Article

CFD Comparison of the Influence of Casting of Samples on the Fiber Orientation Distribution

Department of Cybernetics, School of Science, Tallinn University of Technology, 19086 Tallinn, Estonia
*
Author to whom correspondence should be addressed.
These authors contributed equally to this work.
Fibers 2023, 11(1), 6; https://doi.org/10.3390/fib11010006
Submission received: 5 March 2022 / Revised: 17 November 2022 / Accepted: 3 January 2023 / Published: 10 January 2023
(This article belongs to the Special Issue Mechanics of Fiber Reinforced Cementitious Composites)

Abstract

:
The main goal of this research is to show that even a small deviation from the prescribed casting method EN 14651 causes a difference in fiber orientation distribution in sample beams. A further goal is to investigate the difference in the fiber orientation between bottom and side layers, which would carry the tensile load in the in-situ situation (bottom layer) compared to testing according to EN 14651 (side layer). Nowadays, the development of the proper numerical simulations that aim to visualize the casting process of the fresh concrete flow is a promising challenge in the construction industry. To be able to predict the orientation and spatial distribution of the short fibers using numerical tools may significantly simplify the investigations of the fibered composite materials. This paper compares simulations of different casting methods of the fiber concrete mixture with various flowabilities. The casting of the testing specimen was simulated in different ways: the filling of the formwork according to EN 14651, from the center only and from one edge of the formwork using computational fluid dynamics. The influence of different casting methods in combination with four specific sets of the rheological parameters on the final fiber orientation distribution is discussed. The presented outcomes of the simulations demonstrate that even a minor change in the casting procedure can significantly alter the final characteristics of the material.

1. Introduction

Research and development of advanced composite materials are one of the most important aspects of the building industry. This requirement originates from the environmental impact of the building industry in terms of CO2 production and use of raw materials and also from the need to build higher buildings with lighter stronger structures. The use of fibers in concrete provides for the improvement of load-bearing properties and ensures the increased serviceability of concrete products. The addition of fibers reduces crack propagation and even allows the transfer of stresses through cracks in the concrete. The fibers aligned in the stress direction can contribute to the force transmission. Depending on the place of filling and the direction of the concrete flow in the formwork, the orientation distribution of fibers in the concrete may vary.
Many research groups have contributed to the study and improvement of the rheological properties of the ordinary concrete, as well as of fiber-reinforced concrete. Roussel has established the connection between the proper measurements of rheological properties (yield stress and thixotropy) and casting processes of the slabs and walls [1]. Hu et al. have studied the influence of coarse aggregate on the rheology of concrete and pointed out that a higher amount of coarse and fine aggregate, in general, results in higher rheological parameters (yield stress and viscosity) [2]. Kostrzanowska-Siedlarz and Gołaszewski have analyzed the rheological properties (plastic viscosity and yield stress) and how they change over time [3]. Jiao et al. have indicated that rheological properties, such as plasticity, viscosity and elasticity, under shear stress have an important impact on the constructing, forming or casting process [4]. Boulekbache et al. have studied how the rheology of fiber-reinforced concrete impacts the fiber orientation and distribution and how the flexural strength may be strongly improved by the proper fiber orientation in the direction of the tensile stresses in the fresh concrete with good workability [5]. Ponikiewski and Gołaszewski have demonstrated that the embedding of fibers into the concrete mixture has a negative impact on its workability and rheological properties; however, the optimal addition of a superplasticizer improves its properties [6]. Khaloo et al. have demonstrated that increasing the steel-fiber volume fraction has reduced the workability of self-compacting concrete and that the addition of high percentages of fibers led to a decrease in other rheological parameters [7].
Recently, special attention has been paid to the evaluation of the filling methods of fresh concrete and their influence on the orientational and spatial fiber distribution inside of fiber-reinforced self-compacting concrete and ultra-high-performance fiber-reinforced concrete. Torrijos et al. have analyzed the influence of the casting/placing procedure of fiber-reinforced self-compacting concretes with different fiber lengths on post-peak behavior [8,9]. Ponikiewski et al. have demonstrated the very strong dependence of the location of concrete casting on fiber distribution and presented the possibility of estimating the uniformity of fiber distribution throughout the scanned elements using X-ray computed tomography [10]. Sucharda et al. have presented an approach to identify the specific material characteristics by applying inverse analysis. They found that the size of the specific fracture energy is the most significant input parameter [11].
Vicente et al. have studied the influence of fiber orientation and fiber content on residual tensile strength and fatigue under static and cyclic bending tests [12]. Voutetaki et al. has discussed the impact of the embedded synthetic fibers on the compressive strength and the damage-detection procedure [13]. The results of the investigations presented by Barnett et al. have demonstrated that the panels poured from the center have shown a higher strength due to the alignment of fibers which have a tendency to be aligned perpendicular to the direction of flow and led to more fibers bridging the radial cracks which occurred during the mechanical testing [14].
Ferrara et al. have provided experimental evidence that the casting process can be used to efficiently orient the fibers along the direction of the tensile stresses within the structural element [15]. Zhou and Uchida have studied fiber orientation in ultra-high-performance fiber-reinforced concrete using the transparent model with fibers and compared with X-ray computed tomography analysis [16,17]. Yoo et al. have presented a study that investigates the influence of fiber length and placement method on the flexural behavior of ultra-high-performance self-compacting concrete [18].
In general, the composition of concretes is regulated by EN 206-1. The standard EN 206-1 refers to the standard EN 12390 for the testing of hardened concrete. Part EN 12390-5 deals with the testing of the flexural strength. The test aims to record the maximum force that can be absorbed during specimen bending. The load is applied perpendicular to the direction in which the specimens are filled. In principle, the requirements of the EN 206-1 standard apply to fiber-reinforced concrete and, thus, also the technical requirements for the composition. The standard 12390 was adopted for fiber concrete in the form of the standard EN 14651 [19]. This standard describes the procedure for determining the flexural strength of fiber-reinforced concrete specimens and specifies the procedure of the preparing and testing of the specimens. It describes the evaluation of the tensile behavior of metallic-fiber concrete in terms of the determination of residual flexural tensile strength values defined from load-deflection curves or the load-crack mouth opening displacement curve obtained by applying a center-point load. Since the formulation of the standard EN 14651, a lot of research on the influence of fiber orientations on mechanical properties has been conducted and published [1,2,3,4,5,6,7,8,9,10,14,15,16,17,18,20,21,22,23,24]; additionally, research on the influence of the flow of a concrete mass on fiber orientations has been published [8,9,10,25,26,27,28,29]. However, there have been no studies published that investigate the fiber orientations obtained by the sample preparation according to EN 14651.
Full-scale experiments according to EN 14651 with subsequent computed tomography analysis of fiber distribution are highly time- and cost-consuming procedures; therefore, numerical simulations can significantly simplify the planning and development stage of research and construction. Knowing exactly how the filling process affects the fiber distribution could be used as a guide for the technological design of casting and filling procedures with fiber-reinforced concrete.
The most widely used applications for numerical simulations in concrete materials technology are the rheometry simulations [30,31], the simulation and optimization of the mixing process [32,33], the casting and placement optimization [26,27,34], and the simulation of the tests in hardening state [35]. A detailed overview of existing applications of numerical simulations has been presented by several researchers [36,37]. It has been shown that numerical techniques provide flow prediction for a variety of viscosities with a high reliability level [38,39].
Mechanical models for fiber concrete have been developed by several research teams; several of these models take the fiber orientation distribution into account. Since the fiber orientation distribution is often anisotropic [40,41,42,43], after homogenization, the resulting macroscopic mechanical material model is also anisotropic [20,21,22,23,24].
The use of fiber-reinforced concretes is also widespread in the manufacture of precast concrete elements, among other things [44]. Due to the correct dosage of fibers, cracking is considerably prevented. Concrete and reinforcing-steel damage under increased loads as a result of sulfate action, freeze–thaw cycles and the alkali–silica reaction is a durability problem in tunnel, canal and shaft structures. The optimally controlled placement of the concrete in the formwork contributes to the achievement of the design approaches of the use of fibers. Controlled production in the precast plants has scheduling advantages for the construction progress, which, however, should not be achieved at the expense of the necessary curing. Slackly reinforced precast concrete elements have usually already been removed from the mold the day after concreting and stored in the plant’s yard. Early shrinkage of the concrete causes cracking, which is partly counteracted by the use of fibers. Especially in the case of highly loaded bar-shaped elements, shrinkage cracks with expansion potential are critical and should definitely be prevented by suitable measures. One of the motivations of this study is to develop practical guidelines for the optimal concreting process in precast plants in order to achieve reliable and reproducible final states of the concrete matrix.
The main aim of the research presented here is to analyze the influence of the casting method of a test specimen on the fiber distribution and pointing out which casting conditions might lead to the preferable fiber orientation. Tests on fiber-reinforced specimens have already shown favorable fiber distribution for achieving higher flexural strength of concrete slabs [25]. According to EN 14651 [19], the specimen should be rotated by 90 degrees around the longitudinal axes for bending tests while in-situ casting preserves the bottom layer. That fact raises the question of if the fiber distribution is invariant under this rotation, or if a different fiber distribution is, in fact, tested. Therefore, the numerical simulations aim to investigate the variability in the fiber orientation distribution in different boundary layers of the specimens.
This paper presents the results of numerical simulations of the casting process of fresh self-compacting concrete with short fibers using different pouring methods: the filling of the formwork according to EN 14651 and pouring from the middle and from the end of the formwork. Additionally, the rheological parameters (yield stress and plastic viscosity) were varied to represent different flowabilities, such as super-liquid, self-leveling, high-viscous and slump.

2. Materials and Methods

2.1. Sample Preparation and Testing According to EN 14651

The specimens for the standard test according to EN 14651 are prisms with a square base with dimensions of 15 cm × 15 cm and a specimen length of 550 to 700 mm. The maximum length of the steel fibers is limited to 60 mm. The specimen formwork is filled in two steps. In the first step, 2/3 of the concrete volume is poured in the middle of the mold. The remaining 1/3 is divided in half and poured into the mold at its two ends, see Figure 1. In the simulations described below, the simulated concrete is considered non-compacted; therefore, the mold is filled up to the top edge. Since the filling side may show unevenness after the curing of the concrete, the specimen is rotated once by 90 degrees during load application when measuring the tensile strength, see also Figure 2. The rotation results in two plane-parallel surfaces, which are required for the bending tensile measurement.

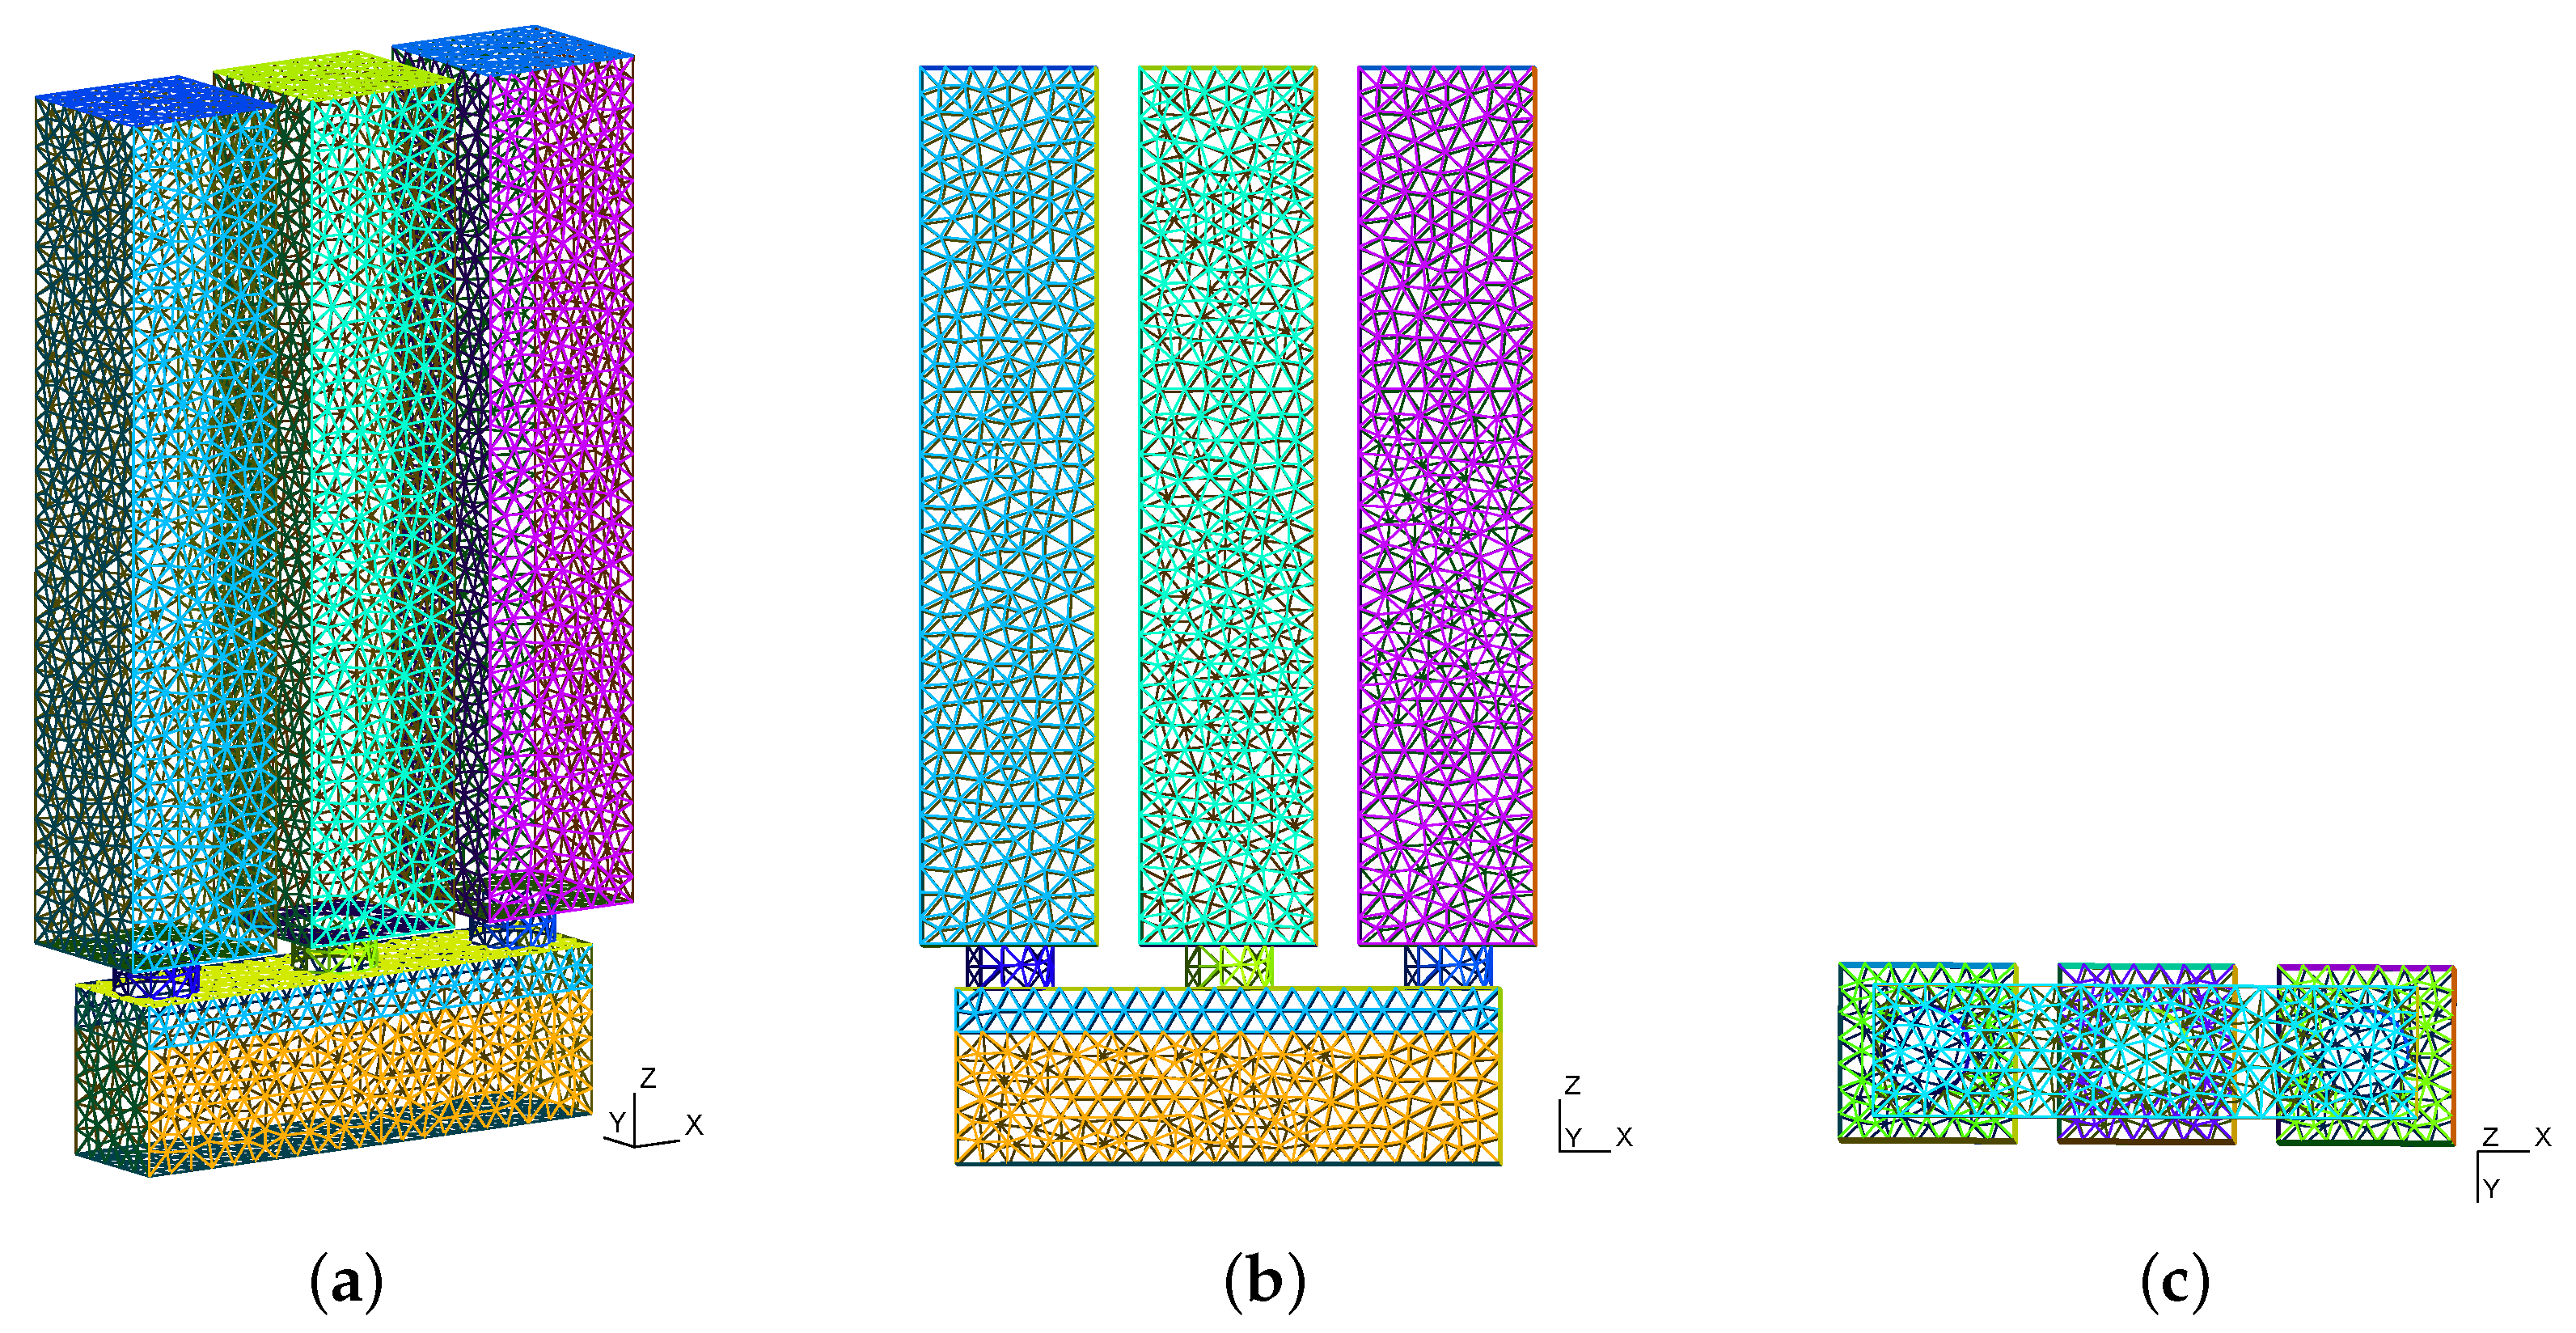
2.2. Computational Fluid Dynamics Simulations

Fresh concrete behaves like a Bingham plastic when it is cast, which means under the critical shear stress (yield stress τ 0 ) it behaves rigidly, and when the critical shear stress is surpassed, it shows a linear relation between shear stress and shear rate.
The flow of the fresh concrete mass can be modeled with the incompressible Navier–Stokes equations
· u = 0
u t + · ( u u ) · ( ν u ) = p ,
with the kinematic viscosity ν = μ ρ and the dynamic viscosity μ . In the implementation, the Bingham-plastic behavior is approximated by a Herschel–Bulkley viscosity model:
μ eff = μ 0 , | γ ˙ | γ ˙ 0 k | γ ˙ | n 1 + τ 0 | γ ˙ | 1 , | γ ˙ | γ ˙ 0 ,
with μ 0 = k | γ ˙ 0 | n 1 + τ 0 | γ ˙ 0 | 1 , a large μ 0 and n = 1 is used to approximate a Bingham-plastic behavior; k dominates the viscosity when the material flows. In a Herschel–Bulkley model, the shear stress τ and shear rate γ ˙ are related as follows: τ = τ 0 + k γ ˙ n .
For these equations, an equation for the fiber orientations is needed. Here, the alignment or orientation tensors [45,46,47] come into play. The orientations of the fibers are described by an evolution equation for the second-order orientation tensor a i j [48,49]
D a i j D t = 1 2 ( ω i k a k j a i k ω k j ) + 1 2 ( r 2 1 ) ( r 2 + 1 ) ( γ ˙ i k a k j + a i k γ ˙ k j 2 γ ˙ k l a i j k l ) + 2 D r ( δ i j 3 a i j ) ,
where D D t is the material derivative (co-moving derivative), ω i j is the vorticity tensor, r = L / D is the aspect ratio of the fibers, L is the fiber length, and D is the diameter. The terms D r = C I γ ˙ , as suggested in [50], and γ ˙ , which is the scalar magnitude of the rate of strain tensor, are given by:
D r = C I γ ˙
= γ ˙ 0.03 ( 1 e 0.224 Φ r ) if Φ r 1.3 γ ˙ 0.0184 e 0.7148 Φ r if Φ r > 1.3 ,
Φ = n L π D 2 4
γ ˙ = | γ ˙ i j | = 1 2 ( γ ˙ i j γ ˙ j i ) ,
where C I is the fiber–fiber interaction coefficient, which serves to randomize the orientation state [49] and n is the fiber number density.
Since the equation of change for the second-order orientation tensor contains the fourth-order orientation tensor, a closure approximation which allows to calculate a i j k l from a i j is required. The IBOF-5 closure approximation suggested in [51] is used here:
a i j k l = β 1 S ( δ i j δ k l ) + β 2 S ( δ i j a k l ) + β 3 S ( a i j a k l ) + β 4 S ( δ i j a k m a m l ) + β 5 S ( a i j a k m a m l ) + β 6 S ( a i m a m j a k n a n l ) ,
where S ( T i j k l ) = 1 24 perm ( i j k l ) T i j k l is the symmetrization operator, with the sum carried out over all permutations of i j k l , and the coefficients β are functions of the second and third invariants of a i j , see [51].
For the simulation, interFiberFoam [27], a modified interFoam solver from the OpenFOAM 2.3.0 library, was used [52]. The implementation was adapted from the icoFiberFoam presented in [49]. The solver uses the so-called Weller-VOF (volume of fluid) method [53] to simulate multiphase free-surface flow. The solver was extended to include calculations of the equation of change for the second-order fiber-orientation tensor field in the concrete phase [27]. At every time step, Equation (4) was solved to simulate the evolution of the fiber-orientation tensors in the concrete phase. The simulation is one-way coupled—the flow-field affects the fiber orientation distribution, whereas the fiber orientation has no effect on the flow field. Verification of the solver had been performed in [27] by comparison with results of simulations published by other researchers.
The geometry simulated is the beam geometry according to EN 14651, with three casting containers, see Figure 3. All simulations are performed on the same mesh, only the initial filling of the containers is changed. The geometry was modeled and meshed in Gmsh [54]. Any number of containers can be active at the same time or one after the other. Post-processing was performed in ParaView [55].
For the atmosphere above the mold, fixed total pressure and a zero-gradient boundary condition for the velocity were applied.
On the walls of the mold, a zero-gradient condition was applied for the pressure field while a planar state of orientation in the plane of the walls was assumed for the fibers.
The material parameters used in the simulation are given in Table 1 and results of simulated flowability tests are given in Table 2.

3. Results

3.1. Dynamics of Filling the form

An intermediate state of the filling of the formwork can be seen in Figure 4; the screenshots are taken at different time steps for different flowabilities to show differences in flow behavior.

3.1.1. Super Liquid

The mold is filled very quickly. In the normative simulation set-up, the concrete is already pressed up against the sidewalls of the mold during filling from the central container. The subsequent filling from the side containers stimulates turbulent mixing of the mold contents at the mold edges. During the filling processes from only one container, there are also strong wave excursions at the surface, which quickly subside again and the concrete surface rapidly levels off horizontally. Figure 4a demonstrates the behavior of the super-liquid mixture. As one can see from the image, the mixture is highly liquid and at the time step 0.55 s the formwork is filled almost at the half. Additionally, the mixture splashes against the sidewalls of the formwork.

3.1.2. Self-Leveling

The mold is filled more slowly and the concrete is not pressed upwards at the end faces of the mold. The sloshing up is not visible, the concrete level in the mold center is higher than at the mold edges. In the edge areas, the concrete already in the mold is more clearly dampened by the concrete flowing out of the edge containers. During edge filling, there is a uniform flat increase in the level of the filling material. After completion of the filling, air bubbles rising to the concrete surface can be assumed, which disappear after the upward rise. In the case of one-sided filling, it can be seen that when the concrete reaches the opposite side, the filling height is approximately the same at the filling point and in the center of the mold. Figure 4b illustrates the behavior of the self-leveling mixture. At the time step 0.55 s, the mixture has a quite-visible cone shape which demonstrates the proper viscosity of the self-leveling mixture.

3.1.3. High Viscous

A clear concrete cone can be seen in the normative filling. The filling from both sides in the second step suggests the formation of three filling areas in the front mold view. There is no pronounced mixing of the different fill quantities. When filling from one side or in the middle, it can be seen that the concrete levels off much more slowly. When filling from the edge, a uniform slope from the filling point along the entire mold length can be seen when reaching the opposite formwork wall. Figure 4c shows the behavior of the high-viscous mixture. In addition, the cone shape of the mixture is even more visible. In addition, the mixture reaches the sidewalls later in time than in the case of the self-leveling mixture (at time step 1.05 s) which may verify that the mixture is more viscous.

3.1.4. Slump

In the normative filling process, concrete cones with a clear valley between the cone tips can be seen even during the second filling step. The concrete surface does not level out completely. Complete displacement of the air bubbles cannot be seen. In the case of one-sided filling, the slope on the concrete surface remains even after the container has been completely emptied. Figure 4d demonstrates the behavior of the slump mixture. As we can notice, the mixture is so highly viscous that even at the time step 2.05 s the mixture has a strong cone shape and it flows so slowly that it did not reach the sidewalls of the formwork.

3.2. Obtained Final Fiber Orientation Distributions

The results of the numerical simulations of the fiber concrete flow with different rheological parameters and performed by several casting methods are demonstrated in Table 3. The fiber orientation distributions are represented by the ellipsoidal glyphs. A spherical shape of the glyphs represents isotropic distribution; the elongated (cigar) shape represents the zones where the fibers were well-aligned with each other; and the penny-shaped glyphs represents a fiber distribution with orientations mostly within a plane (planar isotropy).
The obtained results are presented by two views: a front view of the specimen and a bottom view. The front view contains the glyphs of the whole volume, while the bottom view only shows the bottom layer.
The results of the normative filling process according to EN 14651 are shown in the first column of Table 3 and in Figure 5. The second column depicts the results of only center casting, which one may be tempted to do with sufficiently flowable concrete mass in practice. Additionally, the third column shows casting from one end (in this case, the left side). Each method is compared for four flowabilities ranging from (unrealistically) super-liquid, over realistic self-leveling and high-viscous to slump.
In the following, first general observations valid for all cases are mentioned, and then, for each flowability, the different casting methods are compared.
A general observation is that under the (final) casting points the fibers tend to be aligned along the beam axis close to the bottom layer, and tend to become vertically aligned at a large distance from the final casting point, which can be the center of the beam in the normative filling simulation.
Another observation is that the higher the viscosity and yield stress, the better the fibers are aligned with each other and correlation exists for a longer range.
Concerning different viscosities of a mixture, in general one can conclude that the super-liquid cases produced more isotropic and random fiber orientation distribution. In addition, with the increasing in the viscosity, the fibers become better aligned in one direction. However, the most viscous case —the slump case—demonstrated that a highly dense material can create air bubbles in the formwork during casting.
Quantitative orientation measures in the form of the scalar-order parameter S, the biaxiality b and the director d , which is the eigenvector of the according to amount largest eigenvalue of the alignment tensor ( d = v ( max ( | λ i | ) ), are presented in Table 4. The scalar-order parameter S is S = 3 2 λ 1 ( | λ 1 | | λ 2 | | λ 3 | ), b S = 1 2 ( λ 3 λ 2 ) , b S = sign ( S ) b , with the biaxiality b 0 , 1 3 | S | and S [ 1 2 , 1 ] , see [47,58]. S = 1 is perfectly aligned fibers, S = 0 isotropic and S = 1 2 is planar isotropic; see [58,59]. The two probes are located 2.5 cm above the bottom and centered in the other directions for probe 1, and 2.5 cm from the side wall and centered in the other directions for probe 2; see Figure 2. Thus, they would be at the tip of a notch cut into the bottom or side, respectively.

3.2.1. Super-Liquid

Looking at the numerical simulations of the super-liquid case, one can note from Table 4, that the director and the scalar order parameter vary quite a bit between the casting methods. Normative casting leads to a low scalar-order parameter of only 0.09 and director in the y direction with an inclination towards the x direction for the bottom probe, while the side probe shows a scalar-order parameter of 0.44 with almost z orientation. Even a short waiting time between the castings changes the values or the scalar-order parameter to 0.36 and 0.53, respectively, and the director of probe 1 towards the z direction. Both center and side castings show planar orientations for probe 1, indicated by the negative scalar order parameter, and moderate to good alignment in the z direction for probe 2.
These tendencies can also be observed when looking at the glyphs presented in the first row of Table 3.
The presented fiber orientation distributions are not beneficial for transferring the tensile stresses and will not prevent nor bridge the cracks.

3.2.2. Self-Leveling

Looking at the plots in Table 3 of the numerical simulations for the self-leveling case, one can notice some patterns in the distribution of glyphs emerging. The alignment glyphs in the side view start to follow a circle around the inflow point. For the center casting, this means the fibers are starting to have a tendency to be aligned along the beam axis in the bottom layer, but the director turns upwards with increasing distance from the center. The same tendency of the director turning upwards can be observed for the side casting, though it is less pronounced here. In the case of the normative casting, there are regions between the three casting points where the director is pointed upwards.
Numerically, one can see from Table 4 that the probe 1 shows the director is aligned along the x axis for the center and side casting with a moderate fiber alignment of S = 0.38 , while the normative casting shows a tendency of the flat-isotropic distribution in the xy plane. For probe 2, the situation is reversed with moderately aligned fibers in the z direction for the normative casting, and plane-isotropy in the xz plane for the center and side castings.

3.2.3. High Viscous

The high-viscous case shows the highest degree of alignment in the center casting at probe 1, but all casting positions show at least moderate alignment in the x direction, see Table 4. The scalar-order parameter is positive for all casting positions and on both probe locations. In the normative casting, the director at probe 2 is almost along the z axis, while in the center and edge casting it is oriented in the x direction.
The visual trend observed in the self-leveling case is more pronounced here; the glyphs presented in Table 3 follow the same trend.

3.2.4. Slump

Visually, the same trends as in the high-viscous and self-leveling cases can be observed in Table 3. Quantitatively, one can see from Table 4 that the degree of orientation is higher at probe 1 for the normative and center casting, but lower for the edge casting. At probe 2, in the normative casting there is a planar-isotropic orientation in the xz plane, while in the center casting the orientation is in the x direction, and the edge casting is somewhat tilted from the x in the negative z direction.

4. Discussion

The standard EN 14651 was prepared by the Technical Committee CEN/TS 229 Precast concrete products. In this context, it is worth mentioning that the development of technologies for predictable fiber distribution has a good chance, especially in the field of precast concrete products. In precast plants, controllable manufacturing conditions prevail, which allow high reproducibility of components and precast elements with lower tolerance deviations. In addition, it is possible—especially in precast construction—to arrange the filling side of the precast elements at the correct angles to the subsequent loading direction. This possibility is often not available for in-situ casting.
As can be seen from the Table 3 and Table 4, the most beneficial fiber orientation in the bottom layer was present in the case of the high-viscous and slump flow which were cast by the normative filling method and from the center of the formwork.
However, as is required in standard EN14651, the concrete sample needs to be rotated by about 90 degrees around the longitudinal axis, which means the fiber orientation distribution at the side becomes the bottom in the bending test and has to cope with the strongest tension. As can be seen from Figure 6, the fiber orientations can be quite different.
Simulations of different casting scenarios show that extreme care must be taken when trying to reproduce reality in the simulation; it also shows that for simulations to be used in predicting fiber distributions in structural elements, care must be taken to ensure the building crew follows exactly the prescribed casting procedure. As Figure 7 shows, even a short pause between casting from different positions can alter fiber orientation distributions.

5. Conclusions

This paper assesses the final fiber orientation distributions that were obtained by numerical simulations of different casting methods of fresh concrete flow with short fibers. The simulations were performed on a specimen according to EN 14651 standard. Four different concrete types with different rheological properties were simulated. The behavior of the different concretes and the evaluation of the flow properties of the concretes was rechecked with the funnel-flow and cone flow-table method. For the simulations, interFiberFoam, a modified interFoam solver from the OpenFOAM 2.3.0 library, was used. The visualization was performed in ParaView. The results of the numerical simulation showed that the higher the viscosity and yield stress, the better the fibers were aligned with each other and correlation existed for a longer range. In general, it was concluded that the highly liquid cases produced more isotropic fiber orientation distribution. Further, it can be concluded that the sample preparation must be performed with great care, as even small deviations, such as different times between the first and second pours, can alter fiber orientation distributions. Another possible conclusion could be that the testing according to the standard may not be applicable for in-situ casting of elevated floors, as a different fiber orientation distribution is tested (side-layer compared bottom-layer).
Finally, it can be concluded that further simulation investigations on this topic are useful for the evaluation of mechanical properties of fiber-reinforced specimens. Simulations have great potential as a tool to be used in precast plants for optimizing the production process.

Author Contributions

Conceptualization, H.H.; methodology, H.H.; software, H.H.; simulation, O.G. (normative and center castings), M.H. (edge casting) and H.H. (geometry and meshing; flow table and funnel); data curation, H.H.; writing—original draft preparation, H.H. (methods), O.G. and M.H. (Introduction, Discussion); writing—review and editing, H.H., O.G. and M.H.; visualization, O.G. and H.H.; supervision, H.H.; project administration, H.H.; funding acquisition, H.H. All authors have read and agreed to the published version of the manuscript.

Funding

This work was supported by the Estonian Research Council grant (PUT1146).

Institutional Review Board Statement

Not applicable.

Informed Consent Statement

Not applicable.

Data Availability Statement

The data presented in this study are openly available in TalTech Data Repository at URL: https://dx.doi.org/10.48726/j4gda-mjn32 (accessed on 5 March 2022).

Acknowledgments

The simulations were carried out in the High Performance Computing Centre of TalTech.

Conflicts of Interest

The authors declare no conflict of interest. The funders had no role in the design of the study; in the collection, analyses, or interpretation of data; in the writing of the manuscript, or in the decision to publish the results.

Abbreviations

The following abbreviations are used in this manuscript:
CFDComputational fluid dynamics
FVEFinite-volume elements
SFRCShort-fiber reinforced concrete
VOFVolume of fluid
IBOFInvariant-based optimal fitting

References

  1. Roussel, N. Rheology of fresh concrete: From measurements to predictions of casting processes. Mater. Struct. 2007, 40, 1001–1012. [Google Scholar] [CrossRef]
  2. Hu, J.; Wang, K. Effect of coarse aggregate characteristics on concrete rheology. Constr. Build. Mater. 2011, 25, 1196–1204. [Google Scholar] [CrossRef]
  3. Kostrzanowska-Siedlarz, A.; Gołaszewski, J. Rheological properties of high performance self-compacting concrete: Effects of composition and time. Constr. Build. Mater. 2016, 115, 705–715. [Google Scholar] [CrossRef]
  4. Jiao, D.; Shi, C.; Yuan, Q.; An, X.; Liu, Y.; Li, H. Effect of constituents on rheological properties of fresh concrete-A review. Cem. Concr. Compos. 2017, 83, 146–159. [Google Scholar] [CrossRef]
  5. Boulekbache, B.; Hamrat, M.; Chemrouk, M.; Amziane, S. Flowability of fibre-reinforced concrete and its effect on the mechanical properties of the material. Constr. Build. Mater. 2010, 24, 1664–1671. [Google Scholar] [CrossRef]
  6. Ponikiewski, T.; Gołaszewski, J. Properties of Steel Fibre Reinforced Self-compacting Concrete for Optimal Rheological and Mechanical Properties in Precast Beams. Procedia Eng. 2013, 65, 290–295. [Google Scholar] [CrossRef] [Green Version]
  7. Khaloo, A.; Raisi, E.M.; Hosseini, P.; Tahsiri, H. Mechanical performance of self-compacting concrete reinforced with steel fibers. Constr. Build. Mater. 2014, 51, 179–186. [Google Scholar] [CrossRef]
  8. Torrijos, M.; Tobes, J.; Barragán, B.; Zerbino, R. Orientation and distribution of steel fibres in self-compacting concrete. In Proceedings of the 7th RILEM Symposium on Fiber Reinforced Concrete: Design and Applications (BEFIB 2008), Chennai, India, 17–19 September 2008; p. 729e38. [Google Scholar]
  9. Torrijos, M.C.; Barragán, B.E.; Zerbino, R.L. Placing conditions, mesostructural characteristics and post-cracking response of fibre reinforced self-compacting concretes. Constr. Build. Mater. 2010, 24, 1078–1085. [Google Scholar] [CrossRef]
  10. Ponikiewski, T.; Katzer, J. X-ray computed tomography of fibre reinforced self-compacting concrete as a tool of assessing its flexural behaviour. Mater. Struct. 2016, 49, 2131–2140. [Google Scholar] [CrossRef] [Green Version]
  11. Sucharda, O.; Lehner, P.; Konečnỳ, P.; Ponikiewski, T. Investigation of fracture properties by inverse analysis on selected SCC concrete beams with different amount of fibres. Procedia Struct. Integr. 2018, 13, 1533–1538. [Google Scholar] [CrossRef]
  12. Vicente, M.A.; Mínguez, J.; González, D.C. Computed tomography scanning of the internal microstructure, crack mechanisms, and structural behavior of fiber-reinforced concrete under static and cyclic bending tests. Int. J. Fatigue 2019, 121, 9–19. [Google Scholar] [CrossRef]
  13. Voutetaki, M.E.; Naoum, M.C.; Papadopoulos, N.A.; Chalioris, C.E. Cracking Diagnosis in Fiber-Reinforced Concrete with Synthetic Fibers Using Piezoelectric Transducers. Fibers 2022, 10, 5. [Google Scholar] [CrossRef]
  14. Barnett, S.J.; Lataste, J.F.; Parry, T.; Millard, S.G.; Soutsos, M.N. Assessment of fibre orientation in ultra high performance fibre reinforced concrete and its effect on flexural strength. Mater. Struct. 2010, 43, 1009–1023. [Google Scholar] [CrossRef]
  15. Ferrara, L.; Ozyurt, N.; Di Prisco, M. High mechanical performance of fibre reinforced cementitious composites: The role of “casting-flow induced” fibre orientation. Mater. Struct. 2011, 44, 109–128. [Google Scholar] [CrossRef]
  16. Zhou, B.; Uchida, Y. Fiber orientation in ultra high performance fiber reinforced concrete and its visualization. In Proceedings of the Eighth International Conference on Fracture Mechanics of Concrete and Concrete Structures, Toledo, Spain, 10–14 March 2013. [Google Scholar]
  17. Zhou, B.; Uchida, Y. Influence of flowability, casting time and formwork geometry on fiber orientation and mechanical properties of UHPFRC. Cem. Concr. Res. 2017, 95, 164–177. [Google Scholar] [CrossRef]
  18. Yoo, D.Y.; Kang, S.T.; Yoon, Y.S. Effect of fiber length and placement method on flexural behavior, tension-softening curve, and fiber distribution characteristics of UHPFRC. Constr. Build. Mater. 2014, 64, 67–81. [Google Scholar] [CrossRef]
  19. EN 14651; Test Method for Metallic Fibrered Concrete—Measuring the Flexural Tensile Strength (Limit of Proportionality (LOP), Residual). European Committee for Standardization: Brussels, Belgium, 2005.
  20. Herrmann, H.; Eik, M.; Berg, V.; Puttonen, J. Phenomenological and numerical modelling of short fibre reinforced cementitious composites. Meccanica 2014, 49, 1985–2000. [Google Scholar] [CrossRef]
  21. Eik, M.; Puttonen, J.; Herrmann, H. An orthotropic material model for steel fibre reinforced concrete based on the orientation distribution of fibres. Compos. Struct. 2015, 121, 324–336. [Google Scholar] [CrossRef]
  22. Herrmann, H. Chapter: An Improved Constitutive Model for Short Fibre Reinforced Cementitious Composites (SFRC) Based on the Orientation Tensor. In Generalized Continua as Models for Classical and Advanced Materials; Springer International Publishing: Cham, Switzerland, 2016; pp. 213–227. [Google Scholar] [CrossRef]
  23. Mishurova, T.; Rachmatulin, N.; Fontana, P.; Oesch, T.; Bruno, G.; Radi, E.; Sevostianov, I. Evaluation of the probability density of inhomogeneous fiber orientations by computed tomography and its application to the calculation of the effective properties of a fiber-reinforced composite. Int. J. Eng. Sci. 2018, 122, 14–29. [Google Scholar] [CrossRef]
  24. Herrmann, H. A constitutive model for linear hyperelastic materials with orthotropic inclusions by use of quaternions. Contin. Mech. Thermodyn. 2021, 33, 1375–1384. [Google Scholar] [CrossRef]
  25. Kartofelev, D.; Goidyk, O.; Herrmann, H. A case study on the spatial variability of strength in a SFRSCC slab and its correlation with fibre orientation. Proc. Est. Acad. Sci. 2020, 69, 298–310. [Google Scholar] [CrossRef]
  26. Gram, A. Modelling Bingham Suspensional Flow. Ph.D. Thesis, Royal Institute of Technology (KTH), Stockholm, Sweden, 2015. [Google Scholar]
  27. Herrmann, H.; Lees, A. On the Influence of the Rheological Boundary Conditions on the Fibre Orientations in the Production of Steel Fibre Reinforced Concrete Elements. Proc. Est. Acad. Sci. 2016, 65, 408–413. [Google Scholar] [CrossRef]
  28. Eiduks, M.; Krasnikovs, A.; Dunskis, E.; Kononova, O. Investigation of Fiber Orientation in Viscous Fluid. Sci. J. Riga Tech. Univ. 2010, 33, 98–102. [Google Scholar]
  29. Kononova, O.; Krasnikovs, A.; Lapsa, V.; Kalinka, J.; Galushchak, A. Internal Structure Formation in High Strength Fiber Concrete during Casting. Int. J. Mech. Aerosp. Ind. Mechatron. Manuf. Eng. 2011, 5, 2489–2492. [Google Scholar]
  30. Roussel, N. Correlation between yield stress and slump: Comparison between numerical simulations and concrete rheometers results. Mater. Struct. 2006, 39, 501–509. [Google Scholar] [CrossRef]
  31. Thrane, L.N.; Szabo, P.; Geiker, M.; Glavind, M.; Stang, H. Simulation of the test method “L-Box” for self-compacting concrete. Annu. Trans. NORDIC Rheol. Soc. 2004, 12, 47–54. [Google Scholar]
  32. Krenzer, K.; Mechtcherine, V.; Palzer, U. Simulating mixing processes of fresh concrete using the discrete element method (DEM) under consideration of water addition and changes in moisture distribution. Cem. Concr. Res. 2019, 115, 274–282. [Google Scholar] [CrossRef]
  33. Wallevik, J.E.; Wallevik, O.H. Concrete mixing truck as a rheometer. Cem. Concr. Res. 2020, 127, 105930. [Google Scholar] [CrossRef]
  34. Vasilic, K.; Schmidt, W.; Kühne, H.C.; Haamkens, F.; Mechtcherine, V.; Roussel, N. Flow of fresh concrete through reinforced elements: Experimental validation of the porous analogy numerical method. Cem. Concr. Res. 2016, 88, 1–6. [Google Scholar] [CrossRef]
  35. Marcalikova, Z.; Bujdos, D.; Cajka, R. Approach to numerical modelling of fiber reinforced concrete. Procedia Struct. Integr. 2020, 25, 27–32. [Google Scholar] [CrossRef]
  36. Vasilic, K.; Gram, A.; Wallevik, J.E. Numerical simulation of fresh concrete flow: Insight and challenges. RILEM Tech. Lett. 2019, 4, 57–66. [Google Scholar] [CrossRef]
  37. Roussel, N.; Spangenberg, J.; Wallevik, J.; Wolfs, R. Numerical simulations of concrete processing: From standard formative casting to additive manufacturing. Cem. Concr. Res. 2020, 135, 106075. [Google Scholar] [CrossRef]
  38. Roussel, N.; Gram, A.; Cremonesi, M.; Ferrara, L.; Krenzer, K.; Mechtcherine, V.; Shyshko, S.; Skocec, J.; Spangenberg, J.; Svec, O.; et al. Numerical simulations of concrete flow: A benchmark comparison. Cem. Concr. Res. 2016, 79, 265–271. [Google Scholar] [CrossRef] [Green Version]
  39. Kulasegaram, S.; Karihaloo, B.L.; Ghanbari, A. Modelling the flow of self-compacting concrete. Int. J. Numer. Anal. Methods Geomech. 2011, 35, 713–723. [Google Scholar] [CrossRef]
  40. Oesch, T.S. Investigation of Fiber and Cracking Behavior for Conventional and Ultra-High Performance Concretes Using X-ray Computed Tomography. Ph.D. Thesis, University of Illinois at Urbana, Champaign, IL, USA, 2015. [Google Scholar]
  41. di Prisco, M.; Ferrara, L.; Lamperti, M.G.L. Double edge wedge splitting (DEWS): An indirect tension test to identify post-cracking behaviour of fibre reinforced cementitious composites. Mater. Struct. 2013, 46, 1893–1918. [Google Scholar] [CrossRef]
  42. Pujadas, P.; Blanco, A.; Cavalaro, S.; de la Fuente, A.; Aguado, A. Fibre distribution in macro-plastic fibre reinforced concrete slab-panels. Constr. Build. Mater. 2014, 64, 496–503. [Google Scholar] [CrossRef]
  43. Herrmann, H.; Pastorelli, E.; Kallonen, A.; Suuronen, J.P. Methods for Fibre Orientation Analysis of X-ray Tomography Images of Steel Fibre Reinforced Concrete (SFRC). J. Mater. Sci. 2016, 51, 3772–3783. [Google Scholar] [CrossRef]
  44. Banthia, N.; Bindiganavile, V.; Jones, J.; Novak, J. Fiber-reinforced concrete in precast concrete applications: Research leads to innovative products. PCI J. 2012, 57, 33–46. [Google Scholar] [CrossRef]
  45. Hess, S.; Köhler, W. Formeln zur Tensor-Rechnung; Palm & Enke: Erlangen, Germany, 1980. [Google Scholar]
  46. Ehrentraut, H.; Muschik, W. On Symmetric irreducible tensors in d-dimensions. ARI-Int. J. Phys. Eng. Sci. 1998, 51, 149–159. [Google Scholar] [CrossRef]
  47. Herrmann, H.; Beddig, M. Tensor series expansion of a spherical function for use in constitutive theory of materials containing orientable particles. Proc. Est. Acad. Sci. 2018, 67, 73–92. [Google Scholar] [CrossRef]
  48. Advani, S.G.; Tucker, C.L., III. The Use of Tensors to Describe and Predict Fiber Orientation in Short Fiber Composites. J. Rheol. 1987, 31, 751–784. [Google Scholar] [CrossRef]
  49. Heinen, K. Mikrostrukturelle Orientierungszustände Strömender Polymerlösungen und Fasersuspensionen. Ph.D. Thesis, Universität Dortmund, Dortmund, Germany, 2007. [Google Scholar]
  50. Folgar, F.; Tucker, C.L. Orientation Behavior of Fibers in Concentrated Suspensions. J. Reinf. Plast. Compos. 1984, 3, 98–119. [Google Scholar] [CrossRef]
  51. Chung, D.H.; Kwon, T.H. Invariant-based optimal fitting closure approximation for the numerical prediction of flow-induced fiber orientation. J. Rheol. 2002, 46, 169–194. [Google Scholar] [CrossRef] [Green Version]
  52. The OpenFOAM Foundation. OpenFOAM. v.2.3.0. 2014. Available online: http://www.openfoam.org (accessed on 5 March 2022).
  53. Damián, S.M. An Extended Mixture Model for the Simultaneous Treatment of Short and Long Scale Interfaces. Ph.D. Thesis, Universidad Nacional del Litoral, Santa Fe, Argentina, 2013. [Google Scholar]
  54. Geuzaine, C.; Remacle, J.F. Gmsh: A 3-D finite element mesh generator with built-in pre- and post-processing facilities. Int. J. Numer. Methods Eng. 2009, 79, 1309–1331. [Google Scholar] [CrossRef]
  55. Henderson, A.; Ahrens, J.; Law, C. The ParaView Guide; Kitware Inc.: Clifton Park, NY, USA, 2004. [Google Scholar]
  56. de Larrard, F.; Ferraris, C.F.; Sedran, T. Fresh concrete: A Herschel-Bulkley material. Mater. Struct. 1998, 31, 494–498. [Google Scholar] [CrossRef]
  57. Lashkarbolouk, H.; Halabian, A.M.; Chamani, M.R. Simulation of concrete flow in V-funnel test and the proper range of viscosity and yield stress for SCC. Mater. Struct. 2014, 47, 1729–1743. [Google Scholar] [CrossRef]
  58. Herrmann, H.; Eik, M. Some comments on the theory of short fibre reinforced material. Proc. Est. Acad. Sci. 2011, 60, 179–183. [Google Scholar] [CrossRef]
  59. Jankun-Kelly, T.J.; Mehta, K. Superellipsoid-based, real symmetric traceless tensor glyphs motivated by nematic liquid crystal alignment visualization. IEEE Trans. Vis. Comput. Graph. 2006, 12, 1197–1204. [Google Scholar] [CrossRef]
Figure 1. Preparation of samples according to standard EN 14651, the casting is performed in two steps, arrows denote filling areas.
Fibers 11 00006 g001
Figure 2. A sketch showing the location of the notch for the bending test in relation to the filling side and the location of the fiber orientation probes, probe 1 is located for use with the casting bottom as notched surface (left picture), and probe 2 is located for use with a side wall as notched surface (right picture). The darker surface of the sample beam indicates the filling side during the casting.
Fibers 11 00006 g002
Figure 3. Representation of geometry and mesh of the numerical simulation; the mesh has 7023 nodes and 37,020 cells. Geometry of the beam: W × L × H : 0.15 m × 0.62 m × 0.15 m, inlet 10 cm, located centered on the beam axis and 8 cm from the end walls. Modeling and meshing were performed in Gmsh [54]. (a) Geometry and mesh of the casting setup, 3D view. (b) Geometry and mesh of the casting setup, side view. (c) Bottom view of mesh of the casting setup.
Fibers 11 00006 g003
Figure 4. Comparison of the flow behavior, to give an impression of the viscosity (workability, flowability) of the simulated concrete mass. Shown are intermediate time steps.
Fibers 11 00006 g004
Figure 5. Comparison of the castings according to EN 14651 (first center, then edges).
Fibers 11 00006 g005
Figure 6. Side-by-side comparison of the fiber orientations in the bottom layer and in the side layer. One can see the differences in the bottom-layer orientation distributions differ from the side distributions. Since, in a bending test, the part that is on the under or top side take the largest stress, turning a sample side-ways changes the tested distribution.
Fibers 11 00006 g006
Figure 7. Comparison of a super-liquid casting with no pause between center and side castings with one having a few seconds pause between the center and the side castings to let the concrete mass settle a bit.
Fibers 11 00006 g007
Table 1. Transport properties used in the OpenFOAM simulation, notation follows the naming in OpenFOAM, i.e., ρ is the density, τ 0 is the yield stress, k controls the viscosity of the flowing mass and ν 0 is the viscosity used if stress is below yield stress. The parameters are in the range published by [56,57].
CaseOpenFOAM ValuePhysical Value
ρ all cases23002300 kg m 3
ν 0 all cases10001000 m 2 s
nall cases11
super-liquid0.01739140 Pa
τ 0 self-leveling0.034779.810 Pa
high-viscous0.0547125.81 Pa
slump0.0947217.81 Pa
super-liquid0.01087025 Pa·sn
κ self-leveling0.021749.910 Pa·sn
high-viscous0.041795.910 Pa·sn
slump0.0917210.91 Pa·sn
Table 2. Obtained rheological properties of the simulated SFRC mass using simulated funnel flow test and flow table test (with Abram’s cone, the dropping of plate was not simulated).
CaseFunnel Outflow TimeFlow Table Diameter
super-liquid1 s
self-leveling2.5–3.2 s108 cm
high-viscous5–7 s78 cm
slump16 s62 cm
Table 3. Comparison of fiber orientations for different flowabilities and casting points. The ellipsoidal glyphs represent the fiber orientation distribution: an isotropic distribution is represented by a spherical glyph, a distribution with well aligned fibers is shown by a cigar shaped glyph. An additional hint is given by the colors from blue to red.
According to EN StandardOnly Center CastingOnly Edge Casting
super-liquidFibers 11 00006 i001Fibers 11 00006 i002Fibers 11 00006 i003
self-levelingFibers 11 00006 i004Fibers 11 00006 i005Fibers 11 00006 i006
high-viscousFibers 11 00006 i007Fibers 11 00006 i008Fibers 11 00006 i009
slumpFibers 11 00006 i010Fibers 11 00006 i011Fibers 11 00006 i012
Fibers 11 00006 i013
Table 4. Orientation parameters at two probe positions, the probes are located 2.5 cm above the bottom and centered in the other directions for probe 1, and 2.5 cm from the side wall and centered in the other directions for probe 2. The scalar-order parameter S is S = 3 2 λ 1 ( | λ 1 | | λ 2 | | λ 3 | ), b S = 1 2 ( λ 3 λ 2 ) , b S = sign ( S ) b , with the biaxiality b 0 , 1 3 | S | and S [ 1 2 , 1 ] ; see [58]. S = 1 is perfectly aligned fibers, S = 0 isotropic and S = 1 2 is planar isotropic; see [47,59].
Cast PositionFlowabilityPositionSbEV( λ 1 )
Normsuper-liquidbottom 10.090.03(−0.41, −0.91, −0.061)
Normsuper-liquidside 20.440.02(−0.015, 0.24, 0.97)
Norm restsuper-liquidbottom 10.360.05(−0.099, 0.099, −0.99)
Norm restsuper-liquidside 20.530.03(0.001, 0.17, 0.98)
Centersuper-liquidbottom 1−0.120.03(0.208, 0.007, 0.98)
Centersuper-liquidside 20.420.06(0.044, 0.049, 0.99)
Sidesuper-liquidbottom 1−0.190.04(−0.75, −0.075, 0.65)
Sidesuper-liquidside 20.370.11(0.21, 0.085, 0.97)
Normself-levelingbottom 1−0.250.08(0.045, 0.042, −0.99)
Normself-levelingside 20.380.09(−0.26, −0.101, −0.96)
Centerself-levelingbottom 10.370.10(0.99, 0.15, 0.034)
Centerself-levelingside 2−0.330.10(0.078, −0.99, 0.15)
Sideself-levelingbottom 10.380.08(0.98, 0.031, 0.18)
Sideself-levelingside 2−0.370.12(0.19, 0.96, −0.22)
Normhigh-viscousbottom 10.350.07(0.99, −0.002, 0.007)
Normhigh-viscousside 20.370.10(−0.17, −0.14, −0.97)
Centerhigh-viscousbottom 10.630.05(0.99, 0.05, −0.008)
Centerhigh-viscousside 20.420.10(0.99, 0.05, 0.073)
Sidehigh-viscousbottom 10.510.05(0.99, 0.074, 0.11)
Sidehigh-viscousside 20.410.09(0.84, −0.045, 0.54)
Normslumpbottom 10.590.05(0.99, 0.007, −0.009)
Normslumpside 2−0.280.09(0.024, −0.96, 0.27)
Centerslumpbottom 10.650.04(1.0, 0.01, −0.01)
Centerslumpside 20.400.07(0.99, −0.04, −0.12)
Sideslumpbottom 10.380.08(0.98, 0.007, −0.19)
Sideslumpside 20.290.09(0.83, 0.054, −0.56)
Disclaimer/Publisher’s Note: The statements, opinions and data contained in all publications are solely those of the individual author(s) and contributor(s) and not of MDPI and/or the editor(s). MDPI and/or the editor(s) disclaim responsibility for any injury to people or property resulting from any ideas, methods, instructions or products referred to in the content.

