Article

Development of Thin Films from Thermomechanical Pulp Nanofibers of Radiata Pine (Pinus radiata D. Don) for Applications in Bio-Based Nanocomposites

by
Judith Vergara-Figueroa
1,2,3,*,
Oswaldo Erazo
1,
Héctor Pesenti
4,
Paulina Valenzuela
1,
Arturo Fernández-Pérez
5 and
William Gacitúa
1,2,3
1
Center for Biomaterials and Nanotechnology, Universidad del Bío-Bío, Concepción 4030000, Chile
2
Wood Engineering Department, Faculty of Engineering, Universidad del Bío-Bío, Concepción 4030000, Chile
3
Nanomaterials and Catalysts for Sustainable Processes Group (NanoCatpPS), Universidad del Bío-Bío, Concepción 4030000, Chile
4
Núcleo de Investigación en Bioprocesos y Materiales Avanzados, Facultad de Ingeniería, Universidad Católica de Temuco, Temuco 4780000, Chile
5
Department of Physics, Faculty of Sciences, Universidad del Bío-Bío, Concepción 4030000, Chile
*
Author to whom correspondence should be addressed.
Fibers 2023, 11(1), 1; https://doi.org/10.3390/fib11010001
Submission received: 20 October 2022 / Revised: 18 November 2022 / Accepted: 12 December 2022 / Published: 20 December 2022

Abstract

:
The main objective of this study was to develop cellulose nanofibers from the thermomechanical pulp (TMP) of Radiata Pine (Pinus radiata D. Don), and for this, a one-step micro-grinding process was used. The newly developed material was called thermomechanical pulp nanofibers (TMP-NF). In the first instance, a determination of the constituents of the TMP was carried out through a chemical characterization. Then, TMP-NFs were compared with cellulose nanofibers (CNF) by morphological analysis (Scanning Electron Microscopy, SEM, and Atomic Force Microscopy, AFM), X-ray Diffraction (XRD) and Fourier-Transform Infrared Spectroscopy with Attenuated Total Reflection (FTIR-ATR). In addition, films were developed from TMP-NF and CNF using a vacuum filtration manufacturing method. For this study, 0.10, 0.25, 0.50, and 1.00% dry weight of CNF and TMP-NF were used as continuous matrices without organic solvents. The films were characterized by determining their morphological, physical, surface properties, and mechanical properties. The main results showed that morphological analysis by SEM and AFM for the fractionated sample indicated a fiber diameter distribution in the range of 990-17 nm and an average length of 5.8 µm. XRD analysis showed a crystallinity index of 90.8% in the CNF, while in the TMP-NF, it was 71.2%, which was foreseeable. FTIR-ATR analysis showed the functional groups of lignin and hemicellulose present in the TMP-NF sample. The films presented apparent porosity values of 33.63 for 1.00% solids content of CNF and 33.27% for 0.25% solids content of TMP-NF. The contact angle was 61.50° for 0.50% solids content of CNF and 84.60° for 1.00% solids content of TMP-NF. Regarding the mechanical properties, the modulus of elasticity was 74.65 MPa for CNF and 36.17 MPa for TMP-NF, and the tensile strength was 1.07 MPa for CNF and 0.69 MPa for TMP-NF. Although the mechanical properties turned out to be higher in the CNF films, the TMP-NF films showed improved surface characteristics as to surface hydrophobic and apparent porosity. In addition, the easy and rapid obtaining of TMP nanofibers makes it a promising material that can be used in biologically based nanocomposites.

Graphical Abstract

1. Introduction

The production of materials from lignocellulosic biomass has been an area of great interest [1]. With the rapid development of nanotechnology, lignocellulosic biomass has been used as a raw material to obtain cellulose, the main polymer and the most abundant and renewable [2]. Nanocellulose is classified based on its morphology and comprises two main classes, cellulose nanocrystals (CNC) and cellulose nanofibrils (CNF). CNCs have high rigidity, with a length of 100 to 200 nm and a diameter of 5 to 20 nm. CNFs have a diameter of 10 to 100 nm and a length of several microns, so they have a large flexible surface. Therefore, CNF has been used in numerous applications. However, the traditional preparation of CNF from lignocellulosic biomass requires an essential chemical pretreatment process. This process has the objective of eliminating the lignin, the hemicellulose, and the partial amorphous region of the cellulose [2,3]. Lignin is the second most abundant and renewable aromatic polymer in nature and is considered a natural glue to interlock and bind other biopolymers in the cell wall of lignocellulosic biomass. It has hydrophobicity, mechanical properties, UV-blocking ability, biodegradability, and thermostability. It is also considered a stabilizer of the polarity of cellulose [4,5].
A different class of nanocellulose has now been disclosed—cellulose nanofibers with lignin (LCNF). LCNFs consist of fibers with length and diameter on the micro and nanometric scale, respectively. It is generally obtained by the mechanical deconstruction of the fibers. Its main difference compared to bleached CNF lies in the morphology, dehydration, flocculation, rheology, and mechanical properties due to the presence of lignin on the surface and in all the fibers [4]. In this context, LCNFs have attracted a great deal of attention around the world [6]. LCNFs are generally produced from unbleached fibers and agricultural residues that contain residual lignin. The mechanisms commonly used to isolate LCNFs include mechanical fibrillation (grinding, homogenization and microfluidization) with the help of chemical and/or enzymatic pretreatments to reduce the cost of production. The principle of these strategies is to destroy the complex and recalcitrant structure of the cell wall, thus facilitating the subsequent nanofibrillation of the lignocellulose fibers. Additionally, it has been reported that LCNF can be obtained from wood fibers without any prior treatment. LCNF production has low capital costs, high yields, and low environmental impact [7,8]. LCNF have been isolated directly from wood microfibers by disk grinding and without chemical treatments, obtaining diameters of approximately 55 nm. Additionally, the preparation of LCNF from grinding cane waste and mild alkaline treatment has been reported. The LCNF obtained had a diameter that ranged between 5–10 nm. Acid prehydrolysis is considered an efficient pretreatment to treat lignocellulosic biomass. In this way, the robust and hierarchical structure of the cell wall could be destroyed, and the hydrogen bonds between the fibrils could be broken, which is conducive to subsequent mechanical nanofibrillation. However, current methods still have certain drawbacks, such as environmental pollution, large energy and chemical consumption, low economic efficiency, and adverse side reactions [9].
In terms of cost reduction, factors such as the economics of the pulp bleaching step, easy processing, and the application of micro-milling could increase the industrial prospect of LCNFs [7]. Micro-grinding is a technology that uses a super masscollider or a Masuko mill for the extraction of wood-based nanocellulose. Compared to other types of grinding, this process requires less energy consumption [7,10]. The concept consists of pressing the fiber materials between a stationary disk and a rotating disk with a defined clearance. The impact results in high shear forces created in the suspended cellulosic fibers, generating internal fibrillation that releases the nanofibrils. Therefore, the structure of the nanofibers is determined by controlling the clearance between the grinding discs and a series of applied refining steps [10]. Previously, our research team has destructured materials such as zeolite and bleached cellulose, applying micro-grinding as the first step in the size reduction process and subsequent microfluidization. In our experience, a diameter distribution in the range of 16–81 nm for zeolite and 55–173 nm for CNF has been obtained. [11,12]. Micro-grinding is a viable alternative, as the pretreatment step is not necessary when using high-pressure homogenization and microfluidization. In addition, the specific energy consumed during micro-grinding is among the lowest [13].
Films based on biological materials offer the advantage of being environmentally friendly and may have multifunctional characteristics depending on both their components and the manufacturing process [14,15,16,17,18,19,20,21]. In recent years, LCNFs have been used in various applications, such as additives in papermaking, reinforcing agents in nanocomposites, and multifunctional films. LCNF is promising material and starting to gain more focus on biological resource engineering. There are four types of multifunctional films, those with different dimensional sizes, zero-dimensional (0D) nanomaterials, one-dimensional (1D) nanomaterials, two-dimensional (2D) nanomaterials, and other functional materials [22]. These different applications require LCNF with custom features. For example, a high aspect ratio is important for polymeric reinforcement materials, while residual lignin content is beneficial for ultraviolet-blocking ability and hydrophobicity [6].
On the other hand, the development of films by vacuum filtration has been investigated. This method is based on overpressure filtration and hot pressing for the rapid preparation of CNF films. Österberg et al., 2013 prepared films in less than 1 h from a 150 mL portion of a 0.84% CNF suspension. The films presented a dry thickness of 120 μm and sizes of approximately 137 cm2 (approximate diameter of 13.2 cm) [19]. For their part, Farooq et al., 2019 used the methodology reported by Österberg et al., 2013, using a content of 10% by weight of colloidal lignin particles from softwood Kraft lignin, obtaining nanocomposite films of strong and ductile CNF [17]. Amini et al., 2020 produced pure CNF and LCNF films with different fines content. These researchers used a vacuum filtration system, which consisted of a vacuum pump, a flask, and a Büchner funnel. The formed films were then placed between two stainless steel disks, and the entire assembly was dried in an oven with a load of (2.5 kg) on top of the sample at 75 °C for 24 h. The results showed that CNF films had higher tensile modulus and strength values compared to LCNF films with the same fines content [16]. Kontturi et al., 2021 prepared nanopapers from bacterial cellulose (BC) and wood-based CNF using the vacuum filtration method. Their main results indicated that the presence of hemicelluloses in CNF nanopapers has a decisive strengthening effect on nanopapers, so much so that BC nanopapers (without hemicelluloses) form a different data set from NFC nanopapers (with hemicelluloses) [18]. Oh et al., 2022 developed CNF sheets using the vacuum filtration method. After filtering, the sheets were subjected to two types of treatments, hot pressing and drying by solvent exchange. In addition, the sheets were subjected to the deposition of an alkyl ketene dimer on the controlled porous structure of the CNF sheet. This study confirmed the possibility for alkyl ketene wax to be embedded in a porous CNF sheet and used as a potential barrier material in hydrogel packaging [23].
The main objective of this study was to develop cellulose nanofibers from the thermomechanical pulp (TMP) of Radiata Pine (Pinus radiata D. Don). For this, a one-step micro-grinding process was used, which was shown to be a viable alternative to obtain lignin-loaded cellulose nanofibers, which have been named TMP-NF. Then, TMP-NFs were compared with CNF by morphological analysis (SEM and AFM), XRD, and FTIR-ATR. In addition, films were developed from TMP-NF and CNF using a vacuum filtration manufacturing method, which was characterized by morphological, physical, structural, and surface analysis. Here, films developed as biobased and organic solvent-free nanocomposites are proposed for different applications.

2. Materials and Methods

2.1. Materials

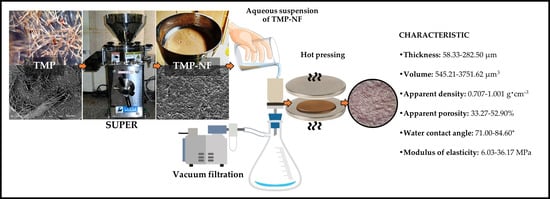
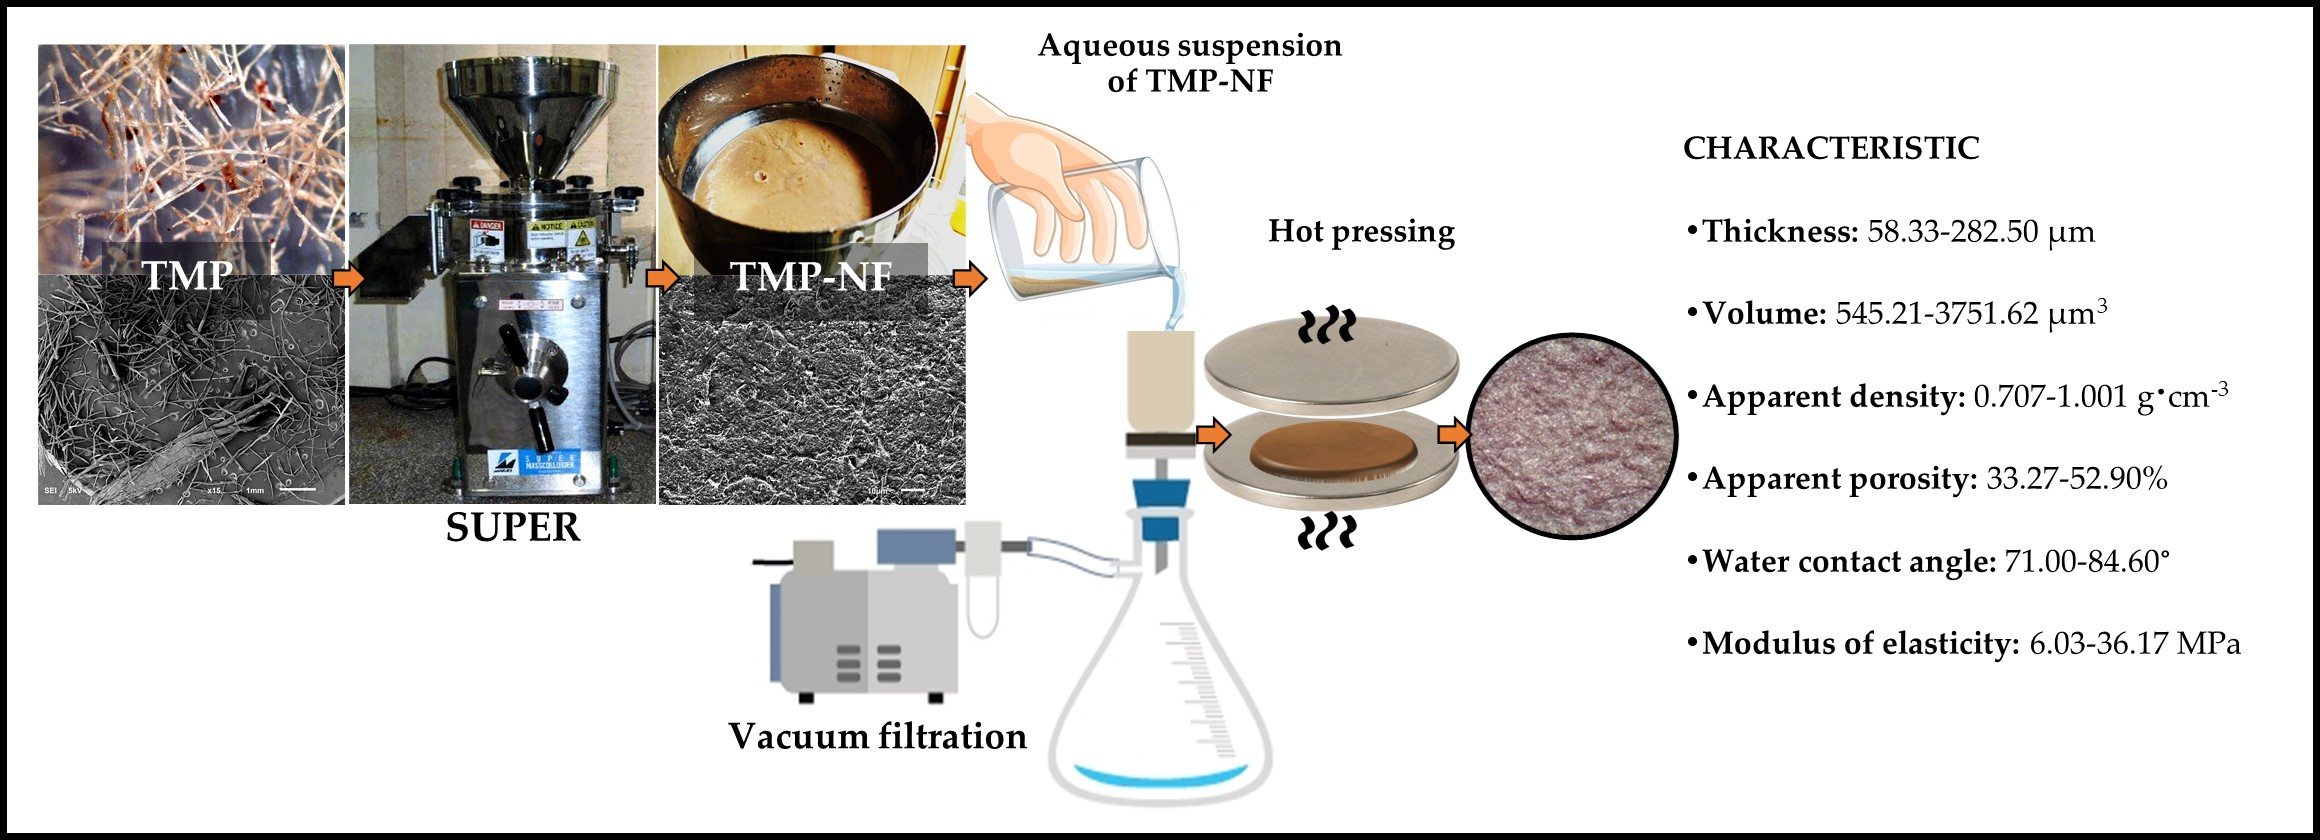
Obtaining Nanofibers from Mechanical Pulp and Film Development

Thermomechanical pulp (TMP) from Pinus radiata D. Don, provided by MASISA S.A, Concepción, Chile, was used as base material to produce the cellulose nanofibers with lignin. The films were manufactured at different concentrations. A comparison was made with CNF obtained from radiata pine kraft pulp (average diameter 91 ± 24 nm) [12], ceded by the Center for Biomaterials and Nanotechnology of the Universidad del Bío-Bío, Concepción, Chile. The reagents used during the characterization of the TMP were distilled water, sodium hydroxide, sodium hypochlorite, and 72% sulfuric acid. All of the reagents were purchased from Merck (Darmstadt, Germany).

2.2. Methodology

2.2.1. Obtaining Nanofibers from Thermomechanical Pulp

Figure 1 shows the general process for obtaining thermomechanical pulp nanofibers. The nanofibers were synthesized in a single step, using a micro-grinding process for size reduction. The protocols described by Taniguchi and Okamura, 1998, Junka et al., 2012, Kalia et al., 2014 and Vergara et al., 2020, with some modifications, were used [10,12,24,25]. During the grinding process, the sample was taken to the SUPER MASSCOLLOIDER equipment (MASUKO, Kawaguchi-city, Japan) at CBN, Universidad del Bío-Bío [26] with a disc opening of 0.5 μm, for 2 continuous hours at 1500–1800 min−1. The consistency of the pulp was 10% w/v. Next, the sample was ultracentrifuged in the YINGTAI INSTRUMENT equipment at 12,000 min−1 for 30 min at room temperature. The resulting suspension was named thermomechanical pulp nanofibers (TMP-NF).

2.2.2. Development of CNF and TMP-NF Films

The protocols described by Österberg et al., 2013, Farooq et al., 2019, Amini et al., 2020, Kontturi et al., 2021, Lu et al., 2022 and Oh et al., 2022 were applied [16,17,18,19,23,27], with some modifications, for the manufacture of films by vacuum filtration. Different percentages of solid content (% dry weight) of CNF and TMP-NF were used as continuous matrices. Table 1 presents the General Factorial Experimental Design for the development of the films.
First, 50 mL of each sample was prepared according to the solid content percentages (% dry weight) (Table 1). Each suspension was mixed at 5000 min−1 for 10 min in high-speed dispersion equipment (ULTRA-TURRAX®, T 25 digital).
Next, films with a diameter of 3.5 cm were prepared using a vacuum filtration system, which consisted of a vacuum pump, Kitasato flask, Büchner funnel, and Whatman™ filter paper (Grade 5) with a pore size of 2.5 μm. Figure 2 shows the scheme for the development of CNF and TMP-NF films. After the filtering process, each film formed was placed between two dry filter papers. To achieve a uniform thickness in the final films, these were placed between two stainless steel discs with a load of 5 kg. The entire set was placed in an oven at 75 °C for 24 h to eliminate excess water in each sample. The dry films were stored in a desiccator at room temperature until the measurements and tests were carried out [16,17,18,19,23,27].

2.3. Characterization Methods

2.3.1. Determination of the Constituents and Morphological Characterization of the Thermomechanical Pulp

The standards issued by the Technical Association of the Pulp and Paper Industry (TAPPI T 257-os 76, TAPPI T 12-75, TAPPI T 15-58, TAPPI T 222-74, and TAPPI T 203-74) were used. The determination of the weight percentages of the TMP constituents was performed sequentially with the following tests: extractives, lignin, holocellulose, and alpha-cellulose [28,29,30,31]. In addition, images of the TMP were taken using a Stereo Microscope (Leica EZ4 HD Digital Stereo Microscope) and a Scanning Electron Microscope (SEM, JEOL Model JSM-6610LV, Jeol Ltd., Tokyo, Japan).

2.3.2. Determination of the Yield of TMP-NF and Morphological Characterization of TMP-NF by Scanning Electron Microscopy (SEM) and Atomic Force Microscopy (AFM)

The yield of TMP-NF was defined as follows,
TMP-NF Yield:
Y   ( % ) = ( W 1 W 2 ) ×   100
where Y is the yield (%) of TMP-NF, W1 is the dry weight of TMP-NF, and W2 is the initial weight of the raw material [32].
A combination of SEM and Atomic Force Microscopy (AFM, Naio, Model Nanosurf, Liestal, Switzerland) analysis was used as a strategic procedure to characterize the fibrils in suspension at the micro and nanometric scale [13]. The AFM (Department of Physics, Faculty of Sciences, Universidad del Bío-Bío, Concepción, Chile) was operated in phase-contrast mode using PPP-FMAuD Gold-Coated Force Modulation AFM Probes (Nanosensors, Neuchâtel, Switzerland) at a resonance frequency of 75 kHz, spring constant of 2.8 N m−1, and a tip radius of about 7 nm. For the morphological characterization of the TMP-NF synthesized in SEM (Center for Biomaterials and Nanotechnology, Universidad del Bío-Bío, Concepción, Chile), a sample suspension of 0.01% dry weight was prepared. A small aliquot was placed in a sample holder and placed in an oven at 50 °C for 20 min. The sample was then coated with gold powder for 35 s (Denton Vacuum, New York, NY, USA). Micrographs were obtained at different magnifications using an accelerating voltage of 5 kV. For the characterization of the sample in AFM, 10 g of post-Masuko sample was ultra-centrifuged in a YINGTAI INSTRUMENT equipment at 12,000 min−1 for 15 min at room temperature. The supernatant was filtered through 0.25 µm filter paper. Then, one drop of the diluted solution was incubated for 12 h on muscovite mica substrates (Grade V1, SPI Supplies, West Chester, PA, USA) for water evaporation. From the images obtained, the diameter and length of the TMP-NF were determined using the ImageJ software (Fiji distribution, open-source). Next, a histogram was constructed with the size distribution of the TMP-NF.

2.3.3. X-ray Diffraction Analysis (XRD) of CNF and TMP-NF

The crystalline parameters of the characteristic phases for the samples of CNF and TMP-NF were determined, employing the refinement of the diffraction profiles with the Rietveld method [33]. X-ray Diffraction (XRD) patterns were performed using a RIGAKU Multipurpose SmartLab model diffractometer (Rigaku Corporation, Tokyo, Japan), with a Theta–Theta Bragg–Brentano geometry goniometer (Laboratory of Crystallographic studies, Facultad de Ingeniería, Universidad Católica de Temuco, Chile). The coherent beam from a copper tube (Cu Kα λ = 1.5418 Å), filtered with Ni, was generated at 40 kV/30 mA and taken by a D/tex Ultra 250 solid-state detector. The measurement was achieved between 5–60° (2θ), with a step of 0.02° and a scanning speed of 1°∙min−1. The optical configurations were adjusted for a 5 mm incident slit, 0.5° diverging slit, 0.5° scattering slit, 10 mm receiving slit, and both sides, with 5° parallel Soller slits, respectively. The instrumental resolution was aligned with the NIST SRM660c (LaB6) standard. Samples corresponding to dehydrated CNF and TMP-NF particles were directly mounted on sample holders with a multi-stage autosampler without any mounting preparation, and the sample routing was performed at 10 min−1. The line profile analysis was performed using TOPAS-Academic 6V by integrating profile fitting techniques based on Rietveld refinements [34,35]. For the quantitative processing of the semi-crystalline and amorphous phases of the CNF and TMP-NF samples, the crystallographic parameters obtained from ICDD cards were assumed in the refinement of the diffraction data: Monoclinic Cellulose I beta (PDF 00-056-1718) and Cellulose Triclinic I Alpha (PDF 00-056-1719). On the other hand, for the amorphous phase, the Pawley and Le Bail fit was used for a pseudo-one-dimensional orthorhombic phase, restricted to two main peaks: 2θ = 18.04° and 2θ = 20.64° [36]. The background was simulated by the Chebyshev polynomial function with 10 levels of order. The shapes of the peaks of the lines were described by Gaussian and Lorentzian distributions, with a goodness of fit of approximately 1.2. Furthermore, monoclinic cellulose was corrected to its preferred orientation, in the (2 0 0) planes, by March′s mathematical theory [37].
For comparison, the Segal Crystalline index (%) was used [9,38]. Equation (2) was applied:
Segal Crystalline Index:
C I ( % ) = ( I 200   I a m I 200 ) × 100
where CI is the Segal Crystalline index (%), I200 is the maximum intensity in that plane, and Iam is the minimum intensity in that plane.

2.3.4. Characterization of CNF and TMP-NF by Fourier-Transform Infrared Spectroscopy with Attenuated Total Reflection (FTIR-ATR)

The CNF and TMP-NF samples were characterized by Fourier-Transform Infrared Spectroscopy (FTIR, Thermo Scientific™, Model Nicolet™ iS™20, USA; in the Laboratory of Thermal and Catalytic Processes, Wood Engineering Department, Universidad del Bío-Bío, Concepción, Chile) with Attenuated Total Reflection (ATR, Specac Quest accessory, Specac, UK), using direct transmittance. To achieve higher resolution during the analysis, dehydrated films were prepared for the CNF and TMP-NF samples. The samples were analyzed in the spectral region between 4000 cm−1 and 600 cm−1, with a resolution of 2 cm−1 and an average of 32 scans. The spectra were plotted using the Origin software, and from the peaks, the chemical structures and their components were searched.

2.3.5. Morphological, Physical, Structural, and Surface Properties of the Developed Films

Morphology

The films were placed in a conditioning chamber at a relative humidity of 53 ± 2% and a temperature of 23 ± 2 °C for 24 h to achieve constant mass and moisture content. Images of the developed films were taken using a Stereo Microscope (Leica EZ4 HD Digital Stereo Microscope) at 35× magnification.

Determination of the Thickness, Volume, Apparent Density, and Apparent Porosity of the Developed Films

The volume of each film was obtained by multiplying the area by the thickness, which was measured with a digital micrometer. The bulk density of each film was calculated using its dry weight and volume. The apparent porosity of the films was determined from Equation (3), assuming that the density of the cellulose fibers and pulp fibers is 1.5 g∙cm−3 [16,23,39].
Apparent porosity:
P   ( % ) = ( ρ c   ρ f ρ c ) × 100
where P is porosity (%) and ρf and ρc are the densities of the cellulose film and fibers, respectively.

Water Contact Angle

The hydrophobicity on the surface of the developed films was evaluated through contact with water. A Contact Angle Goniometer (Tantec Inc., model CAM-micro) was used under conditions of approximately 23 °C and 50% RH. An approximately 5 µL drop of deionized water was deposited on the surface of the film, and the contact angle was measured. Images were taken during the test and analyzed using ImageJ software (Fiji distribution, open source). Each determining contact angle data are the result of the average of 6 measured static contact angle measurements.

Mechanical Analysis of Developed Films

In the mechanical tests, the protocols reported by the authors Andersson et al., 2012; Reyes-Rodriguez et al., 2017; Szymańska-Chargot et al., 2017; Chen, Tze, & Chang, 2020 and Kontturi et al., 2021 with some modifications [18,40,41,42,43].
Tape-type specimens with dimensions of 20 mm long and 5 mm wide were used in sextuplicate. A Deben MICROTEST tensile stage with 200 N load cell (JEOL JSM-6490LV scanning electron microscope) was used. During the execution of the test, the speed of the equipment was adjusted to 1.5 mm·min−1. Modulus of elasticity (E, MPa), Tensile Strength (σ, MPa), and Elongation at failure (ε, %) values were obtained [18,40,41,42,43].

2.4. Statistical Analysis

For the statistical analysis, the Statgraphics® Centurion XVI 2009 software (16.1.03, Statgraphics Technologies, Inc., version The Plains, USA) was used. The data were studied by analysis of variance (ANOVA) with a confidence level of 95% and a multiple comparison test.

3. Results and Discussion

3.1. Determination of the Constituents of the Thermomechanical Pulp, Chemical Characterization

According to Figure 3, it is observed that TMP has a high percentage of lignin (32.25 ± 0.79%). The sample presented 45.40 ± 1.33% for α-cellulose, 15.67 ± 1.13% for hemicellulose, 4.82 ± 0.09% for extractives, and 0.73 ± 0.03% for ashes. These values coincide with those reported by the authors Berrocal et al., 2004, Row, 2005, and Rowell, 2012, for radiata pine [44,45,46]. The results indicate that the pulp was not damaged during the thermomechanical treatment carried out at the plant.

3.1.1. Morphological Characterization of Thermomechanical Pulp Using SEM

According to Figure 4a and the histogram presented in Figure 4b, it is observed that the base material has an average diameter of 0.03 ± 0.01 mm and an average length of 2.5 ± 1.3 mm. Furthermore, it was observed that the sample size distribution is not uniform due to the presence of chips.

3.1.2. Process for Obtaining TMP-NF Using Micro-Grinding

The micro-grinding process has been widely used for reducing the size of wood samples [7,10]. In our investigation, the initial TMP was defibrated with a disk clearance of 0.5 µm for 2 continuous hours at 1500 min−1. The impact caused by the processing generated high shear forces in the cellulosic fibers in suspension. This action caused internal fibrillation, which allowed the release of the nanofibrils. Figure 1 shows that the initial sample was transformed into a brown gel made up of nano and microfibers in an aqueous suspension (Figure 5).

3.1.3. Determination of the Yield of TMP-NF and Morphological Characterization Using SEM and AFM to TMP-NF after the Size Reduction Process

The yield percentage for TMP-NF was 98%, indicating that the micro-grinding process for size reduction is successful. The 2% loss may be due to the material that remains adhered to the discs during the size reduction process; that is, it is an experimental operating loss [32].
After performing the TMP fractionation, it was observed that the resulting sample has a fiber diameter distribution in the range of 990-17 nm (Figure 5). Therefore, the suspension of TMP-NF contains nano and microfibrils. The histogram obtained from an SEM micrograph (Figure 5a) indicates that the average diameter of the fibers is 335 ± 191 nm with an average length of 5.8 ± 2.2 µm. It is important to highlight that the dimensions of the TMP-NF obtained in this research are considerably higher than those reported in the CNF of radiata pine kraft pulp obtained through a microfluidization process [12].
The AFM image in Figure 5b shows that the TMP managed to separate into individual nanofibers after the micro-grinding process, showing that the final sample has nanofibers with an average diameter of 35 ± 13 nm. Furthermore, it is observed that TMP-NFs show a structure of highly intertwined and long cellulosic filaments (Figure 5a) [27]. This result is because the micro-grinding fractionation treatment can combine shear and compression forces to destroy the compact structure of crude lignocellulose, improving the specific surface area of lignocellulose and releasing the elemental fibers [7,10,27].
In Figure 6a,b the presence of irregular particles joined together can be observed, which are found on the nanofibers and between the nanofibers of the thermomechanical pulp. According to what was also observed by the authors Nair et al., 2017, Zhang et al., 2019, Yan et al., 2020, and Tyagi et al., 2021, these particles can be attributed to the presence of lignin aggregates, which bind to cellulose through complex lignin–carbohydrate bonds. The authors indicate that lignin molecules tend to clump together to form lignin aggregates, which is mainly attributed to the hydrophobic association of lignin [4,32,47,48]. The lignin aggregates hypothesis [4] can be confirmed with the results obtained in the XRD (Figure 7) and FTIR-ATR (Figure 8) analyses. Analyzing the histograms, it is observed that the diameter distribution of the lignin spheres oscillates in a range between 1400-120 nm. These results are comparable to those reported by the authors Osong et al., 2013, Cusola et al., 2019 and Lu et al., 2022 [8,27,49].

3.1.4. Crystallographic Analysis Using XRD of CNF and TMP-NF

Figure 7 shows the diffractogram for the CNF and TMP-NF samples. It is observed that the TMP-NF sample presents lower intensity than the CNF sample.
Regarding the para-crystalline characteristics of the cellulose, through the analysis of the diffraction profile line employing the Rietveld method, it was possible to identify the structural trends of the monoclinic, triclinic, and amorphous phases [50].
Consequently, the values revealed in Table 2 are precisely the average parameters of the transition of the semi-crystalline and amorphous structures of the analyzed samples, which were the result of the deviations of the lattice points or molecules, and of the distortions of large displacements of the lattice points, which generate in the interference patterns loss a decrease in the amplitude of the intensities in the Bragg reflections [51]. Once the completed analysis is adequate, it is possible to visualize the determined magnitudes of the unit cell parameters from the distortion contained in the dispersion of the observed signals. The fundamentals of the degree of crystallinity could be perceived through the Segal index; however, this relative indicator is affected by the proportions of the tending phases, the level of distortion of the different arrangements, the orientation of the semi-crystalline lattices, and the fibrillar angle. However, from the stability focus of the semi-crystalline solid, the monoclinic phase is effectively the most abundant and more stable chemically, thermally, and mechanically. From these consistent results, it is reasonably expected to have a highly stable nanofiber, which can undoubtedly lead to higher mechanical resistance. Lignin and hemicelluloses are other disordered components that contribute to the diffuse halo amorphous phase. The TMP-NF sample presents a higher amorphous phase proportion compared to the CNF, with a value of about 28.3%. However, the semi-crystalline phase ratio prevails in an approximate beta/alpha, c.a. 7 times. TMP-NF has a lower crystallinity index conforming to the Segal method. This last sample has larger average crystalline size dimensions in its alpha and beta phases, 7.5 nm and 8.4 nm, respectively. In contrast, CNF had smaller average crystalline domains with minor values of ca. 7 nm for both crystalline phases.

3.1.5. Analysis Using FTIR-ATR for CNF and TMP-NF

Figure 8 shows the FTIR-ATR spectra for the CNF and TMP-NF samples. Comparing both spectra, a reduction in intensities around 3367 and 2849 cm−1 is observed for the TMP-NF sample, which could be associated with the reduction of free OH groups in the sample from TMP, compared to its bleached counterpart (3338 and 2895 cm−1). These peaks can be attributed to intramolecular aromatic and aliphatic O-H stretching hydrogen bonds for cellulose and C-H stretching vibrations for methyl (CH2), respectively. As expected, the characteristic peaks of key functional groups, such as lignin and hemicellulose, were present, indicating their presence in the spectrum of the TMP-NF sample. The peaks located at wavelengths 2918 and 2849 cm−1 are assigned to the symmetric and asymmetric C-H stretching vibrations of the methyl and methylene groups of cellulose and hemicellulose. The peak at 1735 cm−1 is attributed to the ester bond of the carboxylic group of the p-coumaric acids of the hemicelluloses, lignin, or uronic and acetyl ester groups of the hemicelluloses, indicating hemicellulose and lignin remaining in the sample. The peak located at 1701 cm−1 is related to the stretching vibrations of the C=O bonds, either in ester bonds or carboxyl groups. The 1653 cm−1 (CNF) and 1654 cm−1 peaks are attributed to H-O-H stretching vibrations of the adsorbed water for both samples. The 1644 cm−1 peak is assigned to conjugated carbonyl groups on lignin. The observed peaks 1598, 1509, and 1420 cm−1 are assigned to the aromatic ring vibrations of the phenylpropane units (lignin backbone) and the double bond stretching vibration of the aromatic C=C stretch of the lignin aromatic rings. The band observed in the 1372 cm−1 section can be attributed to asymmetric C-H deformations and C-O stretching vibrations of syringyl (S) units in the sample. The peak at 1264 cm−1 could be assigned to the O−H deformation arising from the phenolic C-OH group by stretching. The absorption peak at 1224 cm−1 is related to vibrations of the guaiacil rings (G), and the peaks at 1060 or 1031 cm−1 can be assigned to bending C-H in the plane of the S units and stretching C-O for the TMP-NF sample. The characteristic peaks found in the TPN-NF sample were not observed in the CNF sample. This occurred in the CNF sample because the lignin and hemicellulose were removed to purify and enrich the cellulose. The absorption peak at 1430 cm−1 can be attributed to cellulose CH2 scissoring at glycosidic bonds, and the 1322 cm−1 peak to the rocking vibration of CH2 at C6 carbon. The absorption peak at 1023 cm−1 is attributed to the stretching vibration of the C-O-C pyranose ring, and at 995 cm−1, it can be attributed to the C-O vibration for the CNF sample [7,27,52,53,54,55,56].

3.2. Characterization of the Developed Films: Morphological, Physical, Structural, and Surface Properties

3.2.1. Surface Morphology of Developed Films

Figure 9 shows the images of the surfaces of the films produced from different concentrations of CNF and TMP-NF suspensions, which were obtained with a Stereo Microscope at 35×. In a first general comparison between both samples, the CNF films tend to be white, presenting smoother and less porous surfaces. This becomes even more evident as the concentration of particles in the film increases (Figure 9d). In the TMP-NF films (Figure 9e,h), a brown coloration is observed, corresponding to the presence of lignin and hemicelluloses in the sample, which intensifies as the concentration of particles in the film increases. In addition, the increase in roughness that exists in the 1% TMP-NF sample is evident (Figure 9h).
According to what was reported by Österberg et al. 2013 during the filtering, pressing, and drying process, strong interactions between the nanofibrils are generated. The inherent strength of the cellulose crystals combined with the strength of the interactions between the fibrils leads to the formation of very strong films, which can be used to prepare films based on CNF and TMP-NF [19].

3.2.2. Thickness and Volume of the Developed Films

According to Figure 10a, samples with concentrations of 0.10 and 0.25% presented practically the same thickness. As the content of solids in the films increases, the thickness does so proportionally, showing a linear behavior. From the 0.5% concentration, an increase in the thickness of the films composed of TMP-NF is observed, with the 1% concentration being the thickest with 282.50 ± 19.56 µm. One explanation to understand why the greater thickness is present in the TMP-NF films is that the fibrils that make up the film have a greater diameter (335 ± 191 nm) [39] compared with CNF films, whose average fibril diameter is 91 ± 24 nm [12]. In addition, possibly the roughness observed for the TMP-NF films (Figure 9h) generates a greater thickness, which cannot be considered the real thickness for these films. Concerning the volume of the samples, it should be remembered that films with an average diameter of 3.5 cm were prepared. The volume for each film was obtained by multiplying the area by the thickness, and consequently, the volume for each film reflects the same linear behavior shown in the thickness of the films. The largest volumes are presented with concentrations at 1% for both samples, with 3823.12 ± 430.50 µm3 and 3751.62 ± 384.51 µm3 for CNF and TMP-NF, respectively (Figure 10b).

3.2.3. Structural Properties of the Developed Films, Apparent Density, and Apparent Porosity

Figure 11a presents the results for the apparent density of each film, which was calculated from the dry weight and volume. The films with the lowest solid content present a similar apparent density, showing an approximate value of 0.7 g∙cm−3 for both samples. It is observed that from the concentration of 0.25%, the apparent density increases for both samples and practically maintains a similar density until the film with the highest solid content, which has maximum values of 0.987 ± 0.058 g∙cm−3 for CNF and 1.001 ± 0.008 g∙cm−3 for TMP-NF. According to researchers Kontturi et al., 2021, density should not be affected by grammage, as thicker films are not expected to result in significantly altered interfibrillar distances within the film [18]. The films presented here were dried under high-temperature conditions and were subjected to a pressing system (see Development of CNF and TMP-NF films), which possibly helps to increase interfibrillar bonding [23]. The foregoing explains that the films from 0.25% to 1.00% present similar apparent densities.
The apparent porosity of the films was determined from Equation (3), in which a density of 1.5 g/cm3 was considered for cellulose fibers and pulp fibers [16,23,39]. Applying this density, it can be seen (Figure 11b) that for the films of lower concentration, the apparent porosity is greater, which makes sense since they are the thinnest films presented here. These showed values of 55.29 ± 1.71% and 52.90 ± 4.05% for CNF and TMP-NF, respectively. From the 0.25% concentration, the porosity tends to decrease and remains practically constant up to the 1% concentration for both samples. These films presented a range between 34.21 ± 3.89%–35.01 ± 7.61% for CNF films and 33.27 ± 0.52%–37.78 ± 5.95% for TMP-NF films. The apparent density and apparent porosity of the films presented here changed according to the morphology of the mixed fibers [39]. It was observed that as the solids content increased, the size of the micropores on the surface of the films decreased [16], which shows a strong interaction between nano and microfibrils during vacuum filtering and subsequent hot pressing [17,19].

3.2.4. Water Contact Angle

For a deeper understanding of the surface characteristics of the films, the hydrophobicity of the surface was evaluated by determining the contact angle with water. According to Figure 12, it can be observed in the first instance that the TMP-NF films presented a higher contact angle with water compared to the CNF films, indicating that the TMP-NF films are more hydrophobic than the CNF [16]. Thus, in the 0.10% CNF film, an angle of 56.80° was observed, while for the following concentrations, the angles ranged between 60.10° and 61.50°. The values for the TMP-NF ranged between 71.00°–84.60°. The positive result in the case of the TMP-NF films can be attributed to the high content of lignin in the sample that makes up the TMP-NF compared to cellulose and hemicelluloses [57]. The higher hydrophobicity of TMP-NF films may hold great promise for packaging and composite applications [57].

3.3. Mechanical Analysis of Developed Films

Modulus of Elasticity, Tensile Strength, and Elongation at Failure

The mechanical properties of the films developed from the CNF and TMP-NF suspensions were evaluated through uniaxial tensile tests (Figure 13a), and the results are shown in Figure 13b and Figure 14a,b for the Modulus of elasticity, Tensile strength, and Elongation at failure, respectively. According to Figure 13b, it is observed that the elastic modulus values were higher for all concentrations in the CNF films compared to the same solids content in the TMP-NF films. The modulus values show a linear behavior as the solids content in the films increases, presenting a maximum of 74.65 ± 11.85 MPa for the 1% CNF films. The TMP-NF conformed films also showed a positive linear increase, although lower than in the case of CNF. The range for these films fluctuated between 6.03 ± 0.63 and 36.17 ± 6.26 MPa. The presence of lignin in the TMP-NF could explain the reduction in film stiffness. In general, this can be attributed to a higher Young′s modulus of cellulose compared to lignin [58], which caused the resulting CNF films to have higher moduli compared to the TMP-NF films.
Horseman et al., 2017, indicated that hot-pressed films suffer from lignin softening, which could induce void filling within the films and lead to a decrease in film density [13]. In our work, the CNF films showed a similar density to the TMP-NF films (Figure 13a); therefore, the action of temperature and time (75 °C for 24 h) during hot pressing could possibly affect the TMP-NF films. A shorter pressing time may be adequate for pressing films with high lignin content. Österberg et al., 2013, found that the wet strength of the films allows for the further functionalization of the topological surface, which is beneficial in various applications [19].
Regarding the tensile strength values, they were found to be higher in the CNF films. This is due to the presence of lignin in the structure of TMP-NF, which hinders, to a certain extent, the formation of direct hydrogen bonds between the cellulose molecules [16]. The tensile strength values (Figure 14a) for the CNF fluctuated between 0.65 ± 0.26–1.07 ± 0.42 MPa, while for the TMP-NF films, they fluctuated between 0.25 ± 0.15–0.69 ± 0.28 MPa. It can be seen from Figure 14b that the CNF films exhibit higher elasticity than the TMP-NF films. For the CNF films, the value fluctuated in a range between 6.28 ± 0.81 and 7.42 ± 1.71%, while for the TMP-NF films, the range was between 1.84 ± 0.54–5.03 ± 0.34%. Comparing the results of the films presented here and according to the bibliographical analysis, the general trends agree that films with high lignin contents can become less dense and can show inferior mechanical properties than CNF films [13,57]. Although the density values for both samples were practically similar, the results of the mechanical analysis indicate that the CNF films proved to be more resistant and ductile than the TMP-NF films (Figure 14).
According to the results, the density of the TMP-NF films influenced the mechanical properties of the films, followed by the distribution and size of the particles, which is in agreement with what was reported by Amini et al., 2020 [16].

4. Conclusions

Micro and nanofibers loaded with lignin were successfully obtained from TMP using only the fractionation of the sample through the micro-grinding process in a mill. The average diameter of the micro and nanofiber suspension was 335 ± 191 nm, with an average length of 5.8 ± 2.2 µm. When comparing the samples of CNF and TMP-NF, it can be indicated that the XRD analysis showed that the CNF has a greater crystallinity than the TMP-NF sample, and therefore the TMP-NF sample presented a greater amorphous phase. FTIR-ATR analysis showed the characteristic peaks of the functional groups of lignin and hemicellulose, indicating their presence in the spectrum of the TMP-NF sample. On the other hand, it was observed that the higher the solids content in the films, the smaller the size of the micropores on the surface. The TMP-NF films showed improved values in the water contact angle test, which is beneficial in various applications, such as promising potential applications in packaging and barrier materials. Regarding the mechanical tests, it can be indicated that the CNF films were more resistant and ductile than the TMP-NF films. However, the TMP-NF films showed improved surface characteristics. Given the easy and rapid obtaining of TMP-NF, these prove to be promising new materials to be used as biologically based nanocomposites.

Author Contributions

Conceptualization, J.V.-F. and W.G.; methodology, J.V.-F. and W.G.; software, H.P.; formal analysis, J.V.-F., O.E., H.P. and W.G.; investigation, J.V.-F., O.E., H.P., P.V., A.F.-P. and W.G.; resources, J.V.-F. and W.G.; data curation, J.V.-F., O.E., H.P. and W.G.; writing—original draft preparation, J.V.-F.; writing—review and editing, J.V.-F., O.E. and W.G.; supervision, W.G.; project administration, J.V.-F. and W.G.; funding acquisition, J.V.-F. and W.G. All authors have read and agreed to the published version of the manuscript.

Funding

This research was funded by the research grant from the University of Bio-Bio named “Implementación Año 5 del Plan Plurianual Etapa 1, 2020-1, UBB 2055”.

Data Availability Statement

The data presented in this study are available from the corresponding author upon request.

Acknowledgments

The authors wish to thank the following people for their valuable contribution to our research: Luis Arteaga for the analysis of the samples in FTIR-ATR; Arturo Fernández for the analysis of the samples in AFM; Héctor Pesenti for the analysis of the samples in XRD (ANID Proyecto FONDEQUIP EQM160152); Christopher Salvo, Claudio Montero, and María Graciela for lending us some of their lab equipment. The authors also wish to thank the Center for Biomaterials and Nanotechnology, Universidad del Bío-Bío, Concepción, Chile, for their valuable contribution by lending their laboratories and equipment, and MASISA S.A., Concepción, Chile, for providing us with thermomechanical pulp as raw material.

Conflicts of Interest

The authors declare no conflict of interest.

References

  1. Mohanty, A.K.; Misra, M.; Hinrichsen, G. Biofibres, Biodegradable Polymers and Biocomposites: An Overview. Macromol. Mater. Eng. 2000, 276–277, 1–24. [Google Scholar] [CrossRef]
  2. Pradhan, D.; Jaiswal, A.K.; Jaiswal, S. Emerging Technologies for the Production of Nanocellulose from Lignocellulosic Biomass. Carbohydr. Polym. 2022, 285, 119258. [Google Scholar] [CrossRef] [PubMed]
  3. George, M.; Chae, M.; Bressler, D.C. Composite Materials with Bast Fibres: Structural, Technical, and Environmental Properties. Prog. Mater. Sci. 2016, 83, 1–23. [Google Scholar] [CrossRef]
  4. Tyagi, P.; Gutierrez, J.N.; Nathani, V.; Lucia, L.A.; Rojas, O.J.; Hubbe, M.A.; Pal, L. Hydrothermal and Mechanically Generated Hemp Hurd Nanofibers for Sustainable Barrier Coatings/Films. Ind. Crops Prod. 2021, 168, 113582. [Google Scholar] [CrossRef]
  5. Wang, X.; Xia, Q.; Jing, S.; Li, C.; Chen, Q.; Chen, B.; Pang, Z.; Jiang, B.; Gan, W.; Chen, G.; et al. Strong, Hydrostable, and Degradable Straws Based on Cellulose-Lignin Reinforced Composites. Small 2021, 17, 2008011. [Google Scholar] [CrossRef]
  6. Bian, H.; Dong, M.; Chen, L.; Zhou, X.; Wang, R.; Jiao, L.; Ji, X.; Dai, H. On-Demand Regulation of Lignocellulosic Nanofibrils Based on Rapid Fractionation Using Acid Hydrotrope: Kinetic Study and Characterization. ACS Sustain. Chem. Eng. 2020, 8, 9569–9577. [Google Scholar] [CrossRef]
  7. Diop, C.I.K.; Tajvidi, M.; Bilodeau, M.A.; Bousfield, D.W.; Hunt, J.F. Isolation of Lignocellulose Nanofibrils (LCNF) and Application as Adhesive Replacement in Wood Composites: Example of Fiberboard. Cellulose 2017, 24, 3037–3050. [Google Scholar] [CrossRef]
  8. Osong, S.H.; Norgren, S.; Engstrand, P. An Approach to Produce Nano-Ligno-Cellulose from Mechanical Pulp Fine Materials. Nord. Pulp Pap. Res. J. 2013, 28, 472–479. [Google Scholar] [CrossRef] [Green Version]
  9. Yan, M.; Wu, T.; Ma, J.; Lu, H.; Zhou, X. A Systematic Study of Lignocellulose Nanofibrils (LCNF) Prepared from Wheat Straw by Varied Acid Pretreatments. Ind. Crops Prod. 2022, 185, 115126. [Google Scholar] [CrossRef]
  10. Taniguchi, T.; Okamura, K. New Films Produced from Microfibrillated Natural Fibres. Polym. Int. 1998, 47, 291–294. [Google Scholar] [CrossRef]
  11. Vergara-Figueroa, J.; Alejandro-Martín, S.; Pesenti, H.; Cerda, F.; Fernández-Pérez, A.; Gacitúa, W. Obtaining Nanoparticles of Chilean Natural Zeolite and Its Ion Exchange with Copper Salt (Cu2+) for Antibacterial Applications. Materials 2019, 12, 2202. [Google Scholar] [CrossRef] [PubMed] [Green Version]
  12. Vergara-Figueroa, J.; Alejandro-Martin, S.; Cerda-Leal, F.; Gacitúa, W. Dual Electrospinning of a Nanocomposites Biofilm: Potential Use as an Antimicrobial Barrier. Mater. Today Commun. 2020, 25, 12. [Google Scholar] [CrossRef]
  13. Horseman, T.; Tajvidi, M.; Diop, C.I.K.; Gardner, D.J. Preparation and Property Assessment of Neat Lignocellulose Nanofibrils (LCNF) and Their Composite Films. Cellulose 2017, 24, 2455–2468. [Google Scholar] [CrossRef]
  14. Ko, F.; Wan, Y. Introduction to Nanofiber Materials, 1st ed.; Cambridge University Press: New York, NY, USA, USA, 2014; Volume 9780521879, ISBN 978-0-521-87983-5. [Google Scholar]
  15. Hu, C.; Yang, Y.; Lin, Y.; Wang, L.; Ma, R.; Zhang, Y.; Feng, X.; Wu, J.; Chen, L.; Shao, L. GO-Based Antibacterial Composites: Application and Design Strategies. Adv. Drug Deliv. Rev. 2021, 178, 113967. [Google Scholar] [CrossRef] [PubMed]
  16. Amini, E.; Hafez, I.; Tajvidi, M.; Bousfield, D.W. Cellulose and Lignocellulose Nanofibril Suspensions and Films: A Comparison. Carbohydr. Polym. 2020, 250, 117011. [Google Scholar] [CrossRef]
  17. Farooq, M.; Zou, T.; Riviere, G.; Sipponen, M.H.; Österberg, M. Strong, Ductile, and Waterproof Cellulose Nanofibril Composite Films with Colloidal Lignin Particles. Biomacromolecules 2019, 20, 693–704. [Google Scholar] [CrossRef]
  18. Kontturi, K.S.; Lee, K.Y.; Jones, M.P.; Sampson, W.W.; Bismarck, A.; Kontturi, E. Influence of Biological Origin on the Tensile Properties of Cellulose Nanopapers. Cellulose 2021, 28, 6619–6628. [Google Scholar] [CrossRef]
  19. Österberg, M.; Vartiainen, J.; Lucenius, J.; Hippi, U.; Seppälä, J.; Serimaa, R.; Laine, J. A Fast Method to Produce Strong NFC Films as a Platform for Barrier and Functional Materials. ACS Appl. Mater. Interfaces 2013, 5, 4640–4647. [Google Scholar] [CrossRef]
  20. Parameswaran, C.; Gupta, D. Large Area Flexible Pressure/Strain Sensors and Arrays Using Nanomaterials and Printing Techniques. Nano Converg. 2019, 6, 28. [Google Scholar] [CrossRef] [Green Version]
  21. Qi, X.; Li, X.; Jo, H.; Sideeq Bhat, K.; Kim, S.; An, J.; Kang, J.W.; Lim, S. Mulberry Paper-Based Graphene Strain Sensor for Wearable Electronics with High Mechanical Strength. Sens. Actuators A Phys. 2020, 301, 111697. [Google Scholar] [CrossRef]
  22. Zhu, H.; Luo, W.; Ciesielski, P.N.; Fang, Z.; Zhu, J.Y.; Henriksson, G.; Himmel, M.E.; Hu, L. Wood-Derived Materials for Green Electronics, Biological Devices, and Energy Applications. Chem. Rev. 2016, 116, 9305–9374. [Google Scholar] [CrossRef] [PubMed]
  23. Oh, Y.; Park, S.Y.; Yook, S.; Shin, H.; Lee, H.L.; Youn, H.J. A Waterproof Cellulose Nanofibril Sheet Prepared by the Deposition of an Alkyl Ketene Dimer on a Controlled Porous Structure. Cellulose 2022, 29, 6645–6657. [Google Scholar] [CrossRef] [PubMed]
  24. Junka, K.; Filpponen, I.; Johansson, L.S.; Kontturi, E.; Rojas, O.J.; Laine, J. A Method for the Heterogeneous Modification of Nanofibrillar Cellulose in Aqueous Media. Carbohydr. Polym. 2012, 100, 107–115. [Google Scholar] [CrossRef] [PubMed]
  25. Kalia, S.; Boufi, S.; Celli, A.; Kango, S. Nanofibrillated Cellulose: Surface Modification and Potential Applications. Colloid Polym. Sci. 2014, 292, 5–31. [Google Scholar] [CrossRef]
  26. MASUKO SANGYIO CO. LTD. Ultra-Fine Friction Grinder “Supermasscolloider”. Available online: http://www.masuko.com/English/product/Masscolloder.html (accessed on 10 January 2016).
  27. Lu, H.; Zhang, L.; Yan, M.; Wang, K.; Jiang, J. Screw Extrusion Pretreatment for High-Yield Lignocellulose Nanofibrils (LCNF) Production from Wood Biomass and Non-Wood Biomass. Carbohydr. Polym. 2022, 277, 118897. [Google Scholar] [CrossRef]
  28. TAPPI TAPPI Standards, Technical Information Papers, and Useful Methods Online. Available online: https://tappi.micronexx.com/ (accessed on 1 November 2021).
  29. TAPPI. Acid-Insoluble Lignin in Wood and Pulp (Reaffirmation of T 222 Om-02); TAPPI: Peachtree Corners, GA, USA, 2006; pp. 1–7. [Google Scholar]
  30. TAPPI. T211 Ash in Wood, Pulp, Paper and Paperboard: Combustion at 525 °C; TAPPI: Peachtree Corners, GA, USA, 2007; Volume T211 om-02, p. 7. [Google Scholar]
  31. TAPPI. Sampling and Preparing Wood for Analysis (Proposed Revision of T 257 Cm-02 as a Standard Practice); TAPPI: Peachtree Corners, GA, USA, 2012. [Google Scholar]
  32. Yan, M.; Zhang, L.; Ma, J.; Lu, H.; Zhou, X. Stable Suspensions of Lignocellulose Nanofibrils (LCNFs) Dispersed in Organic Solvents. ACS Sustain. Chem. Eng. 2020, 8, 15989–15997. [Google Scholar] [CrossRef]
  33. Ju, X.; Bowden, M.; Brown, E.E.; Zhang, X. An Improved X-ray Diffraction Method for Cellulose Crystallinity Measurement. Carbohydr. Polym. 2015, 123, 476–481. [Google Scholar] [CrossRef] [Green Version]
  34. Coelho, A. TOPAS-Academic V7. Available online: http://www.topas-academic.net/ (accessed on 20 September 2022).
  35. Young, R.A. The Rietveld Method, 5th ed.; Oxford University Press: New York, NY, USA, 1993; Volume 5, ISBN 0198555776. [Google Scholar]
  36. Dinnebier, R.; Leineweber, A.; Evans, J. 5. Quantitative Phase Analysis. In Rietveld Refinement; De Gruyter: Berlin/Boston, Germany, 2019; pp. 131–150. ISBN 9783110461381. [Google Scholar]
  37. March, A. Mathematische Theorie Der Regelung Nach Der Korngestah Bei Affiner Deformation. Z. Krist.-Cryst. Mater. 1932, 81, 285–297. [Google Scholar] [CrossRef]
  38. Segal, L.; Creely, J.J.; Martin, A.E.; Conrad, C.M. An Empirical Method for Estimating the Degree of Crystallinity of Native Cellulose Using the X-ray Diffractometer. Text. Res. J. 1959, 29, 786–794. [Google Scholar] [CrossRef]
  39. Sim, K.; Youn, H.J. Preparation of Porous Sheets with High Mechanical Strength by the Addition of Cellulose Nanofibrils. Cellulose 2016, 23, 1383–1392. [Google Scholar] [CrossRef]
  40. Reyes-Rodriguez, J.L.; Escorihuela, J.; Garcia-Bernabe, A.; Gimenez, E.; Solorza-Feria, O.; Compan, V. Proton Conducting Electrospun Sulfonated Polyether Ether Ketone Graphene Oxide Composite Membranes. RSC Adv. 2017, 7, 53481–53491. [Google Scholar] [CrossRef] [Green Version]
  41. Chen, H.C.; Tze, W.T.Y.; Chang, F.C. Effects of Nanocellulose Formulation on Physicomechanical Properties of Aquazol–Nanocellulose Composites. Cellulose 2020, 27, 5757–5769. [Google Scholar] [CrossRef]
  42. Szymańska-Chargot, M.; Chylińska, M.; Cybulska, J.; Kozioł, A.; Pieczywek, P.M.; Zdunek, A. Simultaneous Influence of Pectin and Xyloglucan on Structure and Mechanical Properties of Bacterial Cellulose Composites. Carbohydr. Polym. 2017, 174, 970–979. [Google Scholar] [CrossRef] [PubMed]
  43. Andersson, R.L.; Salajkova, M.; Mallon, P.E.; Berglund, L.A.; Hedenqvist, M.S.; Olsson, R.T. Micromechanical Tensile Testing of Cellulose-Reinforced Electrospun Fibers Using a Template Transfer Method (TTM). J. Polym. Environ. 2012, 20, 967–975. [Google Scholar] [CrossRef]
  44. Berrocal, A.; Baeza, J.; Rodríguez, J.; Espinosa, M.; Freer, J. Effect of Tree Age on Variation of Pinus Radiata D. Don Chemical Composition. J. Chil. Chem. Soc. 2004, 49, 251–256. [Google Scholar] [CrossRef]
  45. Row, R.M. (Ed.) Handbook of Wood Chemistry and Wood Composites, 1st ed.; Taylor & Francis: Boca Raton, FL, USA, 2005; Volume 43, ISBN 0849315883. [Google Scholar]
  46. Rowell, R.M. Handbook of Wood Chemistry and Wood Composites, 2nd ed.; CRC Press: Boca Raton, FL, USA, 2012; pp. 75–98. ISBN 9781439853818. [Google Scholar]
  47. Nair, S.S.; Kuo, P.Y.; Chen, H.; Yan, N. Investigating the Effect of Lignin on the Mechanical, Thermal, and Barrier Properties of Cellulose Nanofibril Reinforced Epoxy Composite. Ind. Crops Prod. 2017, 100, 208–217. [Google Scholar] [CrossRef]
  48. Zhang, L.; Lu, H.; Yu, J.; Fan, Y.; Ma, J.; Wang, Z. Contribution of Lignin to the Microstructure and Physical Performance of Three-Dimensional Lignocellulose Hydrogels. Cellulose 2019, 26, 2375–2388. [Google Scholar] [CrossRef]
  49. Cusola, O.; Rojas, O.J.; Roncero, M.B. Lignin Particles for Multifunctional Membranes, Antioxidative Microfiltration, Patterning, and 3D Structuring. ACS Appl. Mater. Interfaces 2019, 11, 45226–45236. [Google Scholar] [CrossRef]
  50. O’sullvian, A.C. Cellulose: The Structure Slowly Unravels. Cellulose 1997, 4, 173–207. [Google Scholar] [CrossRef]
  51. Hosemann, R.; Hindeleh, A.M. Structure of Crystalline and Paracrystalline Condensed Matter. J. Macromol. Sci. Part B 1995, 34, 327–356. [Google Scholar] [CrossRef]
  52. Paul Mclean, J.; Jin, G.; Brennan, M.; Nieuwoudt, M.K.; Harris, P.J. Using NIR and ATR-FTIR Spectroscopy to Rapidly Detect Compression Wood in Pinus Radiata. Can. J. For. Res. 2014, 44, 820–830. [Google Scholar] [CrossRef]
  53. Yang, Y.P.; Zhang, Y.; Lang, Y.X.; Yu, M.H. Structural ATR-IR Analysis of Cellulose Fibers Prepared from a NaOH Complex Aqueous Solution. IOP Conf. Ser. Mater. Sci. Eng. 2017, 213, 8. [Google Scholar] [CrossRef] [Green Version]
  54. Castillo, R.d.P.; Araya, J.; Troncoso, E.; Vinet, S.; Freer, J. Fourier Transform Infrared Imaging and Microscopy Studies of Pinus Radiata Pulps Regarding the Simultaneous Saccharification and Fermentation Process. Anal. Chim. Acta 2015, 866, 10–20. [Google Scholar] [CrossRef] [PubMed]
  55. Domínguez-Robles, J.; Sánchez, R.; Espinosa, E.; Savy, D.; Mazzei, P.; Piccolo, A.; Rodríguez, A. Isolation and Characterization of Gramineae and Fabaceae Soda Lignins. Int. J. Mol. Sci. 2017, 18, 327. [Google Scholar] [CrossRef] [Green Version]
  56. Domínguez-Robles, J.; Soledad, M.; Tamminen, T.; Rodríguez, A.; Larrañeta, E.; Jääskeläinen, A. Lignin-Based Hydrogels with “ Super-Swelling ” Capacities for Dye Removal. Int. J. Biol. Macromol. 2018, 115, 1249–1259. [Google Scholar] [CrossRef] [Green Version]
  57. Rojo, E.; Peresin, M.S.; Sampson, W.W.; Hoeger, I.C.; Vartiainen, J.; Laine, J.; Rojas, O.J. Comprehensive Elucidation of the Effect of Residual Lignin on the Physical, Barrier, Mechanical and Surface Properties of Nanocellulose Films. Green Chem. 2015, 17, 1853–1866. [Google Scholar] [CrossRef] [Green Version]
  58. Gibson, L.J. The Hierarchical Structure and Mechanics of Plant Materials. J. R. Soc. Interface 2012, 9, 2749–2766. [Google Scholar] [CrossRef]
Figure 1. Scheme. TMP-NF production.
Fibers 11 00001 g001
Figure 2. Scheme for the development of CNF and TMP-NF films.
Fibers 11 00001 g002
Figure 3. Chemical characterization of the components of the Radiata Pine Thermomechanical Pulp.
Fibers 11 00001 g003
Figure 4. TMP. (a) Stereo microscopy imaging (35×); (b) SEM micrograph (15×).
Fibers 11 00001 g004
Figure 5. (a) SEM micrograph of TMP-NF; (b) AFM image of TMP-NF.
Fibers 11 00001 g005
Figure 6. Lignin particles from TMP-NF. (a) SEM micrograph; (b) AFM image. Note: The green circles in the figure indicate the lignin particles.
Fibers 11 00001 g006
Figure 7. XRD analysis. Diffractogram for the CNF and TMP-NF samples.
Fibers 11 00001 g007
Figure 8. FTIR-ATR analysis. Spectra for the CNF and TMP-NF samples.
Fibers 11 00001 g008
Figure 9. Stereo Microscope images (35×) for all developed films. (a) CNF 0.10%; (b) CNF 0.25%; (c) CNF 0.50%; (d) CNF 1.00%; (e) TMP-NF 0.10%; (f) TMP-NF 0.25%; (g) TMP-NF 0.50%; (h) TMP-NF 1.00%.
Fibers 11 00001 g009
Figure 10. Physical properties for developed films. (a) Thickness; (b) Volume. Note: Values are presented as means ± SD. N = 6. Values followed by common letters in the super index indicate estimated significant differences between each pair of means media (p > 0.05).
Fibers 11 00001 g010
Figure 11. Structural properties of the developed films. (a) Apparent density; (b) Apparent porosity. Note: Values are presented as means ± SD. N = 6.
Fibers 11 00001 g011
Figure 12. Surface properties of the developed films: Water contact angle. Note: Values are presented as means ± SD. N = 6. Values followed by common letters in the super index indicate estimated significant differences between each pair of means media (p > 0.05).
Fibers 11 00001 g012
Figure 13. Mechanical analysis of the developed films. (a) Uniaxial tensile test; (b) Modulus of elasticity. Note: Values are presented as means ± SD. N = 6. Values followed by common letters in the super index indicate estimated significant differences between each pair of means media (p > 0.05).
Fibers 11 00001 g013
Figure 14. Mechanical analysis of the developed films. (a) Tensile strength; (b) Elongation at failure. Note: Values are presented as means ± SD. N = 6. Values followed by common letters in the super index indicate estimated significant differences between each pair of means media (p > 0.05).
Fibers 11 00001 g014
Table 1. General Factorial Experimental Design for film development by vacuum filtration.
FactorsLevels (%)Response Variable
CNF
 
TMP-NF
0.10
 
0.25
 
0.50
 
1.00
Thickness (µm)
Volume (µm3)
Apparent density (g∙cm−3)
Apparent porosity (%)
Water contact angle (°)
Modulus of elasticity (MPa)
Tensile strength (MPa)
Elongation at failure (%)
Table 2. Results of XRD Analysis for CNF and TMP-NF using TOPAS software.
SampleCNFTMP-NF
Proportion Phases (%)AlphaBetaAmorphousAlphaBetaAmorphous
18.580.51.09.262.528.3
Average crystalline Domain Size (nm)6.86.1 7.58.4
Lattice
Parameters
Lengthsa: 6.100 Åa: 7.996 Å a: 6.089 Åa: 7.980 Å
b: 5.994 Åb: 8.478 Åb: 5.833 Åb: 8.162 Å
c: 11.298 Åc: 10.275 Åc: 10.528 Åc: 10.426 Å
Anglesα: 118.020° α: 117.592°
β: 110.176° β: 112.113°
γ: 82.005°γ: 95.440°γ: 82.064°γ: 96.890°
Segal Crystalline
index (%)
66 43
Disclaimer/Publisher’s Note: The statements, opinions and data contained in all publications are solely those of the individual author(s) and contributor(s) and not of MDPI and/or the editor(s). MDPI and/or the editor(s) disclaim responsibility for any injury to people or property resulting from any ideas, methods, instructions or products referred to in the content.

