Article

Wavelength Sensing Based on Whispering Gallery Mode Mapping

1
Institute of Atomic Physics and Spectroscopy, University of Latvia, LV-1004 Riga, Latvia
2
Institute of Experimental Physics, University of Innsbruck, 6020 Innsbruck, Austria
3
Institute of Telecommunications, Riga Technical University, LV-1048 Riga, Latvia
4
Institute of Astronomy, University of Latvia, LV-1004 Riga, Latvia
*
Author to whom correspondence should be addressed.
Fibers 2022, 10(10), 90; https://doi.org/10.3390/fib10100090
Submission received: 1 September 2022 / Revised: 27 September 2022 / Accepted: 14 October 2022 / Published: 19 October 2022
(This article belongs to the Special Issue Fiber Laser Sources II)

Abstract

:
We demonstrate a wavelength sensor based on whispering gallery mode (WGM) resonators. For the first time, multiple polymethyl methacrylate (PMMA) microspheres were simultaneously attached to a tapered fiber. WGM resonances from these commercially available PMMA microspheres were observed with a NIR camera, monitoring the scattered light. Circulating light in the WGMs was scattered on the outer layer of the microspheres and appeared as bright spots due to scattering defects. For each laser wavelength fed into the tapered fiber, the light interfered differently for the various sizes of PMMA microspheres. We measured scattered light intensity for different wavelengths and created a barcode for each microsphere. Combining these barcodes into a mode map allowed for unknown wavelength detection. A tunable laser around 1550 nm was used for measurements. As a result, a laser wavelength sensor system with a detection limit of 5 pm was demonstrated. The principles of increasing selectivity, as well as creating a compact device, were discussed.

1. Introduction

In recent years, the telecommunications and photonics industries have grown rapidly. Most of the systems in these fields require the use of lasers and precise determination of wavelength [1,2,3]. New optical sensing devices have been researched for various applications [4,5], including for measuring the wavelength of optical systems [6]. Optical microresonators are a good choice for wavelength sensing as they are smaller in size and less expensive than the devices currently used [7].
Whispering gallery mode (WGM) microresonators belong to a subsection of optical microresonators. They offer high-quality factors, low mode volumes [8], and the potential to be integrated into small-scale devices such as chips [9,10]. In addition, WGM microresonators are characterized by narrow spectral lines [11], electromagnetic immunity [12], and high sensitivity [13,14,15], as well as miniature sizes of devices [9,16]. These properties make WGM microresonators appealing for sensing applications. In the last two decades, a variety of applications for optical microresonators have already been demonstrated, such as lasing [5], temperature or humidity sensing applications [13,17], biosensing [5,18], and nonlinear optics research [10].
Whispering gallery modes can be excited in rotationally symmetric cavities, which trap light inside them due to total internal reflection, for example, spheres, toroids, rings, bubbles, etc. Circulating light inside the cavity causes constructive interference, and only a few resonant frequencies (modes) can survive in the cavity [19]. There are multiple methods to couple light inside the resonator and excite WGM resonances, such as free space coupling [13], prism coupling [20], or waveguide coupling [21]. Particularly, tapered fiber offers the highest coupling efficiency [22], and integrated waveguide coupling is not far behind [23].
Resonant modes in a spherical microresonator can be described by the relation
m λ = 2 R n e f f
where m is the integer number of modes, λ is the resonant wavelength, R is the radius of the microresonator, and neff is the effective refractive index [24].
The main parameter used to describe the performance of a WGM microresonator is the quality (Q) factor. The Q factor describes the lifetime of a photon inside the optical cavity. The total Q factor of the microresonator is the sum of different loss mechanisms [25]:
Q 0 1 = Q s c a 1 + Q m a t 1 + Q r a d 1 + Q c o u p l 1
Here Qsca is the optical loss due to surface scattering caused by a deformed outer layer or particles that are attached to the microresonator. Qmat is the optical loss in the dielectric material of the microresonator, which is specific to each material. Qrad is the inherent radiation loss. Qcoupl is the loss due to coupling. This is the only loss mechanism that can be controlled during experiments by changing the coupling distance. Parameters such as (Qsca, Qmat, and Qrad) are defined by the properties of the microresonator shape and material.
Besides microresonators with high and ultra-high Q factors (up to 109) [9,26,27], there are other ways to build an advanced microresonator-based optical system. It has been shown that for sensing applications, the use of multiple microresonators can compensate the low Q factors. Commercially available polymer microspheres are an economically convenient choice. The Q factor of polymethyl methacrylate (PMMA) WGM microresonators is 103–104 [17], and such microresonators have previously been used to determine air humidity [28], temperature [17], and wavelength [29,30]. Traditional WGM microresonator observation methods include transmission [27] and absorption spectrum [31] analysis. However, previous studies have shown a new way of analyzing the circulating light inside the microspheres-image processing instead of classical spectrum analyses. The circulating light inside the cavity is scattered outside the microsphere due to surface imperfections. This light is then observed with a camera. Image processing for wavelength sensing has also been demonstrated by harnessing a speckle from a large (5 cm in diameter) sphere [32].
In this study, we proposed a wavelength sensing method based on WGM resonator image processing. This method used the recorded light intensity changes from multiple spherical PMMA microresonators with diameters in the range of 50 to 80 µm simultaneously attached to a tapered optical fiber. We divided the images of individual microresonators into several smaller regions and analyzed them for best-intensity contrast. The proposed wavelength sensor could be used in many areas where laser wavelength determination is necessary. For the first time, WGM resonances were analyzed with a camera sensitive in the near-infrared (NIR) region at around 1.55 µm, which could be useful for various applications in telecommunications [33].

2. Materials and Methods

2.1. PMMA Microspheres

PMMA microspheres (Bangs Laboratories BB03N average diameter 84 μm) used in our experiments (Figure 1a–c) had diameters of 50–80 μm and an average eccentricity of 1.7% (calculated based on the method shown by Tang et al. [27]). In comparison, liquid microsphere resonators with an eccentricity of around 1.2% [13] and melted optical fiber silica microspheres with an eccentricity of around 1% [27] have been shown in the literature. Scanning electron microscope images of PMMA microspheres from Popov et al. [34] show that the spheres tend to have an uneven surface with irregular dips. Such a surface causes the circulating light to scatter out of the resonator and lowers the Q factor of the microresonator. However, it allows us to observe WGM behavior with image processing. Without noteworthy optical losses in the resonator, there would not be a significant amount of scattered light to detect with a camera.
PMMA has high optical transmission in the 400–1100 nm region and a local maximum in the transmission spectrum around 1500–1600 nm. It means that WGMs in PMMA microspheres can be efficiently excited in a continuous 700 nm wide region, which makes PMMA a good material for a potential wavelength sensor. As opposed to previous PMMA microsphere sensor studies [28,30,35], we demonstrated that WGMs can also be excited in the NIR range actively used in telecommunications.

2.2. Experimental Setup

An experimental setup (Figure 1a) was created to examine the optical properties of PMMA microspheres in the visible light illumination (Figure 1b) and with NIR laser excitation through a tapered fiber for wavelength sensing application (Figure 1c,d).
Light from a continuous wave (CW) tunable laser source (Agilent 81989A, tuning range 1465–1575 nm, full-width at half-maximum (FWHM) linewidth 100 kHz, wavelength resolution and repeatability 5 pm, power stability ±0.03 dB) in the NIR region was fed into single-mode optical fiber (SMF). After a 50/50 ratio splitter, the light was guided to both the optical wavelength meter (EXFO WA-1150) and a sealed box containing tapered fiber and PMMA microspheres. The sealed box (made from PMMA plates, box dimensions: 10 cm × 10 cm × 20 cm) was created to protect the microspheres from dust particles and to reduce the impact of relative humidity (RH) changes on the surrounding environment. For temperature stabilization, a custom-made Peltier thermoelectric element (controlled with ILX Lightwave LDT-5412 controller) was employed and placed beneath the sealed box. We adjusted the Peltier element to stabilize the temperature to around 26 °C in the sealed box—a few degrees higher than the room temperature. For RH stabilization, silica gel was placed inside the sealed box. The experimental setup was located on an optical table with active pneumatic vibration isolation.
To excite PMMA microspheres and observe whispering gallery modes, PMMA spheres were coupled using a tapered fiber. An approximately 5 cm long tapered fiber region was fabricated from standard 125 µm outer diameter single-mode telecommunication fiber (ITU-T G.652 SMF-28) by it stretching on a propane-butane gas torch flame until a waist region of 20–30 μm in diameter was formed. The tapered fiber section was fixed with UV-curing glue to a U-shaped holder. The first experiments were completed by using a tapered fiber with a 10 µm waist diameter. However, Van der Waals force was not strong enough and spheres with diameters of 50–60 µm were detaching from the fiber due to vibrations. We had to find the narrowest possible waist diameter that could also support the spheres. The current coupling method gives a random pattern of microspheres freely attached to the fiber (fiber is dipped in a PMMA microsphere powder, as a result, some spheres stick to the fiber due to Van der Waals force). Instead of using an oscilloscope or optical spectrum analyzer (OSA) to analyze the circulating light inside the microspheres and the microsphere performance itself, we used image processing. An NIR-sensitive camera (Xenics Xs-5049) with a resolution of 320 × 240 pixels was used for NIR measurements. The alignment of microspheres to the tapered fiber was more conveniently performed under visible light illumination using a 3 Mpixel CMOS camera (Ximea xiC MC031MG-SY-UB). Mitutoyo objective was used for image magnification (0.28 numerical aperture, 10x magnification, 20 mm focal length). Xenics camera for NIR region captured one image per second. The wavelength was changed and recorded over time in steps. Each step consisted of changing the wavelength by 0.01 nm, followed by a 5 s stabilization period. Afterward, the next step was initiated. Scanning a 20 nm region took approximately 10 h. Images and data from the optical wavelength meter were recorded independently from this process. We used OSA (Advantest Q8384) to test if the light intensity going through the tapered fiber was nearly constant while tuning the laser.

2.3. Image and Data Processing

Images from the Xenics camera were recorded (1 image per second) and further analyzed with a custom-made Python program to process the data in real-time. As shown in Figure 1c,d different areas of the polymer microspheres have bright spots. This is due to the scattering of the circulating light inside the resonator caused by surface imperfections.
As opposed to other studies [28,30,35], we divided the microsphere into several regions and analyzed the light intensity of each region, not the whole microsphere. Smaller microspheres could be divided into four regions, larger into eight. Similar to our previous work [17], we analyzed brightness changes in the outer layer of the microsphere and divided it into different regions. The aim was to reduce the number of spheres needed for the sensor system. In this case, we could not use very small spheres as the NIR camera’s resolution was a limiting factor. To divide the sphere into many regions and at the same time preserve image quality, a higher number of pixels per µm is necessary.

2.4. COMSOL Simulation Methodology

To simulate the PMMA microspheres, we used COMSOL Multiphysics software with the wave optics module. Simulations were done using 2D and 2D-axisymmetric models with Electromagnetic Waves, Frequency Domain physics. We chose to simulate a 60 µm PMMA microsphere with an air domain surrounding it in a 2D-axisymmetric regime to demonstrate the different modes inside the resonator. The study was set to search for 200 eigenfrequencies for every azimuthal mode number. Additionally, we simulated a 10 µm PMMA microsphere with a rough surface in a 2D regime to model the light scattering on surface irregularities. A built-in random function was used to modify an otherwise perfectly smooth surface of a sphere or a circle [36].
The materials were assigned to domains by defining their refractive index, also taking into account the material dispersion, where different wavelengths of light have different refractive indexes [37].

3. Results and Discussion

3.1. Mode Map Generated from Microspheres

To examine fundamental principles of WGM propagation in PMMA microspheres, we attached a single microsphere to a tapered fiber and scanned the laser wavelength in the range 1550–1570 nm as described previously. Using the camera, we obtained a data set similar to the classical WGM transmission spectrum. Peaks in Figure 2a indicated the presence of WGMs. Spherical geometry can sustain the highest number of higher order modes besides the fundamental mode. In the region 1550–1553 nm, mode splitting was seen. The presence of different modes reduced plateau regions in the measured intensity pattern and made the overall pattern more diverse.
The red lines in Figure 2a are Lorentz functions fitted to different peaks. The narrowest peak was around 1560 nm. The FWHM linewidth was measured to be 75 pm. The Q factor of 2.1 × 10⁴ was calculated. This result was close to the measured upper limit for PMMA microspheres [18].
Detection limit Δλ was calculated using the equation:
Δ λ = F W H M S N R × 2
where SNR is a signal-to-noise ratio. The experimental detection limit of a PMMA microsphere sensor was 5 pm. The detection limit was mainly dependent on the Q factor of the resonator. In this case, noise in the recorded intensity patterns was low (after eliminating noise from the laser source). When using Equation (3), the maximum detection limit was different for each microsphere and depended on the peak, which was chosen from the intensity pattern. We chose the narrowest peak, close to 1560 nm, and 5 pm was the highest resolution that we observed for this microsphere.
A system of many spheres can be used to measure an unknown wavelength. Figure 3 illustrates the alignment of many microspheres attached to a single tapered fiber and a few corresponding light intensity measurements for each microsphere during the laser scan. As microspheres differ in size and how they attach to the tapered fiber, they have different scattered light intensity patterns during the wavelength scan. A combination of several patterns can be used to determine the laser wavelength going through the tapered fiber. The novelty of this system was the use of a tapered fiber instead of a glass plate acting as a prism [28,30,35]. Using tapered fiber as the waveguide enables the construction of a compact device.
Multiple microspheres were attached to a single tapered fiber in a way that WGM resonances were excited. This meant that a similar intensity analysis could be simultaneously performed on a group of PMMA microspheres. Each microsphere gave a specific barcode (Figure 2b); combining several barcodes increased the sensitivity of the sensor system. Each intensity spectra (from every microsphere) was plotted into a single barcode and combined into a mode map.
A mode map from 11 different spheres is shown in Figure 4. Average or integral intensities combining all outer regions for each microsphere are displayed. Not all the spheres were excited at the same time, and intensity patterns during laser scans were unique to every single microsphere.
Whispering gallery mode microresonators can differ in size, material, refractive index, and shape. In our case, all the microspheres were made of the same material. Therefore, the size and coupling position of the resonators determined the intensity patterns as shown in Figure 4. The mode intensity map was obtained by collecting scattered light from microresonators. This meant that the surface imperfections of resonators made each intensity pattern unique. To successfully detect an unknown wavelength, the mode map needed to be diverse; there could not be plateaus in intensity patterns at the same time. To avoid this, many microspheres were attached to the tapered fiber.
Such intensity patterns, as described above, were used for wavelength detection, creating a specific wavelength map, which helps find wavelength based on the PMMA microsphere intensity. Specific wavelengths were determined from a pre-recorded map of barcodes by calculating the least squares difference or correlation with the actual barcode and choosing the row in the map with the smallest difference [28,29,30,38]. Additionally, these maps were created to determine other physical parameters, such as temperature, humidity, the concentration of gases in the air, etc.
PMMA was sensitive to relative humidity and temperature changes; it also dissolved in many organic solvents like acetone, benzene, and others. Thus, PMMA resonators should be isolated from external changes in the surrounding environment to precisely measure wavelength. As shown by Petermann et al. [29] it was possible to fix PMMA microspheres with UV glue and to measure light intensity with a camera without the glue interfering. In our earlier attempts, we created a PMMA temperature sensor, which required microspheres to change their dimensions due to thermal expansion [17]. Glue significantly decreased the thermal expansion of the spheres. A limited range of expansion for PMMA microspheres in the case of a wavelength sensor could even decrease the impact of temperature affectionally to the temperature stabilization. Moreover, the layer of glue could serve as a protective layer from other chemicals in the surrounding environment, making the proposed sensor selective only to wavelength changes. Although packaging microspheres together with a tapered fiber could be more challenging than gluing them to a prism, methods for this process have already been demonstrated [39].

3.2. Mode Map Generated from a Single Microsphere

To develop a more efficient wavelength sensor, we divided an image of a single microsphere into different regions (Figure 1d). We proposed an idea to reduce the number of microspheres needed to create a functioning and sensitive wavelength sensor. Instead of several barcodes from various microspheres, one could use several barcodes from different regions of a single microsphere. Moreover, dividing an image of the microsphere into different sections could reduce the problems with plateaus in intensity patterns for microspheres. To test this, we used a custom-built Python program to analyze NIR camera images in real-time.
Figure 5a,b shows the comparison between measuring average light intensity in one microsphere and dividing it into smaller regions. Examples of division into smaller regions are shown in Figure 1d. The tendency was to reach the highest intensity at a specific wavelength, and this wavelength was similar in Figure 5a,b. The same strongest resonance peak was shifted in different regions from 1553.45 to 1553.65 nm, which was a difference of 0.2 nm. We explained this effect as an interference of different spatial modes circulation in the microsphere with surface irregularities. Differences between the selected regions become more significant when the microsphere was detuned from resonance.
We concluded that these differences were not enough to substitute the system of many microspheres with a single one. However, it could improve the sensitivity of the sensor system proposed in the previous section. The principle was shown in Figure 5a,b in the range 1552–1556 nm. Figure 5c shows a mode map created from seven different regions of the same microsphere. Scattered light patterns for the different regions tended to be more similar to each other than the patterns from various microspheres, as shown in Figure 4. We observed that intensity patterns from different regions of a single PMMA microsphere were more diverse if the microsphere was slightly deformed. However, the Q factor of such microspheres was lower. The effect of surface irregularities was more pronounced in the visible range. In our previous study [40] of the same microspheres with 633 nm light, the Q factors did not exceed 3000. This could negatively affect the detection limit but increase the sensitivity of the proposed sensor at different wavelengths (even when the microsphere is detuned from a resonance). Unique intensity patterns from a single microsphere could be used as a security key or identification code in the future. Packaged tapered fiber and microsphere systems may find useful applications outside of the already discussed sensing field.

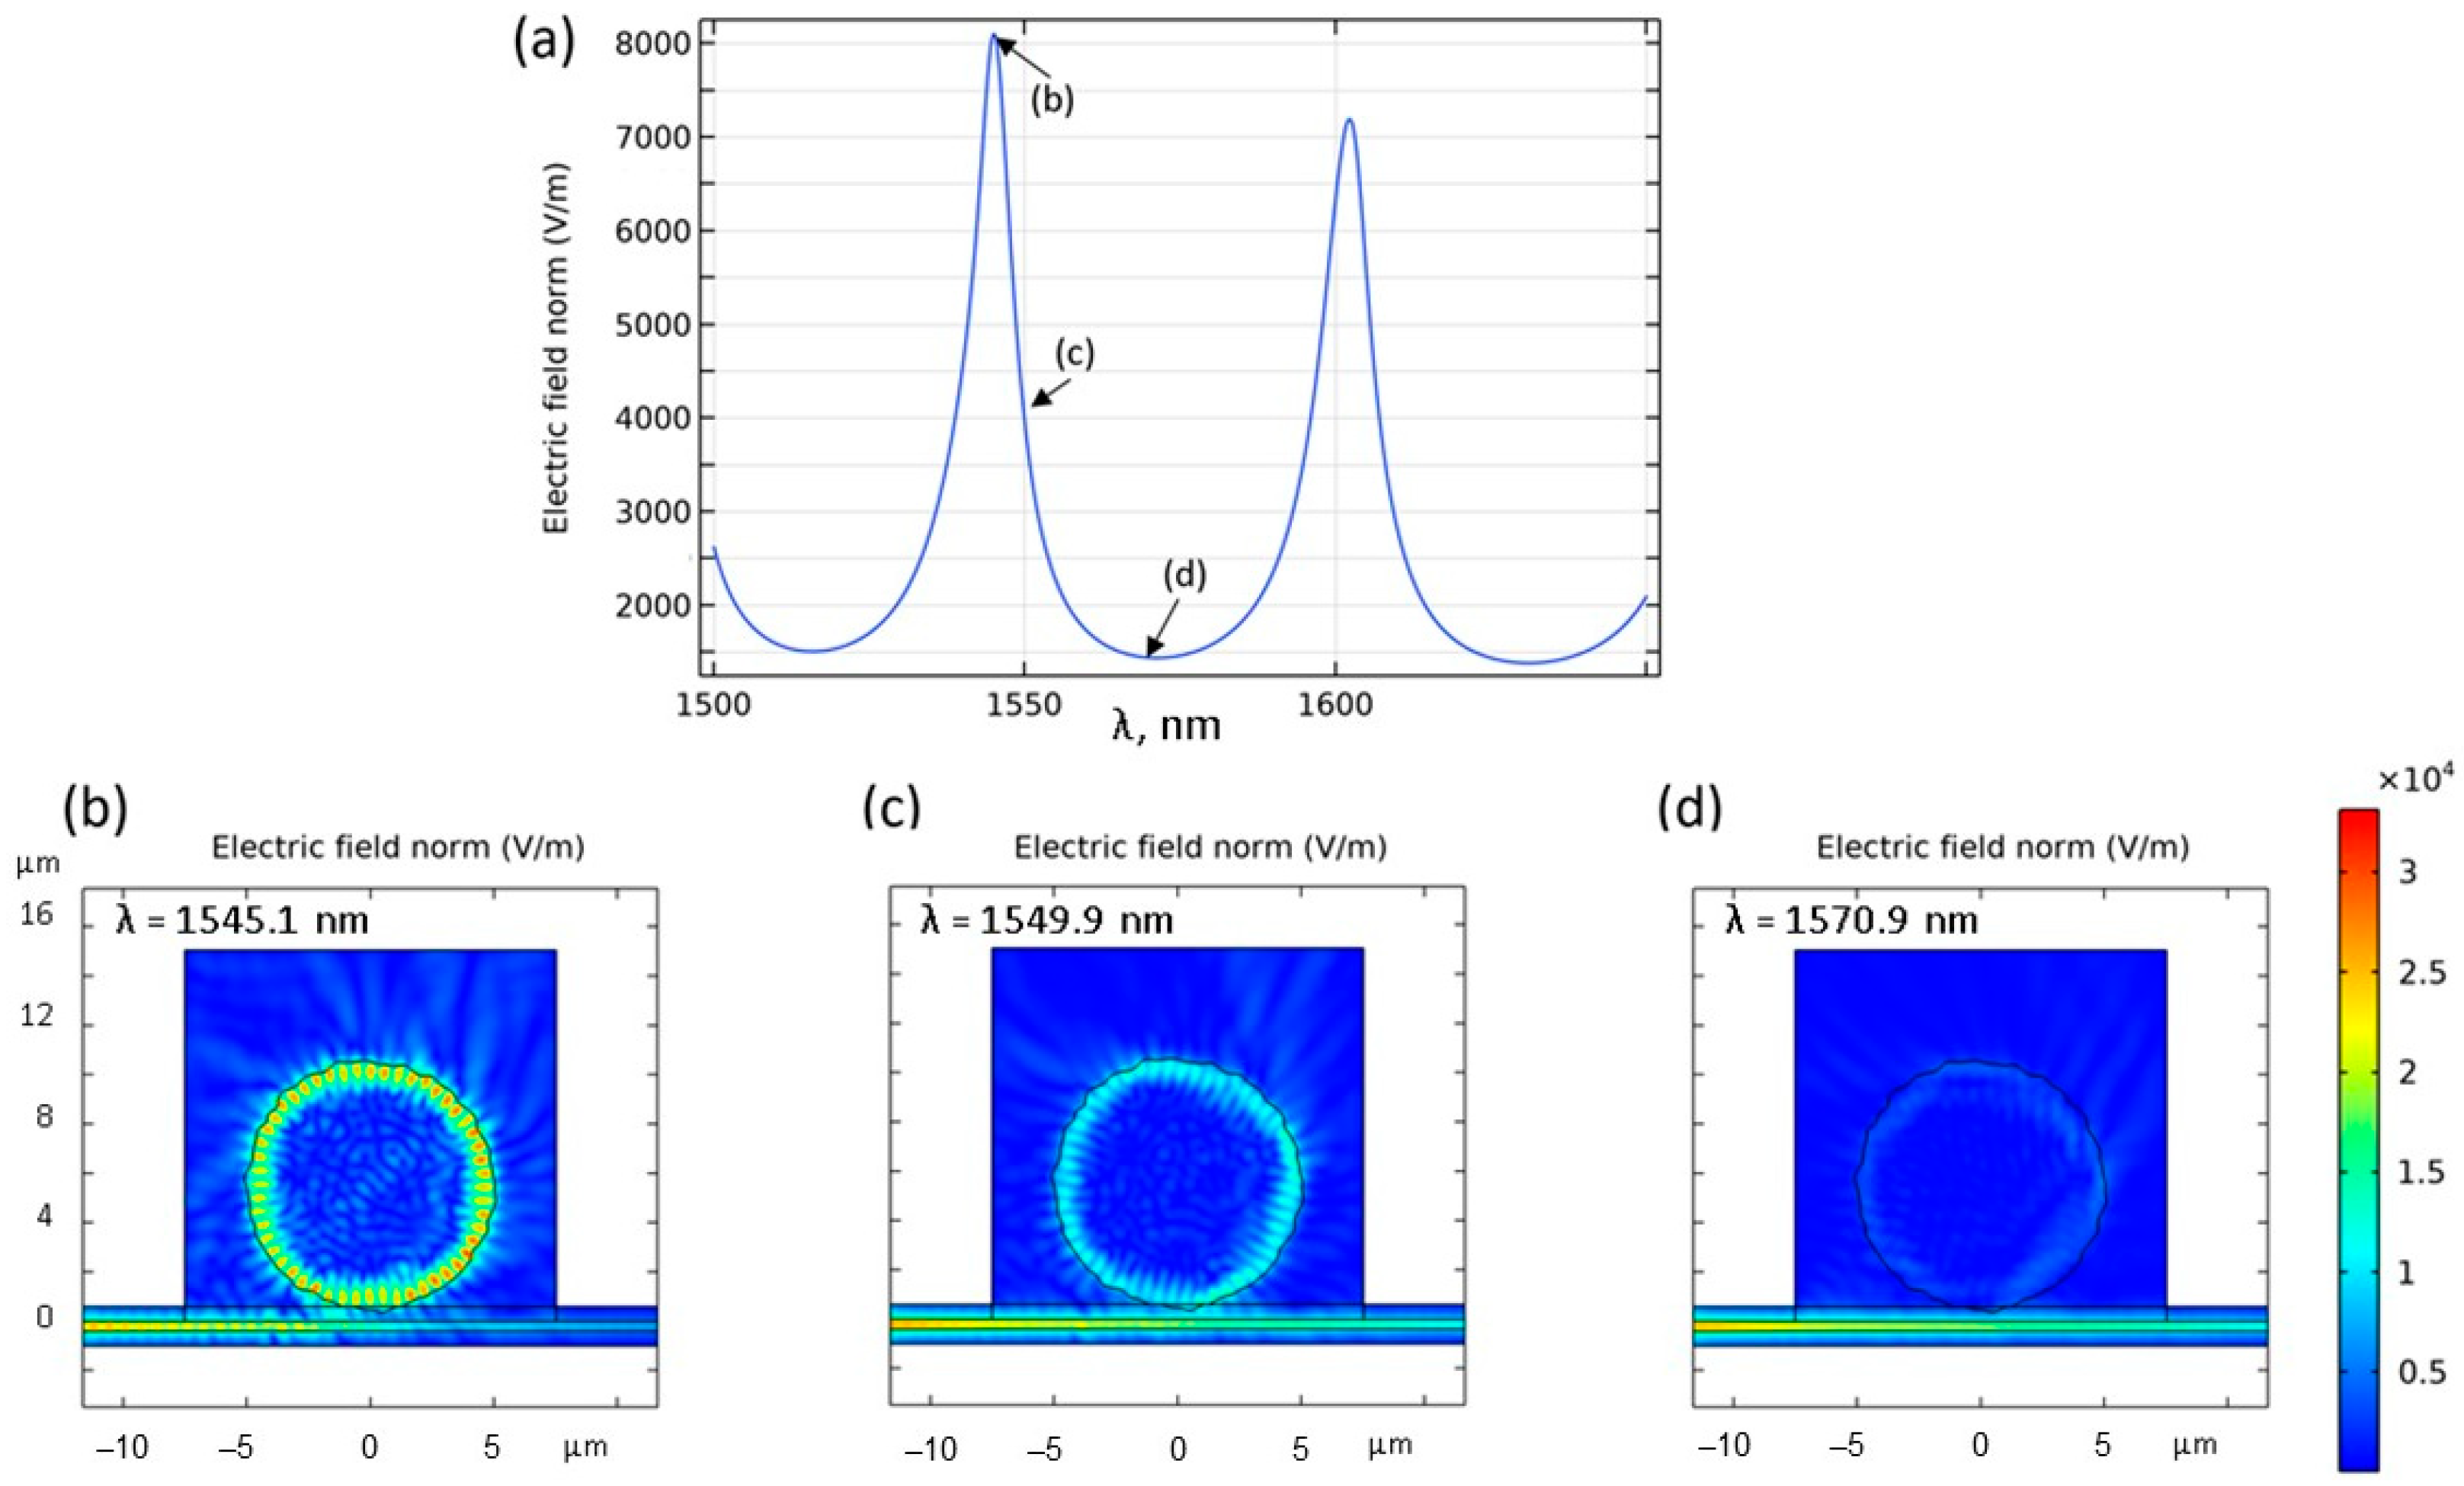
3.3. COMSOL Simulations

COMSOL multiphysics simulations were done in two dimensions using the finite element method. The geometry of the simulation was divided into many triangular segments and the software solves the Maxwell equations. The selected physics for the simulation was Electromagnetic Waves, Frequency Domain, and the results were calculated using the Frequency Domain study. The maximum mesh element size for the simulation was 0.25 μm. The refractive indexes used in the simulation were: n P M M A = 1.4811 , n f i b e r = 1.4440 , and n a i r = 1 . Simulations showed that fundamental and higher order modes could be excited in the PMMA microspheres (Figure 6a).
Different modes are not located in the same geometrical place on the PMMA microsphere surface—some modes are closer to the borderline between PMMA material and air, but some are concentrated 1–2 μm closer to the center of the microsphere. Such aspects could play a significant role when collecting scattered light, as modes that are closer to the outer surface imperfect layer of the microsphere will have stronger interaction with it.
To better predict possible scattered light intensity patterns, the electric field of circulating light inside the microsphere was integrated. Figure 6b shows integral values of the electric field inside the microsphere at different wavelengths in the NIR region. The simulated spectrum mimics the experimental results shown in Figure 2a. The narrowest simulated resonances have about 100 pm FWHM linewidth which is consistent with our experimental observations.
Figure 7a shows two fundamental modes for a rather small diameter PMMA microsphere with surface irregularities. The free spectral range (FSR) between the two fundamental modes was approximately 50 nm. This FSR was different from the experiment because in the 2D regime we simulated a 6x smaller microsphere. Figure 7b–d shows a PMMA microsphere coupled to the tapered fiber. Simulations showed how light was non-uniformly scattered due to surface irregularities. We also observed this effect in the experiments; some regions of the microsphere are brighter than others. Simulations confirm that at each wavelength the PMMA microsphere had a unique way of scattering light from it. The largest scattered light intensity was observed when the fundamental mode was excited with high efficiency (Figure 7b). When WGMs were not excited in the microsphere, little light was scattered from its surface. Instead, the intensity of the light transmitted through the tapered fiber was higher in this case (Figure 7d).

4. Discussion

In this study, the advances toward a PMMA wavelength sensor based on a WGM microresonator were discussed. We used commercially available PMMA microspheres attached to a single tapered fiber to create a compact WGM wavelength sensor. Monitoring the microspheres with an NIR camera and open-source Python code in real-time allowed us to analyze the scattered light intensity patterns while tuning the laser wavelength. As a result, for each microsphere, a unique barcode was developed. A mode map was generated for the system containing 11 microspheres. These mode maps could then be used to determine an unknown wavelength. The highest wavelength detection resolution for this sensor system was 5 pm. COMSOL simulations revealed that the scattered light intensity patterns were unique and diverse due to PMMA microsphere surface irregularities and imperfections. These irregularities, paired with highly efficient light coupling, could increase the sensor’s resolution.
We proposed and experimentally demonstrated a novel idea to use tapered fiber and one PMMA microsphere while dividing the microsphere into smaller sections for light intensity analysis. We have shown that the intensity patterns could be obtained from at least seven regions of the same microsphere. While it was not enough to substitute the set of many spheres with a single one, it could increase the overall sensitivity of the sensor when using many spheres.
The current experimental setup has limited immunity to environmental disturbances—microspheres can freely move due to vibrations and the attachment to the tapered fiber is random. A way to improve this would be to fix spheres to the tapered fiber with glue. Using polarization-maintaining fiber should improve the stability of light polarization reaching the microspheres. A future approach would be to integrate the system of waveguide coupled micro-ring resonators with different diameters on an optical chip, for example, using single-mode optical waveguides made from SU-8 polymer photoresist. This would give dimensional stability, the chance to control the polarization, and allow the fabrication of devices with repeatable parameters. For practical use, the camera system can also be miniaturized.

Author Contributions

Conceptualization, R.B. and J.A.; methodology, R.B. and T.S.; software, R.B. and P.K.R.; mathematical modeling, K.D.; validation, R.B., I.B. and J.A.; formal analysis, R.B.; investigation, R.B.; resources, T.S.; data curation, R.B. and P.K.R.; writing—original draft preparation, P.K.R., R.B. and L.M.; writing—review and editing, L.M. and I.B.; visualization, R.B. and P.K.R.; supervision, J.A. and A.A.; project administration, A.A.; funding acquisition, A.A. All authors have read and agreed to the published version of the manuscript.

Funding

This research was funded by LZP project No. lzp-2018/1-0510 “Optical whispering gallery mode microresonator sensors”, ERDF project No. 1.1.1.5/19/A/003 “The Development of Quantum Optics and Photonics at the University of Latvia”, RTU Science and Innovation Research Platforms Grant No. ZI-2021/5, Austrian Science Fund FWF within the DK-ALM (W1259-N27) and ERDF project No. 8.2.2.0/20/I/006.

Institutional Review Board Statement

Not applicable.

Informed Consent Statement

Not applicable.

Data Availability Statement

Not applicable.

Acknowledgments

Authors are thankful to R. A. Ganeev for suggestions and useful comments on the manuscript.

Conflicts of Interest

The authors declare no conflict of interest. The funders had no role in the design of the study, in the collection, analyses, or interpretation of data, in the writing of the manuscript, or in the decision to publish the results.

References

  1. Nagatsuma, T.; Horiguchi, S.; Minamikata, Y.; Yoshimizu, Y.; Hisatake, S.; Kuwano, S.; Yoshimoto, N.; Terada, J.; Takahashi, H. Terahertz Wireless Communications Based on Photonics Technologies. Opt. Express 2013, 21, 23736. [Google Scholar] [CrossRef] [PubMed] [Green Version]
  2. O’Mahony, M. Future Optical Networks. Opt. Fiber Telecommun. V1B 2008, 24, 611–640. [Google Scholar] [CrossRef]
  3. Pasquazi, A.; Peccianti, M.; Razzari, L.; Moss, D.J.; Coen, S.; Erkintalo, M.; Chembo, Y.K.; Hansson, T.; Wabnitz, S.; Del’Haye, P.; et al. Micro-Combs: A Novel Generation of Optical Sources. Phys. Rep. 2018, 729, 1–81. [Google Scholar] [CrossRef]
  4. Barth, I.; Conteduca, D.; Reardon, C.; Johnson, S.; Krauss, T.F. Common-Path Interferometric Label-Free Protein Sensing with Resonant Dielectric Nanostructures. Light Sci. Appl. 2020, 9, 96. [Google Scholar] [CrossRef] [PubMed]
  5. Toropov, N.; Cabello, G.; Serrano, M.P.; Gutha, R.R.; Rafti, M.; Vollmer, F. Review of Biosensing with Whispering-Gallery Mode Lasers. Light Sci. Appl. 2021, 10, 42. [Google Scholar] [CrossRef]
  6. Dobosz, M.; Kożuchowski, M. Overview of the Laser-Wavelength Measurement Methods. Opt. Lasers Eng. 2017, 98, 107–117. [Google Scholar] [CrossRef]
  7. Petermann, A.B.; Varkentin, A.; Roth, B.; Morgner, U.; Meinhardt-Wollweber, M. All-Polymer Whispering Gallery Mode Sensor System. Opt. Express 2016, 24, 6052. [Google Scholar] [CrossRef]
  8. Righini, G.C.; Dumeige, Y.; Féron, P.; Ferrari, M.; Conti, G.N.; Ristic, D.; Soria, S. Whispering Gallery Mode Microresonators: Fundamentals and Applications. Riv. Nuovo Cim. 2011, 34, 435–488. [Google Scholar] [CrossRef]
  9. Zhu, J.; Ozdemir, S.K.; Xiao, Y.F.; Li, L.; He, L.; Chen, D.R.; Yang, L. On-Chip Single Nanoparticle Detection and Sizing by Mode Splitting in an Ultrahigh-Q Microresonator. Nat. Photonics 2010, 4, 46–49. [Google Scholar] [CrossRef]
  10. Armani, D.K.; Kippenberg, T.J.; Spillane, S.M.; Vahala, K.J. Ultra-High-Q Toroid Microcavity on a Chip. Nature 2003, 421, 925–928. [Google Scholar] [CrossRef]
  11. Qiulin, M.; Huang, L.; Guo, Z.; Rossmann, T. Spectral Shift Response of Optical Whispering-Gallery Modes Due to Water Vapor Adsorption and Desorption. Meas. Sci. Technol. 2010, 21, 115206. [Google Scholar] [CrossRef] [Green Version]
  12. Ascorbe, J.; Corres, J.M.; Arregui, F.J.; Matias, I.R. Recent Developments in Fiber Optics Humidity Sensors. Sensors 2017, 17, 893. [Google Scholar] [CrossRef] [PubMed] [Green Version]
  13. Reinis, P.K.; Milgrave, L.; Draguns, K.; Brice, I.; Alnis, J.; Atvars, A. High-Sensitivity Whispering Gallery Mode Humidity Sensor Based on Glycerol Microdroplet Volumetric Expansion. Sensors 2021, 21, 1746. [Google Scholar] [CrossRef]
  14. Boyd, R.W.; Heebner, J.E. Sensitive Disk Resonator Photonic Biosensor. Appl. Opt. 2001, 40, 5742–5747. [Google Scholar] [CrossRef] [PubMed]
  15. Schliesser, A.; Anetsberger, G.; Rivière, R.; Arcizet, O.; Kippenberg, T.J. High-Sensitivity Monitoring of Micromechanical Vibration Using Optical Whispering Gallery Mode Resonators. New J. Phys. 2008, 10, 095015. [Google Scholar] [CrossRef]
  16. Li, B.B.; Wang, Q.Y.; Xiao, Y.F.; Jiang, X.F.; Li, Y.; Xiao, L.; Gong, Q. On Chip, High-Sensitivity Thermal Sensor Based on High- Q Polydimethylsiloxane-Coated Microresonator. Appl. Phys. Lett. 2010, 96, 2008–2011. [Google Scholar] [CrossRef] [Green Version]
  17. Berkis, R.; Alnis, J.; Brice, I.; Atvars, A.; Draguns, K.; Grundšteins, K.; Reinis, P.K. Mode Family Analysis for PMMA WGM Micro Resonators Using Spot Intensity Changes. In Proceedings of the SPIE, Laser Resonators, Microresonators, and Beam Control XXIII, Online, 6–11 March 2021; Volume 11672, p. 1167217. [Google Scholar]
  18. Brice, I.; Grundsteins, K.; Draguns, K.; Atvars, A.; Alnis, J. Whispering Gallery Mode Resonator Temperature Compensation and Refractive Index Sensing in Glucose. Sensors 2021, 21, 7184. [Google Scholar] [CrossRef]
  19. Yang, S.; Wang, Y.; Sun, H.D. Advances and Prospects for Whispering Gallery Mode Microcavities. Adv. Opt. Mater. 2015, 3, 1136–1162. [Google Scholar] [CrossRef]
  20. Brice, I.; Grundsteins, K.; Atvars, A.; Alnis, J.; Viter, R.; Ramanavicius, A. Whispering Gallery Mode Resonator and Glucose Oxidase Based Glucose Biosensor. Sens. Actuators B Chem. 2020, 318, 128004. [Google Scholar] [CrossRef]
  21. Zheng, Y.; Wu, Z.; Ping Shum, P.; Xu, Z.; Keiser, G.; Humbert, G.; Zhang, H.; Zeng, S.; Dinh, X.Q. Sensing and Lasing Applications of Whispering Gallery Mode Microresonators. Opto-Electron. Adv. 2018, 1, 18001501–18001510. [Google Scholar] [CrossRef]
  22. Matsko, A.B.; Ilchenko, V.S. Optical Resonators With Whispering-Gallery Modes—Part I: Basics. IEEE J. Sel. Top. Quantum Electron. 2006, 12, 3–14. [Google Scholar] [CrossRef]
  23. Bogaerts, W.; de Heyn, P.; van Vaerenbergh, T.; de Vos, K.; Kumar Selvaraja, S.; Claes, T.; Dumon, P.; Bienstman, P.; van Thourhout, D.; Baets, R. Silicon Microring Resonators. Laser Photonics Rev. 2012, 6, 47–73. [Google Scholar] [CrossRef]
  24. Atvars, A. Analytical Description of Resonances in Fabry–Perot and Whispering Gallery Mode Resonators. J. Opt. Soc. Am. B 2021, 38, 3116–3129. [Google Scholar] [CrossRef]
  25. Gorodetsky, M.L.; Savchenkov, A.A.; Ilchenko, V.S. Ultimate Q of Optical Microsphere Resonators. Opt. Lett. 1996, 2799, 453–455. [Google Scholar] [CrossRef]
  26. Vernooy, D.W.; Ilchenko, V.S.; Mabuchi, H.; Streed, E.W.; Kimble, H.J. High-Q Measurements of Fused-Silica Microspheres in the near Infrared. Opt. Lett. 1998, 23, 247–249. [Google Scholar] [CrossRef] [Green Version]
  27. Tang, J.; Liu, J.; Shang, C.; Xie, C.; Guo, H.; Qian, K.; Xue, C.; Liu, J. Fabrication and Spectral Characterizations of High Q Asymmetric Resonant Cavities. Opt. Commun. 2015, 355, 269–273. [Google Scholar] [CrossRef]
  28. Petermann, A.B.; Hildebrandt, T.; Morgner, U.; Roth, B.W.; Meinhardt-Wollweber, M. Polymer Based Whispering Gallery Mode Humidity Sensor. Sensors 2018, 18, 2383. [Google Scholar] [CrossRef] [Green Version]
  29. Petermann, A.B.; Rezem, M.; Roth, B.; Morgner, U.; Meinhardt-Wollweber, M. Surface-Immobilized Whispering Gallery Mode Resonator Spheres for Optical Sensing. Sens. Actuators A Phys. 2016, 252, 82–88. [Google Scholar] [CrossRef]
  30. Schweiger, G.; Nett, R.; Weigel, T. Microresonator Array for High-Resolution Spectroscopy. Opt. Lett. 2007, 32, 2644–2646. [Google Scholar] [CrossRef]
  31. Labrador-Páez, L.; Soler-Carracedo, K.; Hernández-Rodríguez, M.; Martín, I.R.; Carmon, T.; Martin, L.L. Liquid Whispering-Gallery-Mode Resonator as a Humidity Sensor. Opt. Express 2017, 25, 1165–1172. [Google Scholar] [CrossRef]
  32. Metzger, N.K.; Spesyvtsev, R.; Bruce, G.D.; Miller, B.; Maker, G.T.; Malcolm, G.; Mazilu, M.; Dholakia, K. Harnessing Speckle for a Sub-Femtometre Resolved Broadband Wavemeter and Laser Stabilization. Nat. Commun. 2017, 8, 15610. [Google Scholar] [CrossRef] [PubMed] [Green Version]
  33. Salgals, T.; Alnis, J.; Murnieks, R.; Brice, I.; Porins, J.; Andrianov, A.V.; Anashkina, E.A.; Spolitis, S.; Bobrovs, V. Demonstration of a Fiber Optical Communication System Employing a Silica Microsphere-Based OFC Source. Opt. Express 2021, 29, 10903–10913. [Google Scholar] [CrossRef] [PubMed]
  34. Popov, R.; Shankara, G.K.; von Bojnicic-Kninski, C.; Barua, P.; Mattes, D.; Breitling, F.; Nesterov-Mueller, A. Stochastic Deposition of Amino Acids into Microcavities via Microparticles. Sci. Rep. 2019, 9, 16468. [Google Scholar] [CrossRef] [PubMed] [Green Version]
  35. Petermann, A.B.; Roth, B.; Morgner, U.; Meinhardt-Wollweber, M. All-Polymer Whispering Gallery Mode Sensor for Application in Optofluidics. Opt. Data Process. Storage 2017, 3, 8–12. [Google Scholar] [CrossRef]
  36. Draguns, K.; Brice, I.; Atvars, A.; Alnis, J. Computer Modelling of WGM Microresonators with a Zinc Oxide Nanolayer Using COMSOL Multiphysics Software. In Proceedings of the SPIE, Laser Resonators, Microresonators, and Beam Control XXIII, Online, 6–11 March 2021; Volume 11672, p. 1167216. [Google Scholar]
  37. Beadie, G.; Brindza, M.; Flynn, R.A.; Rosenberg, A.; Shirk, J.S. Refractive Index Measurements of Poly(Methyl Methacrylate) (PMMA) from 0.4–1.6 µm. Appl. Opt. 2015, 54, 139–143. [Google Scholar] [CrossRef]
  38. Liao, J.; Yang, L. Optical whispering-gallery mode barcodes for high-precision and wide-range temperature measurements. Light Sci. Appl. 2021, 10, 32. [Google Scholar] [CrossRef]
  39. Dong, Y.; Wang, K.; Jin, X. Package of a Dual-Tapered-Fiber Coupled Microsphere Resonator with High Q Factor. Opt. Commun. 2015, 350, 230–234. [Google Scholar] [CrossRef]
  40. Berkis, R.; Alnis, J.; Atvars, A.; Brice, I.; Draguns, K.; Grundsteins, K. Quality Factor Measurements for PMMA WGM Microsphere Resonators Using Fixed Wavelength Laser and Temperature Changes. In Proceedings of the 2019 IEEE 9th International Conference on Nanomaterials: Applications and Properties, NAP, Odessa, Ukraine, 15–20 September 2019; pp. 9–12. [Google Scholar] [CrossRef]
Figure 1. (a) Scheme of the experimental setup for PMMA microsphere characterization. WGMs and circulating light in the microspheres were observed with a camera through the sealed humidity and dust prevention box roof. (b) Microscope image of various size PMMA microspheres attached to a tapered fiber taken with the visible light camera and additional visible illumination. (c) The same place observed with a NIR camera when only NIR laser radiation was propagating through the tapered fiber. Due to surface imperfections of the microspheres, we could record light intensity on the outer layer of each sphere where circulating light was scattered and leaked out of the microspheres. (d) Close-up of one PMMA microsphere (taken with a NIR camera) when WGMs are present. Green lines indicate the division of the microsphere image into smaller sections.
Fibers 10 00090 g001
Figure 2. (a) Light intensity of one PMMA microsphere (diameter 50 μm) attached to a tapered fiber. Intensity peaks show at what wavelength WGMs were excited. The vertical axis shows normalized light intensity values (average scattered light from all regions of the microsphere). (b) Light intensities for various wavelengths are plotted in a barcode system.
Fibers 10 00090 g002
Figure 3. Intensity measurements of different PMMA microspheres while scanning laser from 1550 to 1570 nm. In the middle, a microscope image of tapered fiber and the excited PMMA microspheres can be seen. Arrows point to the intensity changes in each of the selected microspheres. Vertical axes show normalized relative intensity values.
Fibers 10 00090 g003
Figure 4. Average intensity is shown in the barcode system for 11 different PMMA microspheres attached to the tapered fiber. This mode map can be used for unknown wavelength determination.
Fibers 10 00090 g004
Figure 5. Experimental data of scattered light from a single microsphere. A small section of the light intensity pattern from: (a) analyzing one PMMA microsphere; (b) dividing the same PMMA microsphere into seven regions. Four of the seven regions have been plotted to show differences between them; (c) mode map generated from different regions of one PMMA microsphere.
Fibers 10 00090 g005
Figure 6. COMSOL simulation results from a perfect sphere with a smooth surface. (a) A sample of four modes in the same microresonator (radius is 30 µm). The mode numbers for angular mode p = lm and radial mode q from left to right are p = 0, q = 1; p = 4, q = 1; p = 0, q = 2, and p = 2, q = 2; (b) integral value of electric field inside the PMMA microsphere at different wavelengths.
Fibers 10 00090 g006
Figure 7. 2D COMSOL simulations to examine light scattering from spherical microresonators with 10 µm diameter. In this case, the surface of the microresonator was not perfectly round, the outer layer was deformed. (a) The absorption spectrum of the PMMA microsphere, letters (bd) in the graph indicate the wavelengths chosen for further analysis. 2D image for electric field distribution of the PMMA microsphere with a deformed surface at (b) 1545.1 nm matching the resonance, (c) 1549.9 nm detuned from the resonance, and (d) 1570.9 nm off the resonance.
Fibers 10 00090 g007
Publisher’s Note: MDPI stays neutral with regard to jurisdictional claims in published maps and institutional affiliations.

