Article

Cracking Diagnosis in Fiber-Reinforced Concrete with Synthetic Fibers Using Piezoelectric Transducers

by
Maristella E. Voutetaki
1,
Maria C. Naoum
2,
Nikos A. Papadopoulos
2 and
Constantin E. Chalioris
2,*
1
Structural Science and Technology Division, Architectural Engineering Department, School of Engineering, Democritus University of Thrace, 67100 Xanthi, Greece
2
Laboratory of Reinforced Concrete and Seismic Design of Structures, Civil Engineering Department, School of Engineering, Democritus University of Thrace, 67100 Xanthi, Greece
*
Author to whom correspondence should be addressed.
Fibers 2022, 10(1), 5; https://doi.org/10.3390/fib10010005
Submission received: 12 October 2021 / Revised: 6 December 2021 / Accepted: 20 December 2021 / Published: 9 January 2022

Abstract

:
The addition of short fibers in concrete mass offers a composite material with advanced properties, and fiber-reinforced concrete (FRC) is a promising alternative in civil engineering applications. Recently, structural health monitoring (SHM) and damage diagnosis of FRC has received increasing attention. In this work, the effectiveness of a wireless SHM system to detect damage due to cracking is addressed in FRC with synthetic fibers under compressive repeated load. In FRC structural members, cracking propagates in small and thin cracks due to the presence of the dispersed fibers and, therefore, the challenge of damage detection is increasing. An experimental investigation on standard 150 mm cubes made of FRC is applied at specific and loading levels where the cracks probably developed in the inner part of the specimens, whereas no visible cracks appeared on their surface. A network of small PZT patches, mounted to the surface of the FRC specimen, provides dual-sensing function. The remotely controlled monitoring system vibrates the PZT patches, acting as actuators by an amplified harmonic excitation voltage. Simultaneously, it monitors the signal of the same PZTs acting as sensors and, after processing the voltage frequency response of the PZTs, it transmits them wirelessly and in real time. FRC cracking due to repeated loading ad various compressive stress levels induces change in the mechanical impedance, causing a corresponding change on the signal of each PZT. The influence of the added synthetic fibers on the compressive behavior and the damage-detection procedure is examined and discussed. In addition, the effectiveness of the proposed damage-diagnosis approach for the prognosis of final cracking performance and failure is investigated. The objectives of the study also include the development of a reliable quantitative assessment of damage using the statistical index values at various points of PZT measurements.

1. Introduction

Fiber-reinforced concrete (FRC) with short discrete fibers as mass reinforcement is an efficient cement-based composite that can overcome, up to a point, the drawbacks of the quasi-brittleness of plain concrete [1,2,3]. Steel fibers have extensively been studied in small-sized concrete specimens under various loading conditions [4,5,6] and in large-scale reinforced concrete (RC) structural members subjected to monotonic [7,8,9,10] and, recently, to reverse cyclic deformations [11,12,13,14].
The addition of fibers in concrete improves its strength, toughness, cracking, and tension performance because the randomly distributed fibers effectively restrict the unstable propagation of cracks both in micro- and macro-levels [15,16,17]. It has been proven that fibers provide significant crack control, since FRC exhibits strain-softening behavior even after the appearance of macro-cracks [18,19,20]. The formation of macro-cracks could lead to the corrosion of steel reinforcement and, therefore, crack-width reduction due to fibers becomes vital to increasing the durability of RC structural members [21,22,23]. Furthermore, potential reduction of the required conventional steel shear reinforcement by the addition of steel fibers has also been indicated by tests and analyses performed by the authors and other researchers [11,24,25,26,27].
Concrete with randomly dispersed synthetic fibers is a type of FRC that presents reduced plastic shrinkage cracking, and increased impact resistance and toughness with respect to the plain concrete properties [28,29]. Like most fibers added in concrete matrix, synthetic fibers provide enhanced post-cracking characteristics in terms of ductility, especially on the tensile response [30,31,32]. Fibers arrest the opening and widening of microcracks; thus, FRC exhibits improved straining capacity under tension and compression. However, the low elastic modulus of synthetic fibers reduces their transference in tension, and therefore they contribute less to the FRC behavior after cracking than steel fibers. Furthermore, although synthetic fibers slightly improve the tensile strength in direct tension tests, splitting and bending tests indicate the beneficial influence of these fibers on the ultimate splitting and flexural tensile strength [33,34].
Another important issue of growing concern in civil engineering applications is the need to monitor and implement state-of-health identification techniques in existing infrastructures. Prompt diagnosis of critical failures in RC structures could dodge further structural deterioration and sudden collapse that could cause significant economic losses and abrupt causalities [35,36]. A prominent solution to this problem is to perform continuous in-situ and real-time surveillance to detect perilous damage due to cracking and/or steel-reinforcement yielding, and eventually to assess their severity level [37,38].
Structural health monitoring (SHM) using smart materials and systems is as an emerging technology for the assessment of the internal state of RC structures under operational and critical loads. Piezoelectric lead zirconate titanate (PZT) transducers have received widespread application in electro-mechanical admittance (EMA)-based health monitoring due to their favorable properties [39,40,41,42]. Recent studies have successfully demonstrated the utilization of the EMA technique with the implementation of small-sized, surface-bonded and/or -embedded PZT transducers to detect damage in RC structural members [43,44,45].
The application of piezoelectric materials in SHM techniques has shown important advantages, such as high frequency response, structural simplicity, low cost, and the ability to generate an electrical signal by applying mechanical force. The disadvantages are focused on the limitations of their range area; the uncertainties caused by their application to cracked, damaged, or non-homogenous construction materials such as RC; and the difficulties in identifying the severity and the location of structural damages, since low damage caused near the location of the piezoelectric transducer can present the same results as higher damage farther away [39,42]. For comparison reasons, the main features of some other smart materials used as sensors in SHM applications are also summarized as follows [46,47]:
-
Shape memory alloys have elastic behavior, are corrosion resistant, and have high fatigue failure life, damping capacities, and strength. However, they are expensive, temperature sensitive, and have high cycle fatigue, along with complicated design and heavy weight.
-
Magnetostrictive materials present higher energy density and intrinsic robustness, but they increase the complexity of the structural system, present low accuracy of experimental reproduction, are only suitable for ferromagnetic materials, and their induced energy depends on the proximity of the probe to the monitoring area.
-
Self-monitoring fiber-reinforced composites can be used simultaneously as reinforcing structural materials and as sensing materials that can monitor their own strain, damage, and temperature by their change in electrical resistance utilizing a simple technology. However, their sensitivity to strain is very low in the strain range, from zero to the point just before fiber fracture; their sensing repeatability requires improvement; and, to date, field applications in SHM of civil engineering structures have not been developed.
-
Optical fibers are flexible, corrosion resistant, take up less space, and have immunity to electromagnetic interference and tapping along with high bandwidth support and carrying capacity. Furthermore, fiber-optical sensors can be used in various in-situ and real-time surveillance applications in civil engineering structures, such as monitoring of strain, displacement, vibration, cracks, corrosion, and chloride-ion concentration. They have high sensing capability, the ability to operate in harsh environments, and a large sensing scope. Nevertheless, optical fibers have costly installation, cannot carry electrical power to operate terminal devices, are not suitable at higher optical powers and are fragile in some configurations, and the damage is difficult to repair when embedded. Furthermore, their ability to detect defects and damages along with their long-term sensing capabilities require further investigation.
Furthermore, a reliable assessment of gradually increased damages in RC structural members due to the imposed cyclic loading history with increasing deformation steps has been achieved using the real-time measurements of a network of PZT patches that were installed in regions of the member near the potential damage. Applications of this SHM methodology in real-scale RC frames and beams under lateral reversal loads were investigated by the authors [48,49,50].
Recently, health monitoring of steel FRC specimens using the PZT-enabled EMA-based method was addressed [51]. However, the effectiveness of this SHM technique in FRC specimens with synthetic fibers has not been studied, to the authors’ knowledge. Furthermore, the prognosis of catastrophic failures in RC and FRC structures due to fatigue or under seismic/repeated loading using a real-time SHM system is a challenging task because of the vast amount of measurements required. Furthermore, owing to the randomness of the fibers and the complexity of the FRC structural system, research on incipient damage detection of FRC specimens is seldom seen in public literature. These issues were the main incentive to carry out this innovative experimental research.
The present study deals with developing an SHM procedure based on an EMA-based system that uses PZT transducers and small-sized custom-made devices for diagnosing and estimating premature damages in FRC cubes under repeated compressive load. The influence of the added synthetic fibers on the compressive strength and the SHM procedure is examined. Furthermore, the effectiveness of the proposed monitoring system for prompt damage identification is investigated. Quantitative assessment of damage is also addressed using the distribution of statistical index values at each side of the cubes.
The novelty introduced in this work over the available studies of the literature is focused on the application of the proposed SHM technique to detect load-induced damages in FRC specimens with synthetic fibers subjected to repeated compression with increasing loading steps and corresponding damage levels. Test results of this study also provide a valuable reference for future applications and design of FRC, with an emphasis on the quantification of the influence of the added synthetic fibers on the post-peak compressive behavior and damage assessment.
Furthermore, the applied step-by-step loading–unloading–reloading procedure includes compressive stresses within the elastic range, near the ultimate strength and in the post-peak response, in order to investigate for the first time the sensitivity of the PZT-enabled EMA-based technique to diagnose damage at various levels when a specimen is unloaded to minimize the developed stress effect.
Furthermore, a new and meticulous health-monitoring procedure is proposed that includes measuring and recording the frequency responses of the PZTs mounted to the FRC cube surface using dense mesh points of damage identification. This way, the location, distance, direction, and width of the cracks can be evaluated accurately and verified by the experimental observations.

2. Materials and Methods

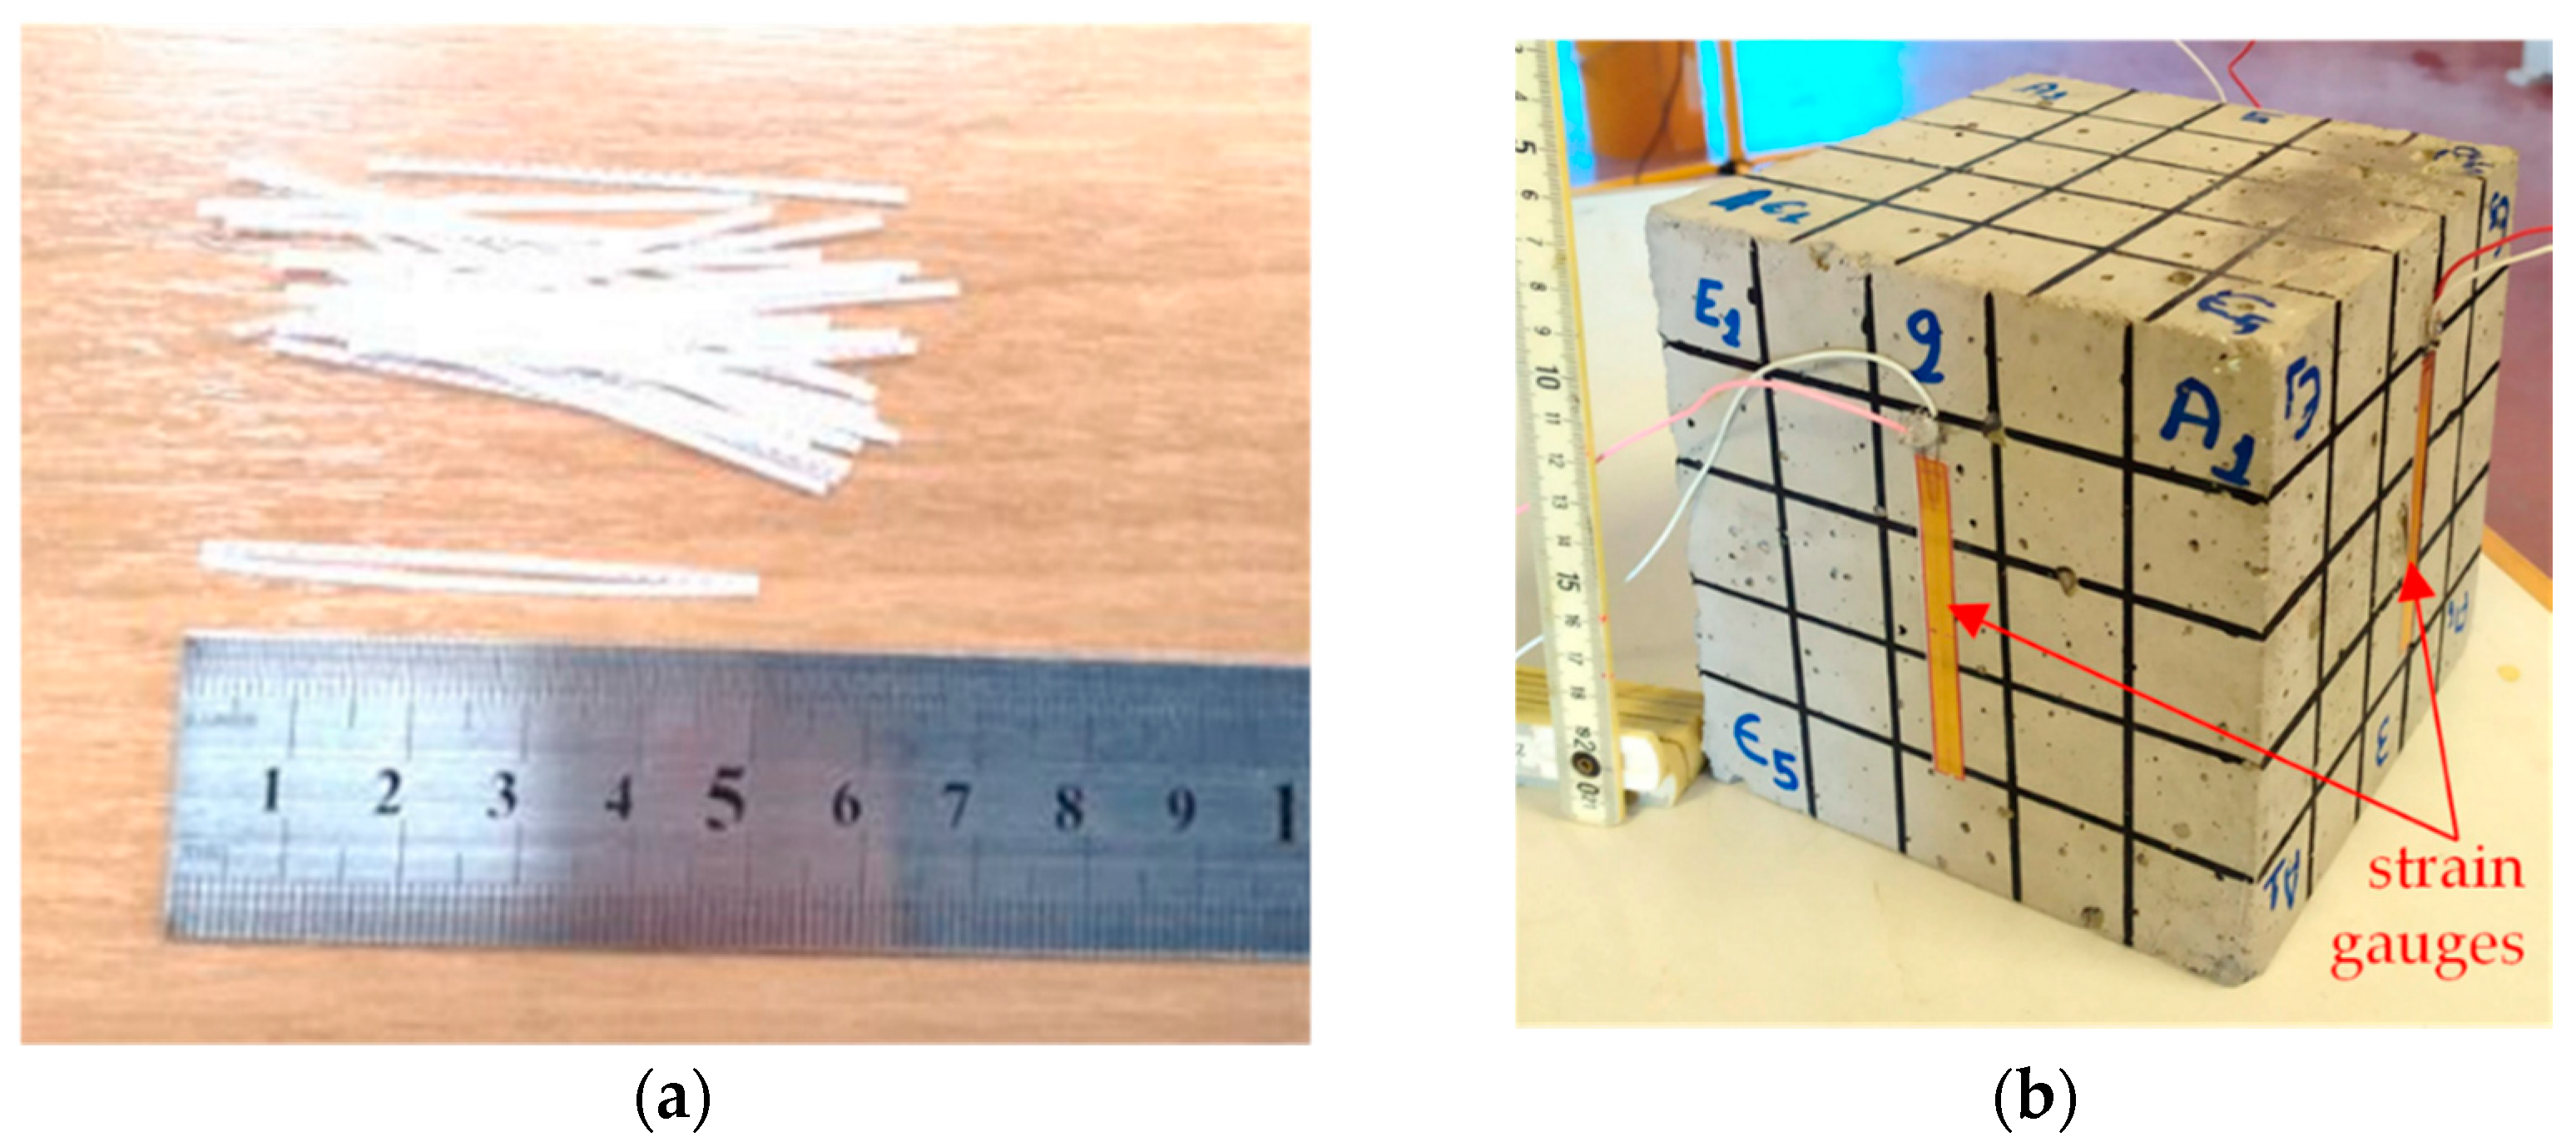
2.1. Materials and Specimens

The concrete used in this study was a ready-mix concrete of grade C30/37 according to the EN 206 standard [52] containing a commercially available ordinary Greek-type cement (Portland type with pozzolan CEM II A-P 42.5 N), high fineness modulus crushed sand (fine aggregate), crushed stone aggregates with 16 mm maximum size (coarse aggregate), and water, in a mass proportion of 1:3.3:2.8:0.56, respectively. Plain concrete (PC) and FRC specimens were casted for comparison.
The macro-synthetic fibers of the FRC mixtures were made of polyolefin. Their appearance has a novel formation with continuous wavy embossing to enhance bond characteristics with concrete due to surface anchorage. The length and the equivalent diameter of the fibers were 50 mm and 0.715 mm, respectively, with the aspect (length-to-diameter) ratio equal to 70, as shown in Figure 1a. The fibers were added directly to the fresh concrete batch in a proportion of 5 kg per 1 m3 concrete. The Young’s modulus under tension and the tensile strength of the fibers were 6 GPa and 430 MPa, respectively, according to manufacturer’s specifications. The generic trademark of the synthetic fibers is SikaFiber Force 50.
The mix procedure and preparation of the FRC mixtures was carried out using a pan-type forced mixer. The fresh ready-mix concrete was first poured into a pan-type mixer and special attention was given during the addition of the fibers to the pan in order to achieve uniformity of fiber distribution and flowability of the fresh FRC mixture. The macro-synthetic fibers were added steadily by hand in small amounts during stirring to prevent clump formation. Stirring of the mixture continued gradually to achieve uniform consistency of the materials, better workability, and homogeneous distribution of the fibers, avoiding their segregation in the coagulated FRC. Concerning the casting procedure, the prepared FRC mixture was poured into the cubic specimens and adequately compacted to air entrapped using a portable mechanical needle vibrator with a flexible shaft and 28 mm head diameter. Special attention was given during pouring and continuous high-frequency vibration to achieve uniform distribution of the added synthetic fibers in fresh concrete mass to fill air voids in the cubic formworks and to improve the compactness of the FRC. The rather low amount of the added synthetic fibers and the consistency of the designed mix resulted in PC and FRC mixtures with adequate workability and compaction.
Standard 150 mm cubes were cast from the PC and FRC batch (six specimens per batch), as shown in Figure 1b. Curing of all specimens was carried out under water in a water tank at a temperature of 17 ± 3 °C and relative humidity of 65 ± 10% rH and in a vibration-free environment from the time of molding until the age of the axial compression tests conducted after 28 days.

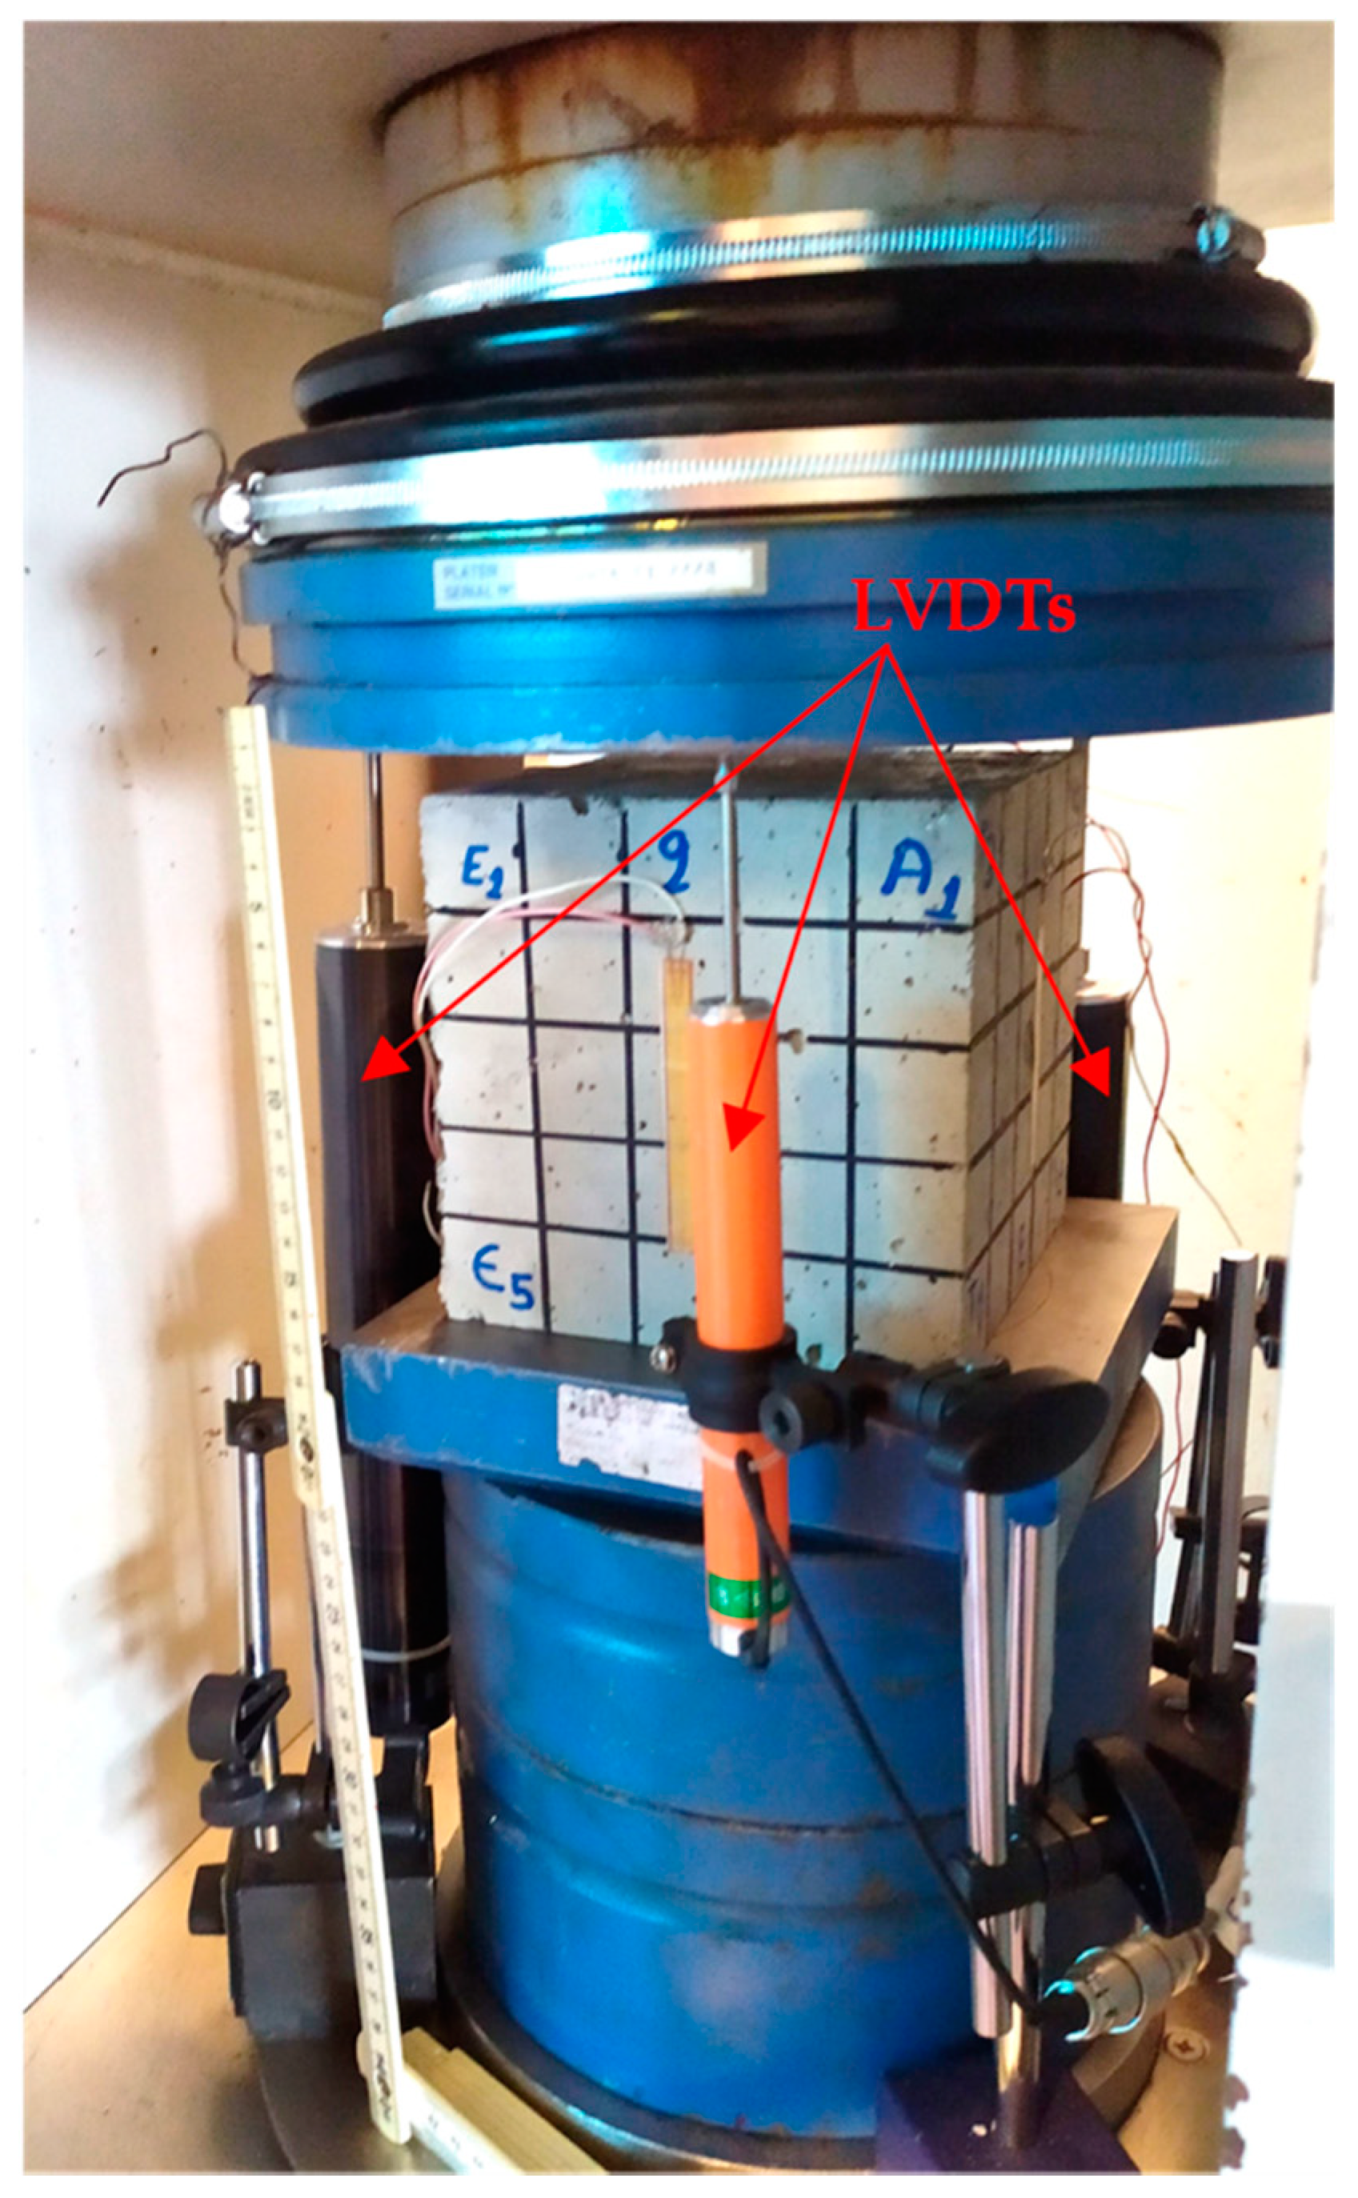
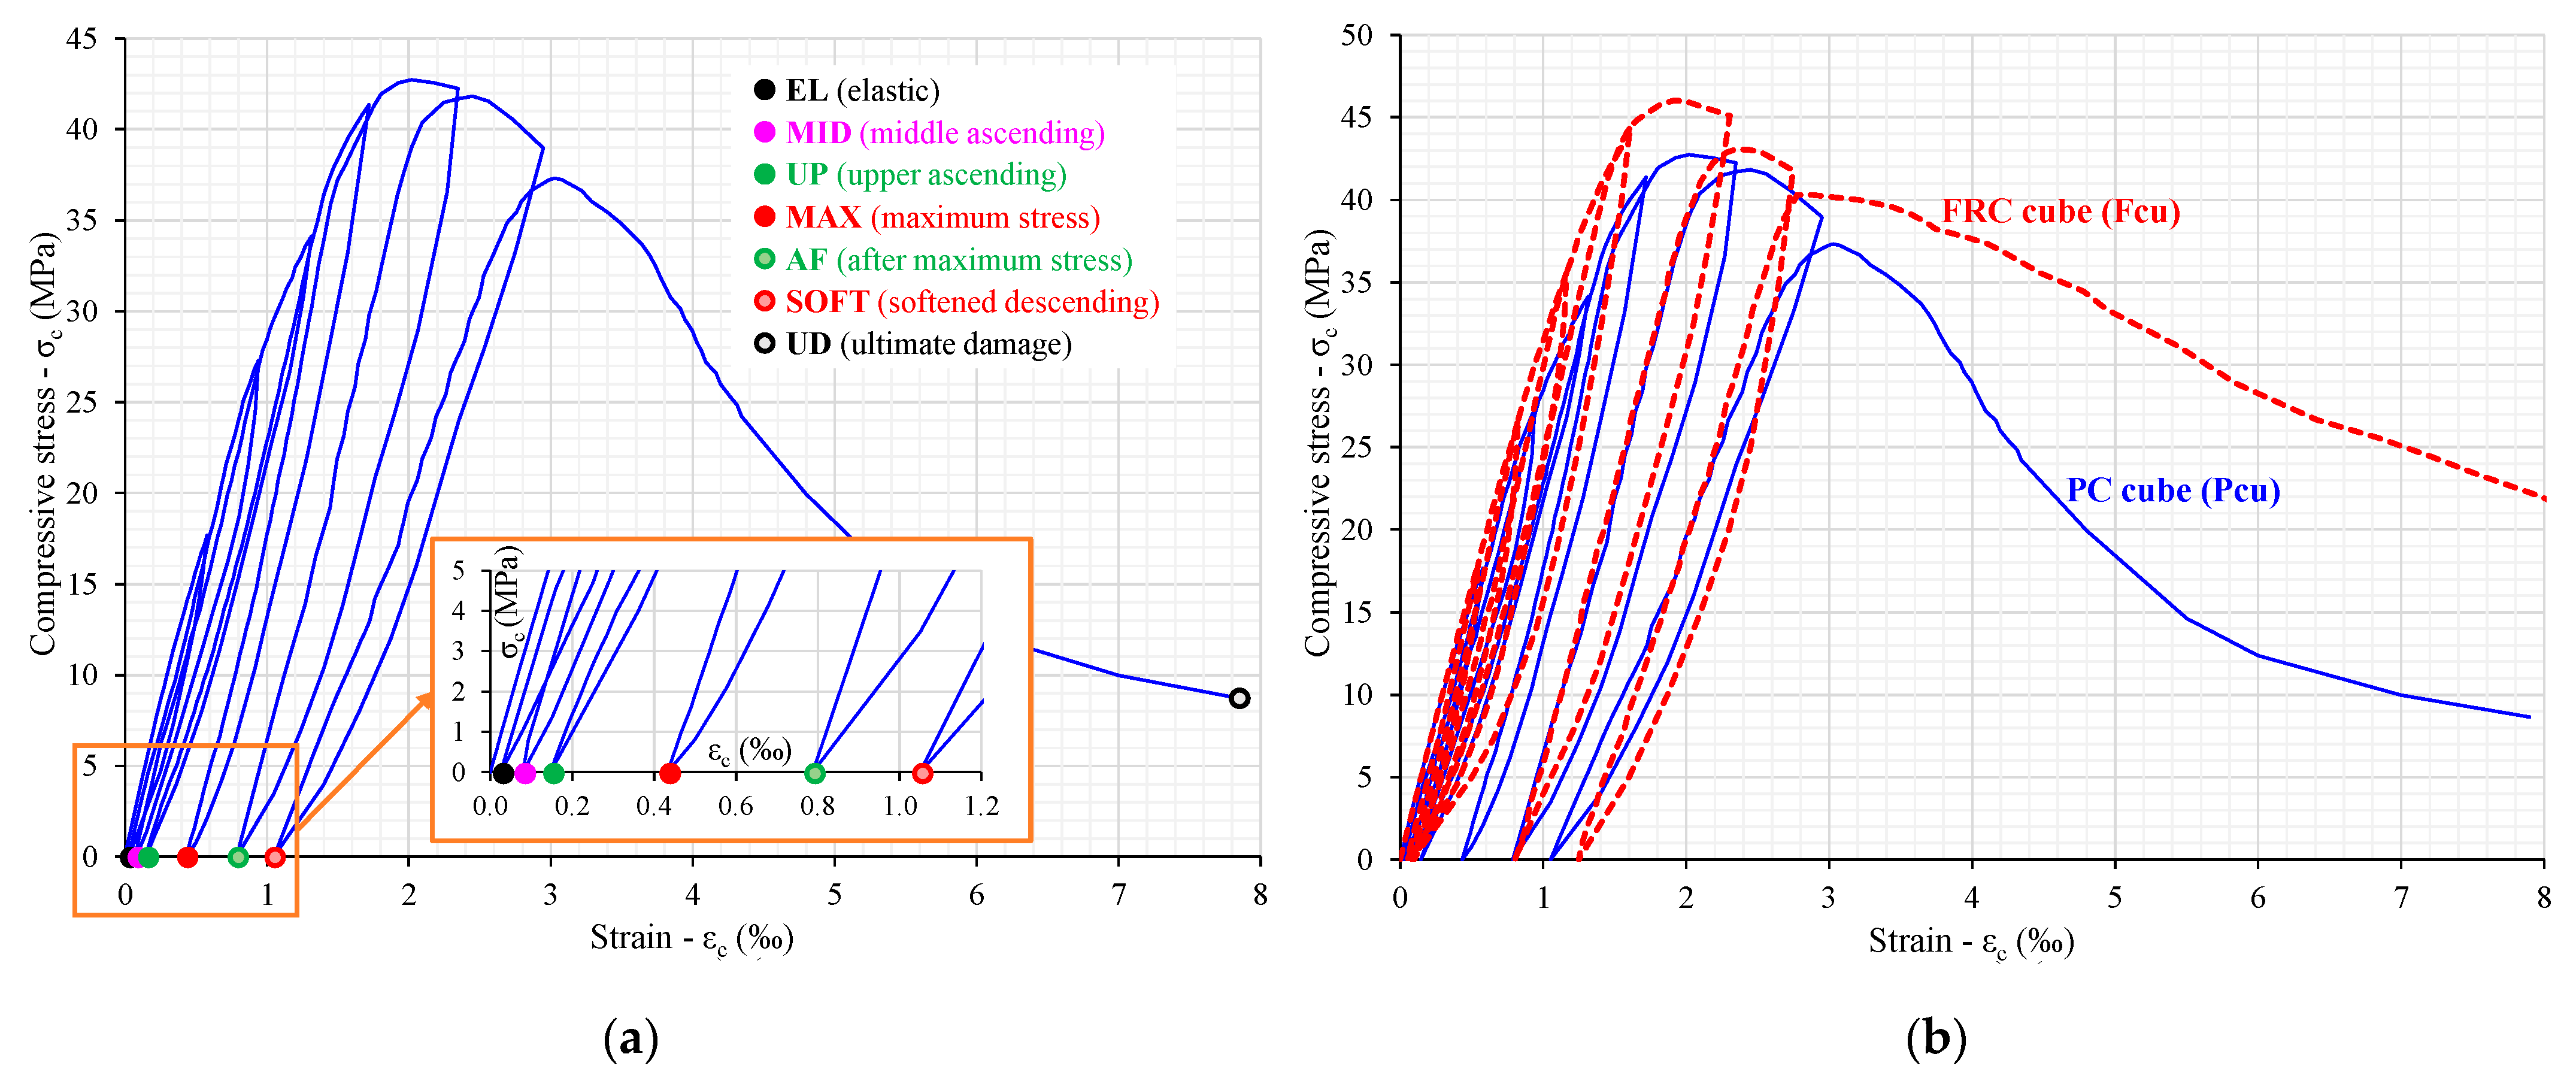
2.2. Compression Tests and Steps of the Repeated Loading

A universal testing machine with an ultimate capacity of 3000 kN and displacement control mode with a 2 mm/min constant rate of strain was used to experimentally obtain the entire compressive stress-versus-strain behavior of the cubes. Three linear variable differential transducers (LVDTs) with 0.01 mm accuracy were installed to measure the axial platen-to-platen deformations during the tests. Three strain gauges mounted to the midsection of each specimen’s surfaces were also used to measure the axial compressive strains of the cubes (Figure 1b). The initial elastic strains to the point of the ultimate compressive strength were recorded using the average measurements of the strain gauges. The post-peak strain-softening behavior was recorded using the average measurements of the LVDTs since the strain gauge readings were significantly disturbed due to the formation of cracks and during the post-cracking response. The upper and lower surface of each tested cube was lubricated before compression test to reduce frictional resistance between the upper and lower load-bearing plate of the universal testing machine and the concrete and, consequently, to limit, up to a point, the impact of the hoop effect. The test rig and instrumentation are shown in Figure 2.
The cubes were subjected to a repeated compressive loading (loading, unloading, reloading, unloading, etc.) using seven (7) different load levels based on the estimated maximum compressive stress (σmax) of the cube. The examined load levels are denoted as follows:
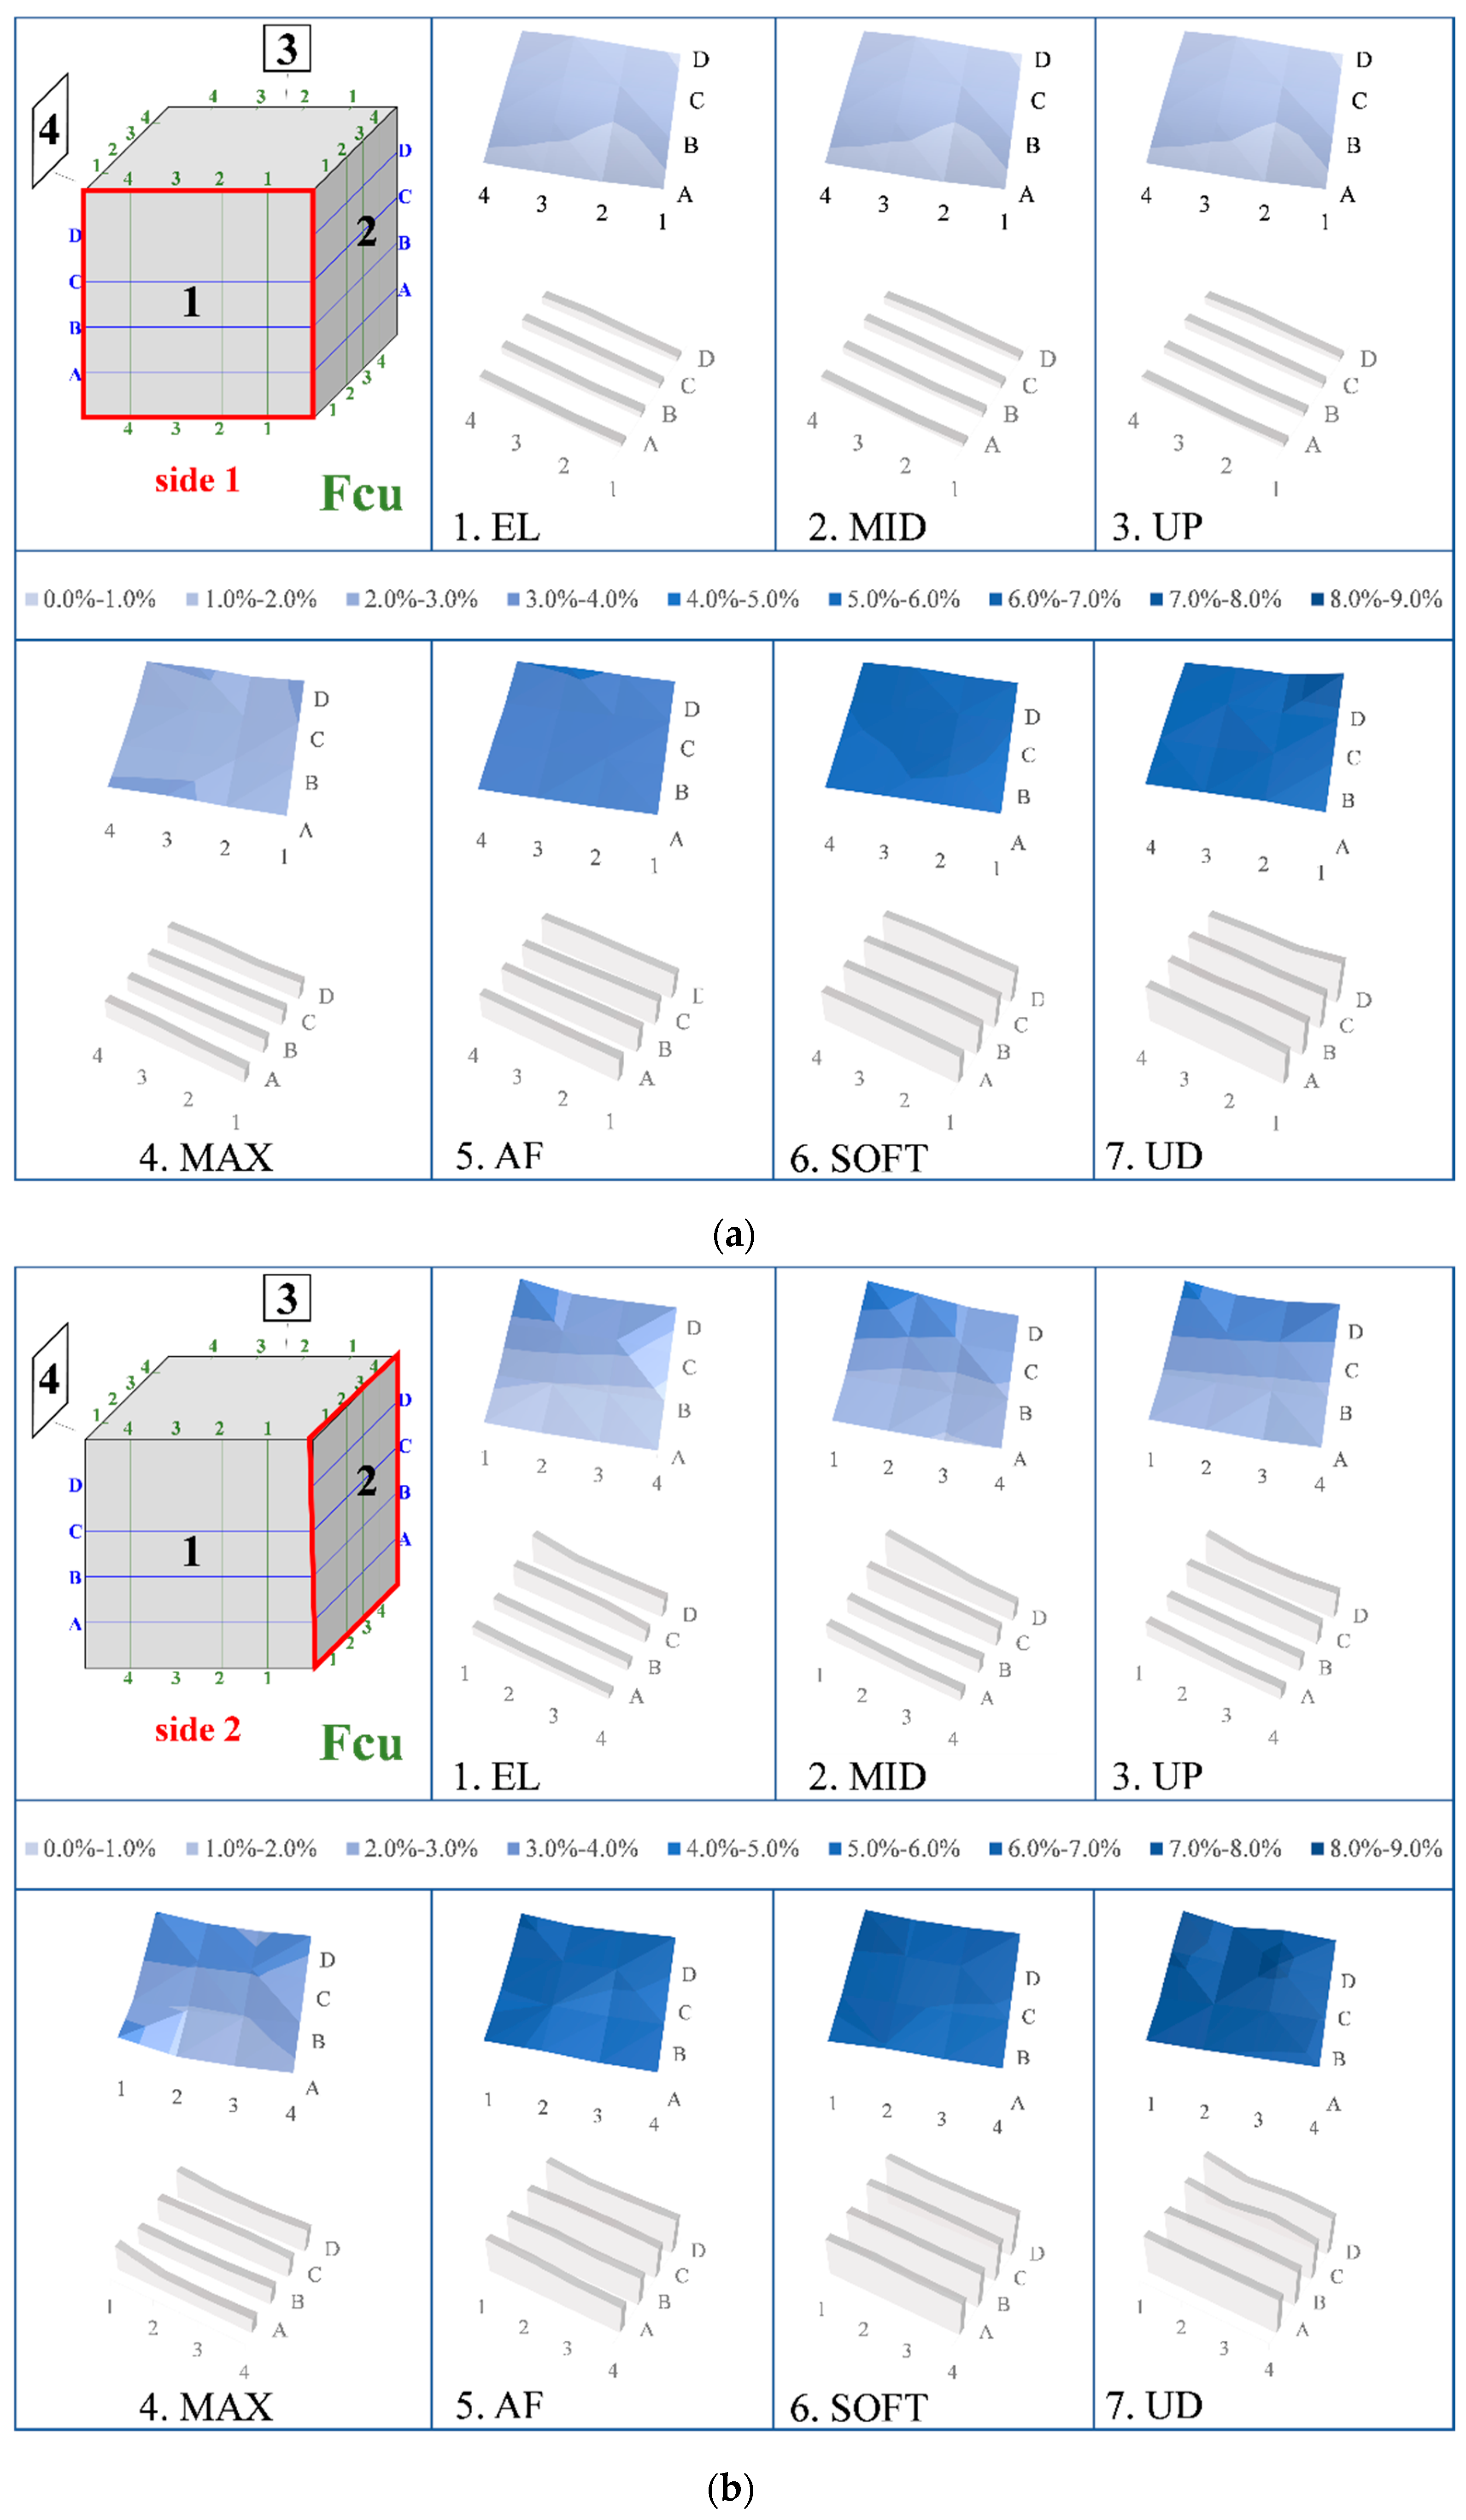
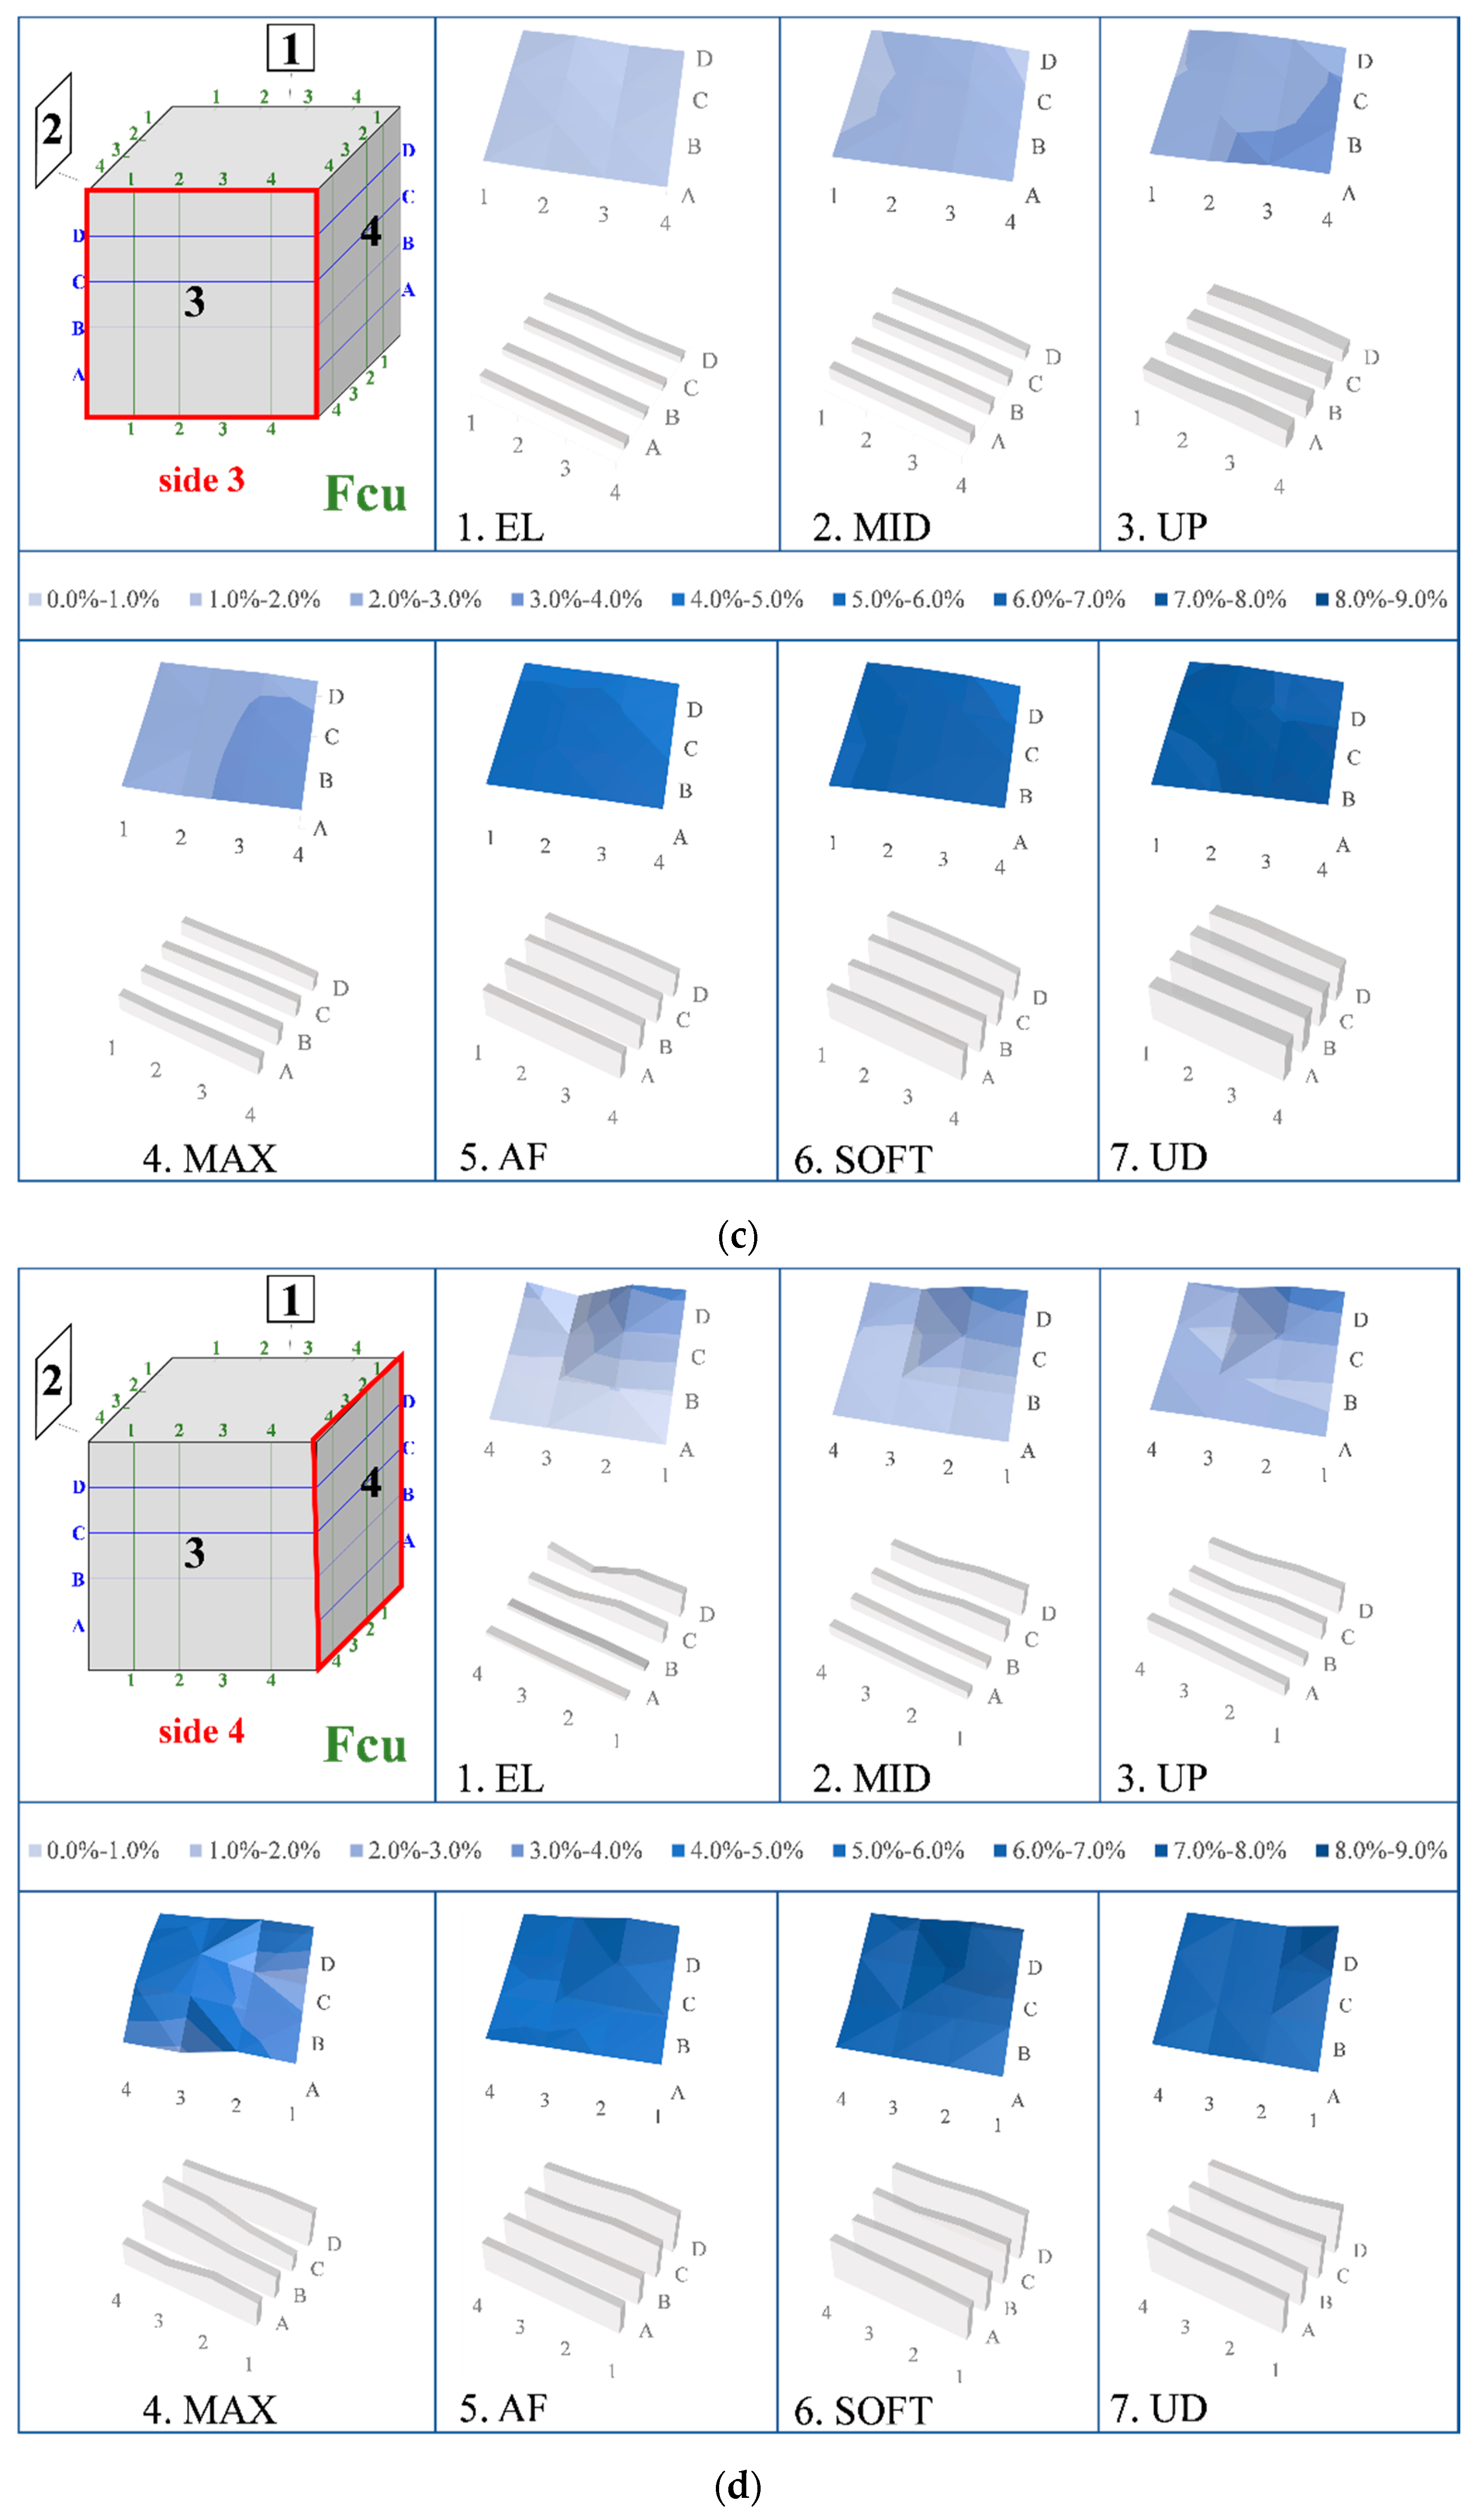
  • The “EL” level equals 40% of the σmax, and up to this point the material has elastic properties;
  • The “MID” level is a middle loading level of the ascending stress–strain part approximately equal to 60% of the σmax;
  • The “UP” level is at the upper ascending stress–strain part approximately equal to the 85% of the σmax;
  • The “MAX” level represents the maximum compressive strength σmax;
  • The “AF” level is at the beginning of the descending stress–strain part and right after σmax;
  • The “SOFT” level is located at the softened descending stress–strain part;
  • “UD” represents the ultimate damage state point.

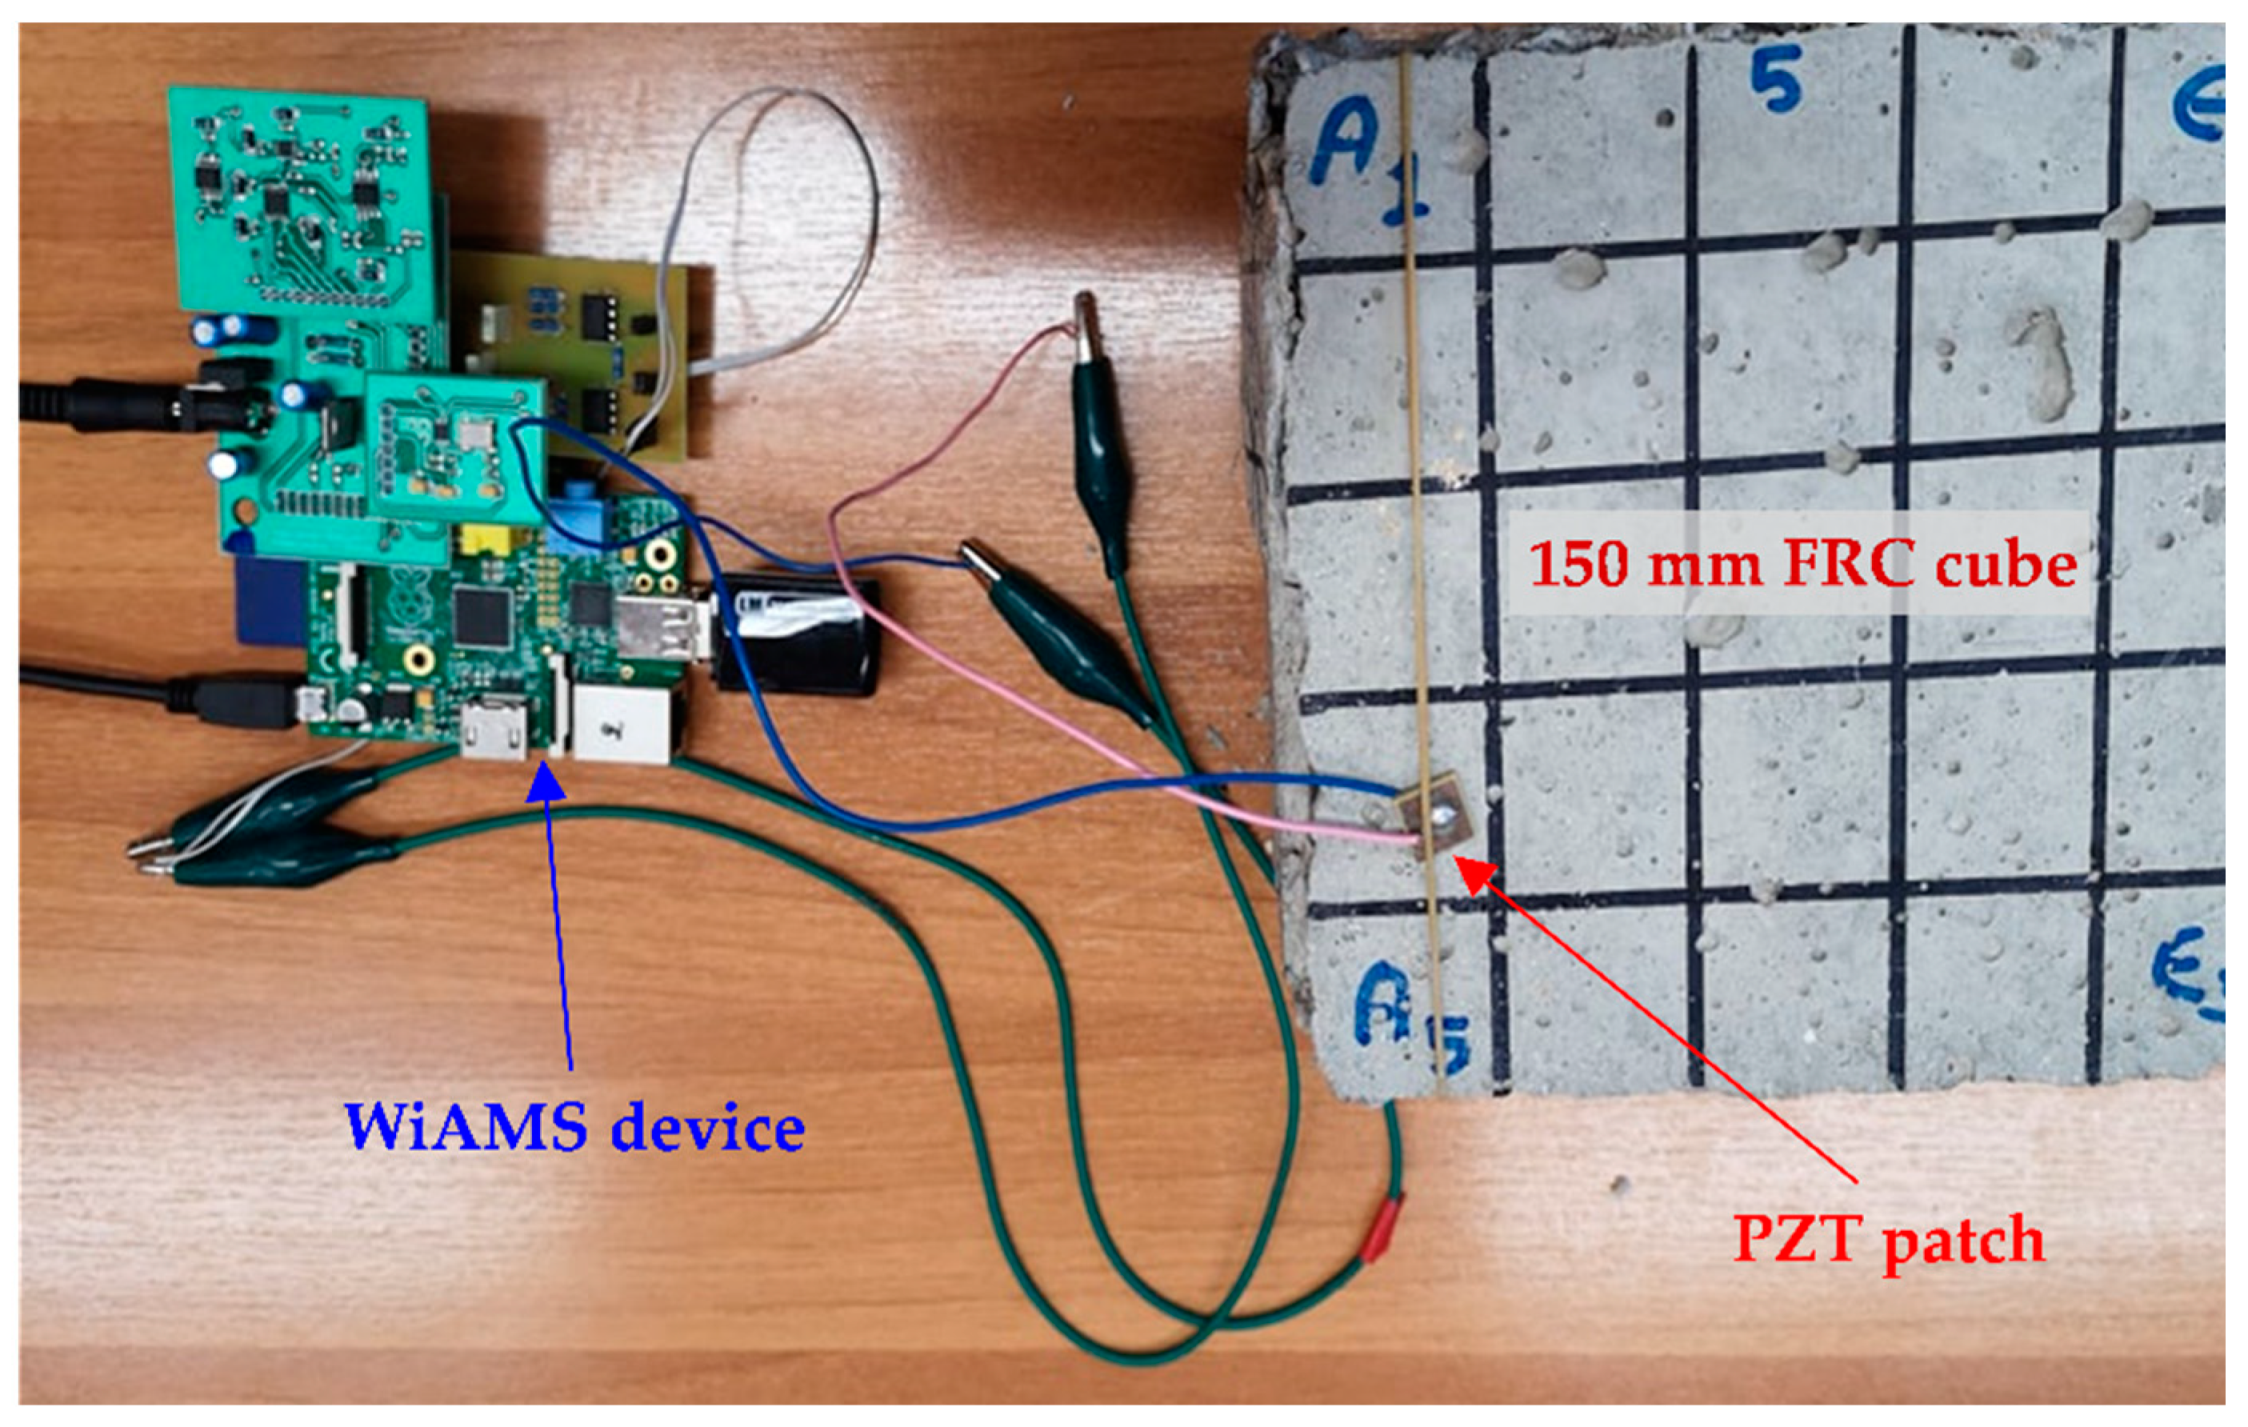
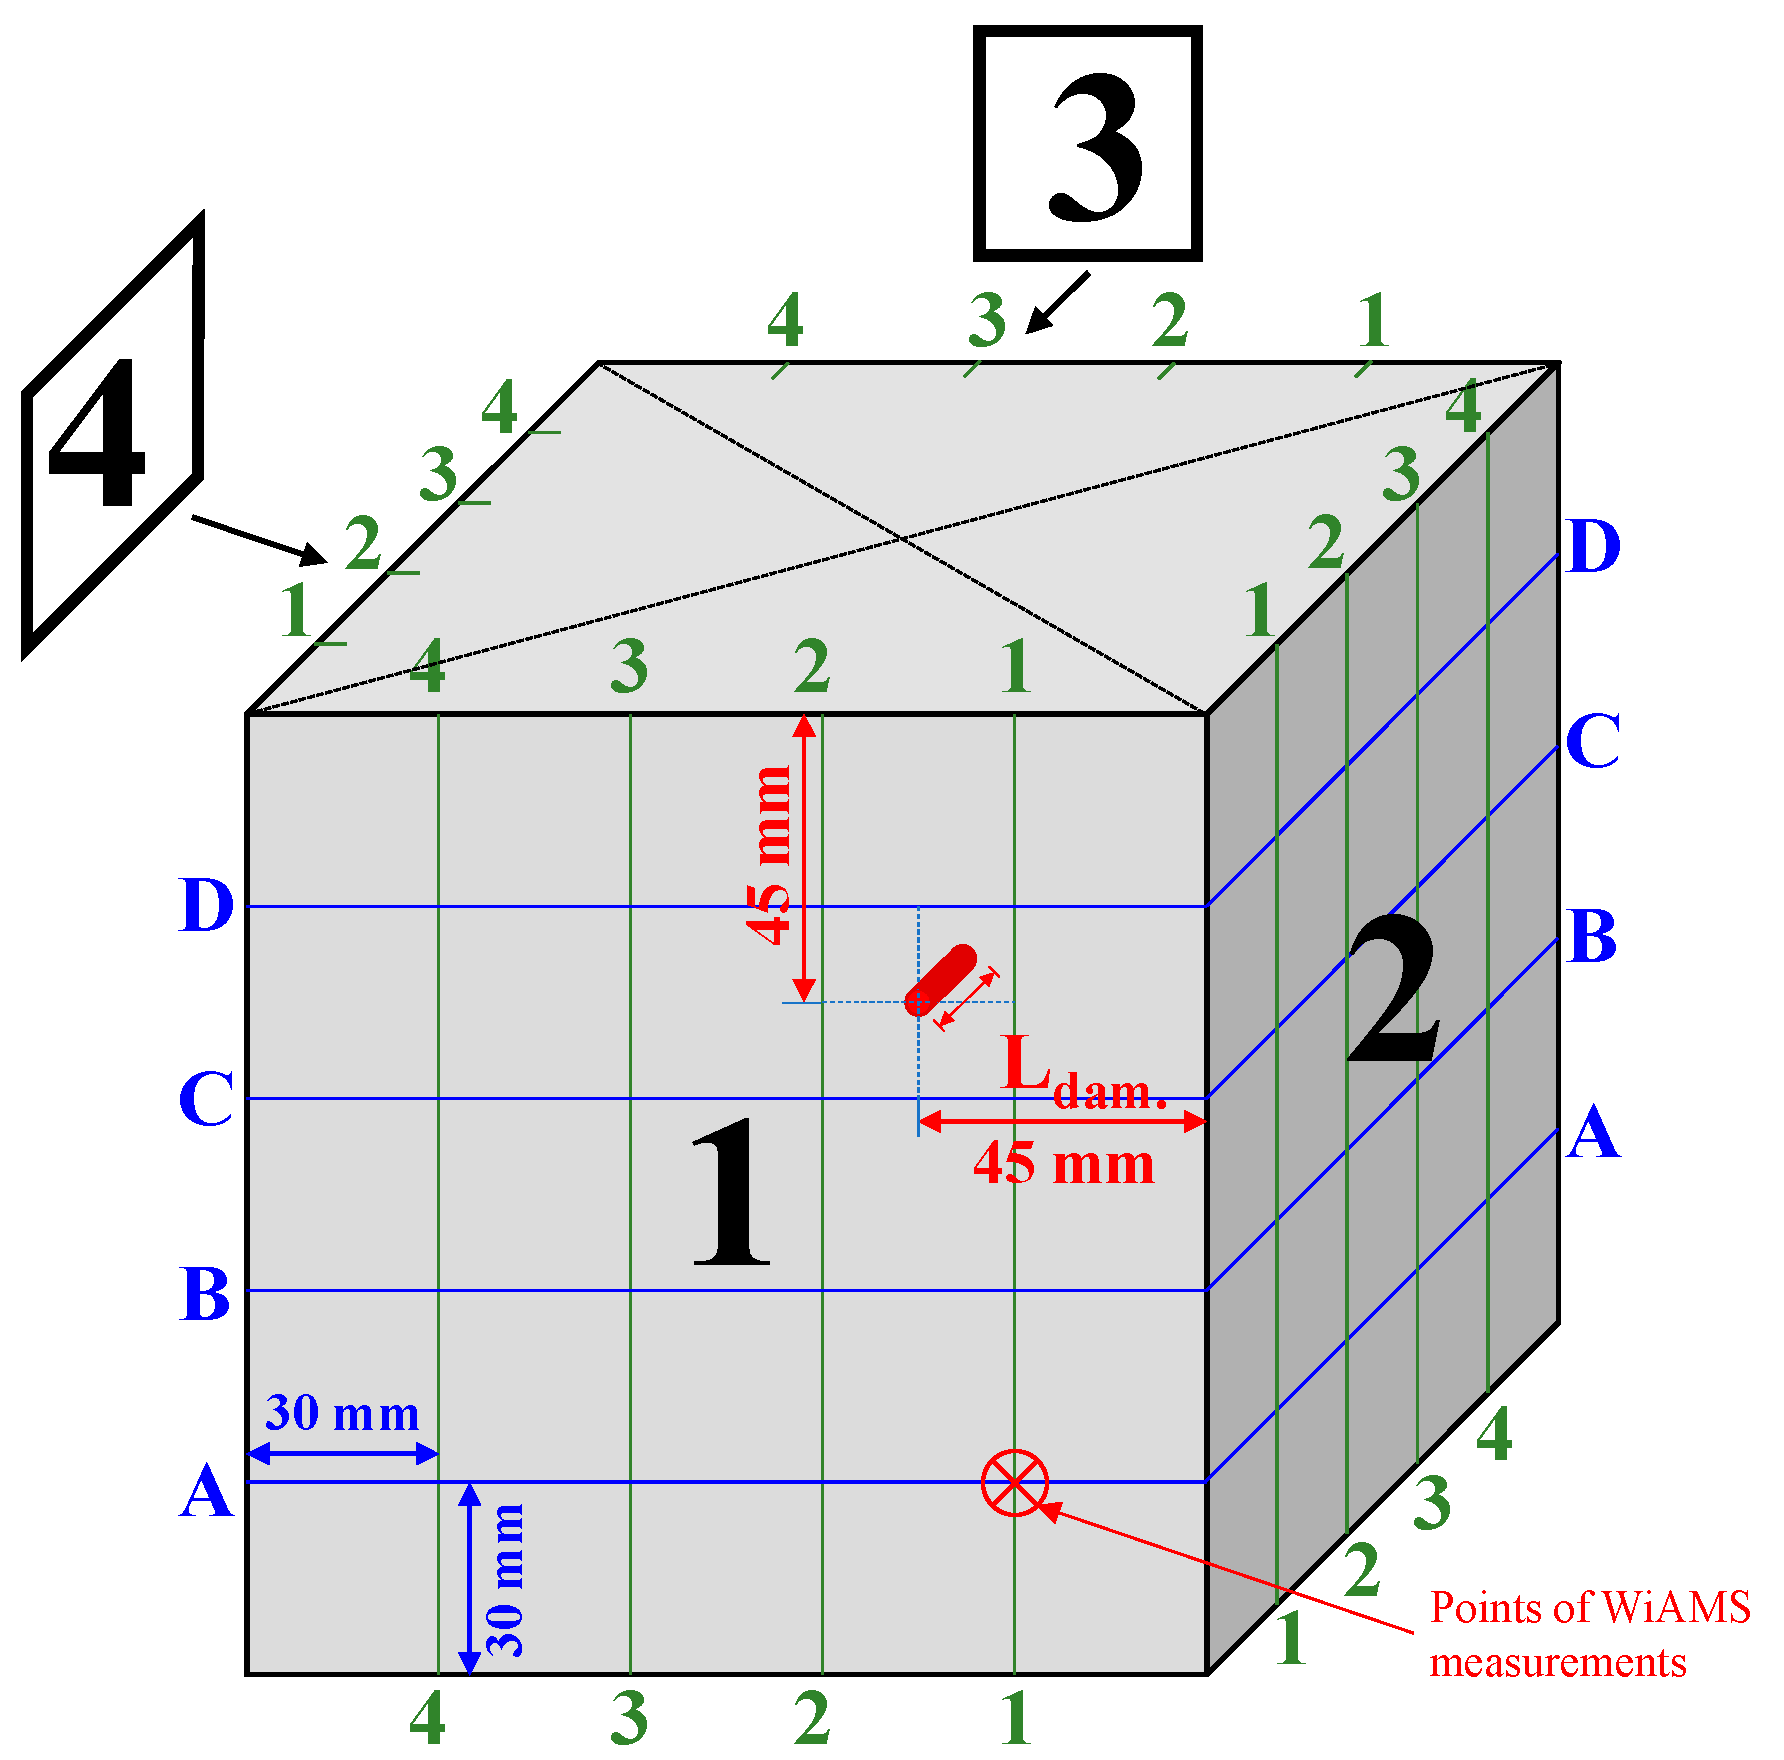
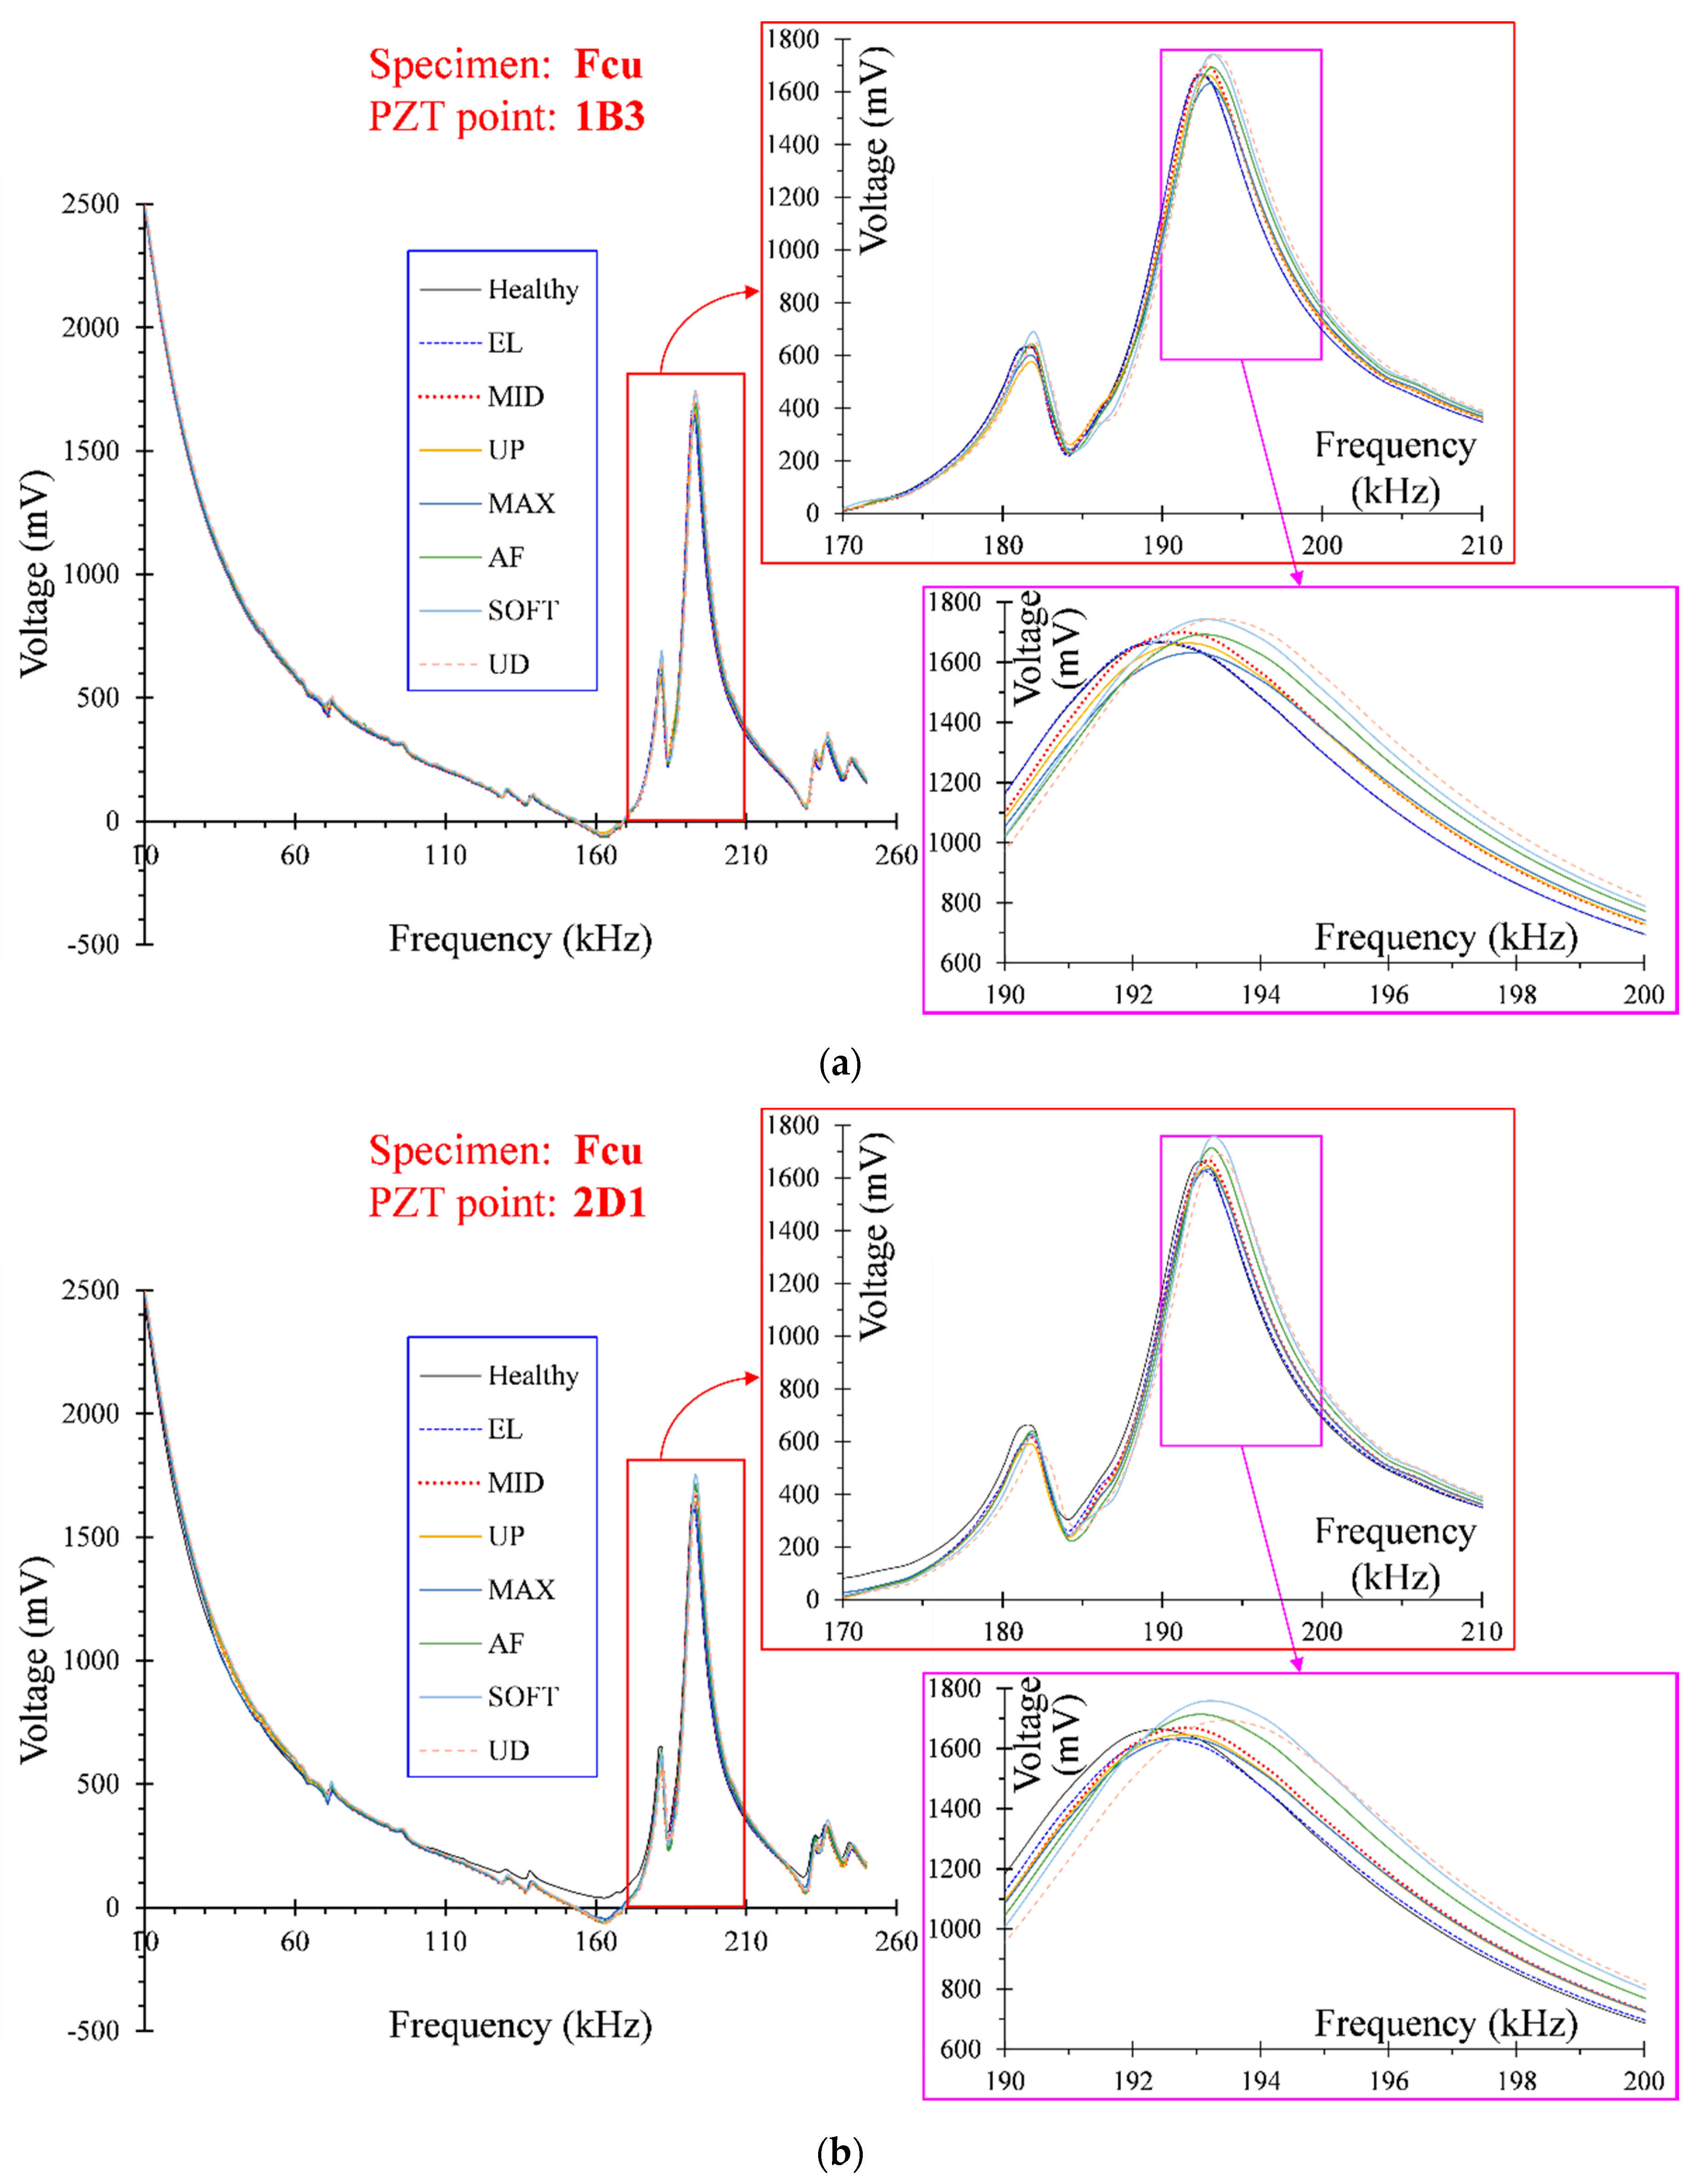
2.3. Damage Identification System and Measurements

A real-time EMA and its inverse electro-mechanical impedance (EMI) method sensing SHM system using small PZT patches was used in this study to detect and evaluate damage severity. This monitoring/damage-detection system first vibrates the PZT transducer, which acts as actuator, by an amplified harmonic excitation voltage. Simultaneously, this SHM system monitors the signal of the PZT, which now acts as sensor, receiving its reflected waves in terms of an electrical impedance frequency response. Next, it processes the measured impedance signals in terms of voltage frequency response and, finally, it transmits the final output response to the remote user in real time and wirelessly via internet connection. The full operation of this integrated SHM system can be controlled remotely from an off-site location by a terminal emulator.
The main principle of the EMA technique addresses the dynamic interaction between a PZT transducer that is properly mounted/surface-bonded to the host structural member, which is assumed to be a skeletal structure. The host structure is represented by its driving-point mechanical impedance, which is connected to the PZT patch represented by its electrical impedance. When the PZT patch is excited by an alternating voltage signal, it deforms, causing the structure to vibrate together and generate local responses. Such responses contain structural properties of the vibration and are transferred back to the PZT patch, which this time produces an electrical response. It is noted that the structural impedance related to its inherent property uniquely determines the output admittance or voltage frequency response when the PZT parameters remain constant. This way, by comparing the output signal of the SHM system at a pristine (initial healthy, undamaged state) and any imminent damaged state of the host structure, any damages or anomalies occurring in the system can be identified. In concrete structural members, cracking of the material induces a change in the mechanical impedance, causing a corresponding change in the voltage signal of the PZT. Additionally, damage parameters such as the location, the direction, and the width of the cracks can be determined via statistical methods.
The EMA-based SHM used in this study as a damage identification system is called the “Wireless impedance/Admittance Monitoring System (WiAMS).” It was developed recently [53] and tested by various experimental projects in large-scaled RC structural members by the authors [45,48,49,50]. The hardware of WiAMS, shown in Figure 3, consists of small-sized devices that are connected to the PZT transducer, which is bonded to the concrete surface by two soldered wires. The theoretical aspects and more details about WiAMS can be found in [45,48,53].
In this study, WiAMS was utilized for the first time for the diagnosis and quantitative assessment of damage at different loading/damage levels in FRC cubes subjected to repeated compressive loading. The addition of synthetic fibers in concrete results in a new composite material that exhibits different cracking performance and overall behavior than common concrete. Voltage measurements of the surface-bonded PZT transducers are carried out initially on the healthy FRC cube (undamaged state) to be used as reference signals. PZT signals are measured during the compressive test and after specific level of loading and unloading, as well as at the unloading step (cube is free of loading). Potential damage due to FRC cracking in the tested cubes causes a modification of the mechanical impedance properties of the fiber composite material, such as change in mass and stiffness, which also modifies the electrical impedance of the PZT, serving as a damage indicator.
In order to quantify damage assessment in FRC, the known statistical index of the root mean square deviation (RMSD) was employed. This damage index is regarded as one of the most useful and reliable indices in several fields of SHM [48,50,54]. The signal of the PZT at the healthy state of the FRC cube corresponded to the baseline measurement used in the adopted statistical analysis with RMSD. Thus, variations in growth trend for the PZT output frequency response signals due to FRC cracking at different damage states could be effectively evaluated by integrating the RMSD index.

3. Results and Observations

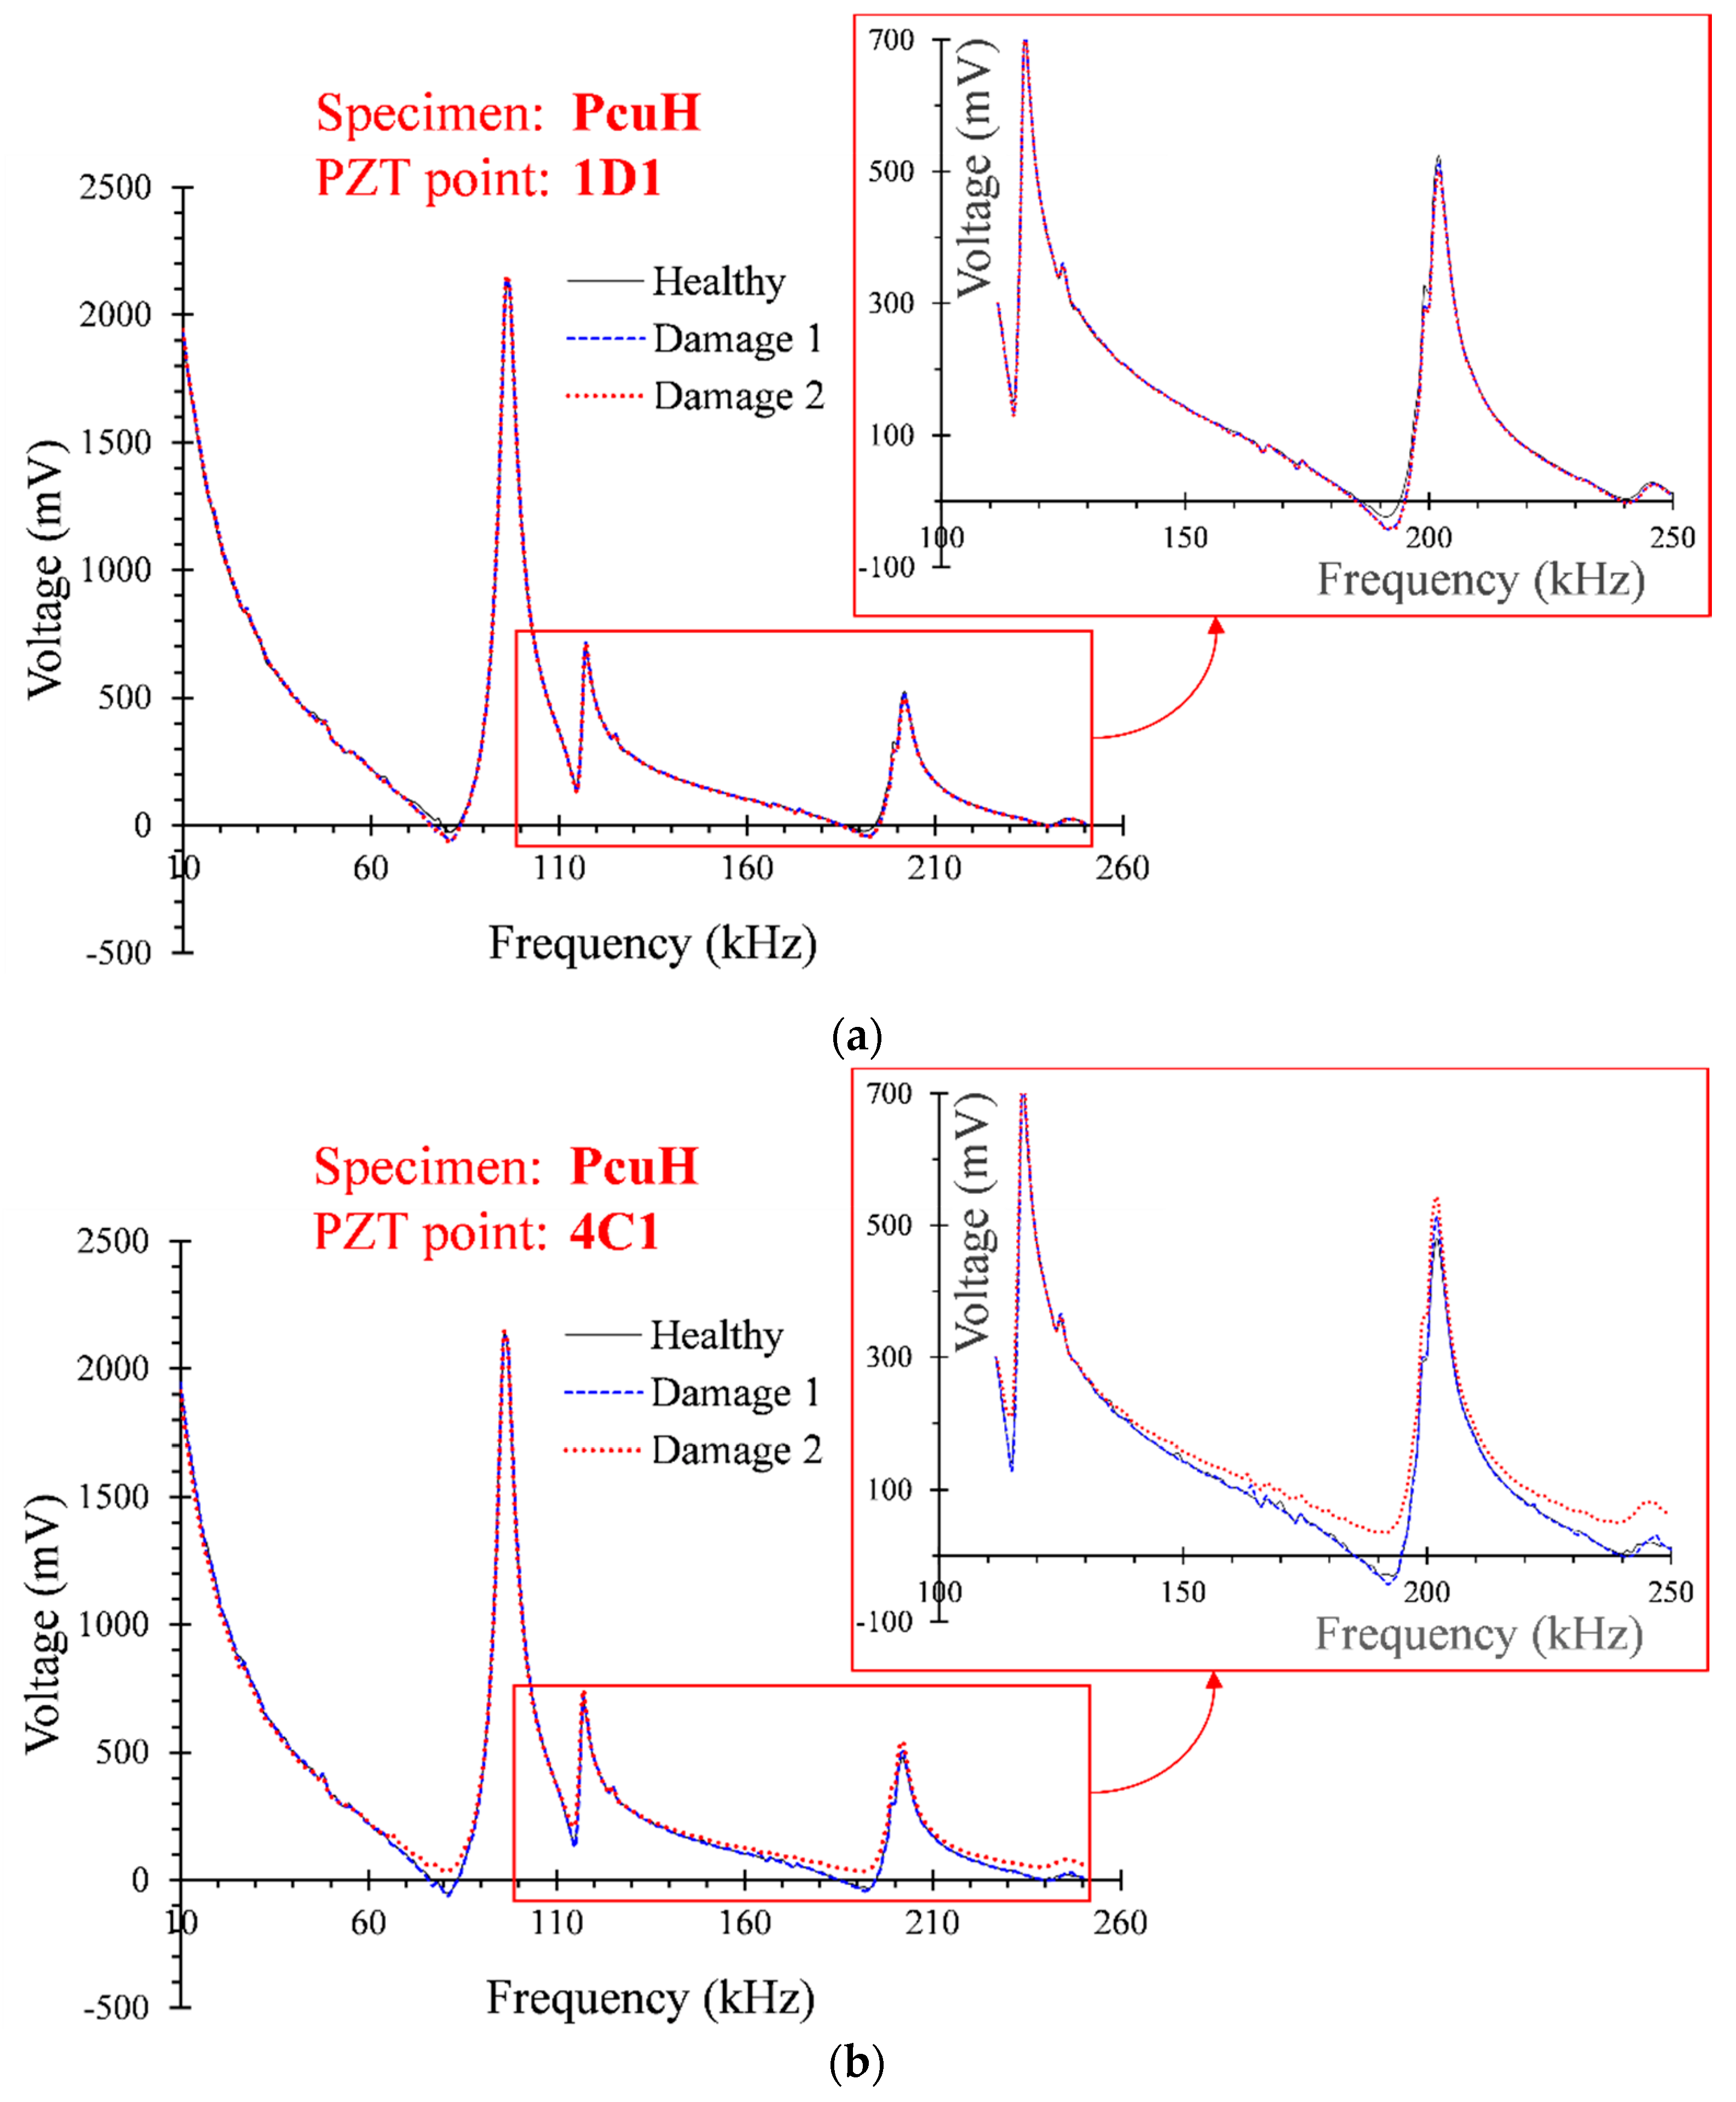
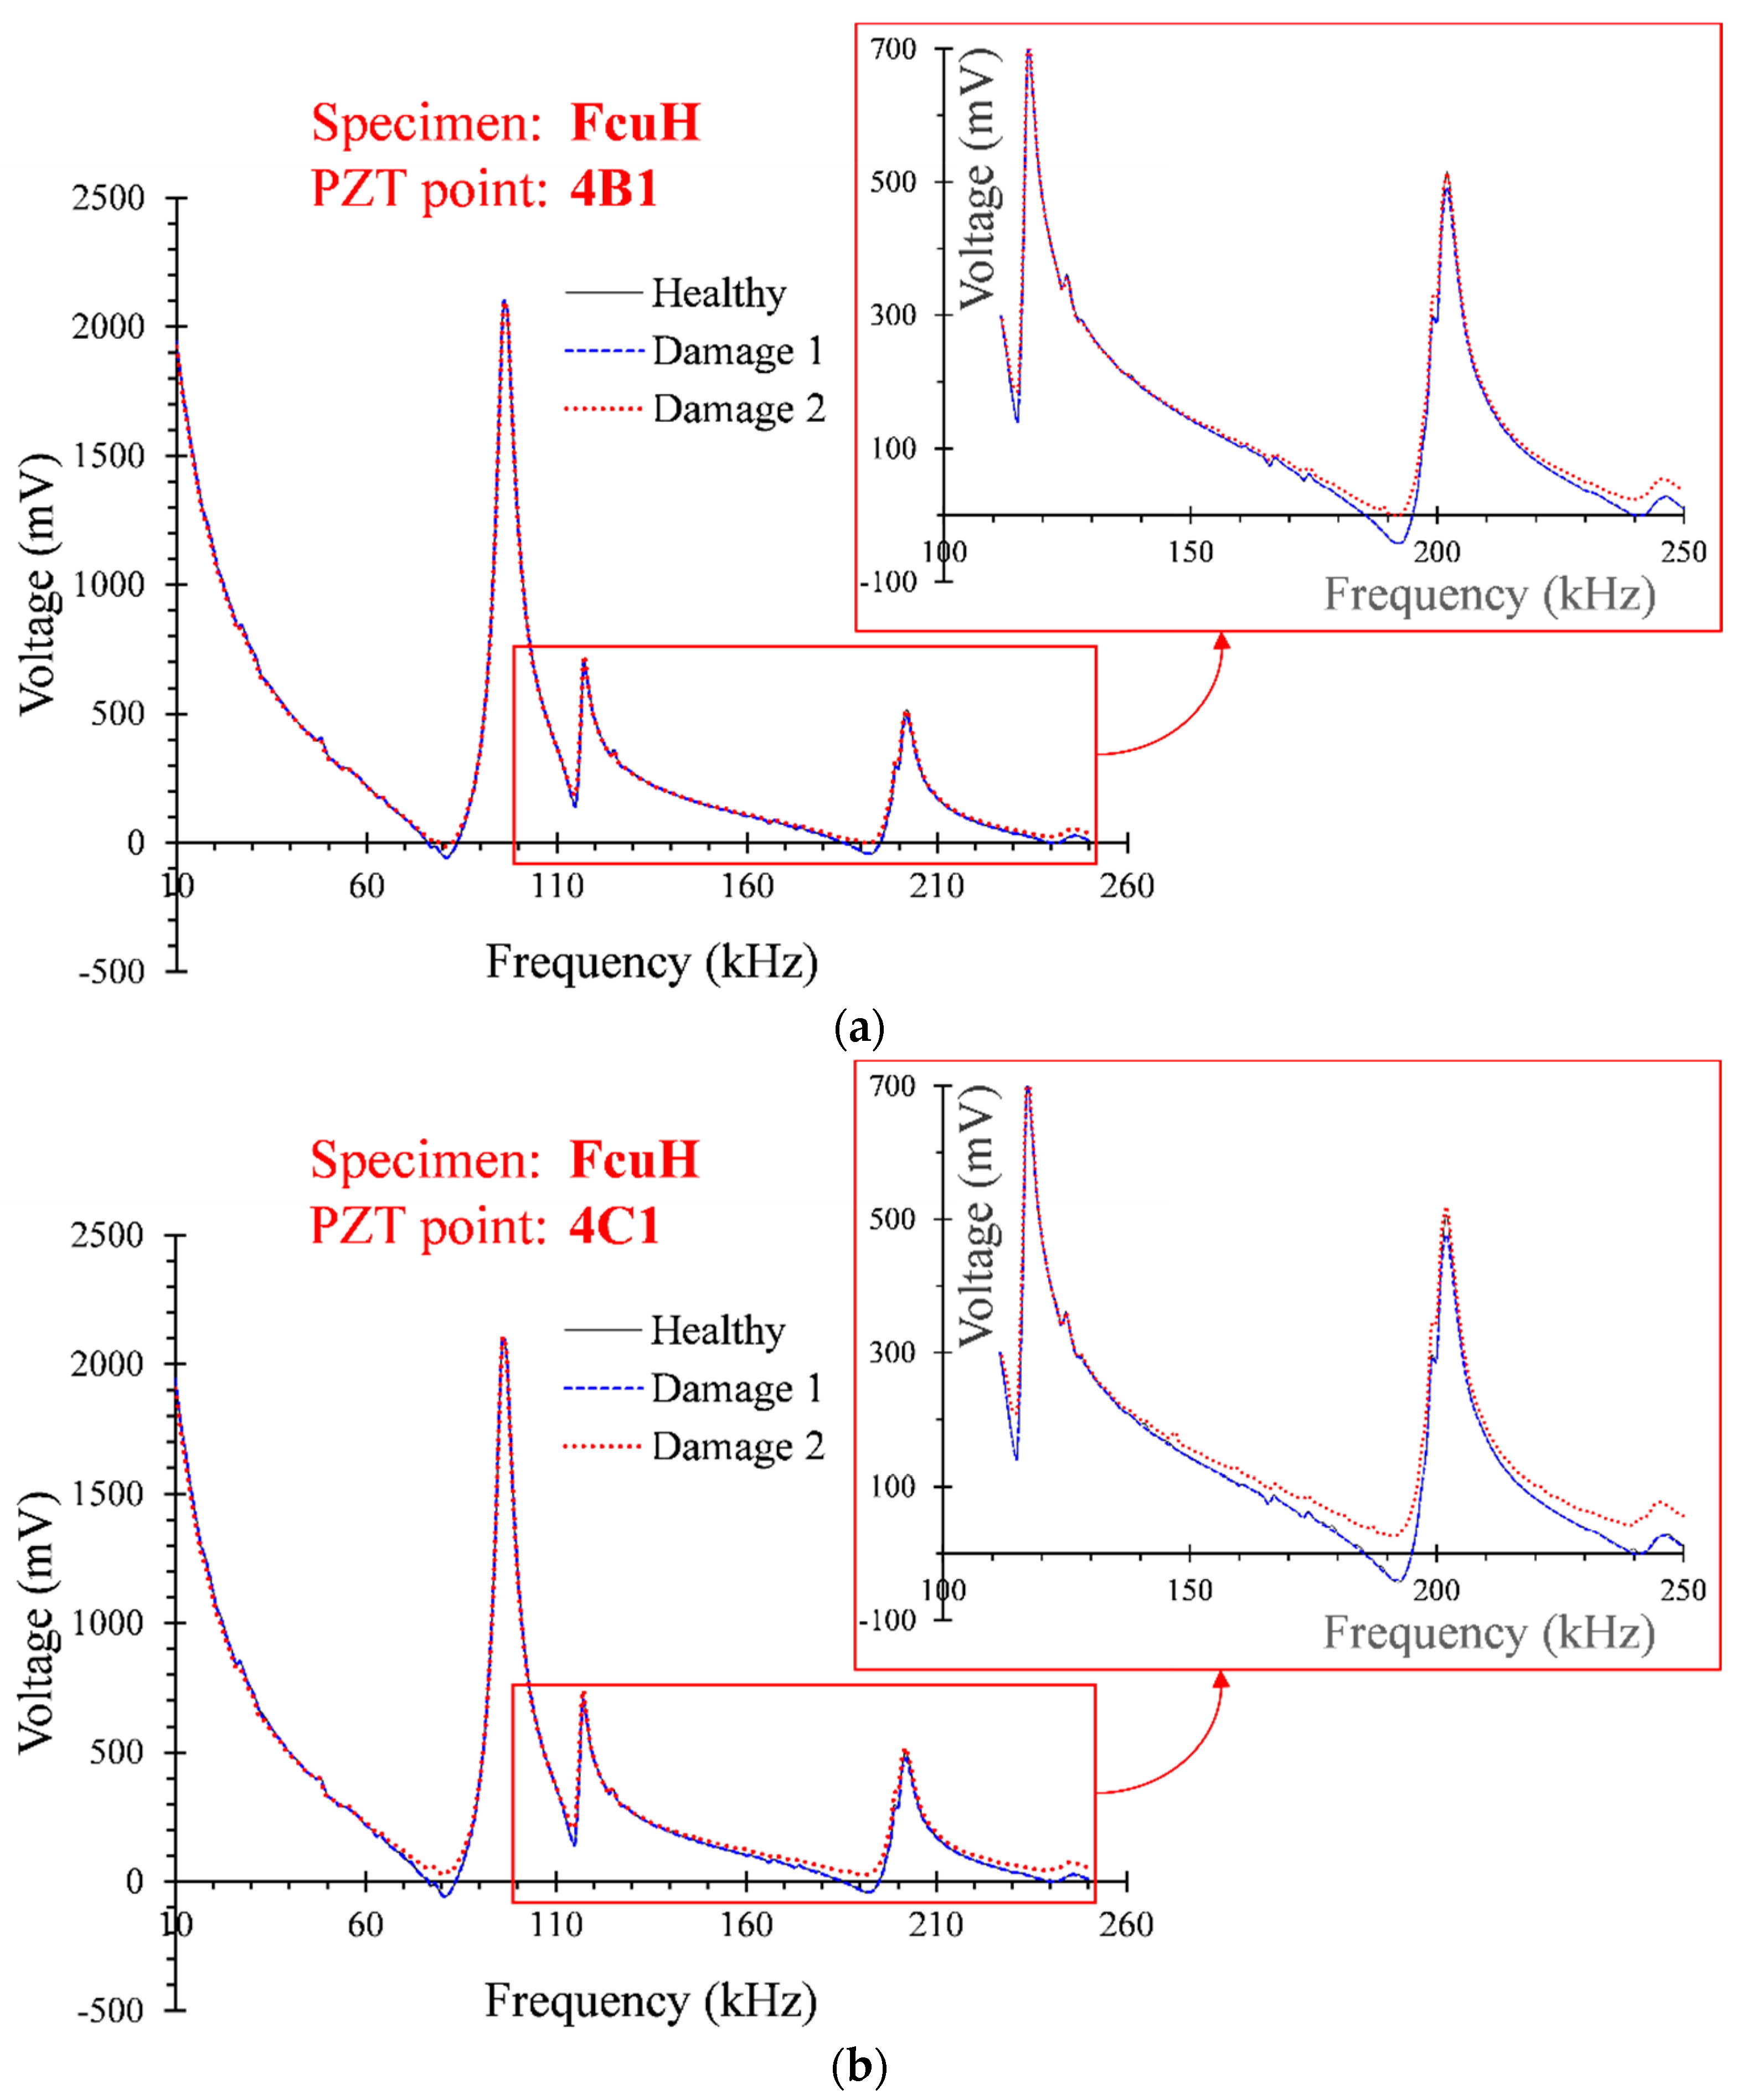
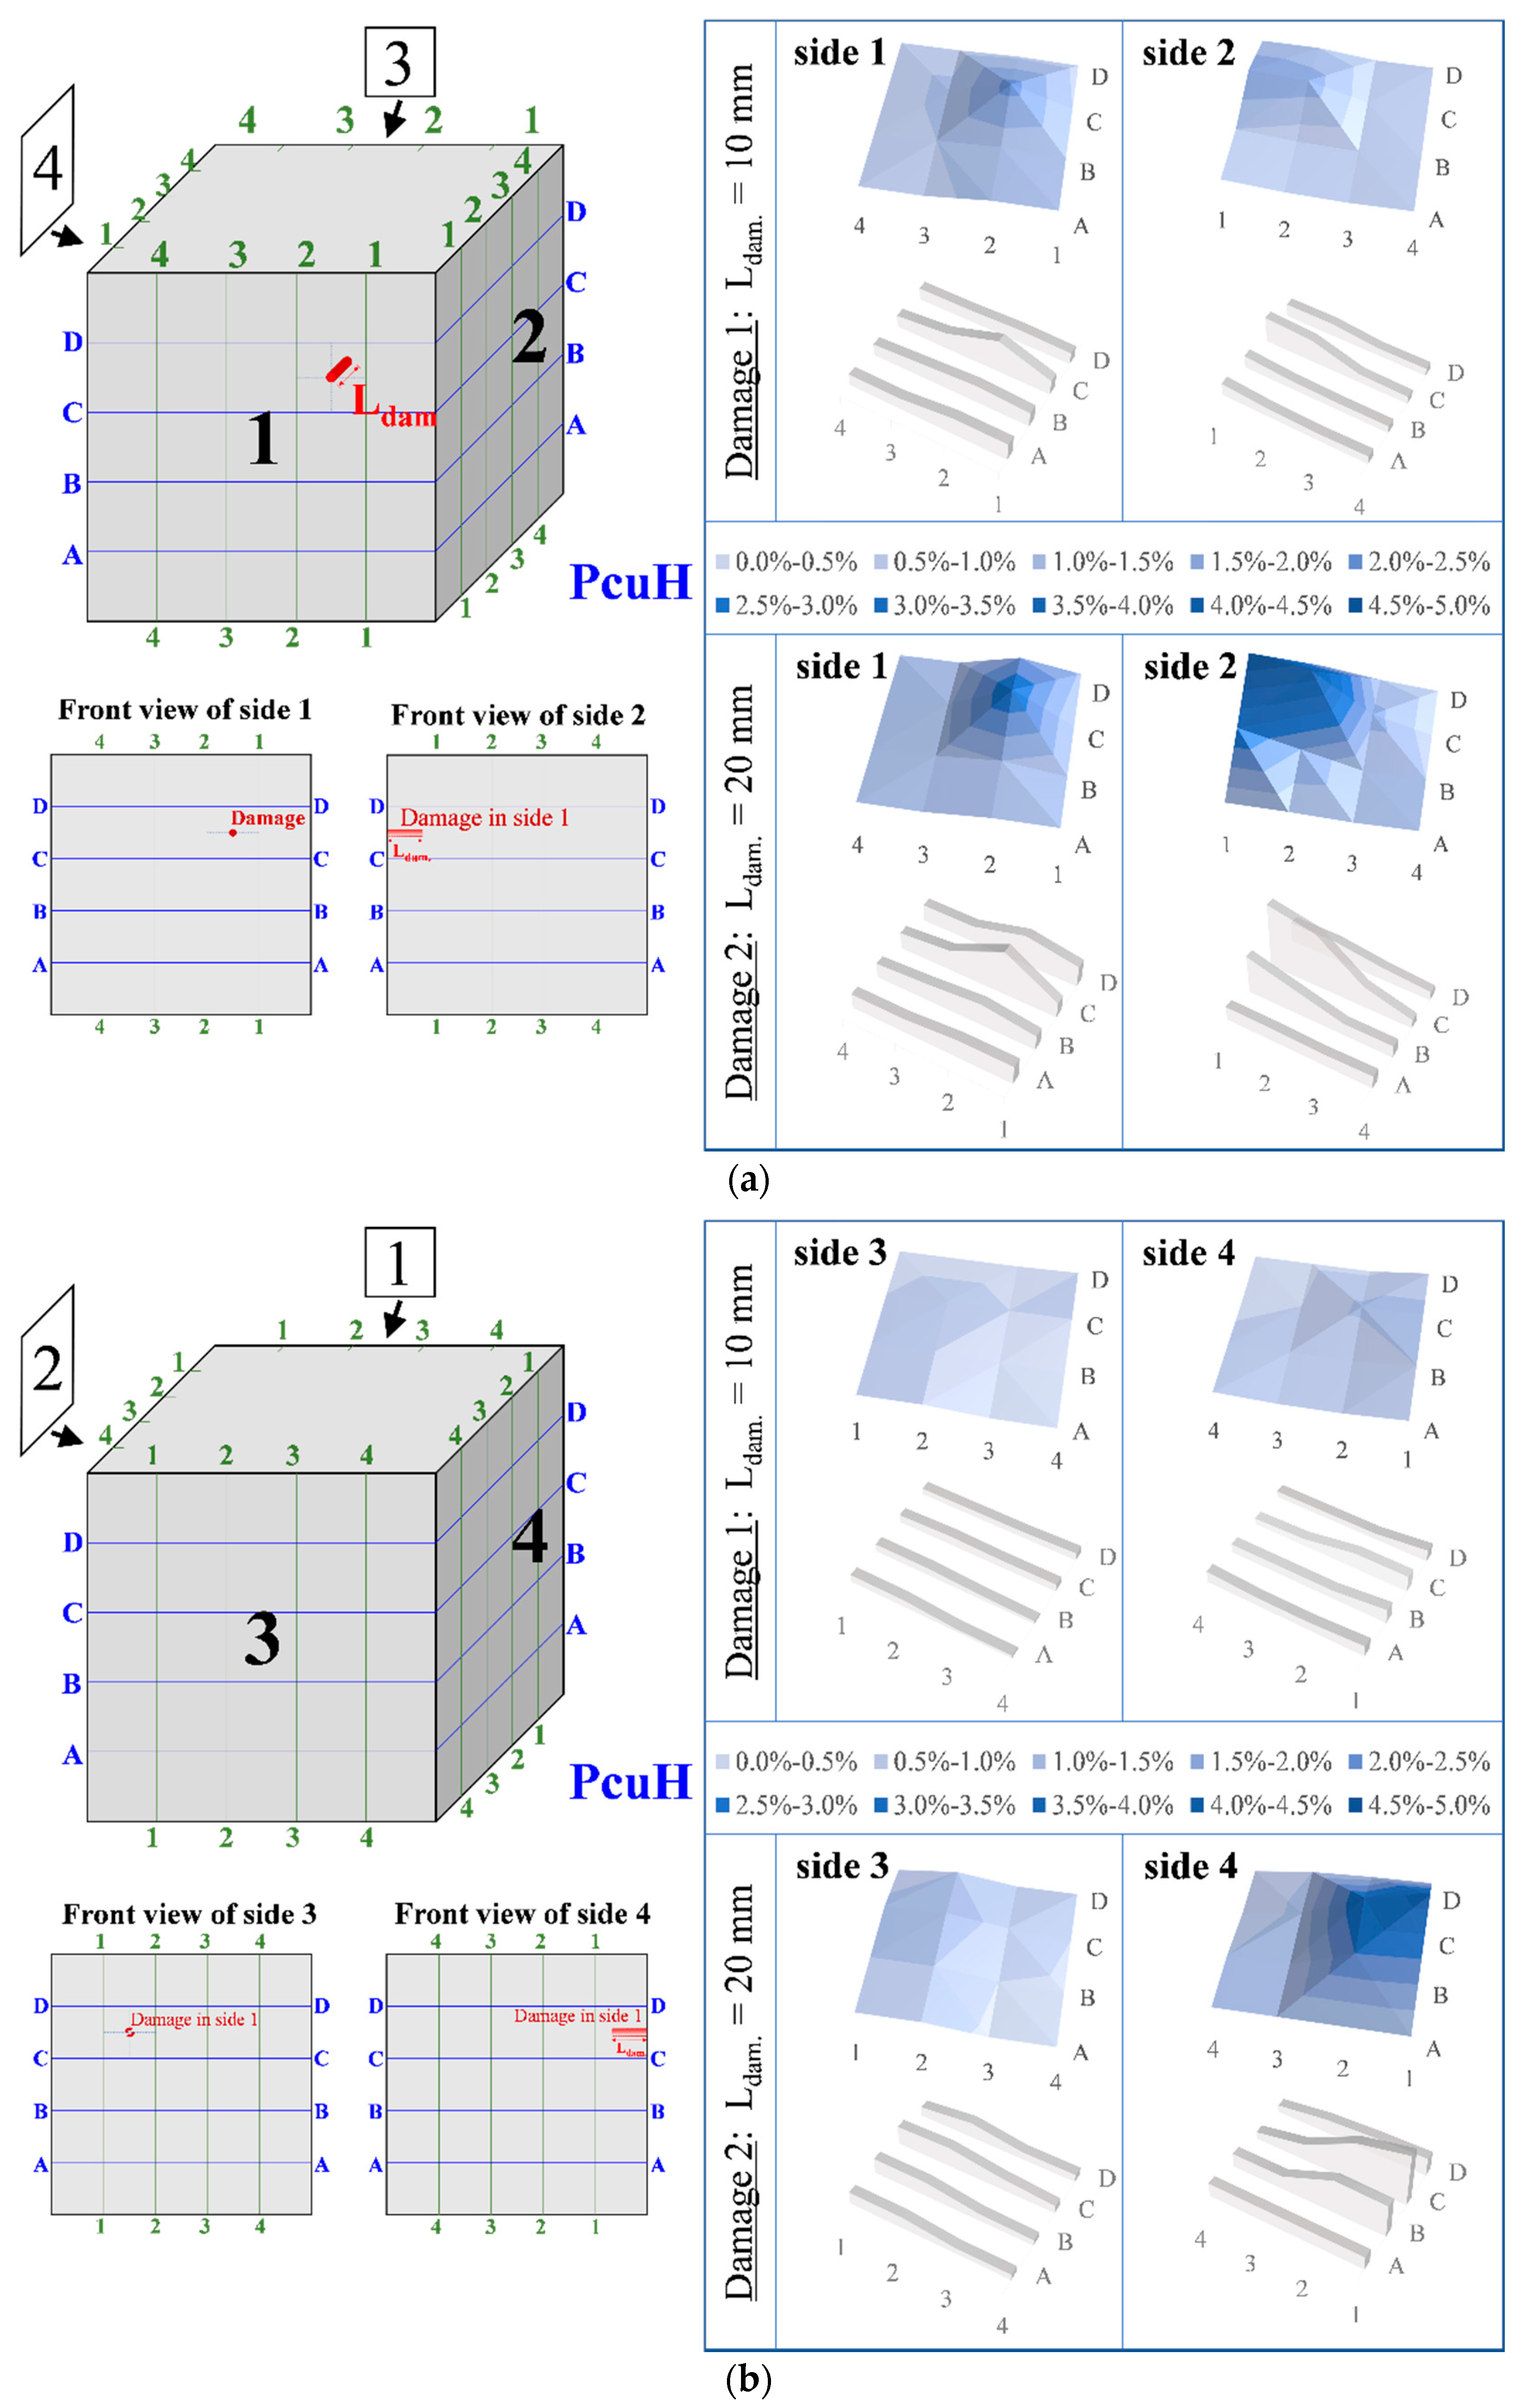
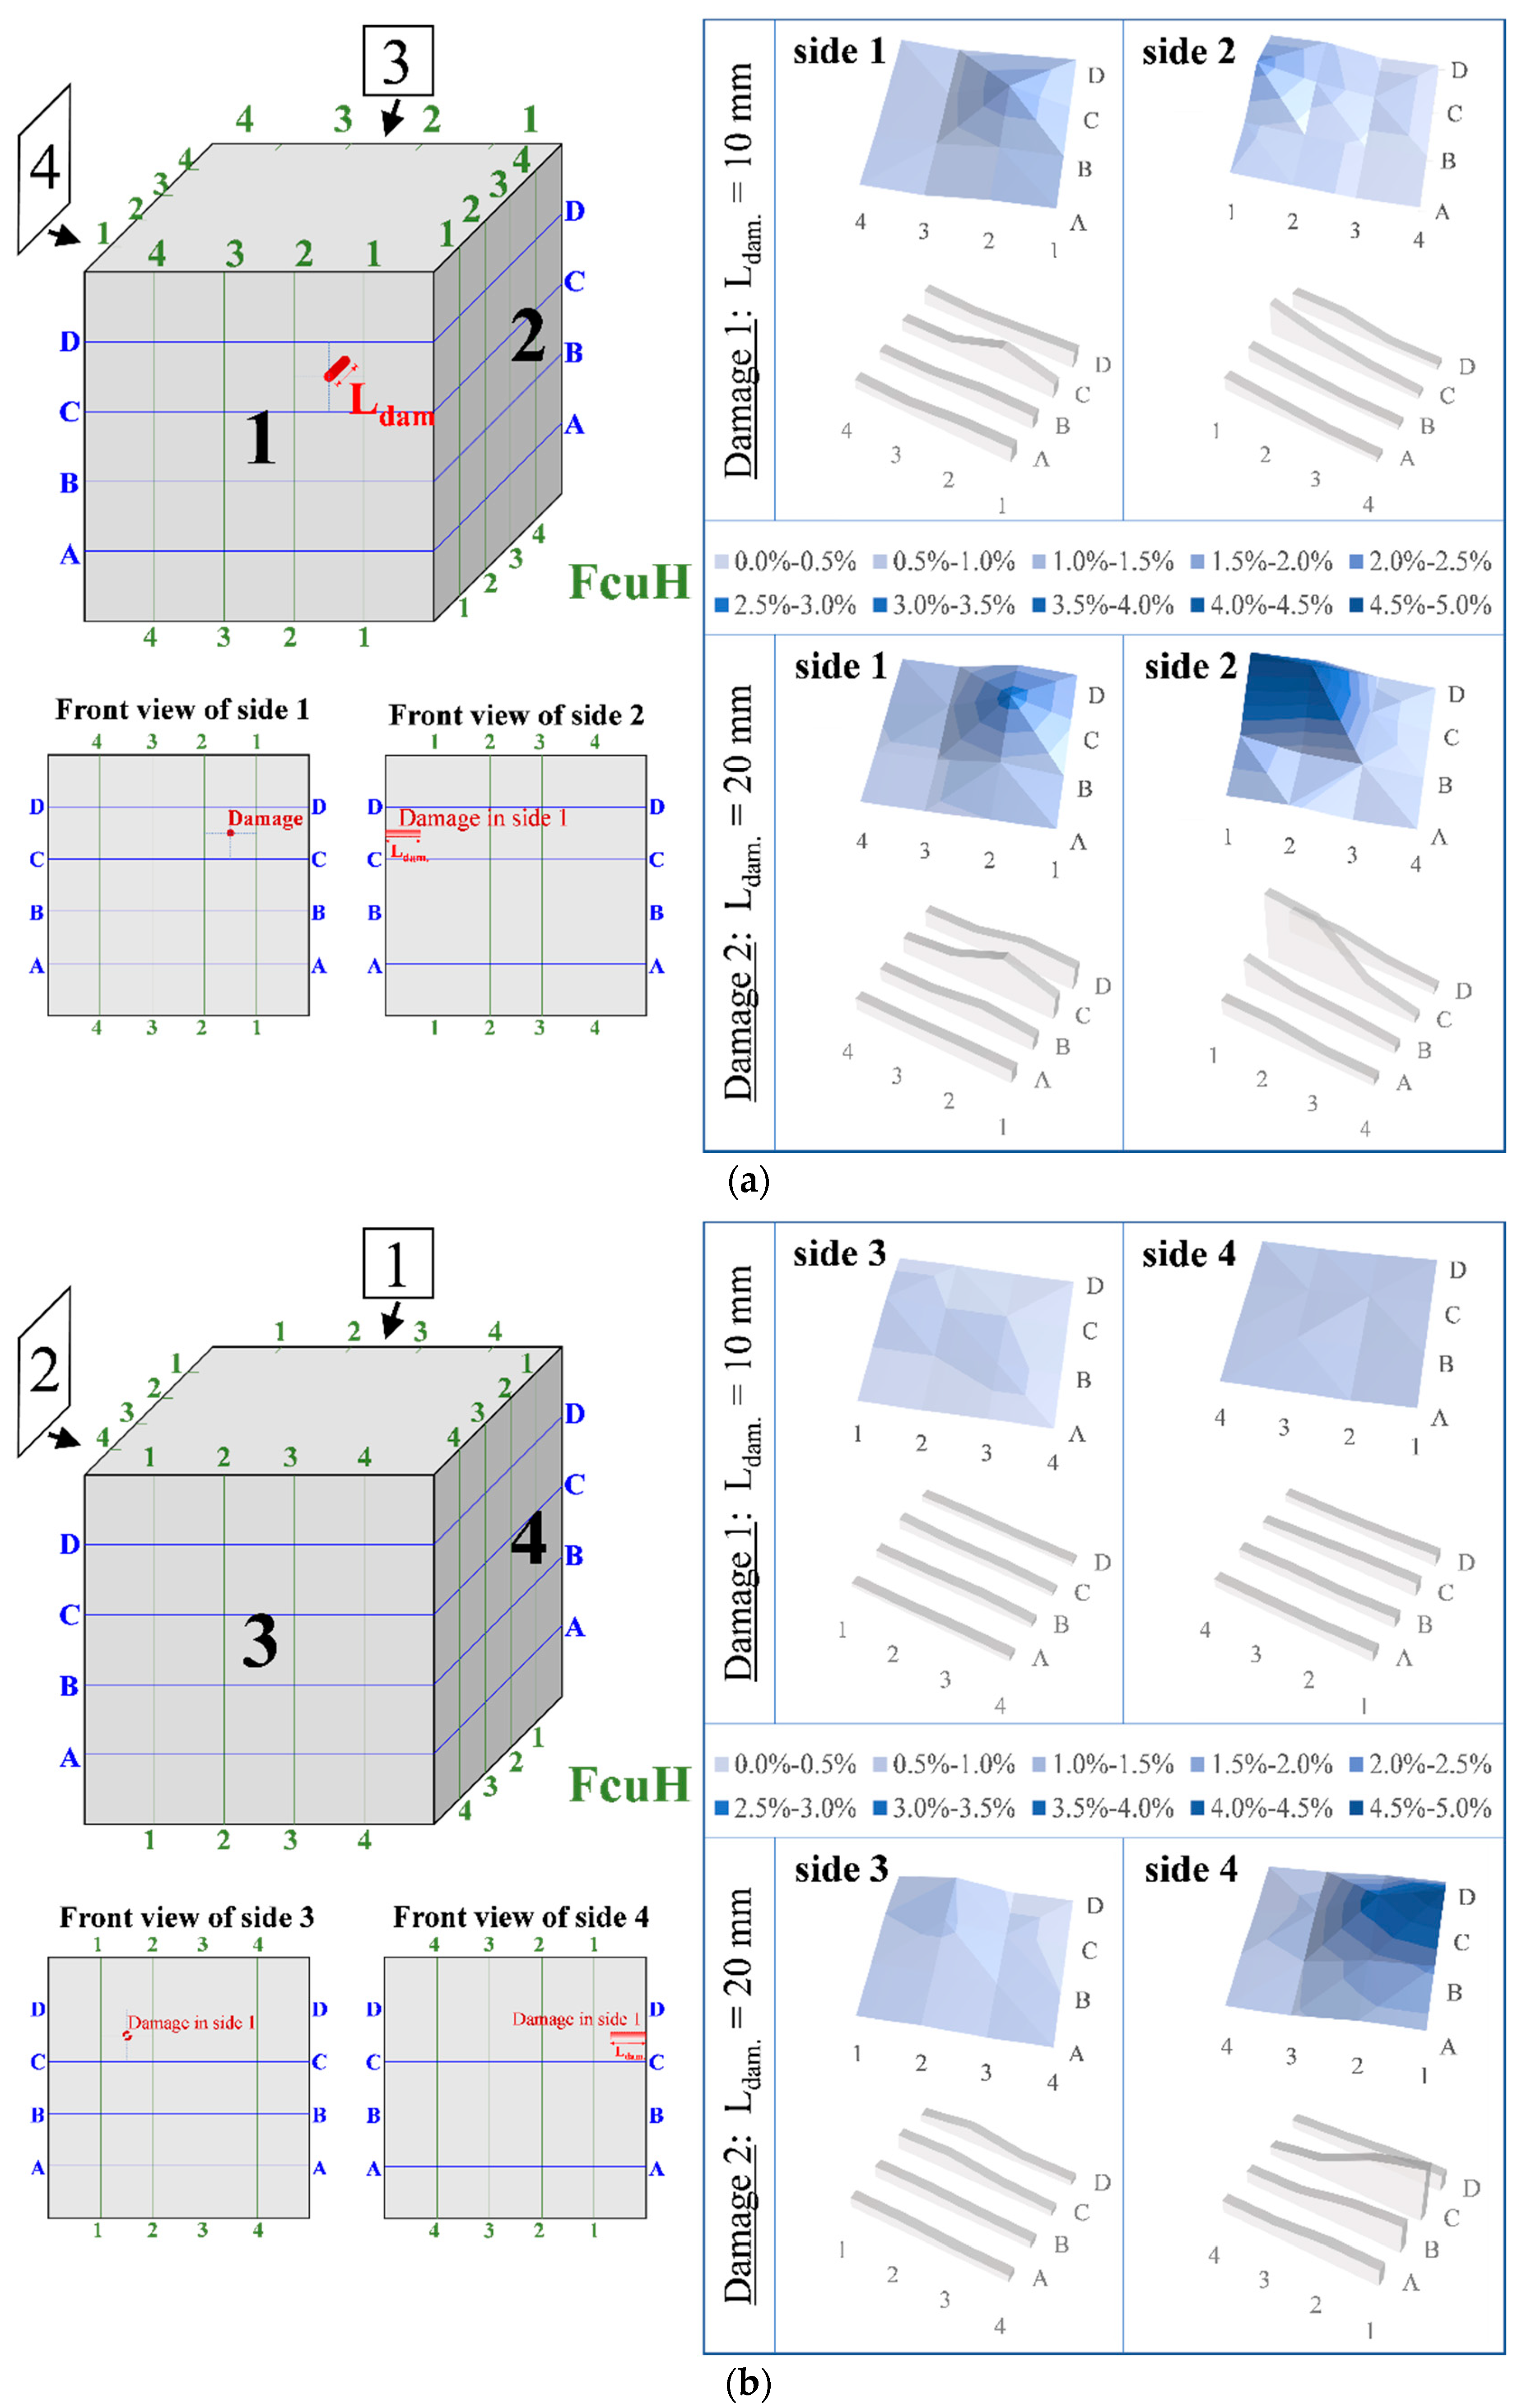
3.1. Verification of WiAMS by Measurements of Artificial Damage

The effectiveness of the adopted SHM system to diagnose the location and the magnitude of the occurred damage was first checked using PC and FRC cubes with predefined and artificially induced damage. A 4 mm diameter hole was drilled in a specific location of side 1 of the cube, as shown in Figure 4.
Two different depths (Ldam = 10 mm and 20 mm) of this pre-drilled hole were induced in the examined cubes in order to represent two different levels of damage. Further, a 30 mm-width mesh was drawn at each of the four sides of the FRC cube, as illustrated and numbered in Figure 4. The intersectional points of the mesh denote 4 × 4 = 16 specific points at each side. A PZT patch was mounted at each point and separate measurements of the damage identification system WiAMS were applied. This way, 16 × 4 = 64 measurements were carried out at each cube specimen for each examined damage state. A healthy state without a pre-drilled hole and two damage levels with a hole at 10 mm and 20 mm depths were examined.
The measurements of the developed SHM system included the voltage frequency responses of the mounted PZT transducers at each mesh point of the PC and FRC cubes at every damage level: “Healthy,” “Damage 1” when the hole had a depth of Ldam = 10 mm, and “Damage 2” when Ldam = 20 mm. Typical diagrams of PZT responses are presented in Figure 5 and Figure 6 for the PC and FRC cubes, respectively.
Especially, diagrams of Figure 5a,b illustrate the output signal in terms of measured voltage versus frequency of the PZTs mounted at point 1D1 and 4C1 of the PC cube (specimen PcuH). From Figure 5a it is indicated that the curve representing the “Healthy” state was rather close to the curves that represent the damage levels “Damage 1” and “Damage 2.” Thus, since the voltage frequency response of the PZT mounted at point 1D1 did not change significantly due to the drilled hole at depths of Ldam = 10 and 20 mm, it is deduced that only slight anomalies were detected and, therefore, it is concluded that no severe damage occurred at this specific point (1D1 of PcuH specimen) at either damage level (“Damage 1” and “Damage 2”).
The same observation can be noted in Figure 5b between the two curves representing the “Healthy” state and the damage level “Damage 1,” which were both more or less identical. Thus, the detected damage at point 4C1 seemed to be slight at this first state (“Damage 1”). On the contrary, the output signal curves between the pristine response (“Healthy”) and the “Damage 2” state, as illustrated in Figure 5b, exhibited notable discrepancies. This fact indicates that the PZT mounted at point 4C1 of the PcuH specimen diagnosed significant damage in the second examined case, where the artificially imposed damage due to the drilled hole had a depth of Ldam = 20 mm. The detected severity level of the structural damage in “Damage 2” state was definitely higher than the damage detected in the “Damage 1” state at point 4C1 of specimen PcuH.
The locations of points 1D1 and 4C1 with respect to the location of the hole could not justify the above differences and conclusions derived from the diagrams demonstrated in Figure 5a,b, since both examined points (4C1 and 1D1) were very rather close to the point of the drilled hole (see also Figure 4 for notation). However, it is emphasized that the PZTs located at side 4 of the cube faced the entire depth of the hole and, therefore, their vibrations were more sensitive to the anomalies of the material due to the drilled hole at the transverse direction. In contrast, the vibrations of the PZTs located at side 1 had the same longitudinal direction with the hole depth and, therefore, it seems these PZTs were less sensitive.
In the same manner, diagrams of Figure 6a,b illustrate the measured voltage frequency responses of the PZTs mounted at points 4B1 and 4C1 of the FRC cube (specimen FcuH). Both points were located on side 4 of the cube. A first observation is that, at both points, the curve representing the “Damage 1” state fitted well with the “Healthy” curve of the pristine state; thus, the detected damage seemed to be slight at this first state. The output signal curves between the “Healthy” response and the “Damage 2” one, as detected by the PZTs located at points 4B1 and 4C1 (Figure 6a,b, respectively), exhibited rather moderate and notable discrepancies, respectively. Obviously, the severity level of structural damages in the “Damage 2,” state as detected at point 4C1, was definitely higher than the damages detected at point 4B1 of specimen FcuH. These diagnoses were clearly justified by the distances between the locations of these points and the location of the drilled hole, since point 4C1 was closer to the hole than point 4B1 (see also Figure 4 for notation).
The conventionally used scalar damage index RMSD successfully resulted in quantify the structural damage severity and, therefore, it was used herein to evaluate the results yielding from the output signal of every PZT patch mounted at each measurement point of the cubes and at both damage levels. Higher RMSD values indicate the detection of increased structural damage. The well-known expression for the calculation of this statistical-based index is as follows:
RMSD = 1 M ( | V p ( f r ) | D | V p ( f r ) | 0 ) 2 1 M ( | V p ( f r ) | 0 ) 2
where | V p ( f r ) | 0 is the absolute value of the voltage output signal as measured from the PZT at the “Healthy” (undamaged) state of the cube, | V p ( f r ) | D is the absolute value of the corresponding voltage output signal as measured from the same PZT at the examined damage level (“Damage 1” or “Damage 2”), and M is the number of the measurements in the frequency band 10–260 kHz [45].
The values of RMSD are used to evaluate the effectiveness of the proposed SHM method for damage diagnosis in the PC and FRC cubes. For this purpose, Figure 7 and Figure 8 illustrate the range of the RMSD values that were calculated based on the PZT voltage output signals (16 measurements at each cube side × 4 sides = 64 total measurements). More specifically, the 3D graphs of Figure 7a,b and Figure 8a,b present the RMSD values of the PC and the FRC cube, respectively, for both examined damage levels (“Damage 1” and “Damage 2”). From these 3D graphs it can be observed that high values of RMSD were obtained at points lying near the hole, or the location of the artificially induced structural damage.
Furthermore, the PZTs located at sides 2 and 4 were more sensitive to the existence of holes in the transverse direction, since higher RMSD values were observed. On the contrary, the vibrations of the PZTs located at sides 1 and 3 had the same longitudinal direction with the hole depth and seemed to be less sensitive, since lower RMSD values were generally obtained.
Furthermore, PZT measurements at both cubes with increased damage level (“Damage 2” with a drilled hole depth of Ldam = 20 mm) yielded to clearly higher RMSD values than in the case of the first damage level (“Damage 1” with a drilled hole depth of Ldam = 10 mm).
These RMSD variations were observed consistently in both examined cubes, the PCuH and FcuH specimens, and, therefore, it is deduced that the influence of the examined three parameters (distance, direction, damage level) triggered changes in the measurements of the PZTs. Thus, the RMSD index seems to be a reliable and proficient statistical tool for structural damage assessment.

3.2. Compression Stress versus Strain Behavior

The behavior of typical cubes tested under repeated compressive loading is presented in terms of stress-versus-strain curves in Figure 9. Specifically, the diagram in Figure 9a illustrates the compressive behavior of a PC cube and the examined loading levels of the repeated loading procedure, as explained in Section 2.2. The behavior of characteristic PC and FRC cubes under repeated compression are presented and compared in the diagram in Figure 9b. From this comparison it is deduced that the FRC cube exhibited 7.7% more compressive strength (σmax = 46.0 MPa) than the PC cube (σmax = 42.7 MPa). Increases in the compressive strength due to the addition of synthetic fibers can also be observed in Table 1, which summarizes the test results of the experimental program that included six PC and six FRC cubes. The mean compressive strength of the PC and the FRC mixtures equaled 42.5 MPa and 46.1 MPa, respectively.
Although the FRC exhibited a rather slight increase (<10%) in the compressive strength with respect to PC, it is stressed that the most important influence of the synthetic fibers to the compressive behavior is the improvement of the post-peak response. The FRC cube displayed a smooth descending part in the stress-versus-strain diagram shown in Figure 9b. This was observed for all FRC specimens and indicates the ability of the composite material to provide a rather ductile post-cracking response with respect to the brittle response of the PC cube. Specifically, in the diagrams in Figure 9b, the value of 80% of σmax, which could be considered a reliable level of post-peak strength and equaled 0.8 σmax = 34.2 MPa (Pcu) and 36.8 MPa (Fcu), was achieved at corresponding strains of 3.6‰ and 4.3‰ for the PC and the FRC cubes, respectively.

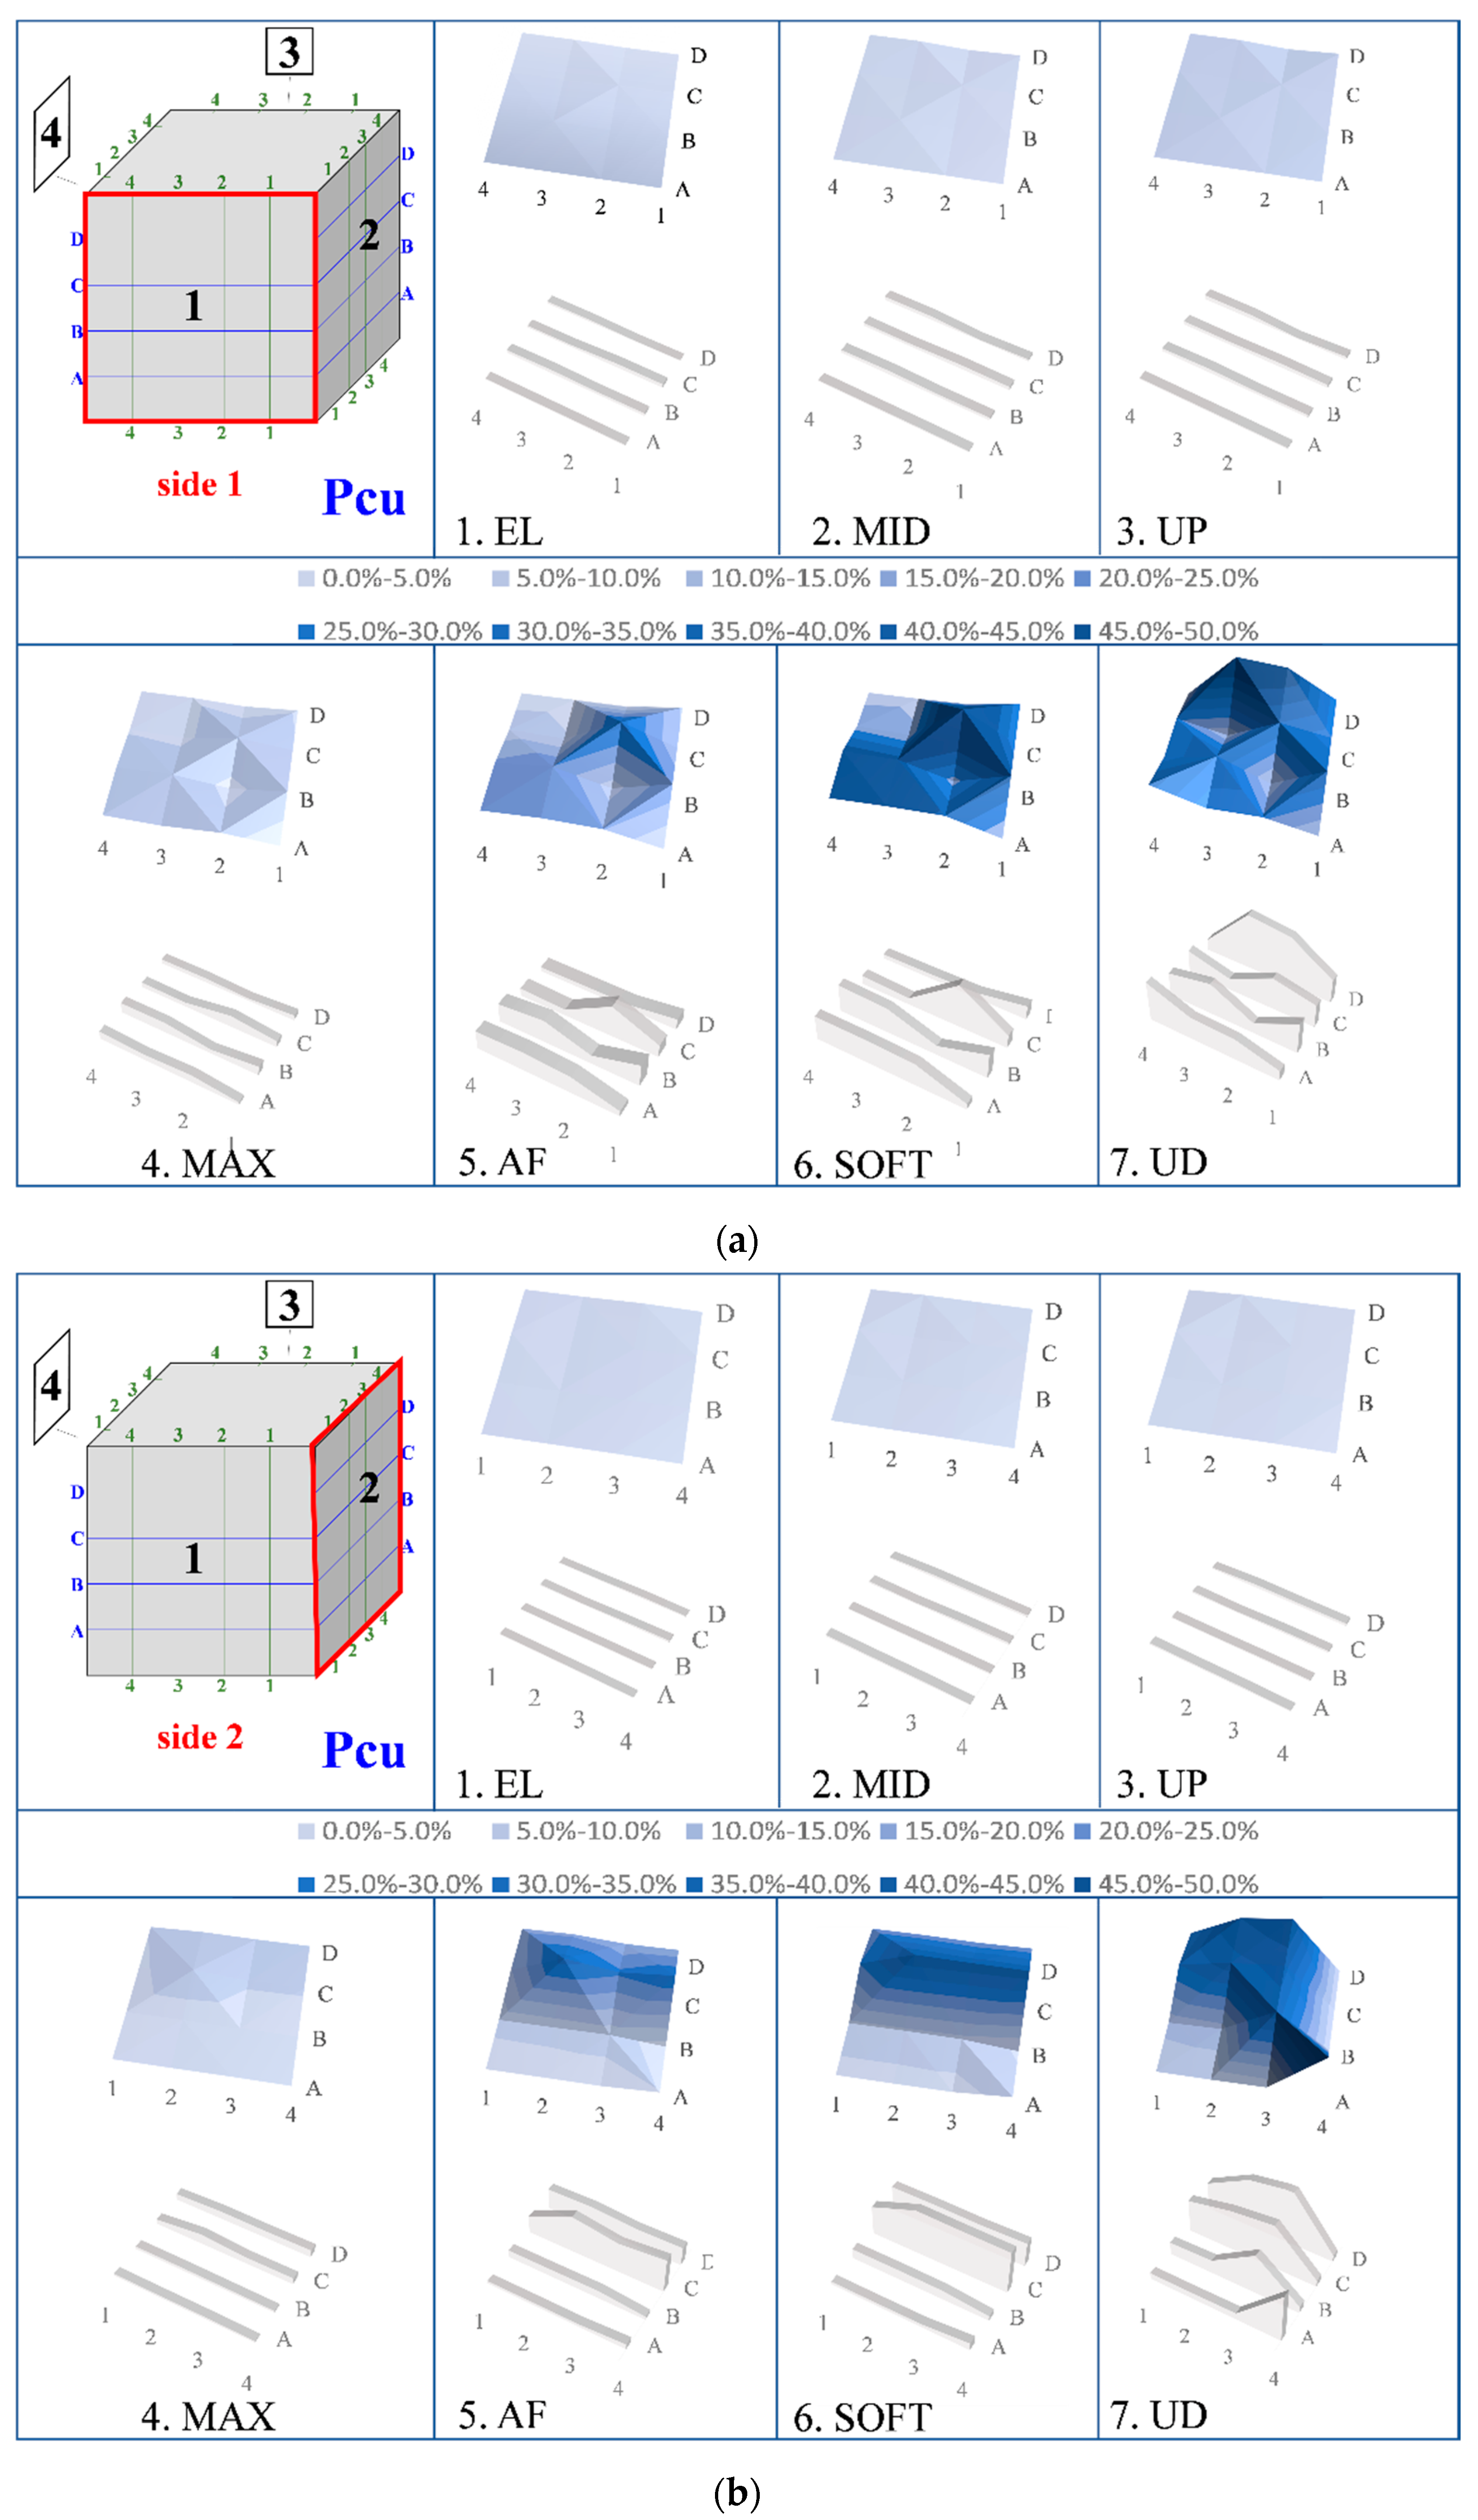
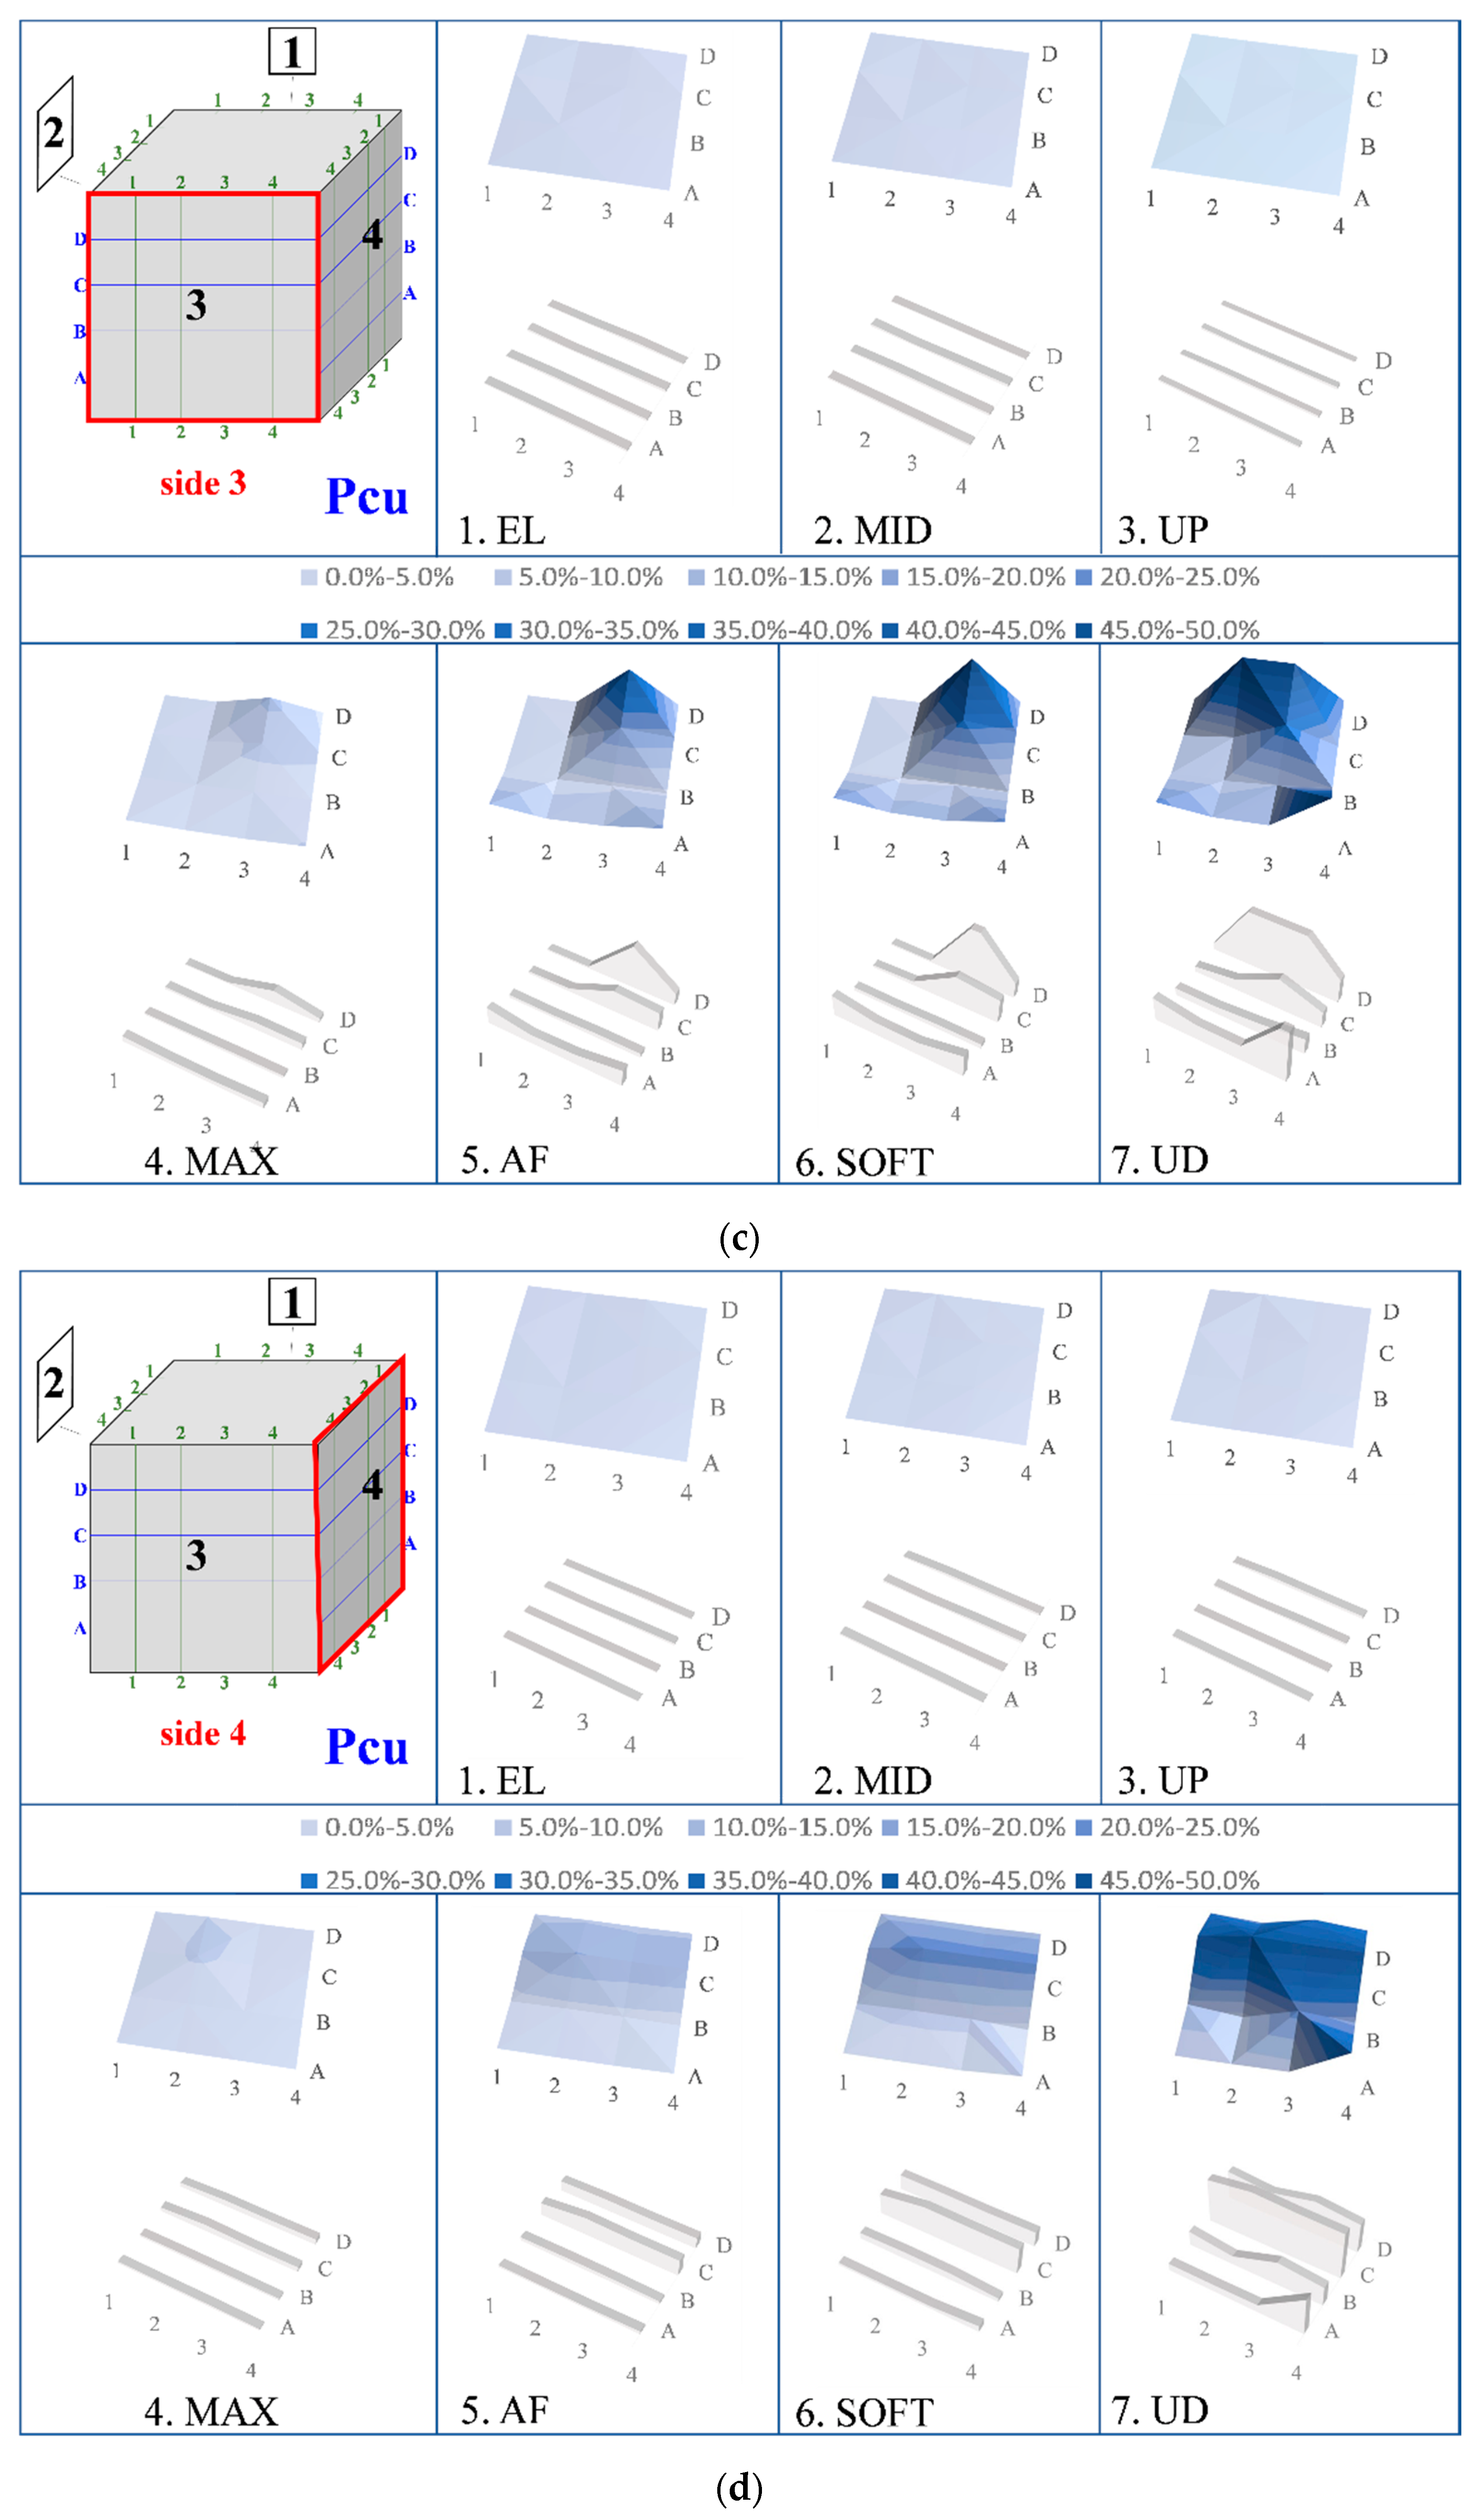
3.3. Damage Assessment of the Cubes Due to the Repeated Compressive Loading

The developed SHM system was used to diagnose damages to the PC and the FRC cubes subjected to repeated compression. Measurements of the voltage frequency responses of the mounted PZT transducers were recorded at each mesh point in both cubes and at every examined loading/damage level: “Healthy” (undamaged), “EL,” “MID,” “UP,” “MAX,” “AF,” “SOFT,” and “UD,” as explained in Section 2.2. and illustrated in Figure 9a. Typical diagrams of PZT responses mounted at points 1B3 and 2D1 are presented in Figure 10a,b in terms of measured voltage versus frequency. From these diagrams it can be observed that the frequency response of PZT at point 2D1 displayed higher discrepancies between the pristine (“Healthy”) state and the forthcoming damage-state responses with respect to the corresponding signals of PZT at point 1B3. Furthermore, the zoomed-in views of the diagrams in Figure 10a,b reveal that as the loading/damage level gradually increased (from “EL,” which corresponds to the elastic stage, to “UD,” which represents the ultimate damage state), the corresponding frequency response curves of the damage states diverged more from the baseline (“Healthy”) curve. Thus, the RMSD values were expected to increase gradually along with the increase in the loading and the damage-severity level of the examined specimens.
In order to quantify the structural damage caused by the imposed repeated compressive loading, Figure 11 and Figure 12 illustrate the range of the RMSD values per side of the cube that were calculated based on the PZT voltage output signals of the PC and the FRC cubes, respectively. It is noted that 16-point measurements were carried out at each side of the cube × 4 sides × 8 damage/loading levels = 512 total measurements at each specimen. From these 3D graphs it can be observed that, for both the PC and FRC cubes, the progressive increase in the structural damage due to the corresponding increase in the imposed compressive load was reflected by the use of the RMSD index and the proposed SHM methodology. Further, it is deduced that RMSD values at low levels of loading, such as “EL,” “MID,” and “UP,” were very low for both the PC and FRC specimens. This can be explained by the fact that concrete is uncracked (level “EL”) or slightly cracked, as the stress-versus-strain diagrams in Figure 9b also indicate.
However, after concrete cracking and especially after the maximum compressive strength, the RMSD values of the PC cube were significantly higher than the corresponding RMSD values of the FRC cube. This is also justified by the overall post-peak compressive behavior of the specimens (see also Figure 9b) and the existence of synthetic fibers. It is known that short fibers added in concrete as mass reinforcement mainly provide crack control due to the tensile stress transfer capability of the fibers across crack surfaces, known as crack-bridging, after cracking. This way, the added synthetic fibers provide significant resistance to shear across developing cracks, and therefore, the FRC cube demonstrated a pseudo-ductile response with increased residual strength and enhanced energy dissipations capacities, relative to the brittle behavior of PC cube. This phenomenon was captured by the RMSD damage index with satisfactory accuracy, as shown in Figure 11 and Figure 12.
Furthermore, from the 3D graphs of Figure 12 (Fcu specimen with synthetic fibers) it can be observed that the RMSD values were more or less at a constant value at high loading/damage levels. This fact indicates that structural damage due to cracking in the FRC cube seems to have had a uniform distribution along the entire surface of each cube side, which can be explained by the known contribution of fibers to control cracking by preventing the opening and widening of microcracks. On the contrary, the RMSD values in the PC cube shown in Figure 11 (Pcu specimen) displayed several peaks that indicate intense damage due to concrete cracking.
Some limitations of the developed EMA-based PZT-enabled SHM custom-made system that could be addressed are the range of the spectrum frequencies and the voltage that excites the PZT patch. Furthermore, during the repeated compressive loading tests and at the higher damage stages (“SOFT” and especially “UD”), some intersectional points of measurement were severely cracked, causing limited application of the PZT transducers on the surface of the cubes and measuring inability.

4. Conclusions

Diagnosis of damage due to cracking in FRC cubes with synthetic fibers under repeated compressive load was achieved using a custom-made EMA-based SHM system. The main contributions and concluding remarks of this experimental study are summarized as follows:
  • The effectiveness of the SHM system used to identify the location and severity level of damage was first verified using PC and FRC cubes with predefined and artificially induced damage in the form of drilled holes at two different depths.
  • PZT transducers located at the transverse direction to the hole depth were more sensitive than the PZTs located at the longitudinal direction.
  • The influence of distance-, direction-, and damage-level triggers changed in the measurements of the PZT transducers and the adopted RMSD index seemed to be a reliable statistical tool for structural damage assessment.
  • The FRC cubes exhibited a rather slight increase (<10%) in compressive strength with respect to the PC cubes. A notable influence of the synthetic fibers on the improvement of the post-peak compressive behavior was observed, which indicates the ability of FRC to provide increased ductility.
  • The illustrated 3D graphs clearly demonstrate that the RMSD index values increased gradually along with the progressive increase in the compressive load and the corresponding damage severity level of the tested cubes. Especially after concrete cracking at post-peak compressive response, the RMSD values of the PC cube were significantly higher than the corresponding RMSD values of the FRC cube. This is justified by the existence of the synthetic fibers, which provided ductile post-peak behavior with respect to the brittle response of the PC cube. This improvement was captured by the RMSD damage index with satisfactory accuracy.

Author Contributions

Conceptualization, M.E.V., M.C.N. and C.E.C.; methodology, M.E.V. and N.A.P.; validation, M.E.V. and M.C.N.; formal analysis, M.E.V. and M.C.N.; investigation, M.C.N. and N.A.P.; data curation, M.E.V. and M.C.N.; writing—original draft preparation, M.E.V.; writing—review and editing, M.E.V. and C.E.C.; visualization, M.E.V. and M.C.N.; supervision, M.E.V. and C.E.C.; project administration, C.E.C. All authors have read and agreed to the published version of the manuscript.

Funding

This research was co-financed by Greece and the European Union (European Social Fund—ESF) through the Operational Programme “Human Resources Development, Education and Lifelong Learning 2014–2020” in the context of the project “Structural Health Monitoring of Fiber-Reinforced Concrete Elements using an Advanced System of Piezoelectric Transducers” (MIS 5050596).

Institutional Review Board Statement

Not applicable.

Informed Consent Statement

Not applicable.

Data Availability Statement

The data presented in this study are available on request from the corresponding author.

Acknowledgments

The contribution of the personnel of the Laboratory of Reinforced Concrete and Seismic Design of Structures at Democritus University of Thrace on the experimental procedure and especially the support of G. Sapidis is sincerely appreciated.

Conflicts of Interest

The authors declare no conflict of interest.

References

  1. Caggiano, A.; Gambarelli, S.; Martinelli, E.; Nisticò, N.; Pepe, M. Experimental characterization of the post-cracking response in hybrid steel/polypropylene fiber-reinforced concrete. Constr. Build. Mater. 2016, 125, 1035–1043. [Google Scholar] [CrossRef]
  2. Smarzewski, P. Effect of curing period on properties of steel and polypropylene fiber reinforced ultra-high performance concrete. Mater. Sci. Eng. 2017, 245, 032059. [Google Scholar] [CrossRef]
  3. Guerini, V.; Conforti, A.; Plizzari, G.A.; Kawashima, S. Influence of steel and macro-synthetic fibers on concrete properties. Fibers 2018, 6, 47. [Google Scholar] [CrossRef] [Green Version]
  4. Rizzuti, L.; Bencardino, F. Effects of fiber volume fraction on the compressive and flexural experimental behavior of SFRC. Contemp. Eng. Sci. 2014, 7, 379–390. [Google Scholar] [CrossRef]
  5. Marcalikova, Z.; Cajka, R.; Bilek, V.; Bujdos, D.; Sucharda, O. Determination of mechanical characteristics for fiber-reinforced concrete with straight and hooked fibers. Crystals 2020, 10, 545. [Google Scholar] [CrossRef]
  6. Bencardino, F.; Rizzuti, L.; Spadea, G.; Swamy, R.N. Stress-strain behavior of steel fiber-reinforced concrete in compression. J. Mater. Civ. Eng. 2008, 20, 255–263. [Google Scholar] [CrossRef]
  7. Smarzewski, P. Hybrid fibres as shear reinforcement in high-performance concrete beams with and without openings. Appl. Sci. 2018, 8, 2070. [Google Scholar] [CrossRef] [Green Version]
  8. Gribniak, V.; Ng, P.-L.; Tamulenas, V.; Misiūnaitė, I.; Norkus, A.; Šapalas, A. Strengthening of fibre reinforced concrete elements: Synergy of the fibres and external sheet. Sustainability 2019, 11, 4456. [Google Scholar] [CrossRef] [Green Version]
  9. Karayannis, C.G.; Kosmidou, P.-M.K.; Chalioris, C.E. Reinforced concrete beams with carbon-fiber-reinforced polymer bars—Experimental study. Fibers 2018, 6, 99. [Google Scholar] [CrossRef] [Green Version]
  10. Gribniak, V.; Kaklauskas, G.; Torres, L.; Daniunas, A.; Timinskas, E.; Gudonis, E. Comparative analysis of deformations and tension-stiffening in concrete beams reinforced with GFRP or steel bars and fibers. Compos. Part B Eng. 2013, 50, 158–170. [Google Scholar] [CrossRef]
  11. Chalioris, C.E. Steel fibrous RC beams subjected to cyclic deformations under predominant shear. Eng. Struct. 2013, 49, 104–118. [Google Scholar] [CrossRef]
  12. Kytinou, V.K.; Chalioris, C.E.; Karayannis, C.G.; Elenas, A. Effect of steel fibers on the hysteretic performance of concrete beams with steel reinforcement—Tests and analysis. Materials 2020, 13, 2923. [Google Scholar] [CrossRef] [PubMed]
  13. Chalioris, C.E.; Kosmidou, P.-M.K.; Karayannis, C.G. Cyclic response of steel fiber reinforced concrete slender beams: An experimental study. Materials 2019, 12, 1398. [Google Scholar] [CrossRef] [Green Version]
  14. Tsonos, A.-D.; Kalogeropoulos, G.; Iakovidis, P.; Bezas, M.-Z.; Koumtzis, M. Seismic performance of RC beam–column joints designed according to older and modern codes: An attempt to reduce conventional reinforcement using steel fiber reinforced concrete. Fibers 2021, 9, 45. [Google Scholar] [CrossRef]
  15. Smarzewski, P. Study of toughness and macro/micro-crack development of fibre-reinforced ultra-high performance concrete after exposure to elevated temperature. Materials. 2019, 12, 1210. [Google Scholar] [CrossRef] [Green Version]
  16. Bencardino, F. Mechanical parameters and post-cracking behaviour of HPFRC according to three-point and four-point bending test. Adv. Civ. Eng. 2013, 2013, 179712. [Google Scholar] [CrossRef] [Green Version]
  17. Gribniak, V.; Kaklauskas, G.; Kwan, A.K.H.; Bacinskas, D.; Ulbinas, D. Deriving stress–strain relationships for steel fiber concrete in tension from tests of beams with ordinary reinforcement. Eng. Struct. 2012, 42, 387–395. [Google Scholar] [CrossRef]
  18. Bajpai, A.; Wetzel, B.; Klingler, A.; Friedrich, K. Mechanical properties and fracture behavior of high-performance epoxy nanocomposites modified with block polymer and core–shell rubber particles. J. Appl. Polym. Sci. 2019, 137, 48471. [Google Scholar] [CrossRef]
  19. Vougioukas, E.; Papadatou, M. A model for the prediction of the tensile strength of fiber-reinforced concrete members, before and after cracking. Fibers 2017, 5, 27. [Google Scholar] [CrossRef] [Green Version]
  20. Chalioris, C.E.; Panagiotopoulos, T.A. Flexural analysis of steel fiber-reinforced concrete members. Comput. Concr. 2018, 22, 11–25. [Google Scholar] [CrossRef]
  21. Hollý, I.; Bilčík, J. Effect of chloride-induced steel corrosion on working life of concrete structures. Solid State Phenom. 2018, 272, 226–231. [Google Scholar] [CrossRef]
  22. Almeida, F.; Cunha, V.M.C.F.; Miranda, T.; Cristelo, N. Indirect tensile behaviour of fibre reinforced alkali-activated composites. Fibers 2018, 6, 30. [Google Scholar] [CrossRef] [Green Version]
  23. El-Newihy, A.; Azarsa, P.; Gupta, R.; Biparva, A. Effect of polypropylene fibers on self-healing and dynamic modulus of elasticity recovery of fiber reinforced concrete. Fibers 2018, 6, 9. [Google Scholar] [CrossRef] [Green Version]
  24. Chalioris, C.E. Analytical approach for the evaluation of minimum fibre factor required for steel fibrous concrete beams under combined shear and flexure. Constr. Build. Mater. 2013, 43, 317–336. [Google Scholar] [CrossRef]
  25. Torres, J.A.; Lantsoght, E.O.L. Influence of fiber content on shear capacity of steel fiber-reinforced concrete beams. Fibers 2019, 7, 102. [Google Scholar] [CrossRef] [Green Version]
  26. Kytinou, V.K.; Chalioris, C.E.; Karayannis, C.G. Analysis of residual flexural stiffness of steel fiber-reinforced concrete beams with steel reinforcement. Materials 2020, 13, 2698. [Google Scholar] [CrossRef]
  27. Abambres, M.; Lantsoght, E.O.L. ANN-based shear capacity of steel fiber-reinforced concrete beams without stirrups. Fibers 2019, 7, 88. [Google Scholar] [CrossRef] [Green Version]
  28. Kotecha, P.; Abolmaali, A. Macro synthetic fibers as reinforcement for deep beams with discontinuity regions: Experimental investigation. Eng. Struct. 2019, 200, 109672. [Google Scholar] [CrossRef]
  29. Mobasher, B.; Dey, V.; Bauchmoyer, J.; Mehere, H.; Schaef, S. Reinforcing efficiency of micro and macro continuous polypropylene fibers in cementitious composites. Appl. Sci. 2019, 9, 2189. [Google Scholar] [CrossRef] [Green Version]
  30. Bentur, A.; Mindess, S. Fiber Reinforced Cementitious Composites: Modern Concrete Technology Series, 2nd ed.; Taylor & Francis: New York, NY, USA, 2007; p. 624. [Google Scholar]
  31. Mindess, S.; Young, J.F.; Darwin, D. Concrete, 2nd ed.; Prentice-Hall: Upper Saddle River, NJ, USA, 2003; p. 644. [Google Scholar]
  32. Carnovale, D.; Vecchio, F.J. Effect of fiber material and loading history on shear behavior of fiber-reinforced concrete. ACI Struct. J. 2014, 111, 1235–1244. [Google Scholar] [CrossRef]
  33. Hasan, M.J.; Afroz, M.; Mahmud, H.M.I. An experimental investigation on mechanical behavior of macro synthetic fiber reinforced concrete. Int. J. Civ. Environ. Eng. 2011, 11, 18–23. [Google Scholar]
  34. Roesler, J.R.; Altoubat, S.A.; Lange, D.A.; Rieder, K.A.; Ulreich, G.R. Effect of synthetic fibers on structural behavior of concrete slabs-on-ground. ACI Mater. J. 2006, 103, 3–10. [Google Scholar]
  35. Rainieri, C.; Fabbrocino, G.; Cosenza, E. Integrated seismic early warning and structural health monitoring of critical civil infrastructures in seismically prone areas. Struct. Health Monit. 2011, 10, 291–308. [Google Scholar] [CrossRef]
  36. Tsonos, A.-D.G. Ultra-high-performance fiber reinforced concrete: An innovative solution for strengthening old R/C structures and for improving the FRP strengthening method. WIT Trans. Eng. Sci. 2009, 64, 273–284. [Google Scholar] [CrossRef] [Green Version]
  37. Soh, C.K.; Tseng, K.K.-H.; Bhalla, S.; Gupta, A. Performance of smart piezoceramic patches in health monitoring of a RC bridge. Smart Mater. Struct. 2000, 9, 533–542. [Google Scholar] [CrossRef]
  38. Mei, H.; Haider, M.F.; Joseph, R.; Migot, A.; Giurgiutiu, V. Recent advances in piezoelectric wafer active sensors for structural health monitoring applications. Sensors 2019, 19, 383. [Google Scholar] [CrossRef] [PubMed] [Green Version]
  39. Yang, Y.; Divsholi, B.S. Sub-frequency interval approach in electromechanical impedance technique for concrete structure health monitoring. Sensors 2010, 10, 11644–11661. [Google Scholar] [CrossRef] [Green Version]
  40. Talakokula, V.; Bhalla, S.; Gupta, A. Monitoring early hydration of reinforced concrete structures using structural parameters identified by piezo sensors via electromechanical impedance technique. Mech. Syst. Signal Process. 2018, 99, 129–141. [Google Scholar] [CrossRef]
  41. Huo, L.; Cheng, H.; Kong, Q.; Chen, X. Bond-slip monitoring of concrete structures using smart sensors—A review. Sensors 2019, 19, 1231. [Google Scholar] [CrossRef] [Green Version]
  42. Yang, Y.; Hu, Y.; Lu, Y. Sensitivity of PZT impedance sensors for damage detection of concrete structures. Sensors 2008, 8, 327–346. [Google Scholar] [CrossRef] [PubMed] [Green Version]
  43. Providakis, C.P.; Angeli, G.M.; Favvata, M.J.; Papadopoulos, N.A.; Chalioris, C.E.; Karayannis, C.G. Detection of concrete reinforcement damage using piezoelectric materials—Analytical and experimental study. Int. J. Civil Archit. Struct. Constr. Eng. 2014, 8, 197–205. [Google Scholar] [CrossRef]
  44. Perera, R.; Torres, L.; Ruiz, A.; Barris, C.; Baena, M. An EMI-Based clustering for structural health monitoring of NSM FRP strengthening systems. Sensors 2019, 19, 3775. [Google Scholar] [CrossRef] [PubMed] [Green Version]
  45. Voutetaki, M.E.; Papadopoulos, N.A.; Angeli, G.M.; Providakis, C.P. Investigation of a new experimental method for damage assessment of RC beams failing in shear using piezoelectric transducers. Eng. Struct. 2016, 114, 226–240. [Google Scholar] [CrossRef]
  46. Bahl, S.; Nagar, H.; Singh, I.; Sehgal, S. Smart materials types, properties and applications: A review. Mater. Today Proc. 2020, 28, 1302–1306. [Google Scholar] [CrossRef]
  47. Sun, M.; Staszewski, W.J.; Swamy, R.N. Smart sensing technologies for structural health monitoring of civil engineering structures. Adv. Civ. Eng. 2010, 2010, 724962. [Google Scholar] [CrossRef] [Green Version]
  48. Chalioris, C.E.; Voutetaki, M.E.; Liolios, A.A. Structural health monitoring of seismically vulnerable RC frames under lateral cyclic loading. Earthq. Struct. 2020, 19, 29–44. [Google Scholar] [CrossRef]
  49. Chalioris, C.E.; Providakis, C.P.; Favvata, M.J.; Papadopoulos, N.A.; Angeli, G.M.; Karayannis, C.G. Experimental application of a wireless earthquake damage monitoring system (WiAMS) using PZT transducers in reinforced concrete beams. WIT Trans. Built. Environ. 2015, 152, 233–243. [Google Scholar] [CrossRef] [Green Version]
  50. Chalioris, C.E.; Kytinou, V.K.; Voutetaki, M.E.; Karayannis, C.G. Flexural damage diagnosis in reinforced concrete beams using a wireless admittance monitoring system—Tests and finite element analysis. Sensors 2021, 21, 679. [Google Scholar] [CrossRef]
  51. Wang, Z.; Chen, D.; Zheng, L.; Huo, L.; Song, G. Influence of axial load on electromechanical impedance (EMI) of embedded piezoceramic transducers in steel fiber concrete. Sensors 2018, 18, 1782. [Google Scholar] [CrossRef] [Green Version]
  52. CEN. EN 206:2013+A1:2016. Concrete—Specification, Performance, Production and Conformity; CEN: Brussels, Belgium, 2016. [Google Scholar]
  53. Providakis, C.P.; Liarakos, E.V. Web-based concrete strengthening monitoring using an innovative electromechanical impedance telemetric system and extreme values statistics. Struct. Control Health Monit. 2014, 21, 1252–1268. [Google Scholar] [CrossRef]
  54. Na, W.S.; Baek, J. A review of the piezoelectric electromechanical impedance based structural health monitoring technique for engineering structures. Sensors 2018, 18, 1307. [Google Scholar] [CrossRef] [PubMed] [Green Version]
Figure 1. Materials: (a) macro-synthetic fibers; (b) FRC cube with strain gauges.
Fibers 10 00005 g001
Figure 2. Compression test rig and instrumentation.
Fibers 10 00005 g002
Figure 3. Application of the developed SHM system in the concrete cube with fibers.
Fibers 10 00005 g003
Figure 4. Mesh points of damage identification measurements in the FRC cube with a pre-drilled hole. 1–4 represent the columns and A–D the rows of the mesh points at each side.
Fibers 10 00005 g004
Figure 5. Voltage frequency response of PZT signals in the PC cube and at points (a) 1D1 and (b) 4C1.
Fibers 10 00005 g005
Figure 6. Voltage frequency response of PZT signals in the FRC cube and at points (a) 4B1 and (b) 4C1.
Fibers 10 00005 g006
Figure 7. Damage assessment measurements in terms of RMSD values of the PC cube (specimen PcuH) with an artificial hole at a depth of 10 mm (Damage 1) and 20 mm (Damage 2): (a) sides 1 and 2; (b) sides 3 and 4. 1–4 represent the columns and A–D the rows of the mesh points at each side.
Fibers 10 00005 g007
Figure 8. Damage assessment measurements in terms of RMSD values of the FRC cube (specimen FcuH) with an artificial hole at a depth of 10 mm (Damage 1) and 20 mm (Damage 2): (a) sides 1 and 2; (b) sides 3 and 4. 1–4 represent the columns and A–D the rows of the mesh points at each side.
Fibers 10 00005 g008
Figure 9. Compressive stress-versus-strain curves: (a) PC cube (specimen Pcu) and examined loading levels; (b) comparison of the PC and FRC compressive behavior (specimens Pcu and Fcu).
Fibers 10 00005 g009
Figure 10. Voltage frequency response of PZT signals in the FRC cube under repeated compression and at points (a) 1B3 and (b) 2D1.
Fibers 10 00005 g010
Figure 11. Damage-assessment measurements in terms of RMSD values of the PC cube (specimen Pcu) under repeated compression: (a) side 1; (b) side 2; (c) side 3; (d) side 4. 1–4 represent the columns and A–D the rows of the mesh points at each side.
Fibers 10 00005 g011aFibers 10 00005 g011b
Figure 12. Damage-assessment measurements in terms of RMSD values of the FRC cube (specimen Fcu) under repeated compression: (a) side 1; (b) side 2; (c) side 3; (d) side 4. 1–4 represent the columns and A–D the rows of the mesh points at each side.
Fibers 10 00005 g012aFibers 10 00005 g012b
Table 1. Compressive strength of the PC and FRC cubes (in MPa).
CubePCFRC
140.844.1
242.743.2
339.846.0
443.046.9
545.248.7
643.547.8
Average42.546.1
Standard deviation1.92.1
Publisher’s Note: MDPI stays neutral with regard to jurisdictional claims in published maps and institutional affiliations.

