Article

Coating Effects of ε-Polylysine and Rosmarinic Acid Combined with Chitosan on the Storage Quality of Fresh Half-Smooth Tongue Sole (Cynoglossus semilaevis Günther) Fillets

1
Shanghai Engineering Research Center of Aquatic Product Processing and Preservation, Shanghai Professional Technology Service Platform on Cold Chain Equipment Performance and Energy Saving Evaluation, Shanghai 201306, China
2
National Experimental Teaching Demonstration Center for Food Science and Engineering, Shanghai Ocean University, Shanghai 201306, China
3
College of Food Science and Technology, Shanghai Ocean University, Shanghai 201306, China
*
Authors to whom correspondence should be addressed.
Coatings 2019, 9(4), 273; https://doi.org/10.3390/coatings9040273
Submission received: 2 April 2019 / Revised: 13 April 2019 / Accepted: 17 April 2019 / Published: 22 April 2019

Abstract

:
The study was to evaluate the effects of chitosan-based coating combined with rosmarinic acid (RA) with different concentrations of ε-polylysine (ε-PL) on flavor retention and sensorial properties of half-smooth tongue sole fillets during storage at 4 °C. Results showed that chitosan-based coatings combined with ε-PL and RA contributed to the reduction of off-flavor compounds, such as total volatile base nitrogen (TVB-N), trimethylamine (TMA), and ATP-related compounds, and accumulation of free amino acids (FAAs). Nineteen volatile organic compounds were analyzed by gas chromatography-mass spectrometer (GC/MS) during storage, including seven alcohols, six aldehydes, and six ketones. The coating treated fresh half-smooth tongue sole (HTS) fillets significantly reduced the relative content of off-odor volatiles, such as 1-octen-3-ol, propanal, hexanal, and octanal. According to sensory evaluation results, chitosan-based coating combined with ε-PL and RA was an effective way to maintain quality of HTS fillets during refrigerated storage.

1. Introduction

The half-smooth tongue sole (HTS, Cynoglossus semilaevis Günther) is a demersal fish that is widely distributed off the coast of China, particularly in the Bohai and Huanghai Seas, because of its delicious taste and nutrition [1]. With the development of e-commerce, the convenient and fast consumption of fresh fish fillets will become a main marketing form of fish products [2]. However, HTS could easily decompose by environmental factors and eventually reach unacceptable quality during storage. Although synthetic or chemical preservatives are used to maintain quality during storage, consumers generally prefer natural additives [3]. Rosmarinic acid (RA) usually originates from Lamiaceae herbs and its possible application in processed foods as a natural antioxidant has reached new interest levels in recent years [4,5].
However, the limited antimicrobial activities of RA do not satisfy consumer needs for perishable aquatic products preservation. ε-polylysine (ε-PL) is a natural polypeptide and perceived as a safe and effective substance, which could interact with bacterial membranes because of its polycationic and surface nature [6]. ε-PL can interact with the microbial cell surface, strip the outer membrane, and cause abnormal distribution of the cytoplasm [7]. Now, ε-PL has been widely used in aquatic products preservation. Cai et al. found that ε-PL could effectively inhibit themicroorganisms growth, and delay changes in lipid oxidation, protein degradation, and nucleotide breakdown in Japanese sea bass during storage [8]. ε-PL could inhibit the growth of Pseudomonas, Shewanella, and Acinetobacter, which are the major genera in spoiled bighead carp (Aristichthys nobilis) fillets [9].
In recent years, a variety of active packaging systems have been developed to prolong storage life and enhance the safety of fish products [10]. The present study prepared the chitosan-based coating containing 30 mg/L RA and different concentrations of ε-PL, and the changes of flavor-related compounds (including total volatile base nitrogen (TVB-N), trimethylamine (TMA), ATP-related compounds, and free amino acids (FAAs)), volatile profile, microbiological, and sensory properties of HTS fillets were assessed to determine the potential effects of chitosan-based coatings combined with ε-PL and RA on the flavor of HTS fillets during refrigerated storage (4 ± 0.5 °C).

2. Material and Methods

2.1. Chitosan-Based Coating Solutions Preparation

Chitosan-based coating solutions were used at concentrations of 1% (w/v) chitosan (deacetylation degree of 80–95% and average molecular weight of 400 kDa, Sinopharm Chemical Reagent Co., Ltd., Shanghai, China) in 1% (v/v) acetic acid solution stirring with a magnetic stirrer for 2 h to dissolve completely. The final concentrations of ε-PL and RA for the chitosan-based coating solutions are listed in Table 1. Then, 30 mg of RA (a purity of 97%, Aladdin Biochemistry Technology Co., Ltd., Shanghai, China) was weighed and introduced into 1000 mL distilled water (30 mg/L) under ultrasonic vibration at ambient temperature according to our previous research [11]. Subsequently, certain amounts of ε-PL (molecular weight < 5000, Macklin Chemical Reagent Co., Ltd., Shanghai, China) were respectively dissolved in the above solution to obtain final concentrations for 0.05%, 0.10%, 0.15%, and 0.20% (w/v). Homogenization was carried out using a rotor stator (FA25, Fluko, Shanghai, China) at 10000 rpm for 60 s to obtain stable coating solutions, and deaeration was conducted in a vacuum pump for 1 h to remove air bubbles from the solution for immersion treatments.

2.2. Preparation and Immersion Treatment of Fillets

Fresh live HTS (weight: 0.75 ± 0.05 kg; length: 40 ± 2 cm) were purchased from Luchao Port Market (Shanghai, China) in August and immediately transported to the laboratory with ice within 30 min. HTS were killed using percussive stunning and fillets with 6 cm × 4 cm × 1 cm, weighing approximately 40 g, were cut and prepared. The final concentrations of chitosan, RA, and ε-PL in coating solutions are listed in Table 1. The HTS fillets were each immersed in freshly prepared chitosan-based coating solution for 10 min at 4 °C with a fillet/solution ratio of 1:3 (w/v), then removed and allowed to drain in a sterile biochemical incubator with air flow at 4 °C for 60 min to form the coatings. After that, each fillet sample was individually packed in a sterile polyethylene bag and stored at 4 ± 0.5 °C for subsequent assessments at 3-day intervals.

2.3. Water Distribution and Migration

The method described by Li et al. [11] was used to assess the water distribution and migration in HTS fillets samples with low field nuclear magnetic resonance (LF-NMR) analysis and magnetic resonance imaging (MRI). The samples from the dorsal part of fillets were cut into small squares (3 cm × 3 cm × 1 cm, about 5 g) and sealed with polyethylene films. T2 relaxation measurements were implemented using a LF-NMR analyzer (MesoMR23-060H.I, Niumag Corporation, Shanghai, China) with a proton resonance frequency of 20 MHz through CPMG pulse. A total of 16 scans were performed with 3000 echoes for each measurement, and the relative content of three types of water components was obtained from the iterative inversion with analytical software of T2 transverse relaxation time. Acquisition parameters were as follows: Slice width = 3 mm, time repetition (TR) = 2000, and time echo (TE) = 15 ms.
MRI experiments were also implemented by the LF-NMR analyzer to obtain proton density weighted images. Acquisition parameters were as follows: Slice width = 3 mm, TR = 2000, and TE = 15 ms.

2.4. Total Volatile Basic Nitrogen (TVB-N)

TVB-N values were determined according to Guan et al. [12]. The TVB-N values were determined using the automatic Kjeldahl nitrogen-determination instrument (Kjeltec8400, Foss, Hilleroed, Denmark) and expressed as mg/100 g samples.

2.5. TMA

Trimethylamine (TMA) values were determined according to the picric acid colorimetric method [13].

2.6. ATP-Related Compounds Analysis

ATP-related compounds (ATP, ADP, AMP, IMP (inosine 5′-monophosphate), HxR (inosine), and Hx (hypoxanthine)) in HTS fillet samples were quantified using HPLC (Waters 2695, Milford, CT, USA) according to the method proposed by Shibata et al. [14]. After obtaining all of the ATP metabolites from HPLC, the freshness index K value was calculated as follows:
K   value   ( % ) = HxR + Hx ATP + ADP + AMP + IMP + HxR + Hx × 100

2.7. Thiobarbituric acid (TBA) Values

TBA values were analyzed according to Sun et al. [15] and expressed in mg malonaldehyde per kg of sample.

2.8. Free Amino Acids (FAAs)

FAAs were performed according to the method of Tavakoli et al. [16] using an automatic amino acid analyzer (L-8800, Hitachi, Tokyo, Japan). Peak identification and quantification were accomplished by the retention times and peak areas from the instrument software in comparison to FAAs standards (Sigma Chemical Co., St Louis, MO, USA).

2.9. Headspace SPME-GC/MS Analysis

Volatile compounds (VOCs) of different treated samples were implemented by the method portrayed by Li et al. [17]. First, 2 g minced samples and 5 mL saturated sodium sulfate were placed in a 20 mL headspace vial and ultrasonically extracted for 30 min at 40 °C. Then, a PDMS/DVB SPME fiber (65 μm, Supelco, Bellefonte, PA, USA) was injected into the headspace vial and exposed to the headspace for 25 min at 50 °C. Volatile compounds were identified using an Agilent 7890A/5975C GC-MS system (Agilent, Santa Clara, CA, USA) equipped with a DB-5MS column (30 m × 0.25 mm × 0.25 μm, J&W Scientific, Folsom, CA, USA). Helium was used as the carrier gas with a flow rate of 1.0 mL/min. The temperature program was isothermal at 40 °C for 10 min, and ramped at 5 °C/min to 240 °C, then 20 °C/min to 280 °C and held for 8 min. The MS ran in EI+ mode with electron impact energy at 70 eV; and collected data at a rate of 0.7 scans/s over a range of m/z 40–650. The volatile compounds were identified by comparison with commercial reference compounds provided by Sigma-Aldrich (St. Louis, MO, USA) and by comparison of their mass spectra with those contained in the NIST 2011.

2.10. Microbiological Analysis

Representative 10 g portions of HTS fillets samples were transferred to sterile homogenous bag with 90mL sterile 0.85% NaCl, fully homogenized, and then subjected to serial dilutions. The following microbiological analyses were performed [18]: (i) Determination of total viable counts (TVC) on nutrient agar medium (Hopebio, Qingdao, China) at 28 °C for 48 h; (ii) enumeration of Pseudomonas spp. after incubation on cetrimide agar (Hopebio, Qingdao, China) at 44 °C for 48 h; (iii) enumeration of H2S-producing bacterial counts after incubation on Iron Agar (Hopebio, Qingdao, China) at 25 °C for 72 h.

2.11. Texture Profile Analysis (TPA)

Texture was assessed using a texture analyzer (Stable Micro Systems, Ltd., Surrrey, UK) equipped with a cylindrical probe (P/5). Portions of 2 cm × 2 cm × 1 cm were cut, and the parameters of hardness, adhesiveness, springiness, and cohesiveness were acquired using constant test speed of 1 m/s and sample deformation of 50%. A texture profile analysis (TPA) was performed on HTS samples.

2.12. Microstructure

Fillets were cut into blocks (3 mm × 3 mm × 1 mm) and fixed with 2.5% glutaraldehyde for 12 h. Then, the blocks were washed with 10× PBS buffer solution for three times and dehydrated by a series of concentrations of ethanol between 30% and 100%. Constantly, isoamyl acetate was added to the above samples to replace the water and lyophilizated. The microstructure of samples was detected with scanning electron microscope (SEM) analyzer (S3400, Hitachi, Tokyo, Japan) based on the gold-coating treatment.

2.13. Sensory Attributes

Sensory analysis of HTS fillets samples was carried out with the method reported by Miranda et al. [19]. Ten experienced judges (4 men and 6 women between 22 and 40 years old) received special training on the cold storage fish samples, focusing on the evaluation of color, odor, tissue morphology, elasticity, and mucus. The different descriptors were evaluated on a scale from 5.0 (stage of highest quality) to 1.0 (stage of lowest quality). At each sampling time, fish samples were coded by three-digit random numbers, presented to the panelists in individual trays in a randomized order, and scored individually. Results were expressed as average values of the different descriptors considered.

2.14. Statistical Analysis

Experimental data were analyzed using SPSS 19.0 (IBM Corporation, Armonk, NY, USA). The one-way ANOVA procedure followed by Duncan’s multiple range tests was adopted to determine the significant difference (p < 0.05) between treatment means, and the results were expressed as means ± SD of three independent experiments.

3. Results and Discussions

The objective of the present study was to assess the effect of chitosan-based coating containing 30 mg/L RA and different concentrations of ε-PL on the quality improvement of HTS fillets. Three independent experiments of every quality parameter were performed to ensure the accuracy of the results. The changes of quality parameters are listed in the following section.

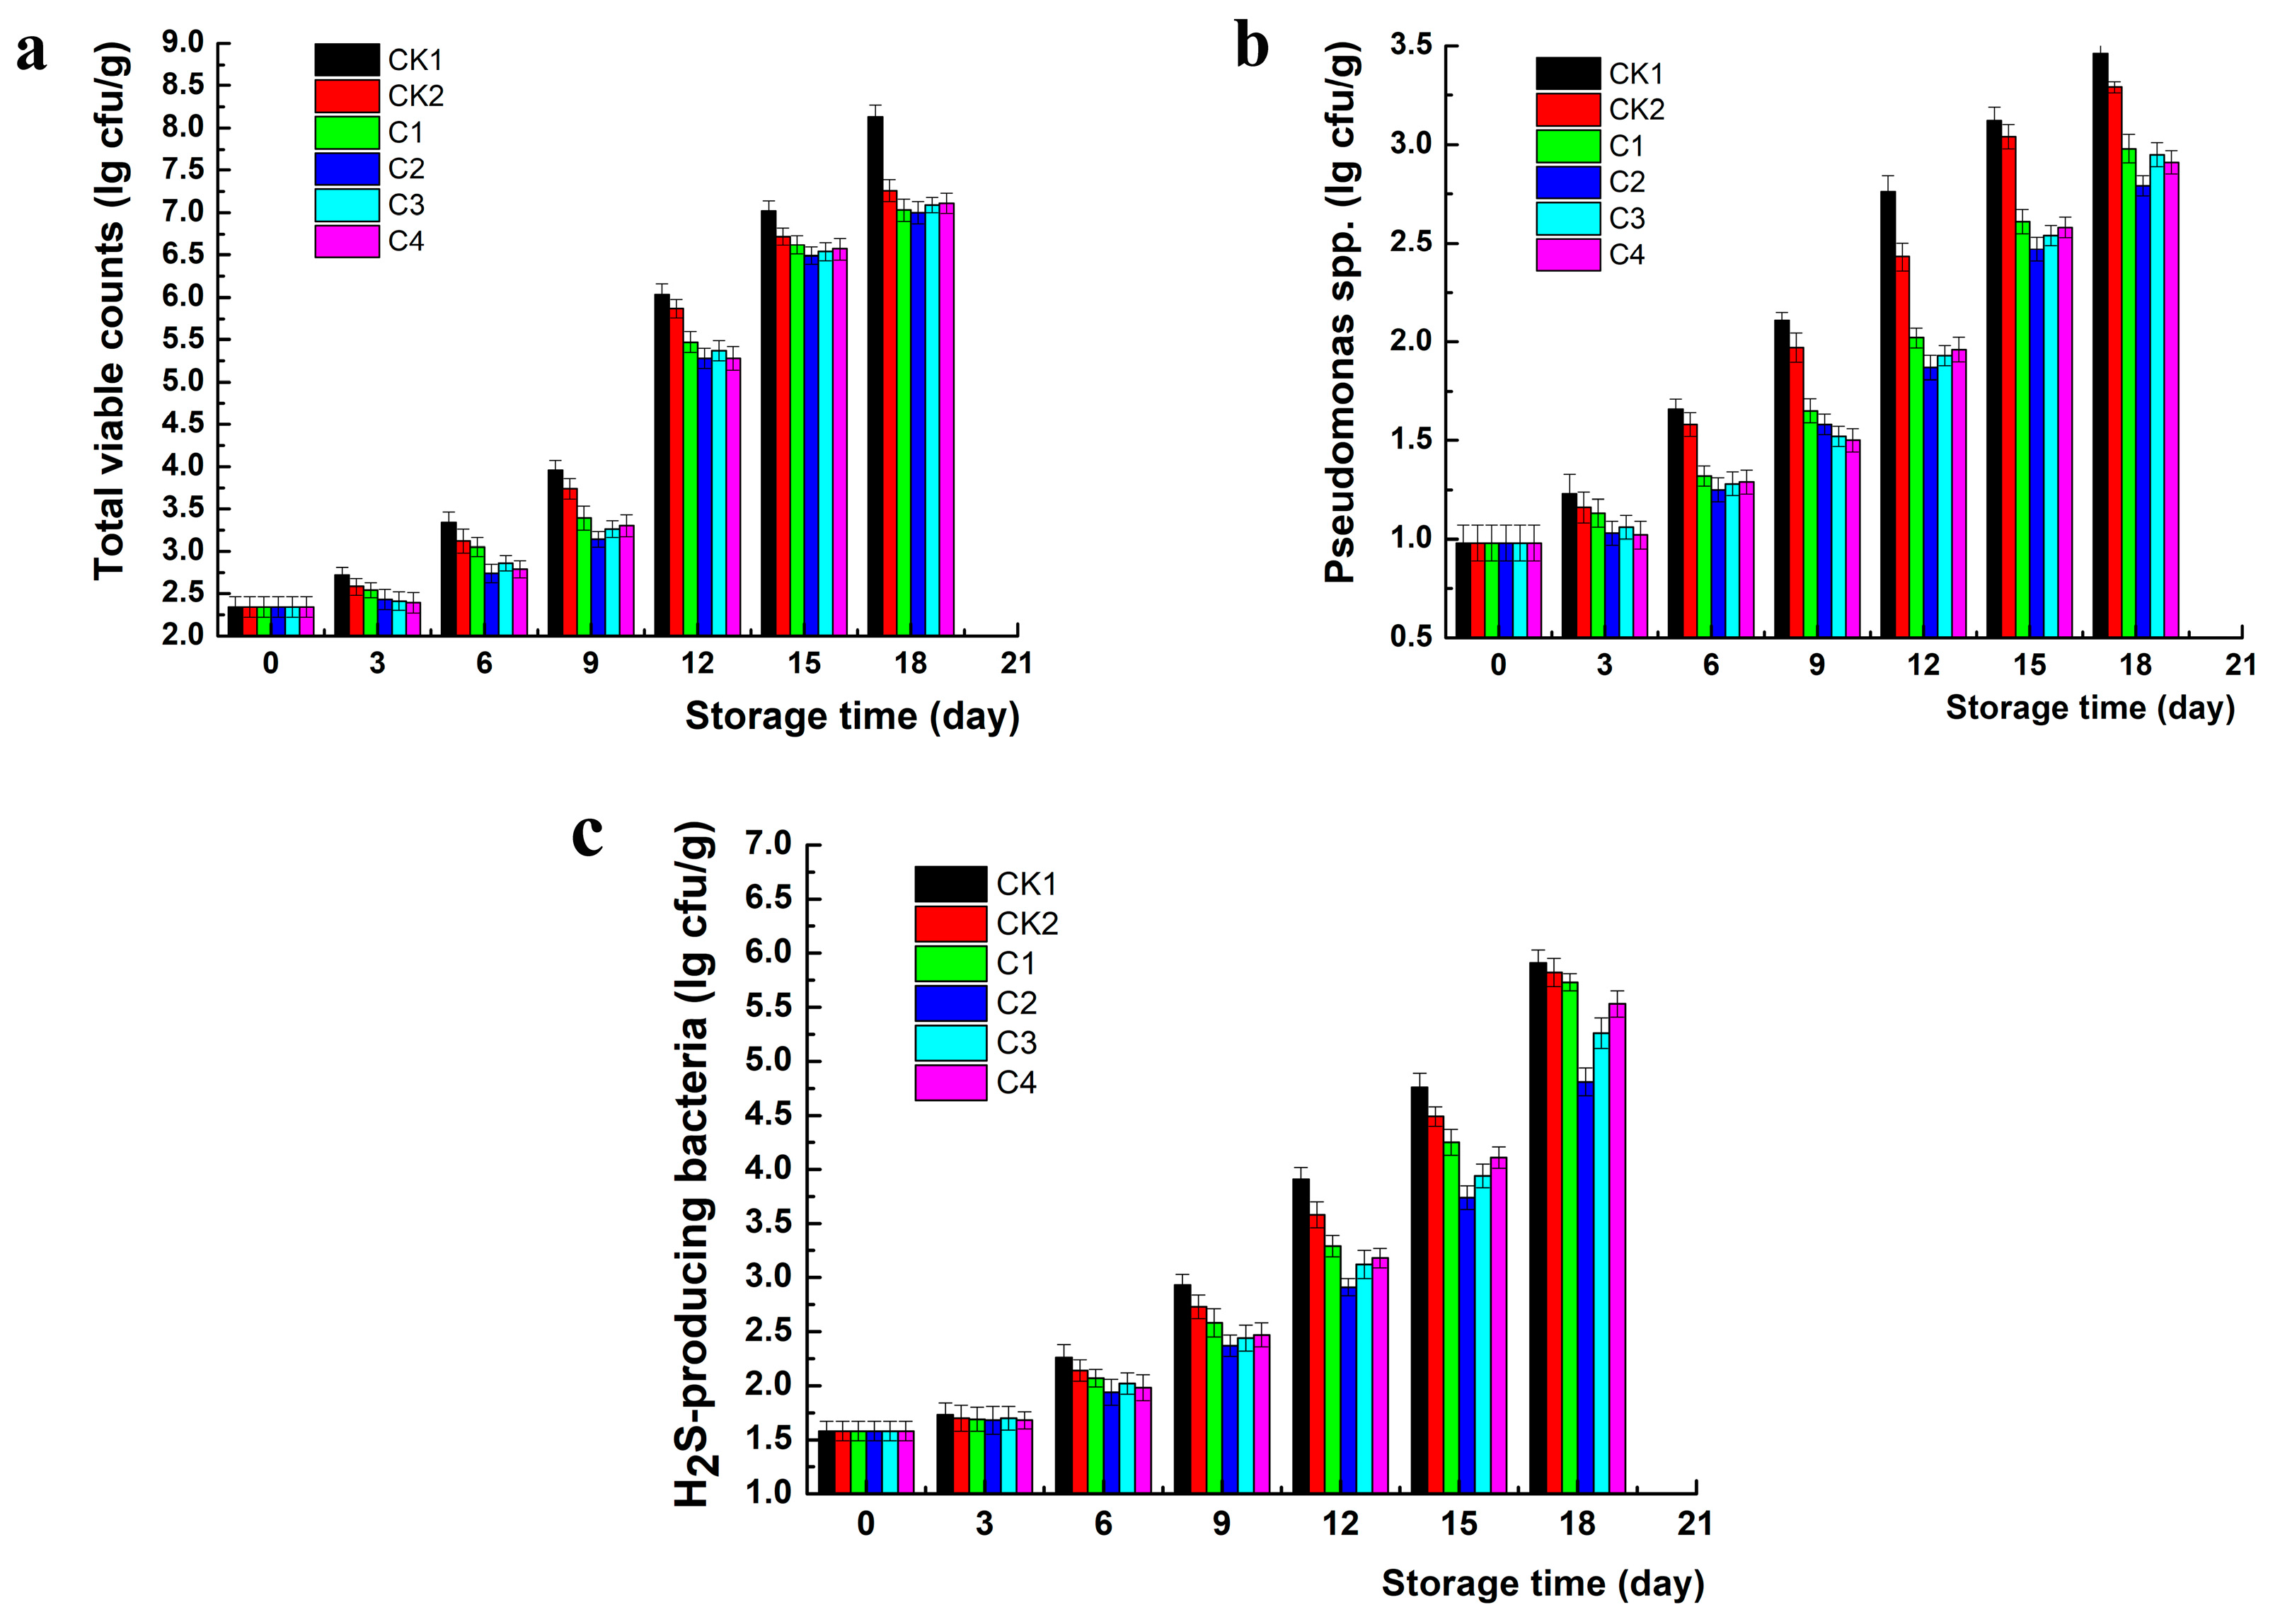
3.1. Microbiological Results

Figure 1 shows the data corresponding to the growth of TVC, Pseudomonas spp., and H2S-producing bacteria of HTS fillets during refrigerated storage. The initial TVC was 2.34 log10 CFU/g, indicating quite a good quality of the fresh HTS fillets considering the proposed upper limit for aerobic plate count of 5 × 10⁵ CFU/g for fresh fish [20]. The microbial count increased during storage and the mesophile number of the C2 sample was significantly lower than others at any of the storage time points (Figure 1a). At day 18, CK1 and CK2 had to be removed due to reaching the maximum limit allowed of 7.0 log CFU/g. Silvia et al. [21] demonstrated that RA had a poor antibacterial activity on retarding growth of gram-negative bacteria, and similar results are also shown in the current experiment regarding the increase of Pseudomonas spp. and H2S-producing bacteria. The growth pattern for Pseudomonas spp. (Figure 1b) was similar to that of TVC, suggesting that aerobic spoilage bacteria dominated the HTS fillets storage. An initial count of H2S-producing bacteria in HTS fillets was approximately 1.6 log CFU/g and no significant differences were observed during the first six days (p > 0.05) in all samples (Figure 1c). At the end of storage, samples treated with ε-PL and RA presented lower counts between 4.81–5.73 log CFU/g. ε-PL could suppress the growth of gram-negative bacteria in HTS fillets ascribed to its ability to interact with the microbial cell surface, strip the outer membrane, and cause abnormal distribution of the cytoplasm [7].

3.2. Chemical Results in HTS Fillets

TMA basically originates from trimethylamine oxide based on the breakdown of bacterial community as well as enzymatic autolysis, which is the primary substance that contributes to the ‘fishy’ off-odor in aquatic products [22]. HTS fillets samples dipped in chitosan-based coating evidenced an obvious inhibitory effect on TMA formation (Figure 2a). The initial TMA value of 0.15 mg N/100 g increased to 10.5 and 9.18 mg N/100 g in CK1 and CK2 samples on final day 18, respectively. However, the treated HTS samples resulted in significantly lower (p < 0.05) values of 2.25, 1.50, 1.51, and 1.53 mg N/100 g for C1, C2, C3, and C4 after 18 days storage, respectively. The use of chitosan-based coating combined with ε-PL and RA led to a sharp reduction in the TMA formation in the HTS fillets. According to El-Obeid et al., a TMA value of 10 mg N/100 g has been used as a limit value of fish freshness [23]. Based on our research (in all treated samples, day 15), a TMA value of 5 mg N/100 g could be considered as an indication of HTS fillets spoilage initiation, and such value in our study corresponded to the microbiological TVC limit value of 7 log CFU/g at day 15 (Figure 1a). The TMA formation was mainly caused by spoilage organisms in HTS fillets, such as Pseudomonas spp. and H2S-producing bacteria. The lower TMA values in treated samples could be the result of bacterial inhibition by chitosan-based coatings containing ε-PL and RA.
Notable TVB-N formation was also determined in HTS fillets under study (Figure 2b). This increase was especially apparent in CK1 and CK2. High TVB-N values in aquatic products during storage demonstrate that nitrogenous materials accumulated from the degradation, operated by proteolytic bacteria of nitrogenous-containing molecules, such as proteins and nucleic acids [24]. ε-PL and RA significantly reduced the formation of TVB-N compared to CK1 and CK2 samples. TVB-N values slowly increased from an initial value of about 10 mg N/100 g of HTS fillets at day 0 to 31.52 and 30.03 mg N/100 g at day 18 for CK1 and CK2 samples, respectively; however, the treated samples (C1, C2, C3, and C4) reached 18.13, 15.26, 14.91, and 13.14 mg N/100 g, respectively. These treated HTS fillets values are below the rejection limit of TVB-N content (30 mg N/100 g) for marine fish.
Changes in IMP, Hx, and K values of HTS fillets samples are shown in Figure 2c–e. IMP provides a sweet and meaty flavor that contributes to enhancing fish quality, whereas its conversion in Hx is responsible for unpleasant bitterness [25]. The IMP concentrations increased first and then decreased with storage time in all samples (Figure 2c). The concentrations of IMP in the CK1, CK2, C1, C2, C3, and C4 samples were at a maximum level at day 3 with values of 8.53, 8.29, 8.17, 7.83, 7.94, and 8.01 mmol/kg, respectively. After 12 days, the IMP concentrations decreased sharply in all the samples, however the IMP concentrations in the treated samples were significantly higher than that of control samples (p < 0.05) during storage, which indicated that chitosan-based coating containing ε-PL and RA inhibited the further degradation of IMP due to controlling the growth of spoilage organism and preventing the secretion of microbial enzymes. The Hx concentration at day 0 was 0.18 mmol/kg, and it increased during storage because of IMP degradation (Figure 2d). The control samples showed significantly higher (p < 0.05) Hx concentration than that of the treated samples except C1 during storage, which indicated that 0.05% (w/v) ε-PL addition might not effectively inhibit the secretion of autolytic enzymes. At the end of the storage, CK1, CK2, and C1 samples were characterized by similar values (around 3.98–4.67 mmol/kg); C2, C3, and C4 showed a significant lower value (p < 0.05) (around 1.36–1.58 mmol/kg). As for K values, the rejection limit of K value is commonly regarded as 60%, as the fish muscle shall lose the possibility of edibility and acceptance once the K value surpasses the limit point [26]. As shown in Figure 2e, the K value was 11.21% in fresh HTS fillets and K-values of all samples increased during storage, however the usage of chitosan-based coating significantly delayed the K-values increase, which had an analogous trend with the TMA and TVB-N. CK1 and CK2 surpassed the maximum permissible level at day 12 and C2, C3, and C4 were still under the rejection levels of the K-value at day 18.
Thiobarbituric acid test measured the malondialdehyde (MDA) content that can be used to determine the rate of lipid oxidation [27]. As recorded in Figure 2f, the initial MDA value of HTS fillets was 0.83 nmol/mgprot and increased gradually in all samples during the first 12 days. Thereafter, there were slight decreases, with the highest value (3.77 nmol/mgprot) in CK1 group at day 12. The TBA value at day 0 for the HTS fillets was 0.45 mg MDA kg−1. Subsequently, the TBA values of all samples showed upward trends during the first 12 days and then slightly decreased due to the reaction of MDA with aldehydes and ketones [28]. The highest TBA value was 3.77 mg MDA kg−1 in CK1 samples, while the TBA values for C1, C2, C3, and C4 were 0.64, 0.65, 0.62, and 0.61 mg MDA kg−1, respectively, which may be due to the chitosan-based coating barrier against oxygen penetration and RA acting as an antioxidant, resulting in delayed lipid oxidation [29].
FAAs are responsible for flavor development and can be precursors of aromatic components. The most abundant FAA in HTS fillets was arginine, followed by glycine and proline, which accounted for 36.33–54.41% of total FAAs (Table 2). As a flavor-detracting amino acid, lysine of CK1 increased from initial value of 14.6 mg/100 g to 51.21 mg/100 g at day 18, while the content in CK2, C1, C2, C3, and C4 was 41.99, 36.67, 22.88, 28.57, and 28.17 mg/100 g at the corresponding storage time, respectively. Similar change properties were found in histidine, which was basically caused by the oxidation process from trimethylamine oxide based on the growth of spoilage organism and was consistent with results of TMA-N value. Aspartic acid, proline acid, and cysteine showed upward trends at the early storage and, afterwards, gradually decreased. Alanine and glycine progressively decreased during storage, which was owing to the positive enhancing effects of desired tastes [30]. For threonine and glutamic acid, no matter what treatments were applied for HTS fillets, no significant differences were observed among treated samples. The decrease of special flavor-enhancing amino acids and accumulation of flavor-detracting amino acids could lead to the flavor deterioration, and the coating could effectively slow down the process and maintain the quality of HTS fillets.

3.3. Volatile Compounds (VOCs)

There were seven alcohols, six aldehydes and six ketones observed in HTS fillets samples during storage, without taking into account aromatic compounds, hydrocarbons, and amines compositions. For the fresh HTS fillets (day 0), some aldehyde compounds characterized the fresh fish flavor as their flavor thresholds are lower compared to alcohols and ketones compounds (Table 3). The most abundant VOCs were ethanol and benzaldehyde isolated from HTS fillets. Ethanol, 2-decanol, benzaldehyde, 2-methylbutanal, and 2-octanone showed tendencies to decrease gradually. Conversely, 1-octen-3-ol, 1-penten-3-ol, 3-methyl-butanal, hexanal, propanal, octanal, 2-nonanone, 2-pentanone, 3-octanone, 2-heptanone, and 2,3-pentanedione showed upward trends of HTS fillets in all samples during storage. The accumulation of 3-pentanone was due to the metabolites produced by spoilage microorganisms, and chemical reactions could be further metabolized [19]. Benzaldehyde was derived from the degradation of amino acid and has a desirable effect on fish odor owing to its pleasant stone fruit and almond nutty aroma, and a higher percentage of benzaldehyde could be identified at the beginning [31]. 1-Octen-3-ol was usually derived from the oxidation of 12-hydroperoxy arachidonic acid, which was basically perceived as off-flavor due to the low odor threshold and usually classified as an oxidative spoilage marker [32]. The accumulation of propanal could be due to the increase of 16-hydroperoxide formed by autoxidation of methyl linolenate and 15-hydroperoxide from auto-oxidation of methyl linolenate [19]. The high levels of hexanal could be closely associated with oxidation of linoleic acid. VOCs generated from the process of lipid auto-oxidation are generally recognized as one of the leading causes of quality deterioration in aquatic products [33]. Furthermore, the treated HTS fillets (C1, C2, C3, and C4) showed lower increases compared to CK1 and CK2 at the same storage time. Obviously, the relative contents of 1-octen-3-ol, 1-penten-3-ol, benzyl alcohol, phenylethyl alcohol, propanal, octanal, 2-nonanone, 2-pentanone, 3-pentanone, 3-octanone, 2-heptanone, and 2,3-pentanedione in CK1 and CK2 were higher than that of the treated HTS fillets, and some of them had putrid odors above certain concentrations, such as octanal and 1-octen-3-ol, having grassy or mushroom-like odors [4]. A low number of off-odor compounds in treated HTS fillets samples could be attributed to the inhibition of lipid oxidation and microbial growth by ε-PL and RA protective coatings [34,35].

3.4. Texture Profile Analysis

Texture changes in postmortem fish muscle are always ascribed to the modifications of myofibrillar proteins caused by protease action and other physicochemical factors [36]. The hardness, springiness, adhesiveness, and cohesiveness were used to evaluate the texture profile of HTS fillets samples (Figure 3). The hardness, springiness, and cohesiveness of CK1 significantly (p < 0.05) decreased by 73.93%, 50.02%, and 77.36%, respectively. Interestingly, the corresponding values of C1, C2, C3, and C4 declined by 43.19–62.48%, 44.12–54.41%, and 43.4–54.72%, respectively, suggesting that the addition of ε-PL and RA could prevent HTS fillets texture becoming loose during cold storage. Texture deterioration were tightly related to the disintegration and degradation of myofibrillar proteins based on the decrease of endogenous proteolytic activity, and then softening occurred during post-mortem, affecting the organoleptic acceptability of consumers [37,38]. As discussed above, chitosan-based coating with ε-PL and RA might enhance the cross-link network of protein-water through improved hydratability, keeping the HTS fillets’ texture.

3.5. Water Distribution by LF NMR Analysis

LF-NMR has been perceived as an efficient technique to evaluate the freshness of fish, and MRI is also a complementary technology for understanding water migration [39]. In the present study, the shortest relaxation time T21 representing the bound water varied, ranging from 0.79% to 1.01% during storage (Table 4), which was due to the water entrapped within highly organized myofibril structures [40]. T22 with intermediate population of relaxation time was considered as immobile water within the myofibril and diminished progressively during storage (p < 0.05). The shortest relaxation time T23 representing free water increased constantly, which indicted that water located within myofibrillar macromolecules was released or translated to free water based on the destruction of muscle fiber [41]. Besides, this process of water migration was also well reflected in the phenomenon of chitosan-based coating retarding the changes of T22 and T23. The T2 proton density weighted images of all the samples are shown in Figure 4. It concluded that no significant difference was detected in image brightness of samples of different treatments in the early storage. From the ninth day, the initial red color presented a tendency towards the blue color. Furthermore, the color of treated HTS fillets was brighter than that of CK1 and CK2, which suggested that the degradation of myofibill and destruction of microstructure was suppressed by the synergistic effect of ε-PL and RA, corresponding to the conclusions of LF-NMR results.

3.6. Morphology Change

Figure 5 CK1–C4 demonstrate the morphology variations in muscle tissues of the HTS fillets at day 18 stored at 4 °C. The myofibril could be seen clearly in fresh fillets with rod-like structure caused by the reduction of water-holding capacity of fish fillets. The destruction level of microstructure in treated samples were lower than that of CK1 and CK2 at the same storage time, indicating chitosan-based coating containing ε-PL and RA has a better performance in preserving the integrity of myofibril in the fillets, probably owing to the deterioration and degradation of myofibrillar proteins. Previous literature depicted that reduced mechanical restraint of fiber nets caused the immobilized water loss and brought about the conversion of secondary structure by decreasing the force of hydrogen bonds [36]. The disordered arrangement of myofibril enhanced during storage was consistent with the results of LF-NMR parameter.

3.7. Sensory Evaluation

Figure 5 (CK1)–(C4) displays the results of sensory evaluation results for the HTS fillets including color, odor, tissue morphology, elasticity, and mucus, and the appearance of the HTS fillets stored after 12 days are displayed in Figure 5 <CK1>–<C4>. At day 0, all samples had the highest sensory scores, indicating they were fresh and of excellent quality. The sensory scores of all HTS fillets samples declined gradually with storage. However, the results showed that the treated HTS fillets (C1, C2, C3, and C4) had significant higher sensory scores than that of the controls (CK1 and CK2) (p < 0.05). In addition, C4 treated with higher level of ε-PL (0.20% (w/v)) consistently demonstrated better sensory qualities. Considering different ε-PL additions, their efficiencies for shelf-life extension were quite comparable. In the present research, the sensory score of CK1 and CK2 were close to the threshold of sensory rejection (score of 3.0) after six and nine days of storage, respectively. However, the treated samples were on the verge of unacceptability after 12 days. Sensory deterioration was caused oxidation reactions and microbial spoilage which produced off-odor compounds, such as TVB-N, TMA, hypoxanthine, and aldehydes. Higher sensory scores in the treated samples compared with CK1 and CK2 indicated that chitosan-based coatings containing ε-PL and RA could contribute to maintain the sensory quality in HTS fillets samples because of antioxidant, antimicrobial, and gas barrier effects of the coatings.

4. Conclusions

The chitosan-based coating containing 0.05%, 0.10%, 0.15%, or 0.20% ε-PL and 30mg/L RA treated HTS fillets showed a potential in slowing down the rate of HTS fillets spoilage. In comparison with the controls (CK1 and CK2), these treated HTS fillets exhibited better effects on reducing the weight loss and cooking loss, suppressing the growth of microbial community, retarding protein degradation, and keeping excellent sensory attributes as well as flavor properties during refrigerated storage. The 0.1%, 0.15%, or 0.2% ε-PL additions had similar effects in slowing down HTS fillets spoilage. Therefore, chitosan-based coating containing 0.1% ε-PL and 30mg/L RA can be utilized as a safe preservation method for extending the shelf life of chilled HTS fillets by considerations of economy and the principle of using as little food additive as possible.

Author Contributions

Data Curation, N.L. and J.M.; Formal Analysis, N.L., J.M., and W.L.; Funding Acquisition, J.X.; Investigation, N.L., Y.S., and J.X.; Methodology, N.L., J.M., W.L., and Y.S.; Project Administration, J.X.

Funding

This research was funded by Marine Fish Industry system of the Ministry of Agriculture of China (CARS-47), NSFC (31601414), National Key Research and Development Program (2016YFD0400106), Doctoral Start-Up Fund from SHOU (A2-2006-00-200310), Training Project for Young Teachers from SMEC (A1-2801-18-30020119) and Construction Project of Public Service Platform for Shanghai Municipal Science and Technology Commission (17DZ2293400).

Acknowledgments

The authors would like to express their profound gratitude to Weiqiang Qiu from Instrumental Analysis Center of Shanghai Ocean University for his technical assistance.

Conflicts of Interest

The authors declare no conflict of interest.

References

  1. Wang, Y.Z.; Sun, J.F.; Lv, A.J.; Zhang, S.L.; Sung, Y.Y.; Shi, H.Y.; Hu, X.C.; Chen, S.J.; Xing, K.Z. Histochemical distribution of four types of enzymes and mucous cells in the gastrointestinal tract of reared half-smooth tongue sole Cynoglossus semilaevis. J. Fish Biol. 2018, 92, 3–16. [Google Scholar] [CrossRef]
  2. Yu, D.; Xu, Y.; Regenstein, J.M.; Xia, W.; Fang, Y.; Jiang, Q.; Wang, B. The effects of edible chitosan-based coatings on flavor quality of raw grass carp (Ctenopharyngodon idellus) fillets during refrigerated storage. Food Chem. 2018, 242, 412–420. [Google Scholar] [CrossRef] [PubMed]
  3. Na, S.; Kim, J.H.; Jang, H.J.; Park, H.J.; Oh, S.W. Shelf life extension of Pacific white shrimp (Litopenaeus vannamei) using chitosan and ε-polylysine during cold storage. Int. J. Biol. Macromol. 2018, 115, 1103–1108. [Google Scholar] [CrossRef] [PubMed]
  4. Ge, L.; Zhu, M.; Li, X.; Xu, Y.; Ma, X.; Shi, R.; Li, D.; Mu, C. Development of active rosmarinic acid-gelatin biodegradable films with antioxidant and long-term antibacterial activities. Food Hydrocoll. 2018, 83, 308–316. [Google Scholar] [CrossRef]
  5. Caleja, C.; Barros, L.; Barreira, J.C.M.; Ciric, A.; Sokovic, M.; Calhelha, R.C.; Beatriz, M.; Oliveira, P.P.; Ferreira, I.C.F.R. Suitability of lemon balm (Melissa officinalis L.) extract rich in rosmarinic acid as a potential enhancer of functional properties in cupcakes. Food Chem. 2018, 250, 67–74. [Google Scholar] [CrossRef] [PubMed]
  6. Mizielińska, M.; Kowalska, U.; Jarosz, M.; Sumińska, P. A comparison of the effects of packaging containing nano ZnO or polylysine on the microbial purity and texture of cod (Gadus morhua) fillets. Nanomaterials 2018, 8, 158. [Google Scholar] [CrossRef] [PubMed]
  7. Tan, Z.; Bo, T.; Guo, F.; Cui, J.; Jia, S. Effects of epsilon-Poly-l-lysine on the cell wall of Saccharomyces cerevisiae and its involved antimicrobial mechanism. Int. J. Biol. Macromol. 2018, 118, 2230–2236. [Google Scholar] [CrossRef]
  8. Cai, L.; Cao, A.; Bai, F.; Li, J. Effect of ε-polylysine in combination with alginate coating treatment on physicochemical and microbial characteristics of Japanese sea bass (Lateolabrax japonicas) during refrigerated storage. LWT-Food Sci. Technol. 2015, 62, 1053–1059. [Google Scholar] [CrossRef]
  9. Liu, X.; Li, D.; Li, K.; Luo, Y. Monitoring bacterial communities in ε-Polylysine-treated bighead carp (Aristichthys nobilis) fillets using culture-dependent and culture-independent techniques. Food Microbiol. 2018, 76, 257–266. [Google Scholar] [CrossRef]
  10. Socaciu, M.I.; Semeniuc, C.; Vodnar, D. Edible films and coatings for fresh fish packaging: Focus on quality changes and shelf-life extension. Coatings 2016, 8, 366. [Google Scholar] [CrossRef]
  11. Na, L.; Yong, S.; Liu, W.; Mei, J.; Jing, X. Low-field NMR and MRI to analyze the effect of edible coating incorporated with map on qualities of half-smooth tongue sole (Cynoglossus semilaevis Günther) fillets during refrigerated storage. Appl. Sci. 2018, 8, 1391. [Google Scholar] [CrossRef]
  12. Guan, W.; Ren, X.; Li, Y.; Mao, L. The beneficial effects of grape seed, sage and oregano extracts on the quality and volatile flavor component of hairtail fish balls during cold storage at 4 °C. LWT-Food Sci. Technol. 2019, 101, 25–31. [Google Scholar] [CrossRef]
  13. Choulitoudi, E.; Bravou, K.; Bimpilas, A.; Tsironi, T.; Tsimogiannis, D.; Taoukis, P.; Oreopoulou, V. Antimicrobial and antioxidant activity of Satureja thymbra in gilthead seabream fillets edible coating. Food Bioprod. Process. 2016, 100, 570–577. [Google Scholar] [CrossRef]
  14. Shibata, M.; Elmasry, G.; Moriya, K.; Rahman, M.M.; Miyamoto, Y.; Ito, K.; Nakazawa, N.; Nakauchi, S.; Okazaki, E. Smart technique for accurate monitoring of ATP content in frozen fish fillets using fluorescence fingerprint. LWT-Food Sci. Technol. 2018, 92, 258–264. [Google Scholar] [CrossRef]
  15. Sun, X.H.; Xiao, L.; Lan, W.Q.; Liu, S.C.; Wang, Q.; Yang, X.H.; Zhang, W.J.; Xie, J. Effects of temperature fluctuation on quality changes of large yellow croaker (Pseudosciaena crocea) with ice storage during logistics process. J. Food Process. Preserv. 2017, 4, e13505. [Google Scholar] [CrossRef]
  16. Tavakoli, S.; Naseri, M.; Abedi, E.; Imani, A. Shelf-life enhancement of whole rainbow trout (Oncorhynchus mykiss) treated with Reshgak ice coverage. Food Sci. Nutr. 2018, 6, 953–961. [Google Scholar] [CrossRef]
  17. Li, N.; Mei, J.; Shen, Y.; Xie, J. Quality improvement of half-smooth tongue sole (Cynoglossus semilaevis) fillets by chitosan coatings containing rosmarinic acid during storage. CyTA J. Food 2018, 16, 1018–1029. [Google Scholar] [CrossRef]
  18. Rollini, M.; Nielsen, T.; Musatti, A.; Limbo, S.; Piergiovanni, L.; Hernandez Munoz, P.; Gavara, R. Antimicrobial performance of two different packaging materials on the microbiological quality of fresh salmon. Coatings 2016, 6, 6. [Google Scholar] [CrossRef]
  19. Miranda, J.M.; Carrera, M.; Barros-Velázquez, J.; Aubourg, S.P. Impact of previous active dipping in Fucus spiralis extract on the quality enhancement of chilled lean fish. Food Control 2018, 90, 407–414. [Google Scholar] [CrossRef]
  20. Zhu, Y.; Ma, L.; Yang, H.; Xiao, Y.; Xiong, Y.L. Super-chilling (−0.7 °C) with high-CO2 packaging inhibits biochemical changes of microbial origin in catfish (Clarias gariepinus) muscle during storage. Food Chem. 2016, 206, 182–190. [Google Scholar] [CrossRef]
  21. Silvia, M.; Tamara, S.; Romano, C.S.; Vojnov, A.A. Antioxidant and antimicrobial activities of rosemary extracts linked to their polyphenol composition. Free Radic. Res. 2006, 40, 223–231. [Google Scholar]
  22. Günlü, A.; Koyun, E. Effects of vacuum packaging and wrapping with chitosan-based edible film on the extension of the shelf life of sea bass (Dicentrarchus labrax) fillets in cold storage (4 °C). Food Bioprocess Technol. 2013, 6, 1713–1719. [Google Scholar] [CrossRef]
  23. El-Obeid, T.; Yehia, H.M.; Sakkas, H.; Lambrianidi, L.; Tsiraki, M.I.; Savvaidis, I.N. Shelf-life of smoked eel fillets treated with chitosan or thyme oil. Int. J. Biol. Macromol. 2018, 114, 578–583. [Google Scholar] [CrossRef] [PubMed]
  24. Volpe, M.G.; Siano, F.; Paolucci, M.; Sacco, A.; Sorrentino, A.; Malinconico, M.; Varricchio, E. Active edible coating effectiveness in shelf-life enhancement of trout (Oncorhynchus mykiss) fillets. LWT-Food Sci. Technol. 2015, 60, 615–622. [Google Scholar] [CrossRef]
  25. Vilas, C.; Alonso, A.A.; Herrera, J.R.; Bernárdez, M.; García, M.R. A mathematical model to predict early quality attributes in hake during storage at low temperature. J. Food Eng. 2017, 222, 11–19. [Google Scholar] [CrossRef]
  26. Cheng, J.-H.; Sun, D.-W.; Qu, J.-H.; Pu, H.-B.; Zhang, X.-C.; Song, Z.; Chen, X.; Zhang, H. Developing a multispectral imaging for simultaneous prediction of freshness indicators during chemical spoilage of grass carp fish fillet. J. Food Eng. 2016, 182, 9–17. [Google Scholar] [CrossRef]
  27. Farshidi, M.; Yousefi, M.; Ehsani, A. The combined effects of lactoperoxidase system and whey protein coating on microbial, chemical, textural, and sensory quality of shrimp (Penaeus merguiensis) during cold storage (4 ± 1 °C). Food Sci. Nutr. 2018, 6, 1378–1386. [Google Scholar] [CrossRef] [PubMed]
  28. Da Silva, S.B.; Ferreira, D.; Pintado, M.; Sarmento, B. Chitosan-based nanoparticles for rosmarinic acid ocular delivery—In vitro tests. Int. J. Biol. Macromol. 2016, 84, 112–120. [Google Scholar] [CrossRef]
  29. Ojagh, S.M.; Rezaei, M.; Razavi, S.H.; Hosseini, S.M.H. Effect of chitosan coatings enriched with cinnamon oil on the quality of refrigerated rainbow trout. Food Chem. 2010, 120, 193–198. [Google Scholar] [CrossRef]
  30. Takahashi, M.; Hirose, N.; Ohno, S.; Arakaki, M.; Wada, K. Flavor characteristics and antioxidant capacities of hihatsumodoki (Piper retrofractum Vahl) fresh fruit at three edible maturity stages. J. Food Sci. Technol. 2018, 55, 1295–1305. [Google Scholar] [CrossRef]
  31. Li, Q.; Zhang, L.; Luo, Y. Changes in microbial communities and quality attributes of white muscle and dark muscle from common carp (Cyprinus carpio) during chilled and freeze-chilled storage. Food Microbiol. 2018, 73, 237–244. [Google Scholar] [CrossRef] [PubMed]
  32. Frankel, E.N. Formation of headspace volatiles by thermal decomposition of oxidized fish oilsvs. oxidized vegetable oils. J. Am. Oil Chem. Soc. 1993, 70, 767–772. [Google Scholar] [CrossRef]
  33. Iglesias, J.; Medina, I.; Bianchi, F.; Careri, M.; Mangia, A.; Musci, M. Study of the volatile compounds useful for the characterisation of fresh and frozen-thawed cultured gilthead sea bream fish by solid-phase microextraction gas chromatography–mass spectrometry. Food Chem. 2009, 115, 1473–1478. [Google Scholar] [CrossRef]
  34. Liu, J.; Xiao, J.; Li, F.; Shi, Y.; Li, D.; Huang, Q. Chitosan-sodium alginate nanoparticle as a delivery system for ε-polylysine: Preparation, characterization and antimicrobial activity. Food Control 2018, 91, 302–310. [Google Scholar] [CrossRef]
  35. Li, T.; Jiang, Y.; Jin, G.; Zhao, Q.; Li, J. Effects of fish-derived biological preservatives on cold storage of grass carp (Ctenopharyngodon idellus) fillets. J. Food Prot. 2016, 79, 1707–1716. [Google Scholar] [CrossRef]
  36. Mahto, R.; Ghosh, S.; Das, M.K.; Das, M. Effect of gamma irradiation and frozen storage on the quality of fresh water prawn (Macrobrachium rosenbergii) and tiger prawn (Penaeus monodon). LWT-Food Sci. Technol. 2015, 61, 573–582. [Google Scholar] [CrossRef]
  37. Chaparrohernández, S.; Ruízcruz, S.; Márquezríos, E.; Ocañohiguera, V.M.; Valenzuelalópez, C.C.; Ornelaspaz, J.D.J.; Torosánchez, C.L.D. Effect of chitosan-carvacrol edible coatings on the quality and shelf life of tilapia (Oreochromis niloticus) fillets stored in ice. Food Sci. Technol. 2015, 35, 734–741. [Google Scholar] [CrossRef]
  38. Wang, S.; Xiang, W.; Fan, H.; Xie, J.; Qian, Y.F. Study on the mobility of water and its correlation with the spoilage process of salmon (Salmo solar) stored at 0 and 4 °C by low-field nuclear magnetic resonance (LF NMR 1 H). J. Food Sci. Technol. 2018, 55, 173–182. [Google Scholar] [CrossRef]
  39. Reza, M.S.; Bapary, M.A.J.; Ahasan, C.T.; Islam, M.N.; Kamal, M. Shelf life of several marine fish species of Bangladesh during ice storage. Int. J. Food Sci. Technol. 2009, 44, 1485–1494. [Google Scholar] [CrossRef]
  40. Xia, T.; Zhao, X.; Yu, X.; Li, L.; Zhou, G.; Han, M.; Xu, X.-L. Negative impacts of in-vitro oxidative stress on the quality of heat-induced myofibrillar protein gelation during refrigeration. Int. J. Food Prop. 2018, 21, 2205–2217. [Google Scholar] [CrossRef]
  41. Xia, X.; Kong, B.; Liu, Q.; Liu, J. Physicochemical change and protein oxidation in porcine longissimus dorsi as influenced by different freeze-thaw cycles. Meat Sci. 2009, 83, 239–245. [Google Scholar] [CrossRef] [PubMed]
Figure 1. Changes in total viable bacteria (a), Pseudomonas spp. (b), and H2S-producing bacteria (c) of half-smooth tongue sole fillets during refrigerated storage (CK1: Chitosan coating without rosmarinic acid or ε-PL; CK2: Chitosan coating with 30 mg/kg rosmarinic acid; C1/C2/C3/C4: chitosan coating with 30 mg/kg rosmarinic acid and 0.05%/0.10%/0.15%/0.20% ε-PL).
Coatings 09 00273 g001
Figure 2. Changes in trimethylamine (TMA, a), total volatile basic nitrogen values (TVB-N, b), inosine 5′-monophosphate (IMP, c), hypoxanthine (Hx, d), K value (e), and Thiobarbituric acid (TBA, f) of half-smooth tongue sole fillets during refrigerated storage (CK1: Chitosan coating without rosmarinic acid or ε-PL; CK2: Chitosan coating with 30 mg/kg rosmarinic acid; C1/C2/C3/C4: Chitosan coating with 30 mg/kg rosmarinic acid and 0.05%/0.10%/0.15%/0.20% ε-PL).
Coatings 09 00273 g002
Figure 3. Changes in hardness (a), springiness (b), adhesiveness (c), and cohesiveness (d) of half-smooth tongue sole fillets during refrigerated storage (CK1: Chitosan coating without rosmarinic acid or ε-PL; CK2: Chitosan coating with 30 mg/kg rosmarinic acid; C1/C2/C3/C4: Chitosan coating with 30 mg/kg rosmarinic acid and 0.05%/0.10%/0.15%/0.20% ε-PL).
Coatings 09 00273 g003
Figure 4. Changes in magnetic resonance imaging (MRI) of half-smooth tongue sole fillets during refrigerated storage (CK1: Chitosan coating without rosmarinic acid or ε-PL; CK2: Chitosan coating with 30 mg/kg rosmarinic acid; C1/C2/C3/C4: Chitosan coating with 30 mg/kg rosmarinic acid and 0.05%/0.10%/0.15%/0.20% ε-PL).
Coatings 09 00273 g004
Figure 5. Changes in microstructure (CK1–C4), sensory evaluation results ((CK1)–(C4)), and appearance (<CK1>–<C4>) of half-smooth tongue sole fillets during refrigerated storage (CK1: Chitosan coating without rosmarinic acid or ε-PL; CK2: Chitosan coating with 30 mg/kg rosmarinic acid; C1/C2/C3/C4: Chitosan coating with 30 mg/kg rosmarinic acid and 0.05%/0.10%/0.15%/0.20% ε-PL).
Coatings 09 00273 g005
Table 1. The final concentrations of chitosan, rosmarinic acid (RA), and ε-polylysine (ε-PL) in coating solutions.
Codes for Coating TreatmentsChitosan (w/v)RA (w/v)ε-PL (w/v)
CK11%
CK21%30 mg/L
C11%30 mg/L0.05
C21%30 mg/L0.10
C31%30 mg/L0.15
C41%30 mg/L0.20
CK1: Chitosan coating without rosmarinic acid or ε-PL; CK2: Chitosan coating with 30 mg/kg rosmarinic acid; C1/C2/C3/C4: Chitosan coating with 30 mg/kg rosmarinic acid and 0.05%/0.10%/0.15%/0.20% ε-PL.
Table 2. Changes in free amino acids (FAAs) content (mg/100 g) in different treated samples during refrigerated storage.
Storage TimeSamplesFAAs
AspThrSerGluGlyAlaValPro
Day 05.12 ± 0.3515.12 ± 0.3714.68 ± 0.373.21 ± 0.3291.32 ± 1.2450.17 ± 0.343.27 ± 0.2327.89 ± 0.31
Day 9CK18.02 ± 0.62ab19.46 ± 0.29ab10.17 ± 0.64cd5.84 ± 0.23c62.73 ± 0.83e32.73 ± 0.27c5.88 ± 0.24ab56.24 ± 0.48a
CK27.86 ± 0.46b19.78 ± 0.38a10.73 ± 0.32c5.39 ± 0.31cd66.38 ± 0.77d34.99 ± 0.34bc5.2 ± 0.13c53.26 ± 0.51b
C18.11 ± 0.38a17.83 ± 0.25c12.07 ± 0.31ab7.04 ± 0.25ab73.26 ± 0.78b36.56 ± 0.23b6.02 ± 0.24a48.92 ± 0.63c
C27.93 ± 0.41b17.23 ± 0.21cd12.34 ± 0.38a6.84 ± 0.64b84.88 ± 0.29a39.34 ± 0.3a5.92 ± 0.23ab46.27 ± 0.54cd
C37.99 ± 0.34b17.93 ± 0.32c12.02 ± 0.25ab6.25 ± 0.36bc79.02 ± 0.28ab38.44 ± 0.23ab4.94 ± 0.27cd41.54 ± 0.57de
C48.03 ± 0.27ab18.21 ± 0.3b11.89 ± 0.41b7.16 ± 0.23a70.56 ± 0.32c37.29 ± 0.28ab5.23 ± 0.17c43.93 ± 0.46d
Day 18CK13.69 ± 0.17d14.68 ± 0.27b4.82 ± 0.57de4.13 ± 0.18b29.47 ± 0.28e17.89 ± 0.23dbc4.79 ± 0.27bc26.62 ± 0.48cd
CK23.94 ± 0.32c14.93 ± 0.43ab5.33 ± 0.25d4.75 ± 0.22b35.49 ± 0.3d18.45 ± 0.24b5.03 ± 0.26ab27.14 ± 0.33cd
C14.67 ± 0.33b15.03 ± 0.31a6.02 ± 0.29c4.97 ± 0.37ab41.26 ± 0.27bc17.66 ± 0.24d5.17 ± 0.24a27.95 ± 0.34c
C25.03 ± 0.28a15.05 ± 0.24a8.43 ± 0.17a5.11 ± 0.32a49.47 ± 0.31a19.87 ± 0.36a4.93 ± 0.36b31.24 ± 0.31a
C34.93 ± 0.18ab14.84 ± 0.32ab8.15 ± 0.33b5.03 ± 0.19ab47.36 ± 0.24ab17.94 ± 0.31bc4.56 ± 0.34cd30.73 ± 0.27ab
C44.73 ± 0.24b14.94 ± 0.21ab8.32 ± 0.32ab4.93 ± 0.3ab43.83 ± 0.23b19.21 ± 0.27ab4.73 ± 0.29c28.67 ± 0.31b
IleLeuTyrLysHisArgCystotal
Day 08.02 ± 0.355.12 ± 0.2114.93 ± 0.2814.6 ± 0.9714.83 ± 0.4361.47 ± 0.722.32 ± 0.21332.07 ± 5.82
Day 9CK111.89 ± 0.33a6.27 ± 0.17ab20.56 ± 0.94a27.37 ± 0.37a21.47 ± 0.53a94.47 ± 0.58a15.03 ± 0.34a398.13 ± 5.37a
CK211.56 ± 0.29ab6.29 ± 0.25a22.11 ± 0.86ab25.68 ± 0.28b20.78 ± 0.39ab89.93 ± 0.97bc14.58 ± 0.36ab391.84 ± 4.93b
C111.14 ± 0.36b5.98 ± 0.27bc20.89 ± 0.23a21.93 ± 0.34c18.9 ± 0.12b90.43 ± 0.62b12.02 ± 0.33b391.1 ± 4.37b
C211.38 ± 0.23ab6.09 ± 0.32b23.67 ± 1.03b19.69 ± 0.24e18.14 ± 0.19bc75.92 ± 0.36d10.37 ± 0.26c386.01 ± 5.11c
C310.99 ± 0.37bc5.88 ± 0.3bc25.27 ± 0.78c20.11 ± 0.27cd17.98 ± 0.34bc73.68 ± 0.45de11.64 ± 0.23bc373.68 ± 4.87d
C411.07 ± 0.33bc5.93 ± 0.23bc24.99 ± 0.35b20.05 ± 0.37cd17.03 ± 0.28c78.11 ± 0.57c10.28 ± 0.19cd369.76 ± 5.03e
Day 18CK110.21 ± 0.37d6.54 ± 0.24a8.21 ± 0.57a51.21 ± 0.43a47.37 ± 0.32a45.05 ± 0.23c3.72 ± 0.13d278.4 ± 5.12f
CK211.34 ± 0.23ab5.78 ± 0.31cd10.31 ± 0.39b41.99 ± 0.52b42.76 ± 0.34b56.11 ± 0.34bc2.93 ± 0.21de286.28 ± 4.75d
C111.45 ± 0.33ab5.39 ± 0.33d9.34 ± 0.23ab36.67 ± 0.31c37.95 ± 0.28c55.98 ± 0.31bc5.62 ± 0.17c285.1 ± 4.83e
C211.12 ± 0.16b6.28 ± 0.48ab13.12 ± 0.56c22.88 ± 0.23e34.71 ± 0.3d60.21 ± 0.27a7.94 ± 0.31ab295.39 ± 5.14a
C310.76 ± 0.23c6.11 ± 0.26b14.28 ± 0.76cd28.57 ± 0.26d33.82 ± 0.29d57.47 ± 0.29b8.2 ± 0.27a292.75 ± 5.03b
C411.54 ± 0.33a5.88 ± 0.36c15.67 ± 0.37d28.17 ± 0.32d34.25 ± 0.25d56.38 ± 0.43bc7.98 ± 0.28ab289.23 ± 4.82c
Identification and semiquantification of main volatile compounds (μg/kg) identified in HTS fillets after 0, 9 and 18 days of cold storage. Different uppercase letters in same group from different day indicate a significant difference (p < 0.05). Different lowercase letters in different groups from same day indicate a significant difference (p < 0.05).
Table 3. Identification and semiquantification of main volatile compounds (μg/kg) identified in half-smooth tongue sole (HTS) fillets after 0, 9, and 18 days of cold storage.
Compounds0 d9 d18 d
CK1CK2C1C2C3C4CK1CK2C1C2C3C4
Alcohols
1-Octen-3-ol3.68 ± 0.23A7.85 ± 0.64a, B7.63 ± 0.57ab, B7.02 ± 0.46b, B6.93 ± 0.56bc, B6.76 ± 0.45c, B6.87 ± 0.55bc, B19.94 ± 1.53a, C18.58 ± 1.38b, C16.03 ± 1.29c, C12.76 ± 1.56de,C12.91 ± 1.14d, C13.17 ± 1.17d, C
1-Penten-3-ol12.17 ± 1.67A23.87 ± 2.23a, B21.65 ± 1.97b, B20.03 ± 2.03c, B18.93 ± 1.86d, B18.25 ± 1.08de, B18.56 ± 1.56d, B69.76 ± 2.18a, C65.82 ± 1.76b, C60.28 ± 3.21c, C52.36 ± 2.19d, C56.82 ± 3.28d, C59.67 ± 3.03cd, C
Ethanol187.97 ± 6.93A93.27 ± 2.41a, B107.83 ± 1.97b, B116.63 ± 5.23c, B132.11 ± 3.35e, B134.03 ± 3.16ef, B125.18 ± 2.76d, B32.17 ± 1.65a, C39.26 ± 1.93b, C45.16 ± 1.87c, C58.73 ± 1.68f, C49.76 ± 3.56d, C52.18 ± 1.95e, C
Benzyl alcoholND3.67 ± 0.47ANDNDNDNDND37.94 ± 1.38a, B31.89 ± 1.18b, B24.63 ± 1.24c, B11.13 ± 1.18f, B21.85 ± 2.06e, B23.67 ± 1.14cd, B
Phenylethyl AlcoholND2.16 ± 0.24 ANDNDNDNDND9.26 ± 0.42a, B8.89 ± 0.53b, B7.54 ± 0.64c, B1.97 ± 0.22f, B3.83 ± 0.74d, B3.25 ± 0.25e, B
1-Hexanol9.18 ± 0.64A17.83 ± 2.15a, B16.25 ± 1.16b, B15.11 ± 1.43c, B13.89 ± 1.28e, B15.03 ± 1.48cd, B14.78 ± 1.37d, B7.83 ± 1.26a, C8.57 ± 1.37b, C8.96 ± 1.45cd, C9.98 ± 1.34e, C9.21 ± 1.28d, C8.86 ± 1.24c, C
2-Decanol8.73 ± 1.24A6.23 ± 0.49a, B6.28 ± 0.38ab, B6.41 ± 0.18b, B7.84 ± 0.17d, B7.12 ± 0.38cd, B6.94 ± 0.32c, BNDNDND0.64 ± 0.18b, CND1.85 ± 0.24a, C
Aldehydes
Benzaldehyde69.07 ± 1.74A43.12 ± 1.54a, B48.88 ± 1.27b, B51.67 ± 1.38c, B54.58 ± 1.17f, B53.96 ± 2.98e, B52.12 ± 2.04cd, B14.28 ± 1.47a, C19.81 ± 1.37b, C25.98 ± 2.23c, C36.94 ± 1.28d, C31.84 ± 1.21de, C30.33 ± 1.98d, C
2-methylbutanal7.26 ± 1.12A3.47 ± 0.18a, B3.94 ± 0.32b, B4.28 ± 0.27c, B4.77 ± 0.68d, B4.68 ± 0.43e, B4.33 ± 0.37f, BNDNDND0.94 ± 0.08a, CNDND
3-methyl-Butanal11.53 ± 1.62A25.76 ± 1.94a, B22.95 ± 1.26b, B20.78 ± 1.01c, B16.97 ± 1.21f, B17.48 ± 1.46e, B19.37 ± 1.62cd, B67.92 ± 2.25a, C61.37 ± 1.82b, C56.59 ± 1.97cd, C53.94 ± 1.39d, C58.38 ± 1.89cd, C54.61 ± 1.26c, C
Hexanal3.87 ± 0.27A14.56 ± 1.62a, B13.93 ± 0.37b, B12.72 ± 0.78c, B11.37 ± 0.78d, B11.06 ± 0.76de, B10.96 ± 1.04e, B47.37 ± 0.89a, C45.12 ± 0.93b, C41.38 ± 1.13c, C40.63 ± 3.11cd, C40.23 ± 1.89cd, B52.78 ± 3.82d, C
Propanal1.72 ± 0.23A30.83 ± 0.46a, B26.69 ± 0.57b, B24.92 ± 0.37c, B19.83 ± 0.47e, B21.34 ± 0.27d, B20.73 ± 0.48de, B93.92 ± 2.57a, C85.23 ± 2.39b, C81.17 ± 2.86c, C54.89 ± 3.22f, C61.64 ± 2.89d, C64.98 ± 3.28e, C
Octanal2.54 ± 0.23A13.93 ± 1.11a, B12.84 ± 0.74b, B11.17 ± 1.31c, B9.95 ± 0.38e, B11.02 ± 1.23cd, B10.82 ± 0.63d, B38.16 ± 2.81a, C34.74 ± 2.18b, C29.93 ± 1.16c, C26.58 ± 1.16e, C27.98 ± 1.21d, C26.84 ± 1.12e, C
Ketones
2-NonanoneND3.64 ± 0.34a, A2.99 ± 0.29b, A2.67 ± 0.32c, A1.87 ± 0.29d, A1.84 ± 0.29d, A1.89 ± 0.31d, A23.54 ± 1.27a, B20.84 ± 0.89b, B18.26 ± 1.02c, B12.79 ± 0.79f, B14.82 ± 0.29e, B15.01 ± 0.14d, B
2-Pentanone9.74 ± 0.89A18.84 ± 1.19a, B18.21 ± 1.07b, B16.19 ± 1.18c, B12.33 ± 0.89e, B14.19 ± 0.74de, B14.67 ± 0.73d, B47.92 ± 3.28a, C43.37 ± 2.18b, C39.03 ± 2.19c, C31.03 ± 4.29f, C36.03 ± 1.92e, C37.47 ± 1.73d, C
3-PentanoneND20.11 ± 3.29a, B14.89 ± 1.67b, B7.38 ± 1.11c, BNDNDND48.94 ± 2.42a, C33.78 ± 3.19b, C18.03 ± 2.82c, CND4.89 ± 0.37d, C3.92 ± 0.28e, C
2-Octanone13.44 ± 1.02A5.83 ± 0.26a, B6.26 ± 0.57b, B6.93 ± 0.33c, B7.28 ± 0.38d, B7.02 ± 1.19cd, B6.99 ± 1.02c, B0.94 ± 0.05a, C1.12 ± 0.27b, C1.37 ± 0.35c, CNDNDND
3-OctanoneND1.64 ± 0.23a, A1.23 ± 0.27b, A0.87 ± 0.29c, ANDNDND23.22 ± 1.28a, B19.74 ± 1.14b, B15.84 ± 1.02c, B8.01 ± 0.92ef, B10.58 ± 0.83d, B8.95 ± 0.92e, B
2-Heptanone11.54 ± 1.25A40.93 ± 2.64a, B36.65 ± 2.18b, B28.55 ± 3.19c, B12.99 ± 1.82e, B13.27 ± 1.14d, B13.35 ± 1.28d, B97.49 ± 2.12a, C83.78 ± 3.29b, C66.45 ± 3.28c, C26.16 ± 1.29f, C37.84 ± 1.29e, C41.49 ± 1.92d, C
2,3-pentanedione17.58 ± 1.16A49.28 ± 1.29a, B43.75 ± 2.01b, B38.94 ± 1.26c, B35.56 ± 1.13e, B36.14 ± 3.17d, B38.23 ± 1.29cd, B125.27 ± 2.29a, B103.18 ± 1.07b, C97.21 ± 1.72c, C71.19 ± 1.29f, C86.18 ± 1.28e, C94.53 ± 1.18d, C
RI: Retention index; ND: Not detected. Different uppercase letters in same group from different day indicate a significant difference (p < 0.05). Different lowercase letters in different groups from same day indicate a significant difference (p < 0.05).
Table 4. Changes in water distribution of of different treated samples during refrigerated storage.
Percentage of T2iCK1CK2C1C2C3C4
T21
0 day0.82 ± 0.06A, a0.82 ± 0.06A, a0.82 ± 0.06A, a0.82 ± 0.02A, a0.82 ± 0.06A, a0.82 ± 0.06A, ab
60.93 ± 0.04A, b0.94 ± 0.04A, b0.93 ± 0.02A, b0.92 ± 0.08A, bc0.85 ± 0.05B, a0.85 ± 0.03B, ab
120.86 ± 0.07A, ab1.01 ± 0.03A, c0.92 ± 0.06A, c0.89 ± 0.05B, b0.93 ± 0.02B, b0.79 ± 0.02C, a
180.94 ± 0.02A, b0.97 ± 0.04A, bc0.99 ± 0.04A, c0.93 ± 0.09B, bc0.88 ± 0.04B, ab0.88 ± 0.04C, b
T22
0 day94.19 ± 0.23A, a94.19 ± 0.23A, a94.19 ± 0.23A, a94.19 ± 0.23A, a94.19 ± 0.23A, a94.19 ± 0.23A, a
686.81 ± 0.29B, a88.02 ± 0.24B, ab90.11 ± 0.57B, c92.36 ± 0.74AB, c89.36 ± 0.32B, b89.44 ± 0.49B, b
1278.58 ± 0.17C, a80.43 ± 0.32C, ab86.36 ± 0.42C, c88.17 ± 0.82B, cd84.92 ± 0.63C, b84.37 ± 0.54C, b
1869.68 ± 0.22D, a71.67 ± 0.31D, ab75.97 ± 0.68D, c80.48 ± 0.73C, d74.93 ± 0.58D, b75.25 ± 0.67D, bc
T23
0 day4.99 ± 0.17A, a4.99 ± 0.17A, a4.99 ± 0.17A, a4.99 ± 0.17A, a4.99 ± 0.17A, a4.99 ± 0.17A, a
612.26 ± 0.24B, a11.04 ± 0.37B, ab8.96 ± 0.35B, c6.72 ± 0.54B, d9.79 ± 0.52B, b9.71 ± 0.45B, b
1220.56 ± 1.54C, a18.56 ± 1.26C, b12.43 ± 1.32C, d10.93 ± 1.03C, de14.15 ± 1.19C, cd14.84 ± 1.21C, c
1829.38 ± 1.68D, a27.36 ± 1.26D, b23.04 ± 1.24D, d18.59 ± 1.42D, e24.19 ± 1.92D, c23.87 ± 1.42D, cd
Different uppercase letters in same group from different day indicate a significant difference (p < 0.05). Different lowercase letters in different groups from same day indicate a significant difference (p < 0.05).

