1. Introduction
Thermal barrier coatings (TBCs) are commonly applied to protect the hot-path components of gas turbines and engines by reducing the temperature of metallic substrates. The state of the art of TBCs are represented by yttrium-stabilized zirconium (YSZ) oxide (7–8 wt.%), which has a low thermal conductivity (~2.5 W/(m·K)) [
1,
2]. YSZ is usually deposited onto the components either by atmospheric plasma spray (APS) or by electron beam physical vapor deposition (EB-PVD) techniques. Further, EB-PVD is favored because it results in a coating with superior thermal shock resistance, which results in longer cycling life, while the APS technique has been widely used due to its relatively low cost and much lower thermal conductivity [
3,
4,
5,
6]. APS TBCs have a splat-based structure that contains pores with various morphologies trapped in between the splats. Because of these pores, the thermal conductivity can be significantly lower (i.e., by as much as 50%) than fully dense coatings [
7].
The thermal conductivity is determined by the microstructure, such as the porosity, grain size, and gain boundary. Hence, the thermal conductivity is often affected by multiple factors. Chen et al. [
8] analyzed the relationship between the microstructure and thermal conductivity quantitatively using multiple linear regression, and they found that the porosity significantly affects the thermal conductivity at a fixed temperature, while the monoclinic phase content has a great influence on the thermal conductivity at higher temperatures.
Numerous researchers have studied the relationship between the porosity and thermal conductivity by carrying out theoretical calculations and experiments. It is generally accepted that a higher porosity leads to a lower thermal conductivity. In fact, the thermal diffusivity or conductivity of porous materials is highly sensitive to the morphology of pores [
9,
10]. Many models have been proposed in previous studies to investigate the effect of pores on the thermal conductivity by setting specific parameters as input. Golosnoy et al.’s [
11] results based on finite element analysis showed the lower thermal conductivities compared with the experimental ones. While Tan et al.’s [
12] model, which was based on image analysis (IA) and finite, element analysis showed similar trends for YSZ coating thermal conductivity, the simulated results were higher than those compared to the experimental data. The difference among the simulating results and experimental ones mainly motivates researchers to conduct further investigation on the modeling. However, simulation of APS TBCs’ thermal conductivity based on comprehensive microscopic pore morphology has still not been achieved. For decades, numerous studies have measured the porosity and thermal conductivity of true APS TBCs samples prepared with different spray parameters to determine the factors influencing thermal conductivity. However, these studies mostly focused either on the linear relationship between the overall porosity and thermal conductivity, or on the effect of only crack-like pores termed inter-lamellar pores on the thermal conductivity. As often highlighted in the literature, the thermal conductivity is particularly sensitive to inter-lamellar pores that have their thickness oriented parallel to the heat flux, and are less sensitive to pores with other shapes and morphologies [
13,
14,
15]. In fact, the volume of inter-lamellar pores is usually much smaller than that of other pores [
9]. For porosity measurements, usually, methods such as IA [
16], Archimedean displacement [
17], and mercury intrusion porosimetry (MIP) [
18] are used. However, these methods do not allow the comprehensive characterization of pores containing the full thickness of the TBCs [
19]. Thus, few researchers have systematically analyzed the effect of pores with different shapes, orientations, and sizes.
The variation in the thermal conductivity comes from the interaction between all pores. Multiple linear regression is a typical empirical method that is widely used to characterize the quantitative dependence among factors [
20]. Hence, multiple linear regression would be a suitable approach to determine the role played by each type of pores.
The aim of this study is to investigate the effect of pores with different morphologies on the thermal conductivity. In this work, several 8%-YSZ coatings with similar monoclinic phase contents were prepared. A rectangular macroscopic area of 1 mm × 2 mm in each sample, with its thickness corresponding to nearly the full thickness of the coatings, was analyzed to measure the porosity employing a method named panoramic statistics [
19]. More than 141,000 pores in five samples were automatically scanned and distinguished using panoramic statistics. In addition, data like aspect ratio, orientation, and area of every pore were automatically categorized in statistical lists of the INCA Feature software (V5.05). Pores were classified according to the aspect ratio, orientation, and area. The relationship between different types of pores and thermal conductivity was then evaluated using multiple linear regression.
3. Results and Discussion
3.1. Phase Content
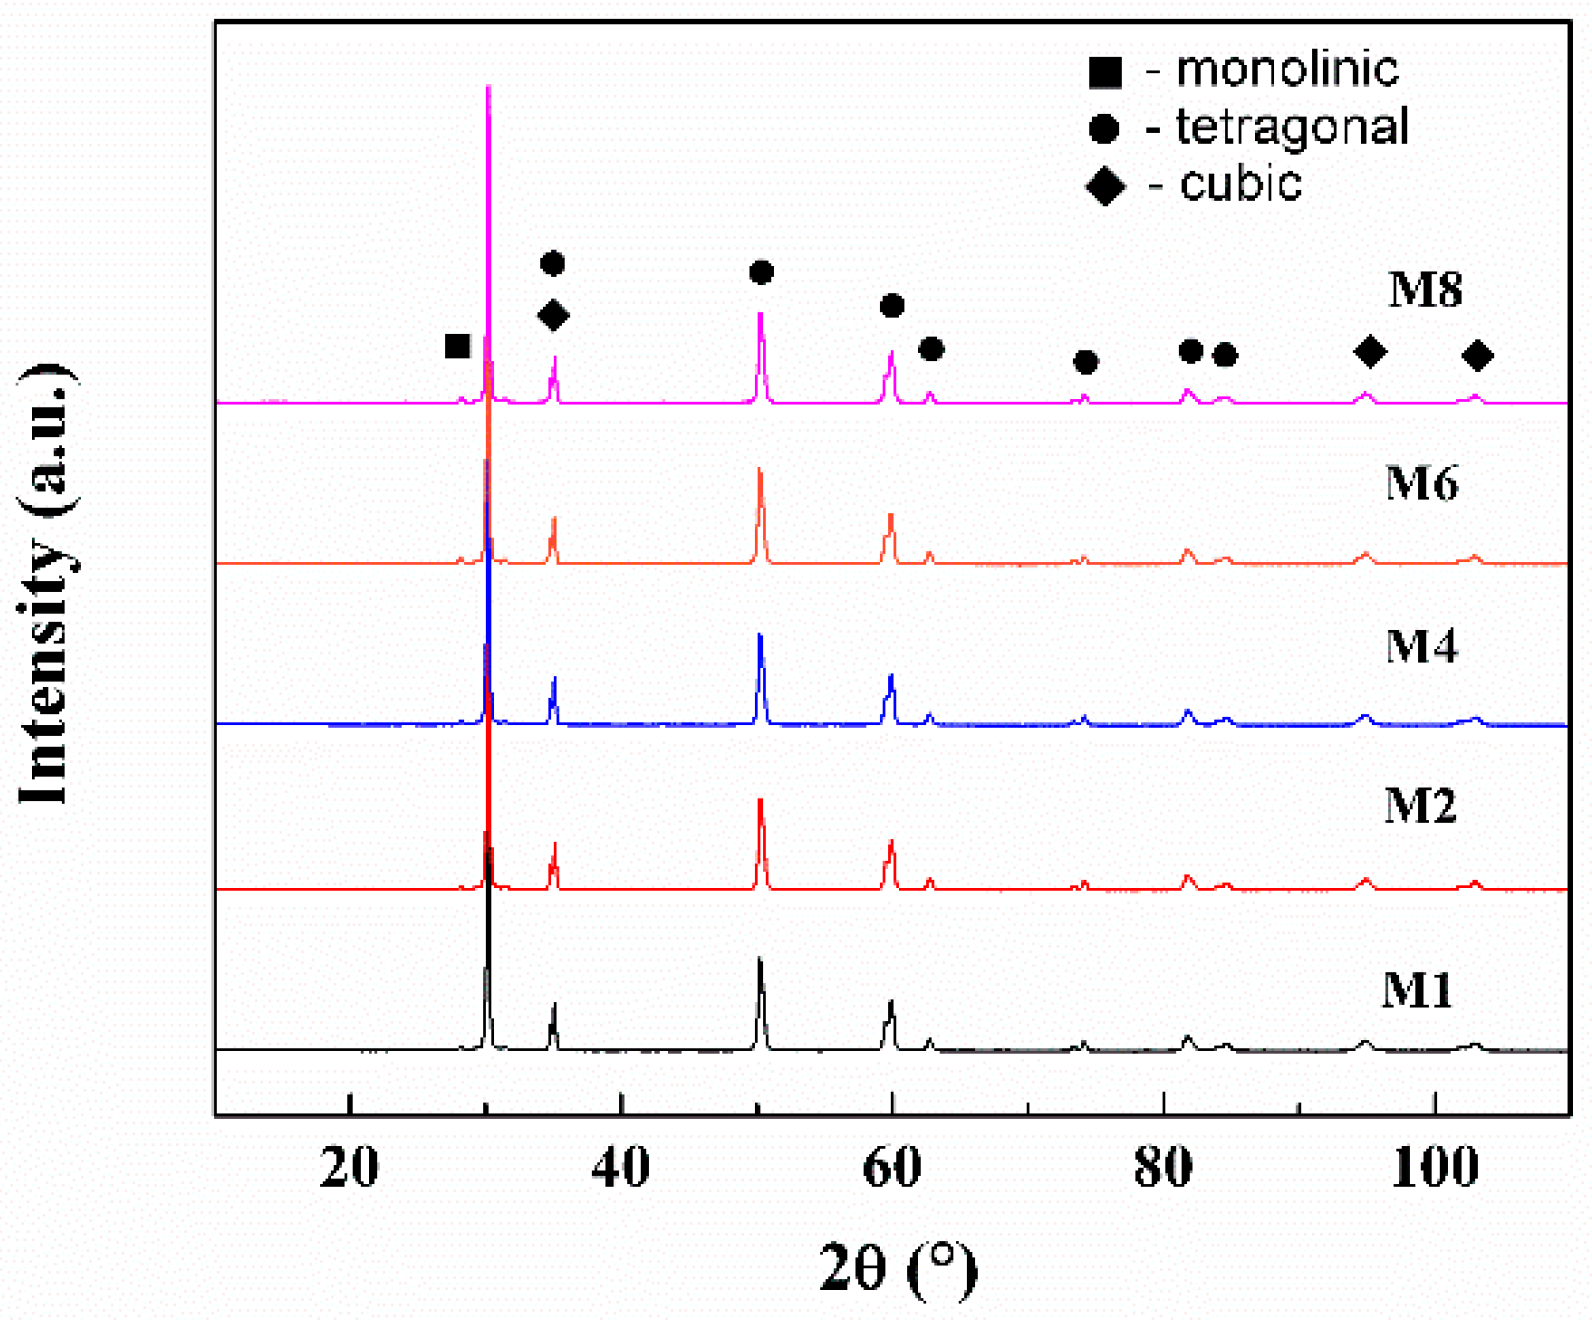
As presented in
Figure 1, YSZ coating consists of the monoclinic, tetragonal, and cubic phases. The phase content of each sample is shown in
Table 2. The thermal conductivity of the monoclinic phase is higher than those of the cubic phase and tetragonal phase, so the monoclinic phase content plays an important role in increasing the thermal conductivity of TBCs [
8]. In this study, the monoclinic phase contents of samples are very similar: all about 5%. Therefore, it can be assumed that the effect of the monoclinic phase content on the thermal conductivity can be ignored.
3.2. Panoramic Statistics
3.2.1. Overall Porosity and Thermal Conductivity
The overall porosity, pore area, and the number of pores of each sample are presented in
Table 3. Further, the thermal conductivity of each sample at different temperatures from 25 to 500 °C is shown in
Figure 2. The overall porosity of samples is not very different, ranging from 6.15% to 9.58%. However, the thermal conductivity of samples at 500 °C varied from about 0.8 W/(m·K) to about 1.4 W/(m·K), meaning that different types of pores with various morphologies have different effects on the decrease in the thermal conductivity.
3.2.2. Porosity Classification
As often mentioned in the literature, the microstructures of as-sprayed and sintered free-standing APS YSZ consists of lamellar pores (intra-lamellar and inter-lamellar) and globular voids [
10,
23,
24]. In this study, pores having different morphologies and orientations have been classified depending on their aspect ratio (
a), orientation (β), and area (
s). In particular, all pores having
a < 3 have been consider as “spherical”, while those with
a ≥ 3 have been considered to be lamellar shaped [
10]; further, lamellar pores were divided into horizontal (0 ≤ β ≤ 45°) and vertical (45° < β < 90°) pores. In addition, pores were divided into big pores (
s ≥ 2 μm
2) and small pores (
s < 2 μm
2) for the area of above 50% pores smaller than 2 μm
2. For studying the morphology and orientation of different pores, six types of pores listed in
Table 4 were considered: big-horizontal pores, small-horizontal pores, big-vertical pores, small-vertical pores, big-globular pores, and small-globular pores. Ratios of the 6 types of pores to scanning area of samples are presented in
Table 5.
3.3. Multiple Linear Regression Analysis
In the multiple linear regression analysis, a total of 30 sets of thermal conductivity data were input as values of the dependent variable, and the influence of the six types of pores at different temperatures from room temperature to 500 °C was considered. The calculations were done with the SPSS software. The multiple linear regression equation is given by Equation (4):
Here, X0, X1, X2, X3, and X4 represent temperature in °C, and the fractions of the small-horizontal pores in %, big-horizontal pores in %, small-vertical pores in %, and big-globular pores in %, respectively. It was worth noting that the input-independent variables, big-vertical, and small-globular pore fractions were removed from the equation during the calculation, indicating that they have no obvious impact on the thermal conductivity of samples.
The linear coefficient R2 is 0.973 and F-value is 173.133; both indicate that highly significant linear relationship between the dependent variables and independent variables. The coefficients of independent variables are all plural, meaning that temperature and the four types of pores that remained in the equation all have a significant influence on the decrease in the coating thermal conductivity.
Standardization coefficient
Pj of independent variables are listed in
Table 6. The magnitude of the standardization coefficient
Pj was used to estimate the importance of the independent variable
Xi: the larger the
Pj magnitude, the greater the importance of
Xi.
3.4. The Effect of Different Types of Pores
By comparing Pj, the four types of pores were ranked according to their effect on the thermal conductivity; the order of effect was as follows: small-vertical pores > big-globular pores > big-horizontal pores > small-horizontal pores.
3.4.1. Small-vertical Pores
Figure 3a,b represents the schematic of the coating containing a small-horizontal pore and a small-vertical pore.
L is the thickness of the material and
A1 and
A2 are the cross-sectional areas of the small-horizontal and small-vertical pores, respectively. It is assumed that the cross-sectional area
A is proportional to the pore length, as the real area is difficult to measure.
R1,
R2,
R1′, and
R2′ represent the thermal resistance of the upper and lower part of the pore in the dashed line area, while the thermal resistance of the small-horizontal and small-vertical pores is
and
.
The thermal resistance
R of a substance is given by the equation:
where
is the heat flux propagation length of a substance,
A is the cross-sectional area, and λ is the thermal conductivity.
The thermal resistance within the dashed-line area in
Figure 3a is given by
where λ
s is the thermal conductivity of the solid, and λ
p is the thermal conductivity of gas in pores. The thermal resistance of the dashed-line area in
Figure 3b is given by
So it can be concluded that the difference between the two is given by
We can conclude that the thermal resistance of small-vertical pores is bigger than that of small-horizontal pores when they occupy the same volume.
3.4.2. Horizontal Pores
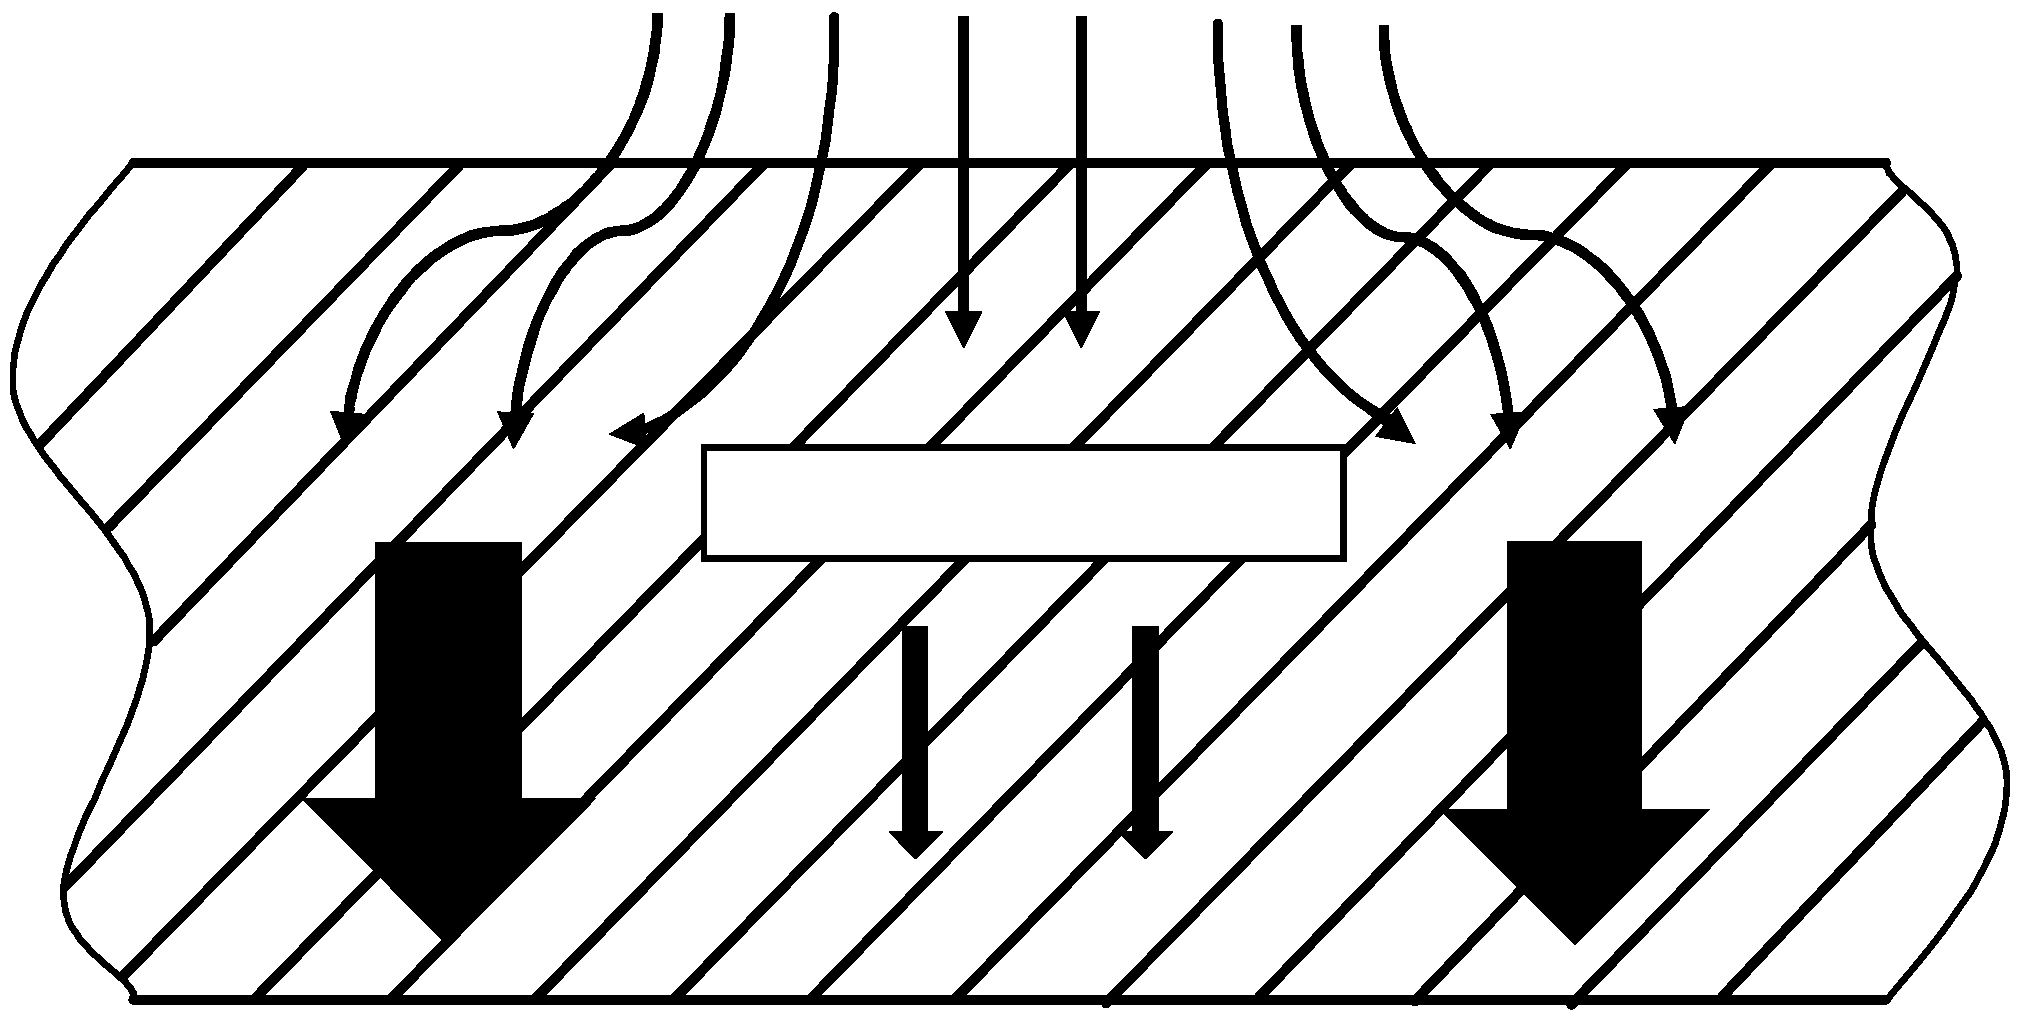
Figure 4. shows the schematic of the heat flux passing through horizontal pores, the arrowhead thickness represents the magnitude of heat flux passing through the area per unit time. According to the Equation (3), the thermal resistance is inversely proportional to the contact area and the thermal conductivity. For λ
s >> λ
p, it can be inferred that
Rs <<
Rp. Coating regions with perfect contact are separated by horizontal pores, which have no contact arising from gas entrapped beneath spreading liquid droplets during coating formation. The heat flux is restricted to conduction through the regions of true contact, which refer to solid/solid interface, so that the heat flux is higher compared to the regions possessing pores, which refer to solid/gas contact. The longer the pore transverse length, the more significant the effect.
It is worth noting that horizontal pores, irrespective of the size, all play a significant role in decreasing the thermal conductivity of coatings. Therefore, several studies have explored the effect of inter-lamellar pores [
6,
9].
3.4.3. Excluded Variables
In multiple linear regression, there are six types of pore inputs, however, only four types of pores appear in the equation. In the calculation, the variables, i.e., the big-vertical and small-globular pore fractions, were removed from the equation, indicating that they have no significant effect on the thermal conductivity of coatings.
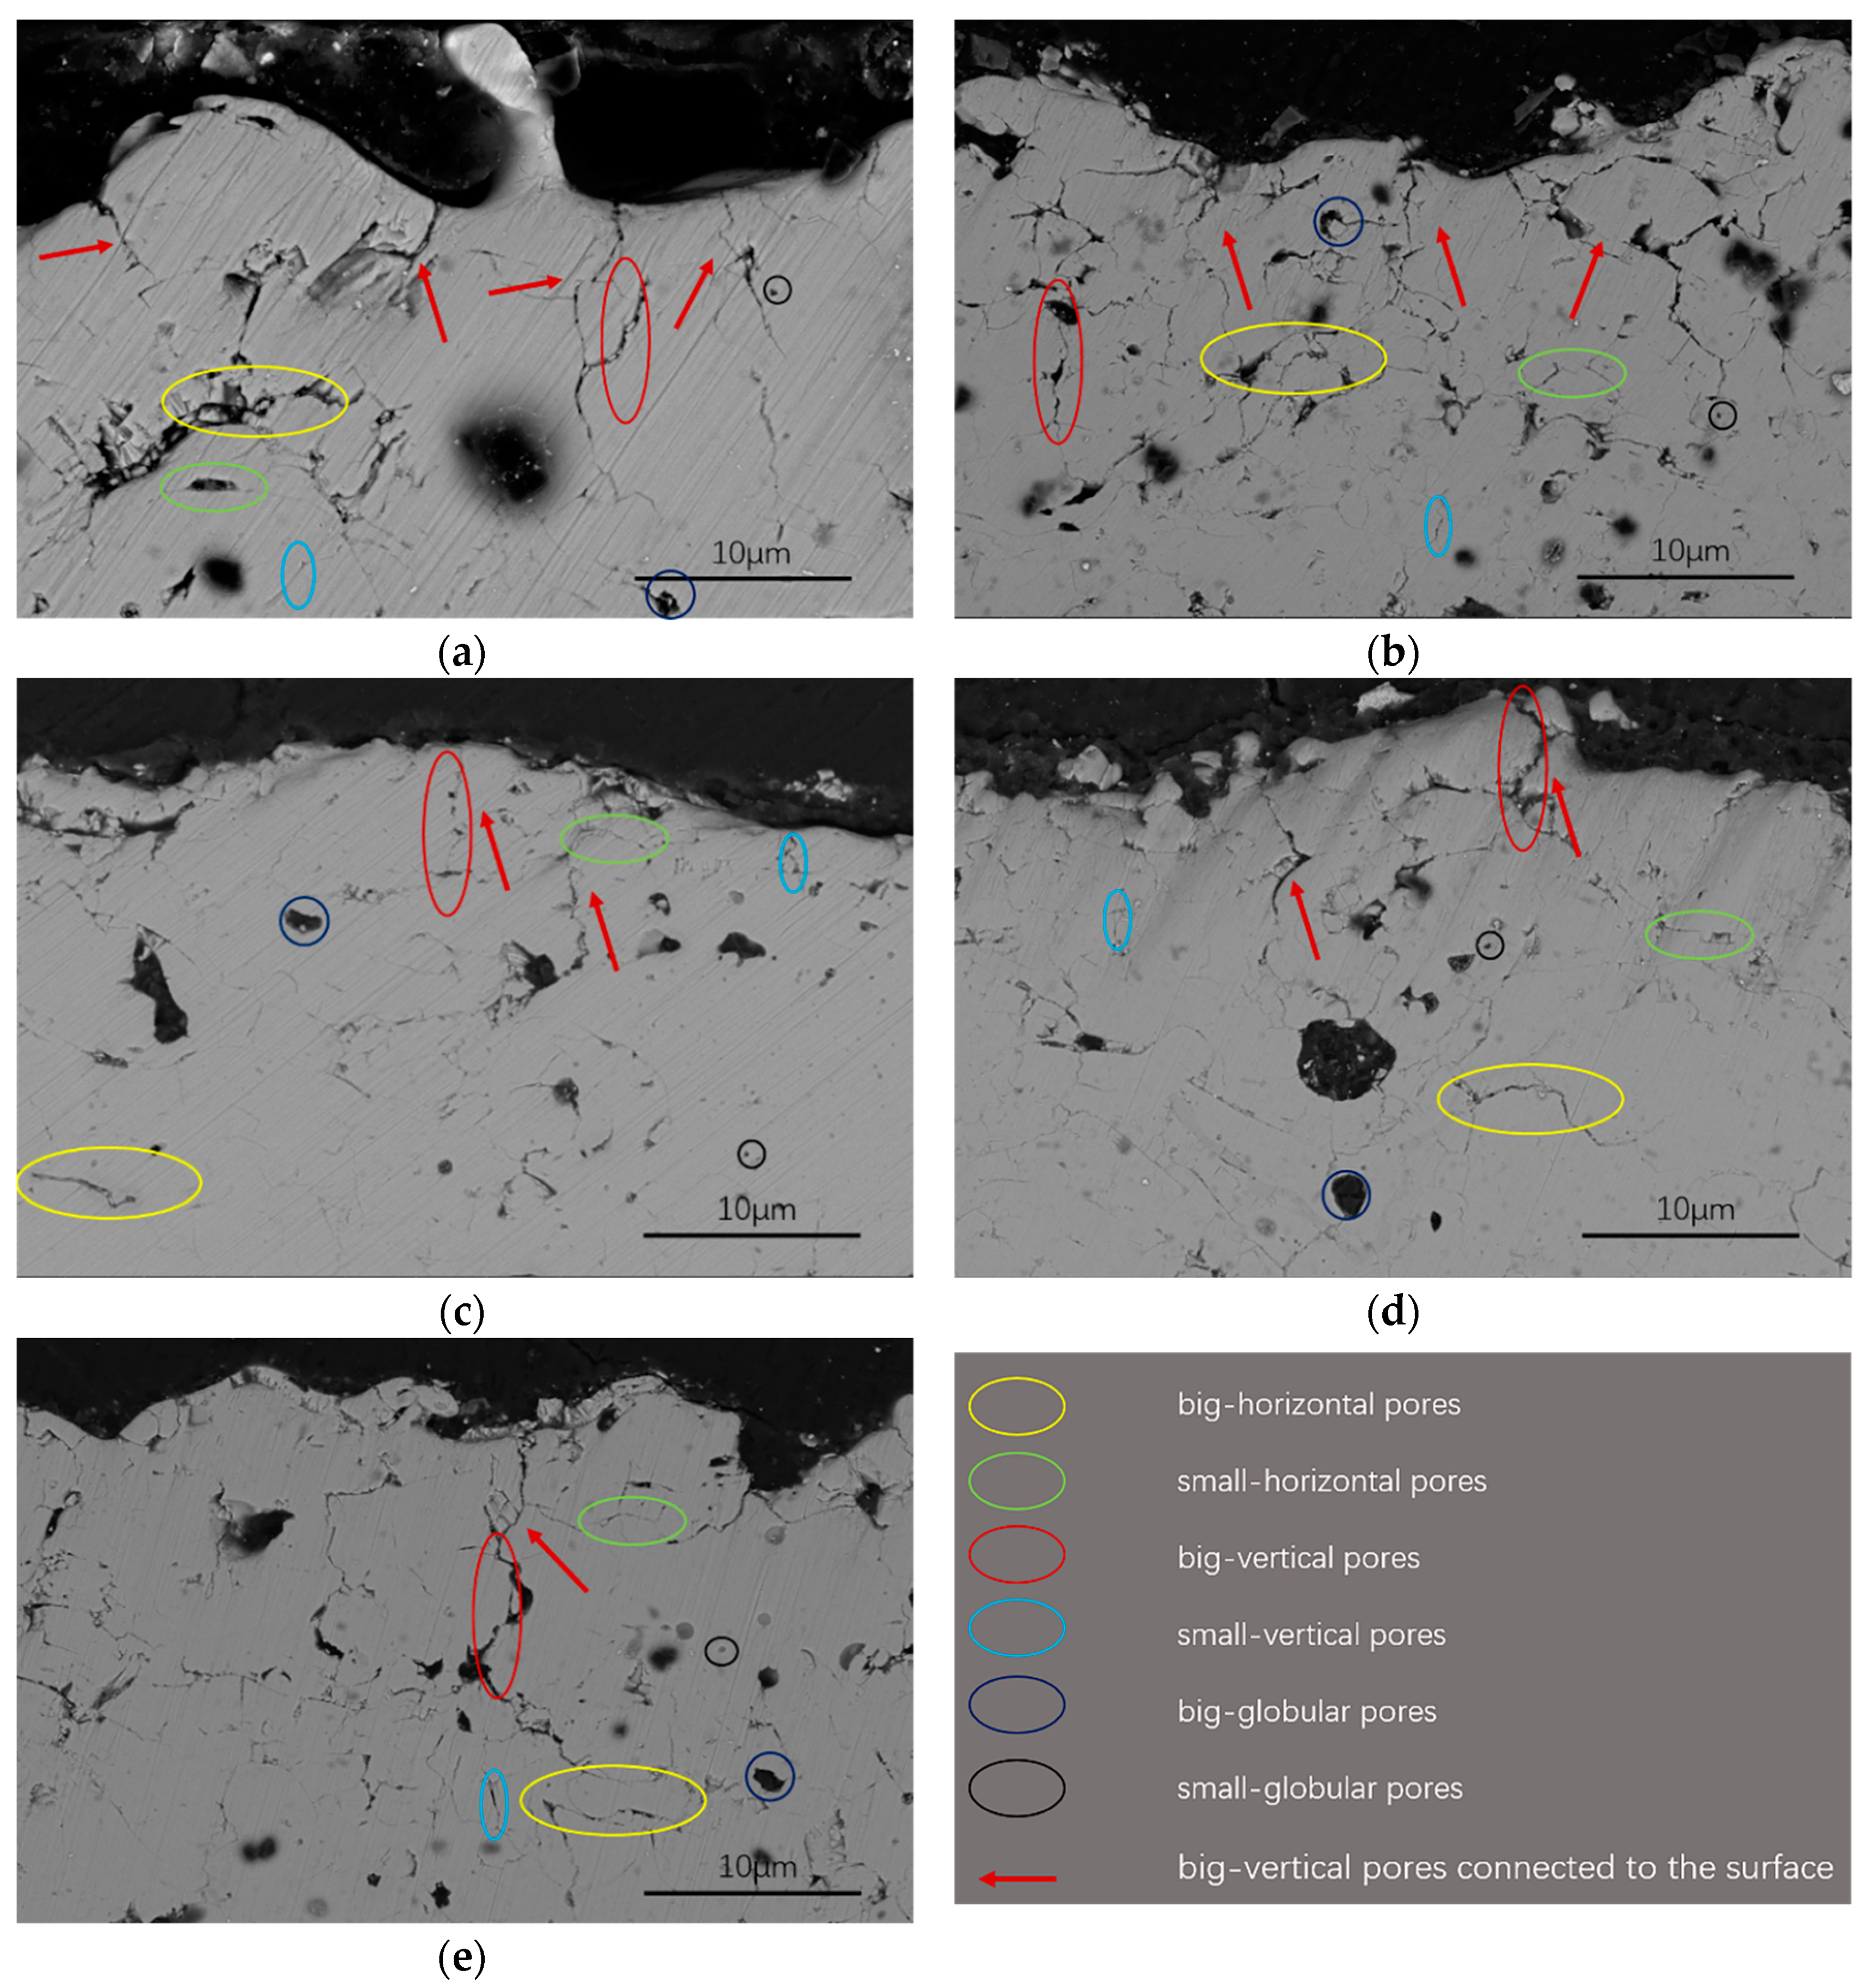
According to the thermal resistance theory, the big-vertical pores should have a greater effect on the coating thermal conductivity than the small-vertical pores. As shown in
Figure 5, parts of the big-vertical pores are connected to the coating surface in samples. These pores connected to the surface increased the convective heat transfer when a temperature difference existed between the coating interior and surface, leading to a decrease in the thermal conductivity. Hence, the big-vertical pores have no significant influence on the coating thermal conductivity.
On the other hand, the small-globular pores, which are almost uniformly distributed in the coating, have a width comparable with the mean free path of the molecules, so that their exitance is almost transparent to the phonon.
4. Conclusions
In this study, samples having similar monoclinic phase contents were prepared to eliminate the effect of phase content. Then, based on panoramic statistics on porosity, more than 141,000 pores were scanned and distinguished using SEM with the INCA software, and porosity data, i.e., the aspect ratio, orientation, and area, were obtained. Then, the data were analyzed by employing multiple linear regression at SPSS. The results are summarized as follows:
Different pores play different roles in decreasing thermal conductivity: for samples with an overall porosity of 6%–9%, the thermal conductivity varies greatly.
According to the multiple linear regression equation, the small-vertical pores have the biggest effect on the decrease in the thermal conductivity.
The horizontal pores, irrespective of their size, play a significant role in decreasing the thermal conductivity of coatings.
The quantitative relationship between different kinds of pores and thermal conductivity offers a new way to get low thermal conductivity by optimizing spraying parameters to perfect the pore types and distributions.

 ,
, 


