
Unveiling Nanogranular Advancements in Nickel-Doped Tungsten Oxide for Superior Electrochromic Performance

 ,
,
Abstract
:1. Introduction
2. Experimental
2.1. Chemicals
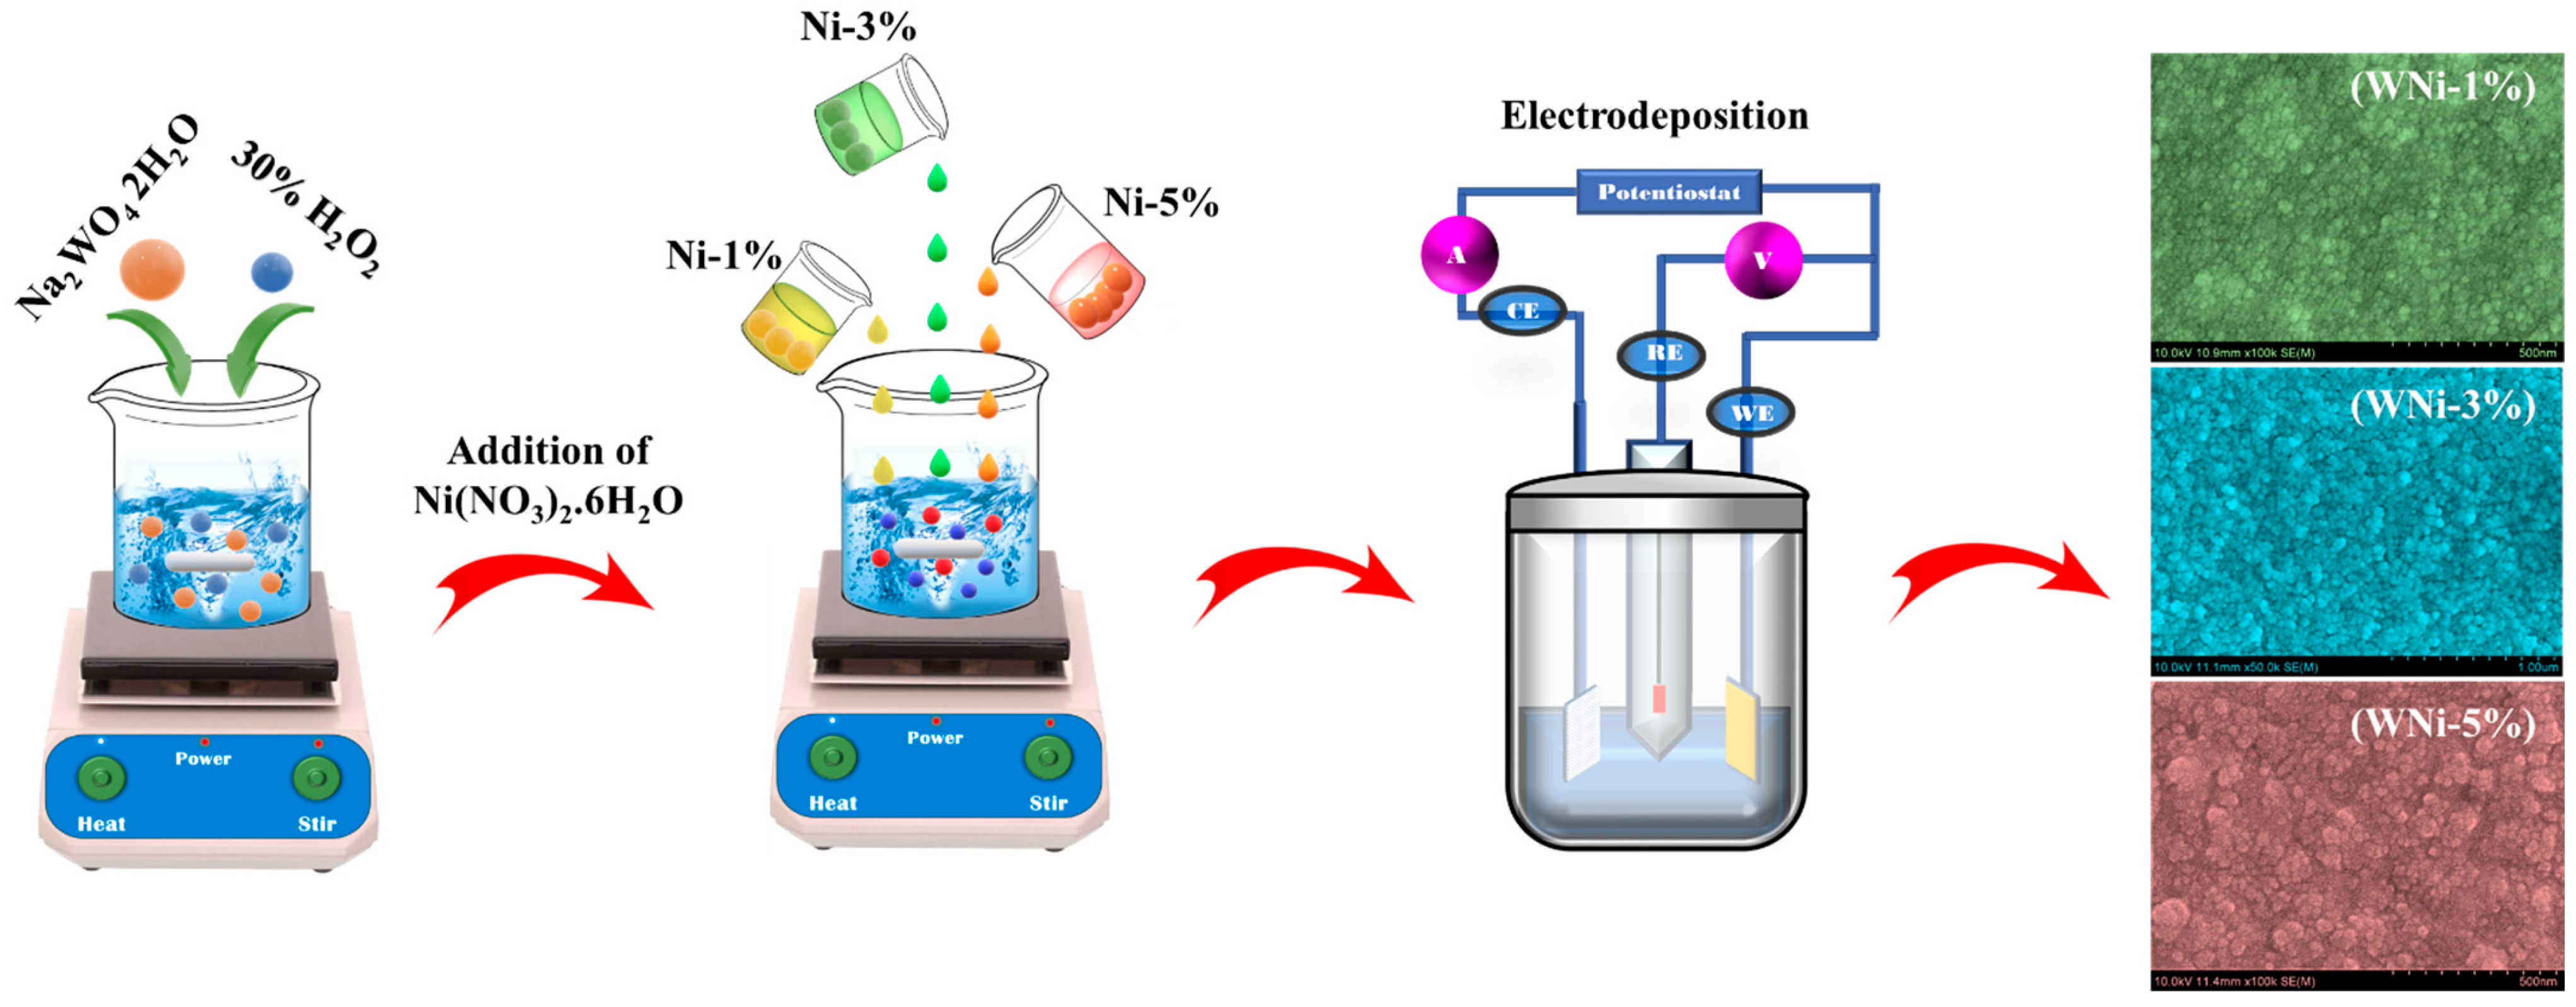
2.2. Fabrication of Ni-Doped WO3 Thin Films
2.3. Electrochromic Device Fabrication
3. Sample Characterization and Electrochromic Measurements
4. Results and Discussion
4.1. Mechanism of Electrodeposition
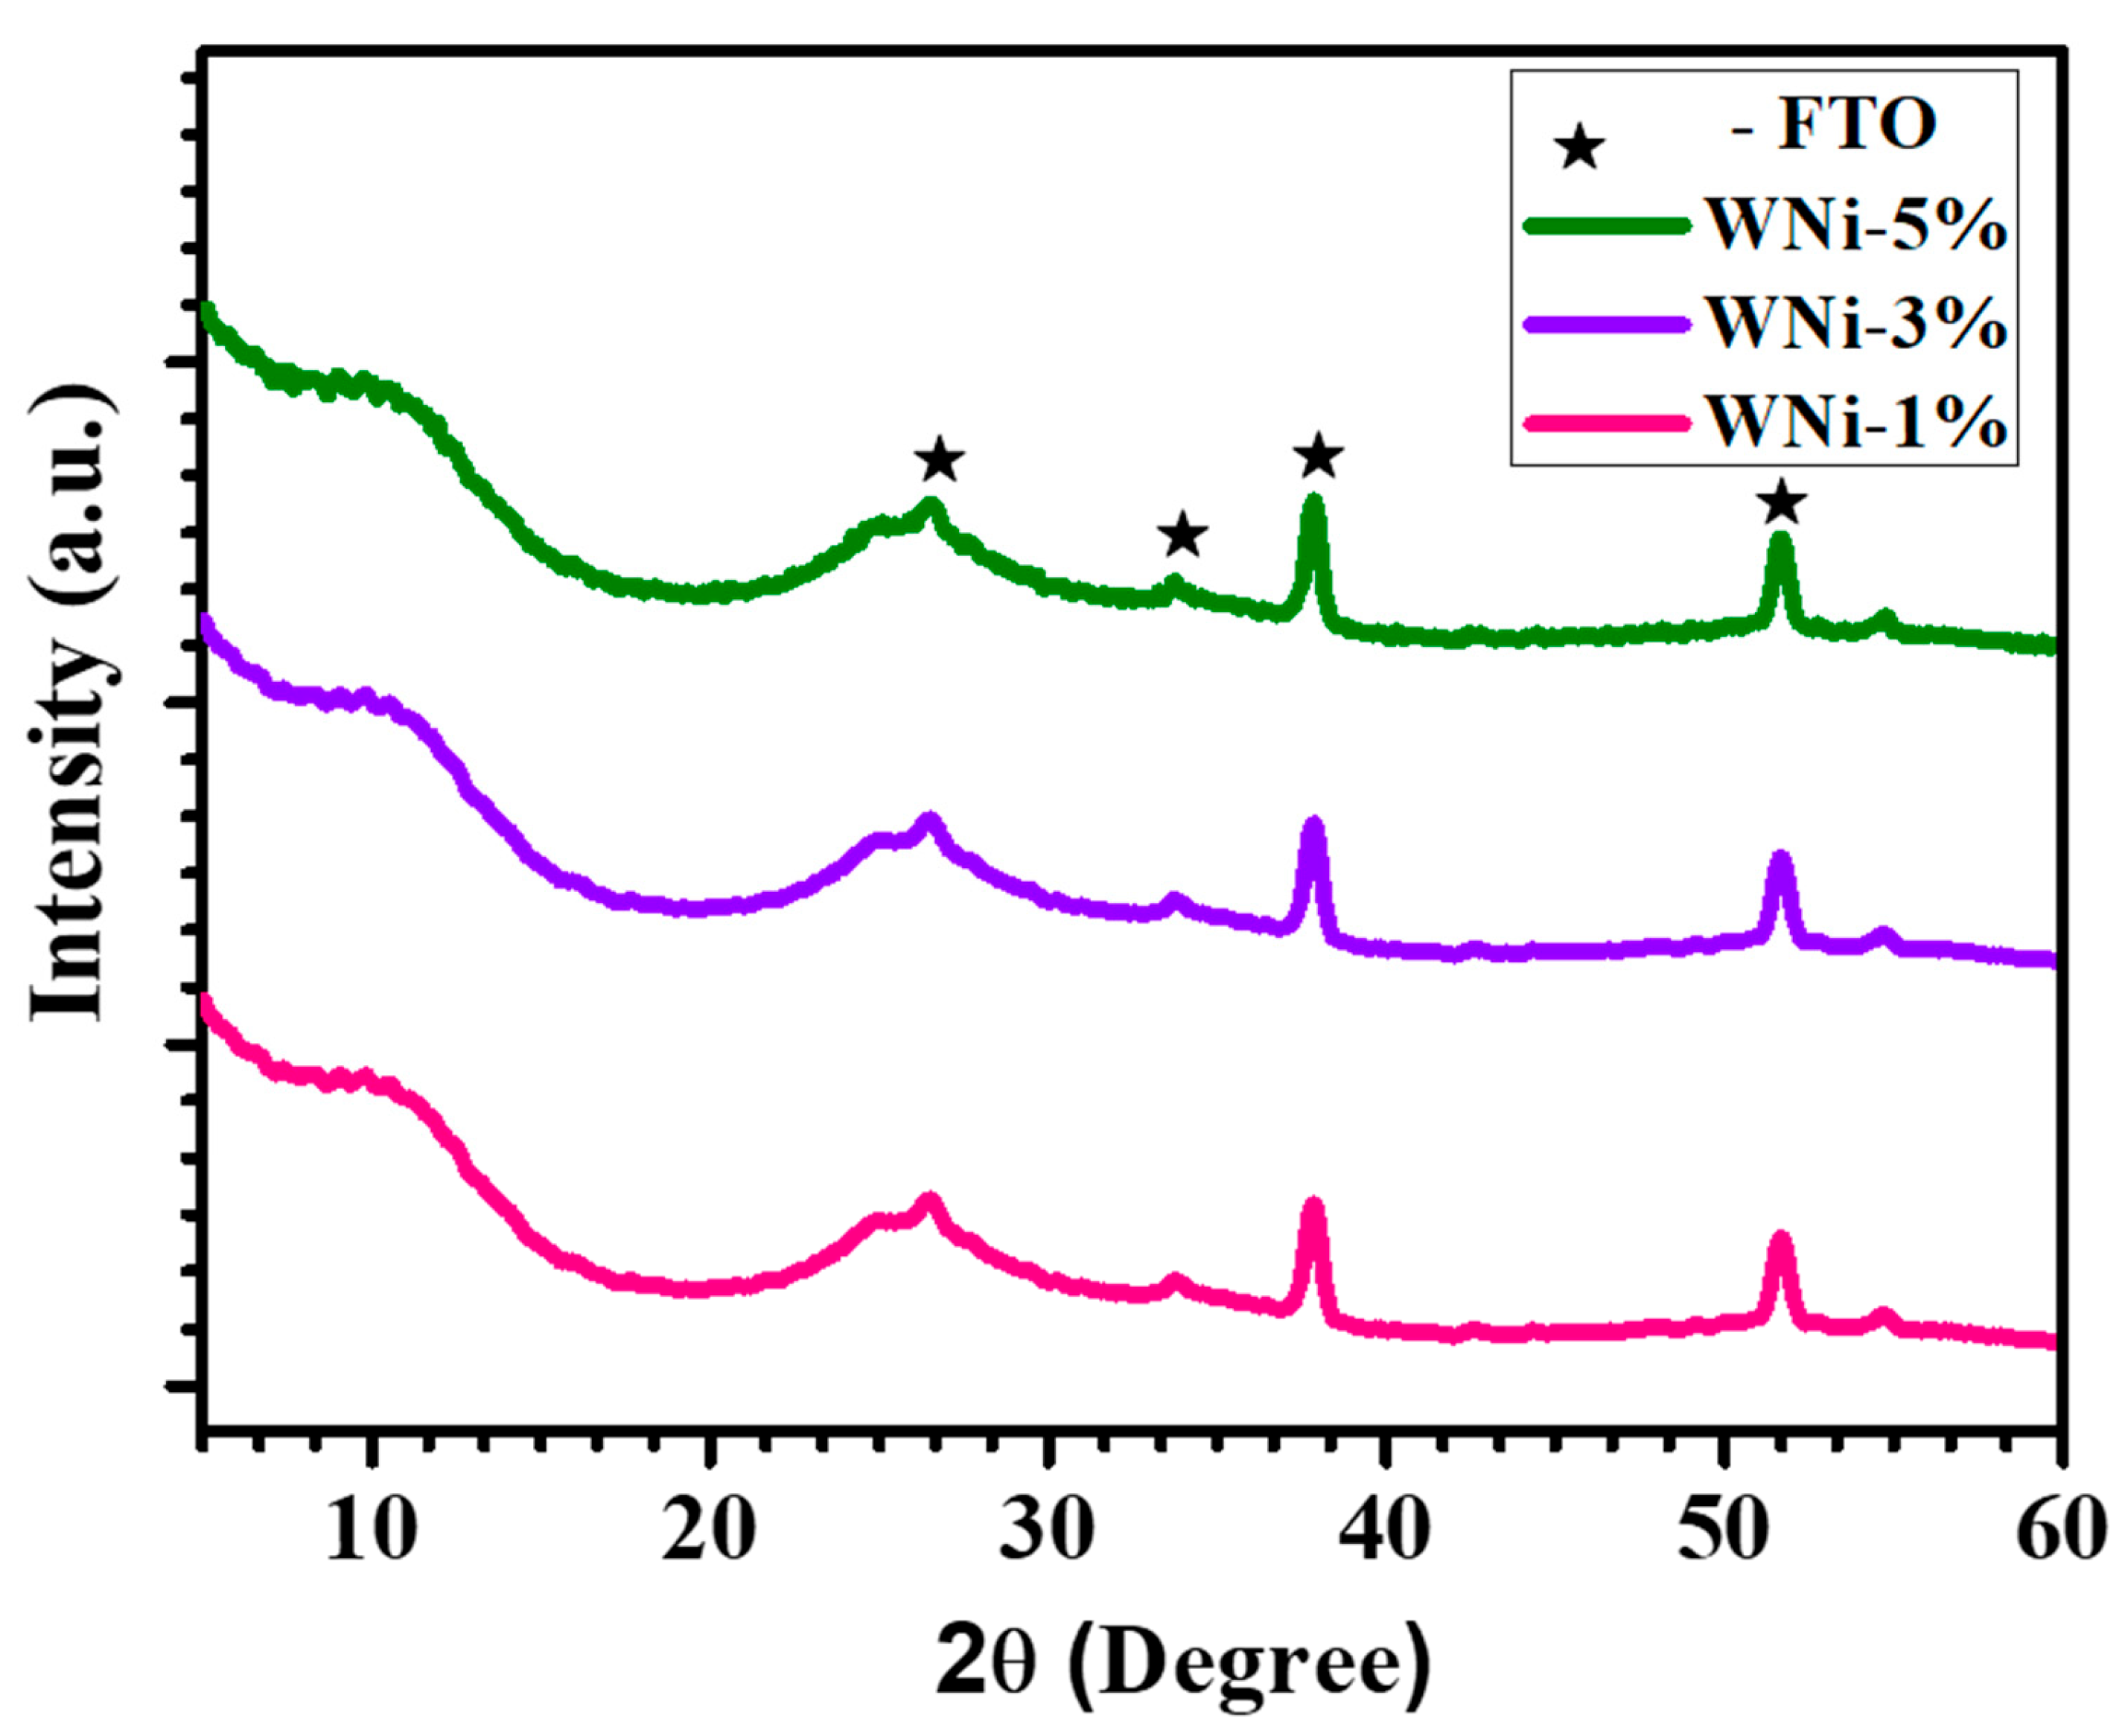
4.2. X-ray Diffraction (XRD) Elucidation
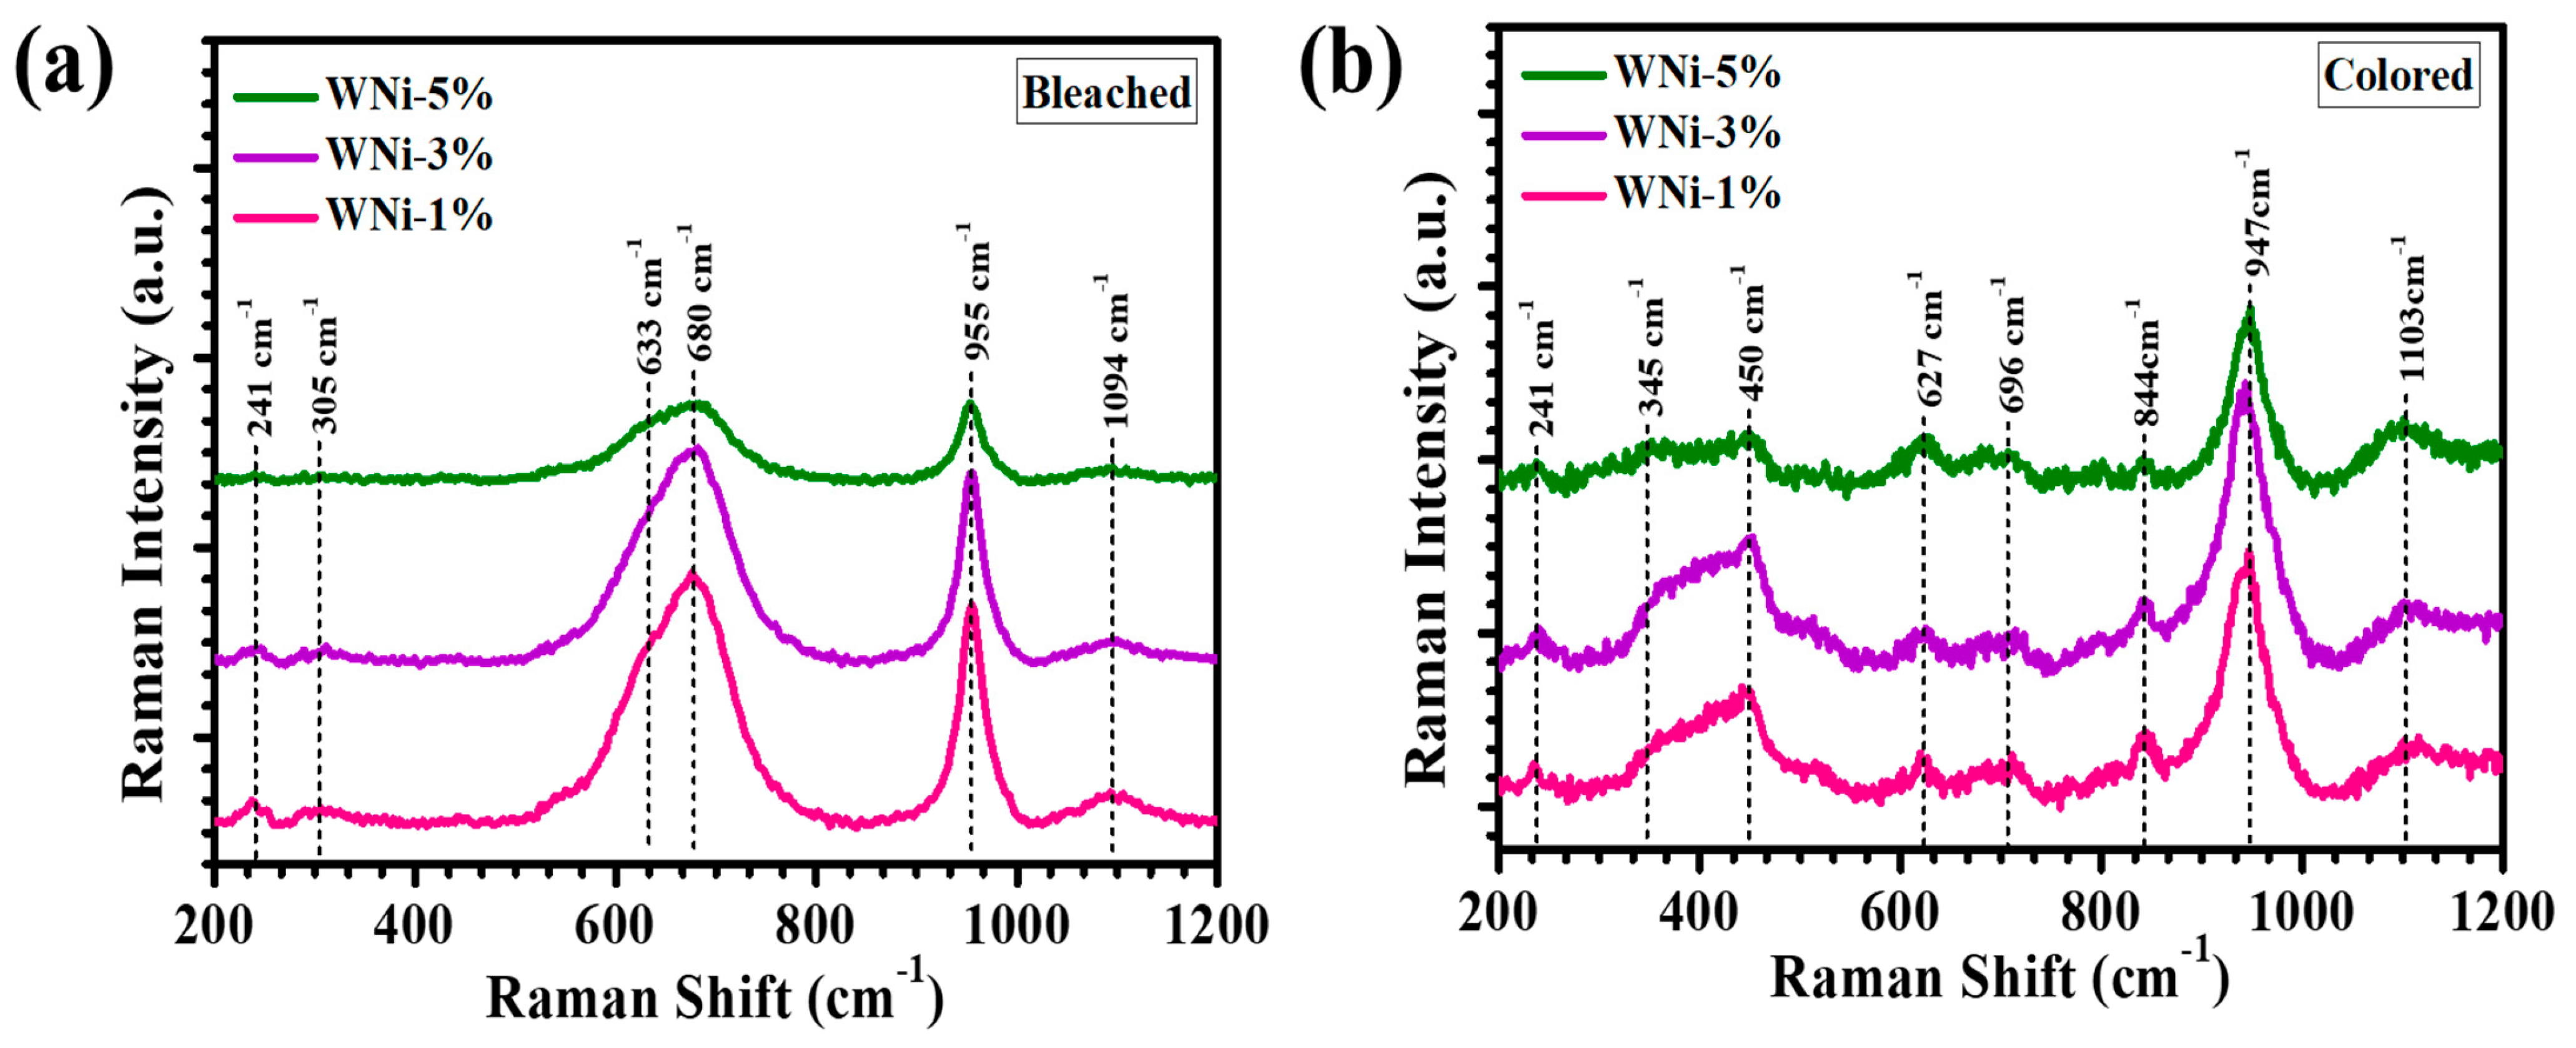
4.3. Raman Spectroscopy Analysis
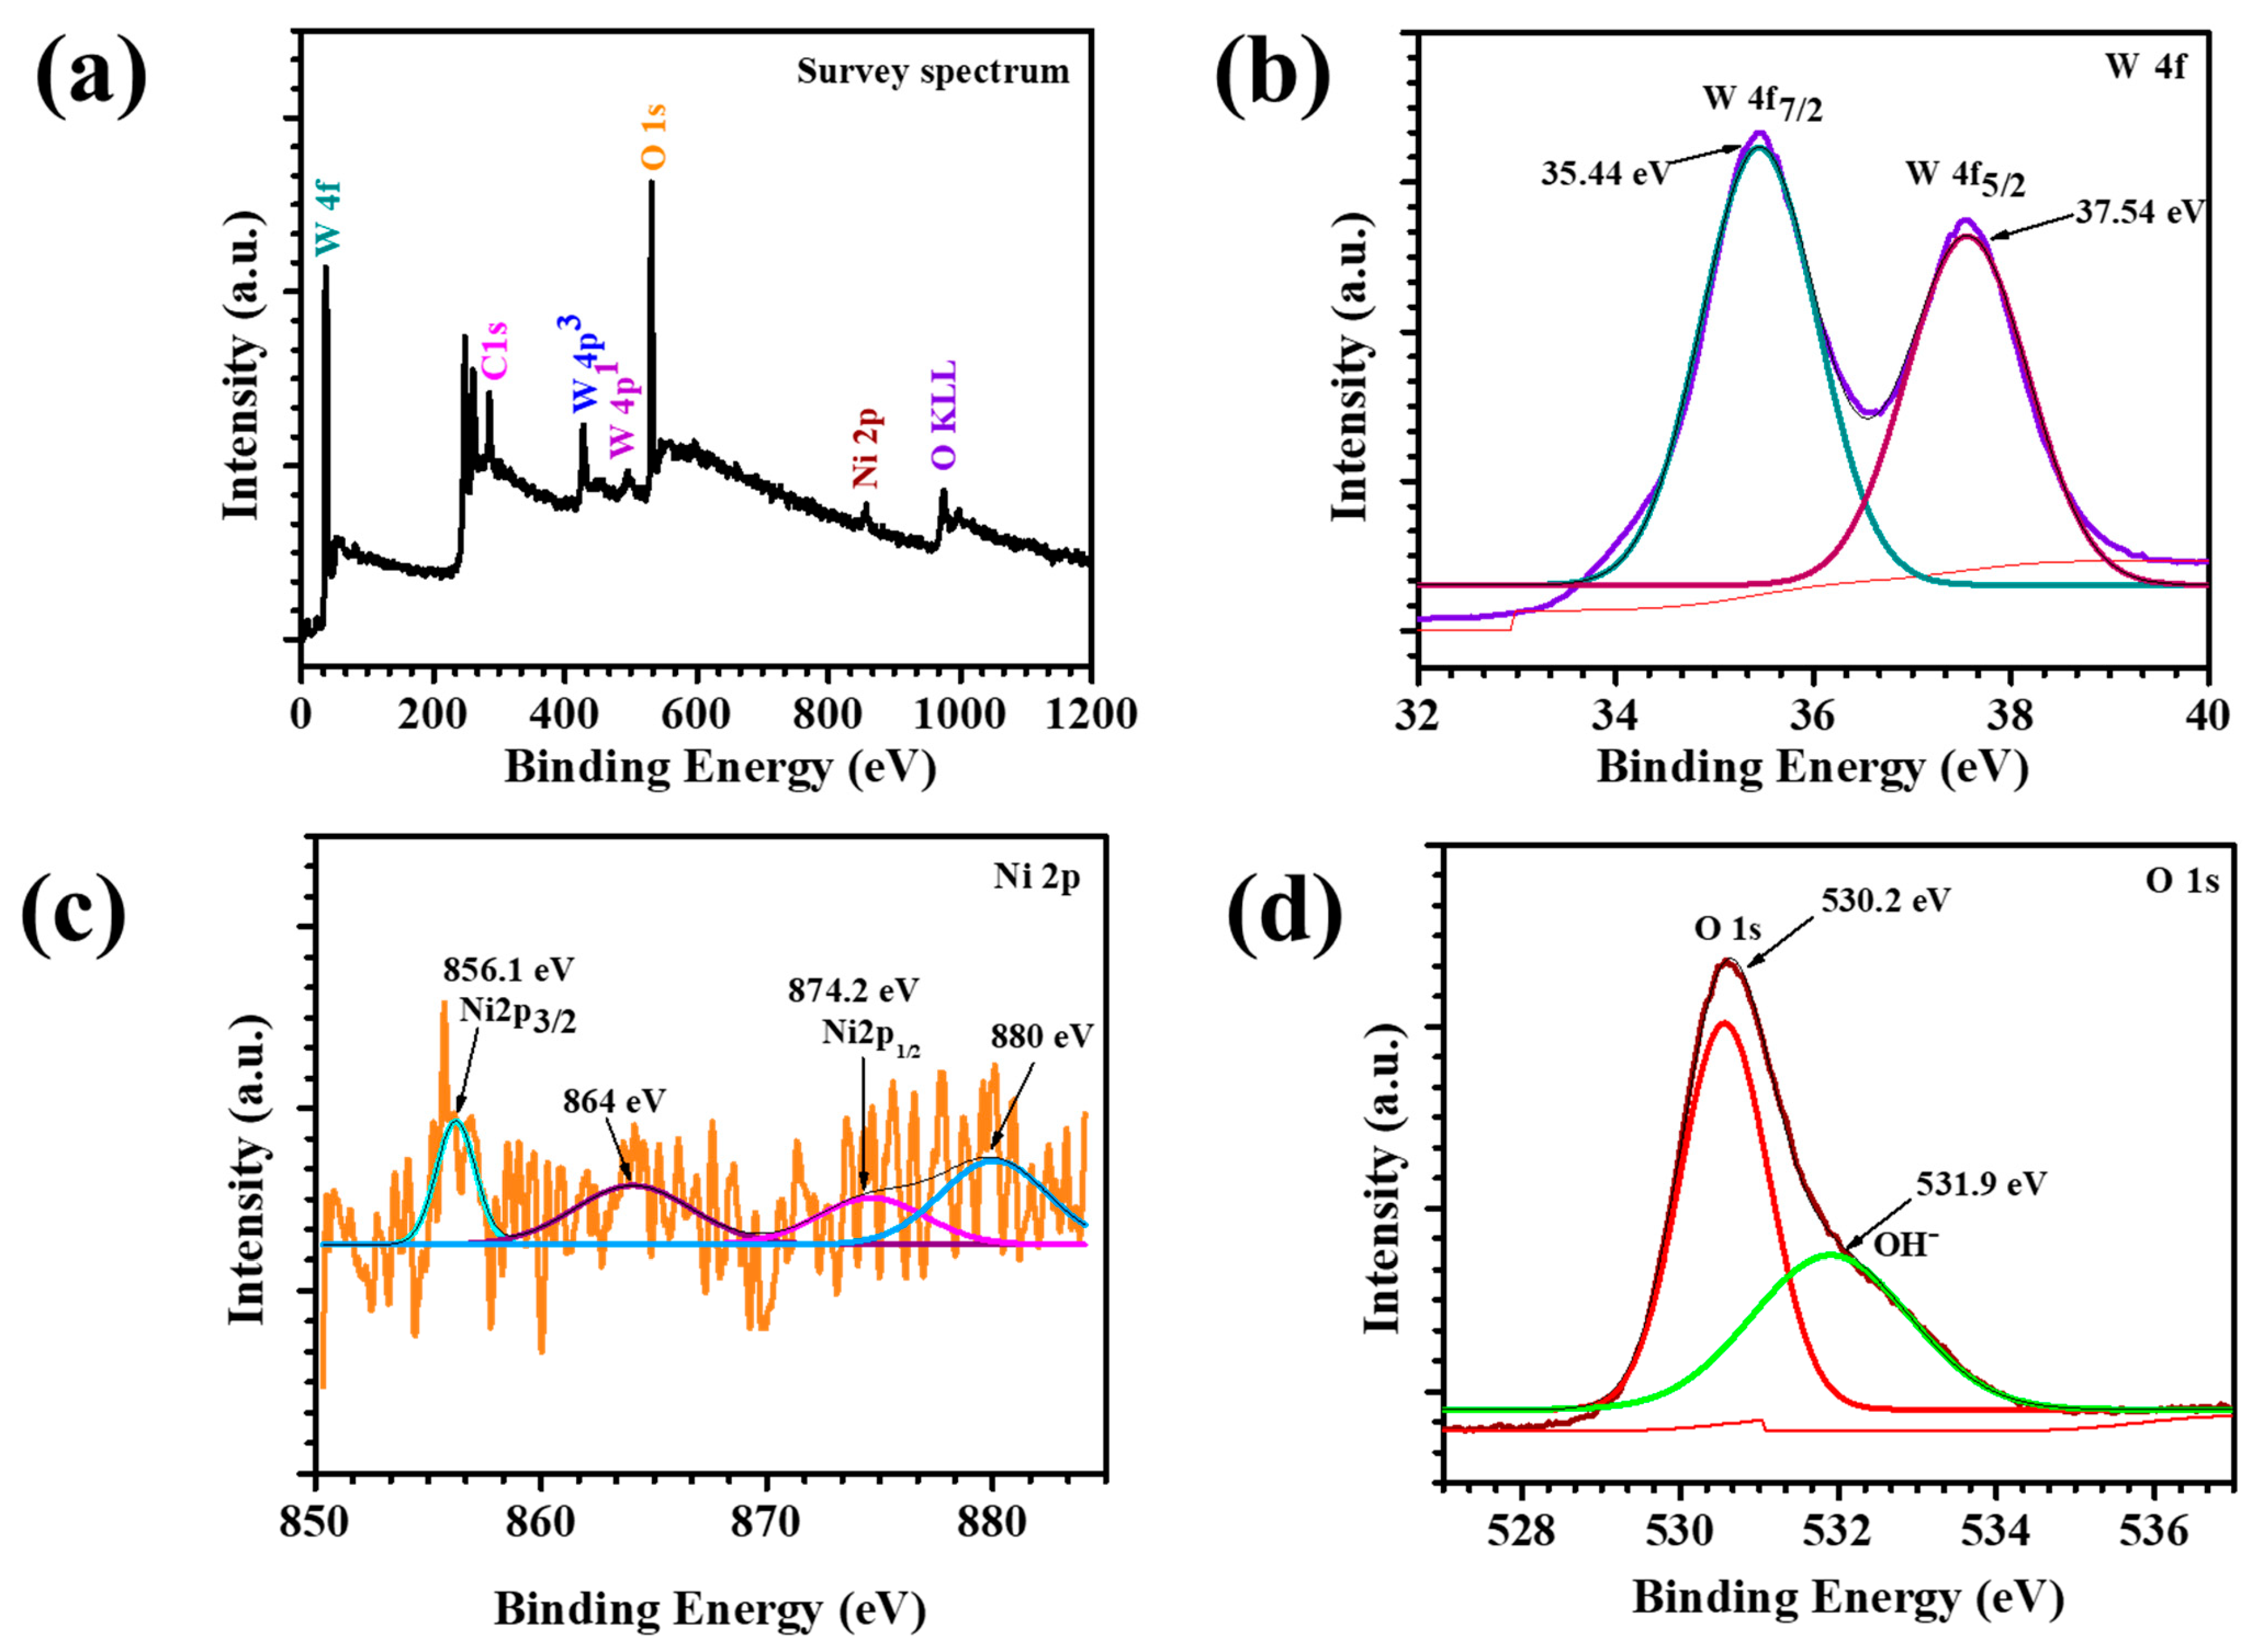
4.4. X-ray Photoelectron Spectroscopy (XPS) Elucidation
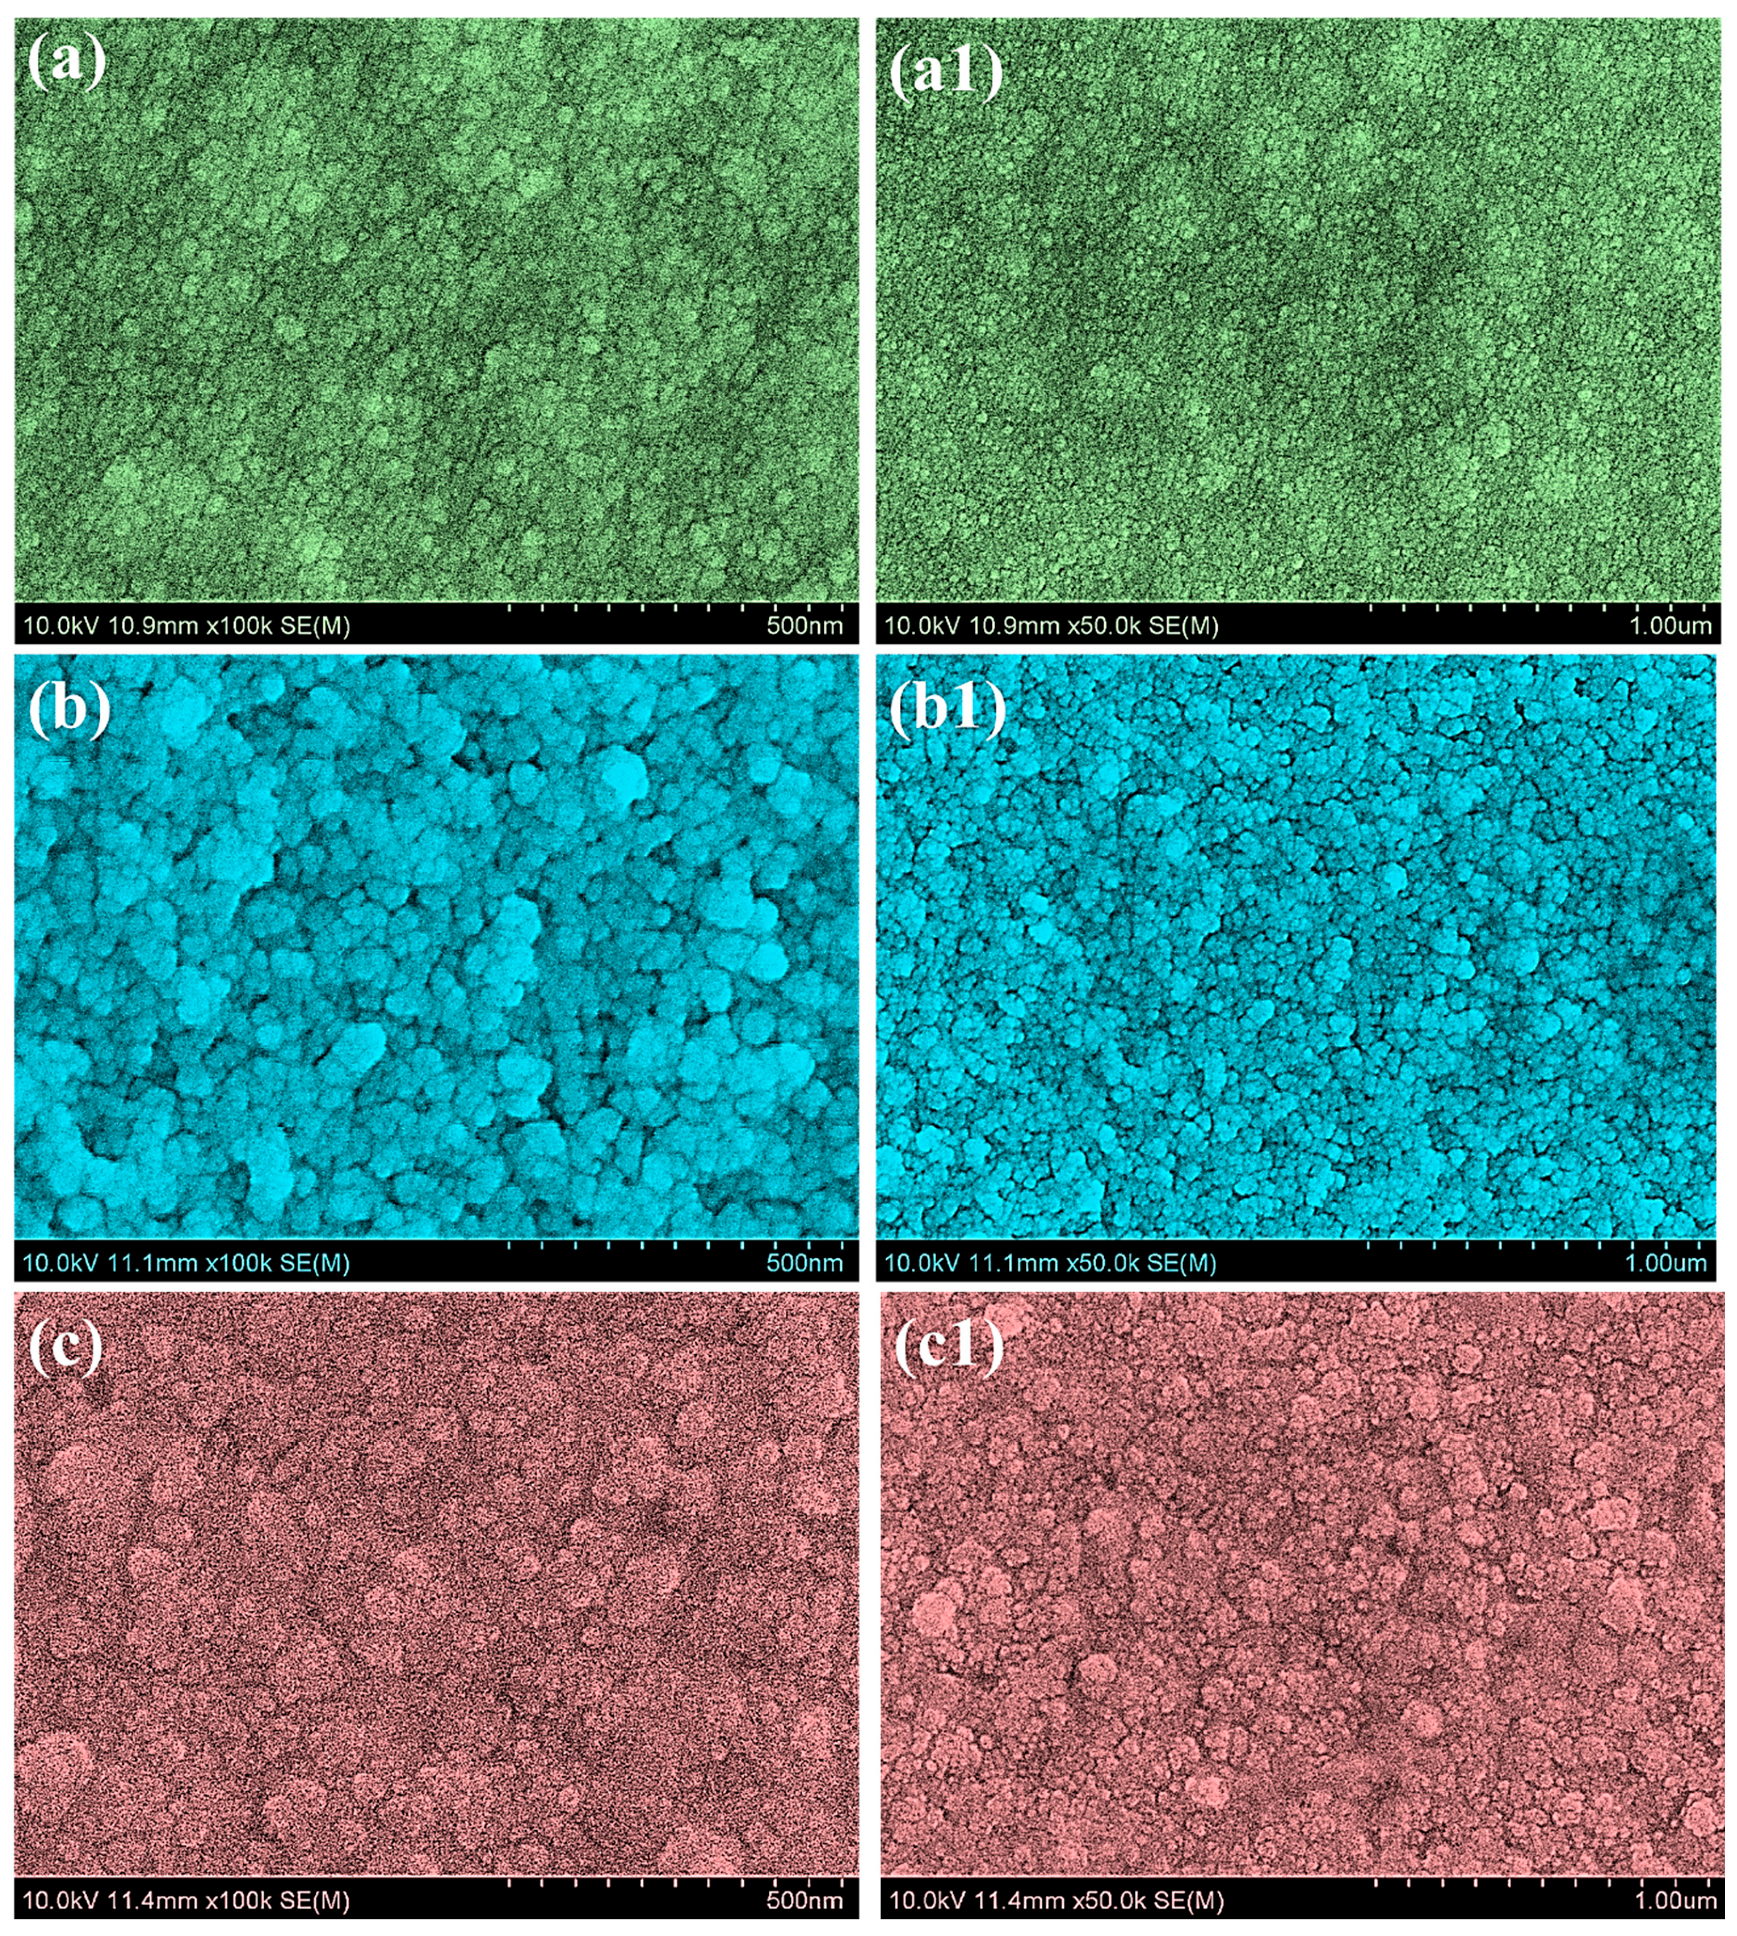
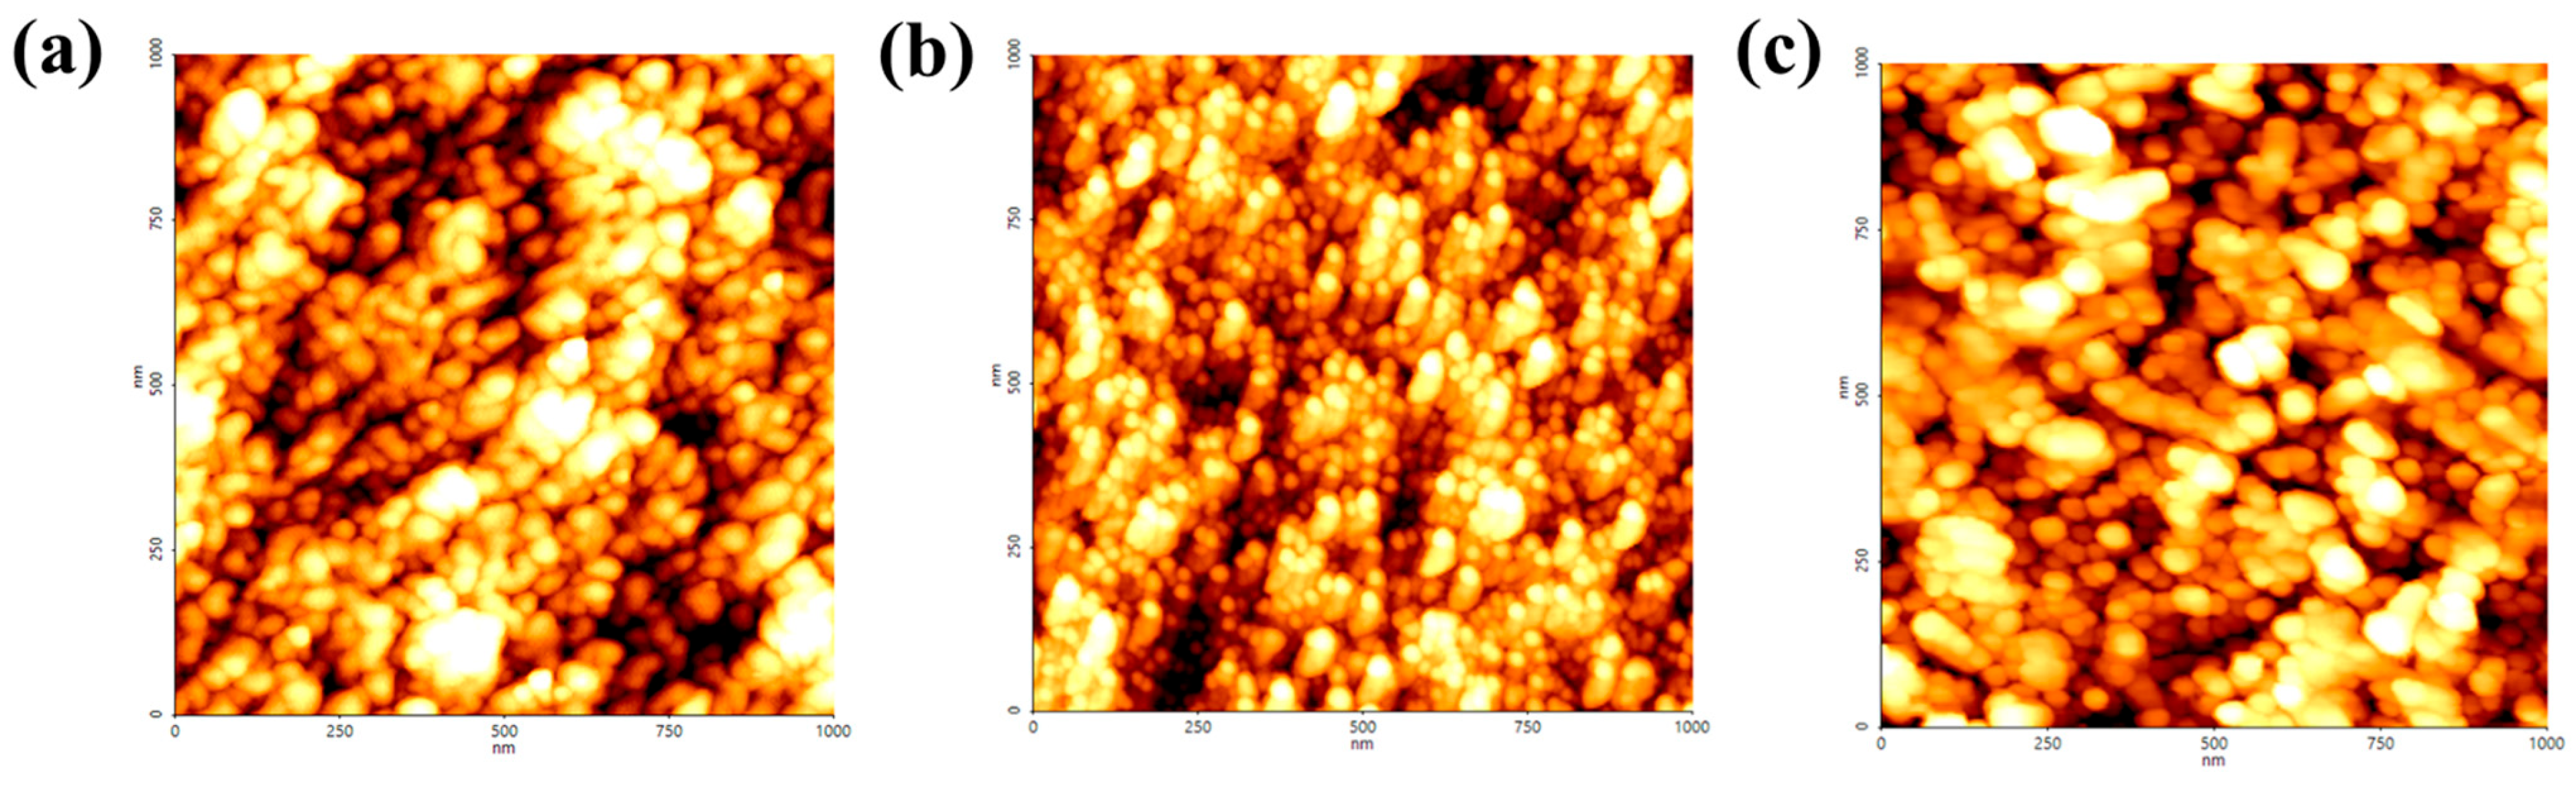
4.5. Morphological and Elemental Compositional Characteristics
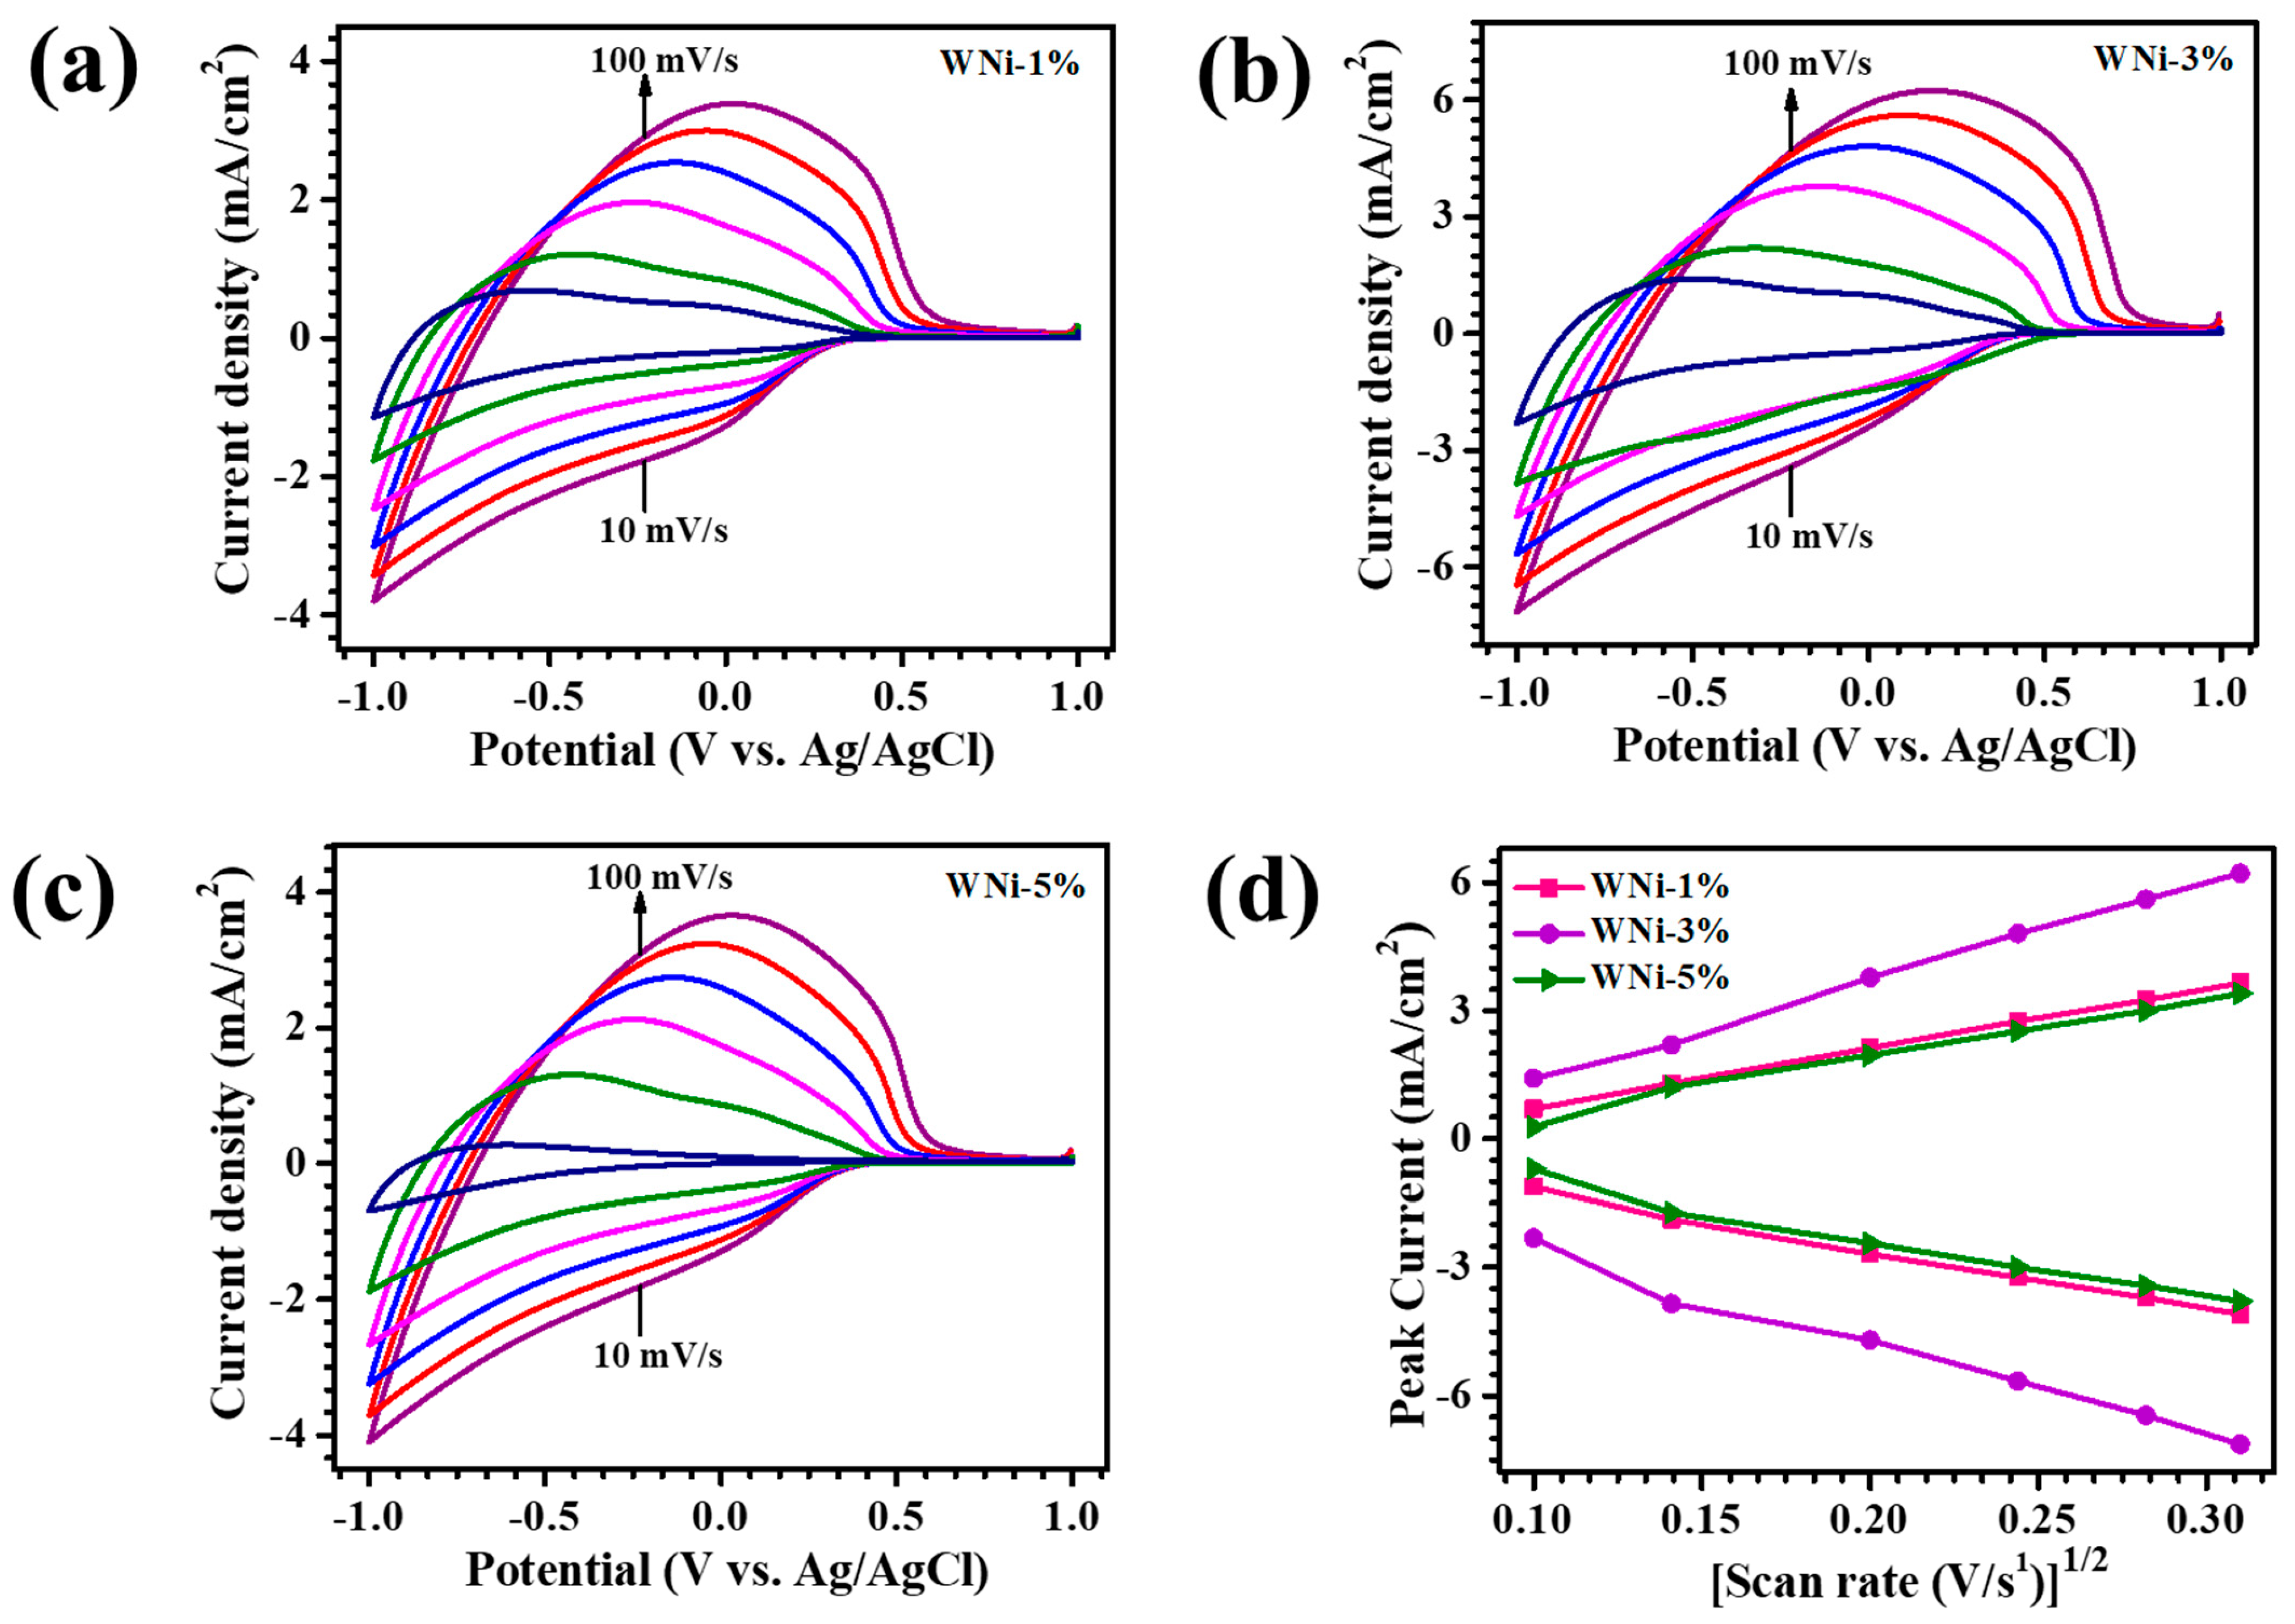
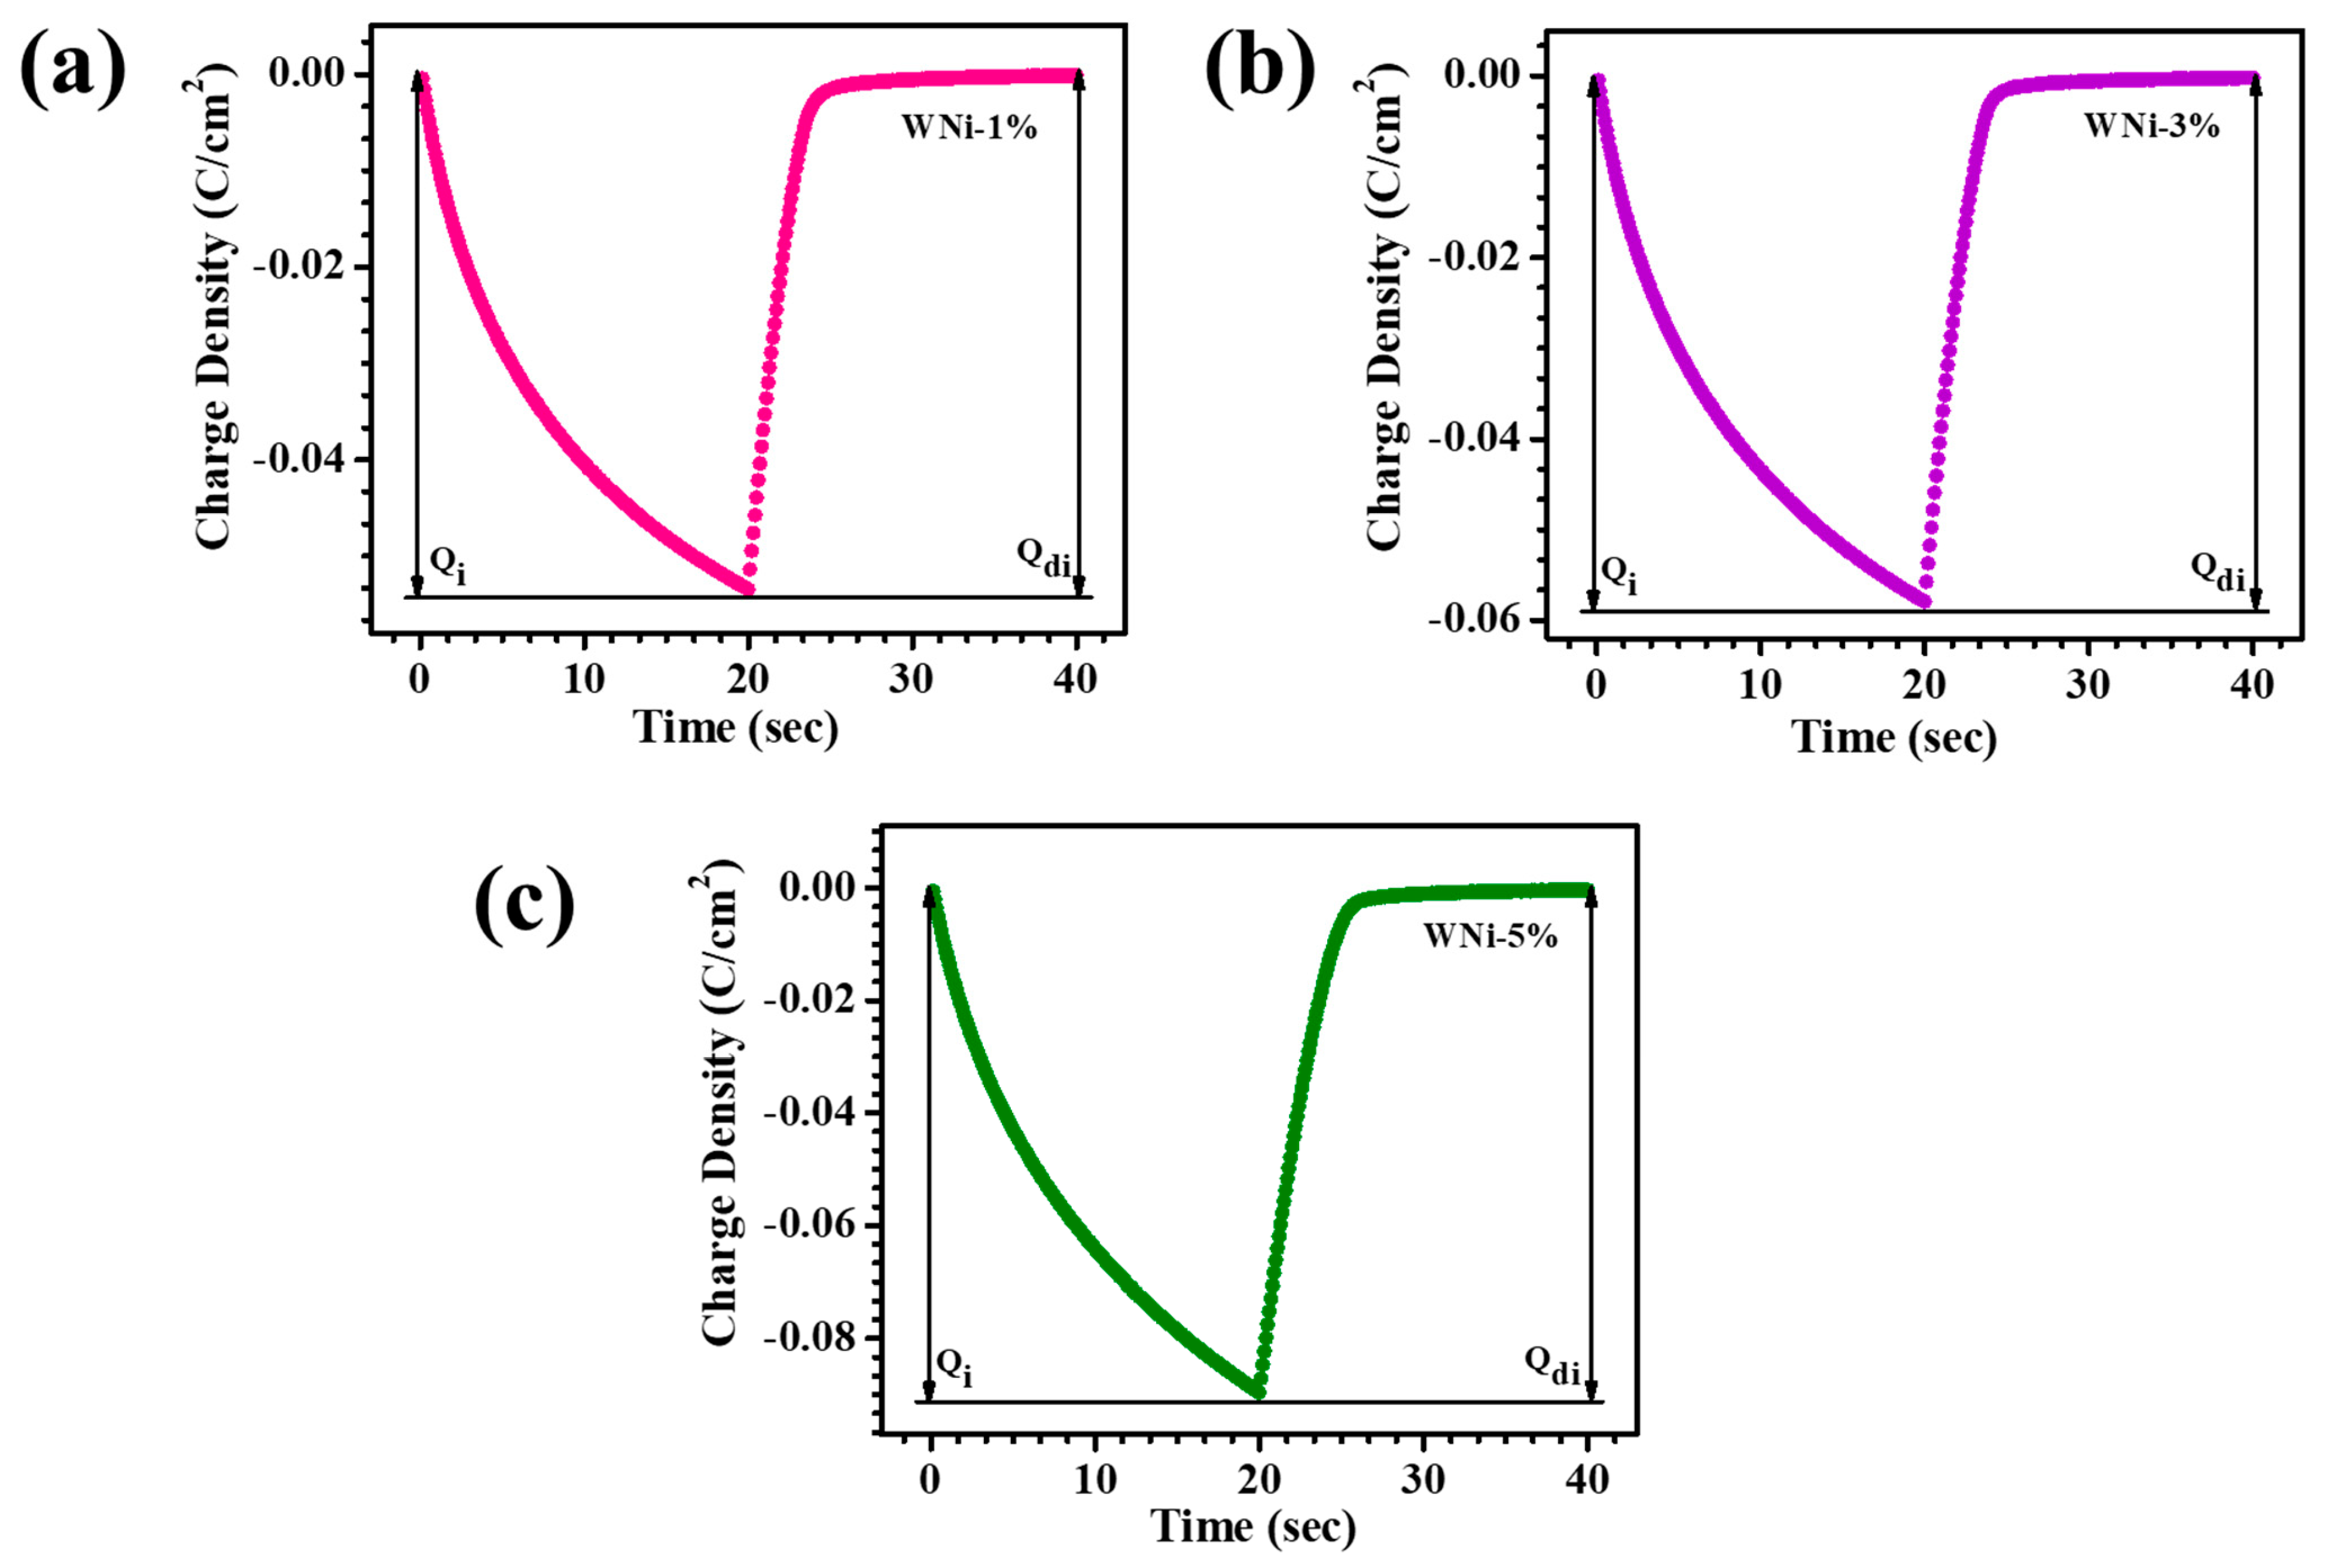
5. Electrochromic Analysis
6. Conclusions
Supplementary Materials
Author Contributions
Funding
Institutional Review Board Statement
Informed Consent Statement
Data Availability Statement
Conflicts of Interest
References
- Chen, S.; Takata, T.; Domen, K. Particulate Photocatalysts for Overall Water Splitting. Nat. Rev. Mater. 2017, 2, 17050. [Google Scholar] [CrossRef]
- Shi, Y.; Zhang, B. Recent Advances in Transition Metal Phosphide Nanomaterials: Synthesis and Applications in Hydrogen Evolution Reaction. Chem. Soc. Rev. 2016, 45, 1529–1541. [Google Scholar] [CrossRef] [PubMed]
- Kment, S.; Riboni, F.; Pausova, S.; Wang, L.; Wang, L.; Han, H.; Hubicka, Z.; Krysa, J.; Schmuki, P.; Zboril, R. Photoanodes Based on TiO2 and α-Fe2O3 for Solar Water Splitting-Superior Role of 1D Nanoarchitectures and of Combined Heterostructures. Chem. Soc. Rev. 2017, 46, 3716–3769. [Google Scholar] [CrossRef]
- Cai, G.; Park, S.; Cheng, X.; Eh, A.L.S.; Lee, P.S. Inkjet-Printed Metal Oxide Nanoparticles on Elastomer for Strain-Adaptive Transmissive Electrochromic Energy Storage Systems. Sci. Technol. Adv. Mater. 2018, 19, 759–770. [Google Scholar] [CrossRef]
- Patil, R.A.; Devan, R.S.; Lin, J.H.; Liou, Y.; Ma, Y.R. An Efficient Methodology for Measurement of the Average Electrical Properties of Single One-Dimensional NiO Nanorods. Sci. Rep. 2013, 3, 7–9. [Google Scholar] [CrossRef]
- Jensen, J.; Hösel, M.; Dyer, A.L.; Krebs, F.C. Development and Manufacture of Polymer-Based Electrochromic Devices. Adv. Funct. Mater. 2015, 25, 2073–2090. [Google Scholar] [CrossRef]
- Thakur, V.K.; Ding, G.; Ma, J.; Lee, P.S.; Lu, X. Hybrid Materials and Polymer Electrolytes for Electrochromic Device Applications. Adv. Mater. 2012, 24, 4071–4096. [Google Scholar] [CrossRef]
- Moser, M.L.; Li, G.; Chen, M.; Bekyarova, E.; Itkis, M.E.; Haddon, R.C. Fast Electrochromic Device Based on Single-Walled Carbon Nanotube Thin Films. Nano Lett. 2016, 16, 5386–5393. [Google Scholar] [CrossRef] [PubMed]
- Deb, S.K. A Novel Electrophotographic System. Appl. Opt. 1969, 8, 192–195. [Google Scholar] [CrossRef]
- Morankar, P.J.; Amate, R.U.; Teli, A.M.; Chavan, G.T.; Beknalkar, S.A.; Dalavi, D.S.; Ahir, N.A.; Jeon, C.W. Surfactant Integrated Nanoarchitectonics for Controlled Morphology and Enhanced Functionality of Tungsten Oxide Thin Films in Electrochromic Supercapacitors. J. Energy Storage 2023, 73, 109095. [Google Scholar] [CrossRef]
- Quy, V.H.V.; Jo, I.R.; Kang, S.H.; Ahn, K.S. Amorphous-Crystalline Dual Phase WO3 Synthesized by Pulsed-Voltage Electrodeposition and its Application to Electrochromic Devices. J. Ind. Eng. Chem. 2021, 94, 264–271. [Google Scholar] [CrossRef]
- Amate, R.U.; Morankar, P.J.; Chavan, G.T.; Teli, A.M.; Desai, R.S.; Dalavi, D.S.; Jeon, C.W. Bi-Functional Electrochromic Supercapacitor Based on Hydrothermal-Grown 3D Nb2O5 Nanospheres. Electrochim. Acta 2023, 459, 142522. [Google Scholar] [CrossRef]
- More, A.J.; Patil, R.S.; Dalavi, D.S.; Suryawanshi, M.P.; Burungale, V.V.; Kim, J.H.; Patil, P.S. Synthesis and Charcaterization of Potentiostatically Electrodeposited Tungsten Oxide Thin Films for Smart Window Application. J. Electron. Mater. 2017, 46, 974–981. [Google Scholar] [CrossRef]
- Bathe, S.R.; Patil, P.S. Influence of Nb Doping on the Electrochromic Properties of WO3 Films. J. Phys. D Appl. Phys. 2007, 40, 7423–7431. [Google Scholar] [CrossRef]
- Chavan, G.T.; Morankar, P.J.; Ahir, N.A.; Teli, A.M.; Rosaiah, P.; Ahmed, B.; Syed, A.; Elgorban, A.M.; An, J.; Jeon, C.W. Synthesis of Multinary Composite (NiMnCuCoS) Electrodes: Aqueous Hybrid Supercapacitors. J. Alloys Compd. 2023, 968, 171966. [Google Scholar] [CrossRef]
- Mineo, G.; Ruffino, F.; Mirabella, S.; Bruno, E. Investigation of WO3 Electrodeposition Leading to Nanostructured Thin Films. Nanomaterials 2020, 10, 1493. [Google Scholar] [CrossRef] [PubMed]
- Shahrim, N.A.; Ahmad, Z.; Wong Azman, A.; Fachmi Buys, Y.; Sarifuddin, N. Mechanisms for Doped PEDOT:PSS Electrical Conductivity Improvement. Mater. Adv. 2021, 2, 7118–7138. [Google Scholar] [CrossRef]
- Cui, B.; Guo, C.; Zhang, Z.; Fu, G. Construction of a Novel Self-Bleaching Photochromic Hydrogel Embraced within the Zn-MOF@WO3 Junction for Assembling UV-Irradiated Smart Rewritable Device. Chem. Eng. J. 2023, 455, 140822. [Google Scholar] [CrossRef]
- Rastgoo-Deylami, M.; Javanbakht, M.; Omidvar, H.; Hooshyari, K.; Salarizadeh, P.; Askari, M.B. Nickel-Doped Monoclinic WO3 as High Performance Anode Material for Rechargeable Lithium Ion Battery. J. Electroanal. Chem. 2021, 894, 115383. [Google Scholar] [CrossRef]
- Green, S.V.; Pehlivan, E.; Granqvist, C.G.; Niklasson, G.A. Electrochromism in Sputter Deposited Nickel-Containing Tungsten Oxide Films. Sol. Energy Mater. Sol. Cells 2012, 99, 339–344. [Google Scholar] [CrossRef]
- Green, S.V.; Kuzmin, A.; Purans, J.; Granqvist, C.G.; Niklasson, G.A. Structure and Composition of Sputter-Deposited Nickel-Tungsten Oxide Films. Thin Solid Films 2011, 519, 2062–2066. [Google Scholar] [CrossRef]
- De León, J.M.O.R.; Acosta, D.R.; Pal, U.; Castañeda, L. Improving Electrochromic Behavior of Spray Pyrolised WO3 Thin Solid Films by Mo Doping. Electrochim. Acta 2011, 56, 2599–2605. [Google Scholar] [CrossRef]
- Cai, G.F.; Wang, X.L.; Zhou, D.; Zhang, J.H.; Xiong, Q.Q.; Gu, C.D.; Tu, J.P. Hierarchical Structure Ti-Doped WO3 Film with Improved Electrochromism in Visible-Infrared Region. RSC Adv. 2013, 3, 6896–6905. [Google Scholar] [CrossRef]
- Prasad, A.K.; Park, J.-Y.; Jung, H.Y.; Kang, J.W.; Kang, S.H.; Ahn, K.-S. Electrochemical Deposition of Ni-WO3 Thin-Film Composites for Electrochromic Energy Storage Applications: Novel Approach Toward Quantum-Dot-Sensitized Solar Cell-Assisted Ni-WO3 Electrochromic Device. J. Ind. Eng. Chem. 2023, 117, 500–509. [Google Scholar] [CrossRef]
- Chithambararaj, A.; Nandigana, P.; Kaleesh Kumar, M.; Prakash, A.S.; Panda, S.K. Enhanced Electrochromism from Non-Stoichiometric Electrodeposited Tungsten Oxide Thin Films. Appl. Surf. Sci. 2022, 582, 152424. [Google Scholar] [CrossRef]
- Wang, J.; Khoo, E.; Lee, P.S.; Ma, J. Synthesis, Assembly, and Electrochromic Properties of Uniform Crystalline WO3 Nanorods. J. Phys. Chem. C 2008, 112, 14306–14312. [Google Scholar] [CrossRef]
- Her, Y.C.; Chang, C.C. Facile Synthesis of One-Dimensional Crystalline/Amorphous Tungsten Oxide Core/Shell Heterostructures with Balanced Electrochromic Properties. CrystEngComm 2014, 16, 5379–5386. [Google Scholar] [CrossRef]
- Zhao, Y.; Zhang, X.; Chen, X.; Li, W.; Wang, L.; Ren, F.; Zhao, J.; Endres, F.; Li, Y. Preparation of WO3Films with Controllable Crystallinity for Improved Near-Infrared Electrochromic Performances. ACS Sustain. Chem. Eng. 2020, 8, 11658–11666. [Google Scholar] [CrossRef]
- Li, W.; Zhang, J.; Zheng, Y.; Cui, Y. High Performance Electrochromic Energy Storage Devices Based on Mo-Doped Crystalline/Amorphous WO3 Core-Shell Structures. Sol. Energy Mater. Sol. Cells 2022, 235, 111488. [Google Scholar] [CrossRef]
- Mehmood, F.; Iqbal, J.; Ismail, M.; Mehmood, A. Ni Doped WO3 Nanoplates: An Excellent Photocatalyst and Novel Nanomaterial for Enhanced Anticancer Activities. J. Alloys Compd. 2018, 746, 729–738. [Google Scholar] [CrossRef]
- Chatzikyriakou, D.; Krins, N.; Gilbert, B.; Colson, P.; Dewalque, J.; Denayer, J.; Cloots, R.; Henrist, C. Mesoporous Amorphous Tungsten Oxide Electrochromic Films: A Raman Analysis of Their Good Switching Behavior. Electrochim. Acta 2014, 137, 75–82. [Google Scholar] [CrossRef]
- Berruet, M.; Pereyra, C.J.; Mhlongo, G.H.; Dhlamini, M.S.; Hillie, K.T.; Vázquez, M.; Marotti, R.E. Optical and Structural Properties of Nanostructured ZnO Thin Films Deposited onto FTO/Glass Substrate by a Solution-Based Technique. Opt. Mater. 2013, 35, 2721–2727. [Google Scholar] [CrossRef]
- Sarycheva, A.; Gogotsi, Y. Raman Spectroscopy Analysis of the Structure and Surface Chemistry of Ti3C2T XMXene. Chem. Mater. 2020, 32, 3480–3488. [Google Scholar] [CrossRef]
- Lee, S.H.; Cheong, H.M.; Tracy, C.E.; Mascarenhas, A.; Benson, D.K.; Deb, S.K. Raman Spectroscopic Studies of Electrochromic A-WO3. Electrochim. Acta 1999, 44, 3111–3115. [Google Scholar] [CrossRef]
- Chavan, G.T.; Amate, R.U.; Lee, H.; Syed, A.; Bahkali, A.H.; Elgorban, A.M.; Jeon, C.W. Rational Design of 3D Hollow Cube Architecture for Next-Generation Efficient Aqueous Asymmetric Supercapacitors. J. Energy Storage 2023, 61, 106757. [Google Scholar] [CrossRef]
- Chen, L.; Zhu, X.; Liu, Y.; Yang, L.; Su, J.; He, Z.; Tang, B. Electrochromic Properties of Ni or Ti Single-Doped and Ni-Ag or Ti-Ag Binary-Doped WO3 Thin Films. Electrochim. Acta 2024, 475, 143644. [Google Scholar] [CrossRef]
- Navale, S.T.; Mali, V.V.; Pawar, S.A.; Mane, R.S.; Naushad, M.; Stadler, F.J.; Patil, V.B. Electrochemical Supercapacitor Development Based on Electrodeposited Nickel Oxide Film. RSC Adv. 2015, 5, 51961–51965. [Google Scholar] [CrossRef]
- Girija, N.; Kuttan, S.S.; Anusree, T.K.; Nair, B.N.; Mohamed, A.A.P.; Hareesh, U.N.S. Nickel Foam-Supported NiCo2O4 Urchin-Shaped Microparticles Sheathed with NiCoO2 Nanosheets as Electrolyte-Wettable Electrodes for Supercapacitors. ACS Appl. Nano Mater. 2022, 5, 14529–14539. [Google Scholar] [CrossRef]
- Cartwright, J.H.; Piro, O.; Tuval, I. Ostwald Ripening, Chiral Crystallization, and the Common-ancestor Effect. Phys. Rev. Lett. 2007, 98, 165501. [Google Scholar] [CrossRef]
- Frank, F.C. On Spontaneous Asymmetric Synthesis. Biochim. Biophys. Acta 1953, 11, 459–463. [Google Scholar] [CrossRef]
- Zhou, J.; Wei, Y.; Luo, G.; Zheng, J.; Xu, C. Electrochromic Properties of Vertically Aligned Ni-doped WO3 Nanostructure Films and Their Application in Complementary Electrochromic Devices. J. Mater. Chem. C 2016, 4, 1613–1622. [Google Scholar] [CrossRef]
- Ahmad, K.; Kim, H. Fabrication of Nickel-Doped Tungsten Trioxide Thin Film-Based Highly Stable Flexible Electrochromic Devices for Smart Window Applications. ACS Sustain. Chem. Eng. 2023, 11, 10746–10754. [Google Scholar] [CrossRef]
- Jo, M.H.; Kim, K.H.; Ahn, H.J. P-doped Carbon Quantum Dot Graft-Functionalized Amorphous WO3 For Stable and Flexible Electrochromic Energy-Storage Devices. Chem. Eng. J. 2022, 445, 136826. [Google Scholar] [CrossRef]
- Rakibuddin, M.; Shinde, M.A.; Kim, H. Sol-gel Fabrication of NiO and NiO/WO3 Based Electrochromic Device on ITO and Flexible Substrate. Ceram. Int. 2020, 46, 8631–8639. [Google Scholar] [CrossRef]
- Wang, Y.; Shen, G.; Tang, T.; Zeng, J.; Sagar, R.R.; Qi, X.; Liang, T. Construction of Doped-Rare Earth (Ce, Eu, Sm, Gd) WO3 Porous Nanofilm for Superior Electrochromic and Energy Storage Windows. Electrochim. Acta 2022, 412, 140099. [Google Scholar] [CrossRef]


| Sample Code | Diffusion Coefficient (cm2/s × 10−9) | Qi (C/cm2) | Qdi (C/cm2) | Reversibility | tc (s) | tb (s) | Tb (%) | Tc (%) | ΔT600nm (%) | ΔOD | Coloration Efficiency (cm2/C) | |
|---|---|---|---|---|---|---|---|---|---|---|---|---|
| Reduction | Oxidation | |||||||||||
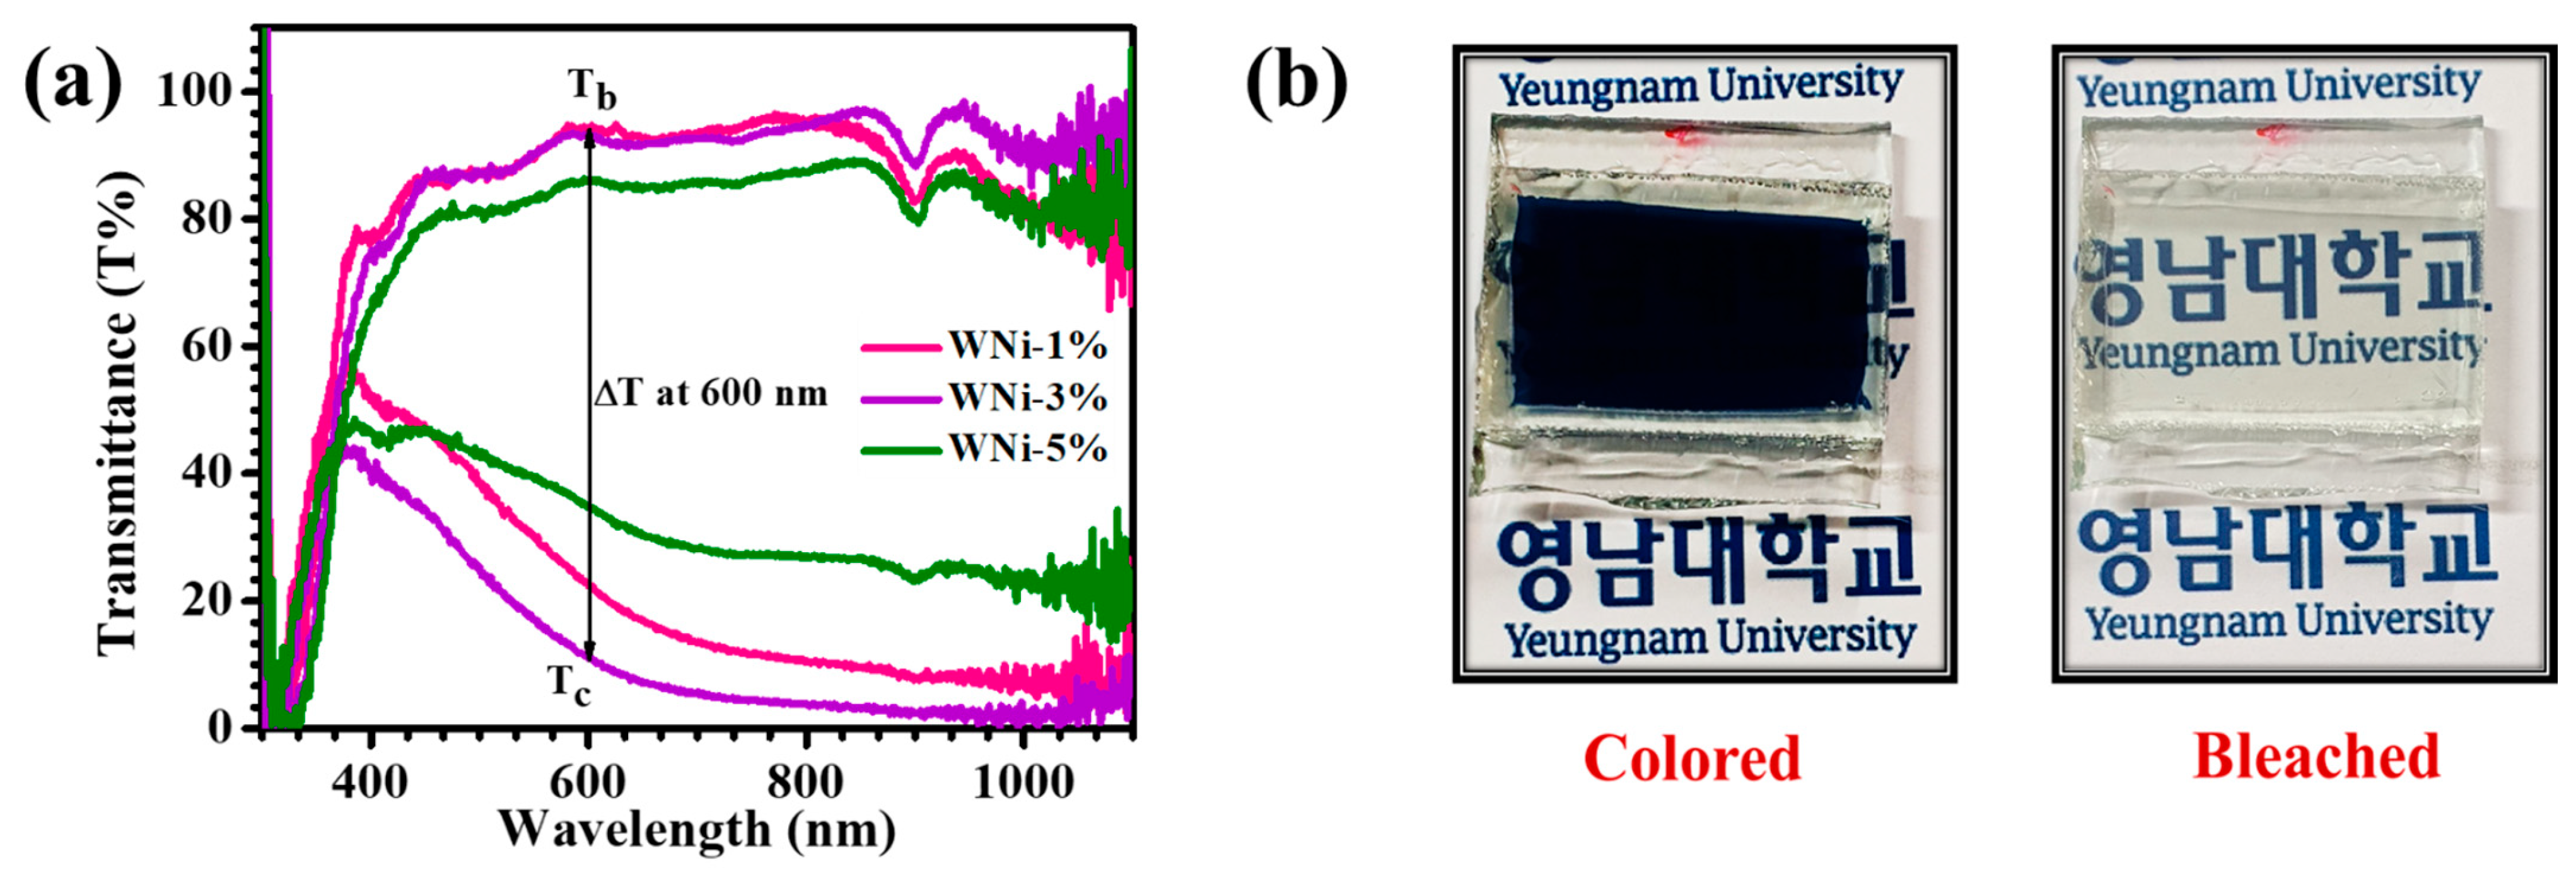
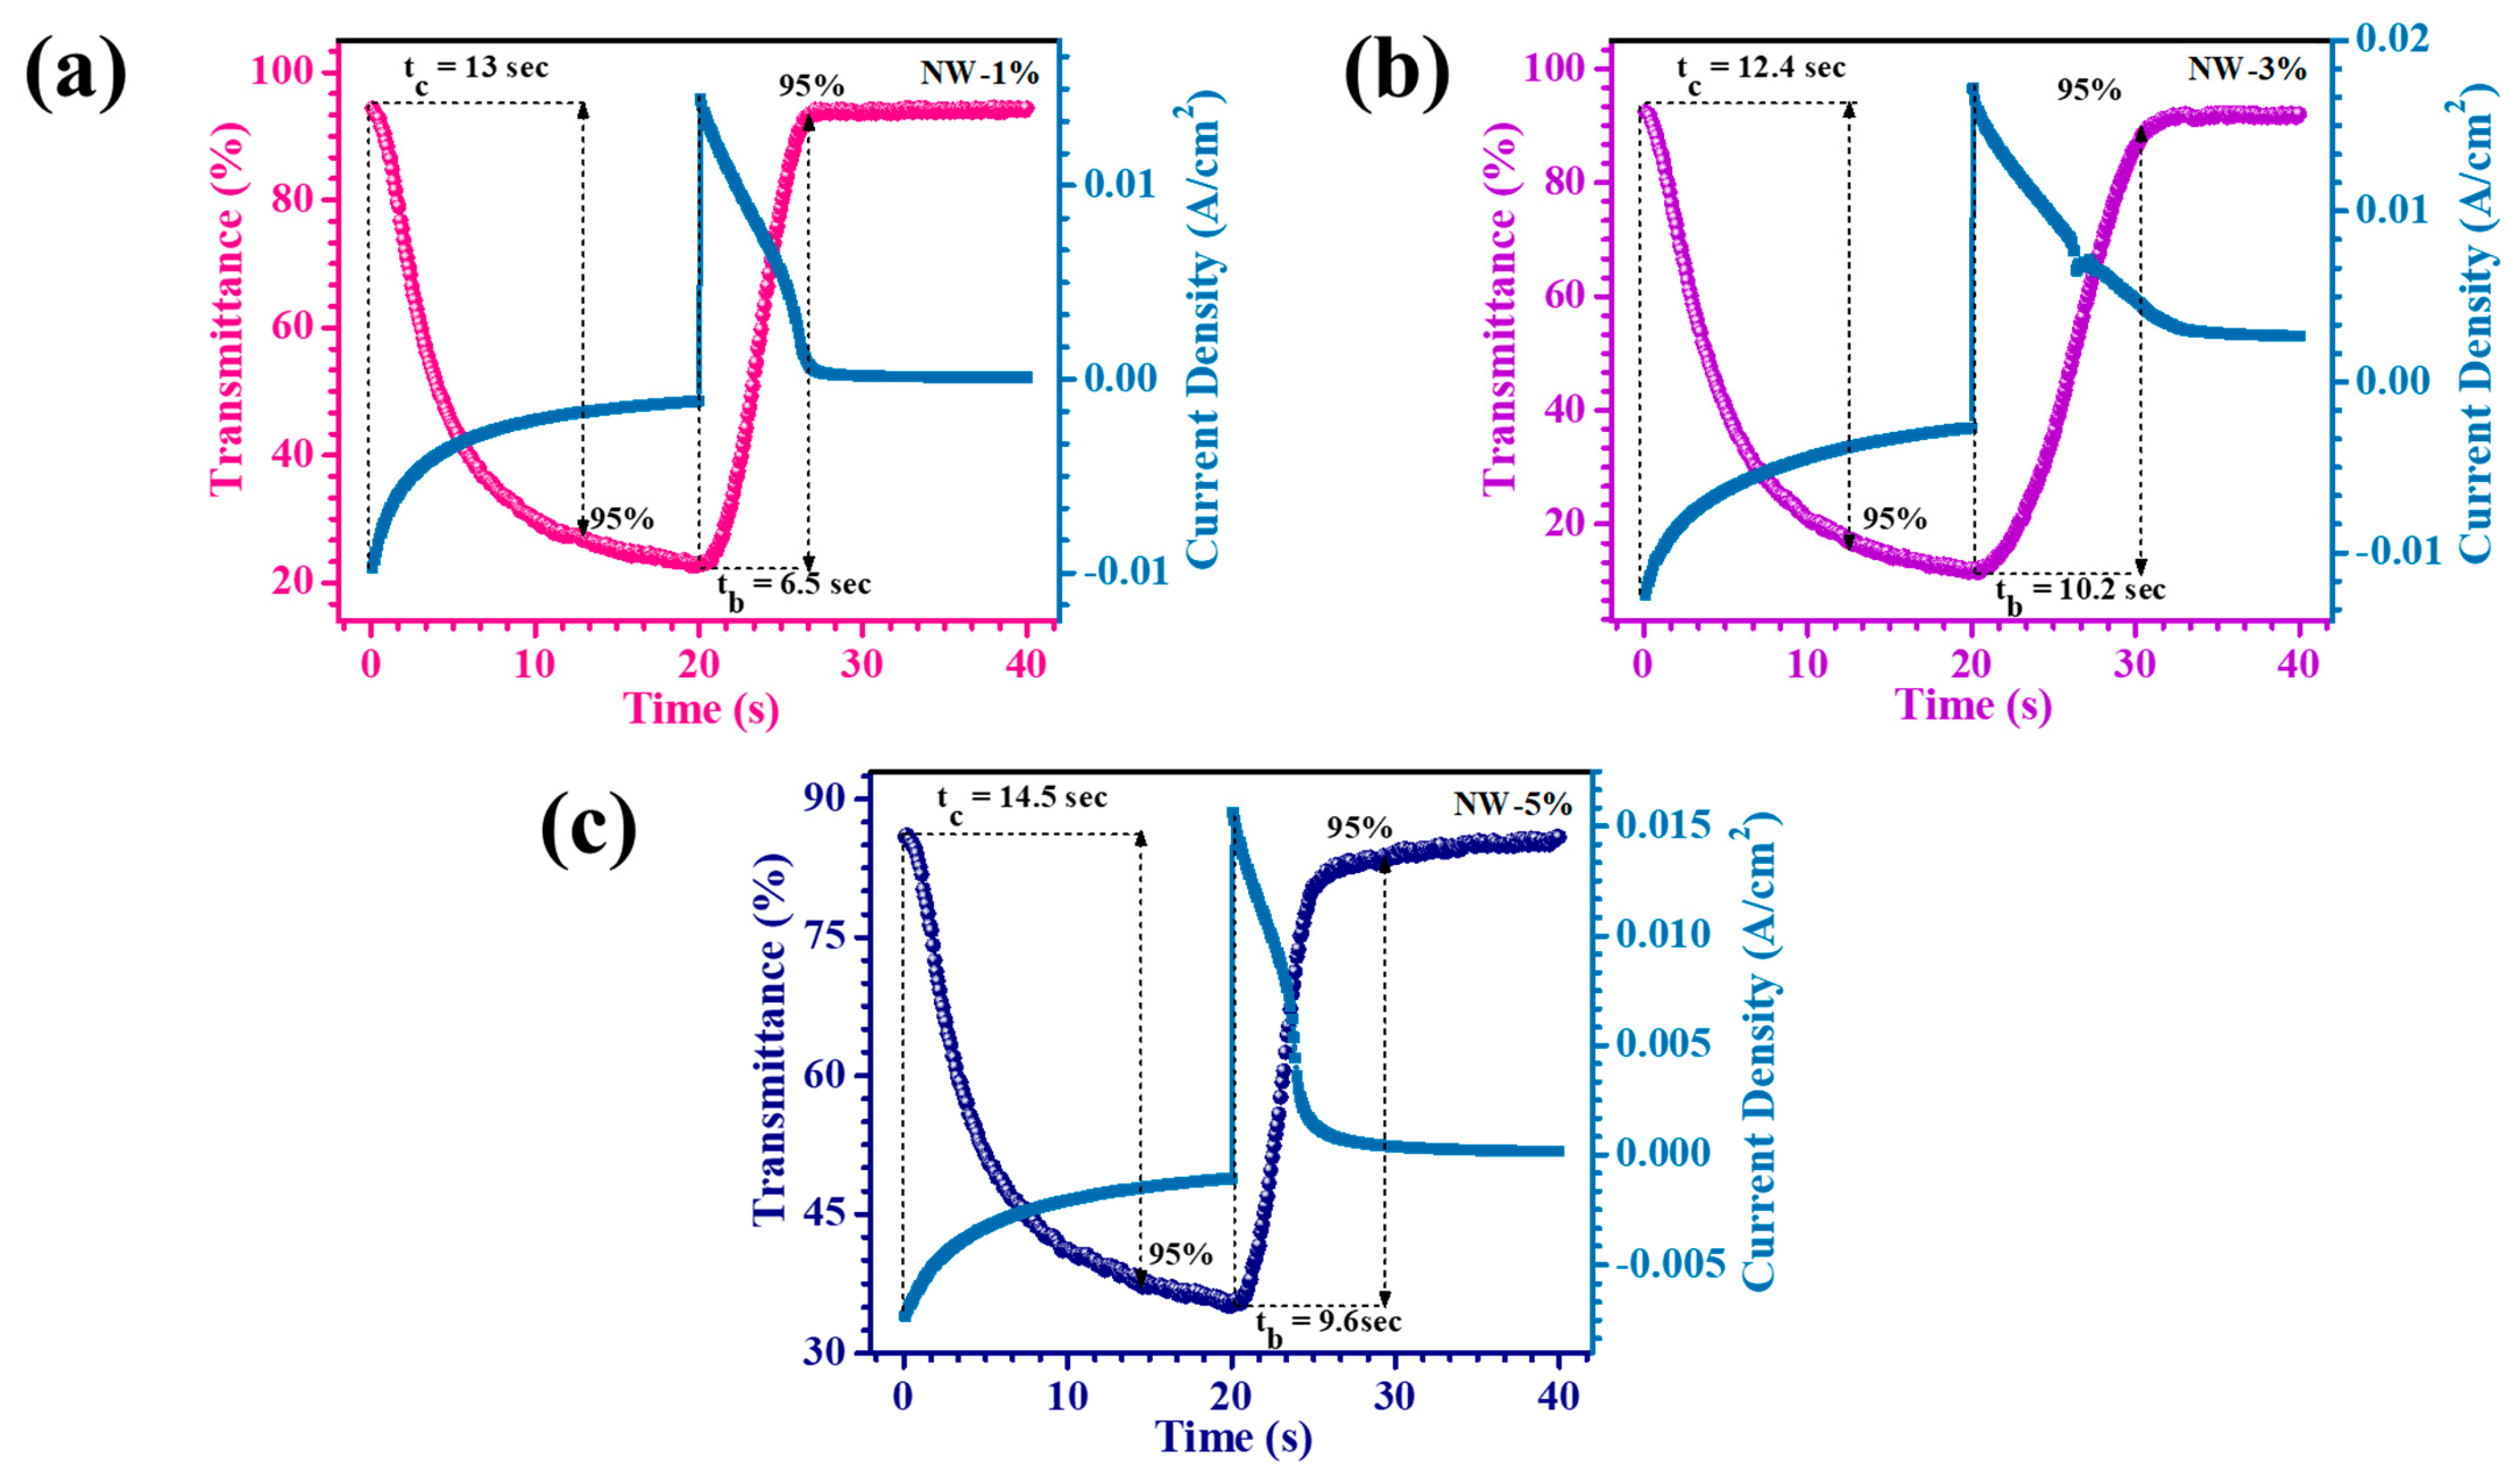
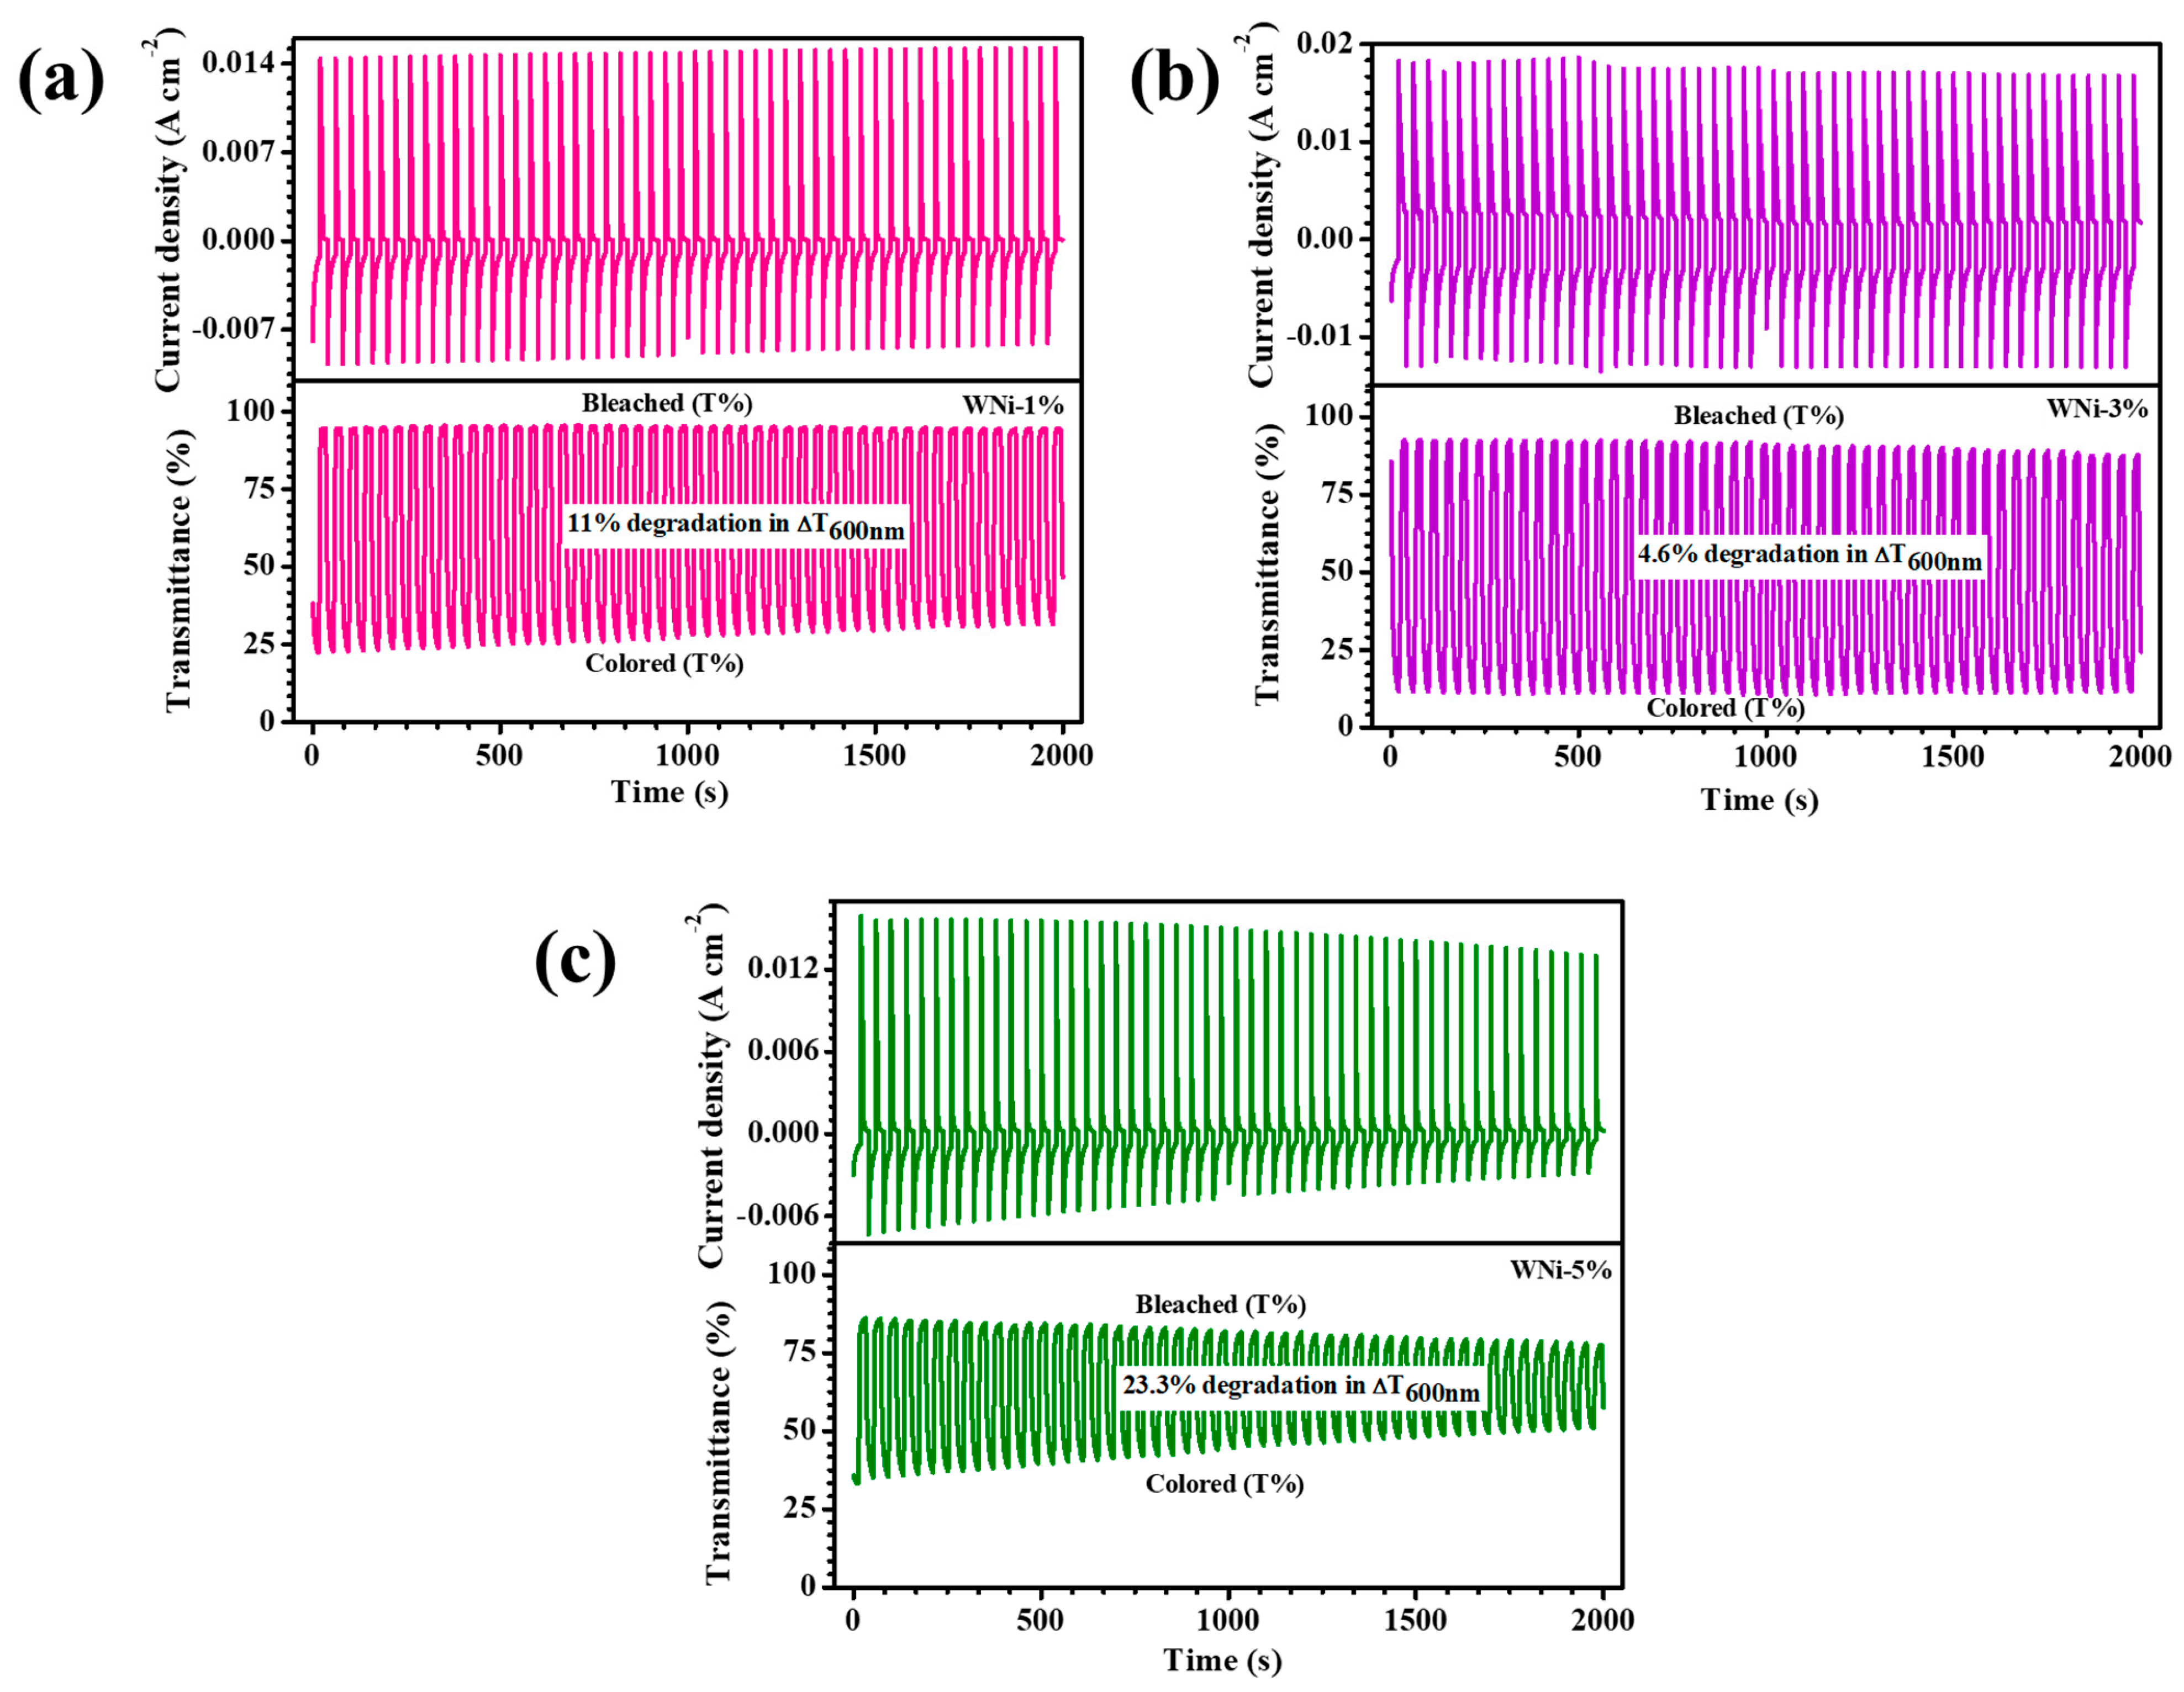
| WNi-1% | 0.44 | 0.16 | 0.54 | 0.53 | 98.1% | 13 | 6.5 | 94.2 | 22.4 | 71.8 | 1.436 | 53.18 |
| WNi-3% | 1.86 | 0.7 | 0.573 | 0.57 | 99.4% | 12.4 | 10.2 | 92.8 | 10.9 | 81.9 | 2.141 | 75.12 |
| WNi-5% | 0.17 | 0.025 | 0.9 | 0.86 | 95.5% | 14.5 | 9.6 | 86.3 | 34 | 52.3 | 0.100 | 22.22 |
Disclaimer/Publisher’s Note: The statements, opinions and data contained in all publications are solely those of the individual author(s) and contributor(s) and not of MDPI and/or the editor(s). MDPI and/or the editor(s) disclaim responsibility for any injury to people or property resulting from any ideas, methods, instructions or products referred to in the content. |
© 2024 by the authors. Licensee MDPI, Basel, Switzerland. This article is an open access article distributed under the terms and conditions of the Creative Commons Attribution (CC BY) license (https://creativecommons.org/licenses/by/4.0/).
Share and Cite
Morankar, P.J.; Amate, R.U.; Teli, A.M.; Beknalkar, S.A.; Jeon, C.-W. Unveiling Nanogranular Advancements in Nickel-Doped Tungsten Oxide for Superior Electrochromic Performance. Coatings 2024, 14, 320. https://doi.org/10.3390/coatings14030320
Morankar PJ, Amate RU, Teli AM, Beknalkar SA, Jeon C-W. Unveiling Nanogranular Advancements in Nickel-Doped Tungsten Oxide for Superior Electrochromic Performance. Coatings. 2024; 14(3):320. https://doi.org/10.3390/coatings14030320
Chicago/Turabian StyleMorankar, Pritam J., Rutuja U. Amate, Aviraj M. Teli, Sonali A. Beknalkar, and Chan-Wook Jeon. 2024. "Unveiling Nanogranular Advancements in Nickel-Doped Tungsten Oxide for Superior Electrochromic Performance" Coatings 14, no. 3: 320. https://doi.org/10.3390/coatings14030320