Article

Degradation Rate Control Issues of PEO-Coated Wrought Mg0.5Zn0.2Ca Alloy

1
Departamento de Ingeniería Química y de Materiales, Facultad de Ciencias Químicas, Universidad Complutense de Madrid, 28040 Madrid, Spain
2
Materials Science Department, Faculty of Engineering, University of Mons, 20, Place du Parc, 7000 Mons, Belgium
3
Unidad Asociada al ICTP, IQM (CSIC), Grupo de Síntesis Orgánica y Bioevaluación, Instituto Pluridisciplinar (UCM), Paseo de Juan XXIII 1, 28040 Madrid, Spain
*
Author to whom correspondence should be addressed.
Coatings 2024, 14(3), 309; https://doi.org/10.3390/coatings14030309
Submission received: 11 January 2024 / Revised: 26 February 2024 / Accepted: 27 February 2024 / Published: 2 March 2024
(This article belongs to the Special Issue Plasma Electrolytic Oxidation (PEO) Coatings, 2nd Edition)

Abstract

:
Bioactive plasma electrolytic oxidation (PEO) coatings were developed on a wrought Mg0.5Zn0.2Ca alloy using a transparent electrolyte for easy maintenance and waste disposal, compared to a conventional suspension-based solution. Treatment times of 300, 600, and 900 s were evaluated for their effects on coating morphology, composition, and corrosion resistance. A short-time electrochemical impedance spectroscopy (EIS) screening was utilized to identify coatings with optimal corrosion protection. To assess the degradation rate and corrosion mechanisms, hydrogen evolution was monitored under pH-controlled quasi-in vivo conditions over extended immersion periods. Coating thickness increased by only 3% from 300 to 900 s of treatment (13 and 18 µm, respectively), with pore bands formed near the barrier layer at 900 s. The short-term EIS screening revealed that the coatings produced at 600 and 900 s were less protective and consistent than those at 300 s due to the presence of pore bands, which increased permeability. Hydrogen evolution measurements during 5 days of immersion at pH 7.4 indicated a tenfold higher degradation rate of the PEO-coated alloy compared to the bare substrate. Therefore, none of the PEO coatings provided effective corrosion protection after 24 h of immersion, which is attributed to crack formation at the PEO/corrosion products interface. This highlights the importance of crevices in the corrosion of Mg-Zn-Ca alloys. The presence of ZnO exacerbates the corrosion of magnesium in crevice areas.

1. Introduction

In recent decades, Mg and its alloys have been of great interest as temporary implants due to their good biocompatibility and mechanical properties similar to bone [1,2]. Most biomedical Mg alloys approved for clinical use up to date contain rare earths (RE) which might lead to toxicity problems in the human body [3]. The non-toxicity of alloying elements is becoming a priority in alloy design. In this regard, zinc (Zn) and calcium (Ca) are of great interest; (i) Zn is involved in mineralization, DNA synthesis, hormonal activity, and antibacterial response; (ii) Ca is an essential element in the human body because it is the main component of bone and is involved in cell-signaling reactions [4,5].
Newly developed biodegradable Mg-Zn-Ca alloys have shown excellent mechanical properties and great biocompatibility [6,7,8,9]. However, the main concern of that system is a high degradation rate that indirectly delays recovery at the surgical site, due to the generation of gas pockets caused by hydrogen evolution [10]. Most of the degradation studies of Mg-Zn-Ca systems were performed on cast alloys [11,12,13,14], while much fewer data exist on extruded alloys [15,16,17,18].
Plasma electrolytic oxidation (PEO) is a flexible method of surface protection and functionalization of Mg alloys [19,20]. It allows for a wide variation in composition, microstructure, porosity, and roughness of the coatings through the modification of the electrolyte and process parameters [21]. PEO-coated Mg alloys commonly demonstrate enhanced corrosion resistance [22,23]. However, most of the research has been applied to Mg-Al-Zn system alloys, and less work has been conducted in Al-free systems for biomedical purposes. For instance, in the case of Mg-Zn-Ca systems, PEO has been only applied to as-cast alloys, the findings showing a 2–4 times improvement in the corrosion performance in SBF medium [24,25,26,27,28,29]. It should be noted that in most cases PEO systems have been evaluated by electrochemical or immersion testing without a tight pH of the medium. Recent studies have indicated that this omission can significantly accelerate the corrosion rate of Mg-Zn-Ca alloys [30].
The Ca-P containing electrolytes used in PEO treatments of Mg alloys are typically based on suspensions which do not offer easy maintenance and waste disposal. Additionally, PEO electrolytes for Mg alloys often contain fluoride compounds for enhanced passivation of Mg. These could negatively affect the cell adhesion and proliferation [26,31]. Transparent Ca-P-based electrolytes have been recently proposed as a more chemically stable and user-friendly alternative and have been applied to Mg-Zn-Ca alloys. To the best of the authors’ knowledge, there is no available data on PEO of extruded Mg-Zn-Ca systems.
The present work focuses on a comparative study of the PEO coatings on a wrought Mg0.5Zn0.2Ca alloy using a suspension electrolyte and a transparent electrolyte, both containing bioactive Ca, Si and P species. The coatings were carried out at three different treatment times (300, 600, and 900 s). The influence of the electrolyte and treatment time was evaluated in terms of composition and morphology, thickness, and corrosion behavior of the coatings. Short-term electrochemical impedance screening of the coated systems was followed up by a longer-term hydrogen evolution test, where the pH was kept constant by a CO2 flow through the medium. The results offer an understanding of the corrosion mechanism of a lean-extruded Mg0.5Zn0.2Ca alloy and highlight the issues with the degradation rate controlled by PEO coating systems.

2. Materials and Experimental Methods

2.1. Materials

The substrate was a wrought Mg0.5Zn0.2Ca alloy supplied by the Institute of Surface Science (Helmholtz-Zentrum Hereon, Geesthacht, Germany), with a composition of (% wt.: 0.5% Zn, 0.2% Ca, 0.001% Ni, 0.001% Cu, 0.002% Fe, 0.01% Si, 0.03% Ag, bal. % Mg) determined by Arc Spark analysis. The alloy was cut into 3.5 mm-thick disks with a diameter of 10 mm. The samples were ground through successive grades of silicon carbide abrasive (up to P1200), rinsed in isopropyl alcohol, and dried in warm air.

2.2. PEO Treatment

PEO treatments were carried out using an alternating current (AC), voltage-controlled power supply (EAC-S2000, ET Systems electronic, Altlußheim, Germany) with a current density of 100 mA/cm2, 50 Hz frequency and +350/−50 V. The experimental setup was equipped with a stainless-steel mesh (AISI 316 of Ø15 cm) along with a 2 L jacketed cell operating at a constant temperature (20 °C). The PEO process was conducted in transparent and suspension-based alkaline Ca-P-Si electrolytes (Table 1) using three different treatment times of 300, 600, and 900 s. After the PEO process, the specimens were rinsed in deionized water, cleaned with isopropyl, and dried in warm air.

2.3. Characterization

Optical micrographs were obtained under polarized light with a Leica DMi8 optical microscope. A chemical etching with an acetic-picral solution (5 g picric acid, 100 mL ethanol, 5 mL acetic acid and 10 mL water) was used to reveal the microstructure.
The coated specimens were examined in plan-view and cross-section views (polish to 1 µm diamond paste) using JEOL JSM-6400 (Freising-Lerchenfeld, Germany) scanning electron microscopy equipped with an energy dispersive X-ray (EDS). The coating thicknesses were determined with an ISOSCOPE FMP10 eddy current meter (Fischer, Munich, Germany), equipped with an FTA3.3H probe. The coating porosity was analyzed with ImageJ software V.1.8.0 using at least three SEM plan-view micrographs at ×1000 magnification for each coating.
The roughness parameters, Sa (arithmetical mean height of the area) and S10z (Ten-point height), were evaluated using a focus-variation optical 3D profilometer (InfiniteFocus SL, ALICONA, Utrecht, The Netherlands).
Phase identification was carried out by X-ray diffraction (XRD) analysis using Philips X’Pert (Malvern, UK) diffractometer. XRD patterns are analyzed by ICDD PDF4+ database. The XRD spectra were acquired in the range of 2Ɵ range: 10 to 90° with a step size of 0.04° and a dwell time of 1 s per step.

2.4. Electrochemical Measurements

The electrochemical measurements were carried out using a GillAC potentiostat (ACM Instruments, Cartmel Fell, UK). The test was run at 37 °C in a modified α-MEM solution (Minimum Essential Medium Eagle-alpha) prepared in the laboratory and containing only inorganic compounds as follows: 6.8 g/L NaCl, 2.2 g/L NaHCO3, 0.4 g/L KCl, 0.12 g/L Na2HPO4, 0.09 g/L MgSO4, 0.2 g/L CaCl2, and pH adjusted at 7.4 with 0.1 M of HCl. A conventional three electrode cell was used with a graphite counter electrode, an Ag/AgCl-3 M KCl reference electrode, and the specimen as the working electrode (exposed area of ~4.3 cm2).
Potentiodynamic polarization curves were obtained after 1 h of immersion at a scan rate of 0.3 mV/s with potential sweep from −200 mV to +1000 mV (relative to the OCP) using a current density limit of 5 mA/cm2. The corrosion current density was obtained from an analysis of cathodic Tafel slope.
Electrochemical impedance spectroscopy (EIS) measurements were conducted after 1 h of immersion, applying a sinusoidal perturbation of 10 mV amplitude (vs. OCP) and a frequency sweep from 100 kHz to 10 mHz. ZView software V.3.5i was used to analyze the impedance spectra, and a goodness fit was ensured through the square of the standard deviation, which should be <0.01, and the weighted sum of squares (proportional to the average percentage error between the original data points and the calculated values) < 0.1.

2.5. Hydrogen Evolution

The corrosion performance of bare alloy and PEO-coated specimens were carried out with an hydrogen evolution test at 37 °C in inorganic α-MEM solution during 5 days of immersion. The total surface area of the immersed specimens was ~4.3 cm2 and the presented results were tested in triplicate to obtain the average value. The pH of the solution in the immersion tank (~21 L) was continuously adjusted at 7.4 from a flow of CO2 regulated by a switch coupled with a pH sensor (more details on the set-up can be found elsewhere [32]).
Statistical analysis (mean ± standard deviation) of the resulting data was performed using an unpaired t-test with the GraphPad t-test calculator (Dotmatics, Boston, MA, USA, https://www.graphpad.com/quickcalcs/ttest1/ (accessed on 25 February 2024).

3. Results and Discussion

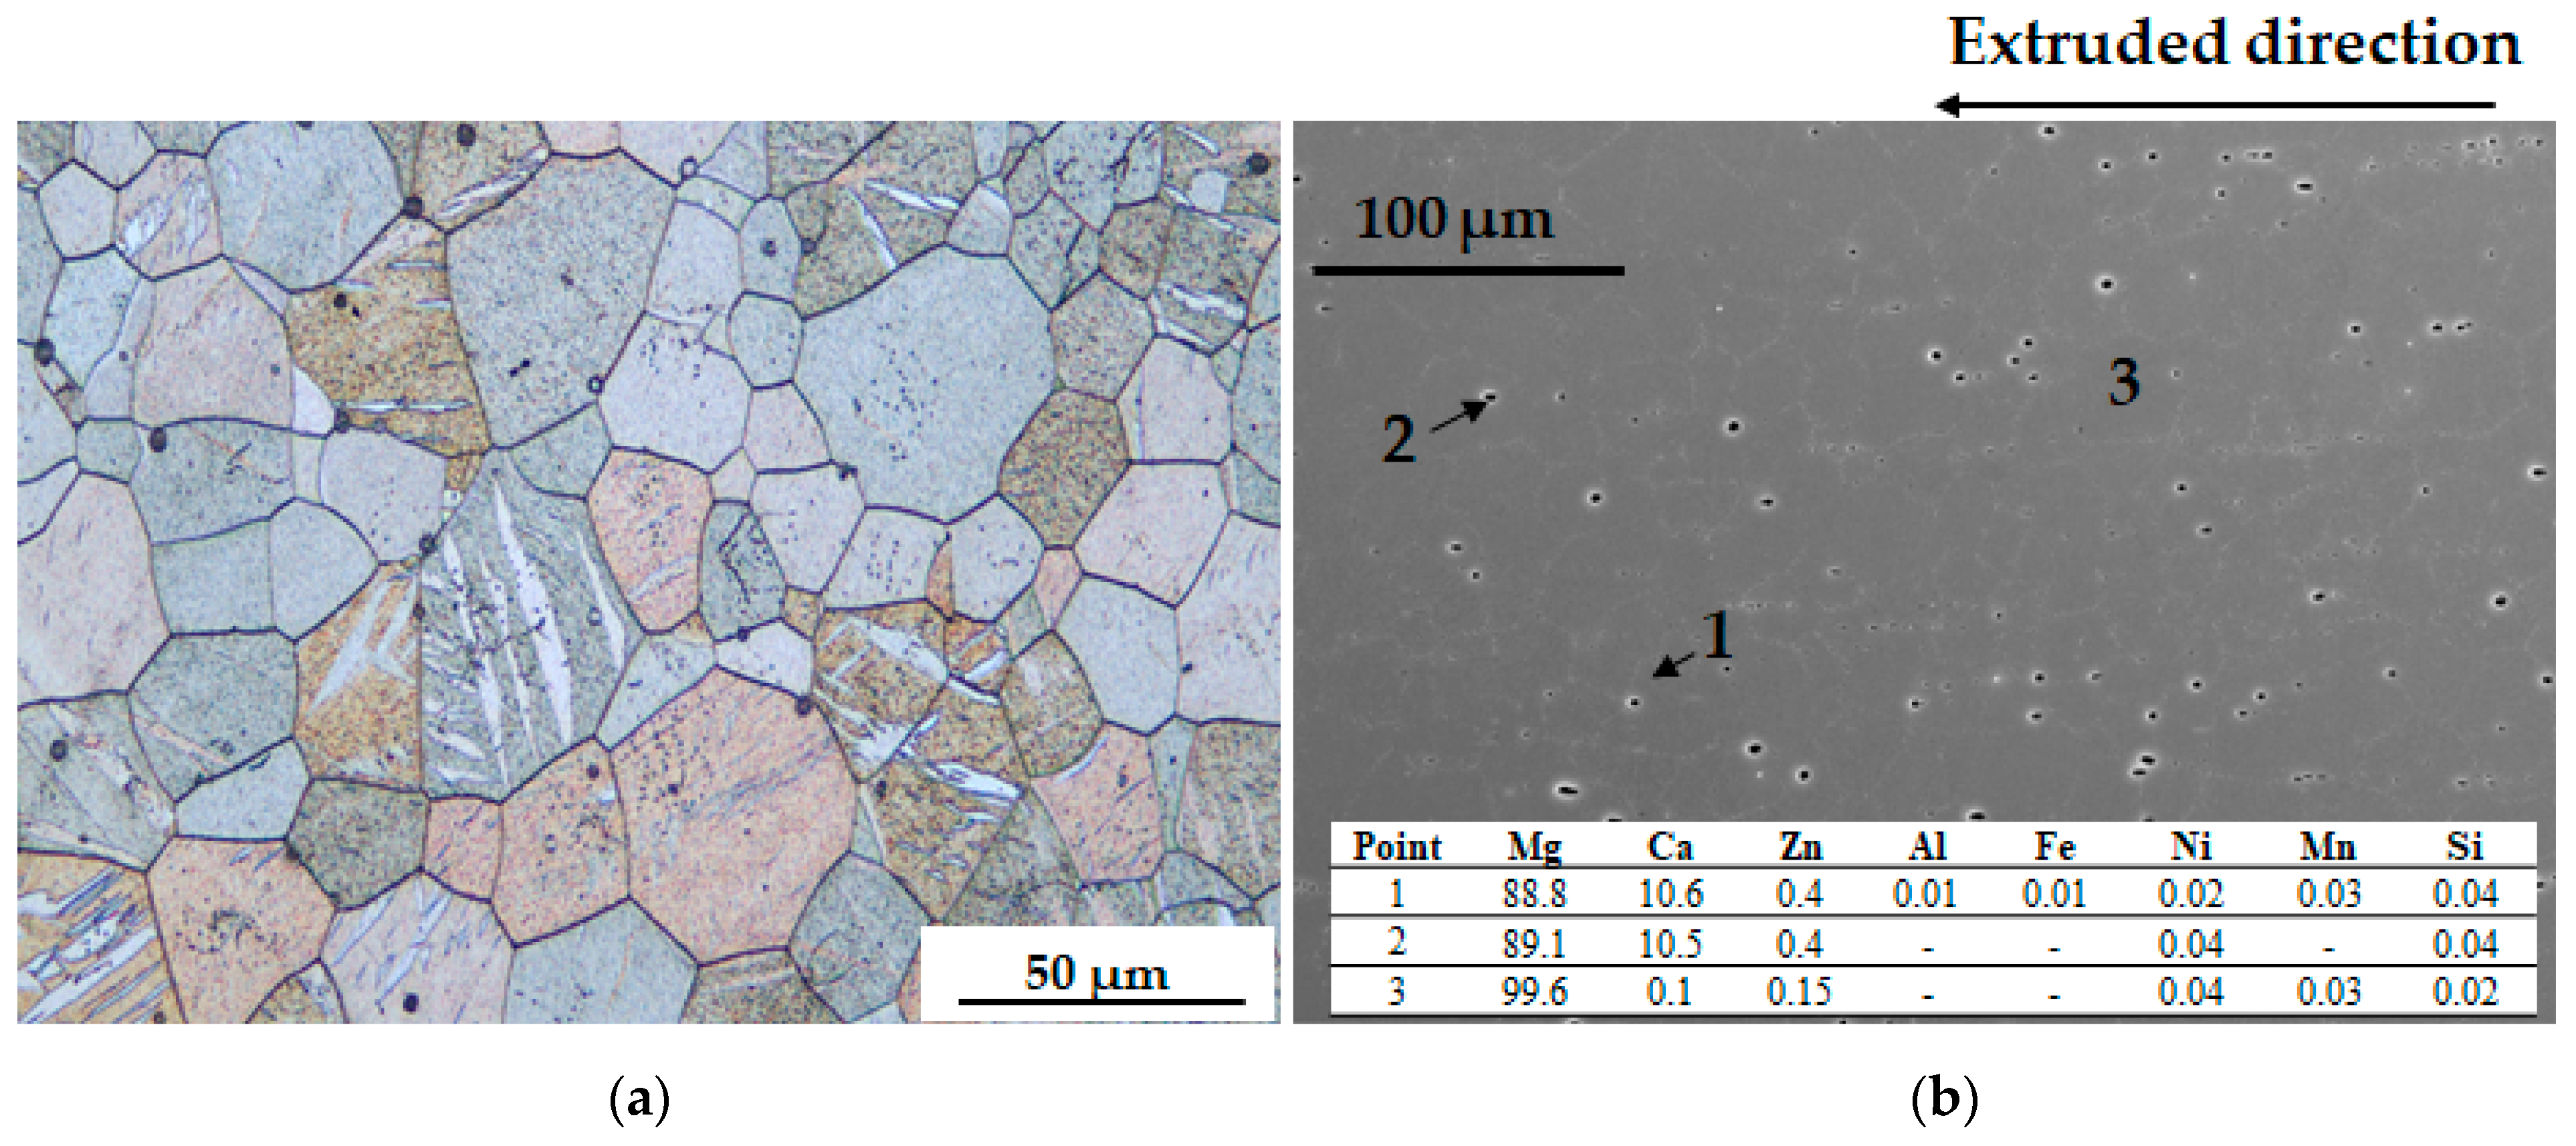
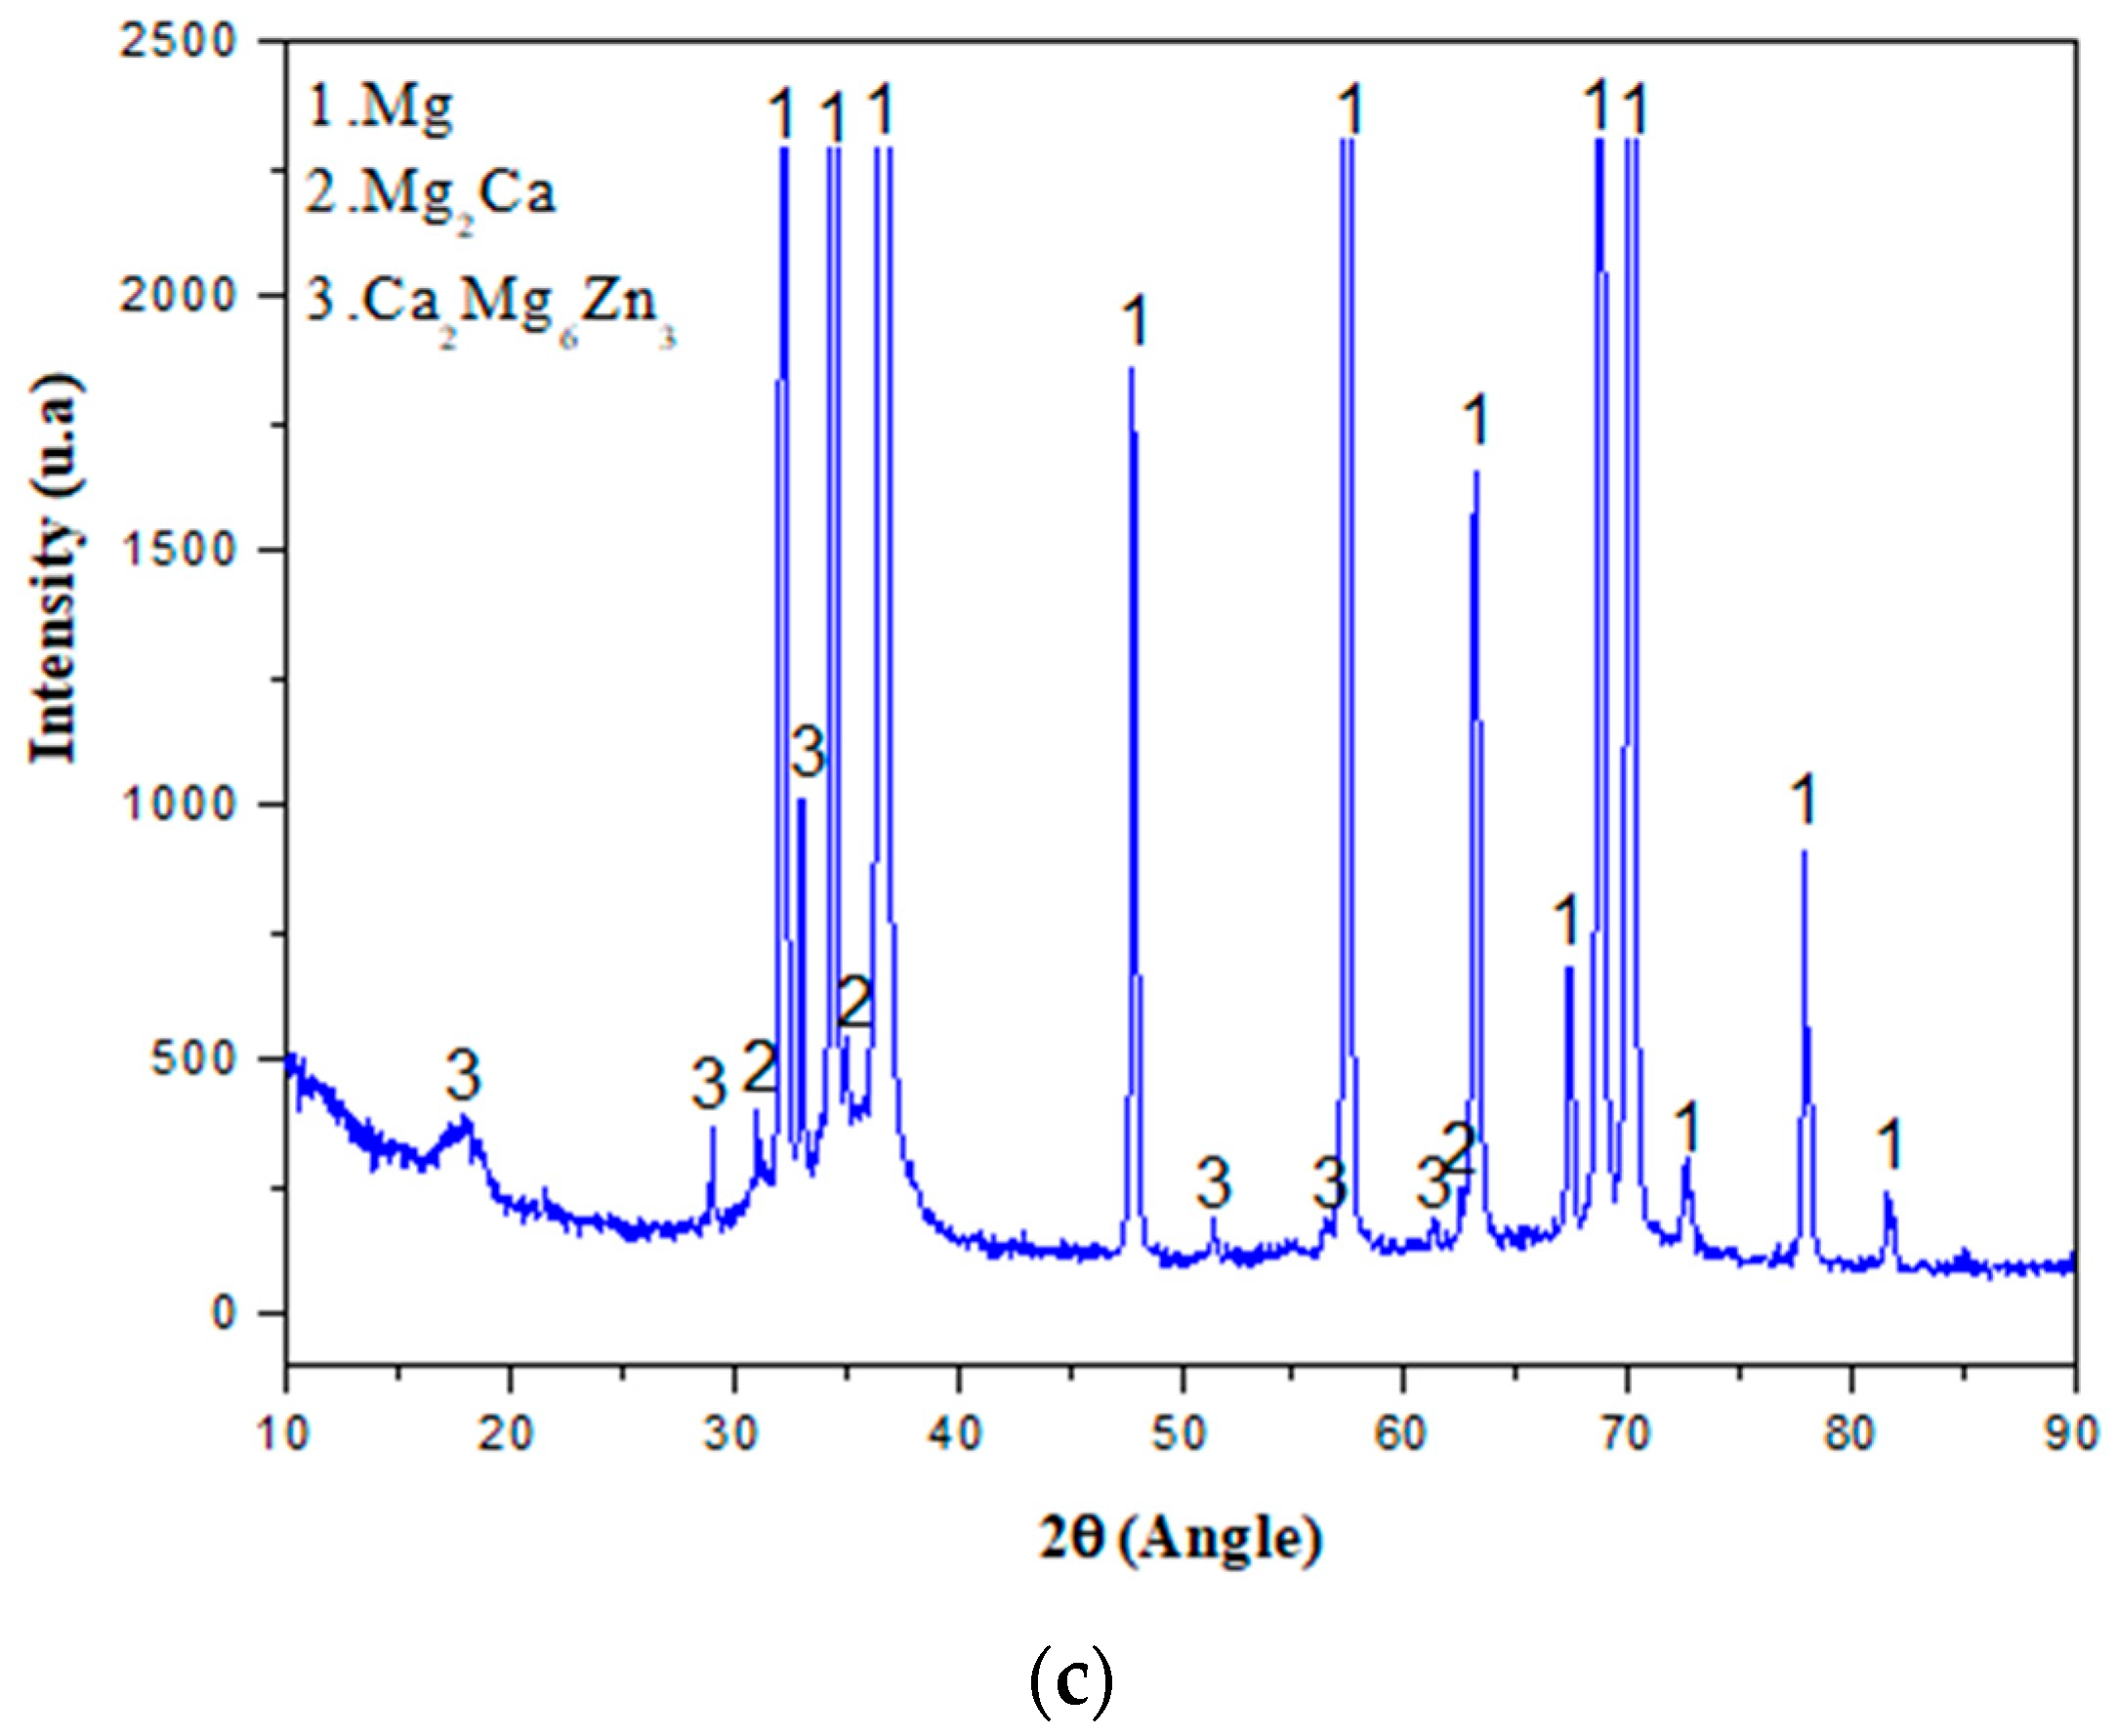
3.1. Characterization of Wrought Mg0.5Zn0.2Ca Alloy

Optical and SEM/EDS studies (Figure 1a,b) revealed a microstructure of α-Mg equiaxed grains (25 ± 3 µm) decorated with deformation twins, formed as a result of partial dynamic recrystallization during the alloy manufacturing, and particles distributed along the extrusion direction [33,34]. Some of the particles have dissolved/detached during the metallographic preparation (Figure 1b). An EDS point analysis of the matrix (Figure 1b) reveals that Ca and Zn are partially dissolved in a α-Mg phase at a lower concentration. The X-ray diffraction pattern (Figure 1c) shows high intensity peaks ascribed to the α-Mg phase and lower intensity peaks corresponding to the secondary phases, Mg2Ca and Ca2Mg6Zn3.

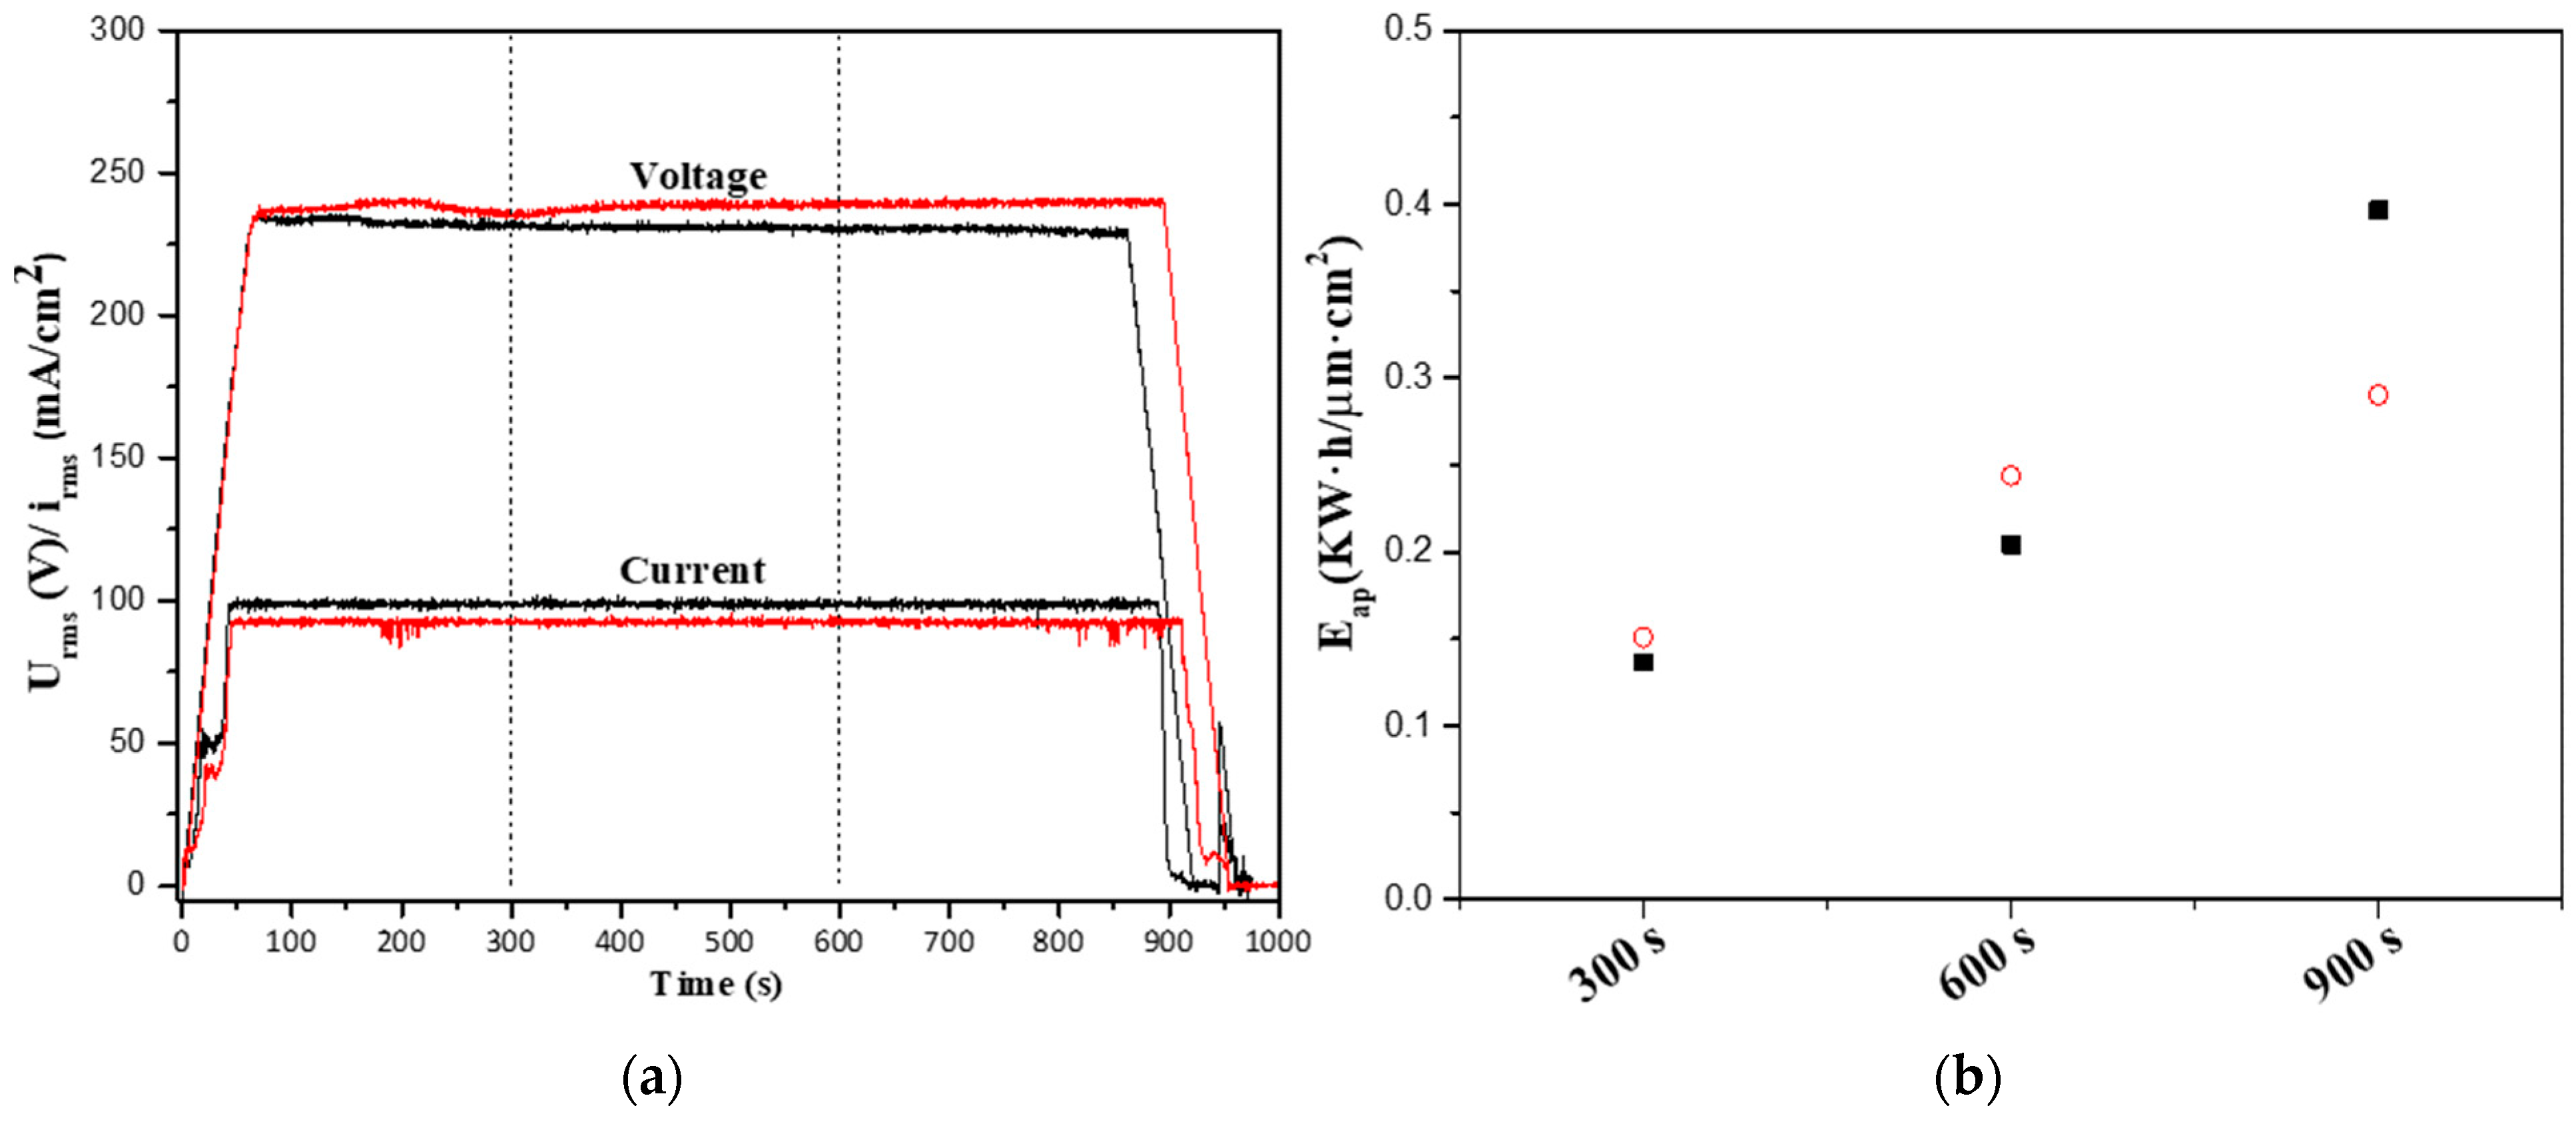
3.2. Electrical Response and Efficiency of PEO Treatment

Figure 2a illustrates the evolution of the root mean square values of voltage and current density (Urms, irms) during PEO treatment in transparent (PEO-T) and suspension (PEO-S) electrolytes during 900 s. The treatments performed for shorter times (300 and 600 s) revealed similar behavior.
A linear voltage is observed during the 60 s ramp followed by a second inflexion at 50 s caused by the initiation of the plasma microdischarges, which corresponds to the oxide layer growth kinetic. A constant value of voltage (~230 V) is observed until the treatments are stopped, due to the increase in the impedance of the coatings during the PEO treatment. It is worth mentioning that microdischarges can be detected visually only in the case of PEO in transparent electrolyte (PEO-T), whereas it is not possible in case of PEO-S, due to the opacity of the milky suspension solution.
The calculated apparent specific energy consumption for all PEO processes is shown in Figure 2b. The calculation is conducted according to the formula: E (W·s·cm−2) = t 0 t f (current density (A·cm−2) × Voltage (V)), where t0 = 0 s and tf is the duration of the PEO coating process. The specific energy consumption is obtained by dividing the energy by the coating thickness and adjusting the units to kW·h·m−2·μm−1.
An increase in energy consumption for PEO-T and PEO-S is observed with the increase in the treatment time from 0.14 to 0.40 kW·h·m−2·µm−1 and from 0.15 to 0.29 kW·h·m−2·µm−1, respectively. The energy efficiency is slightly higher for the PEO-S electrolyte at low treatment times (300 and 600 s), while at longer treatment times (900 s) it is slightly higher for the PEO-T electrolyte. It is important to note that the energy consumption values of this work are comparable with the data available for the PEO treatments in a Ca-free, transparent electrolyte for Mg alloy [35], which is around 0.13 kW·h·m−2·µm −1. Also, these values are lower compared with those previously reported by the authors in as-cast MgZnCa and Mg3Zn0.4Ca alloys in fluorine-containing electrolyte (1.6 and 1.9 kW·h·m−2·µm−1, respectively) [30].

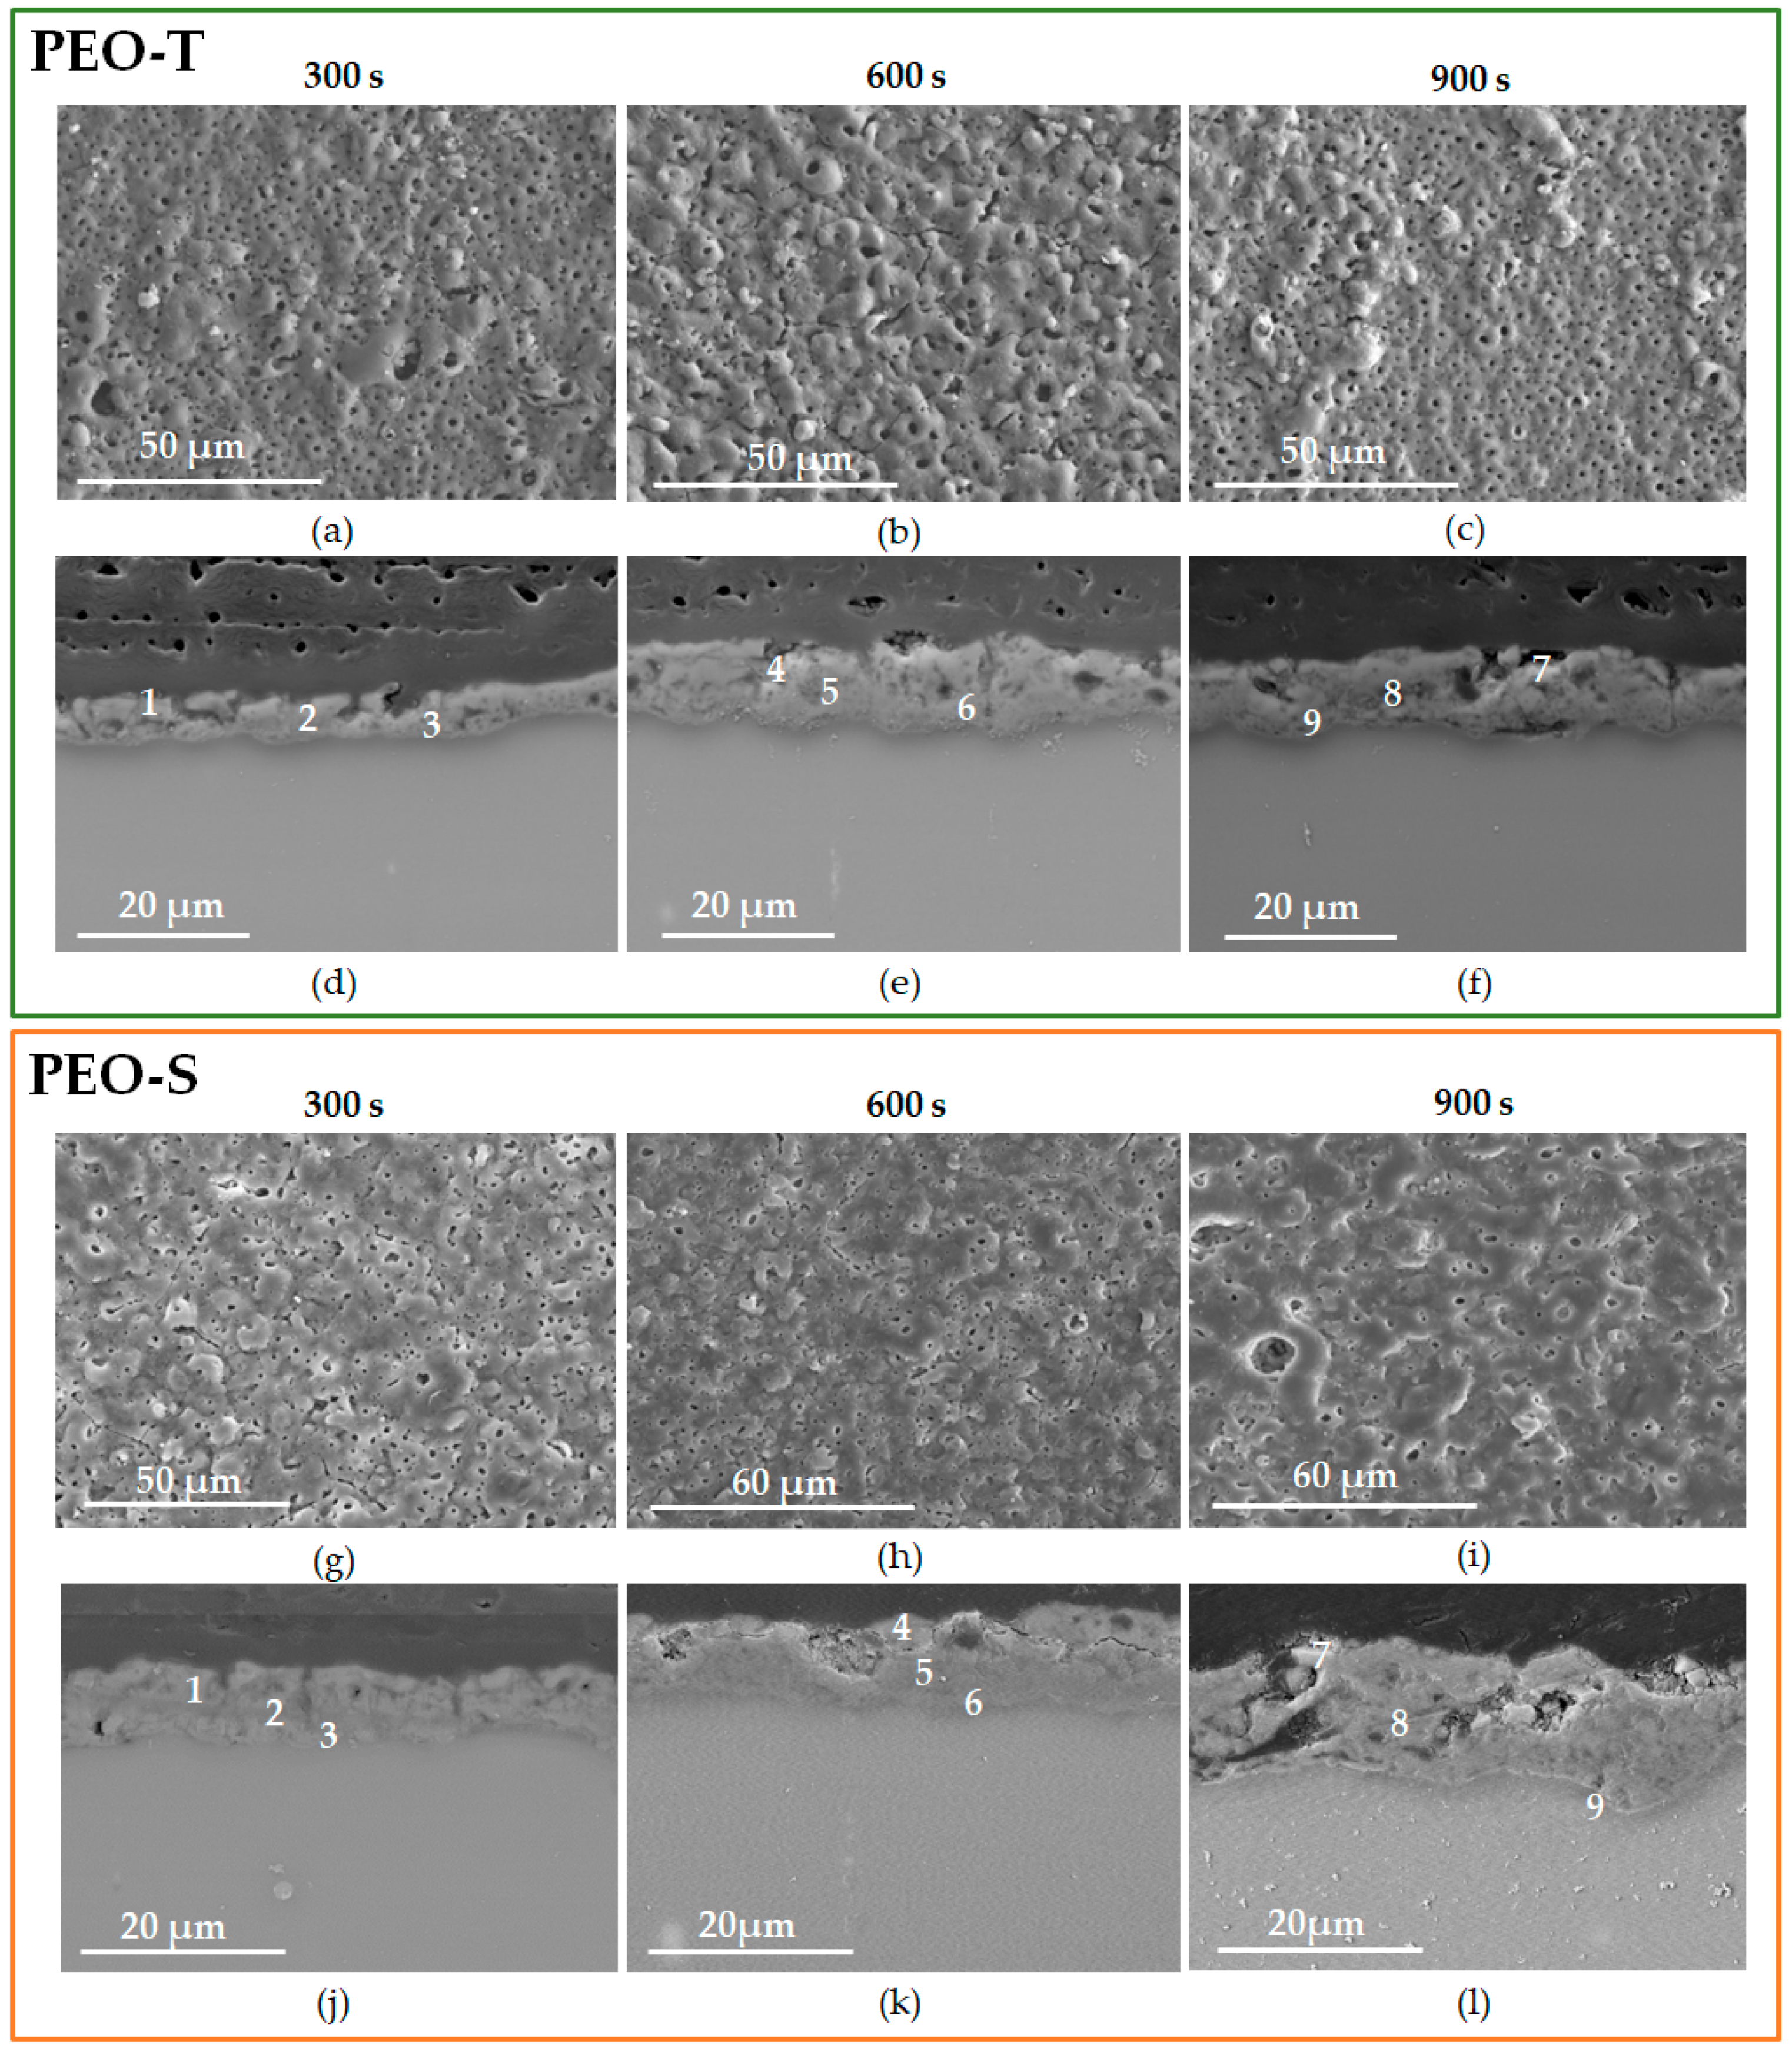
3.3. Characterization of the PEO Coatings

The surface and cross-sectional morphologies of all the developed coatings, along with their respective EDS, are shown in Figure 3 and Table 2. Common surface features are found for all the PEO coatings (Figure 3a–c,g–i), characterized by a pumice-like structure with pores. The latter are formed due to gas ejection out of the discharge channels and gas evolution through molten coating material followed by fast solidification [36].
Regarding surface roughness, the average value of Sa of PEO-T and PEO-S coatings tends to decrease (from 3.9 ± 0.7 to 2.7 ± 0.1 µm and 2.4 ± 0.4 to 1.1 ± 0.2 µm, respectively), while that of S10z tends to increase with the treatment time (Supplementary Material, Table S1). Furthermore, the Sa and S10z values for PEO-T are slightly higher compared to PEO-S values for all treatment times. The evolution of the surface pore population density in PEO-T electrolyte decreases from (1 ± 0.3) × 106 to (7 ± 1.2) × 105 pore·mm2 (Figure 3a–c) with the increase in treatment time. In addition, the average pore size shows slightly higher values for longer treatments (2.5 ± 0.7 to 1.4 ± 0.4 µm for 600 and 900 s, respectively) compared to 300 s (0.9 ± 0.4 µm).
Coatings developed in suspension electrolyte do not reveal significant changes in the surface characteristics, with values of surface pore population density from (5 ± 0.8 to 3 ± 0.5) × 106 pore·mm2 and the average pore size from 0.5 ± 0.2 to 0.4 ± 0.1 µm. In most PEO/Mg works reported in the literature, the average pore size increases with increasing treatment time because the discharge channels tend to coalesce, contributing to the increase in pore size [37,38]. The opposite situation is observed here, although the energy consumption is higher with treatment time, as shown in Figure 2b. This may be attributed to the lower intensity of microdischarges on the surface, while most of the energy is involved in the development of a few isolated micro-arcs [39]. In addition, the sub-micrometric pores may be due to gas bubbles passing through the molten oxide material, displaced by the micro-arc events.
Regardless of the treatment time and electrolyte, BSE cross-section images reveal the presence of an inner dense layer and an outer part with internal pores. It is worth mentioning that oxide layers formed at 900 s show the formation of an intermediate pore band which could be related to the evolution of discharges and the specifics of the coating growth mechanism [40]. This may be due to the high solidification rate of the molten coating material. If it solidifies too fast, it forms a vault over the channel, blocking the escape of gases. In addition, this oxidation can also be facilitated by the high amount of Zn in the coating, as illustrated in the EDS analysis of nine points (Table 2) of Figure 3f,l. This type of pore band has been also reported for PEO coatings developed in phosphate-based electrolytes for treatment times longer than 10 min [41,42].
In general, the oxide layers achieved a thickness in the range of (~13–18) μm with slight differences depending on the treatment time and electrolyte (Figure 3d–f,j–l, Supplementary Material, Table S1). The thinnest coating is the one developed in the suspension electrolyte for short time (PEO-T, 300 s). This electrolyte produces an increase in the thickness values (up to 18 for PEO-T 600 s) by increasing the treatment time. This trend is in agreement with observations made in several works conducted on Mg alloys [43,44,45].
The use of a suspension electrolyte led to the formation of slightly thicker coatings. This fact may be related to the size of the species formed in the electrolyte. In the case of suspension electrolytes, the particles are CaO (size of 1–5 µm), while in the transparent electrolyte, a [Ca-EDTA]−2 complex is formed (the size is few angstroms). According to the literature, the incorporation of particles into PEO coatings in particle-containing electrolytes [46] depends on their size, with respect to the diameter of the microdischarges channels and coating pores. Once in the plasma discharge channel, the particle is melted and ionized, and the Ca2+ and O2− ions migrate under the electric field and form part of the coating material. The CaO particle size is larger than that of the [Ca-EDTA]−2 chelate complex, and there is 0.05 M Ca species in the suspension electrolyte versus only 0.01 M in the transparent one. Therefore, the amount of newly formed coating material per discharge is greater, which translates into a thicker coating. Thicker coatings can be easily achieved in suspension electrolytes compared with particle-free true solutions, this is a well-established and known fact in PEO technology [47,48].
A semiquantitative analysis of the elemental composition of coatings performance by EDS is shown in Table 2. The most important feature is that short PEO treatments (300 s) led to a higher incorporation of Ca, while a slight reduction in Ca occurred for longer treatment times. No clear differences are detected between 300 and 600 s and the type of electrolyte. The decrease in Ca with treatment time could be explained by the development of greater intensity (i.e., longer lasting) microdischarges that could cause a destructive effect with the consequent loss of the previously formed material at the site of microdischarges [49]. It is worth noting that the Ca incorporation for all treatments times is slightly two times higher in the suspension electrolyte than in the transparent electrolyte. The thickness of PEO coatings is affected by the size of the species in the electrolyte as discussed previously. This is related to the fact that the size of the species can also affect their ability to diffuse and transport through the electrolyte to the metal surface and into the growing ceramic layer. Thus, smaller species may have a higher diffusion compared to larger species [50]. Some reports have found that smaller species may have a greater facility to act as “cores” around which ceramic composites form [51]. Therefore, the coatings formed in the suspension electrolyte, although they have a larger particle size, have a higher concentration in the electrolyte (0.05 M vs. 0.01 M), and therefore allow for a higher incorporation of Ca into the coatings.
EDS conducted through the thickness of the coating revealed that Si, K and P migrate inwards from the electrolyte and are mainly incorporated in the outer part of the PEO coatings. Zn incorporation was higher in the inner part of all PEO coatings. This occurs because Si and P migrate from the electrolyte inwards, while Zn migrates from the substrate outwards.
The X-ray diffraction patterns of the (a) PEO-T and (b) PEO-S studied coatings are displayed in Figure 4. All of the coatings reveal high intensity peaks of Mg, MgO, and the presence of amorphous material corresponding to a peak broadening between 25 and 40° (2θ). In addition, Mg2SiO4 (forsterite) and ZnO (wurtzite) are formed in all coatings in both electrolytes. During microdischarges, the SiO2 reacts with MgO to form forsterite in the range 1100–1400 °C [52], while ZnO is formed by the transformation of Zn(OH)2 at 80 °C [53]. The intensity of Mg peaks decreases with an increasing process time while the intensity of those for MgO, ZnO, and Mg2SiO4 increases with process time for both electrolytes. The crystallinity of the coating inside the PEO may be also related to the intensity of the discharge. In general terms, the degree of crystallinity/amorphism is around ~71% for PEO-T and ~84% for PEO-S, being slightly higher in the case of the suspension electrolyte. The higher energy required for coating breakdown and the higher discharge intensity can be observed on the Mg surface within the PEO procedure for a longer process time [37]. This means that a higher temperature in the PEO process may favor a greater crystallinity of Mg2SiO4, MgO, and ZnO. Crystalline material has a greater electron conductivity and promotes the oxidation of oxygen anions and O2 evolution, which, together with fast solidification of ejected molten material at the coating/electrolyte interface, explains the presence of a pore band at the 900 s treatments.
As for the semi-quantitative percentage content of Mg, MgO, Mg2SiO4, and ZnO phases for the transparent electrolyte, it is in the range of MgO (7–26%), Mg (47–57%), ZnO (1–3%), and Mg2SiO4 (27–37%). Similar behavior is observed for the suspension electrolyte, MgO (6–8%), Mg (41–60%), ZnO (1–3%), and Mg2SiO4 (31–50%). Overall, the values are slightly higher for the suspension electrolyte due to the incorporation of higher species in the coating, as discussed before. The lack of apatite or hydroxyapatite is due to the fact that a higher positive pulse voltage is required for its formation, as a higher plasma discharge temperature and a lower cooling rate of the material are needed [54].

3.4. Electrochemical Measurements

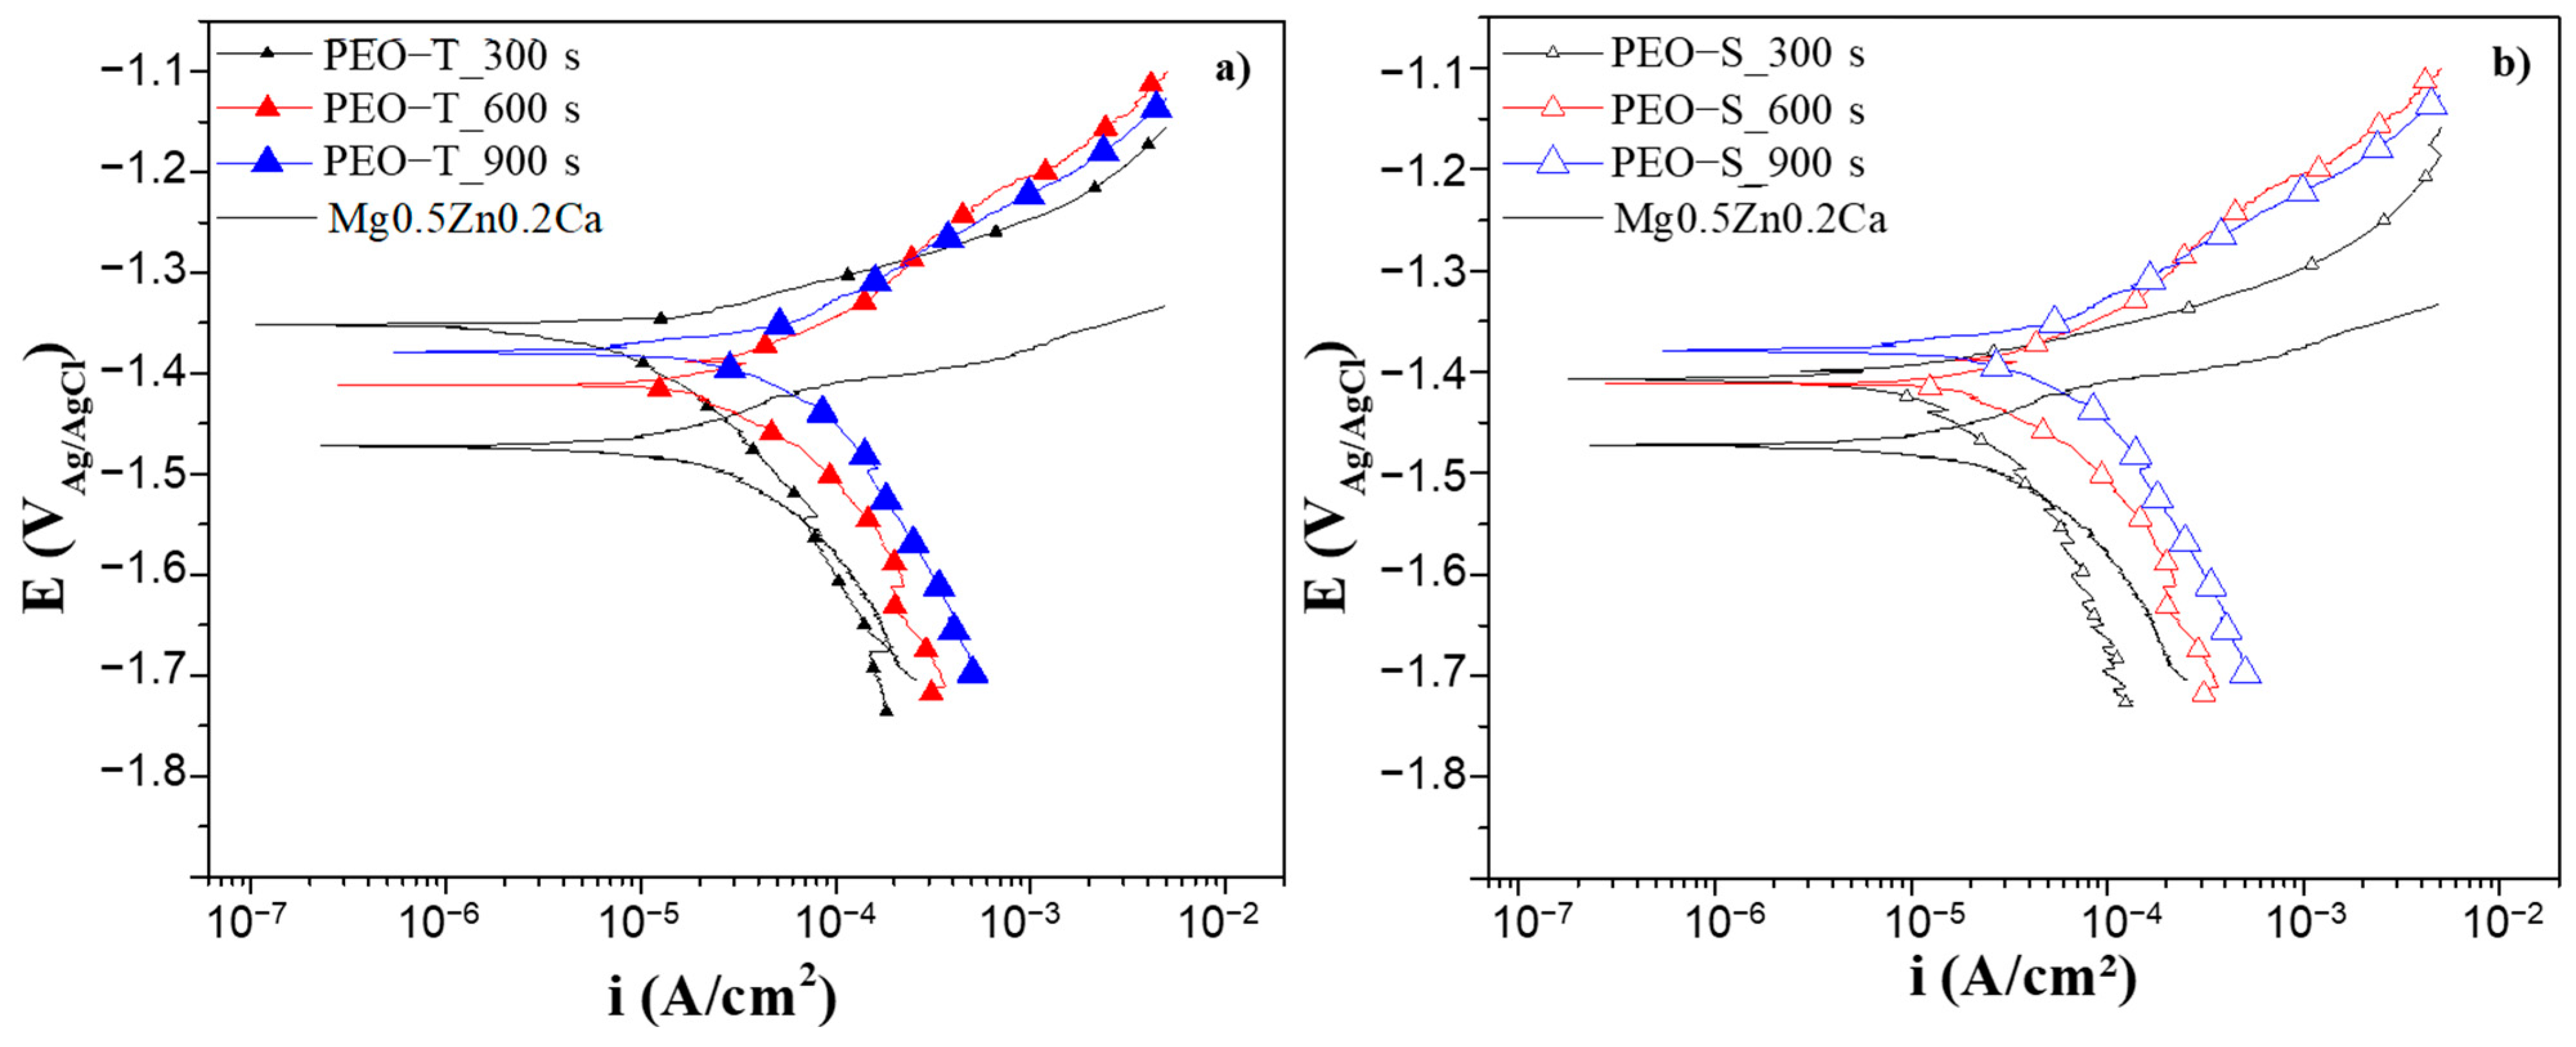
3.4.1. Potentiodynamic Polarization Curves (PDP)

The polarization curves of PEO-T and PEO-S coatings obtained under different treatment times on the Mg0.5Zn0.2Ca alloy after 1 h of immersion in inorganic α-MEM at 37 °C are displayed in Figure 5. The electrochemical parameters obtained from the curves (corrosion potential (Ecorr) and corrosion current density (icorr)) are presented in Table 3.
Regardless of the electrolyte and the treatment time, all PEO coatings shifted the Ecorr to slightly nobler values (~60–120 mV, depending on the coating). PEO coatings formed during 300 s in both electrolytes reveal protective properties with a decrease in the current density by ~2–3 times, with PEO-T at 300 s being the coating with the best results. It is worth mentioning that increasing the treatment time leads to an increase inf icorr, indicating that the coatings become less protective and could even induce an acceleration of the degradation process, compared with the non-treated substrate. This could be associated with the crevice phenomena and undercoating corrosion, which will be probed further. The pore band formed in the coatings developed under longer times could act as a storage of a more aggressive electrolyte that might also intensify the corrosion process.
It should be noted that the anodic branches of the all PEO-coated specimens do not reveal a well-defined region of pseudo passivity or marked pitting potential, especially for longer treatment times. The latter can reasonably be called pseudo-Tafel behavior, i.e., the anodic behavior of these systems resembles an active dissolution which can be attributed to a uniform undercoating corrosion morphology.
Data unavailability on PEO of extruded Mg-Zn-Ca systems does not allow for a proper comparison with the literature. The closer systems in terms of comparison would be PEO-coated as-cast Mg-Zn-Ca alloys. The current density values of the present work are higher (3–6 times) than those obtained in the literature, e.g., PEO/Mg3Zn0.4Ca and PEO/Mg1.78Zn0.51Ca alloys (icorr of 2.38–7.28 and 5.25 mA/cm2, respectively) [31,55]. This brings up the fact that the final performance of a PEO system is influenced not only by the electrolyte composition and process parameters, but also by the bulk material including the fabrication process. In fact, in the authors’ previous work it was reported that the extruded Mg0.5Zn0.2Ca alloy revealed a slightly higher degradation rate in comparison to as-cast Mg-Zn-Ca alloys, which was associated to the lack of barrier network and the high number of twins which facilitate the corrosion process [17].
It should be noted that the PDP results may not reflect the true protective capability of the coating, taking into account that high polarization is a source of non-stationarity in Mg-based systems. Therefore, additional screening by EIS is always advisable.

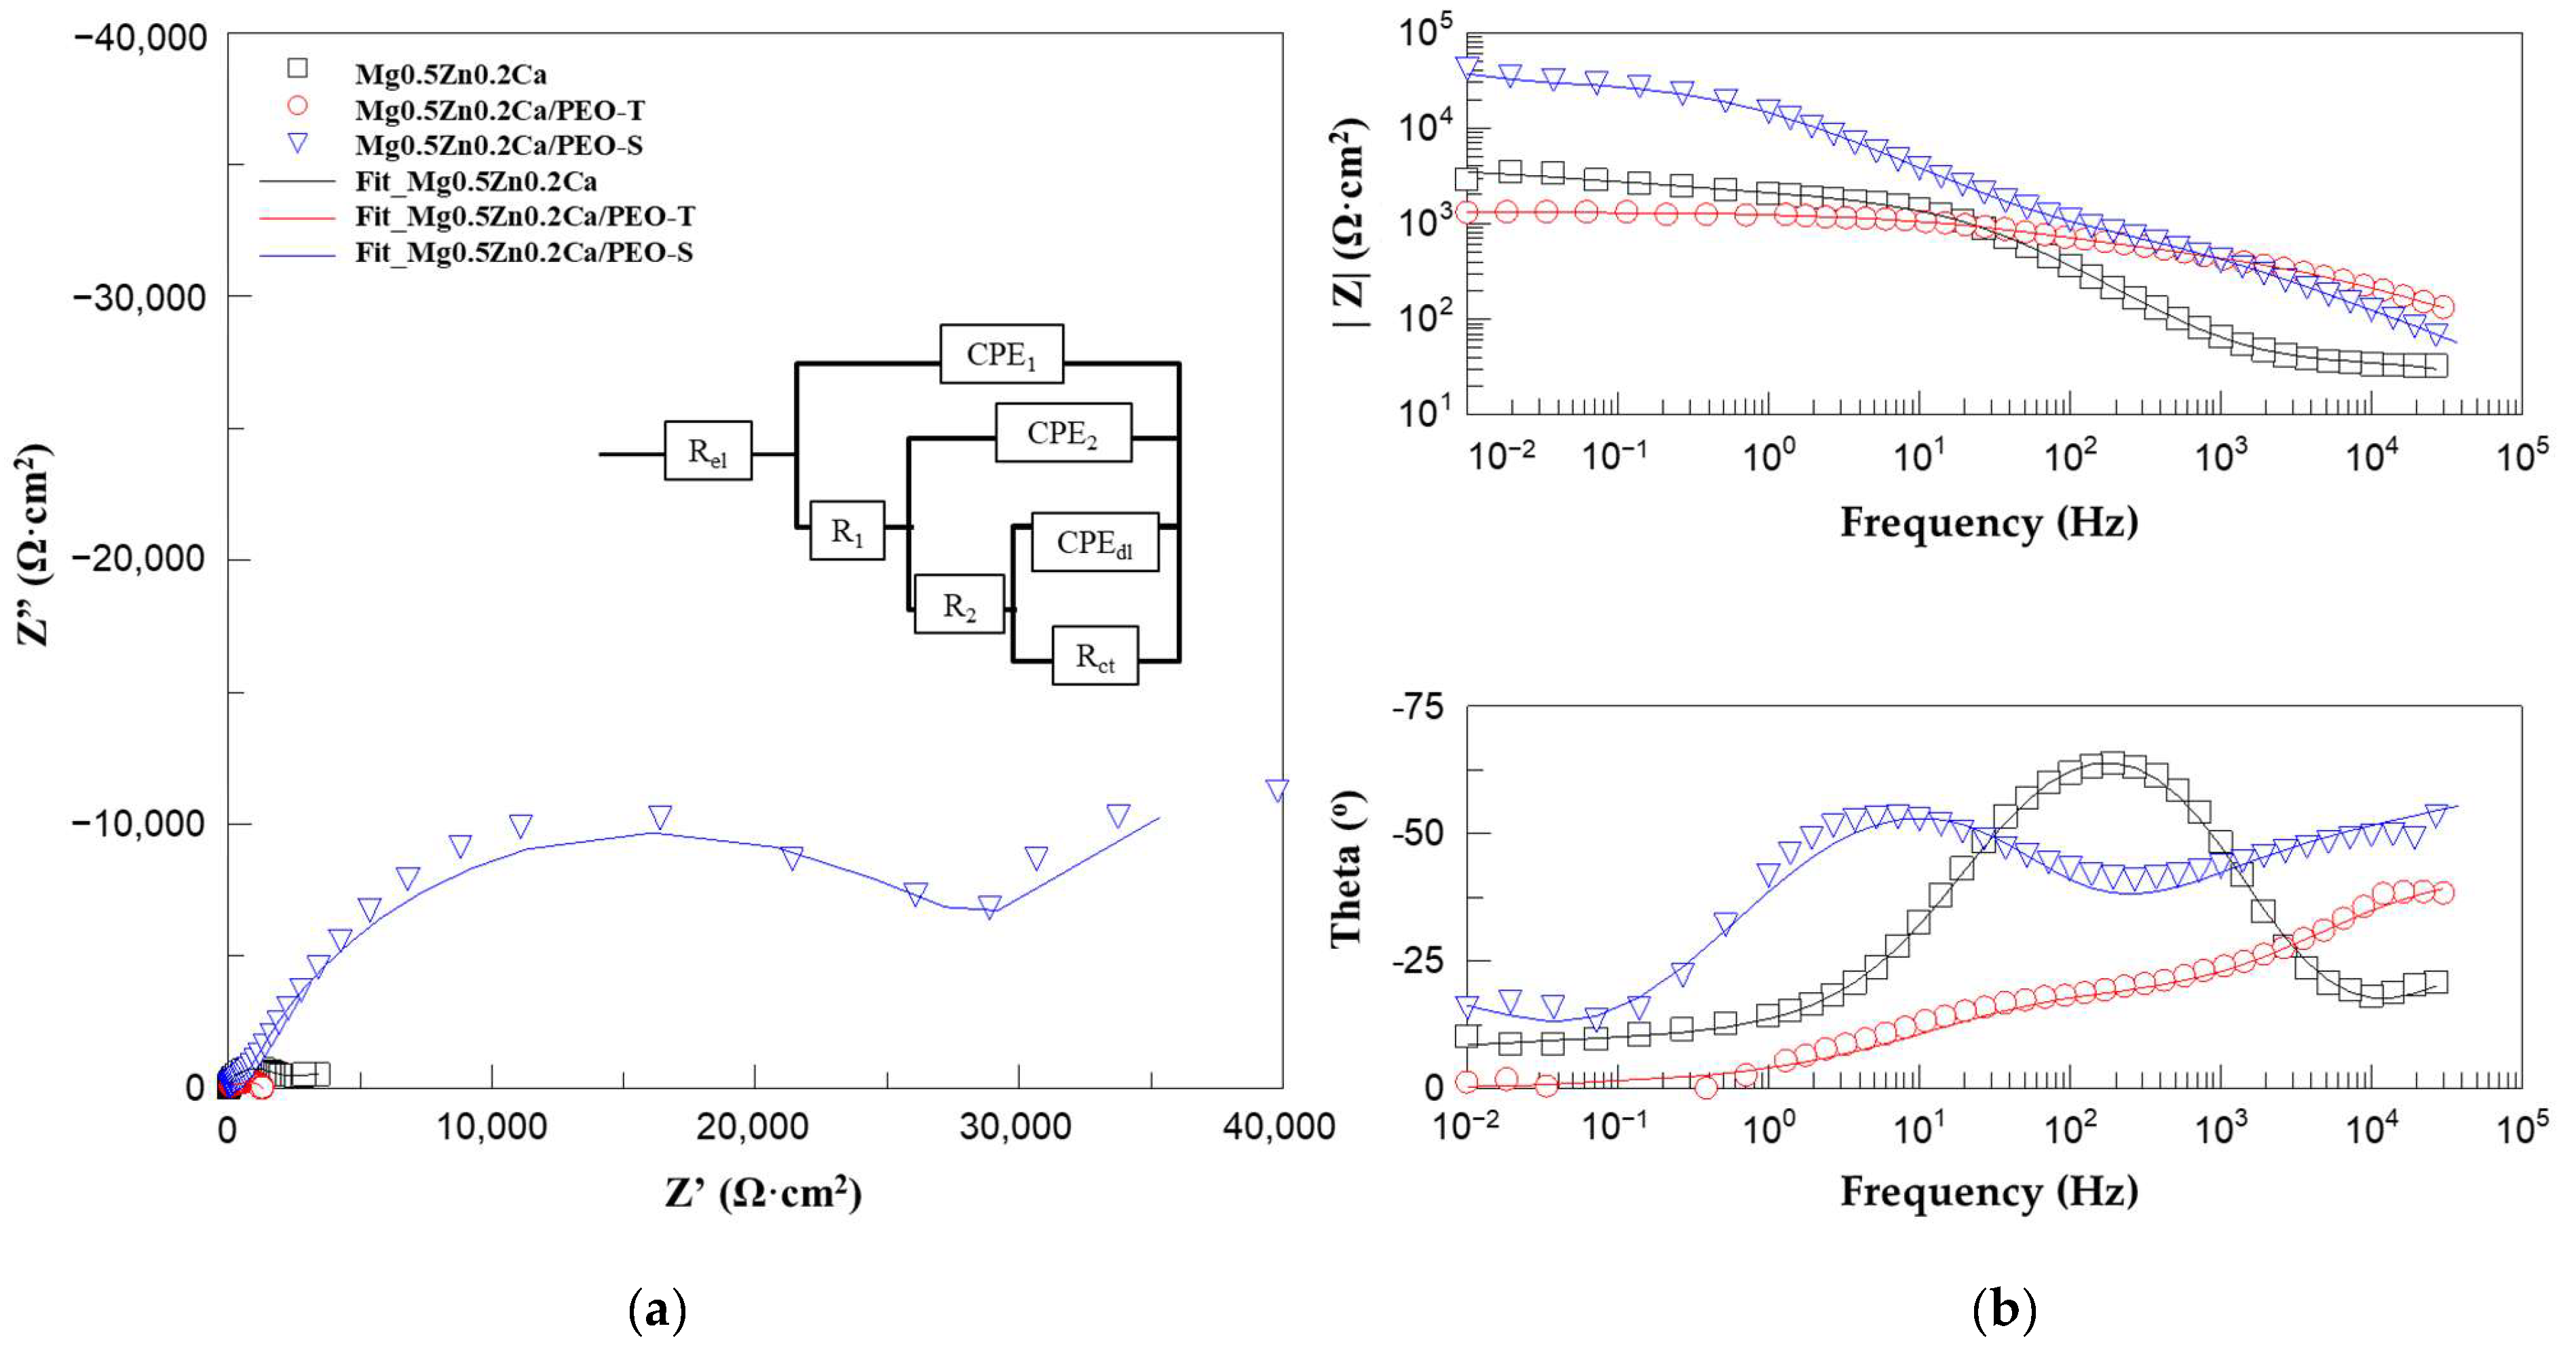
3.4.2. Electrochemical Impedance Spectroscopy (EIS)

Figure 6 shows the modulus of total impedance at low frequencies (׀Z׀10mHz) of PEO-coated specimens and the substrate after 1 h of immersion in inorganic α-MEM solution at 37 °C. This value provides a good estimation of the overall corrosion performance of the material.
PEO coatings formed in a transparent electrolyte during 300 and 600 s showed the best repeatability, whereas the rest of the coatings revealed higher differences between the results. This might be related to the heterogeneity of the coatings formed under longer treatment times and the variability between the randomly selected specimens. In general, all of the developed layers do not show a considerably better corrosion performance compared to the bare substrate. This might be attributed to the formation of the pore band close to the inner barrier layer, leading to a premature failure of the sample during the first hour of immersion.
In order to analyze in detail the EIS spectra of PEO coatings formed in different electrolytes, PEO-T (600 s) and PEO-S (300 s) specimens were selected based on their higher repeatability. These two coatings were taken as an example with the aim of understanding the contribution of the coating microstructure and the various electrochemical processes taking place in the coating/substrate systems to their corrosion resistance.
Figure 7a,b shows the Nyquist and Bode plots of the EIS spectra of PEO-T and PEO-S coatings for the selected treatment times (300 and 600 s). The equivalent circuit (inset in Figure 7a) used to interpret the EIS results includes: Rel—solution resistance, R1/CPE1—the response ascribed to the capacitive and resistance behavior of outer part of the coating, R2/CPE2—the capacitive and resistance behavior of the inner barrier layer and Rct/CPEdl—the electrochemical activity at the substrate/electrolyte interface associated with the double layer and charge-transfer phenomena. This equivalent circuit has been previously reported to fit the behavior of this type of PEO systems [30,56]. In cases of the substrate, R1/CPE1 and R2/CPE2 represent the response of Ca-P-rich deposits that form on the Mg surface in modified α-MEM and on the corrosion products layer, respectively. The impedance of CPE is calculated by the following equation: Z = 1/(CPE(jω)n); where j is the imaginary number and −1 ≤ n ≤ 1.
The fitted values of the circuit elements (Table 4) indicate that the barrier layer is the main factor responsible for the corrosion protection of the PEO coating, where R1 is lower than R2 in both cases. It can be seen that the R1 and R2 of PEO-S sample are higher compared to the uncoated specimen, indicating that the short-term corrosion resistance of the Mg0.5Zn0.2Ca alloy is improved after the PEO process. Whereas in the case of PEO-T, both values are lower than those of the substrate, suggesting that the coating is not protective and that its barrier layer has degraded, as it has a lower resistance than the corrosion product layer of the substrate. This is because it is not very compact (note the pores inside the coatings in Figure 3e), which allows for easy permeation of corrosive species from the medium.
As for the differences between the two coatings, the R1 and R2 values of PEO-S (1206 and 32,438 Ω·cm2) are 4–10 times higher than those of PEO-T (342.6 and 777.3 Ω·cm2). These are consistent with the higher pore-area fraction of the latter and the presence of the internal pores. This also explains the lower |Z|10mHz values for PEO-T in the intermediate frequency range. Comparing the results obtained in PDP and EIS, there is a clear concordance in the relative ranking of PEO-T (600 s) and PEO-S (300 s).
Both coatings are further evaluated by hydrogen evolution measurements in modified α-MEM with CO2 flow-controlled pH for 5 days of immersion, a period that is comparable to the duration of a standard in vitro cell proliferation assay. This is conducted in order to (i) verify the results of the EIS screening; (ii) discriminate the coatings and determine the realistic degradation rate; and (iii) examine the development of corrosion products.

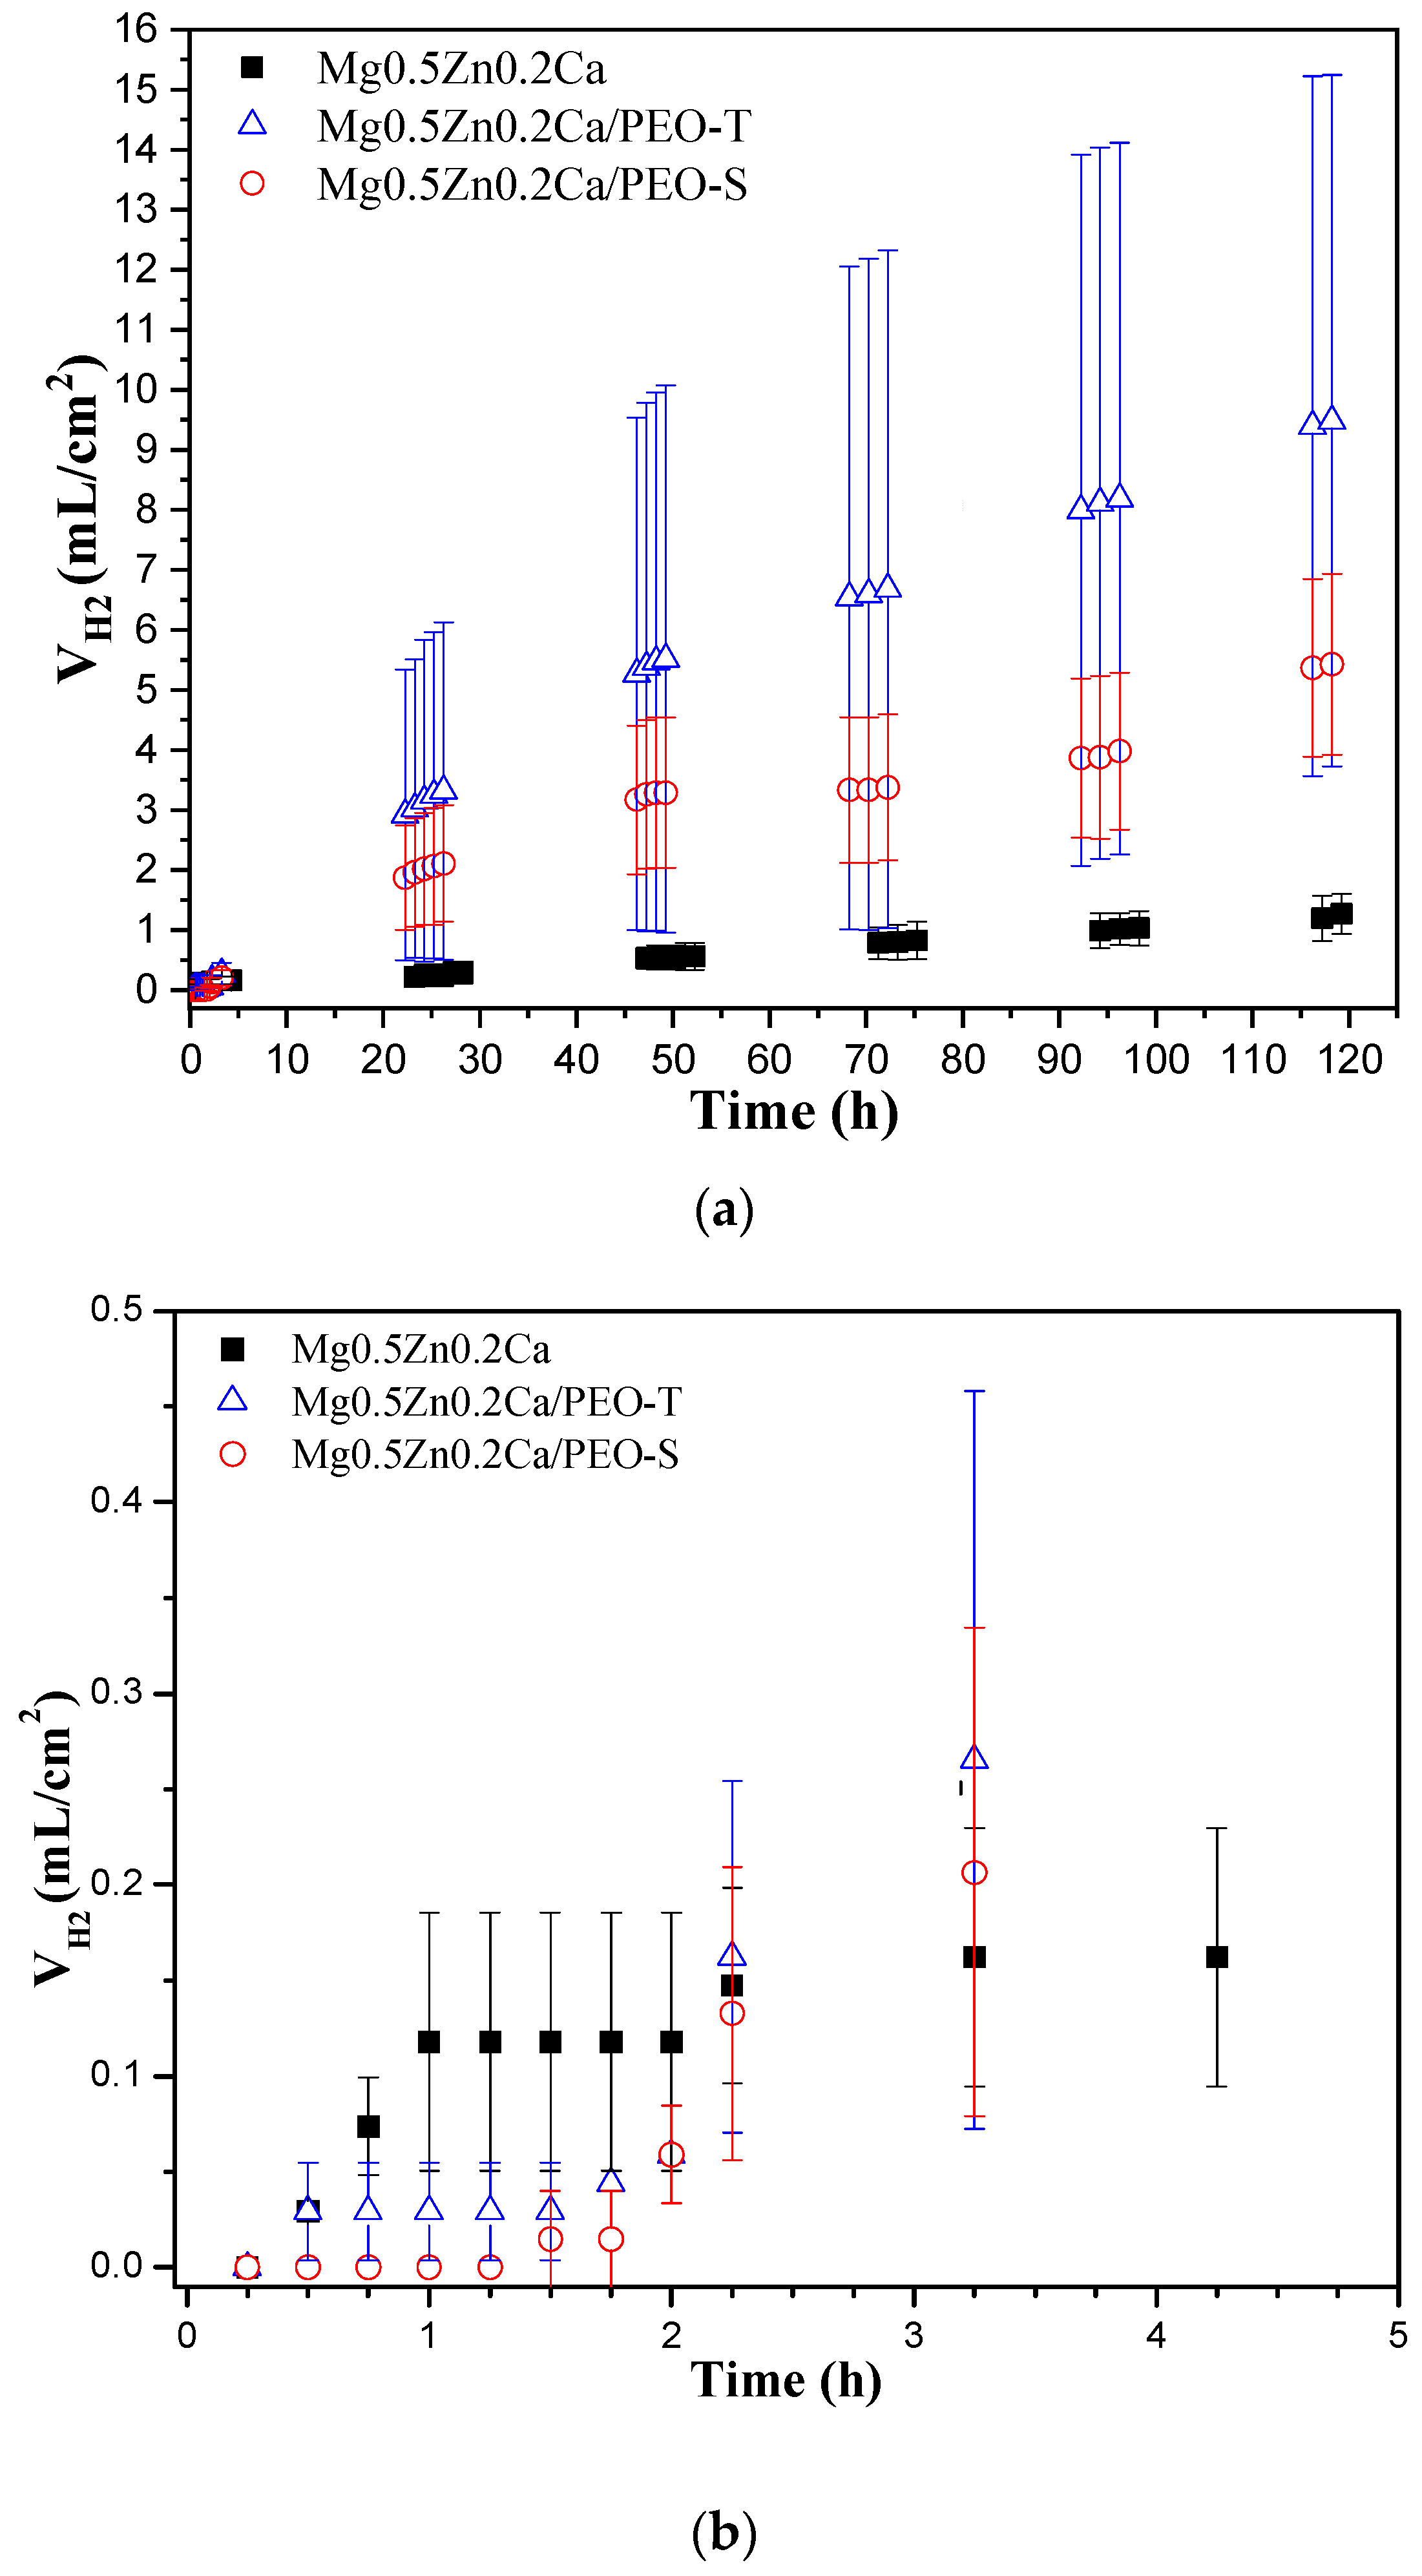
3.4.3. Hydrogen Evolution

Figure 8 shows the hydrogen evolution during 5 days of immersion in an inorganic α-MEM solution at 37 °C for the bulk material and PEO-coated specimens. The pH was controlled at 7.4 by a flow of CO2 through the medium during the test. It is important to note that the works reported in the literature for PEO-coated Mg alloys in physiological media either use a medium refreshment method [26,55,57] or a 5% CO2 injection into the incubator atmosphere [58], either of which does not provide a tight pH control and might lead to an underestimation of the corrosion rate [17].
Both PEO coatings show a quick, linear acceleration of corrosion rate after 2 h of immersion (Figure 8b) and until the end of the test, with a slight change in the slope after 48 h. This suggests that the coatings are easily permeable due to their internal porosity and the presence of a pore band close to the barrier layer (Figure 3e). In addition, as observed by EIS, the values of the inner barrier layer resistance are lower compared to the literature [8,31,59], which also indicates poor corrosion properties. Considering the total hydrogen volume after 5 days, that of PEO-T coating is two times higher (9.48 mL/cm2) compared to PEO-S (5.42 mL/cm2), which is in agreement with the results obtained from the EIS measurements. However, considering the standard deviation values, the differences between the PEO-T and PEO-S cannot be viewed as statistically significant. Remarkably, both PEO coatings exhibited 10–13 times higher corrosion rate (PEO-T: 26.31 and PEO-S: 15.05 mm/year) compared to the substrate (0.94 mm/year), indicating that both oxide layers accelerated the corrosion of Mg, which is opposite to what is typically found in the literature of PEO-treated Mg alloys [26,27]. According to the literature, the degradation rate of an orthopedic implant is expected to be <0.5 mm/year [60,61], which would allow an implant integration with complete bone healing. Comparing these values with the degradation rate by hydrogen evolution (PEO-T: 26.3 and PEO-S: 15.1 mm/year), they are 3–10 times higher than expected for a complete implant integration. This situation would lead to the implant degrading before implant integration occurs, so the implant is not performing its function. The corrosion-accelerating PEO treatment may present as an interest for bone cancer therapy applications, where an accelerated degradation of Mg implant is sought after, in order to treat the tumors [62,63].
The high corrosion rate observed in PEO-coated extruded Mg0.5Zn0.2Ca alloy may be attributed to two factors: (i) the formation of a crevice at the interface PEO/substrate, as described in previous work [30], and (ii) the presence of ZnO within the coatings due to the oxidation of Ca-Mg-Zn intermetallic (in particular Ca2Mg6Zn3 as identified by XRD) (Figure 1c). Studies on galvanized steel have indicated that ZnO, in the presence of carbonates (dissolved CO2 from the air), generates corrosion products in both the anodic region (e.g., Zn5(OH)8Cl2·H2O) and cathodic region (e.g., Zn5(OH)6(CO3)2). These corrosion products can function as semi-permeable membranes, facilitating the transportation of anions (as Cl) while hindering the movement of cations (e.g., H+), thus promoting ionic flow and maintaining acidic conditions in the anodic area [64,65]. Consequently, localized corrosion is intensified. Moreover, once the corrosion process commences, it progresses swiftly due to the uniformity of the alloy microstructure and the presence of defects produced during the extrusion process (see Figure 1) [17]. A continuous network of secondary phases that might act as a barrier for corrosion progression, as occurs in cast PEO-F/Mg-Zn-Ca alloys [30], is lacking in the extruded lean alloy.
According to the literature, PEO coatings on a cast-Mg-Zn-Ca alloy showed improved corrosion performance based on electrochemical and immersion measurements [24,27,28,66]. In the present work, taking into consideration only the electrochemical measurements, a slight corrosion protection could be observed for some of the coatings. However, when the pH in the immersion test was kept at 7.4, it became evident that the PEO coatings did not improve the corrosion resistance. A direct comparison with other published results on similar coatings appears difficult due to different factors: (i) most of the PEO work reported so far has been carried out on as-cast Mg-Zn-Ca alloys, with no reports on extruded alloys. (ii) The reported coatings in general are ~2 times thicker than those of this work (in the range of 20–40 µm), not least due to the presence of fluorine species in the electrolytes. (iii) Hydrogen release volume is not measured during immersion tests or constant pH of the corrosive medium is not ensured.
Figure 9 shows the macro- and micro-morphological examination of the corrosion products developed in the studied specimens after 5 days of immersion. The bare substrate has a very uniform appearance (Figure 9a), while in PEO-T and PEO-S coated samples the corrosion products layer is heterogeneous (Figure 9c,d). A detailed cross-sectional analysis of one of the coatings (considering that both PEO-T (600 s) and PEO-S (300 s) performed similarly during H2 evolution test) has been carried out in order to understand the corrosion mechanism. The examination (Figure 9e) disclosed a 64.3 ± 1.1 µm-thick, cracked corrosion products layer and a notable lack of a PEO layer above it. Cracking of the corrosion products is related to stresses induced by twofold volume changes during dehydration of Mg(OH)2 (Reactions (1) and (2))
Mg2+ + 2OH → Mg(OH)2
Mg(OH)2 → MgO + H2O
and evolving H2 gas.
In comparison with the results of other published works, the onset of corrosion in the present systems is rather early. For instance, on PEO-coated Mg0.8Ca the initiation of the undercoating corrosion product layer was reported after 2 weeks of immersion [67], although the coatings in question were four times thicker and contained a high level of fluorine.
The EDS analysis presented in Table 5 illustrates the composition of corrosion products (Figure 9b,e). The corrosion product layer in the PEO-S-coated substrate exhibits high levels of Ca and P (~12–18% and ~10 at.%, respectively) attributed to the precipitation of Ca-P compounds from the inorganic α-MEM solution. They are considerably lower than the respective levels in corrosion layer formed on the bare substrate (~20–27% and ~17–20 at.%), indicating that the coating must have been at least partially present during most of the immersion period and was impeding the ingress of α-MEM species [30]. These results are in agreement with observations made in other studies. The main corrosion products on Mg-Zn-Ca alloys consist of Mg(OH)2, Ca10(PO4)6(OH)2, (Ca,Mg)3(PO4)2, Mg(HCO3)(OH)·2H2O, or MgCO3·3H2O [24,27,68], which is consistent with the high levels of Mg, Ca, P, and O illustrated in Table 5. Additionally, Zn is present in both inner and outer parts of the corrosion products (e.g., points 3 and 5; Table 5) due to the diffusion of Zn from the bulk material and the dissolution of ZnO from the PEO coating. In the present conditions, the ZnO dissolution forms compounds such as Zn5(OH)8Cl2·H2O, ZnPO4, ZnCO3, and/or Zn(OH)2 [64,65]. This supports the idea of (i) the corrosion products layer acting as a crevice between the substrate and the coating, and (ii) ZnO in the PEO participating in reactions creating a more aggressive environment. The latter is corroborated by the high level of Cl in the corrosion products in PEO-S sample (points 4 and 5, Table 5, ~1.1%,) causing an accelerated corrosion of the system.
Several important factors corresponding to the corrosion mechanisms are illustrated by post-corrosion characterization: (i) corrosive species from the medium penetrate through the micro-defects of the outer porous layer, causing progressive hydration of the coating and degradation of the inner barrier layer. (ii) Corrosion products react with the medium species causing the precipitation of Ca-P based compounds. (iii) The cracked inner coating corrosion products layer forms a crevice at the PEO/corrosion products interface. (iv) The presence of ZnO in the PEO coatings and its hydration products promote a more aggressive microenvironment in the crevice, accelerating the corrosion rate of the systems.
For the load-bearing applications where an implant is expected to be made of a wrought alloy (for the mechanical properties sake), it is necessary to continue searching for strategies to improve the corrosion behavior of the Mg0.5Zn0.2Ca alloy. A possible strategy may include changing the PEO electrolyte and electrical conditions so that the Zn is incorporated into the coating not as ZnO but in the form of Zn phosphate, or Zn-substituted hydroxyapatite.

4. Conclusions

PEO coatings were produced on a wrought Mg0.5Zn0.2Ca alloy using transparent and suspension electrolytes and were assessed for microstructure, composition, and corrosion behavior. Key findings are as follows:
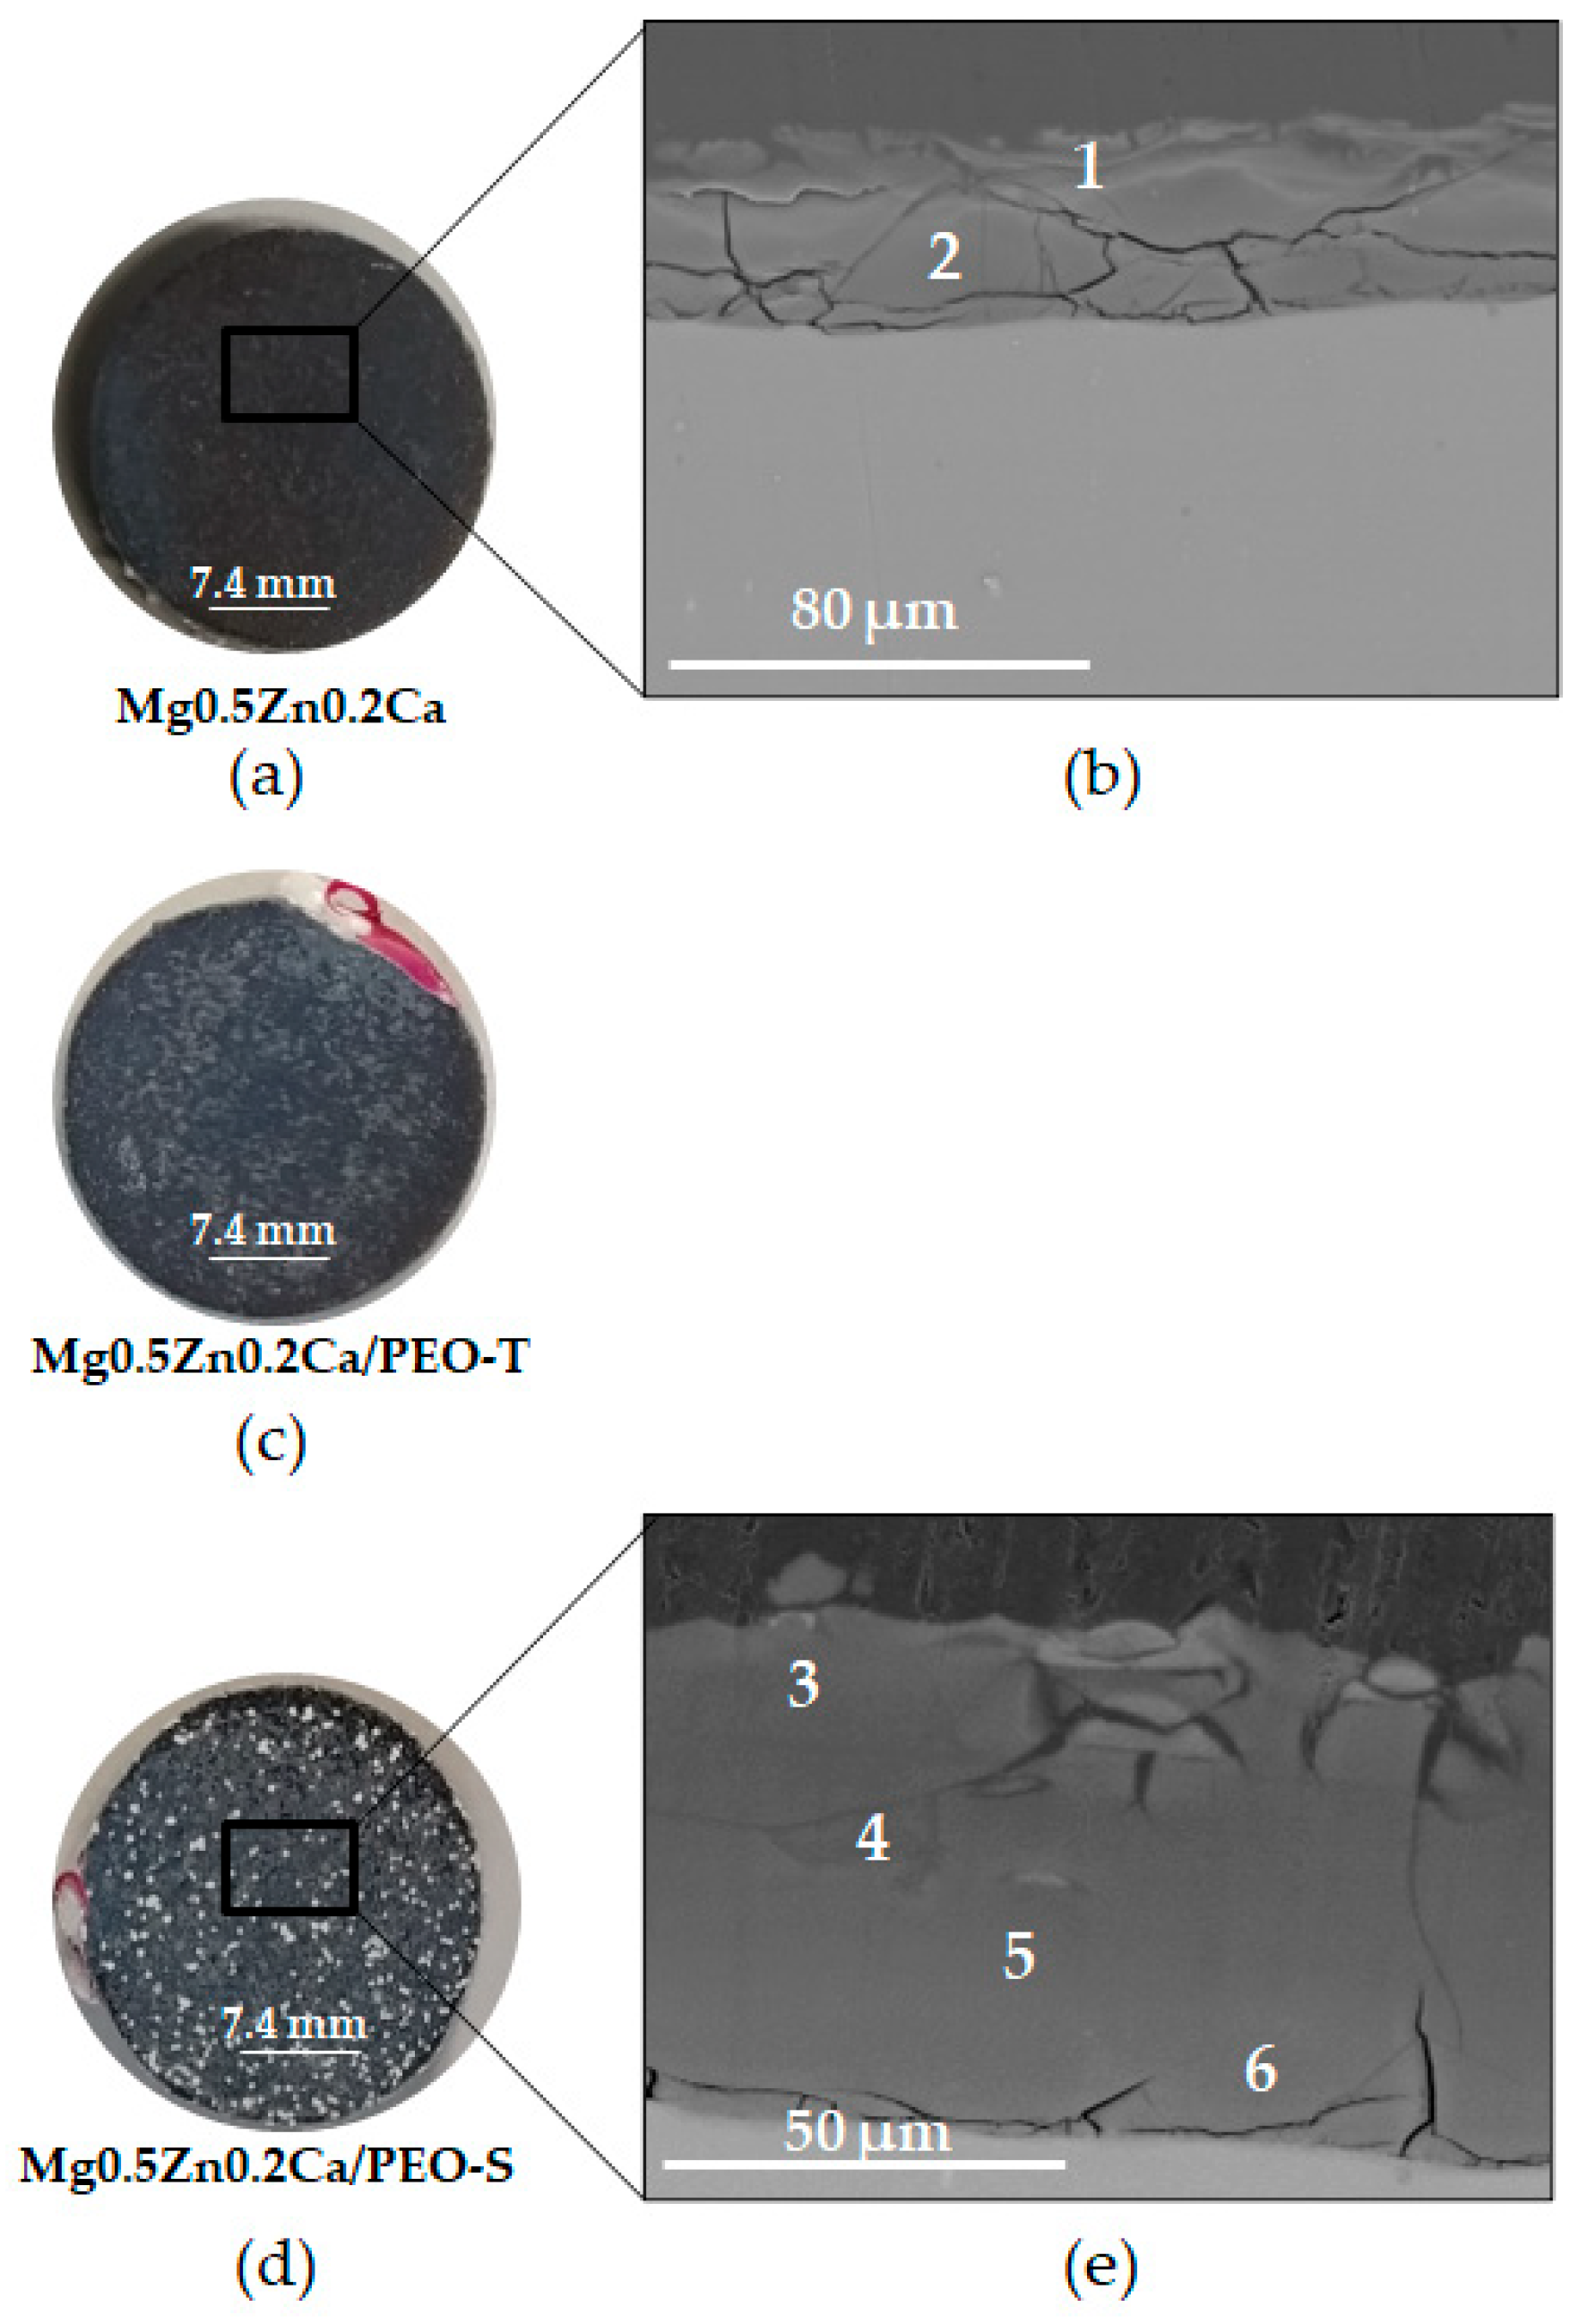
  • Coatings applied for 300 s in both electrolytes were compact, while longer treatments led to the formation of a pore band.
  • Suspension electrolyte coatings were marginally thicker (13–18 µm) compared to transparent electrolyte coatings (13–16 µm) due to the relationship between species size in the electrolyte and microdischarges channel diameter.
  • The incorporation of species into the coating increased from 300 to 900 s for both electrolytes, with slightly higher incorporation in suspension electrolyte coatings, attributed to species size, diffusion, and electrolyte concentration.
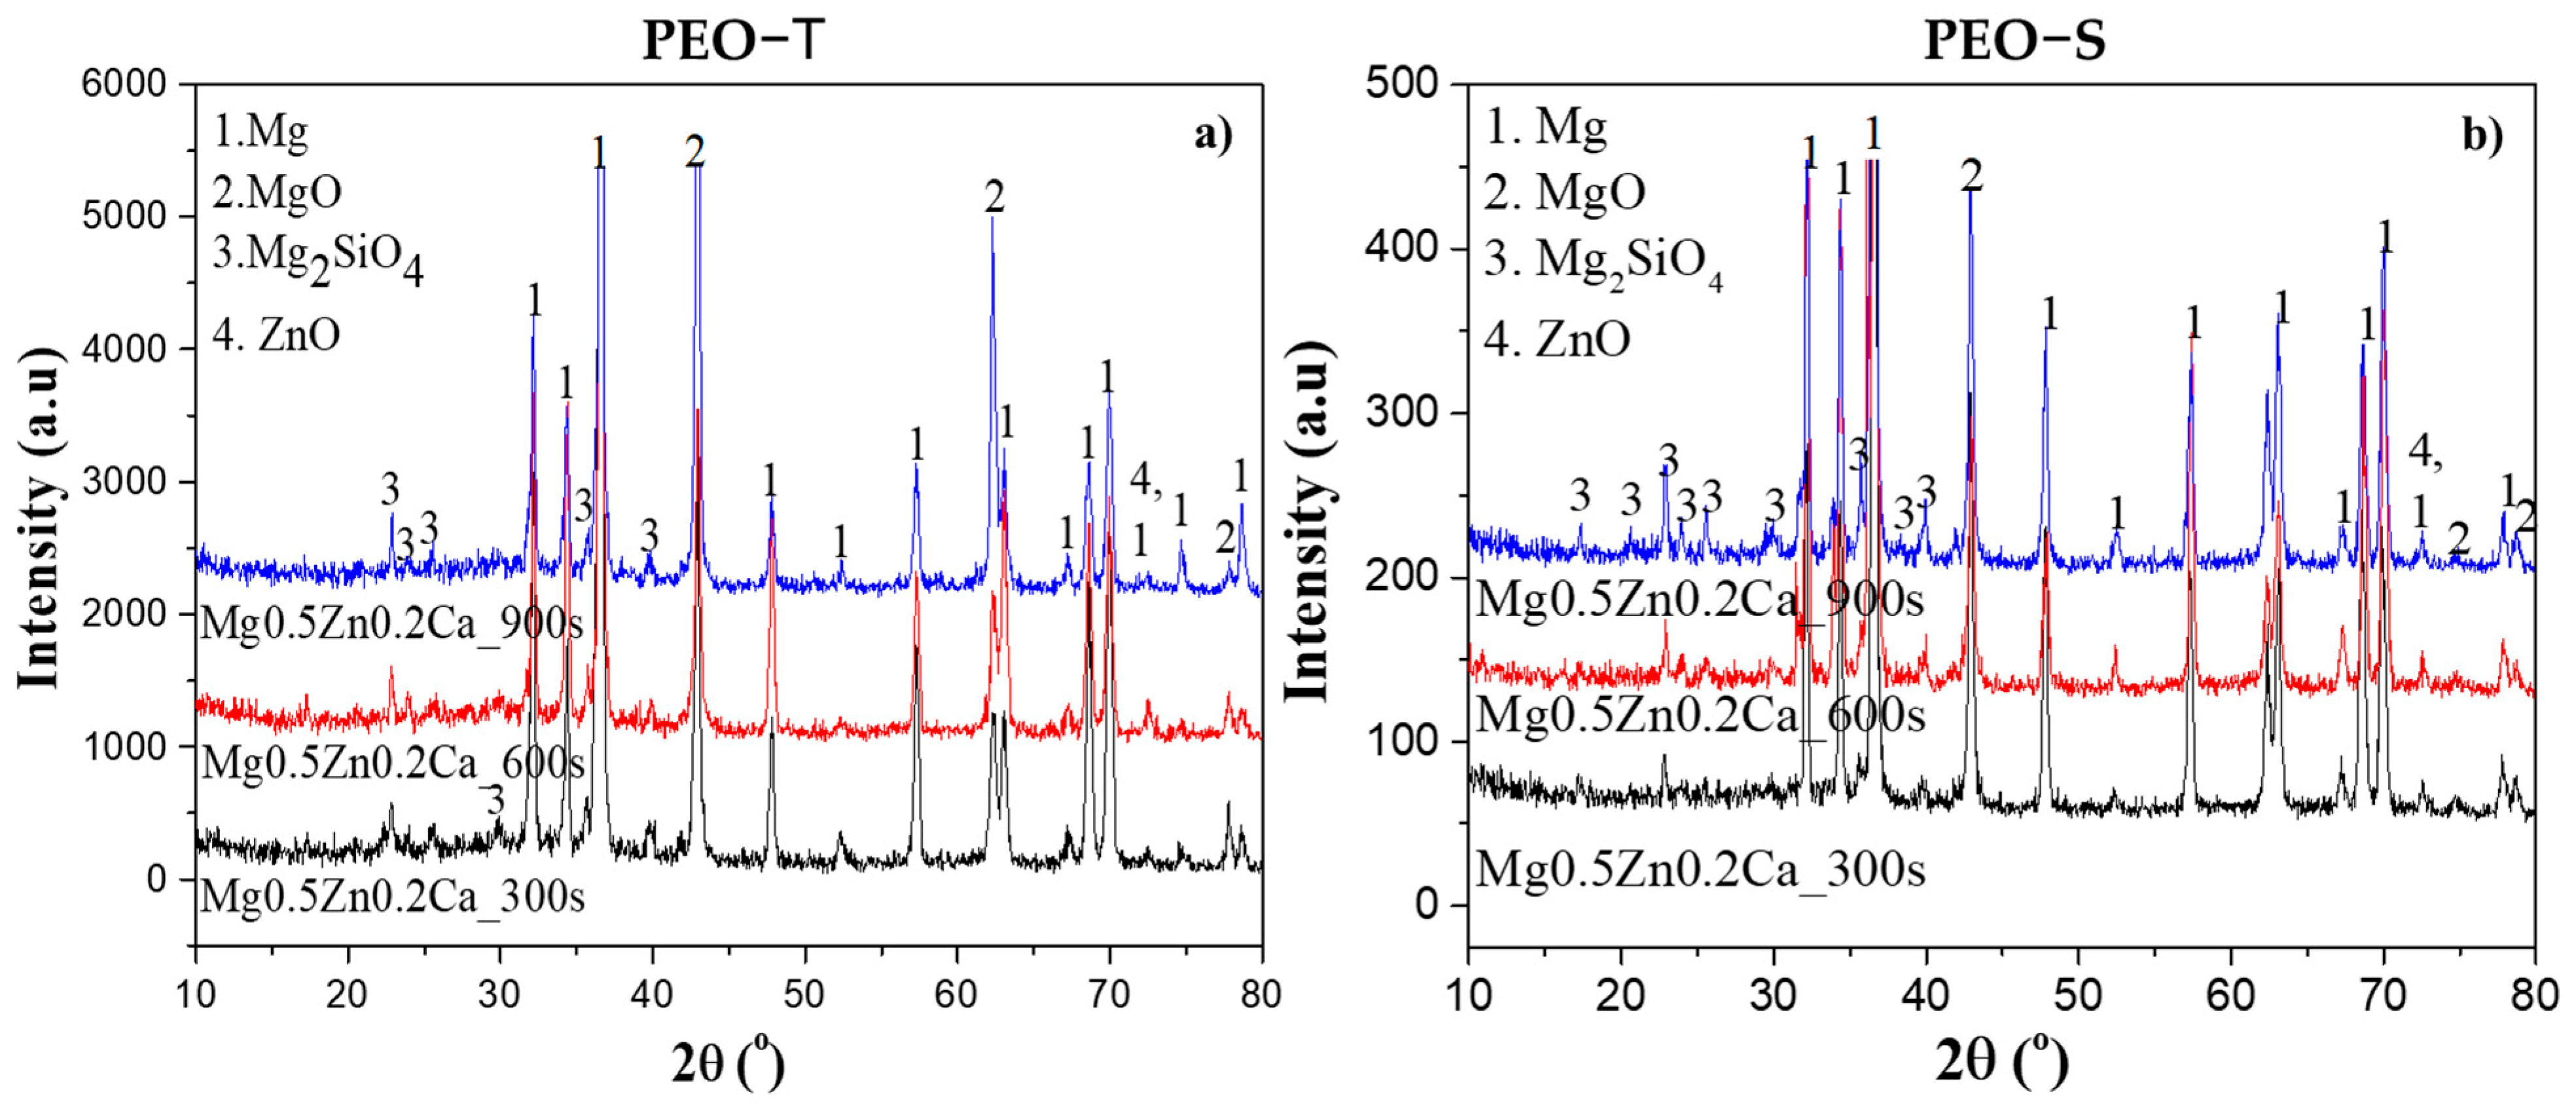
  • Coatings comprised MgO, ZnO and Mg2SiO4, regardless of treatment time or electrolyte, with slightly higher crystallinity in suspension electrolyte coatings (~84%).
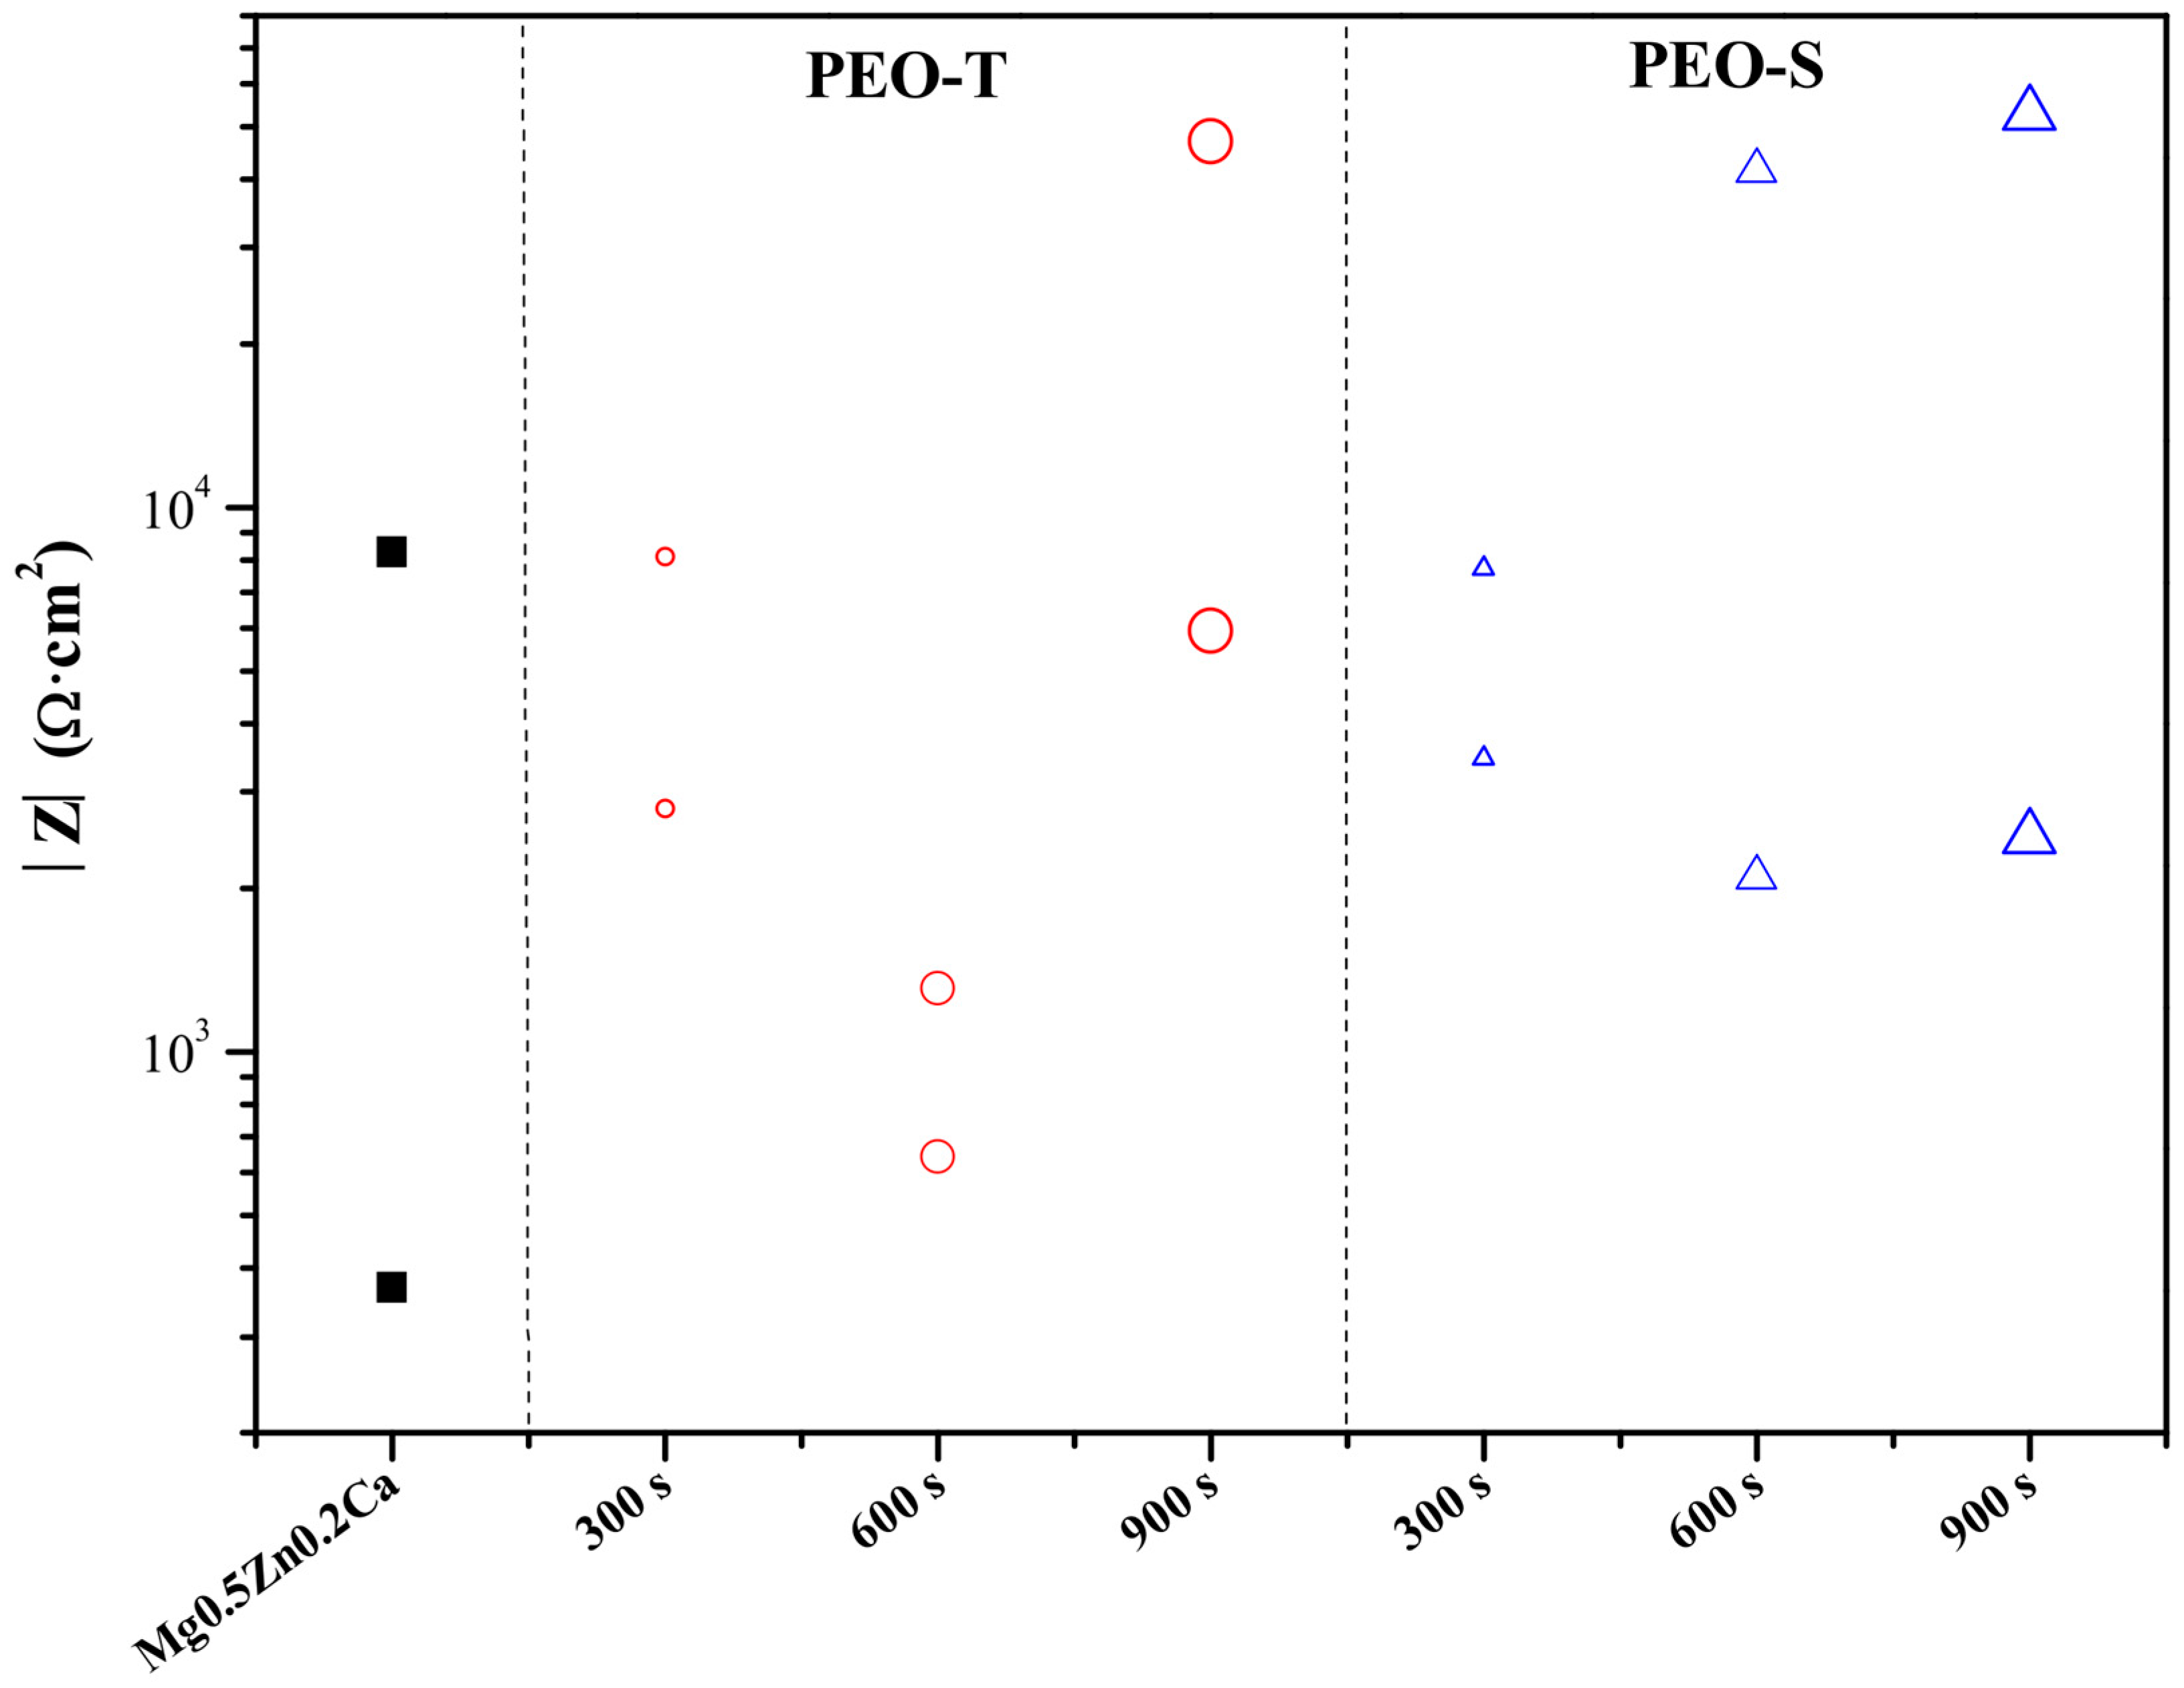
  • Short-term electrochemical evaluation by EIS demonstrated protective properties for 300 s coatings (|Z|10mHz, PEO-T: 5449.65 and PEO-S: 5582.60 Ω·cm2), while longer treatments showed impaired repeatability due to pore band formation.
  • PEO-T-600s coatings revealed 50 times lower corrosion protection than PEO-S-300s due to higher pore area fraction and slightly larger internal pores.
  • Both coatings revealed significantly higher corrosion rates (PEO-T: 26.3 and PEO-S: 15.6 mm/year) over the 5-day period compared to the substrate (0.94 mm/year), attributed to a Cl-rich aggressive microenvironment in the crevice induced by hydrolysis of ZnO in the coatings.

Supplementary Materials

The following supporting information can be downloaded at: https://www.mdpi.com/article/10.3390/coatings14030309/s1, Table S1: Coating surface porosity characteristics from plan view of PEO-T and PEO-S at three treatment times (Figure 3a–c,g–i).

Author Contributions

L.M.: Conceptualization, investigation, validation, writing—original draft, review and editing. M.M.: conceptualization, resources, software, supervision, writing—review and editing, Funding acquisition. R.A.: conceptualization, resources, software, supervision, writing—original draft, writing—review and editing. E.M.: conceptualization, resources, software, supervision, writing—review and editing, Funding acquisition. All authors have read and agreed to the published version of the manuscript.

Funding

This research was funded by grant number S2018/NMT-4411 (Regional Government of Madrid and EU Structural and Social Funds), grant number PID2021-124341OB-C22 (MCIU), and grant number RYC-2017-21843.

Institutional Review Board Statement

Not applicable.

Informed Consent Statement

Not applicable.

Data Availability Statement

Data available in a publicly accessible repository that does not issue DOIs. All data presented in this work will be available in Docta Complutense repository https://docta.ucm.es/handle/20.500.14352/16 (25 February 2024).

Acknowledgments

The support of the ADITIMAT-CM project (S2018/NMT-4411, Regional Government of Madrid and EU Structural and Social Funds) and PID2021-124341OB-C22 (MCIU) are gratefully acknowledged. M. Mohedano is grateful for the support of RYC-2017-21843.

Conflicts of Interest

The authors declare no conflicts of interest. The funders had no role in the design of the study; in the collection, analyses, or interpretation of data; in the writing of the manuscript; or in the decision to publish the results.

References

  1. Munir, K.; Lin, J.; Wen, C.; Wright, P.F.A.; Li, Y. Mechanical, Corrosion, and Biocompatibility Properties of Mg-Zr-Sr-Sc Alloys for Biodegradable Implant Applications. Acta Biomater. 2020, 102, 493–507. [Google Scholar] [CrossRef]
  2. Kiani, F.; Wen, C.; Li, Y. Prospects and Strategies for Magnesium Alloys as Biodegradable Implants from Crystalline to Bulk Metallic Glasses and Composites—A Review. Acta Biomater. 2020, 103, 1–23. [Google Scholar] [CrossRef]
  3. Witte, F.; Kaese, V.; Haferkamp, H.; Switzer, E.; Meyer-Lindenberg, A.; Wirth, C.J.; Windhagen, H. In Vivo Corrosion of Four Magnesium Alloys and the Associated Bone Response. Biomaterials 2005, 26, 3557–3563. [Google Scholar] [CrossRef]
  4. Staiger, M.P.; Pietak, A.M.; Huadmai, J.; Dias, G. Magnesium and Its Alloys as Orthopedic Biomaterials: A Review. Biomaterials 2006, 27, 1728–1734. [Google Scholar] [CrossRef]
  5. Kellesarian, S.V.; Yunker, M.; Ramakrishnaiah, R.; Malmstrom, H.; Kellesarian, T.V.; Ros Malignaggi, V.; Javed, F. Does Incorporating Zinc in Titanium Implant Surfaces Influence Osseointegration? A Systematic Review. J. Prosthet. Dent. 2017, 117, 41–47. [Google Scholar] [CrossRef]
  6. Li, Z.H.; Sasaki, T.T.; Uedono, A.; Hono, K. Role of Zn on the Rapid Age-Hardening in Mg-Ca-Zn Alloys. Scr. Mater. 2022, 216, 114735. [Google Scholar] [CrossRef]
  7. Schäublin, R.E.; Becker, M.; Cihova, M.; Gerstl, S.S.A.; Deiana, D.; Hébert, C.; Pogatscher, S.; Uggowitzer, P.J.; Löffler, J.F. Precipitation in Lean Mg–Zn–Ca Alloys. Acta Mater. 2022, 239, 118223. [Google Scholar] [CrossRef]
  8. Baigonakova, G.; Marchenko, E.; Zhukov, I.; Vorozhtsov, A. Structure, Cytocompatibility and Biodegradation of Nanocrystalline Coated Mg–Ca–Zn Alloys. Vacuum 2023, 207, 111630. [Google Scholar] [CrossRef]
  9. Qiu, W.; Huang, G.; Li, Y.; Chen, J.; Huang, W.; Peng, Z.; Liang, J.; Xia, F.; Yao, M.; Xiong, A. Microstructure and Properties of Mg–Ca–Zn Alloy for Thermal Energy Storage. Vacuum 2022, 203, 111282. [Google Scholar] [CrossRef]
  10. Roche, V.; Koga, G.Y.; Matias, T.B.; Kiminami, C.S.; Bolfarini, C.; Botta, W.J.; Nogueira, R.P.; Jorge Junior, A.M. Degradation of Biodegradable Implants: The Influence of Microstructure and Composition of Mg-Zn-Ca Alloys. J. Alloys Compd. 2019, 774, 168–181. [Google Scholar] [CrossRef]
  11. Annur, D.; Erryani, A.; Amal, M.I.; Sitorus, L.S.; Kartika, I. The Synthesis and Characterization of Mg-Zn-Ca Alloy by Powder Metallurgy Process. AIP Conf. Proc. 2016, 1725, 020032. [Google Scholar] [CrossRef]
  12. Abdel-Gawad, S.A.; Shoeib, M.A. Corrosion Studies and Microstructure of Mg−Zn−Ca Alloys for Biomedical Applications. Surf. Interfaces 2019, 14, 108–116. [Google Scholar] [CrossRef]
  13. Wang, Y. The Effects of Second Phase on Microstructure and Properties of Degradable As-Cast Mg-Zn-Ca Alloy for Intrauterine Device (IUD) Applications. Int. J. Electrochem. Sci. 2022, 17, 220835. [Google Scholar] [CrossRef]
  14. Xie, L.L.; Chu, J.H.; Li, X.J.; Zou, D.N.; Tong, L.B. Improved Corrosion Resistance of EP Coating on Mg Alloy through GO Hybridization and Silica-Based Superhydrophobic Surface. Diam. Relat. Mater. 2022, 130, 109476. [Google Scholar] [CrossRef]
  15. Merson, D.; Brilevsky, A.; Myagkikh, P.; Markushev, M.; Vinogradov, A. Effect of Deformation Processing of the Dilute Mg-1Zn-0.2Ca Alloy on the Mechanical Properties and Corrosion Rate in a Simulated Body Fluid. Lett. Mater. 2020, 10, 217–222. [Google Scholar] [CrossRef]
  16. Jiang, P.; Blawert, C.; Hou, R.; Bohlen, J.; Konchakova, N.; Zheludkevich, M.L. A Comprehensive Comparison of the Corrosion Performance, Fatigue Behavior and Mechanical Properties of Micro-Alloyed MgZnCa and MgZnGe Alloys. Mater. Des. 2020, 185, 108285. [Google Scholar] [CrossRef]
  17. Moreno, L.; Matykina, E.; Yasakau, K.A.; Blawert, C.; Arrabal, R.; Mohedano, M. As-Cast and Extruded MgZnCa Systems for Biodegradable Implants: Characterization and Corrosion Behavior. J. Magnes. Alloys 2023, 11, 1102–1120. [Google Scholar] [CrossRef]
  18. Jin, Y.; Blawert, C.; Yang, H.; Wiese, B.; Feyerabend, F.; Bohlen, J.; Mei, D.; Deng, M.; Campos, M.S.; Scharnagl, N.; et al. Microstructure-Corrosion Behaviour Relationship of Micro-Alloyed Mg-0.5Zn Alloy with the Addition of Ca, Sr, Ag, In and Cu. Mater. Des. 2020, 195, 108980. [Google Scholar] [CrossRef]
  19. Zhang, Y.; Bai, K.; Fu, Z.; Zhang, C.; Zhou, H.; Wang, L.; Zhu, S.; Guan, S.; Li, D.; Hu, J. Composite Coating Prepared by Micro-Arc Oxidation Followed by Sol–Gel Process and in Vitro Degradation Properties. Appl. Surf. Sci. 2012, 258, 2939–2943. [Google Scholar] [CrossRef]
  20. Gao, J.H.; Shi, X.Y.; Yang, B.; Hou, S.S.; Meng, E.C.; Guan, F.X.; Guan, S.K. Fabrication and Characterization of Bioactive Composite Coatings on Mg–Zn–Ca Alloy by MAO/Sol–Gel. J. Mater. Sci. Mater. Med. 2011, 22, 1681–1687. [Google Scholar] [CrossRef]
  21. Blawert, C.; Sah, S.P.; Scharnagl, N.; Kannan, M.B. 8—Plasma Electrolytic Oxidation/Micro-Arc Oxidation of Magnesium and Its Alloys. In Surface Modification of Magnesium and Its Alloys for Biomedical Applications; Narayanan, T.S.N.S., Park, I.-S., Lee, M.-H., Eds.; Woodhead Publishing Series in Biomaterials; Woodhead Publishing: Sawton, UK, 2015; pp. 193–234. ISBN 978-1-78242-078-1. [Google Scholar]
  22. Jia, P.; Pan, Y.; Yu, L.; Wang, J.; Feng, R.; Wang, Y.; Fang, X.; Chen, C. In Vitro Degradation and Corrosion Evaluations of Plasma Electrolytic Oxidized Mg–Zn–Ca–Si Alloys for Biomedical Applications. J. Mater. Res. Technol. 2023, 23, 2410–2425. [Google Scholar] [CrossRef]
  23. Keyvani, A.; Kamkar, N.; Chaharmahali, R.; Bahamirian, M.; Kaseem, M.; Fattah-alhosseini, A. Improving Anti-Corrosion Properties AZ31 Mg Alloy Corrosion Behavior in a Simulated Body Fluid Using Plasma Electrolytic Oxidation Coating Containing Hydroxyapatite Nanoparticles. Inorg. Chem. Commun. 2023, 158, 111470. [Google Scholar] [CrossRef]
  24. Zhang, N.; Zhao, D.; Liu, N.; Wu, Y.; Yang, J.; Wang, Y.; Xie, H.; Ji, Y.; Zhou, C.; Zhuang, J.; et al. Assessment of the Degradation Rates and Effectiveness of Different Coated Mg-Zn-Ca Alloy Scaffolds for in Vivo Repair of Critical-Size Bone Defects. J. Mater. Sci. Mater. Med. 2018, 29, 138. [Google Scholar] [CrossRef]
  25. Kröger, N.; Kopp, A.; Staudt, M.; Rusu, M.; Schuh, A.; Liehn, E.A. Hemocompatibility of Plasma Electrolytic Oxidation (PEO) Coated Mg-RE and Mg-Zn-Ca Alloys for Vascular Scaffold Applications. Mater. Sci. Eng. C 2018, 92, 819–826. [Google Scholar] [CrossRef]
  26. Pan, Y.; Chen, C.; Wang, D.; Huang, D. Dissolution and Precipitation Behaviors of Silicon-Containing Ceramic Coating on Mg–Zn–Ca Alloy in Simulated Body Fluid. Colloids Surf. B Biointerfaces 2014, 122, 746–751. [Google Scholar] [CrossRef] [PubMed]
  27. Ly, X.; Yang, S.; Nguyen, T. Effect of Equal Channel Angular Pressing as the Pretreatment on Microstructure and Corrosion Behavior of Micro-Arc Oxidation (MAO) Composite Coating on Biodegradable Mg-Zn-Ca Alloy. Surf. Coat. Technol. 2020, 395, 125923. [Google Scholar] [CrossRef]
  28. Dou, J.; Gu, G.; Chen, C.; Pan, Y. Characterization and Biodegradation Behavior of Micro-Arc Oxidation Coatings Formed on Mg–Zn–Ca Alloys in Two Different Electrolytes. RSC Adv. 2016, 6, 104808–104818. [Google Scholar] [CrossRef]
  29. Pan, Y.; He, S.; Wang, D.; Huang, D.; Zheng, T.; Wang, S.; Dong, P.; Chen, C. In Vitro Degradation and Electrochemical Corrosion Evaluations of Microarc Oxidized Pure Mg, Mg–Ca and Mg–Ca–Zn Alloys for Biomedical Applications. Mater. Sci. Eng. C 2015, 47, 85–96. [Google Scholar] [CrossRef]
  30. Moreno, L.; Mohedano, M.; Arrabal, R.; Matykina, E. Development and Screening of (Ca-P-Si-F)-PEO Coatings for Biodegradability Control of Mg-Zn-Ca Alloys. J. Magnes. Alloys 2022, 10, 2220–2237. [Google Scholar] [CrossRef]
  31. Wang, Y.; Chen, M.; Zhao, Y. Preparation and Corrosion Resistance of Microarc Oxidation-Coated Biomedical Mg–Zn–Ca Alloy in the Silicon–Phosphorus-Mixed Electrolyte. ACS Omega 2019, 4, 20937–20947. [Google Scholar] [CrossRef]
  32. Daavari, M.; Atapour, M.; Mohedano, M.; Sánchez, H.M.; Rodríguez-Hernández, J.; Matykina, E.; Arrabal, R.; Taherizadeh, A. Quasi-in Vivo Corrosion Behavior of AZ31B Mg Alloy with Hybrid MWCNTs-PEO/PCL Based Coatings. J. Magnes. Alloys 2021, 10, 3217–3233. [Google Scholar] [CrossRef]
  33. Chun, J.S.; Byrne, J.G. Precipitate Strengthening Mechanisms in Magnesium Zinc Alloy Single Crystals. J. Mater. Sci. 1969, 4, 861–872. [Google Scholar] [CrossRef]
  34. Lu, X.; Zhao, G.; Zhou, J.; Zhang, C.; Yu, J. Microstructure and Mechanical Properties of the As-Cast and As-Homogenized Mg-Zn-Sn-Mn-Ca Alloy Fabricated by Semicontinuous Casting. Materials 2018, 11, 703. [Google Scholar] [CrossRef]
  35. Santos-Coquillat, A.; Esteban-Lucia, M.; Martinez-Campos, E.; Mohedano, M.; Arrabal, R.; Blawert, C.; Zheludkevich, M.L.; Matykina, E. PEO Coatings Design for Mg-Ca Alloy for Cardiovascular Stent and Bone Regeneration Applications. Mater. Sci. Eng. C 2019, 105, 110026. [Google Scholar] [CrossRef]
  36. Arrabal, R.; Mohedano, M.; Matykina, E. Electrochemical Surface Treatments for Mg Alloys. In Encyclopedia of Materials: Metals and Allloys; Caballero, F.G., Ed.; Elsevier: Oxford, UK, 2022; pp. 87–112. ISBN 978-0-12-819733-2. [Google Scholar]
  37. Chaharmahali, R.; Fattah-alhosseini, A.; Babaei, K. Surface Characterization and Corrosion Behavior of Calcium Phosphate (Ca-P) Base Composite Layer on Mg and Its Alloys Using Plasma Electrolytic Oxidation (PEO): A Review. J. Magnes. Alloys 2020, 9, 21–40. [Google Scholar] [CrossRef]
  38. Tang, H.; Wu, T.; Wang, H.; Jian, X.; Wu, Y. Corrosion Behavior of HA Containing Ceramic Coated Magnesium Alloy in Hank’s Solution. J. Alloys Compd. 2017, 698, 643–653. [Google Scholar] [CrossRef]
  39. Hussein, R.; Northwood, D. Production of Anti-Corrosion Coatings on Light Alloys (Al, Mg, Ti) by Plasma-Electrolytic Oxidation (PEO). In Developments in Corrosion Protection; BoD–Books on Demand: Norderstedt, Germany, 2014; Chapter 11; pp. 201–239. ISBN 978-953-51-1223-5. [Google Scholar]
  40. Hussein, R.O.; Nie, X.; Northwood, D.O. An Investigation of Ceramic Coating Growth Mechanisms in Plasma Electrolytic Oxidation (PEO) Processing. Electrochim. Acta 2013, 112, 111–119. [Google Scholar] [CrossRef]
  41. Lu, X.; Blawert, C.; Mohedano, M.; Scharnagl, N.; Zheludkevich, M.L.; Kainer, K.U. Influence of Electrical Parameters on Particle Uptake during Plasma Electrolytic Oxidation Processing of AM50 Mg Alloy. Surf. Coat. Technol. 2016, 289, 179–185. [Google Scholar] [CrossRef]
  42. Lu, X.; Blawert, C.; Huang, Y.; Ovri, H.; Zheludkevich, M.L.; Kainer, K.U. Plasma Electrolytic Oxidation Coatings on Mg Alloy with Addition of SiO2 Particles. Electrochim. Acta 2016, 187, 20–33. [Google Scholar] [CrossRef]
  43. Asoh, H.; Asakura, K.; Hashimoto, H. Effect of Alcohol Addition on the Structure and Corrosion Resistance of Plasma Electrolytic Oxidation Films Formed on AZ31B Magnesium Alloy. RSC Adv. 2020, 10, 9026–9036. [Google Scholar] [CrossRef]
  44. de Tavares, M.M.; de Vitoriano, J.O.; da Silva, R.C.L.; Franco, A.R.; de Souza, G.B.; da Costa, J.A.P.; Alves-Junior, C. Effect of Duty Cycle and Treatment Time on Electrolytic Plasma Oxidation of Commercially Pure Al Samples. J. Mater. Res. Technol. 2019, 8, 2141–2147. [Google Scholar] [CrossRef]
  45. Zhuang, J.; Song, R.; Xiang, N.; Lu, J.; Xiong, Y. Effects of Oxidation Time on Corrosion Resistance of Plasma Electrolytic Oxidation Coatings on Magnesium Alloy. Int. J. Mater. Res. 2017, 108, 758–766. [Google Scholar] [CrossRef]
  46. Lu, X.; Mohedano, M.; Blawert, C.; Matykina, E.; Arrabal, R.; Kainer, K.U.; Zheludkevich, M.L. Plasma Electrolytic Oxidation Coatings with Particle Additions—A Review. Surf. Coat. Technol. 2016, 307, 1165–1182. [Google Scholar] [CrossRef]
  47. Lou, B.-S.; Lin, Y.-Y.; Tseng, C.-M.; Lu, Y.-C.; Duh, J.-G.; Lee, J.-W. Plasma Electrolytic Oxidation Coatings on AZ31 Magnesium Alloys with Si3N4 Nanoparticle Additives. Surf. Coat. Technol. 2017, 332, 358–367. [Google Scholar] [CrossRef]
  48. Wang, Y.; Wei, D.; Yu, J.; Di, S. Effects of Al2O3 Nano-Additive on Performance of Micro-Arc Oxidation Coatings Formed on AZ91D Mg Alloy. J. Mater. Sci. Technol. 2014, 30, 984–990. [Google Scholar] [CrossRef]
  49. Gu, X.-N.; Zheng, Y.-F. A Review on Magnesium Alloys as Biodegradable Materials. Front. Mater. Sci. China 2010, 4, 111–115. [Google Scholar] [CrossRef]
  50. Tsai, D.-S.; Chou, C.-C. Influences of Growth Species and Inclusions on the Current–Voltage Behavior of Plasma Electrolytic Oxidation: A Review. Coatings 2021, 11, 270. [Google Scholar] [CrossRef]
  51. Reichelt, K. Nucleation and Growth of Thin Films. Vacuum 1988, 38, 1083–1099. [Google Scholar] [CrossRef]
  52. Brindley, G.W.; Hayami, R. Kinetics and Mechanism of Formation of Forsterite (Mg2SiO4) by Solid State Reaction of MgO and SiO2. Philos. Mag. J. Theor. Exp. Appl. Phys. 1965, 12, 505–514. [Google Scholar] [CrossRef]
  53. Wang, M.; Zhou, Y.; Zhang, Y.; Hahn, S.; Kim, E. From Zn(OH) 2 to ZnO: A Study on the Mechanism of Phase Transformation. CrystEngComm 2011, 13, 6024–6026. [Google Scholar] [CrossRef]
  54. Tang, H.; Han, Y.; Wu, T.; Tao, W.; Jian, X.; Wu, Y.; Xu, F. Synthesis and Properties of Hydroxyapatite-Containing Coating on AZ31 Magnesium Alloy by Micro-Arc Oxidation. Appl. Surf. Sci. 2017, 400, 391–404. [Google Scholar] [CrossRef]
  55. Dou, J.; Wang, J.; Lu, Y.; Chen, C.; Yu, H.; Ma, R.L.-W. Bioactive MAO/CS Composite Coatings on Mg-Zn-Ca Alloy for Orthopedic Applications. Prog. Org. Coat. 2021, 152, 106112. [Google Scholar] [CrossRef]
  56. Moreno, L.; Mohedano, M.; Arrabal, R.; Matykina, E. Screening of Fluoride-Free PEO Coatings on Cast Mg3Zn0.4Ca Alloy for Orthopaedic Implants. Surf. Coat. Technol. 2024, 476, 130184. [Google Scholar] [CrossRef]
  57. Fang, H.; Wang, C.; Zhou, S.; Zheng, Z.; Lu, T.; Li, G.; Tian, Y.; Suga, T. Enhanced Adhesion and Anticorrosion of Silk Fibroin Coated Biodegradable Mg-Zn-Ca Alloy via a Two-Step Plasma Activation. Corros. Sci. 2020, 168, 108466. [Google Scholar] [CrossRef]
  58. van Gaalen, K.; Gremse, F.; Benn, F.; McHugh, P.E.; Kopp, A.; Vaughan, T.J. Automated Ex-Situ Detection of Pitting Corrosion and Its Effect on the Mechanical Integrity of Rare Earth Magnesium Alloy—WE43. Bioact. Mater. 2022, 8, 545–558. [Google Scholar] [CrossRef] [PubMed]
  59. Shahri, Z.; Allahkaram, S.R.; Soltani, R.; Jafari, H. Study on Corrosion Behavior of Nano-Structured Coatings Developed on Biodegradable as Cast Mg–Zn–Ca Alloy by Plasma Electrolyte Oxidation. Surf. Coat. Technol. 2018, 347, 225–234. [Google Scholar] [CrossRef]
  60. Tsakiris, V.; Tardei, C.; Clicinschi, F.M. Biodegradable Mg Alloys for Orthopedic Implants—A Review. J. Magnes. Alloys 2021, 9, 1884–1905. [Google Scholar] [CrossRef]
  61. Chandra, G.; Pandey, A. Biodegradable Bone Implants in Orthopedic Applications: A Review. Biocybern. Biomed. Eng. 2020, 40, 596–610. [Google Scholar] [CrossRef]
  62. Wang, L.; Guo, X.; Chen, J.; Zhen, Z.; Cao, B.; Wan, W.; Dou, Y.; Pan, H.; Xu, F.; Zhang, Z.; et al. Key Considerations on the Development of Biodegradable Biomaterials for Clinical Translation of Medical Devices: With Cartilage Repair Products as an Example. Bioact. Mater. 2022, 9, 332–342. [Google Scholar] [CrossRef] [PubMed]
  63. Nicolao-Gómez, A.; Martínez-Campos, E.; Moreno, L.; Rodríguez-Hernández, J.; Matykina, E. Hierarchical Hybrid Coatings with Drug-Eluting Capacity for Mg Alloy Biomaterials. Materials 2023, 16, 7688. [Google Scholar] [CrossRef]
  64. Persson, D.; Thierry, D.; Karlsson, O. Corrosion and Corrosion Products of Hot Dipped Galvanized Steel during Long Term Atmospheric Exposure at Different Sites World-Wide. Corros. Sci. 2017, 126, 152–165. [Google Scholar] [CrossRef]
  65. Manhabosco, S.M.; Manhabosco, T.M.; Geoffroy, N.; Vignal, V.; Dick, L.F.P. Corrosion Behaviour of Galvanized Steel Studied by Electrochemical Microprobes Applied on Low-Angle Cross Sections. Corros. Sci. 2018, 140, 379–387. [Google Scholar] [CrossRef]
  66. Dou, J.; Chen, Y.; Chi, Y.; Li, H.; Gu, G.; Chen, C. Preparation and Characterization of a Calcium–Phosphate–Silicon Coating on a Mg–Zn–Ca Alloy via Two-Step Micro-Arc Oxidation. Phys. Chem. Chem. Phys. 2017, 19, 15110–15119. [Google Scholar] [CrossRef] [PubMed]
  67. Mohedano, M.; Luthringer, B.J.C.; Mingo, B.; Feyerabend, F.; Arrabal, R.; Sanchez-Egido, P.J.; Blawert, C.; Willumeit-Römer, R.; Zheludkevich, M.L.; Matykina, E. Bioactive Plasma Electrolytic Oxidation Coatings on Mg-Ca Alloy to Control Degradation Behaviour. Surf. Coat. Technol. 2017, 315, 454–467. [Google Scholar] [CrossRef]
  68. Dou, J.; Zhao, Y.; Lu, L.; Gu, G.; Yu, H.; Chen, C. Effect of the Second-Step Voltages on the Structural and Corrosion Properties of Silicon–Calcium–Phosphate (Si–CaP) Coatings on Mg–Zn–Ca Alloy. R. Soc. Open Sci. 2018, 5, 172410. [Google Scholar] [CrossRef]
Figure 1. Optical (a) and secondary electron (b) micrographs of wrought alloy microstructure (inset composition determined by point analyses, EDS (at %)). (c) X-ray diffraction pattern of bare substrate.
Coatings 14 00309 g001aCoatings 14 00309 g001b
Figure 2. (a) Current density-time curves and (b) energy consumption for PEO-T and PEO-S coatings for Mg0.5Zn0.2Ca alloy during 900 s. Dashed lines indicate curves corresponding to the 300 and 600 s treatments. PEO-T electrolyte correspond to black colour and squares shape, and PEO-S electrolyte correspond to red colour and circle shape.
Coatings 14 00309 g002
Figure 3. Secondary electron plan-view micrographs and backscattered electron cross-sectional micrographs of the (af) PEO-T and (gl) PEO-S coatings. Numbers indicate where the local EDS analysis (Table 2) was performed.
Coatings 14 00309 g003
Figure 4. X-ray patterns of (a) PEO-T and (b) PEO-S on Mg0.5Zn0.2Ca alloy at 300, 600, and 900 s.
Coatings 14 00309 g004
Figure 5. Polarization curves of (a) PEO-T and (b) PEO-S and for Mg0.5Zn0.2Ca alloy after 1 h of immersion in inorganic α-MEM.
Coatings 14 00309 g005
Figure 6. Scatter diagram of the impedance values for studied PEO-T and PEO-S coatings. Black squares indicate bare alloy, red circles indicate PEO-T coatings, blue triangles indicate PEO-S coatings, and symbol size increases in the order of increasing treatment time.
Coatings 14 00309 g006
Figure 7. (a) The Nyquist (inset the equivalent circuit determined for PEO coatings and substrate) and (b) Bode plots of PEO-T at 600 s and PEO-S at 300 s on Mg0.5Zn0.2Ca alloy.
Coatings 14 00309 g007
Figure 8. Hydrogen evolution for bare substrate, PEO-T, and PEO-S coatings (a) during 5 days of immersion in α-MEM solution; (b) amplification of the first 5 h.
Coatings 14 00309 g008
Figure 9. (a,c,d) Macrographs and (b,e) cross-section of (b) Mg0.5Zn0.2Ca substrate and (e) PEO-S coatings for Mg0.5Zn0.2Ca alloys after 5 days of immersion in inorganic α-MEM. The numbers (1–6) indicate where the local ESD analysis was displayed (Table 5).
Coatings 14 00309 g009
Table 1. Composition and PEO process parameters of electrolytes.
Electrolyte (g/L)
Composition
PEO-T
Transparent
PEO-S
Suspension
Na3PO4·12H2O1010
Na2SiO3·5H2O109
KOH81
CaH7C3PO62-
CaO-2.9
Na2EDTA2.67-
NaF--
σ (mS/cm2)40.124.6
pH12.712.9
Parameters of process
Voltage (V)−350/−50
Current density (mA/cm2)100
Time (s)300/600/900
Table 2. EDS analysis (at. %) of PEO-T and PEO-S coatings.
CoatingTime (s)LocationONaMgSiPKCaZnCa/P
PEO-T300Plan view45.91.038.19.94.90.01.20.00.24
151.51.131.510.64.40.20.80.10.18
248.80.836.97.74.70.50.50.10.11
315.80.280.51.81.10.10.10.40.09
600Plan view42.50.440.011.75.00.50.80.00.16
449.40.536.09.34.00.40.30.10.08
548.91.038.76.23.41.30.30.10.09
640.50.251.35.12.40.30.10.20.04
900Plan view45.60.941.99.02.91.30.70.10.24
749.11.135.08.93.91.10.80.10.21
849.80.337.87.63.90.40.20.10.05
939.50.353.24.71.80.20.10.20.06
PEO-S300Plan view53.73.926.67.83.40.83.80.01.12
145.82.234.214.12.90.60.10.10.03
250.31.735.99.12.50.40.10.10.04
344.10.350.64.00.80.10.10.10.13
600Plan view44.42.637.514.63.01.01.00.30.33
437.61.341.614.14.50.50.30.40.07
536.00.950.28.83.70.00.40.10.11
637.21.652.78.02.10.50.00.0-
900Plan view38.72.138.112.95.81.01.30.10.22
736.50.944.613.14.20.60.20.10.05
836.00.552.97.53.30.00.10.30.04
941.00.155.71.51.00.10.10.40.10
Table 3. Corrosion characteristics obtained from polarization curves.
ElectrolyteTime (s)Ecorr
(V)
icorr
(µA/cm2)
Epit
(V)
Mg0.5Zn0.2Ca−1.4733.41−1.40
PEO-T300−1.3511.02-
600−1.4155.40-
900−1.3860.79-
PEO-S300−1.4120.20-
600−1.4147.32-
900−1.3860.32-
Table 4. EIS equivalent circuits after 1 h of immersion in inorganic α-MEM solution.
SampleRel
(Ω·cm2)
CPE1
(µS·sn·cm2)
n1R1 (Ω·cm2)CPE2
(µS·sn·cm2)
n2R2
(Ω·cm2)
CPEdl
(µS·sn·cm2)
ndlRct
(Ω·cm2)
Rtotal
(Ω·cm2)
Mg0.5Zn0.2Ca36.810.10.58171.324.40.87148930.60.5615003160.3
PEO-T145.140.59187.70.0030.70342.664.40.55777.31321.6
PEO-S106.450.6412067.440.7632,030583.130.832,43865,684
Table 5. EDS analysis (at.%) of substrate and PEO-S on Mg0.5Zn0.2Ca alloy from Figure 9b,e after 5 days of immersion in inorganic α-MEM solution.
SampleLocationONaMgSiPClKCaZnCa/P
Mg0.5Zn0.2Ca147.81.38.20.117.1--20.70.11.21
240.80.710.80.419.6--26.50.71.36
PEO-S360.20.912.00.09.70.7-13.80.71.42
456.00.717.50.010.01.2-12.10.91.21
548.51.117.70.211.21.10.417.71.11.58
670.10.819.20.02.50.3-5.10.52.04
Disclaimer/Publisher’s Note: The statements, opinions and data contained in all publications are solely those of the individual author(s) and contributor(s) and not of MDPI and/or the editor(s). MDPI and/or the editor(s) disclaim responsibility for any injury to people or property resulting from any ideas, methods, instructions or products referred to in the content.

