
Four-Polarisation Camera for Anisotropy Mapping at Three Orientations: Micro-Grain of Olivine
 , , , , , , , and
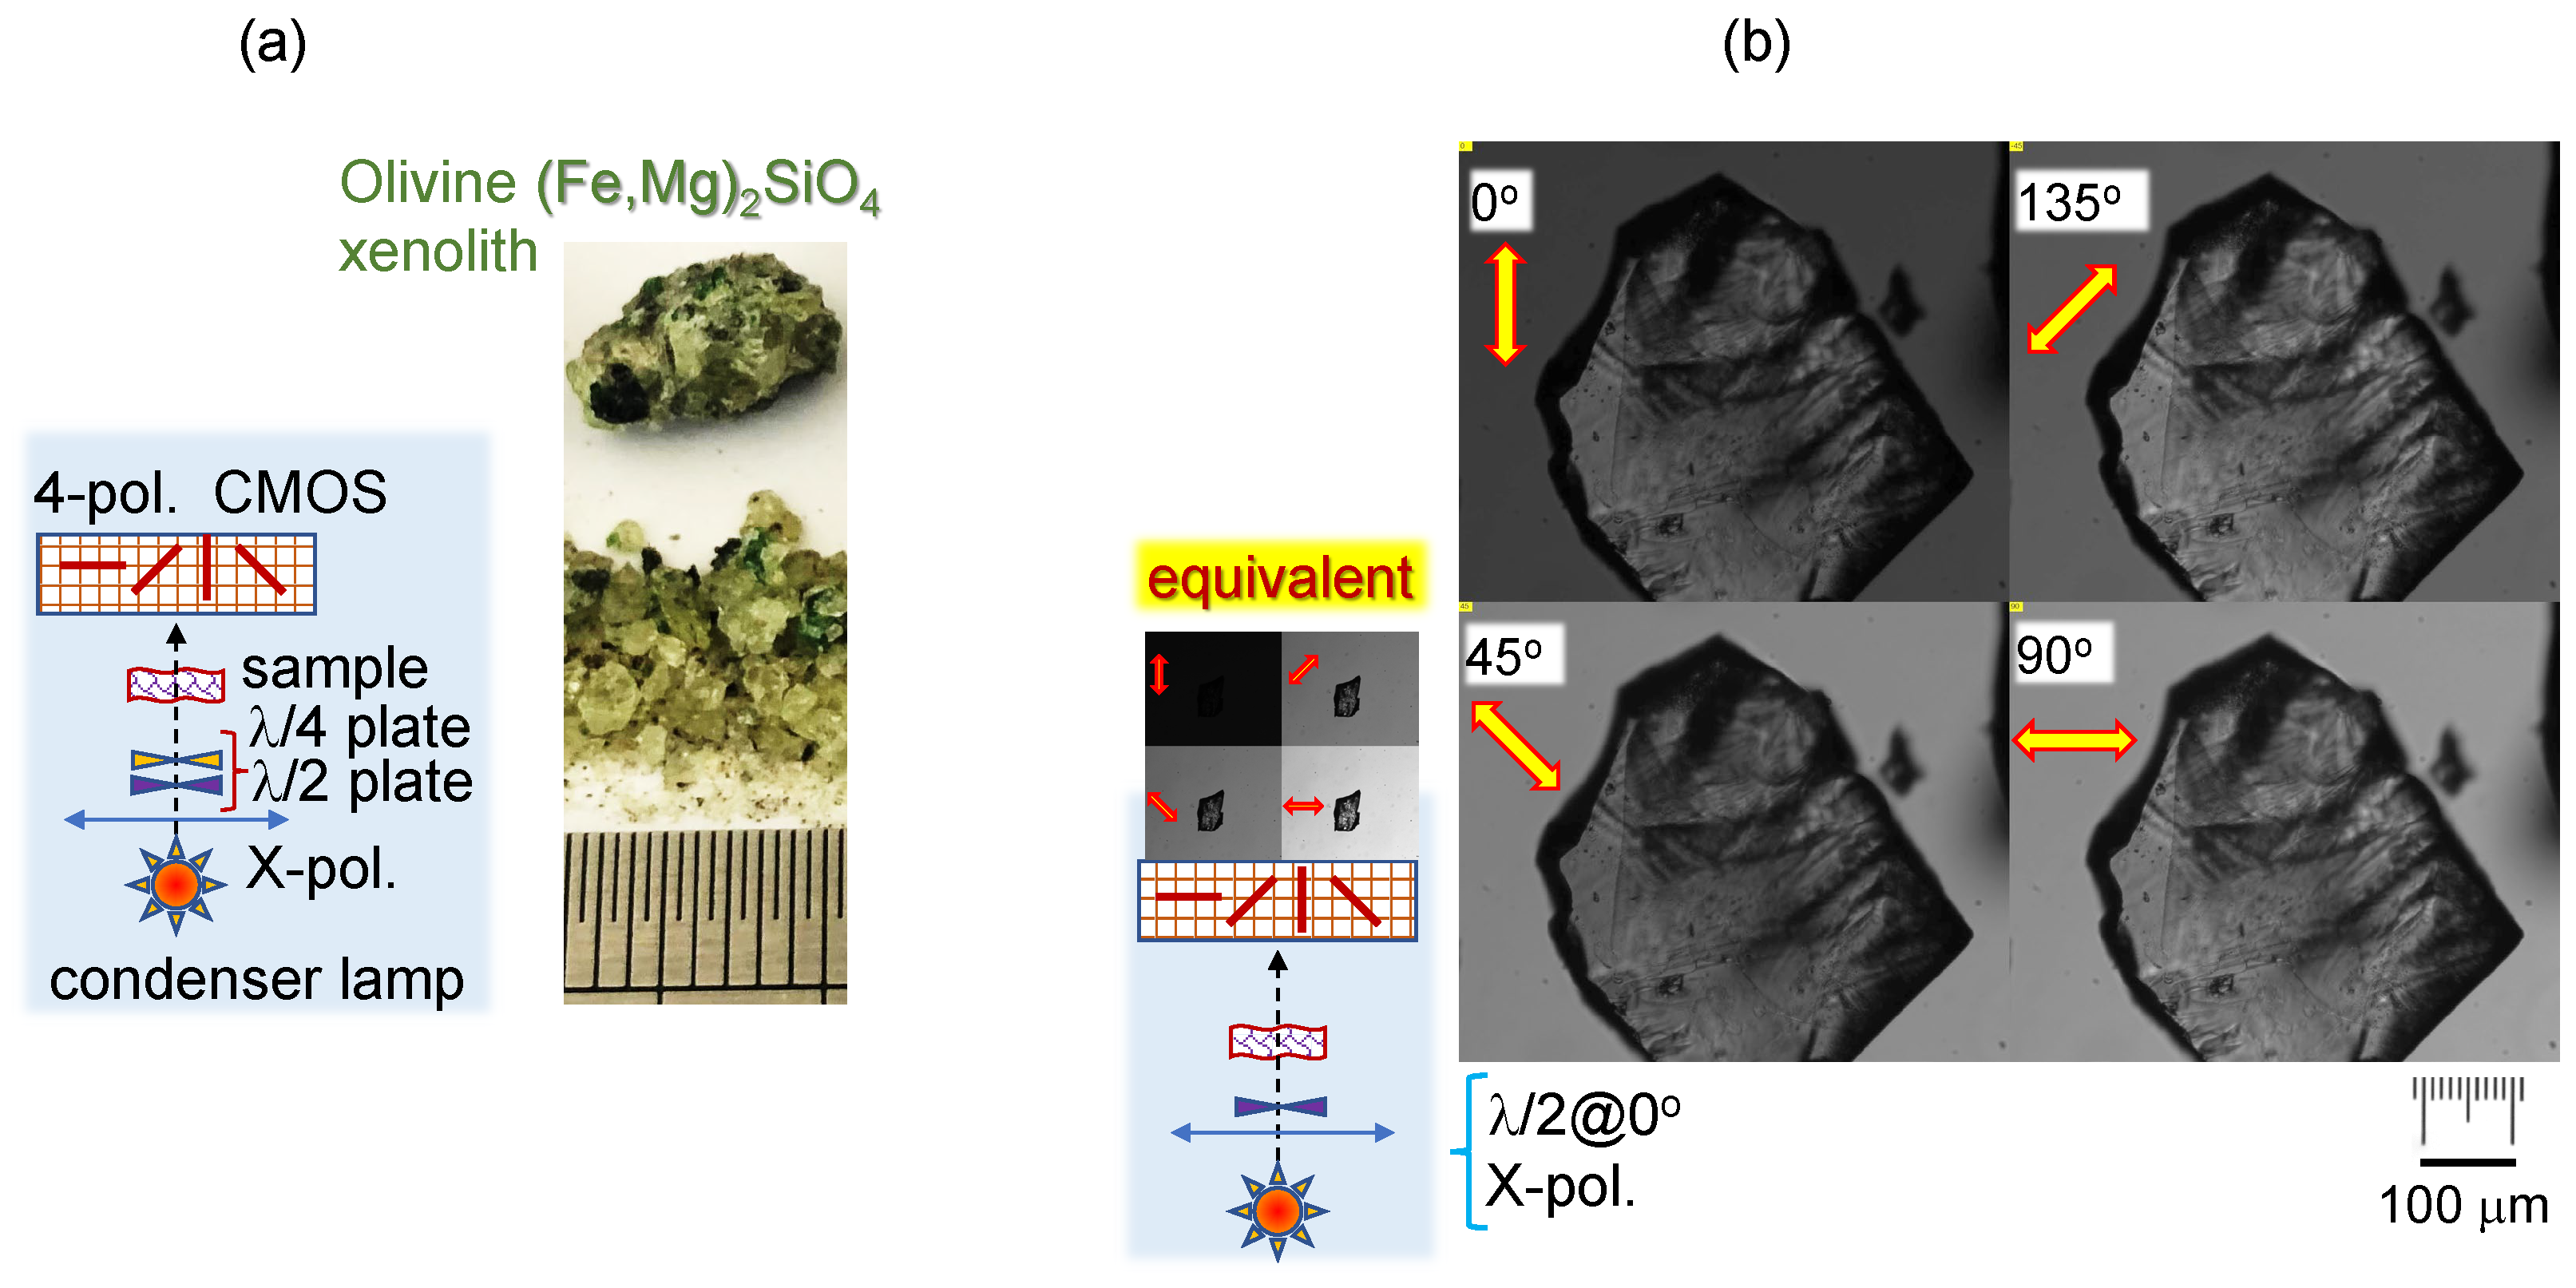
Abstract
:1. Introduction
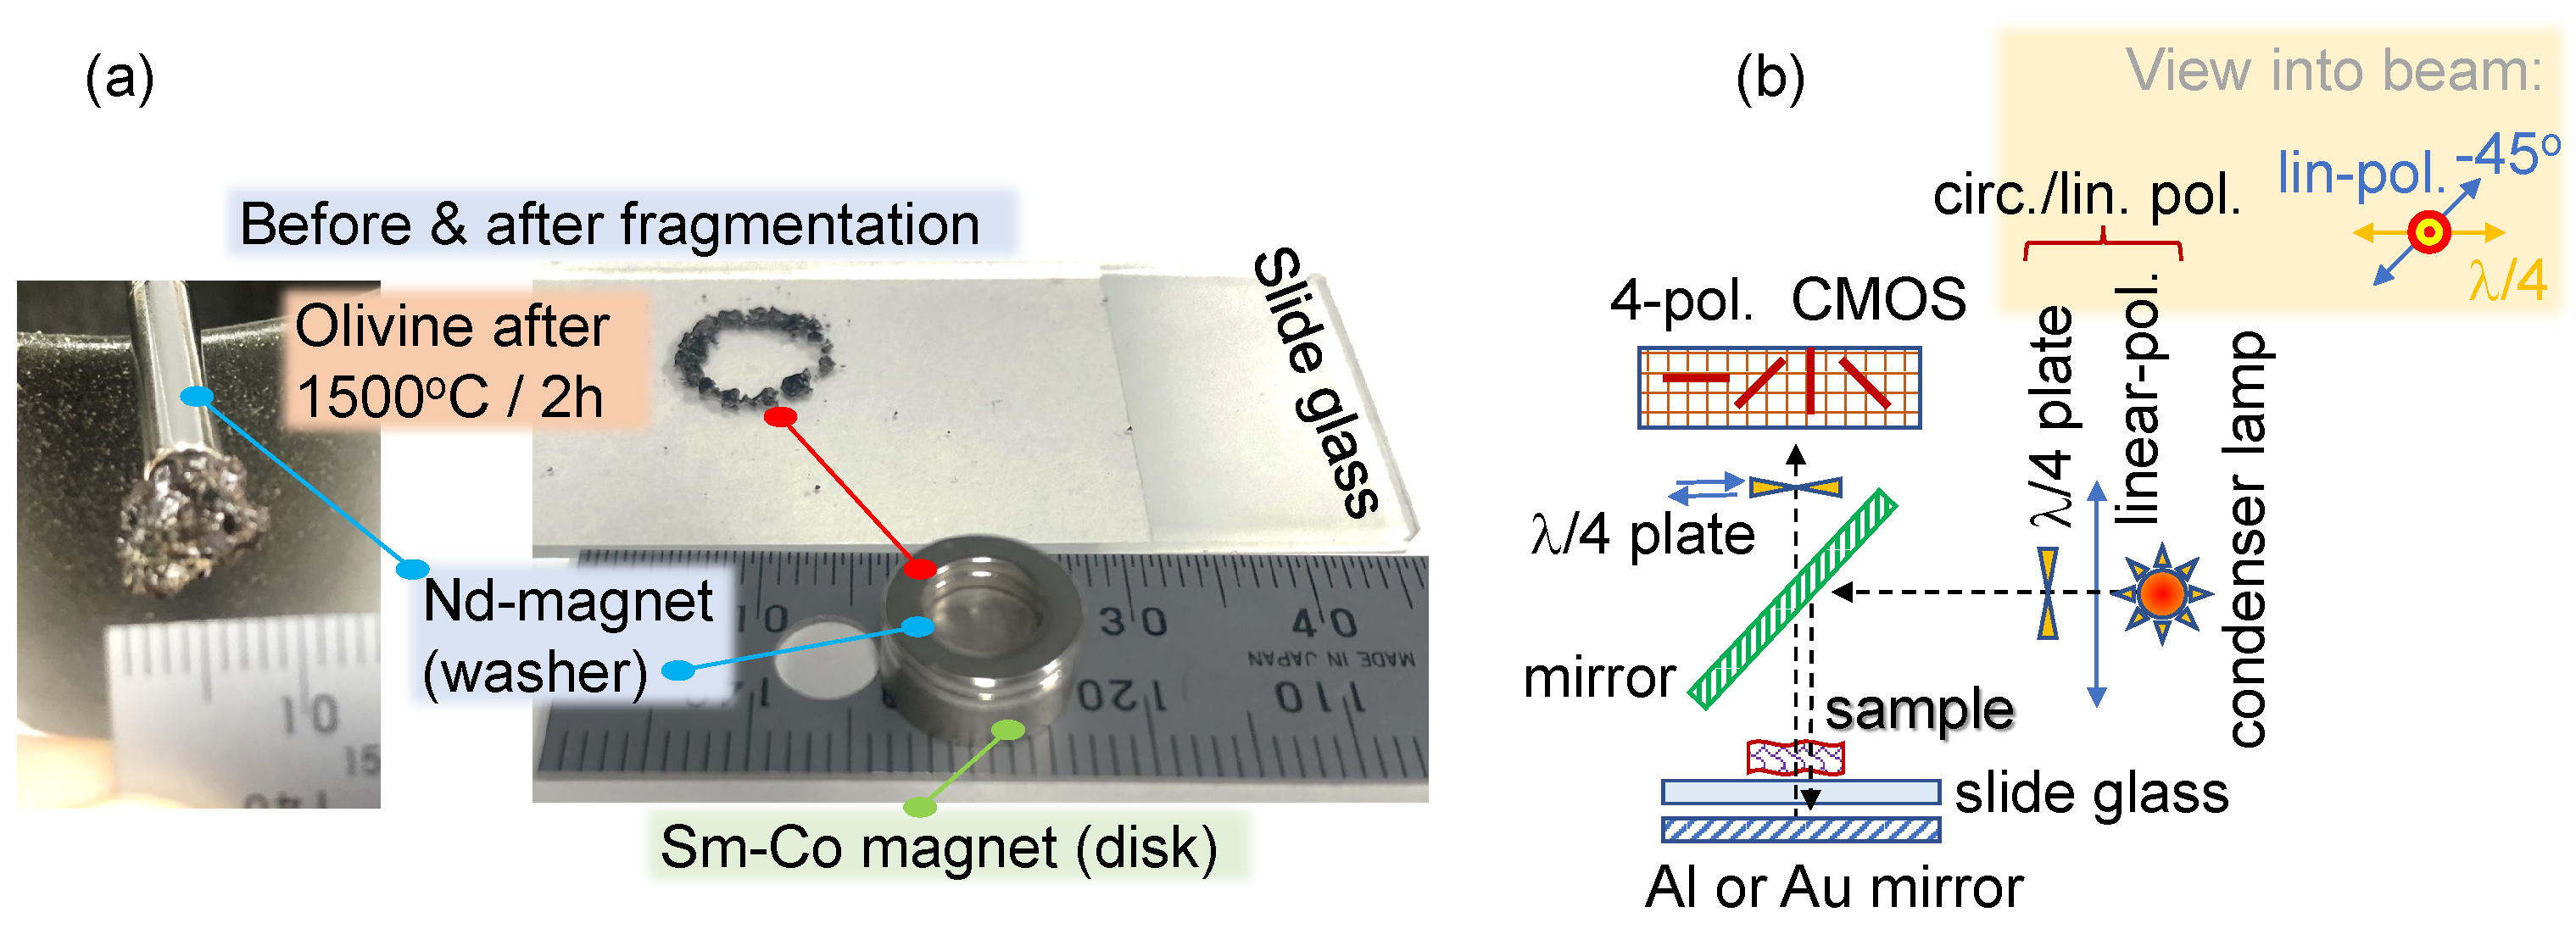
2. Method and Samples
2.1. Method: Detection of Anisotropy
2.2. Mueller Matrices Used for Modelling of Transmittance
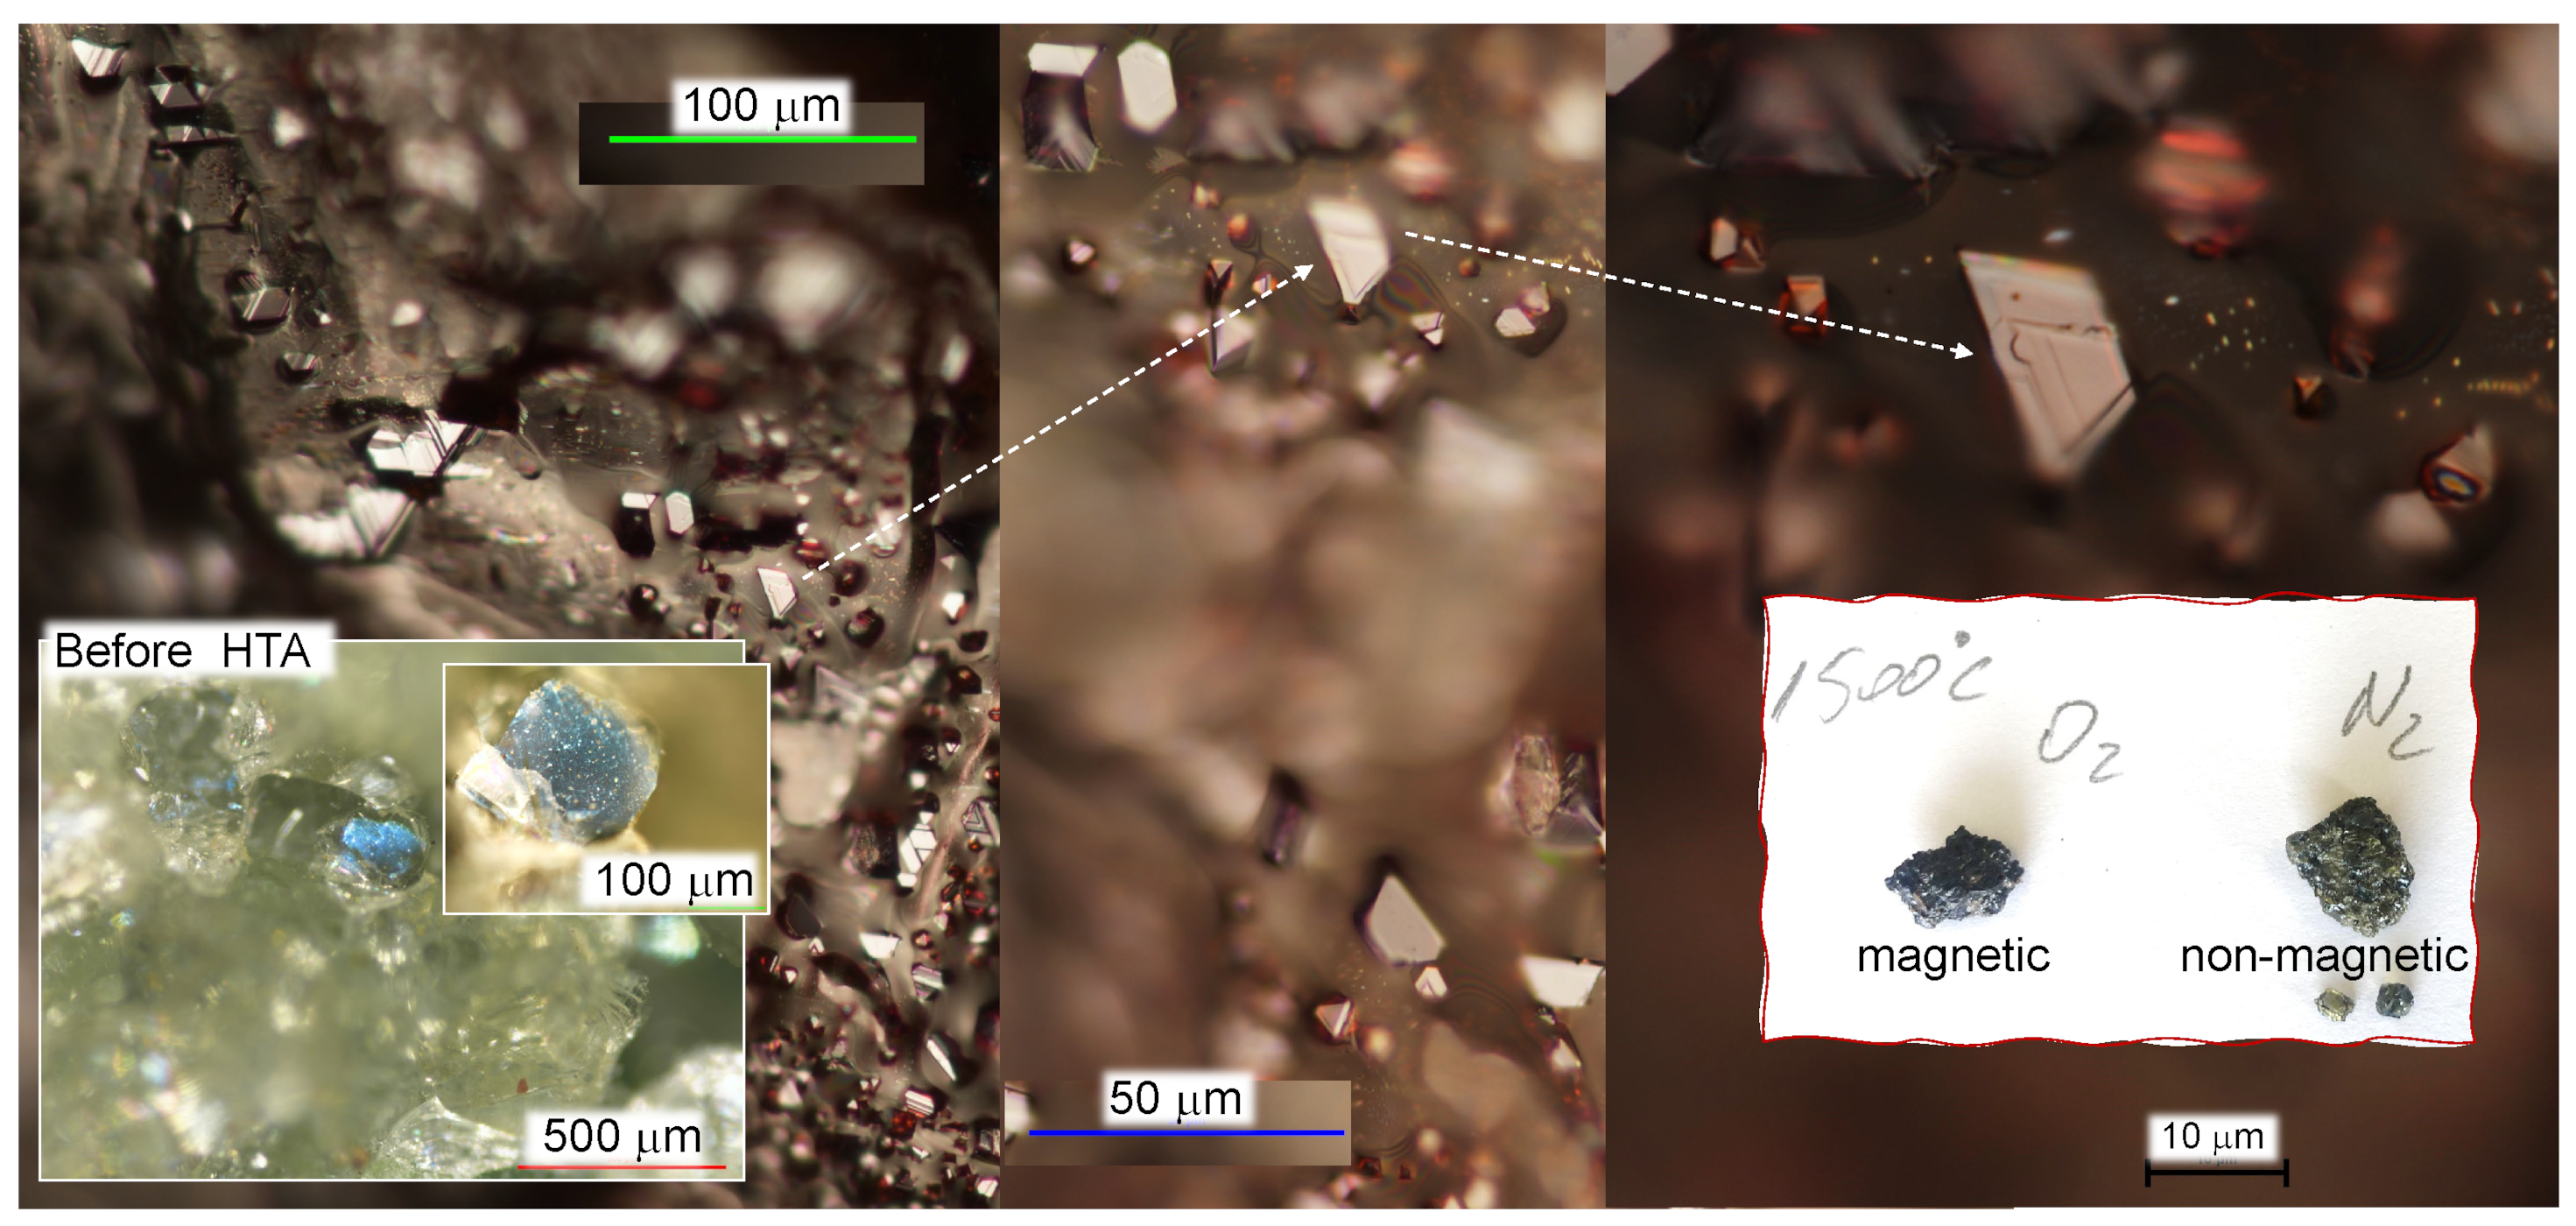
2.3. Annealed Olivine Samples
3. Results and Discussion
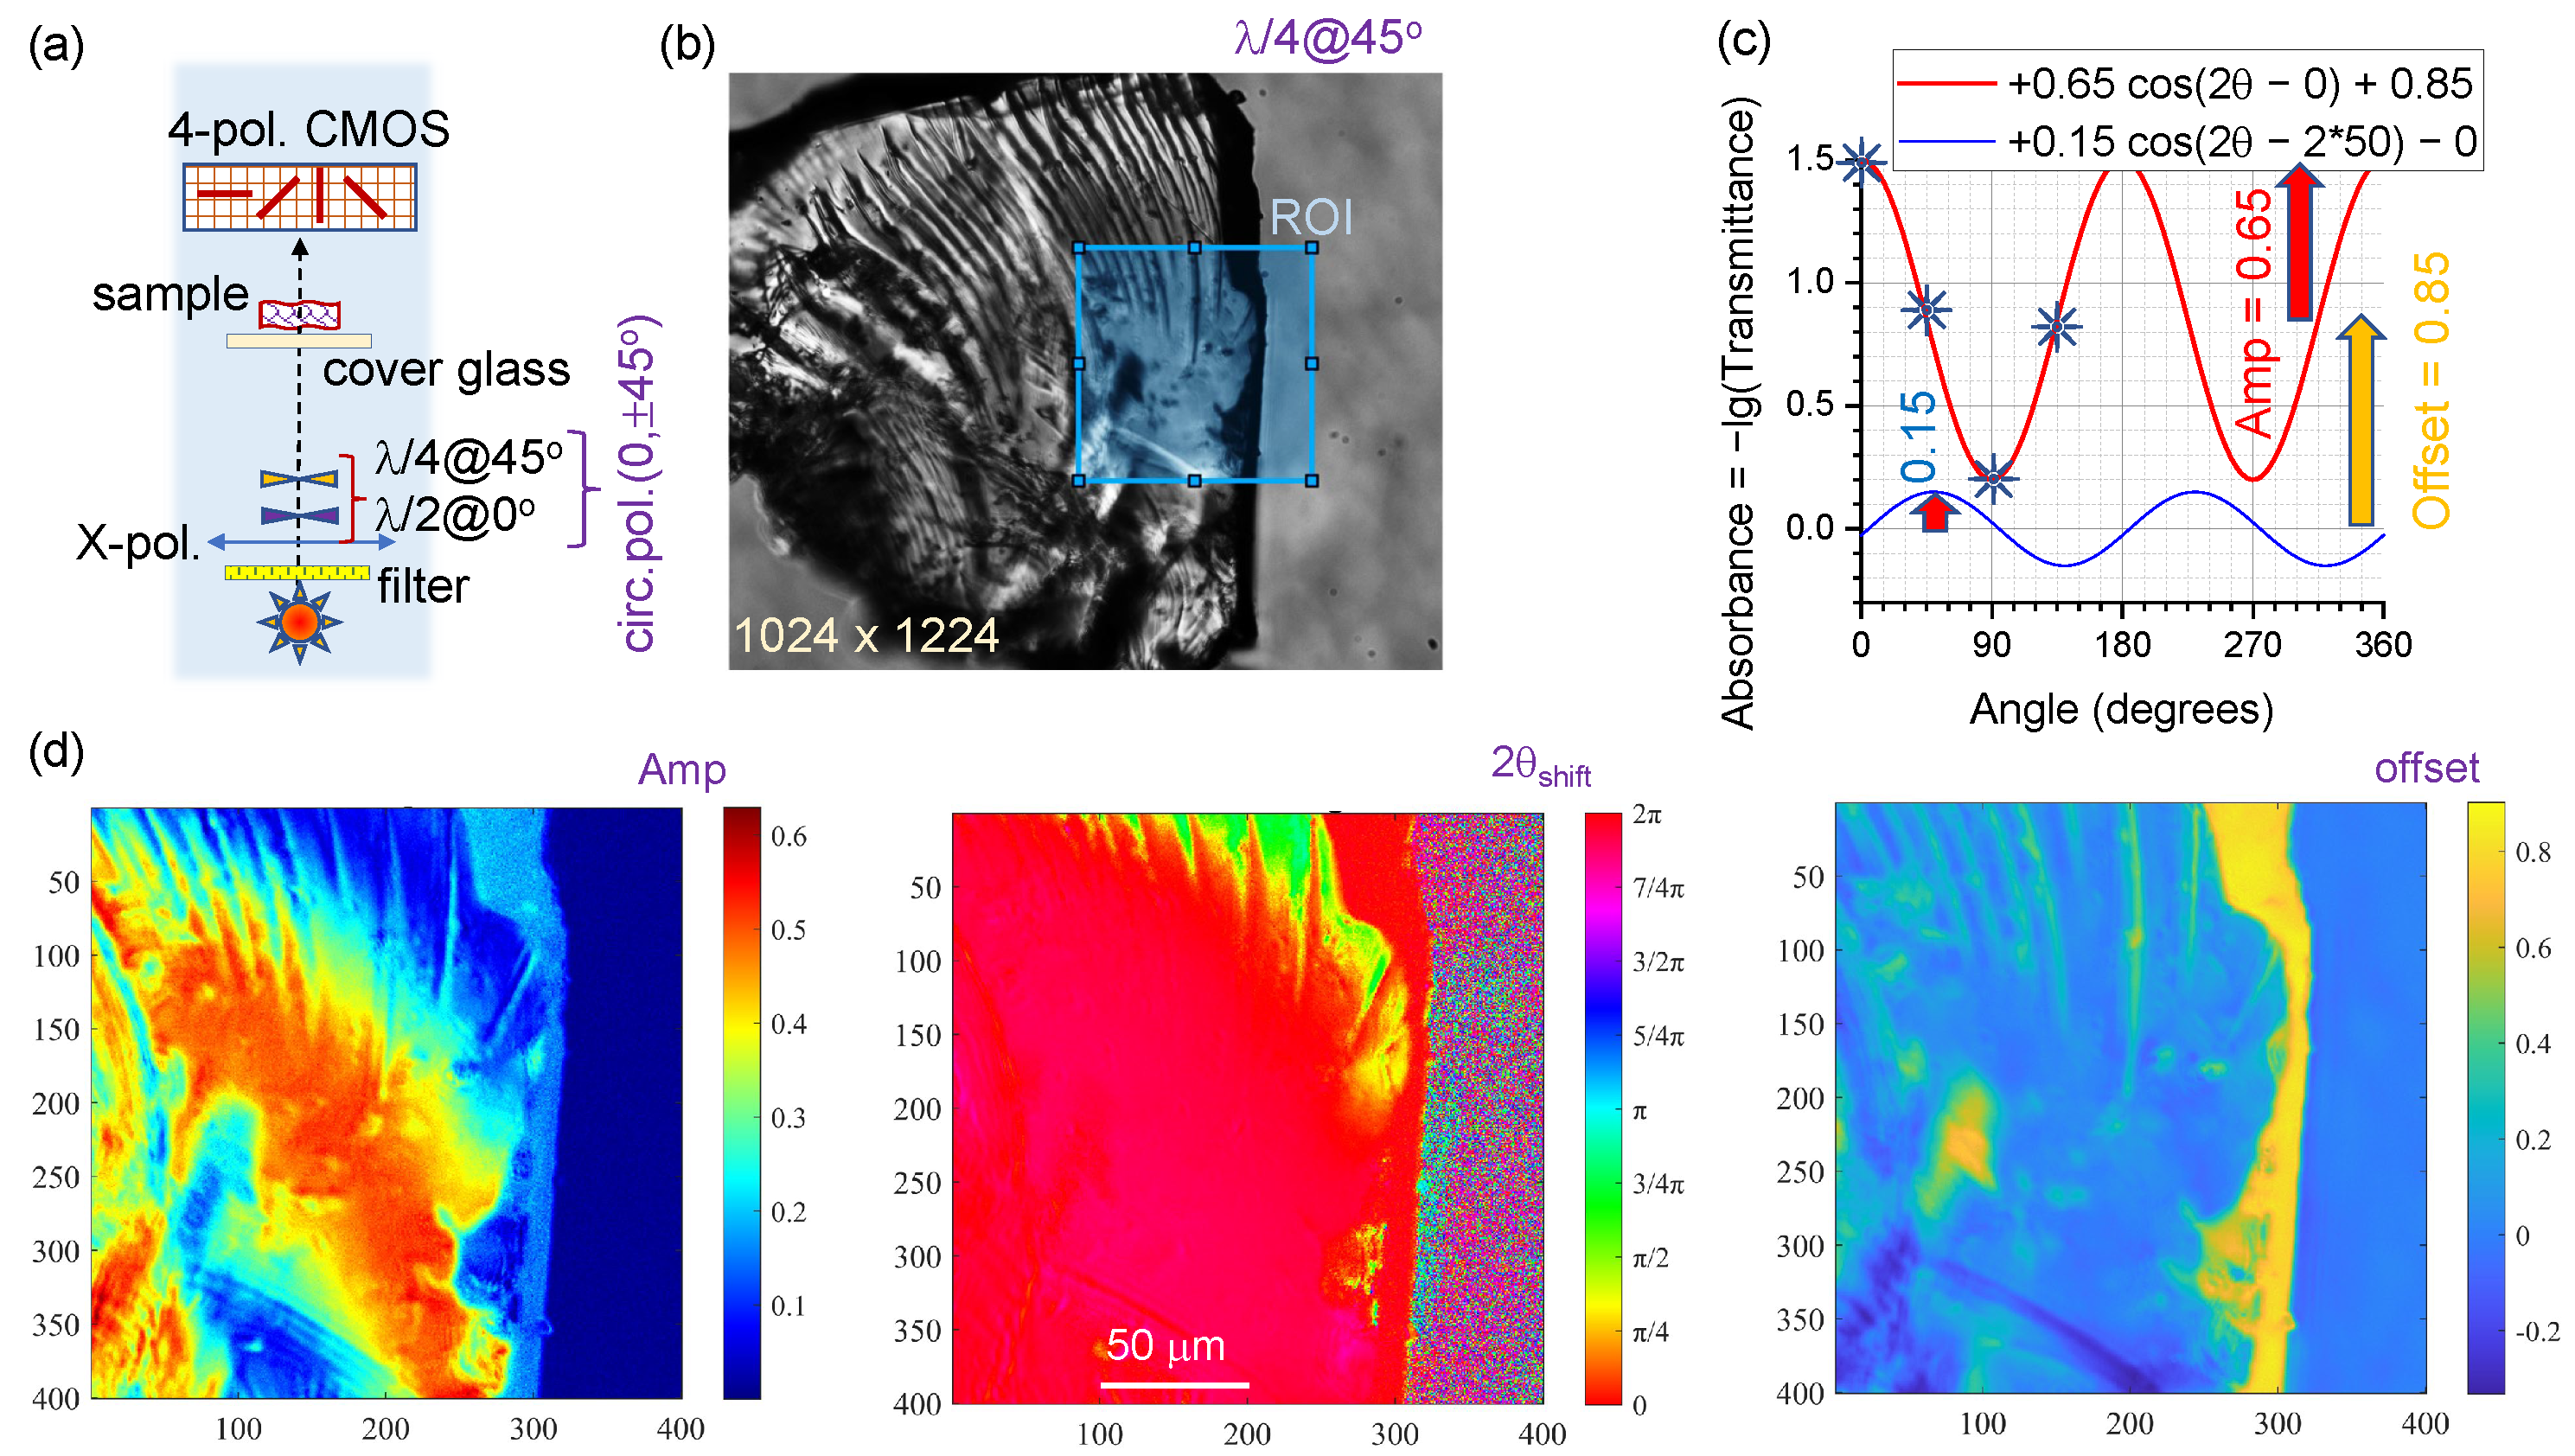
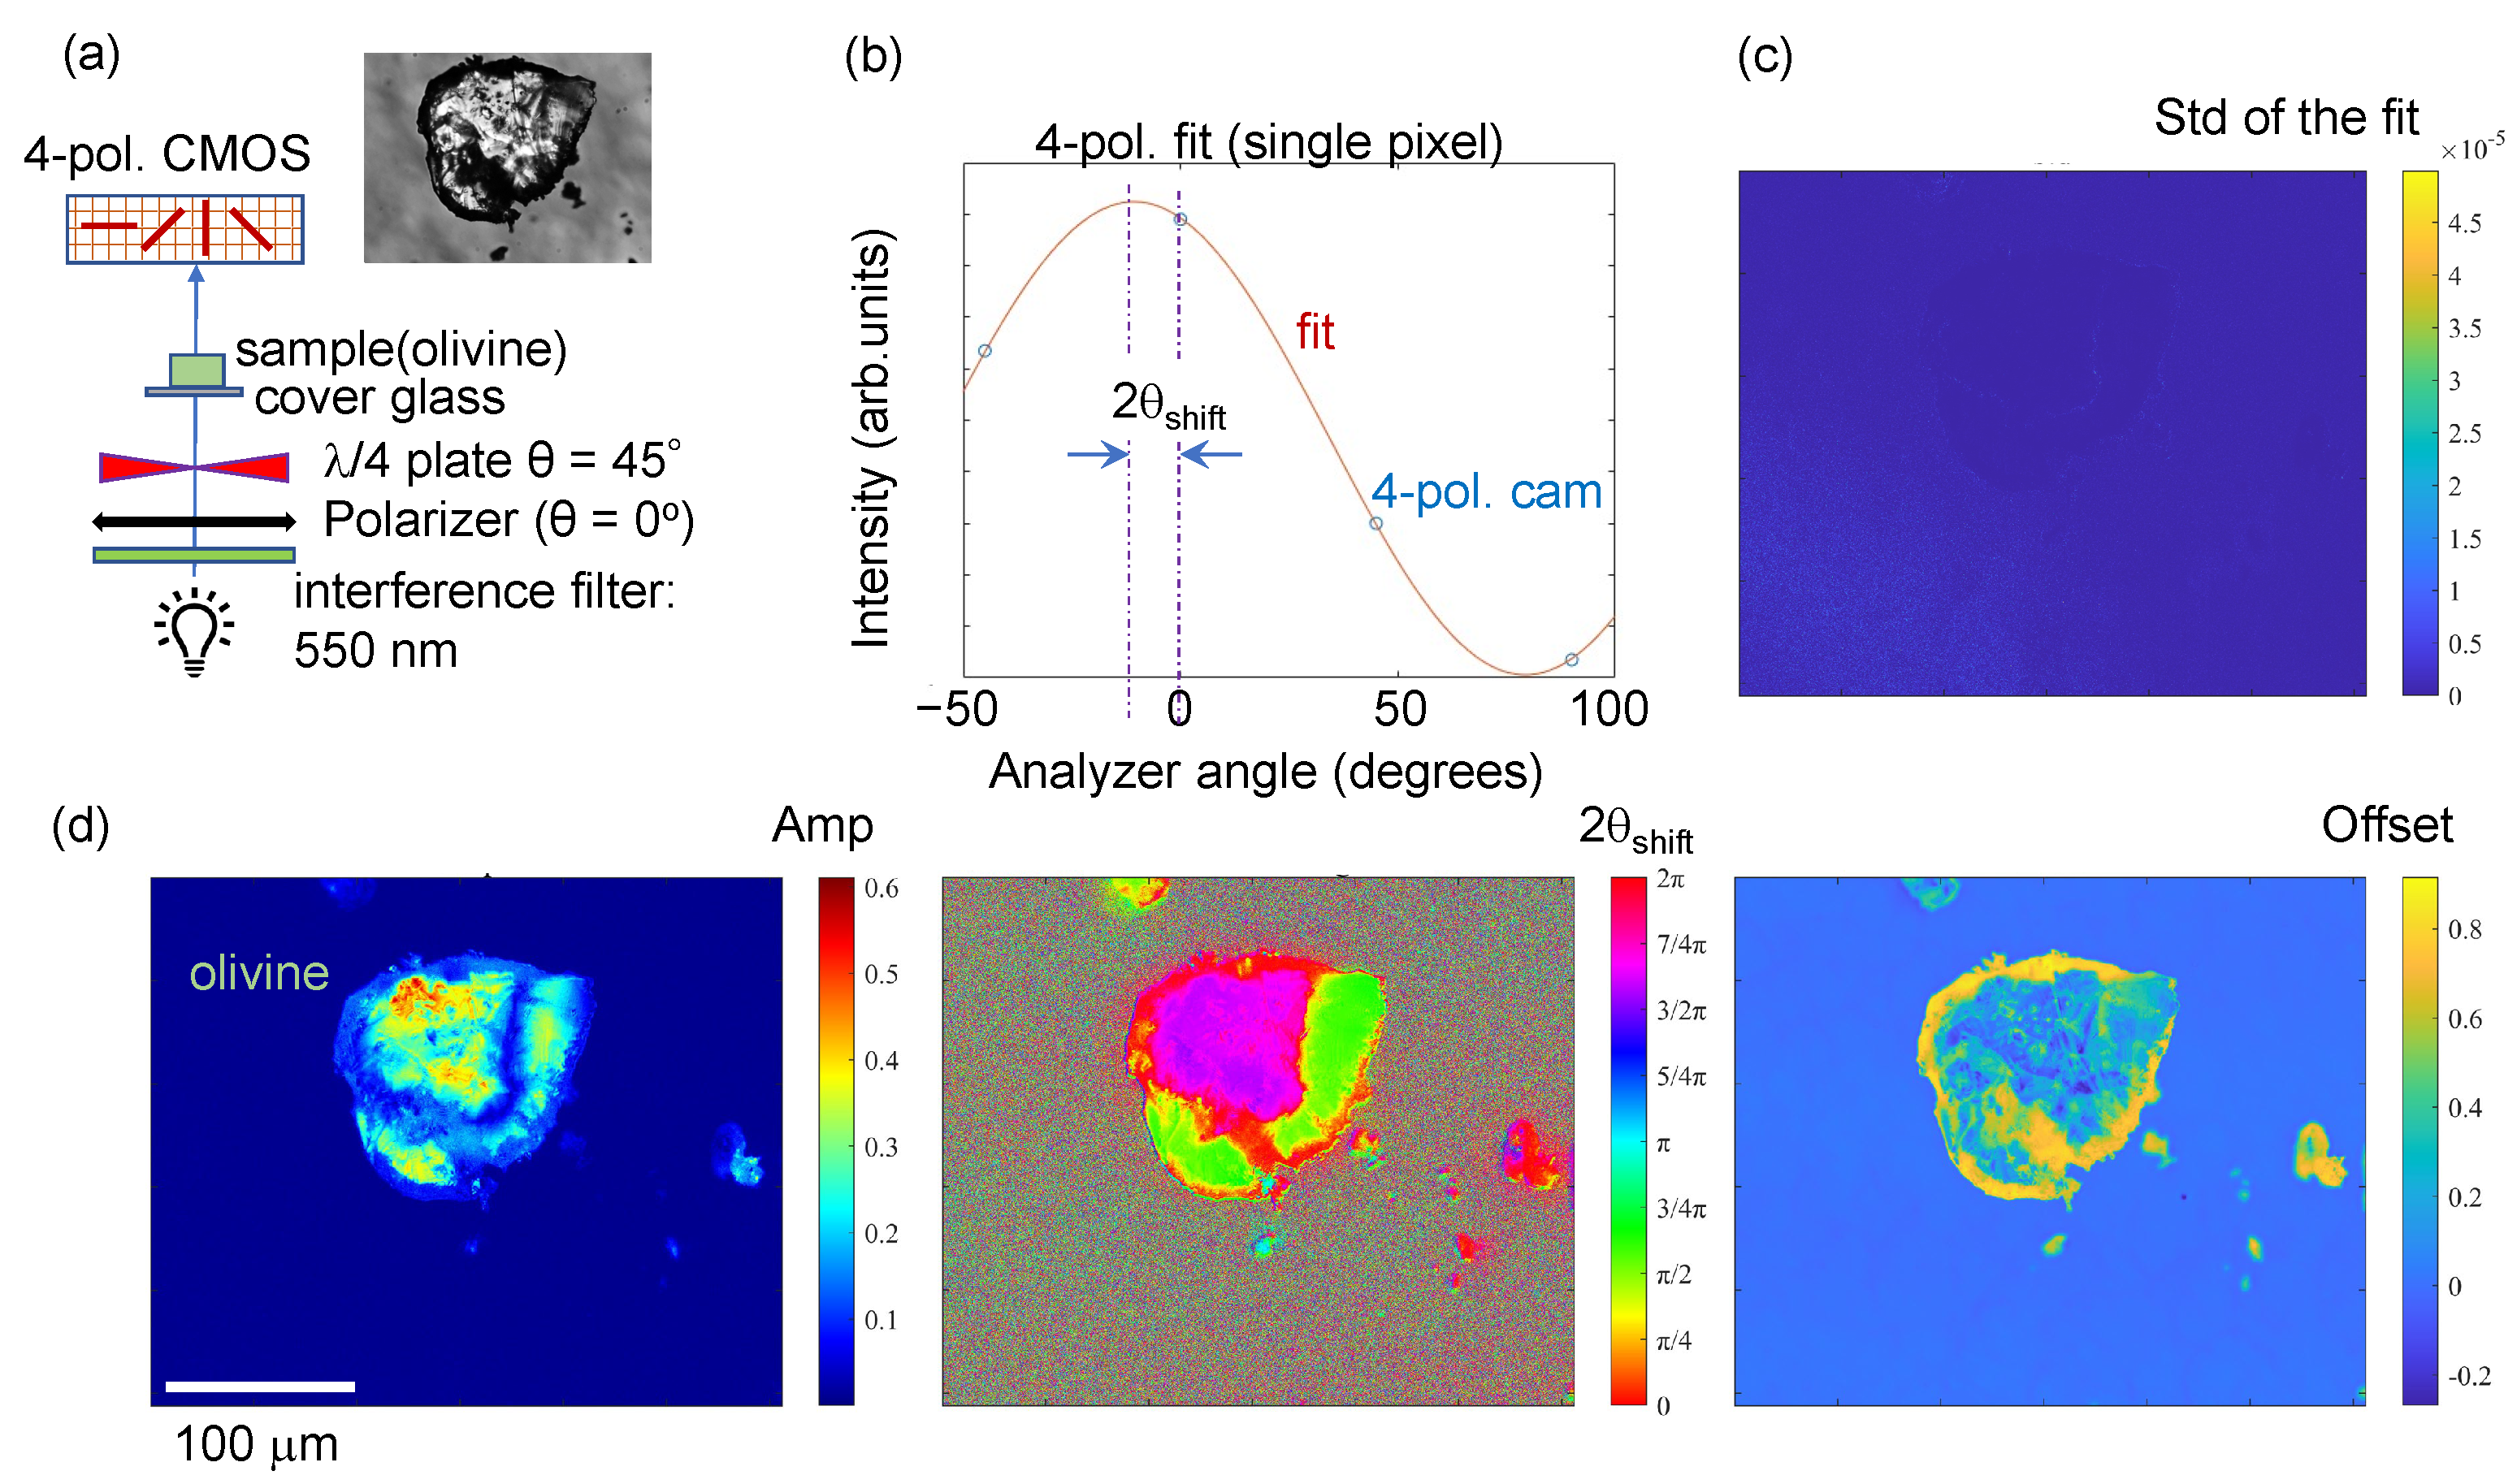
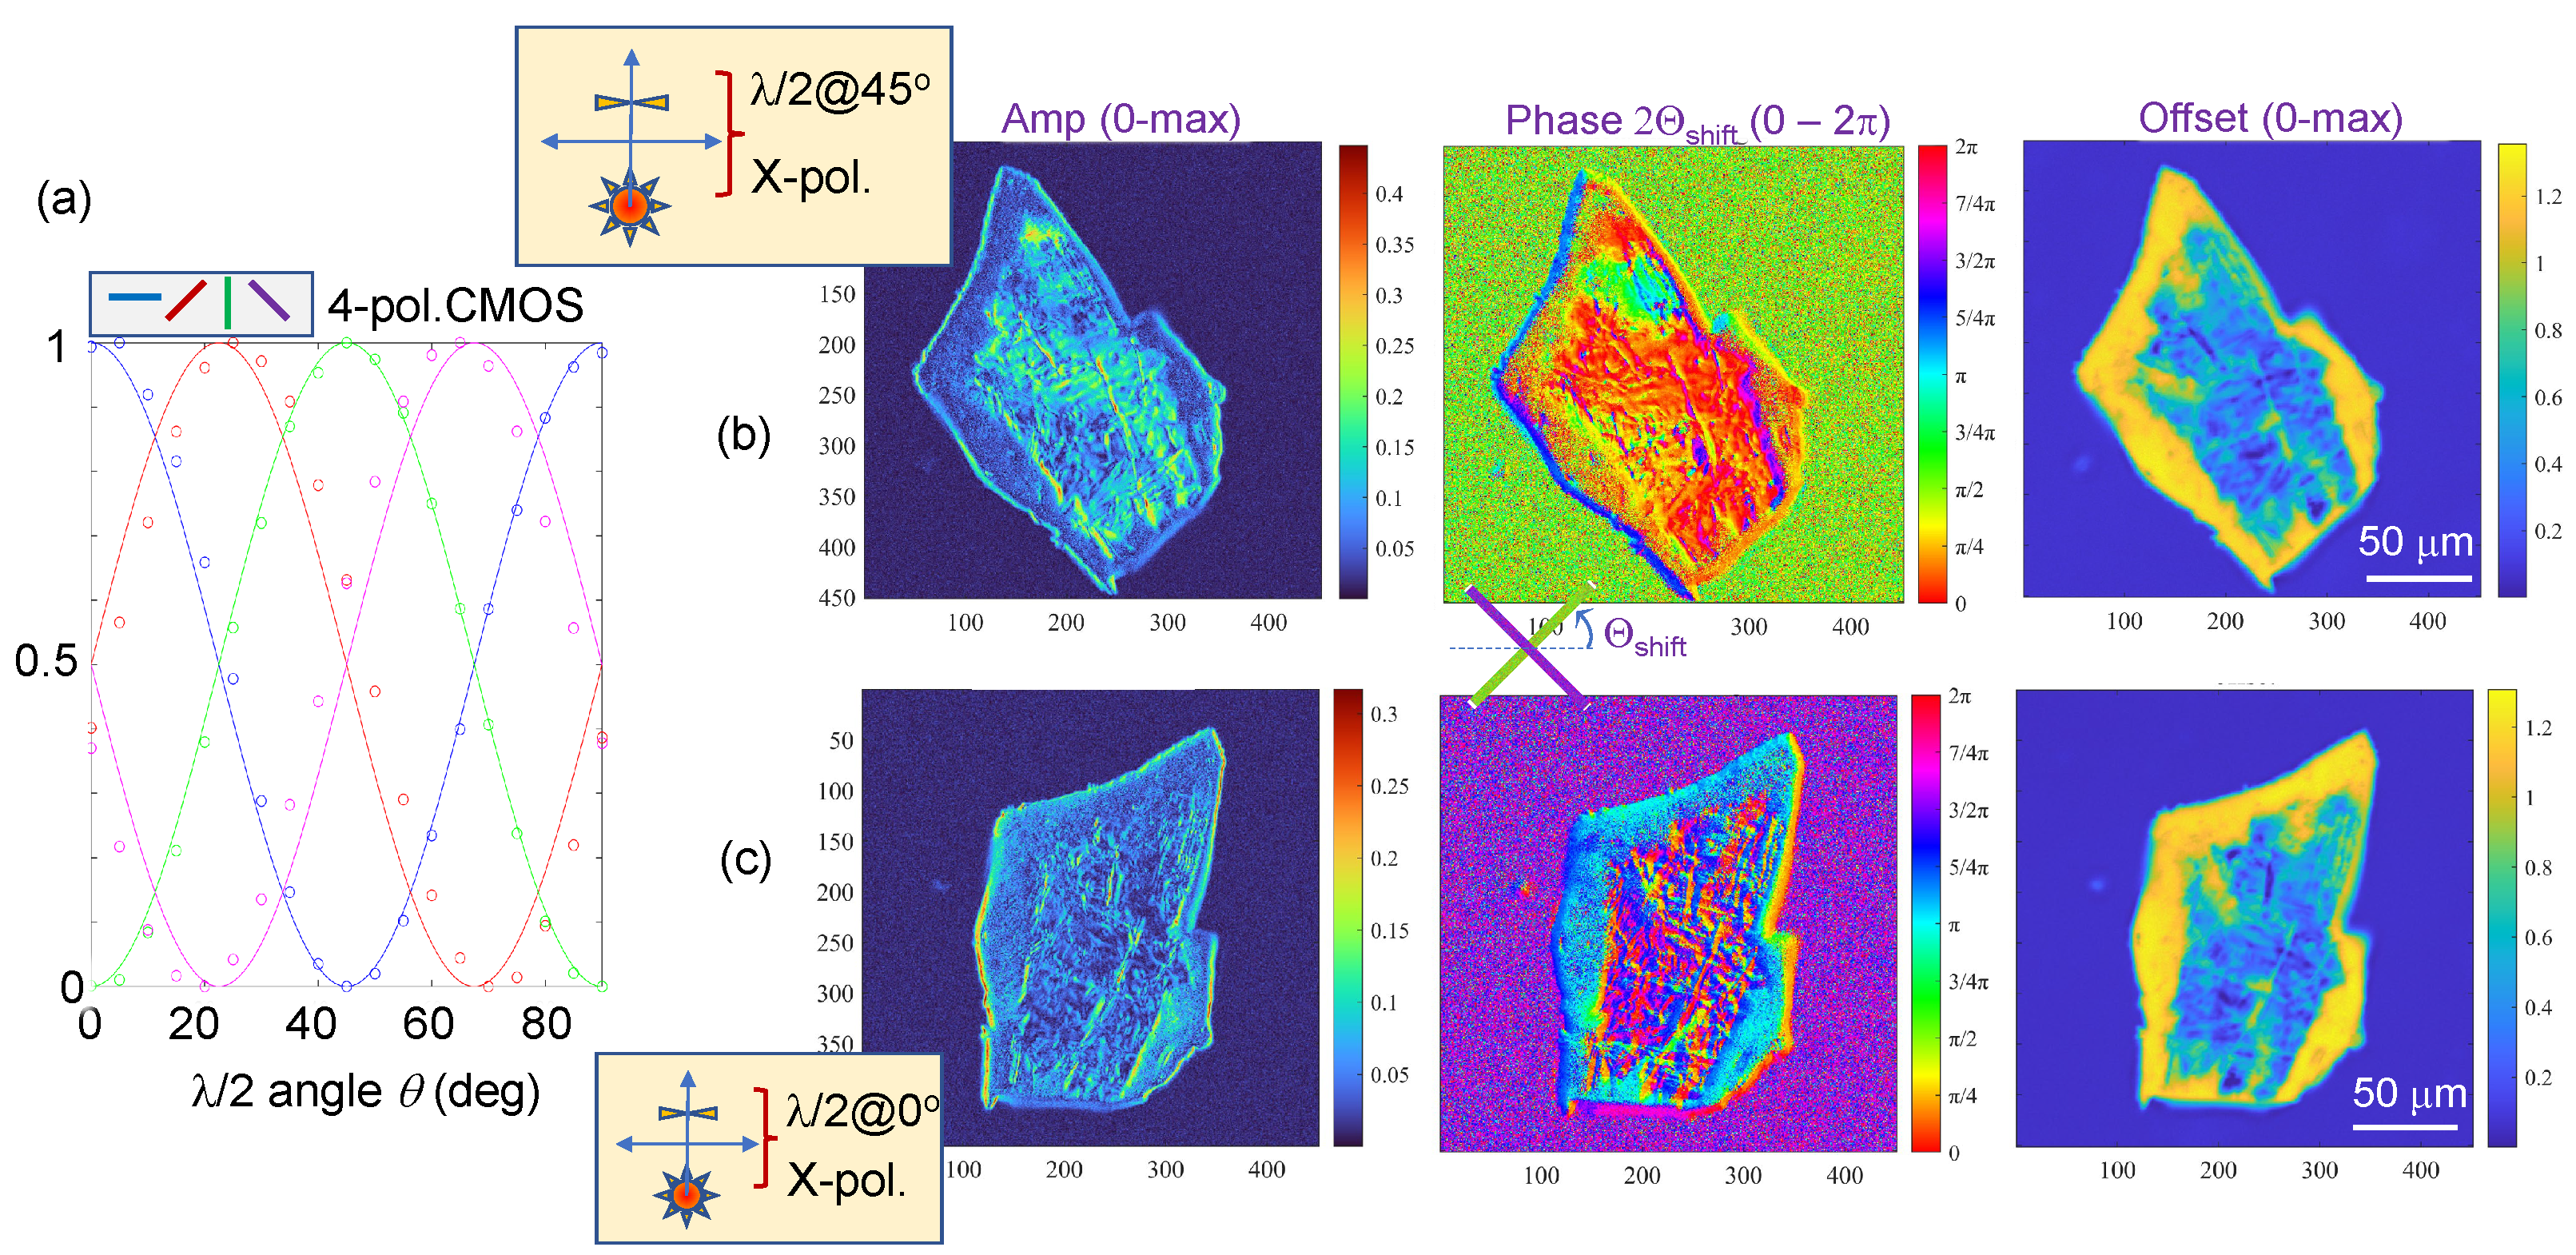
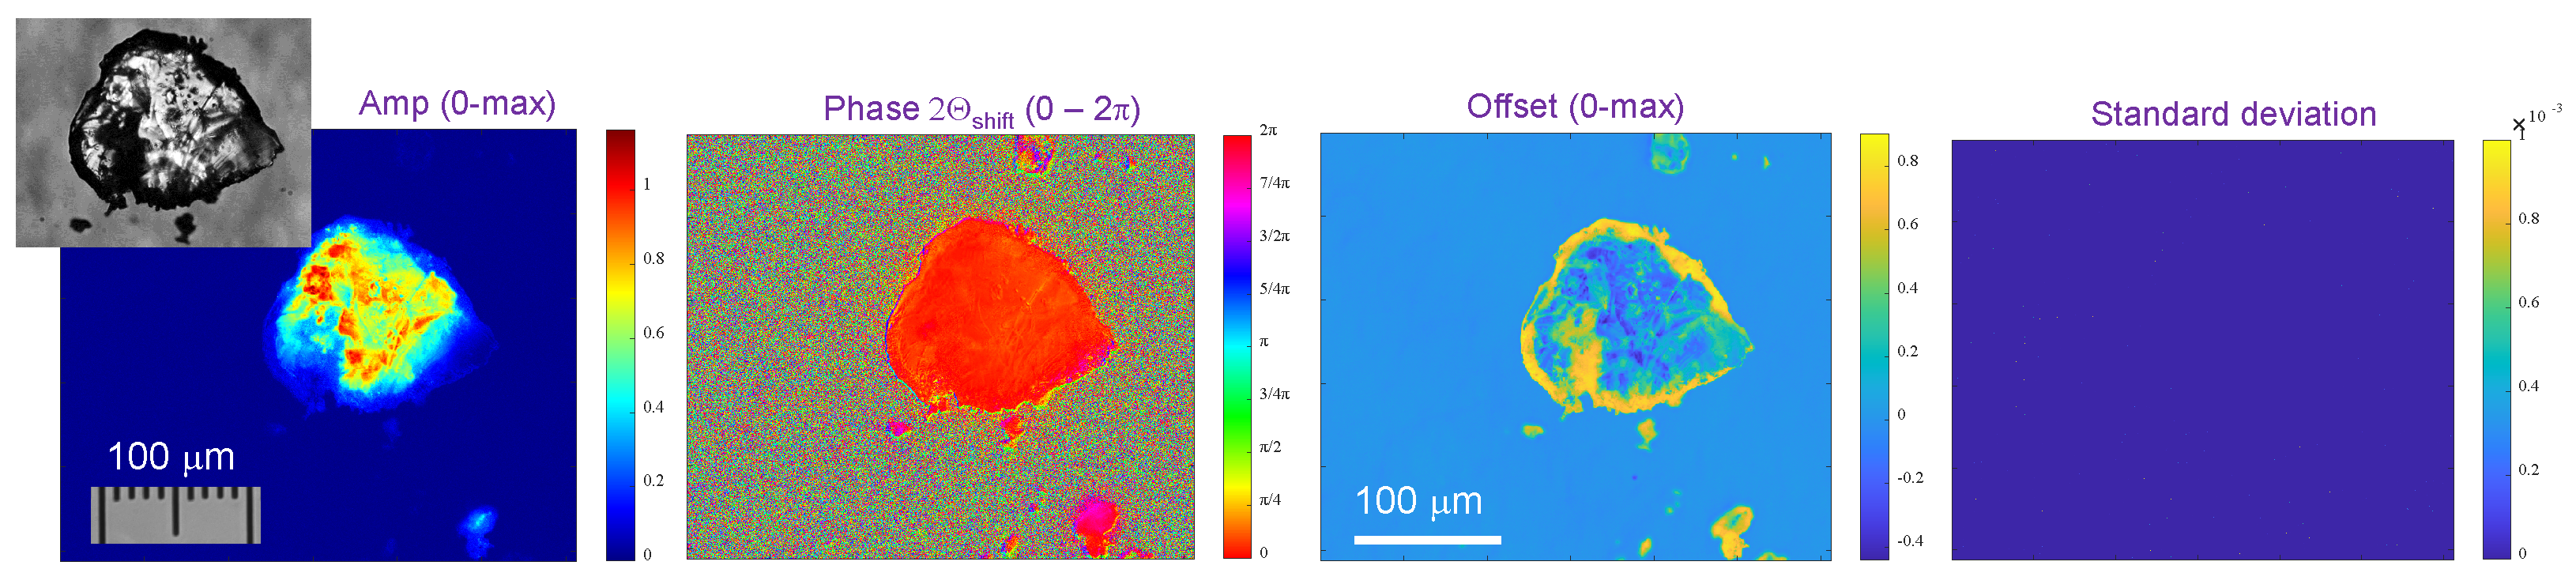
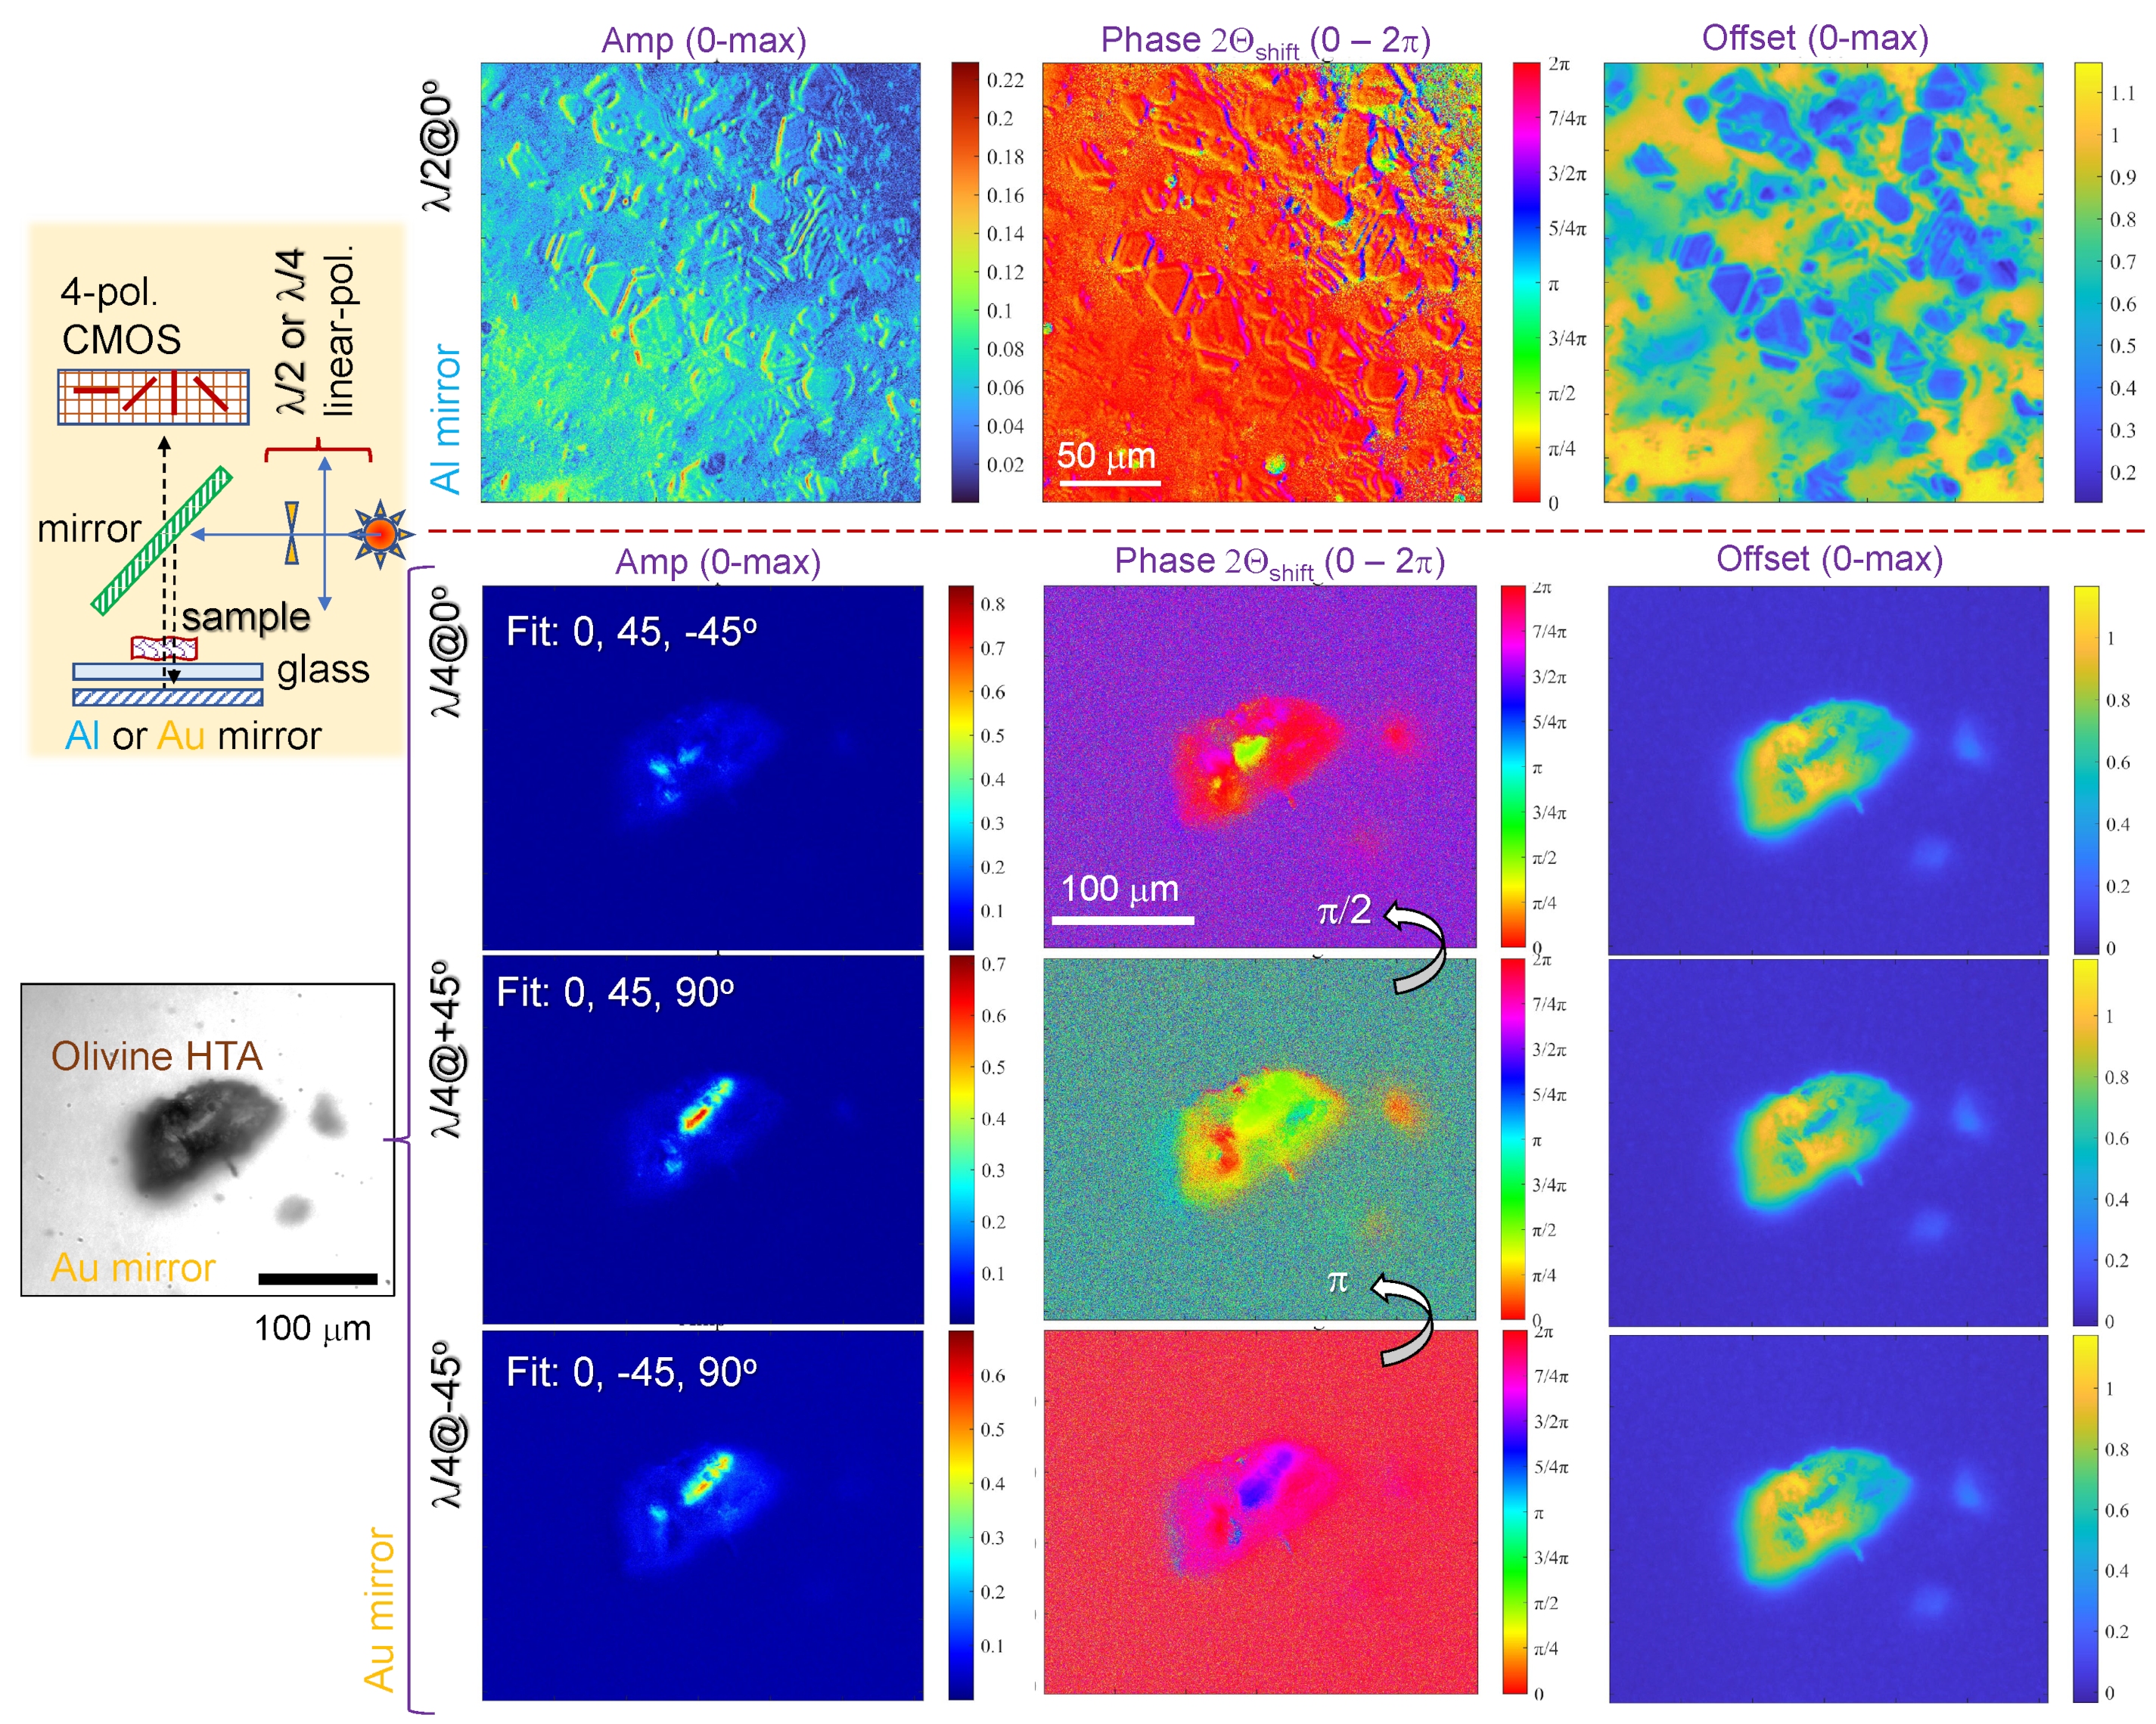
3.1. Four-Polarisation Detection of Transmitted Intensity
3.2. Three-Point Fit of Four-Polarisation Camera Images
3.3. Annealed Olivine under Reflection (Three-Point) Polariscopy
4. Conclusions and Outlook
Author Contributions
Funding
Data Availability Statement
Acknowledgments
Conflicts of Interest
References
- Schrettle, F.; Kant, C.; Lunkenheimer, P.; Mayr, F.; Deisenhofer, J.; Loidl, A. Wüstite: Electric, thermodynamic and optical properties of FeO. Eur. Phys. J. B 2012, 85, 164. [Google Scholar] [CrossRef]
- Koike, C.; Matsuno, J.; Chihara, H. Variations in the Infrared Spectra of Wüstite with Defects and Disorder. Astrophys. J. 2017, 845, 115. [Google Scholar] [CrossRef]
- Scarcelli, G.; Yun, S.H. Confocal Brillouin microscopy for three-dimensional mechanical imaging. Nat. Photonics 2008, 2, 39. [Google Scholar] [CrossRef]
- Traverso, A.J.; Thompson, J.V.; Steelman, Z.A.; Meng, Z.; Scully, M.O.; Yakovlev, V.V. Dual Raman-Brillouin Microscope for Chemical and Mechanical Characterization and Imaging. Anal. Chem. 2015, 87, 7519–7523. [Google Scholar] [CrossRef]
- Honda, R.; Ryu, M.; Moritake, M.; Balcytis, A.; Mizeikis, V.; Vongsvivut, J.; Tobin, M.J.; Appadoo, D.; Li, J.L.; Ng, S.H.; et al. Infrared Polariscopy Imaging of Linear Polymeric Patterns with a Focal Plane Array. Nanomaterials 2019, 9, 732. [Google Scholar] [CrossRef]
- Ryu, M.; Nishijima, Y.; To, S.M.N.; Hashizume, T.; Matsubara, R.; Kubono, A.; Hu, J.; Ng, S.; Juodkazis, S.; Morikawa, J. Hyperspectral Molecular Orientation Mapping in Metamaterials. Appl. Sci. 2021, 11, 1544. [Google Scholar] [CrossRef]
- Kadziolka-Gawel, M.; Adamczyk, Z.; Kalinowski, L. Mössbauer study of changes in Olivine after heating in air. Can. Mineral. 2019, 57, 105–115. [Google Scholar] [CrossRef]
- Ricca, R.; Bellouard, Y. Single-Layer Subwavelength Femtosecond-Laser-Induced Confined Nanocrystallization in Multistack Dielectrics. Phys. Rev. Appl. 2023, 19, 044035. [Google Scholar] [CrossRef]
- Schuiling, R.D. Olivine against Climate Change and Ocean Acidification. 2011. Available online: http://www.innovationconcepts.eu/res/literatuurSchuiling/olivineagainstclimatechange23.pdf (accessed on 10 September 2023).
- van Dongen, T. One Tonne of Olivine Sand Can Take in up to One Tonne of CO2. 2021. Available online: https://www.dezeen.com/2021/06/15/carbon-capture-material-library-aireal-olivine-teresa-van-dongen/ (accessed on 10 September 2023).
- Kuebler, K.; Wang, A.; Haskin, L.; Jolliff, B. A Study of Olivine Alteration to Iddingsite Using Raman Spectroscopy. Astrophys. J. 2006, 34, 1953. [Google Scholar]
- Swindle, T.; Treiman, A.; Lindstrom, D.; Burkland, M.; Cohen, B.; Grier, J.; Li, B.; Olson, E. Noble gases in iddingsite from the Lafayette meteorite: Evidence for liquid water on Mars in the last few hundred million years. Meteorit. Planet. Sci. 2000, 35, 107–115. [Google Scholar] [CrossRef]
- Vernazza, P.; Ferrais, M.; Jorda, L.; Hanus, J.; Carry, B.; Marsset, M.; Broz, M.; Fetick, R.; Viikinkoski, M.; Marchis, F.; et al. VLT/SPHERE imaging survey of the largest main-belt asteroids: Final results and synthesis. Astron. Astrophys. 2021, 654, A56. [Google Scholar] [CrossRef]
- Gassner, C.; Vongsvivut, J.; Ng, S.; Ryu, M.; Tobin, M.; Juodkazis, S.; Morikawa, J.; Wood, B. Linearly Polarized Infrared Spectroscopy for the Analysis of Biological Materials. Appl. Spectrosc. 2023, in press. [Google Scholar] [CrossRef]
- He, C.; He, H.; Chang, J.; Chen, B.; Ma, H.; Booth, M. Polarisation optics for biomedical and clinical applications: A review. Light. Sci. Appl. 2021, 10, 194. [Google Scholar] [CrossRef]
- Roth, J.; Kozak, J.; Yazdanfar, S.; Rollins, A.; Izatt, J. Simplified method for polarization-sensitive optical coherence tomography. Opt. Lett. 2001, 26, 1069–1071. [Google Scholar] [CrossRef]
- de Boer, J.; Hitzenberger, C.; Yasuno, Y. Polarization sensitive optical coherence tomography—A review. Biomed. Opt. Express 2017, 8, 1838–1873. [Google Scholar] [CrossRef]
- Linklater, D.; Vailionis, A.; Ryu, M.; Kamegaki, S.; Morikawa, J.; Mu, H.; Smith, D.; Maasoumi, P.; Ford, R.; Katkus, T.; et al. Structure and Optical Anisotropy of Spider Scales and Silk: The Use of Chromaticity and Azimuth Colors to Optically Characterize Complex Biological Structures. Nanomaterials 2023, 13, 1894. [Google Scholar] [CrossRef]
- Onuma, T.; Otani, Y. A development of two-dimensional birefringence distribution measurement system with a sampling rate of 1.3 MHz. Opt. Commun. 2014, 315, 69–73. [Google Scholar] [CrossRef]
- Hikima, Y.; Morikawa, J.; Hashimoto, T. FT-IR Image Processing Algorithms for In-Plane Orientation Function and Azimuth Angle of Uniaxially Drawn Polyethylene Composite Film. Macromolecules 2011, 44, 3950–3957. [Google Scholar] [CrossRef]
- Honda, R.; Ryu, M.; Moritake, M.; Balcytis, A.; Mizeikis, V.; Vongsvivut, J.; Tobin, M.J.; Appadoo, D.; Li, J.L.; Ng, S.H.; et al. Hyperspectral mapping of anisotropy. Nanoscale Horiz. 2019, 4, 1443–1449. [Google Scholar]
- Collett, E. Polarization, 3rd ed.; Field Guides; SPIE Press: Bellingham, DC, USA, 2005. [Google Scholar]
- Roberts, A.; Zhao, X.; Hu, P.; Abrajevitch, A.; Chen, Y.H.; Harrison, R.; Heslop, D.; Jiang, Z.; Li, J.; Liu, Q.; et al. Magnetic Domain State and Anisotropy in Hematite (α-Fe2O3) From First-Order Reversal Curve Diagrams. J. Geophys. Res. Solid Earth 2021, 126, e2021JB023027. [Google Scholar] [CrossRef]
- Ng, S.; Allan, B.; Ierodiaconou, D.; Anand, V.; Babanin, A.; Juodkazis, S. Drone Polariscopy—Towards Remote Sensing Applications. Eng. Proc. 2021, 11, 46. [Google Scholar]
- Chen, H.; Wolff, L. Polarization Phase-Based Method For Material Classification In Computer Vision. Int. J. Comput. Vis. 1998, 28, 73–83. [Google Scholar] [CrossRef]
- Fritzsche, S.; Pauw, B.; Weimann, C.; Sturm, H. First of its kind: A test artifact for direct laser writing. Meas. Sci. Technol. 2023, 34, 075004. [Google Scholar] [CrossRef]
- Semaltianos, N.; Karczewski, G. Laser Synthesis of Magnetic Nanoparticles in Liquids and Application in the Fabrication of Polymer–Nanoparticle Composites. ACS Appl. Nano Mater. 2021, 4, 6407–6440. [Google Scholar] [CrossRef]
- Jakobi, J.; Petersen, S.; Menéndez-Manjón, A.; Wagener, P.; Barcikowski, S. Magnetic Alloy Nanoparticles from Laser Ablation in Cyclopentanone and Their Embedding into a Photoresist. Langmuir 2010, 26, 6892–6897. [Google Scholar] [CrossRef]


Disclaimer/Publisher’s Note: The statements, opinions and data contained in all publications are solely those of the individual author(s) and contributor(s) and not of MDPI and/or the editor(s). MDPI and/or the editor(s) disclaim responsibility for any injury to people or property resulting from any ideas, methods, instructions or products referred to in the content. |
© 2023 by the authors. Licensee MDPI, Basel, Switzerland. This article is an open access article distributed under the terms and conditions of the Creative Commons Attribution (CC BY) license (https://creativecommons.org/licenses/by/4.0/).
Share and Cite
Kamegaki, S.; Smith, D.; Ryu, M.; Ng, S.H.; Huang, H.-H.; Maasoumi, P.; Vongsvivut, J.; Moraru, D.; Katkus, T.; Juodkazis, S.; et al. Four-Polarisation Camera for Anisotropy Mapping at Three Orientations: Micro-Grain of Olivine. Coatings 2023, 13, 1640. https://doi.org/10.3390/coatings13091640
Kamegaki S, Smith D, Ryu M, Ng SH, Huang H-H, Maasoumi P, Vongsvivut J, Moraru D, Katkus T, Juodkazis S, et al. Four-Polarisation Camera for Anisotropy Mapping at Three Orientations: Micro-Grain of Olivine. Coatings. 2023; 13(9):1640. https://doi.org/10.3390/coatings13091640
Chicago/Turabian StyleKamegaki, Shuji, Daniel Smith, Meguya Ryu, Soon Hock Ng, Hsin-Hui Huang, Pegah Maasoumi, Jitraporn Vongsvivut, Daniel Moraru, Tomas Katkus, Saulius Juodkazis, and et al. 2023. "Four-Polarisation Camera for Anisotropy Mapping at Three Orientations: Micro-Grain of Olivine" Coatings 13, no. 9: 1640. https://doi.org/10.3390/coatings13091640