Article

Effect of Cu Addition on Properties of an Al-La Alloy

School of Materials Engineering, Xi’an Aeronautical University, Xi’an 710077, China
*
Author to whom correspondence should be addressed.
Coatings 2023, 13(9), 1505; https://doi.org/10.3390/coatings13091505
Submission received: 28 July 2023 / Revised: 19 August 2023 / Accepted: 23 August 2023 / Published: 25 August 2023
(This article belongs to the Special Issue Tribological Properties and Wear Protection of Coatings and Alloys)

Abstract

:
The effect of copper content on the microstructure and properties of an aluminum copper alloy containing lanthanum was studied by adding 0.5 wt% lanthanum and different contents of copper to the 2A12 alloy. We used a universal testing machine, Brinell hardness tester, and friction and wear testing machine to test the mechanical properties of the alloy. The microstructure and phase composition of the alloy were analyzed using scanning electron microscopy, energy dispersive spectroscopy, and X-ray diffraction. The results show that, after adding La and Cu, the alloy grain is refined, and the fracture mode changes from dissociation fracture to quasi dissociation fracture. A new phase containing La accumulates at the grain boundary. If the amount of Cu added is too large, the tendency for hot cracking increases, which can easily lead to the formation of voids or even cracks. The tensile strength and hardness of the cast alloy significantly increase with the increase in Cu addition. In the range of adding 2 wt% to 5 wt% Cu, the tensile strength and hardness of the cast alloy increases by approximately 12% and 17.84%, respectively, compared with the original alloy. With the increase in Cu addition, the elongation of the alloy first increases and then decreases, reaching its maximum value when Cu addition is 3 wt%. Adding Cu is beneficial for improving the wear resistance of the alloy. When the addition of Cu is 3 wt%, the alloy has the best wear resistance and minimum wear amount. This is due to the enrichment of La and Cu at the grain boundaries, forming new La phases or other phases with higher hardness, which changes the properties of the alloy. It shows that the content of Cu in the 2A12 alloy can be increased to 7-8% with the increasing of additional rare-earth elements, and a new Al-Cu (7 wt% to 8 wt%)-Mg (1.2 wt% to 1.8 wt%)-Mn (0.3 wt% to 0.9 wt%)-La (0.5 wt%) alloy, in which tensile strength, hardness, and elongation of the alloy are increased by 8.1%, 16%, and 79.1%, respectively, can be formed. In addition, the wear resistance of Al-La alloys also improves significantly with the addition of copper content. The coefficient of friction is reduced by 68% compared with no copper addition.

1. Introduction

High strength and light weight are the basic requirements for aeronautical structural materials, and good toughness, reliability, and stress corrosion resistance are also of concern [1]. The 2Al2 alloy is a high-strength duralumin that can be strengthened by heat treatment; the 2A12 Al alloy is a widely used metal structure material. It is widely used in aerospace, electronic instruments, and ships [2]. Although the A12 aluminum alloy has high strength and good heat resistance and fatigue resistance, it has poor corrosion resistance, especially in the presence of inter-crystal corrosion. At room temperature, the 2A12 aluminum alloy is less plastic than the 2024 aluminum alloy, with yield strength less than 60% of the 7050 aluminum alloy and a tensile strength less than the 2024 and 7050 aluminum alloy. The 2A12 aluminum alloy is exposed to a tropical marine atmospheric environment, and the corrosion morphology changes from spot corrosion to severe inter-crystal corrosion as the exposure time increases [3]. Wear changes the surface roughness of the 2A12 aluminum alloy and induces partial dissolution of inter-metallic compound particles. Electrochemical non-uniformity caused by inter-metallic compound particles and roughness has a significant effect on the pitting corrosion of the 2A12 aluminum alloy [4].
2A12 is the highest strength heat-treatment-strengthened alloy in the Al-Cu-Mg system. The main alloy elements are copper and magnesium, with a mass fraction (%) of: Cu3.8% to 4.9% and Mg1.2% to 1.8%. The main strengthening phase is the S phase (Al2CuMg), followed by the θ phase (CuAl2). The higher the amount of copper precipitated without changing the Mg content θ and the more phases, the better the reinforcement. Increasing the copper content is necessary to the hardness of the aluminum silicon (Al-Si) alloy and aging treatment [5,6,7]. At present, the copper content in aluminum alloys ranges from approximately 2.5 wt% to 8 wt% [8], and the content of 4 wt% to 6.8 wt% has the best strengthening effect. With the increase in copper content in aluminum alloys, the deformation resistance of aluminum alloys increases [8,9]. By controlling the content of Cu and Mg in the Al-Cu-Mg alloy, low-melting-point (LMP) eutectics with different contents were obtained. The higher the content of the LMP eutectic, the better the hot cracking resistance of the alloy [10]; the higher the content of copper is, the greater the hot cracking tendency of the alloy is when the content of magnesium is constant. Increasing the content of copper to improve the synthesis of Al-Cu-Mg alloys is not feasible.
The strengthening effects of rare earth on aluminum alloys are mainly divided into limited-solution strengthening, fine-grained strengthening, and second-phase strengthening. E. Aguirre De la Torre investigated an automotive A356 aluminum alloy reinforced with 0.2 (wt%) Al-6Ce-3La (ACL) [11]. Ce could refine the grain size of LC4 alloy and improve its plastic properties. Ce is beneficial to improving salt-spray corrosion resistance of the LC4 alloy [12]. Wang Zhen et al. found that La/Ce mixed rare earth is useful for refining the grain of industrial pure aluminum, while the rare-earth content is beneficial for improving mechanical properties within a certain range [13]. Ce-rich mixed rare earth has refining, purifying, and modifying effects on cast aluminum alloys, and is detrimental to the high-temperature electrical conductivity of the alloys [14]. Wu Lifan et al. studied the corrosion properties of rare-earth Ce on a 2A12 alloy in an acid, harsh marine atmospheric environment and found that the addition of rare-earth Ce is beneficial to improving the corrosion resistance of the alloy [15]. The addition of a trace amount of rare-earth Ce to the Al-Mg-Zn alloy was found to significantly improve the corrosion resistance of the alloy [16]. Adding 0.1% Ce to a 6063 aluminum alloy improves overall properties [17]. Zhou Huihui analyzed the mechanism of the damping improvement from the effect of La on the morphology and distribution of Sn, and the effect of La on the wetting properties of Sn and aluminum alloy matrix [18]. Zhen et al. studied the influence of different alloying elements on the microstructure and properties of an Al alloy. It was found that La had various effects on improving Al alloy strength [19]. The addition of Al7CuLa2 compounds to the Al-Cu-Mg alloy, which formed dispersion distribution and grain boundaries with Al and Cu due to decreased dissolution, improved the comprehensive properties through pinning lease and grain refinement. Too high a La content would reduce the group concentration of the S phase (Al2CuMg); the strengthening effect would be reduced, and the optimum La content was 0.4% [20].
With the main composition of the 2A12 alloy as a reference, the content of La was fixed at 0.5%, and the strengthening effect of copper in the aluminum alloy was reasonably utilized to develop an Al-xCu-Mg-Mn-La alloy with a high content of copper. The research method was to fix the content of La at 0.5% by adding the Al-La alloy (20% La) and Al-Cu alloy (50% Cu) after the 2A12 alloy was melted, changing the amount of Cu added and studying the rule of the amount of Cu added with the alloy’s structure and energy, in order to obtain a high-performance Al-xCu-Mg-Mn-La alloy.

2. Experimental Materials and Characteristics

2.1. Materials and Preparation

Experimental materials are the 2A12 Al alloy bar (Southwest Al), Al-Cu master alloy containing 50% Cu, and Al-La intermediate alloy containing 20% La (Institute of rare-earth metals). The compositions of 2A12 Al alloy are shown in Table 1. The Cu content span in 2A12 alloy is greater than 1%, and the addition of 1% Cu has no significant effect on the composition change of the alloy. Cu addition amounts of 2%, 3%, 4%, and 5% were selected in this paper.
In the experiment process, the 2A12 Al alloy was melted in a graphite crucible. After refining and metamorphism, Al-La and Al-Cu master alloys were added at 720 °C. After the added alloy was completely melted, the temperature was raised to 720 °C, modification treatment was performed, and the slag was removed. The temperature was raised again to 720 °C, fully stirred for 5~10 min, the slag was removed, and it was smoothly cast into the sand mold cavity (in Figure 1a) at 700 °C. Then, it was cooled naturally to room temperature, and the cast bar was obtained (in Figure 1b). The cast bar was processed into a tensile specimen, as shown in Figure 1c,d.

2.2. Characteristics

The hardness was tested by Brinell’s hardness tester (HB-3000, Laizhou Huayin Testing Instrument Co., Ltd., Laizhou, China): pressure head: φ5 mm, force: 125 kN, maintained for 30 s after loading. The maximum and minimum values from the date measured at seven different positions on each sample were removed, and the average of the remaining values was calculated. The tensile fracture test was performed using an electronic universal testing machine (WDW, Shenzhen Sansi Testing Equipment Co., Ltd., Shenzhen, China) to assess the tensile strength of the cast alloy sample. The speed of tensile loading was 0.5 mm/min and the maximum loading capacity was 1 × 10⁵ N. The surface microstructure morphology and microstructure fracture of the original 2A12 Al alloy and all recast alloys were observed and analyzed by scanning electron microscopy (SEM, JSM-6510A, JEOL, Tokyo, Japan) equipped with energy disperse spectroscopy (EDS). The phases of this cast alloy were characterized by X-ray diffraction (PAN-alytical, Malvern, UK). The dry friction and wear properties of the Al-Cu alloys in air were evaluated by the friction and wear tester (UMT-2, Bruker, Mannheim, Germany). The friction pair was a Cr15 ceramic ball with a diameter of 4 mm, the applied load was 5 N, the friction radius was 2 mm, the wear time was 10 min, and the motor speed was 150 r/min. Friction and wear were reciprocating sliding, and the sliding trajectory was circular. The mass change of the coating samples was measured by analytical balance, and the mass loss before and after the wear test was obtained.

3. Results and Discussion

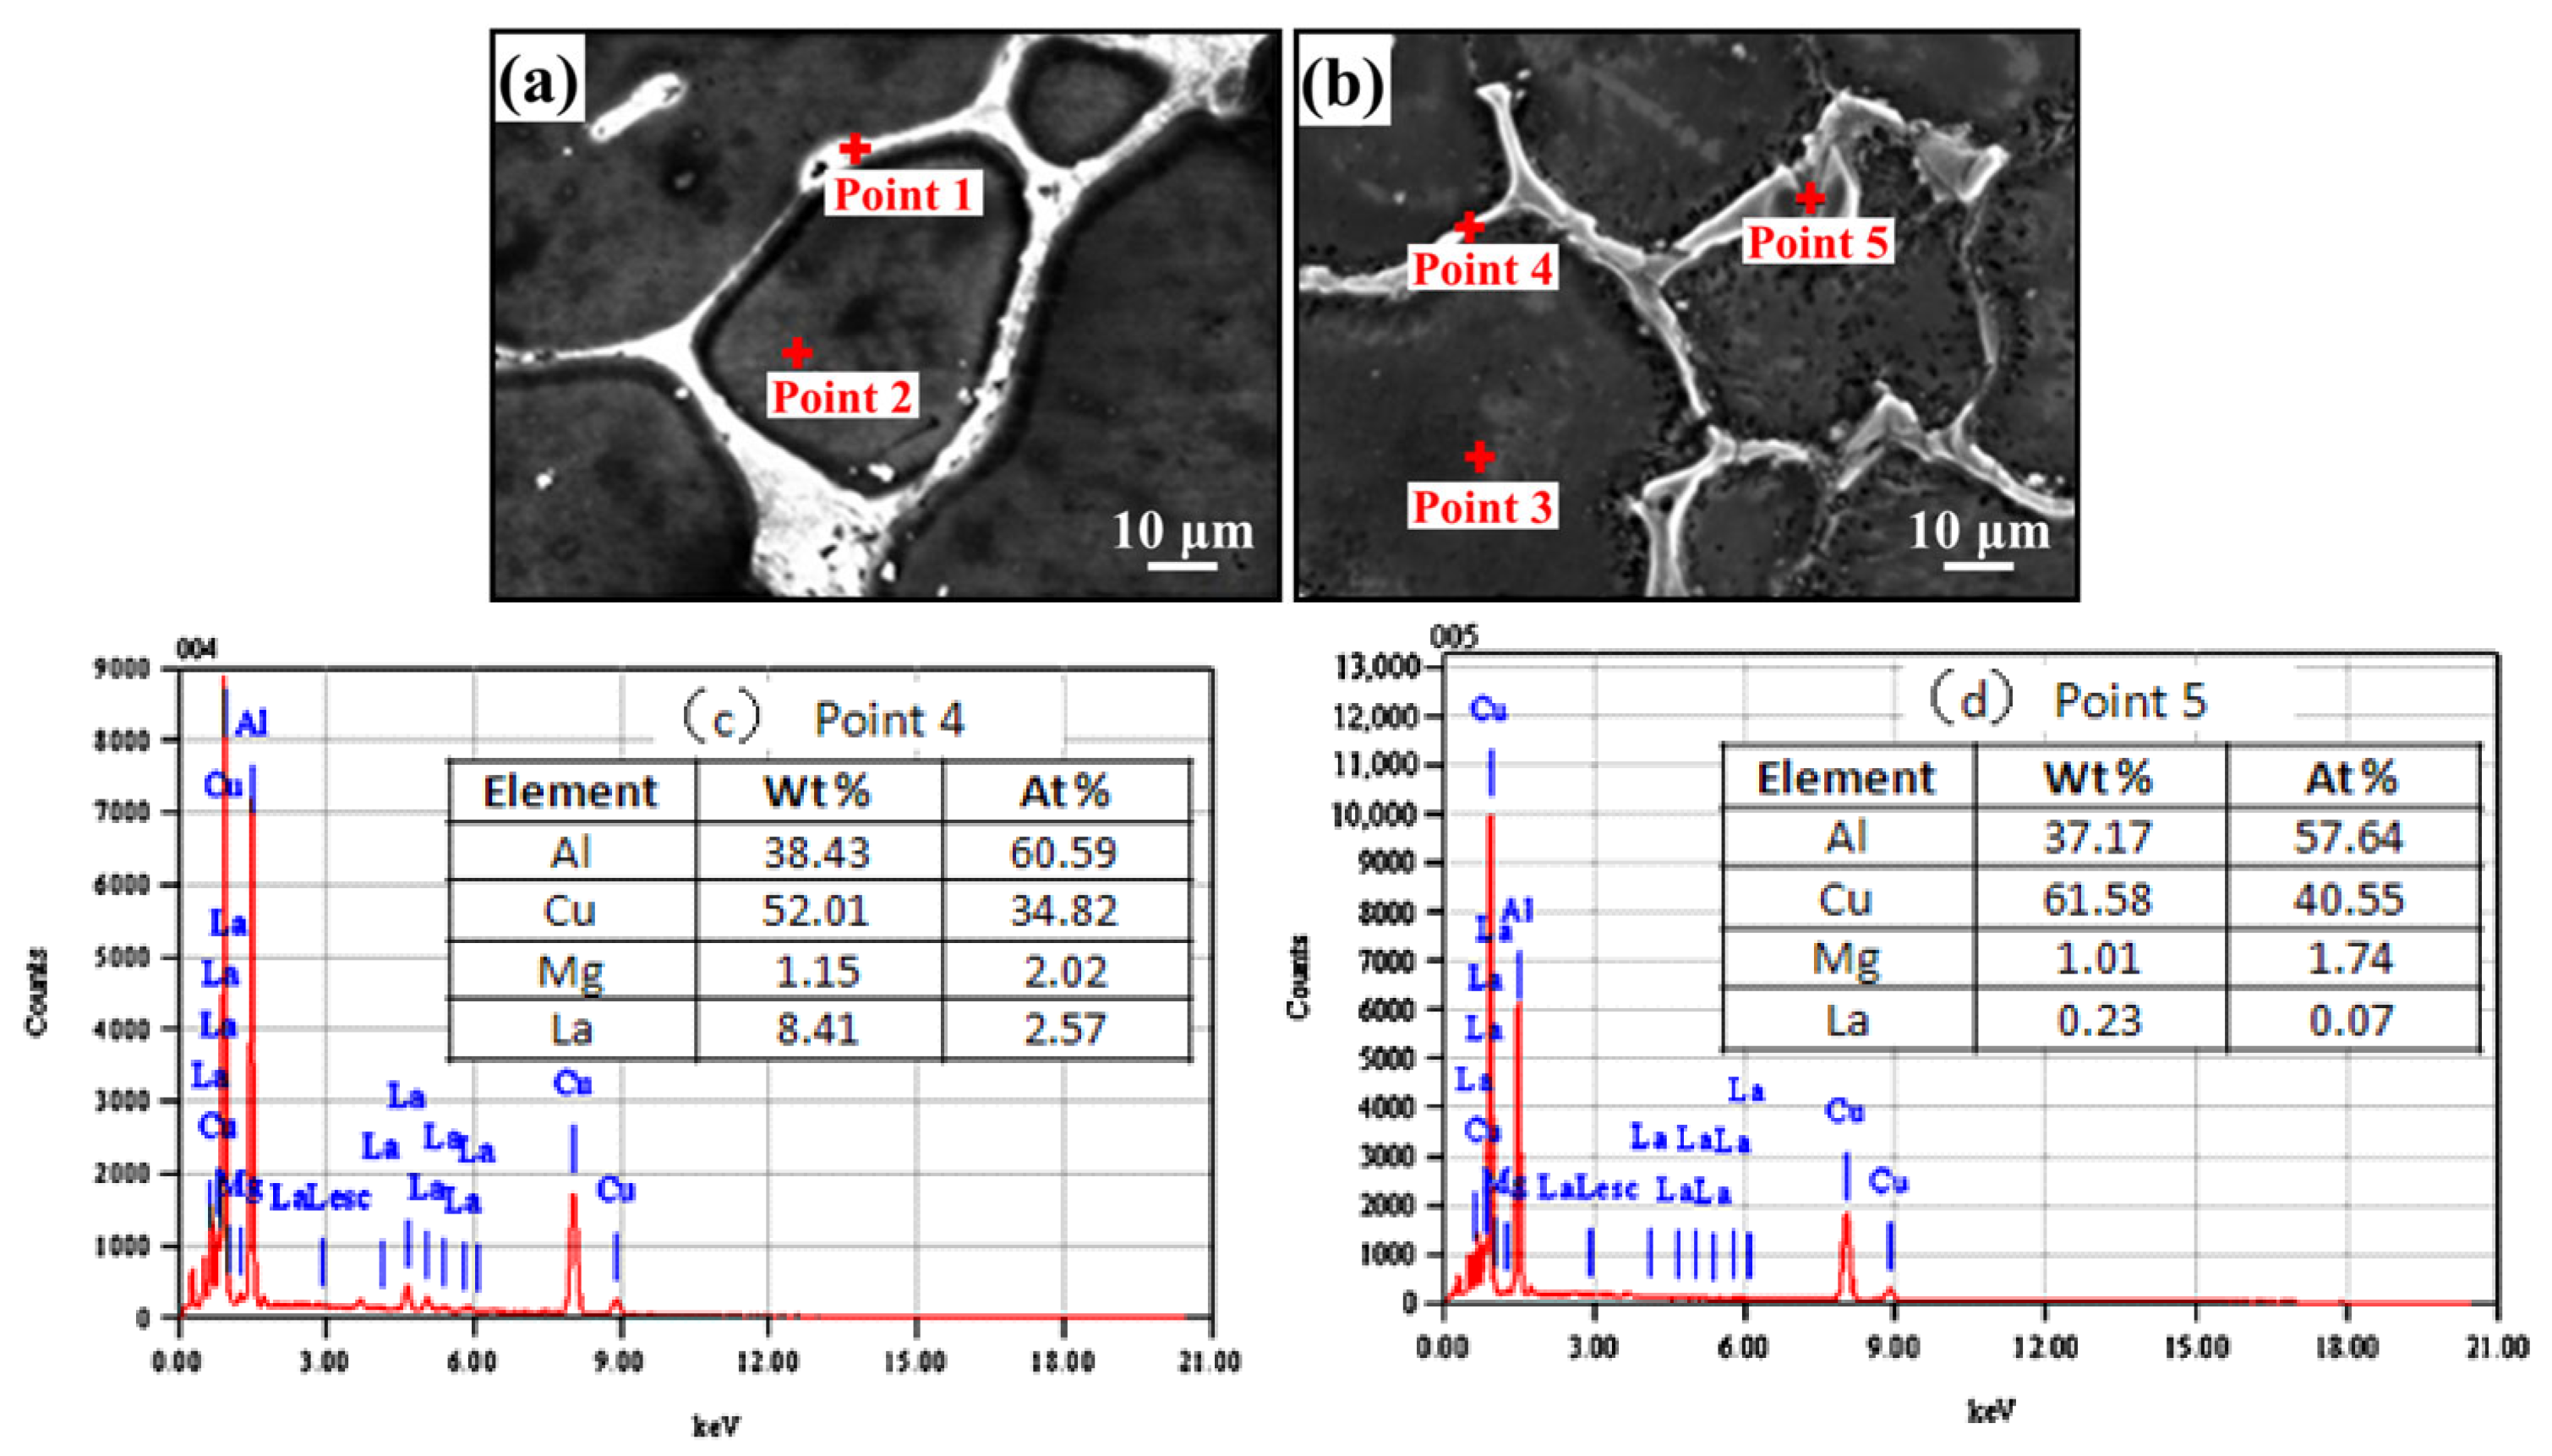
3.1. Microstructure and Composition of the Al-La Alloys with Different Cu Content

Figure 2 is an SEM photograph of the alloy. Figure 2a is a picture of the microstructure of the original 2A12 alloy. The grain boundaries are discontinuous and exist as more porous near the grain boundaries. Furthermore, the grains are uneven and the sizes are different. Figure 2b–e are cast structures of alloys with La 0.5 wt% and Cu 2 wt%, 3 wt%, 4 wt%, and 5 wt%, respectively. It can be seen that the grain size decreases, and the grain boundary is clear and continuous compared with the original sample (Figure 2a). With the addition of La, the grain boundary becomes clear and continuous, and the grain size becomes fine and uniform when the addition of Cu increases from 2 wt% to 4 wt%. When 4 wt% Cu is added (in Figure 2d), the grain size is the smallest, but the grain boundary is the thickest, and the voids near the grain boundary are more than those at 3 wt% Cu (in Figure 2c). Figure 2e has uniform and fine grains but coarse grain boundaries and corroded phenomena. Thus, when La was added 0.5 wt%, the optimal amount of Cu was 3 wt%.
In Figure 2, the metallographic pictures are consistent with the mechanical properties of the alloys mentioned above. With the increase in Cu content, the fine and uniform grain size of the alloys increases the tensile strength, hardness, and elongation of the alloys. The elongation of the alloy is the largest when the amount of Cu is 3 wt%. With the increase in the amount of Cu, cracks appear obviously in the alloy (Figure 2d,e) and the plasticity of the alloy decreases. Because of the existence of La, the Cu content is higher than that of the 2A12 alloy (3.8 wt% to 4.9 wt%), which can still play a reinforcing role. On the one hand, rare-earth elements have a good grain refinement effect [15]. On the other hand, La may be formed by some intermediate phases, such as Cu and Al, which play a role in strengthening the second phase. When the content of Cu exceeds a certain amount, the abundant enrichment of Cu in some areas can easily lead to hot cracking or residual stress, which reduces the plasticity of the alloy.
It is shown that the content of Cu in the 2A12 alloy can be raised to 7%~8% (usually Cu content is 3.8 wt%~4.9 wt%) when 0.5 wt% La is added. The grain refinement and microstructure of the alloy are homogeneous, and the comprehensive mechanical properties of the alloy are improved.
Figure 3 and Table 2 are SEM and EDS analysis results. Figure 3a,b shows the original 2A12 and include Cu (3 wt%) and La (0.5 wt%). In Figure 3a,b, there are black masses and brighter areas, and in the brighter areas of Figure 3b, there are gray areas. EDS was used to analyze the possible phases in these regions. Table 2 lists the data of energy spectrum analysis. According to Table 2, the primary alloys are mainly α-Al. There is a small amount of Cu and Mg phases (or elements) in the solution of α-Al (Figure 3a, point 1). In the bright white region (Figure 3a, point 2), the number ratio of Al and Cu atoms is close to 1:1, which may contain Al-Cu and Al2CuMg phases. La is not detected in Figure 3a. The main strengthening phases of the 2A12 alloy are Al2Cu and Al2CuMg. These phases are obtained after solid solution treatment. After adding Cu and La, the alloy mainly consists of α-Al (Figure 3b, point 3), and La does not exist in α-Al. In the bright region of Figure 3b (point 4), the number ratio of Al and Cu atoms is close to 2:1 and contains Mg and La. According to the relationship of the atomic number, it is estimated that the region may contain new phases consisting of Cu, Al, and La. In the gray area wrapped in the bright region of Figure 3b (point 5), the number ratio of Al and Cu atoms is close to 1:1, and the number of atoms containing Mg and La is lower than that of the bright region and La decreases the most. From the above data analysis, it is believed that the addition of Cu and La in as-cast alloys may gather at grain boundaries and form new phases containing La. The distribution of La on grain boundaries is not uniform. It may be that La refines the second phase and weakens the grain boundaries. Figure 3c,d shows the EDS spectra with elemental maps of point 4 and point 5.
In order to further analyze the structure of alloys after adding Cu and La, 2A12 alloys with adding Cu (3%) and La (0.5%) were analyzed by XRD pattern. The results are shown in Figure 4. It can be seen that the main phase of the alloy is α-Al, which contains AlCu3, Al4Cu9, CuAl2, Al2CuMg, AlLa3, Al6Cu6La, and so on, which is basically consistent with the above analysis.

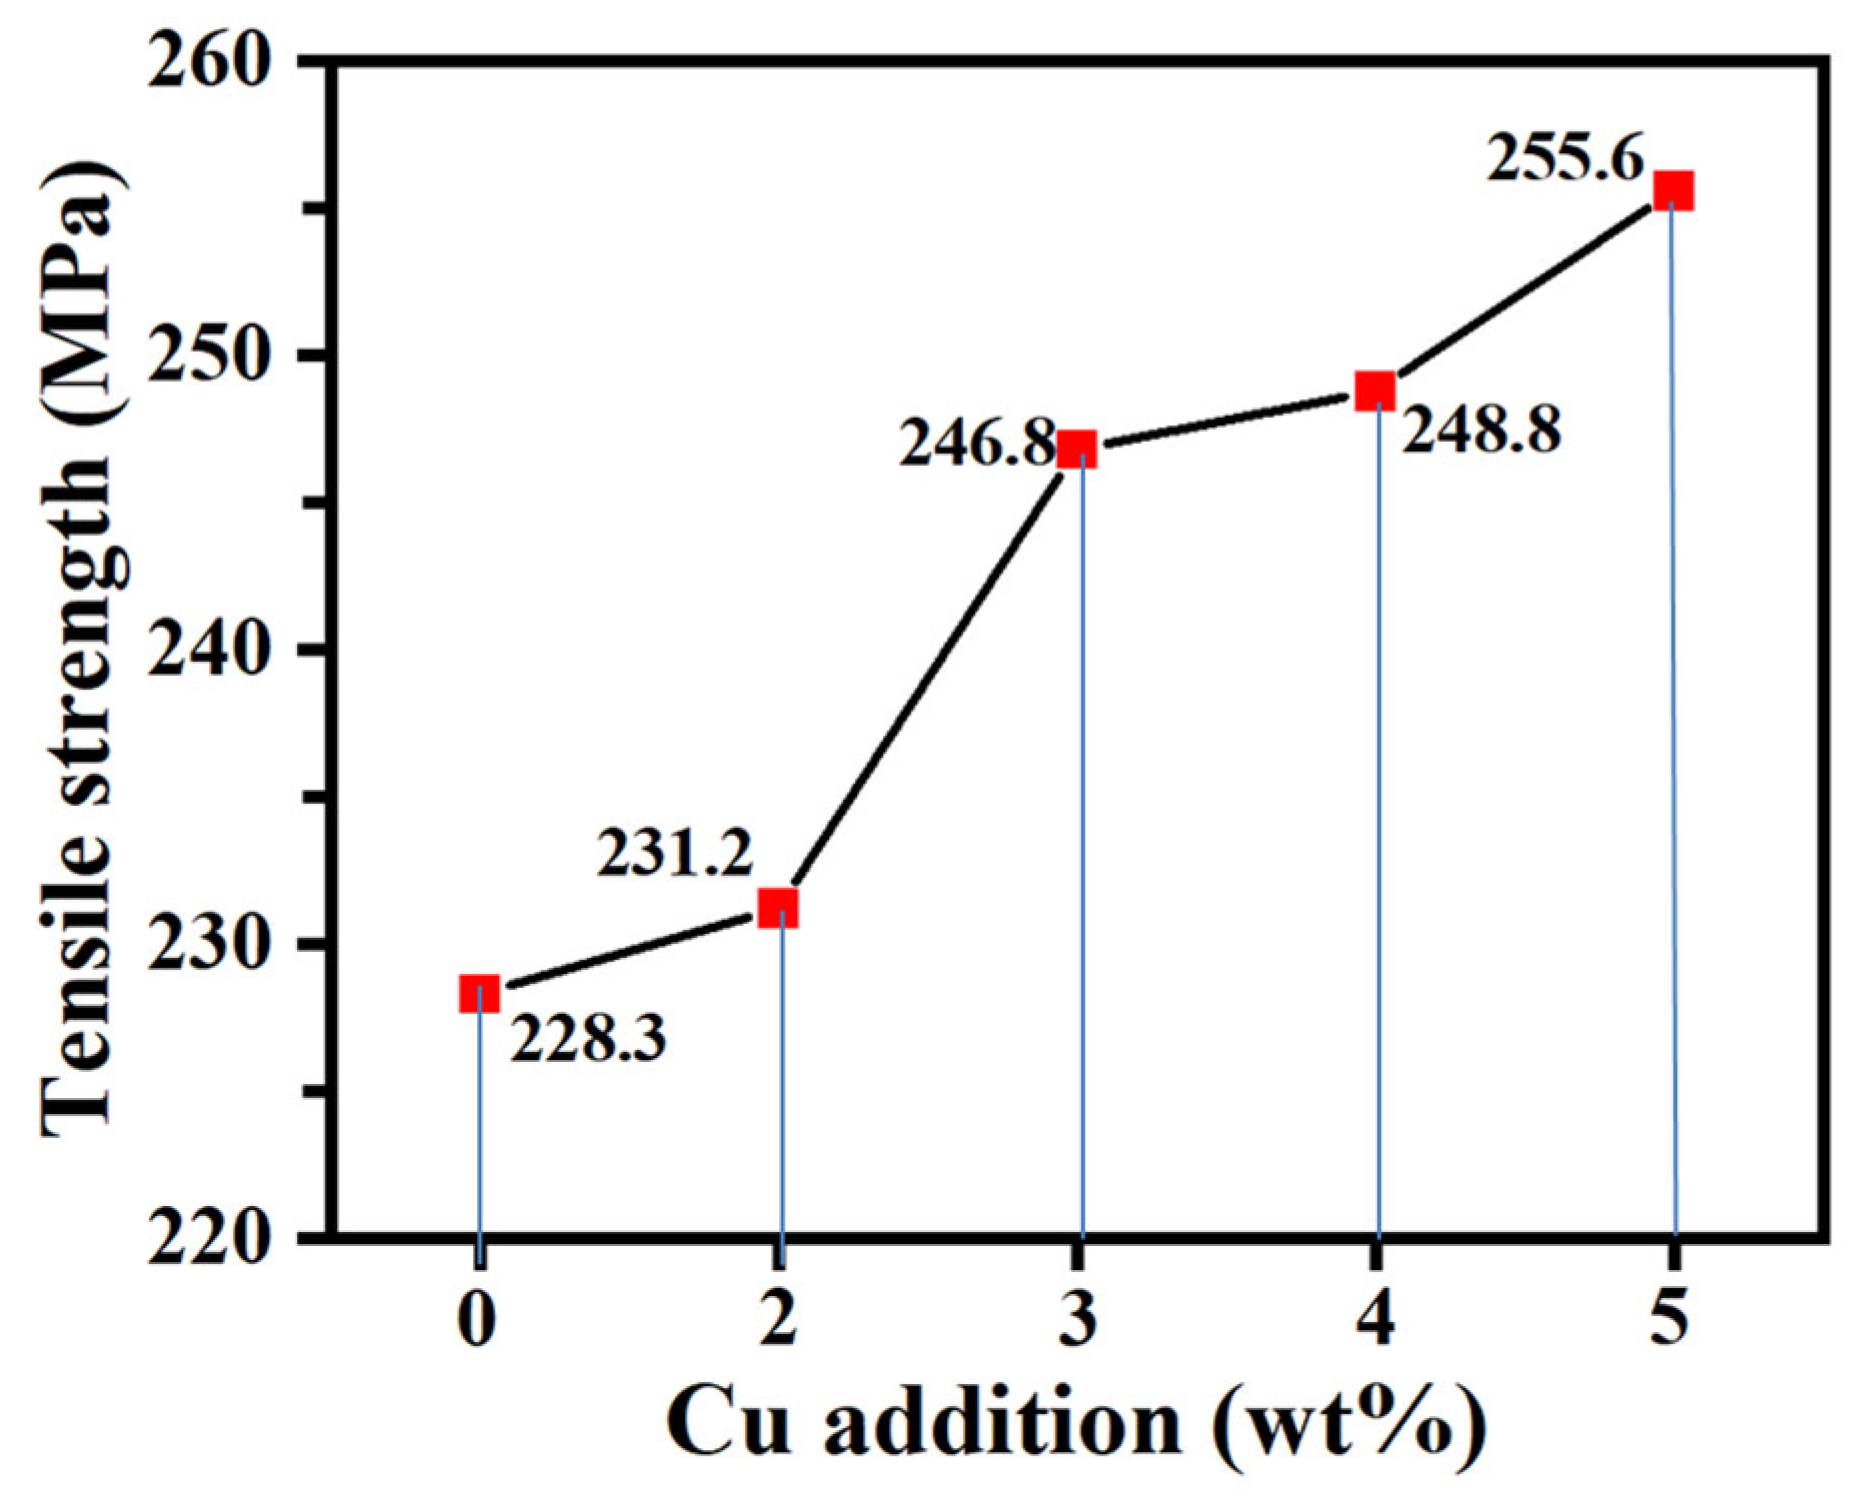
3.2. Effect of Cu Addition on Mechanical Properties of Al-La Alloy

Figure 5 is the curve of tensile strength of the specimen with the addition of Cu. It can be seen from Figure 5 that the tensile strength of the Al alloy with 0.5 wt% La added with 2 wt% to 5 wt% Cu increases with the increase in Cu content. The tensile strength of the alloy is 5% when the amount of Cu is 5 wt%, and the tensile strength (228.3 MPa) of the alloy increases by approximately 12% compared with that of the original Cu alloy. With the increase in Cu content, the increasing trend of as-cast strength of the alloy becomes slower.
Figure 6 shows the curve of elongation with the addition of Cu. From Figure 6, adding 2 wt% to 5 wt% Cu in 0.5% La in the 2A12 Al alloy, the elongation of the alloy increases first and then decreases with the increase in Cu addition. When the Cu content of the La-Al alloy is 3 wt%, the elongation of the alloy is 6.27%, which is 2.77% higher than that of the original Cu alloy, and the increase is approximately 79%. Within the experimental range, the elongation of as-cast alloys is greater than that of original alloys with the increase in Cu content.
Figure 7 is the curve of the hardness of the sample, changing with the amount of Cu added. It can be seen from Figure 7 that the hardness of the 2A12 Al alloy added to 0.5 wt% La is increased with the increase in Cu addition when adding 2 wt% to 5 wt% Cu. The hardness of the alloy increases most obviously when the content of Cu is 2 wt%. The hardness increases slowly with the increase in Cu content, but the hardness rises more than the original sample. The maximum hardness of the new alloy is 119.8 HBW when the content of Cu is 5 wt%, which is approximately 17.79% higher than that of the original alloy containing Cu. When the amount of Cu added is less than 3%, the hardness increases significantly.
La has the effect of fine-grain strengthening and second-phase strengthening on the Al-Cu-Mg alloy. The content of La remains unchanged, and as the amount of Cu added increases, the number of phase S(Al2CuMg) and formed Al, Cu, Mg, and La compounds increases. It improved the overall performance of the alloy. Unchanging the content of La, Cu was overabundance with addition, and Cu/Mg was much greater than 2.6. The increase in the number of θ phases (CuAl2) formed during the later stage of solidification, led to an increase in the strength and hardness, while the plasticity decreased.
Figure 8 shows the SEM images of the tensile fracture surface of alloys with different Cu content. Figure 8a is the original sample, Figure 8b is the fracture surface of alloys with 0.5% La and 3% Cu, and Figure 8c is the fracture surface of alloys with 0.5% La and 5% Cu. In Figure 8a, the tearing phenomenon is not obvious, and there are porosities and cracks, which are characterized by cleavage fracture, indicating the poor plasticity of the material. In Figure 8b, besides the obvious cleavage surface, a few tear ridges appeared, showing quasi-cleavage fracture characteristics, indicating that the plasticity of the material was improved compared with that of the original material. Although there are tear ridges and cleavage surfaces in Figure 8c, larger cracks appear. Cracks become the dominant factor of fracture. The plasticity of the material is worse than that of Figure 8b. The results of the study in Figure 6 are further proved. The reason for the transformation of fracture characteristics from cleavage fracture to the quasi-cleavage fracture may be that the addition of La promotes the formation of new phases, strengthens the combination of grain and grain boundary (shown in Figure 3a,b), and tearing occurs during the tensile process. When the amount of Cu added exceeds a certain value, because of the low solubility of copper in Al alloys, excessive Cu can only be concentrated at grain boundaries, and cracks and stresses are easily formed during solidification.

3.3. Effect of Cu Addition on Tribological Properties of the Al-La Alloy

Figure 9a shows the coefficient of friction as well as the typical morphology of the wear marks for 0 wt%, 3 wt%, and 5 wt% Cu additions, respectively, at 0.5 wt% La. The friction coefficients of the alloy are 1.08 and 1.18 at 3 wt% and 5 wt% Cu, respectively. Compared with the friction coefficient of the no Cu addition substrate (3.38), it shows a significant improvement in wear resistance. The inserted figure shows the sharpest wear marks without added copper, while the samples with 3 wt% and 5 wt% Cu content show wear marks. Combined with Figure 9b, wear mass loss shows that the samples without added copper are the most worn and the samples with 3 wt% Cu addition have the best wear performance. This is attributed to the formation of the Al-Cu-La inter-metallic compound (Table 1 and Figure 4). The compound is enriched at grain boundaries, which leads to an increase in energy at grain boundaries and enhances the wear resistance of the set matrix.
Figure 9a shows obvious grooves and scratches on the friction surface, as well as slight plastic deformation, indicating that abrasive wear is the main form of wear. Micro-cutting wear, multiple plastic deformation wear, fatigue wear, etc., are the main mechanisms of abrasive wear in this alloy. The amount of wear is related to the number and geometric shape of abrasive particles, as well as the relative hardness between the abrasive particles and the metal substrate. The more abrasive particles there are, the greater the hardness compared with the substrate, and the sharper the edges, the more severe the wear.
There is an S phase in the Al Cu Mg alloy θ phase, as well as complex compounds formed by Al, Cu, Mg, La, and other hard points, which have hardness greater than that of the base metal and can be considered as abrasive particles during friction. During the friction process, hard points are pressed in under the action of mutual squeezing pressure α- Al, and the rotational force causes the hard points to move tangentially relative to the contact surface. When the edges and angles of the hard points are sharp and appropriate, micro-cutting occurs, resulting in long and shallow grooves on the contact surface, forming chips and leaving furrows on the contact surface; when the height of the non-sharp protruding part of the hard point is small, the hard point slides along the contact surface with a greater force, and the surface metal is pushed forward or on both sides of the hard point, generating accumulation. The accumulation does not detach from the substrate, causing significant plastic deformation on the surface and forming wrinkles. Multiple plastic deformations result in the work hardening of the metal surface and this ultimately peeling off, forming layered folds, pits, scratches, etc., on the contact surface; when the stress repeatedly applied by hard points exceeds the fatigue limit of the alloy surface, micro cracks will form on the contact surface, leading to surface separation and the formation of chips, and grooves will appear on the contact surface.
When Cu is added at 0%, the hardness of the alloy is the smallest, the hardness difference between the hard point and the matrix is the largest, and the wear is the most severe (5.221 mg). The result is the maximum width and depth of the wear scar, with the widest point approaching 50 μm. When Cu is added at 3%, the plasticity of the alloy is the best. During the friction process, the repeated action of hard points does not cause micro cracks, and the wear is the smallest (3.522 mg). As a result, the width and depth of the wear mark are the smallest, with the widest point approaching 20 μm. When the amount of Cu added is 5%, the hardness of the alloy increases while the number of hard points increases. The wear amount and the width and depth of the wear mark are between the first two, with a wear amount of 4.579 mg and the widest part of the wear mark approaching 30 μm.

4. Conclusions

Cu is the main strengthening element of the Al-Cu-Mg alloy, with a content of 3.8% to 4.9%. When Cu/Mg > 2.6, the main strengthening phase is the S phase (Al2CuMg), with a small amount of the θ phase (CuAl2). The increase in Cu content promotes θ. The strengthening effect is better when the phase is increased. However, an increase in Cu content can cause defects such as thermal cracking and reduced corrosion resistance. Rare-earth elements can extract and purify aluminum alloys, improve mechanical properties and corrosion resistance, and reduce corrosion resistance. Taking the composition of the 2A12 alloy as a reference, the effect of Cu addition on the microstructure and properties of the alloy was studied by adding 0.5% La:
(1)
With the addition of 0.5% La, as the Cu content increases, the alloy grains refine and the fracture mode of the alloy changes from dissociation fracture to quasi-dissociation fracture. When the amount of Cu added is greater than 3%, excessive Cu makes the alloy prone to thermal cracking, resulting in pores and even cracks.
(2)
Adding 0.5% wt La to the Al-Cu-Mg alloy and increasing the Cu content, to a certain extent, refines the grain, improves the fracture characteristics of the alloy, ameliorates the mechanical properties of the alloy, and the amount of La added is controlled at 0.5%. With the increase in Cu content, the hardness and tensile strength of the alloy increase, and the plasticity increases first and then decreases. When 3 wt% Cu is added, the maximum elongation of the alloy is 6.27%. Then, the elongation of the alloy decreases but is higher than that of the original alloy.
(3)
The formation of Al-Cu-La compounds and their enrichment at grain boundaries enhance the wear resistance of the alloy. Abrasive wear is the main form of wear for this alloy. When the amount of Cu added is 3%, the alloy has the best wear resistance and the minimum wear amount. When the amount of Cu added is too large, θ. The increase in the amount of phase (CuAl2) results in a decrease in the wear resistance of the alloy.
(4)
The addition of La and Cu mainly aggregates at grain boundaries, forming new phases containing La. When the amount of Cu added exceeds a certain range, a large amount of Cu is enriched at the grain boundaries, which can easily cause alloy cracking. When the addition amount of La is 0.5 wt%, the Cu content in the Al Cu alloy can be increased to 7% to 8%, and the mechanical properties of the Al-Cu (7% to 8%) Mg (1.2% to 1.8%)–Mn (0.3% to 0.9%)-La (0.5) alloy are better.

Author Contributions

Conceptualization, M.S.; Writing—original draft, S.W.; Supervision, G.M. All authors have read and agreed to the published version of the manuscript.

Funding

Project of Xi’an Science and Technology Bureau (201805032YD10CG16(3)); Project of Xi’an Aeronautical University (2019HX013); innovation training program for college students (S202111736027).

Institutional Review Board Statement

Not applicable.

Informed Consent Statement

Not applicable.

Data Availability Statement

The data that support the findings of this study are available within the article.

Conflicts of Interest

The authors declared that they have no conflict of interest in this work. We declare that we do not have any commercial or associative interest that represents a conflict of interest in connection with the work submitted.

References

  1. Zhang, H.; Li, J.; Wang, D.; Hiromi, N. Research progress on fatigue properties of aluminum alloys. Light Alloy Fabr. Technol. 2023, 51, 15–22+63. [Google Scholar]
  2. Zhang, H.; Zhao, X.; Liu, Y. Effect of high frequency impacting and rolling on fatigue crack growth of 2A12 aluminum alloy welded joint-2021. Int. J. Fatigue 2012, 14, 106172. [Google Scholar]
  3. Cui, Z.; Li, X.; Zhang, H.; Xiao, K.; Dong, C.; Liu, Z.; Wang, L.; Thongtem, S. Atmospheric Corrosion Behavior of 2A12 Aluminum Alloy in a Tropical Marine Environment. Adv. Mater. Sci. Eng. 2015, 2015, 163205. [Google Scholar] [CrossRef]
  4. Tian, W.; Chao, B.; Xiong, X.; Li, Z. Effect of Surface Roughness on Pitting Corrosion of 2A12 Aluminum Alloy. J. Electrochem. Sci. 2018, 13, 3107–3123. [Google Scholar] [CrossRef] [PubMed]
  5. Yang, Y.; Zhao, P.; Zong, F. Study on aging hardening characteristics of Al-5Si-xCu alloy. Mater. Heat Treat. 2012, 41, 196–198. [Google Scholar]
  6. Gun, Y.; Xu, T.; Li, J.; Cao, C.; Dons, S. Liquid precipitation phase of eutectic piston alloy with different Cu contents. Chin. J. Rare Met. 2016, 40, 207–214. [Google Scholar]
  7. Ma, J.; Guo, P. Effect of Cu content on microstructure and property of A1 alloy piston material. Hot Work. Technol. 2014, 43, 90–92. [Google Scholar]
  8. Wang, Z.; Tian, R. Aluminum Alloy and Its Processing Manual; Central South University Press: Changsha, China, 2005; pp. 90–139. [Google Scholar]
  9. Liu, Y.; Tian, W.; Sun, Y. Research Progress of Microalloying of A1-Zn-Mg-(Cu) Aluminum Alloy. Non Ferr. Met. Mater. Eng. 2018, 39, 38–41. [Google Scholar]
  10. Han, J.; Wang, J.; Zhang, M.; Niu, K. Relationship between amounts of low-melting-point eutectics and hot tearing susceptibility of ternary AI-Cu-Mg alloys during solidification. Trans. Nonferrous Met. Soc. China 2020, 30, 2311–2325. [Google Scholar] [CrossRef]
  11. La Torre, E.A.-D.; Pérez-Bustamante, R.; Camarillo-Cisneros, J.; Gómez-Esparza, C.D.; Medrano-Prieto, H.M.; Martínez-Sánchez, R. Mechanical properties of the A356 aluminum alloy modified with La/Ce. J. Rare Earths 2013, 31, 811–816. [Google Scholar] [CrossRef]
  12. Liang, W. Rare-Earth Element Ce Impact on the Framework and Performance LC4 Ultra-High Alnminum Alloy; Guangxi University: Nanning, China, 2007. [Google Scholar]
  13. Zhen, W.; Li, F.; Gan, C.; Zhou, N. Microstructure and Properties of Extruded Commercial Purity Aluminum with La and Ce Mixed Rare Earth. Chin. J. Rare Met. 2022, 46, 438–450. [Google Scholar]
  14. Li, H.-Y.; Zhao, F.; Yang, S.-L. Effect of Ce-rich rare earth addition on microstructure and electrical conductivity of aluminum alloy. Chin. J. Nonferrous Met. 2022, 30, 719–727. [Google Scholar]
  15. Wu, L.; Li, T.; Zhao, H.; Sun, M.; Fan, J. Influence of Ce on Corrosion Resistance of 2A12 Aluminum Alloy in Harsh Marine Atmospheric. Chin. J. Rare Met. 2019, 43, 21269–21274. [Google Scholar]
  16. Xu, D.; Chen, K.; Hu, G.; Chen, S. Effects of Trace Rare Earth Ce on Microstructure and Corrosion Properties of Al-Zn-Mg Aluminum Alloy. Mater. Rep. 2020, 34, 8100–8105. [Google Scholar]
  17. Guo, J.; Li, R.; Niu, H. Department of Metallurgical and Chemical Engineering, Jiyuan. Effect of Cerium on Microstructureand Properties of 6063 Aluminum Alloy. J. Chin. Soc. Rare Earths 2021, 39, 275–281. [Google Scholar]
  18. Zhou, H.; Yang, N.; Zhang, Z. Effect of Rare Earth La and Sn on Structure, Mechanical and Damping Properties of Cast Aluminum Alloy. Rare Met. Mater. Eng. 2021, 50, 932–938. [Google Scholar]
  19. Zheng, Q.; Zhang, L.; Jiang, H.; Lu, M.; Zhang, L.; Zhao, J. Effect mechanisms of micro-alloying element La on microstructure and mechanical properties of hypoeutectic Al-Si alloys. J. Mater. Sci. Technol. 2020, 47, 142–151. [Google Scholar] [CrossRef]
  20. Liu, J. Effect of La on Microstructure Properties and Hot-Tearing of Al-Cu-Mg Alloy; Shenyang University of Technology: Shenyang, China, 2017. [Google Scholar]
Figure 1. (a) sand mold cavity; (b) cast bar; (c) tensile sample; (d) diagram of tensile sample.
Coatings 13 01505 g001
Figure 2. Microstructure of 2A12 alloy with additional different amounts of Cu: (a) 2A12 alloy; (b) added 0.5% La and 2% Cu; (c) added 0.5% La and 3% Cu; (d) added 0.5% La and 4% Cu; (e) added 0.5% La and 5% Cu.
Coatings 13 01505 g002
Figure 3. EDS of 2A12 alloys sample. (a) 2A12 alloy; (b) added 0.5% La and 3% Cu; (c) Point 4; (d) Point 5.
Coatings 13 01505 g003
Figure 4. XRD pattern of 2A12 alloy containing La (0.5 wt%) and Cu (3 wt%).
Coatings 13 01505 g004
Figure 5. Curve of tensile strength with the addition of Cu.
Coatings 13 01505 g005
Figure 6. Curve of elongation with the addition of Cu.
Coatings 13 01505 g006
Figure 7. Curve of hardness with the addition of Cu.
Coatings 13 01505 g007
Figure 8. SEM of fracture morphology: (a) 2A12 alloy; (b) added 0.5% La and 3% Cu into 2A12; (c) added 0.5% La and 5% Cu into 2A12.
Coatings 13 01505 g008
Figure 9. Tribological properties: (a) friction coefficient and typical wear morphology (insert chart), (b) wear quality loss.
Coatings 13 01505 g009
Table 1. Compositions of 2A12 Al alloy.
Alloy
Composition
Mass Percent
SiFeCuMnMgNiZnTiAl
2A12≤0.50–0.53.8–4.90.3–0.91.2–1.8≤0.10≤0.3≤0.15margin
Table 2. Atomic number ratio (%) measured by EDS at each point.
Point12345
No AddingAdding Cu (3 wt%), La (0.5 wt%)
Al48.1597.9998.9260.5957.64
Cu48.040.571.0834.8240.55
Mg3.811.4402.021.74
La0002.570.07
Disclaimer/Publisher’s Note: The statements, opinions and data contained in all publications are solely those of the individual author(s) and contributor(s) and not of MDPI and/or the editor(s). MDPI and/or the editor(s) disclaim responsibility for any injury to people or property resulting from any ideas, methods, instructions or products referred to in the content.

