Article

Effect of Coating on Stress Corrosion Performance of Bridge Cable Steel Wire

1
Jiangsu Key Laboratory of Advanced Metallic Materials, Southeast University, Nanjing 211189, China
2
Baosteel Group Nantong Wire Products Co., Ltd., Nantong 226002, China
3
Shenzhen-Zhongshan Link Administration Center, Guangdong Highway Construction Co., Ltd., Zhongshan 528400, China
4
Shanghai Pujiang Cable Co., Ltd., Shanghai 201314, China
*
Author to whom correspondence should be addressed.
Coatings 2023, 13(8), 1339; https://doi.org/10.3390/coatings13081339
Submission received: 29 June 2023 / Revised: 27 July 2023 / Accepted: 27 July 2023 / Published: 29 July 2023
(This article belongs to the Special Issue Corrosion and Corrosion Prevention in Extreme Environments)

Abstract

:
Hot galvanization on steel surfaces can isolate the steel from corrosive environments and alleviate the stress corrosion cracking caused by the anodic dissolution mechanism. However, the cathodic protection potential of the coating is excessively negative, which may aggravate the hydrogen embrittlement problem. The effect of a coating on the stress corrosion performance of bridge cable wire was studied by means of X-ray diffraction (XRD), scanning electron microscopy (SEM), energy-dispersive spectrometry (EDS), a thermal desorption analysis (TDA), an electrochemical workstation, and an FIP test. The results show that hot-dip ZnAl and ZnAlMg alloy coatings can significantly prolong the stress corrosion fracture time of steel wire substrates. From a macroscopic perspective, the stress corrosion cracking fracture is a brittle fracture caused by hydrogen embrittlement. Moreover, the coating type has little effect on the fracture morphology of bridge cable wire. In NH4SCN solution (50 °C, 20 wt.%), a corrosion product layer composed of ZnS and Al2O3 was formed on the surface of the coated steel wire. The electrochemical analysis showed that the corrosion resistance of the ZnAlMg coating was better than that of the ZnAl coating, which was the main reason for the improvement of the stress corrosion performance.

1. Introduction

Hot-dip galvanized steel wire is the main load-bearing structure in suspension bridges and cable-stayed bridges [1]. The harsh service environment requires that the steel wire has excellent mechanical and corrosion resistance properties [2]. However, a study found that the stress corrosion cracking problem of galvanized steel wire appeared in many long-span bridges within ten years after the bridges were completed [3]. Stress corrosion cracking has two mechanisms: anodic dissolution and hydrogen embrittlement [4].
Permanent microstructural damage is caused by the anodic dissolution mechanism [5]. Therefore, in the steel industry, the corrosion process is often slowed down by hot-dip galvanizing on the steel surface [6]. The principle is to isolate the steel from the corrosive environment through the alloy coating, so as to play a shielding protection role [7]. In addition, the active metal material can also be used as a sacrificial anode to provide a cathodic protection current for the steel wire substrate [7,8]. However, Zn is relatively soft and the generated corrosion products are loose and porous, which limits the improvement of its service life [9]. A small amount of Al was added to the zinc bath to increase the hardness of the coating [10]. Compared with a traditional pure Zn coating, the ZnAl coating has better corrosion resistance and significantly lower costs [11]. Zhao et al. [12] proved that the average service life of Galfan (Zn-5Al) steel wire under corrosion fatigue conditions was significantly higher than that of galvanized steel wire. In addition to ZnAl coatings, ZnAlMg coatings have also been extensively studied [13]. For example, Suprer Zinc (Zn-4.5Al-0.1Mg) [14], ZAM (Zn-6Al-3Mg) [15], and MagiZincTM (Zn, 1–2 wt.% Mg, 1–2 wt.% Al) [16] have been produced on an industrial scale for several years. Henryk Kania found that the improved corrosion resistance of ZnAlMg coatings is due to the presence of a more anodic MgZn2 phase [17]. Through a neutral salt spray test, Fan et al. [13] proved that the corrosion resistance of the Zn-5Al-1.5Mg coating was about 2.4 times that of the Galfan coating. The excellent corrosion resistance of the ZnAlMg coating is attributed to the fact that magnesium can inhibit the formation of soluble or porous corrosion products [18].
The stress corrosion cracking caused by the anodic dissolution mechanism can be alleviated by hot-dip Zn alloy coatings. However, the cathodic protection potential of the coating is excessively negative, and atomic hydrogen may be produced after corrosion [7]. This is equivalent to leaving the steel structure in a hydrogen-filled state, which may exacerbate the problem of hydrogen embrittlement [3]. Barton et al. [5] compared the hydrogen contents in galvanized and stripped-galvanized steel wires before and after corrosion. The hydrogen content in the uncorroded galvanized steel wire was measured to be about 3 ppm. It is speculated that hydrogen was introduced during the production of steel wires. For example, steel needs to be pickled with HCl before hot dipping, and the pickling process may introduce hydrogen atoms. The galvanized steel wires are soaked in concentrated hydrochloric acid for 60 s and then rinsed with water, and the resulting samples are referred to as “stripped–galvanized steel wires” [5]. Between uncorroded samples, the hydrogen levels in the stripped–galvanized steel wire samples (~11 ppm) are slightly higher than those found in the galvanized steel wire. This result is due to hydrogen absorption during the stripping process. The hydrogen concentration of corroded steel wire is higher than that of uncorroded steel wire, indicating that the corrosion process may be accompanied by hydrogen absorption. Moreover, the hydrogen content of galvanized steel wire (~59 ppm) is much higher than that of stripped–galvanized steel (~36 ppm) wire after corrosion [5]. In recent years, the construction of super-long span bridges has shown a blowout development trend, and the span of bridges has increased from 1624 m (1998, Great Belt Bridge) to 1666 m (2022, Lingdingyang Bridge). With the continuous increases in bridge spans, the strength of the steel wire used in the bridge cables should also be improved accordingly. However, high-strength steel wire may have the risk of hydrogen embrittlement damage. Elices et al. [19] showed that when the strength of cold-drawn pearlite steel wire exceeded 2000 MPa, its hydrogen embrittlement sensitivity was significantly increased.
In the past, the research on the stress corrosion performance of bridge cable steel wire has mainly focused on the steel wire substrate [20,21], and the influence of the coating was seldom considered. Moreover, the corrosion resistance of the coating was mostly evaluated in NaCl solution [22,23] without considering the effect of hydrogen embrittlement. According to the literature, NH4SCN solution (50 °C, 20 wt.%) is widely used in the study of hydrogen embrittlement, which plays the role of soaking and charging the hydrogen [24,25]. In order to consider the influence of the hydrogen embrittlement mechanism, the NH4SCN solution (50 °C, 20 wt.%) was selected as the test solution in this paper. The effect of the coating on the stress corrosion performance of bridge cable wire was studied using the FIP test. This paper is expected to provide guidance for the research of high-strength steel wire and the reliability of engineering applications.

2. Materials and Methods
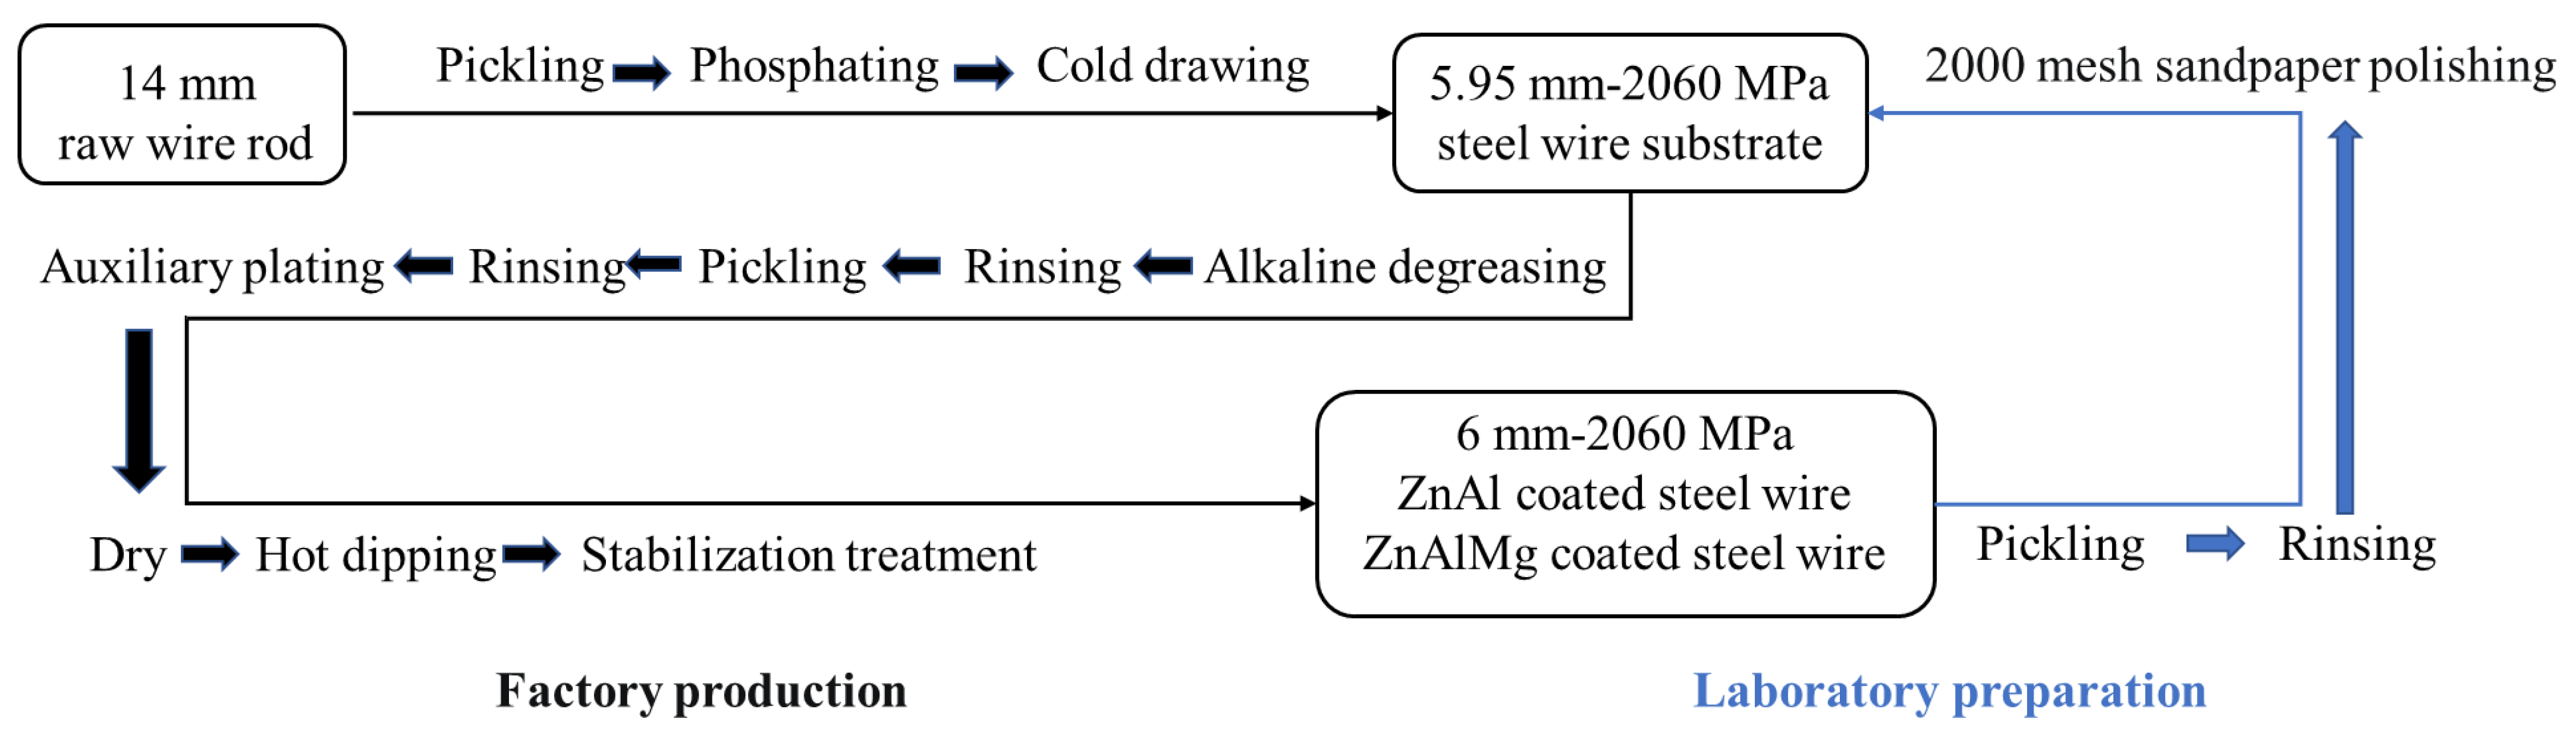
2.1. Test Specimen

The ZnAl- and ZnAlMg-coated steel wires were manufactured by Baosteel Group Nantong Wire Products Co., Ltd. Figure 1 shows a schematic diagram of the steel wire production process. The chemical composition of the 14 mm raw wire rods is shown in Table 1. The steel wire substrates are obtained in the factory via pickling, phosphating, and cold drawing (Figure 1). Phosphated film (film weight > 6 g/m2) is mainly used as a lubrication and corrosion-resistant coating during the cold working process [26]. Then, the steel wire substrates are subjected to an alkaline bath (alkali bath solution: 20 wt.% NaOH; temperature: 70 °C), pickling (pickling solution: 20 wt.% HCl; temperature: 70 °C), auxiliary plating (mass ratio of flux solution: NH4Cl:ZnCl2:H2O = 9:11:80; temperature: 30 °C; time: 90 s), and hot-dip coating (temperature: 450 °C; time: 60 s). The phosphating of the film does not have any effect on the production of the coating, as it is removed during pickling. The hydrochloric acid is heated to 70 °C to improve its efficiency at high speeds of production. The volatilized acid mist is treated by alkali washing with air suction. After auxiliary plating, the surface of the steel wire is dried with the drying solvent method to avoid zinc blasting and improve the surface quality of the coating. Subsequently, the steel wire substrates are immersed in the zinc alloy plating bath. The coating types are ZnAl alloy (composition: 95 wt.%Zn, 5 wt.%Al) and ZnAlMg alloy (composition: 94 wt.%Zn, 5 wt.%Al, 1 wt.%Mg) coatings, respectively. Then, the residual stress on the surface of the steel wires is released through a stabilization treatment (tension: 2200 kg; speed: 100–200 m/s; heating temperature: 310 °C). Finally, coated steel wires with a diameter of 6 mm and a strength grade of 2060 MPa are obtained. The surface quality has an impact on the stress corrosion performance of the steel wire [27]. Therefore, the surface quality of the samples is as consistent as possible. The surface of the coated steel wire is smooth and uniform, and there are no trouble issues such as coating peeling and burring. Here, steel wire substrates as the control samples were obtained using the HCl pickling method [5] (Figure 1). Next, the residual acid on the surface of the steel wire substrate was rinsed with water. Since grinding can eliminate defects on the steel wire surface [28], the steel wires were polished with 2000 mesh sandpaper to obtain a smooth surface. However, because the surface of the steel wire was curved, it was impossible to measure its surface roughness directly. Therefore, we prepared a flat steel sample and polished it with 2000 mesh sandpaper. The average surface roughness (Ra) of the sample was then measured by a surface profilometer (Dektak 150, Bruker Daltonic Inc, Germany) to be about 177 ± 52 nm. The specific information about the test samples is listed in Table 2.

2.2. Test Method and Parameters

The microstructure and chemical composition were characterized with a scanning electron microscope (SEM, Navo Nano SEM450, Thermo Fisher Scientific, Waltham, MA, USA) equipped with an energy dispersion spectroscope (EDS, NordlysMax3, Oxford Instruments, Oxford, UK). Considering that the coating is composed of several different elements, the backscatter electron detector was selected. The morphology of the coated steel wire was recorded at a beam spot of 6 and an acceleration voltage of 20 kV. The element distribution was obtained in surface scan mode, and the composition of the Zn-rich phase and eutectic phase was measured in point analysis mode. XRD (SmartLab 3, Rigaku Corporation, Tokyo, Japan) was used to characterize the phase of the coated steel wire, operating at a voltage of 40 kV at room temperature, a tube current of 40 mA, and a scanning rate of 10°/min.
The FIP test was proposed in 1978 by the International Federation of Prestressed Concrete (FIP, Lausanne, Switzerland) [19,21]. The rupture time of a test piece was determined by maintaining constant tensile force and immersing it in a solution of 20 wt.% thiocyanate at a given constant temperature (50 °C). The FIP test was performed on a stress corrosion tester (QC-1000, China Metallurgical Science and Industry Group Co. Ltd., Beijing, China) to evaluate the stress corrosion properties of coated steel wires and steel wire substrates. In order to ensure that the stress corrosion conditions are completely consistent, the formula F = A × σ (where A is the cross-sectional area of the wire and σ is the tensile strength grade) is used to calculate Fmax. The applied loads are 70%Fmax (40.75 ± 0.62 kN) and 80%Fmax (46.57 ± 0.79 kN), respectively. In order to compare the tensile fracture and stress corrosion cracking fracture, the tensile test was carried out on a microcomputer-controlled electronic universal testing system (CMT5105, NSS Laboratory Equipment Co., Ltd., Shenzhen, China). The macroscopic morphology of the fracture was observed with a digital microscope (VHX-5000, Keyence Corporation, Osaka, Japan).
The corrosion behavior of the steel wire was monitored using an electrochemical workstation (CHI604E, Chenhua Instrument Co., Ltd., Shanghai, China) during stress corrosion. The reference electrode was a saturated calomel electrode (SCE) and the counter electrode was a graphite rod. The test voltage range of the potentiodynamic polarization curve was ±1 V relative to the open-circuit potential (OCP) and the scanning speed was 5 mV/s. The sinusoidal voltage excitation signal with a disturbance amplitude of 5 mV was used for electrochemical impedance spectrum (EIS) testing. The EIS data were fitted using ZSimpWin software.
The hydrogen content and states were analyzed via a thermal desorption analysis (TDA, JTF-20A SERIES, J-SCIENCE LAB Co., Ltd., Kyoto, Japan) using a gas chromatograph at a heating rate of 100 °C h−1 in the temperature range of room temperature to 850 °C. A standard Ar gas flow (40 mL/min) was used for the calibration of the hydrogen content. The discharged gas was analyzed every 3 min. The mass of the steel wire samples was about 4.5 g. The hydrogen-charged sample was prepared after soaking in NH4SCN solution (50 °C, 20 wt.%) for 24 h, and the TDA test was performed immediately after being charged with hydrogen.

3. Results and Discussion

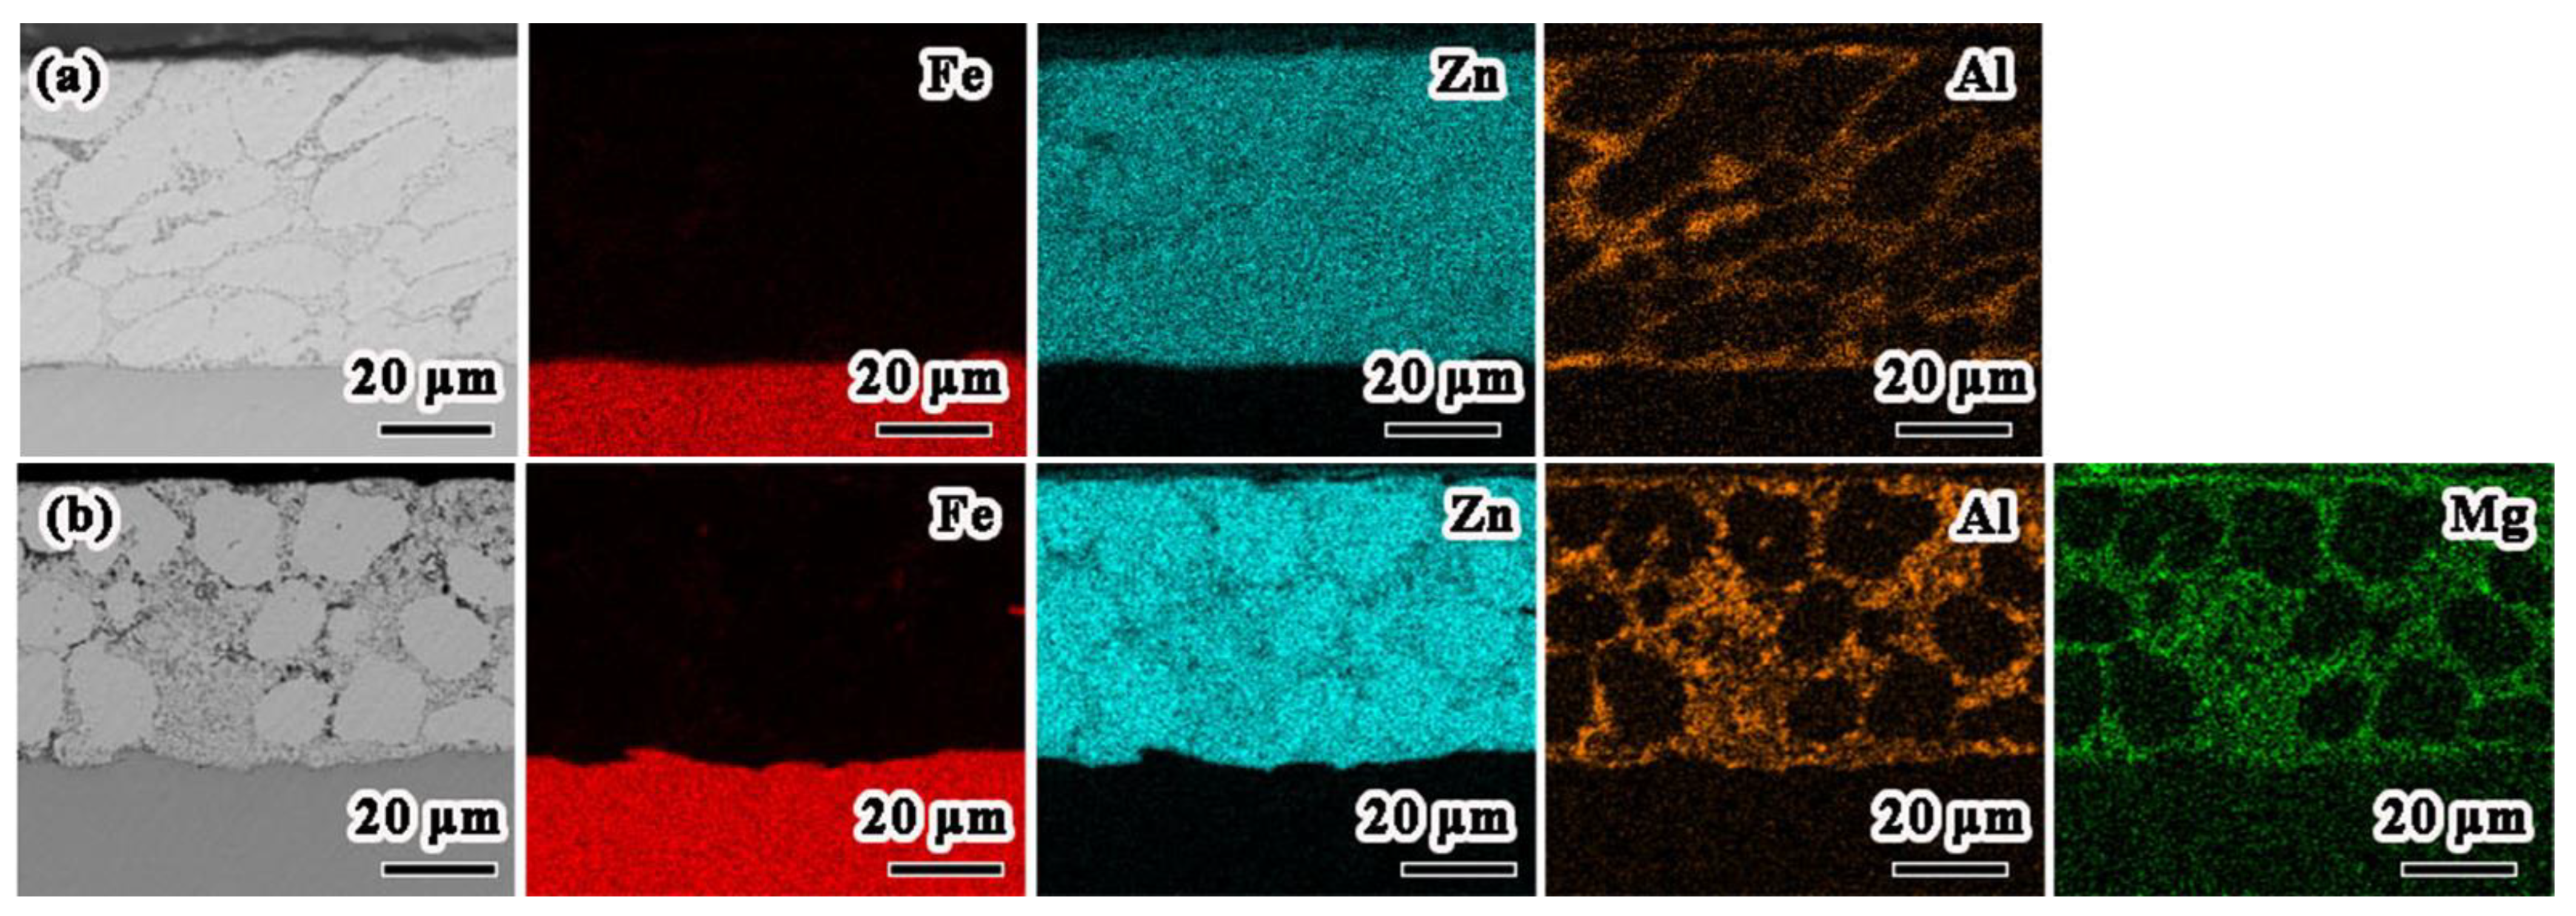
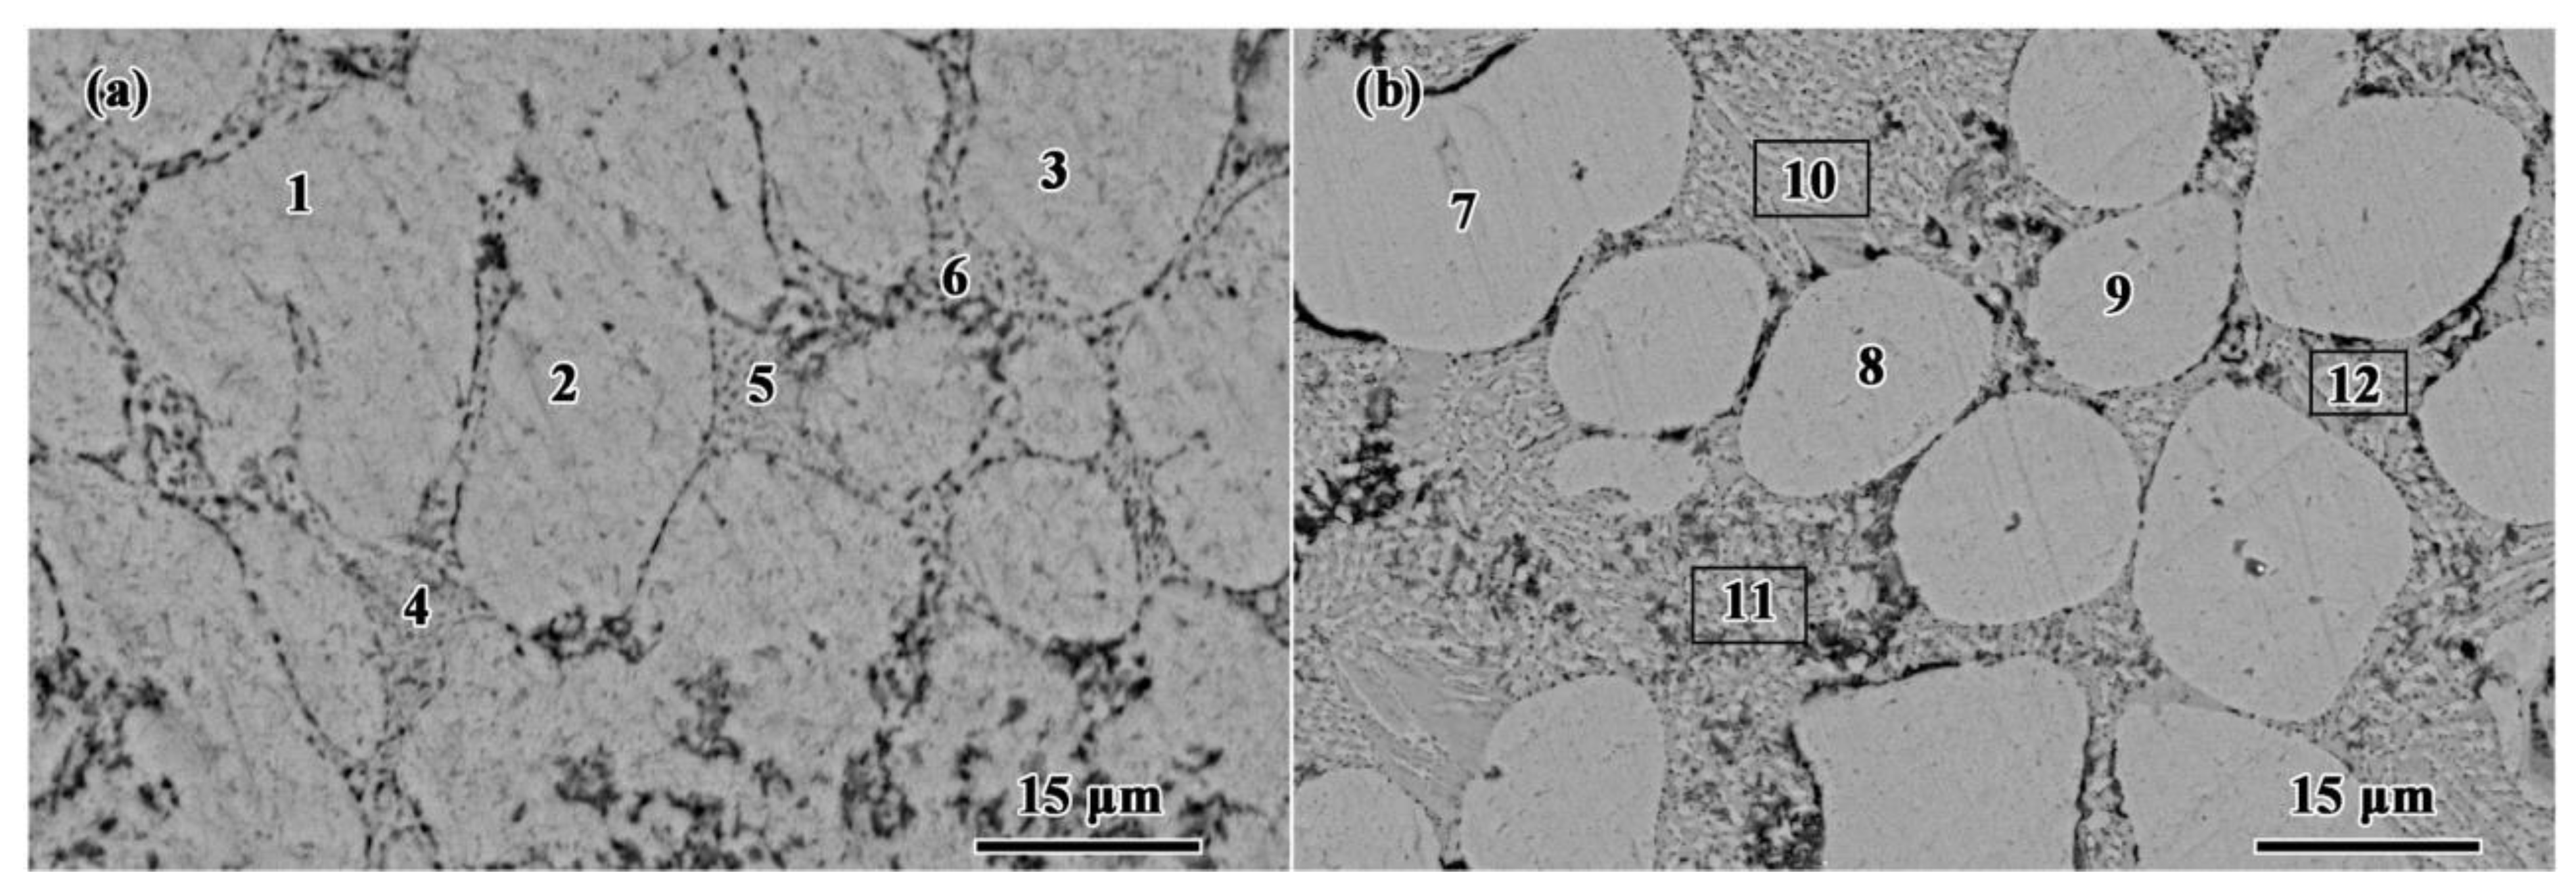
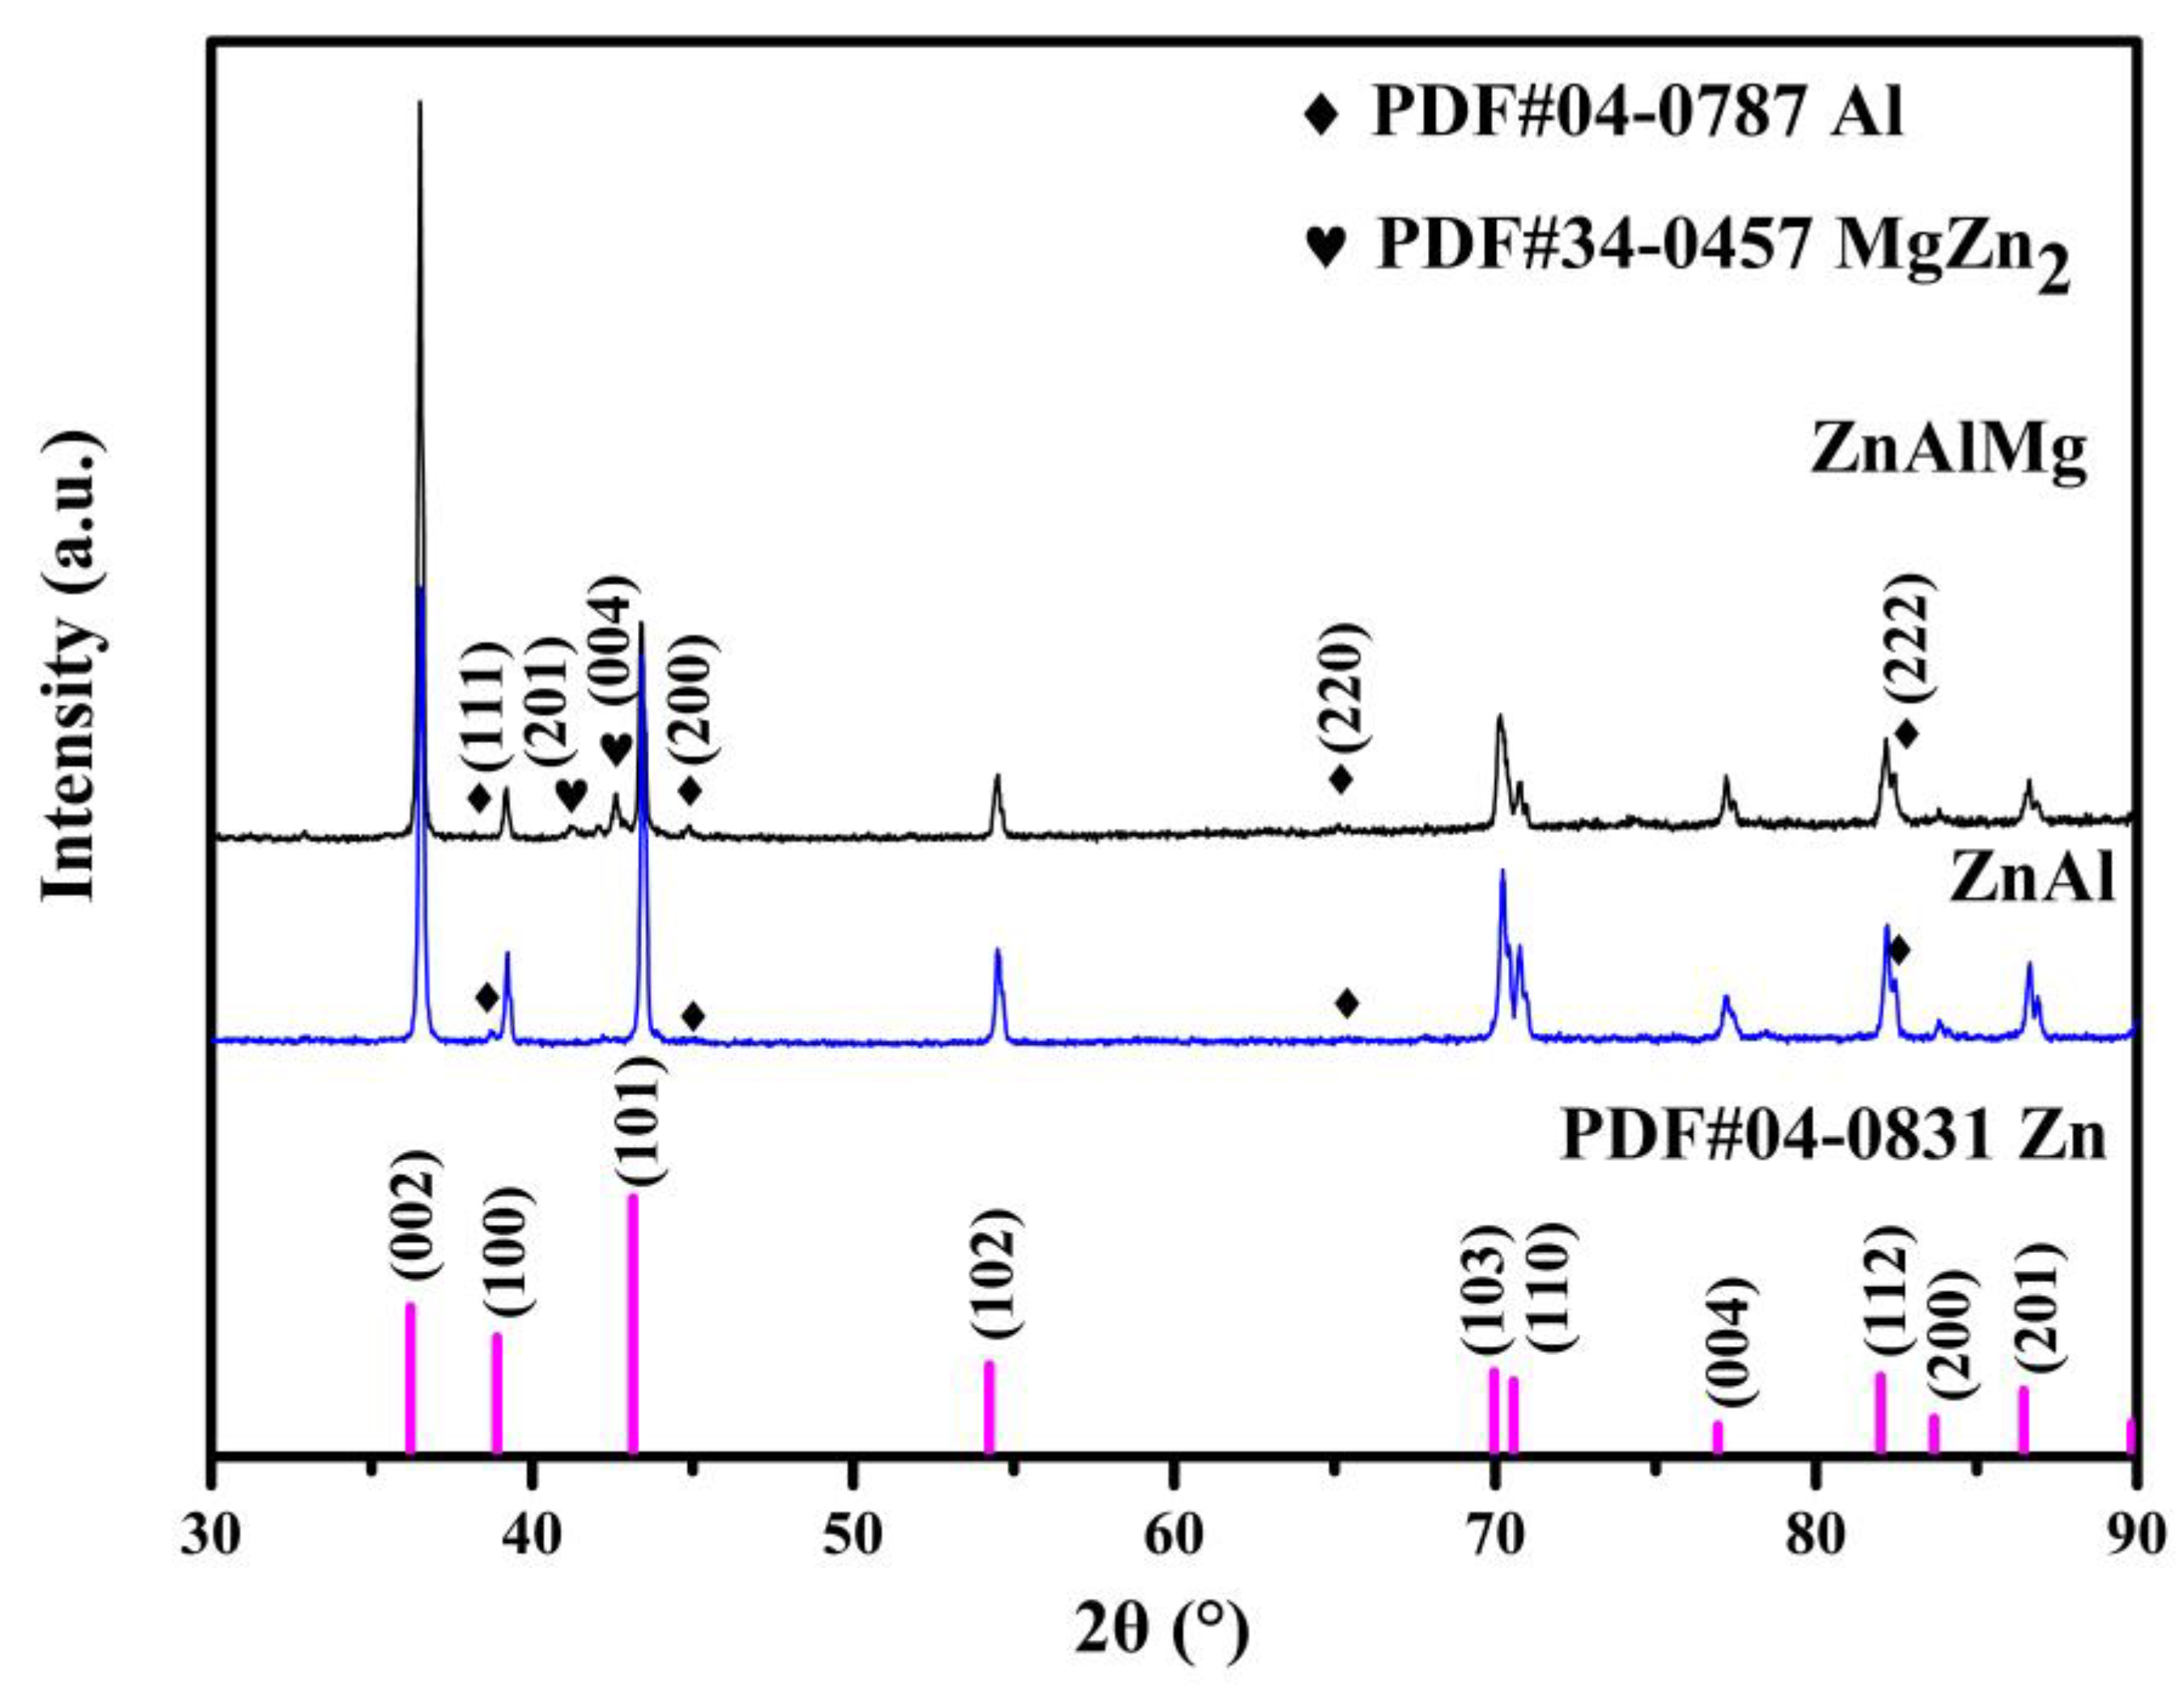
3.1. Microstructure of Coated Steel Wire before Stress Corrosion

SEM and EDS mapping images of the transverse sections of the ZnAl- and ZnAlMg-coated steel wires are presented in Figure 2. As can be seen from Figure 2, the thicknesses of the two coatings are almost identical, which is about 50 μm as measured using Nano Measurer software. Both of the coatings are composed of a light grey granular Zn-rich phase and a eutectic phase. Figure 3 shows SEM images of the ZnAl and ZnAlMg coatings. Backscattered electrons were used as an imaging signal not only to analyze the morphological features but also to qualitatively analyze the composition. The image is brighter where the atomic number is larger, such as in the Zn-rich phase (Figure 3). Table 3 shows the EDS composition at each phase of the coating. The eutectic phase of the ZnAl coatings is composed of Zn and Al elements and the eutectic phase of the ZnAlMg coatings is composed of Zn, Al, and Mg elements. Detailed content is shown in Table 3. Figure 4 shows an XRD pattern of the coated steel wire. It can be seen from Figure 4 that the diffraction peaks of the two coatings are in good agreement with the diffraction peaks of pure Zn (PDF#04-0831). Additionally, the diffraction peaks of Al (PDF#04-0787) and MgZn2 (PDF#34-0457) are marked in the XRD pattern. The diffraction peak intensity of Al and MgZn2 is weak because the contents of Mg and Al are low. According to the above results and the literature [29], it can be inferred that the eutectic phase of the ZnAl coating is β-Al/η-Zn and binary eutectic. The ZnAlMg coating is composed of a granular Zn-rich phase and fine dispersive Zn/Al/MgZn2 ternary eutectic phase around it [30].

3.2. Stress Corrosion Test

Figure 5 compares the stress corrosion fracture time of the coated steel wire with that of the corresponding steel wire substrate. Under the same test conditions, the fracture time of the steel wire substrate (stripped ZnAlMg) was shorter than that of steel wire substrate (stripped ZnAl), which was mainly due to the different composition (Table 1). At an applied load of 70%Fmax, the fracture times the of ZnAl- and ZnAlMg-coated steel wires were 6.8 and 11.5 times that of the corresponding steel wire substrate, respectively. Under the applied load of 80%Fmax, the fracture times of the ZnAl- and ZnAlMg-coated steel wires were 5.6 and 10 times that of the corresponding steel wire substrate, respectively. This indicates that both the ZnAl and ZnAlMg coatings show significant protective effects on the steel wire substrate. Hence, the protection of the coating plays a dominant role in the stress corrosion process compared with hydrogen charging. Moreover, when the metric is the multiplication factor on the steel wire substrate’s life, the ZnAlMg coating has a stronger protective effect on the steel wire substrate than the ZnAl coating under two different applied stress levels. Furthermore, as the applied stress increases, the protective effect of the coating slightly decreases. This may be due to the stress accelerating the crack propagation in the coating. To sum up, the stress corrosion fracture time of the coated steel wire is related to the corrosion resistance of the coating, the quality of the steel wire substrate, and the applied load.
Figure 6 shows the fracture surface and side appearance of the steel wire substrate after stress corrosion cracking. There is no necking in the fracture, and it is a brittle fracture caused by hydrogen embrittlement from a macroscopic view. The angle between the crack propagation direction and the applied stress direction is approximately 45°, which can be explained by the hydrogen-enhanced layered pearlite shear fracture model [31]. The main crack in the overload fracture zone is almost perpendicular to the applied stress direction, which indicates that the fracture velocity is extremely fast at this time. Figure 7 presents the fracture surface and side appearance of coated steel wire after stress corrosion cracking. The fracture macroscopic morphology of the coated steel wire is similar to that of the steel wire substrate, indicating that the coating does not affect the fracture mechanism of the steel wire. Partial exfoliation of the coating can be observed on the side of the fracture of the coated steel wire, indicating that the coating would preferentially corrode. For comparison with stress corrosion cracking, we carried out tensile tests on the steel wire substrate in the air. As shown in Figure 8, the tensile fracture of the steel wire substrate has significant necking, with a surface shrinkage rate of about 40%.
Figure 9 shows the SEM images and corresponding EDS element mapping of the coated steel wire after 48 h of stress corrosion. In Figure 9a, it can be seen that the corrosion product layer is formed on the surface of the steel wire substrate. The corrosion product layer is composed of Fe, Zn, Al, S, and O elements. The effect of adding Mg to the ZnAl alloy coating is mainly to inhibit the formation of soluble or porous corrosion products. Due to the low Mg content, which is almost undetectable, only the distribution of Zn and Al elements is shown in Figure 9b. As shown in Figure 9b, after stress corrosion, the O in the solution is easy to enrich in the Al-rich region, while the S element is easy to enrich in the Zn-rich region, and it is speculated that the corrosion products are composed of Al2O3 and ZnS. Compared with ZnS, Al2O3 has a denser structure and better corrosion resistance. The Al2O3 on the surface of ZnAlMg-coated steel wire is more complete, so the protection of the steel wire substrate is stronger (Figure 5). Figure 10 shows an XRD pattern of the coated steel wire after 24 h of stress corrosion. The diffraction peaks of ZnS (PDF#39-1963), Al2O3 (PDF#46-1131), and Zn (PDF#04-0831) in the XRD pattern of the ZnAl-coated steel wire demonstrate that the corrosion products are indeed composed of ZnS and Al2O3. The diffraction peak of Al (PDF#04-0787) also appears in the XRD pattern of the ZnAlMg-coated steel wire. This phenomenon may be due to the fact that the corrosion rate of the ZnAlMg coating is slower than that of the ZnAl coating, and the coating has not been completely transformed into a corrosion product layer.
According to the literature reports, the NH4SCN solution (50 °C, 20 wt.%) has the effect of soaking and charging hydrogen on steel, and the reaction equation is shown as Equation (1). In the NH4SCN solution, Fe will also undergo an anodic dissolution reaction, as shown in Equation (2). In addition, it may be accompanied by a reduction reaction of dissolved oxygen (Equation (3)) [25]. Similar to Fe, Zn and Al may dissolve in the NH4SCN solution, resulting in the reaction of Equations (4) and (5). ZnS is formed by the combination of Zn2+ and S2−. As shown in Equation (6), Al3+ combines with OH to form Al(OH)3. However, Al(OH)3 is unstable and is thermally decomposed to form Al2O3 (Equation (7)):
SCN + 2H2O + 2H + +2e→S2− + H2 + CO2 + NH4+
Fe→Fe2+ + 2e
H2O + O2 + 4e→4OH
Zn→Zn2+ + 2e
Al→Al3+ + 3e
Al3+ + 3OH⇋Al(OH)3
Al(OH)3 ≜ Al2O3 + 3H2O

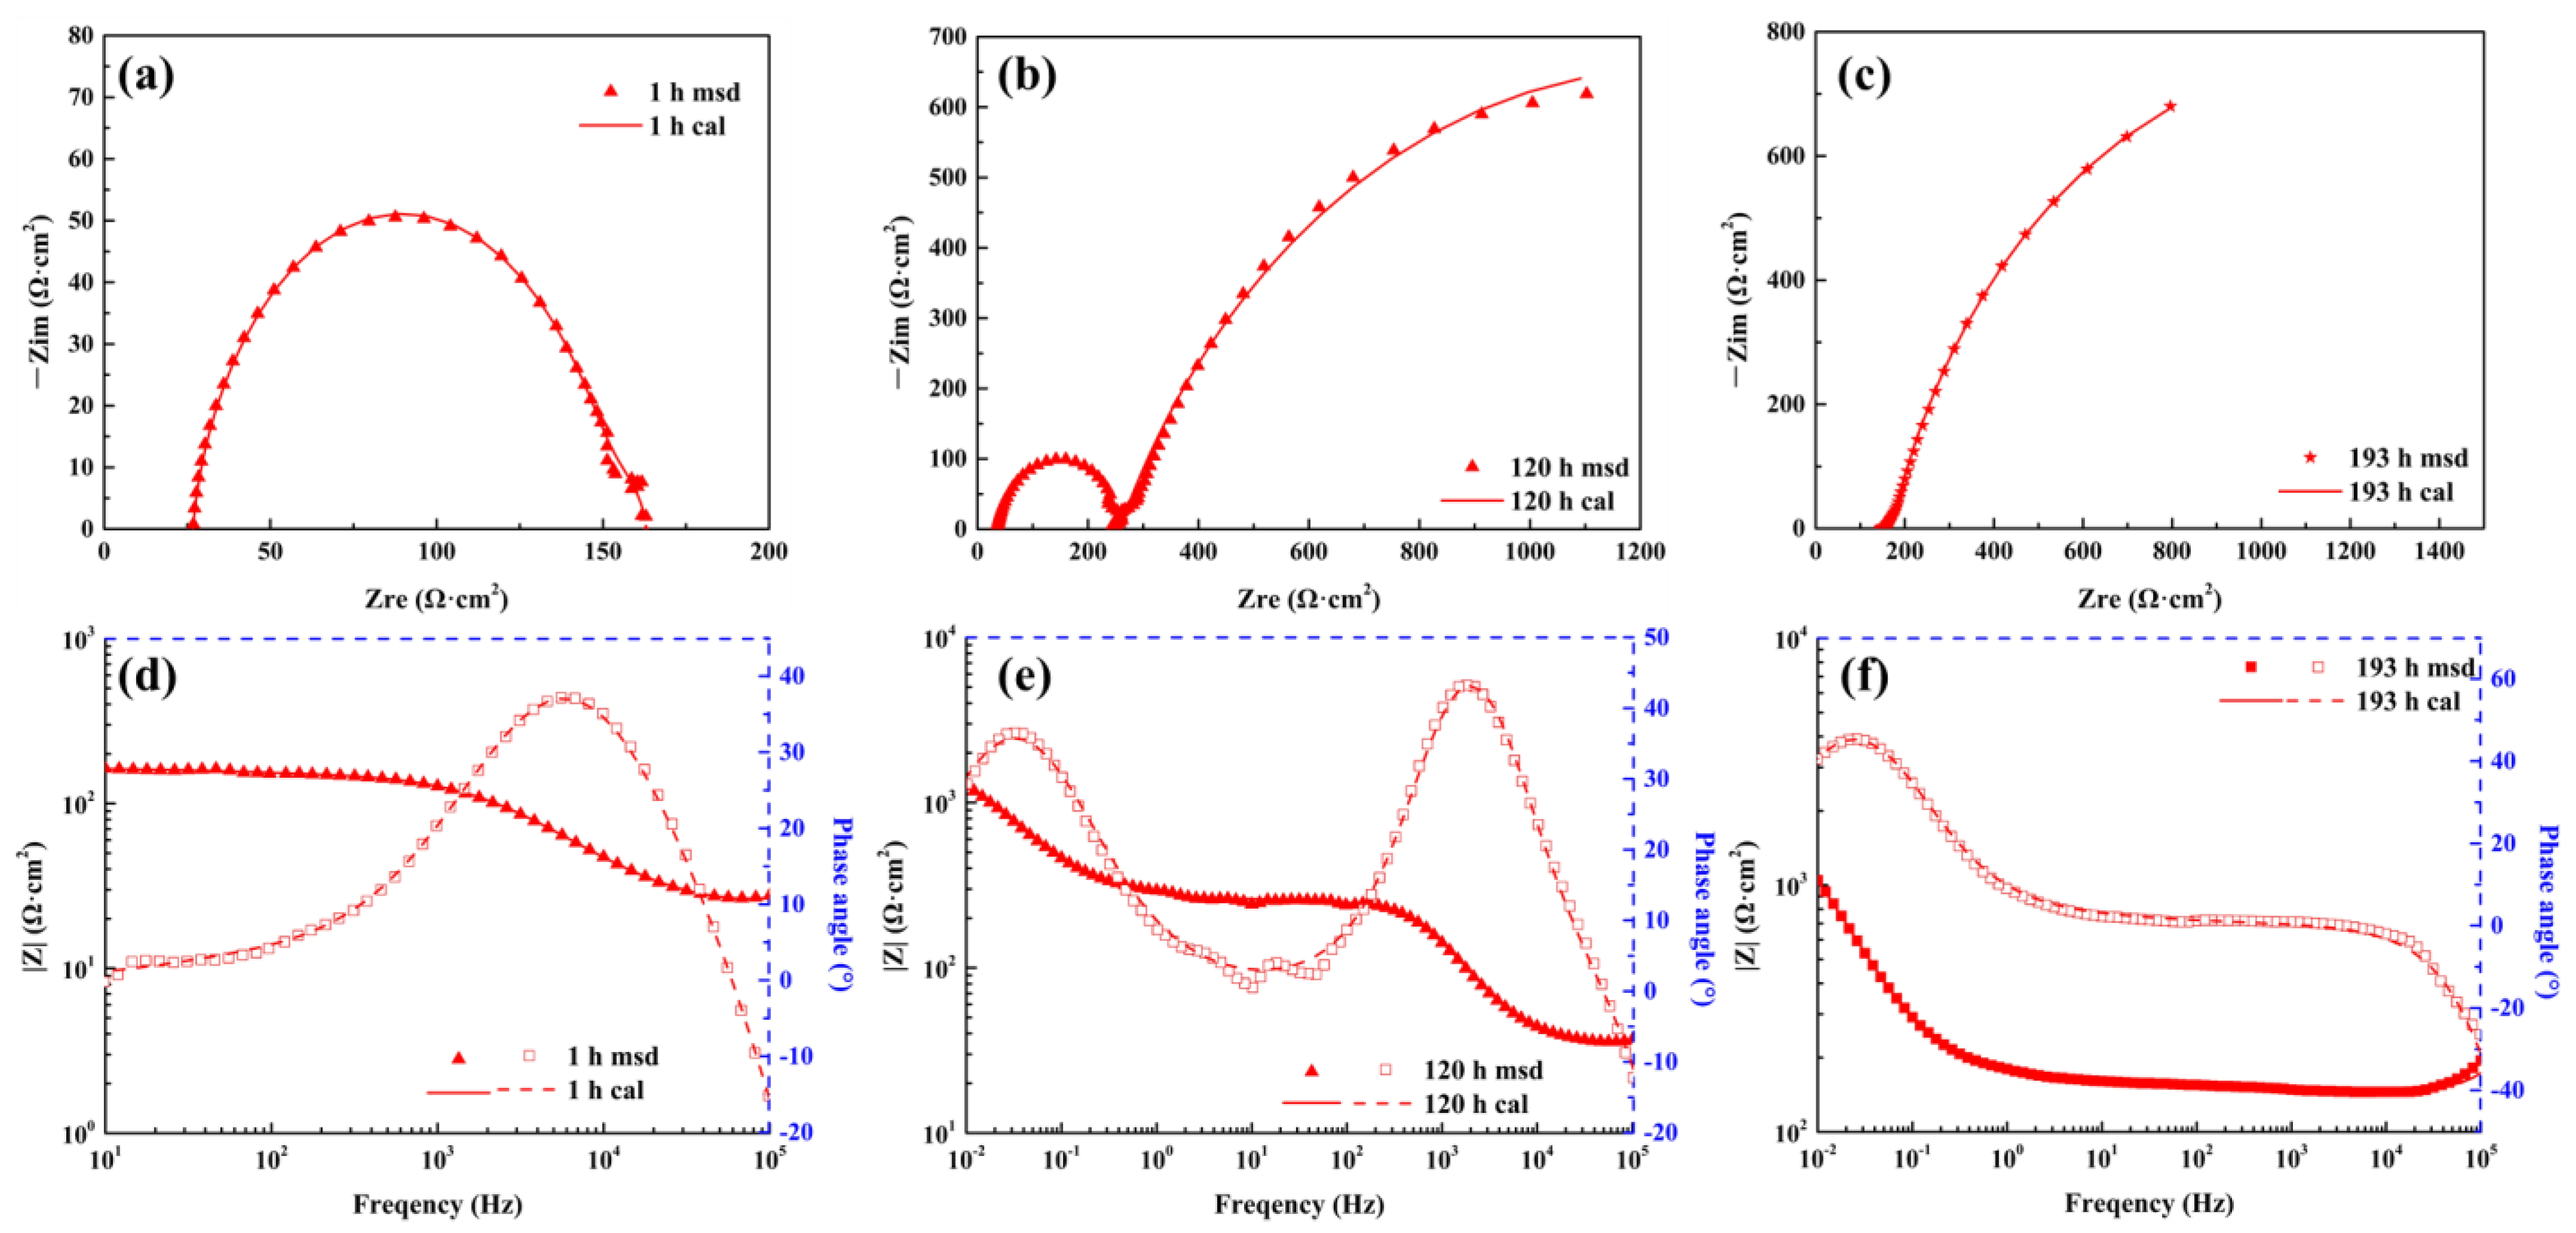
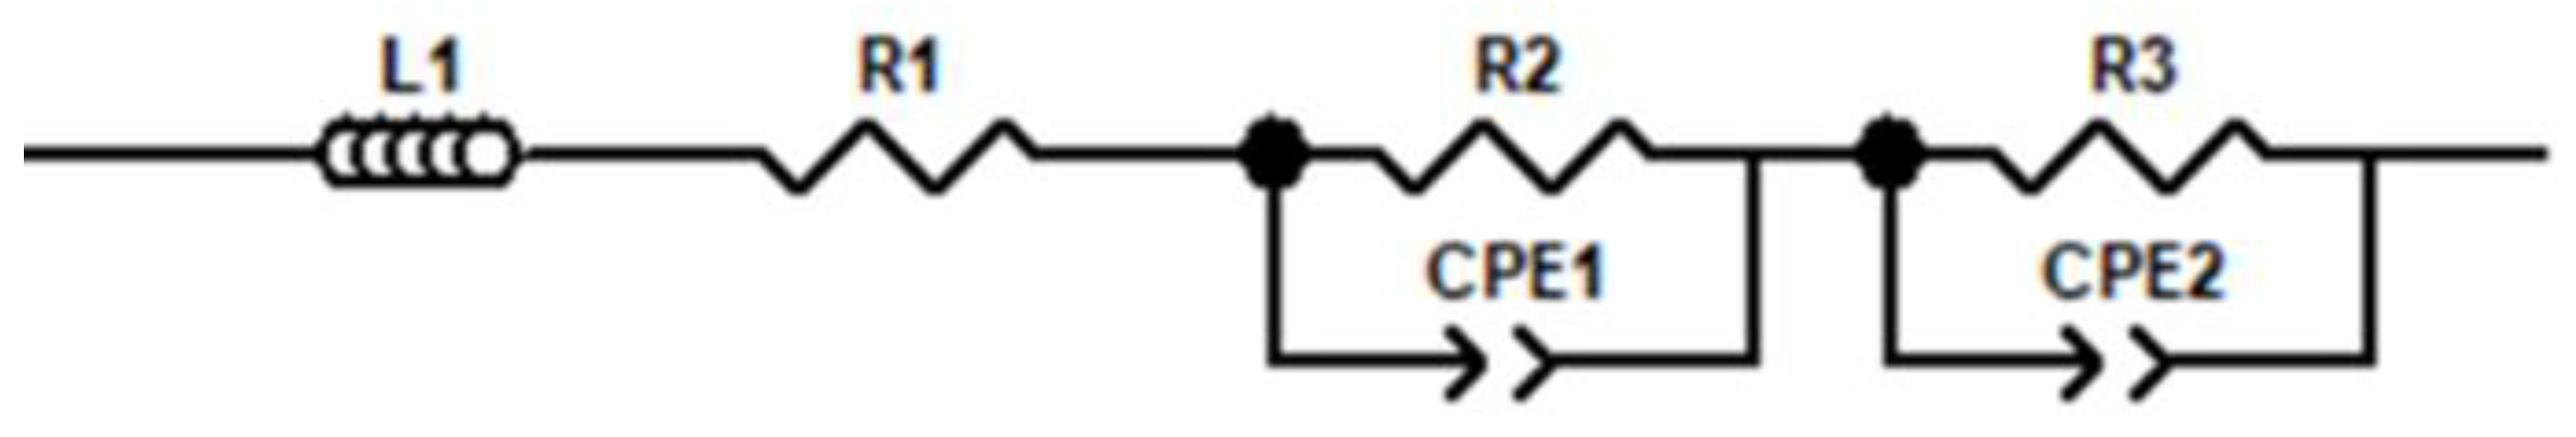
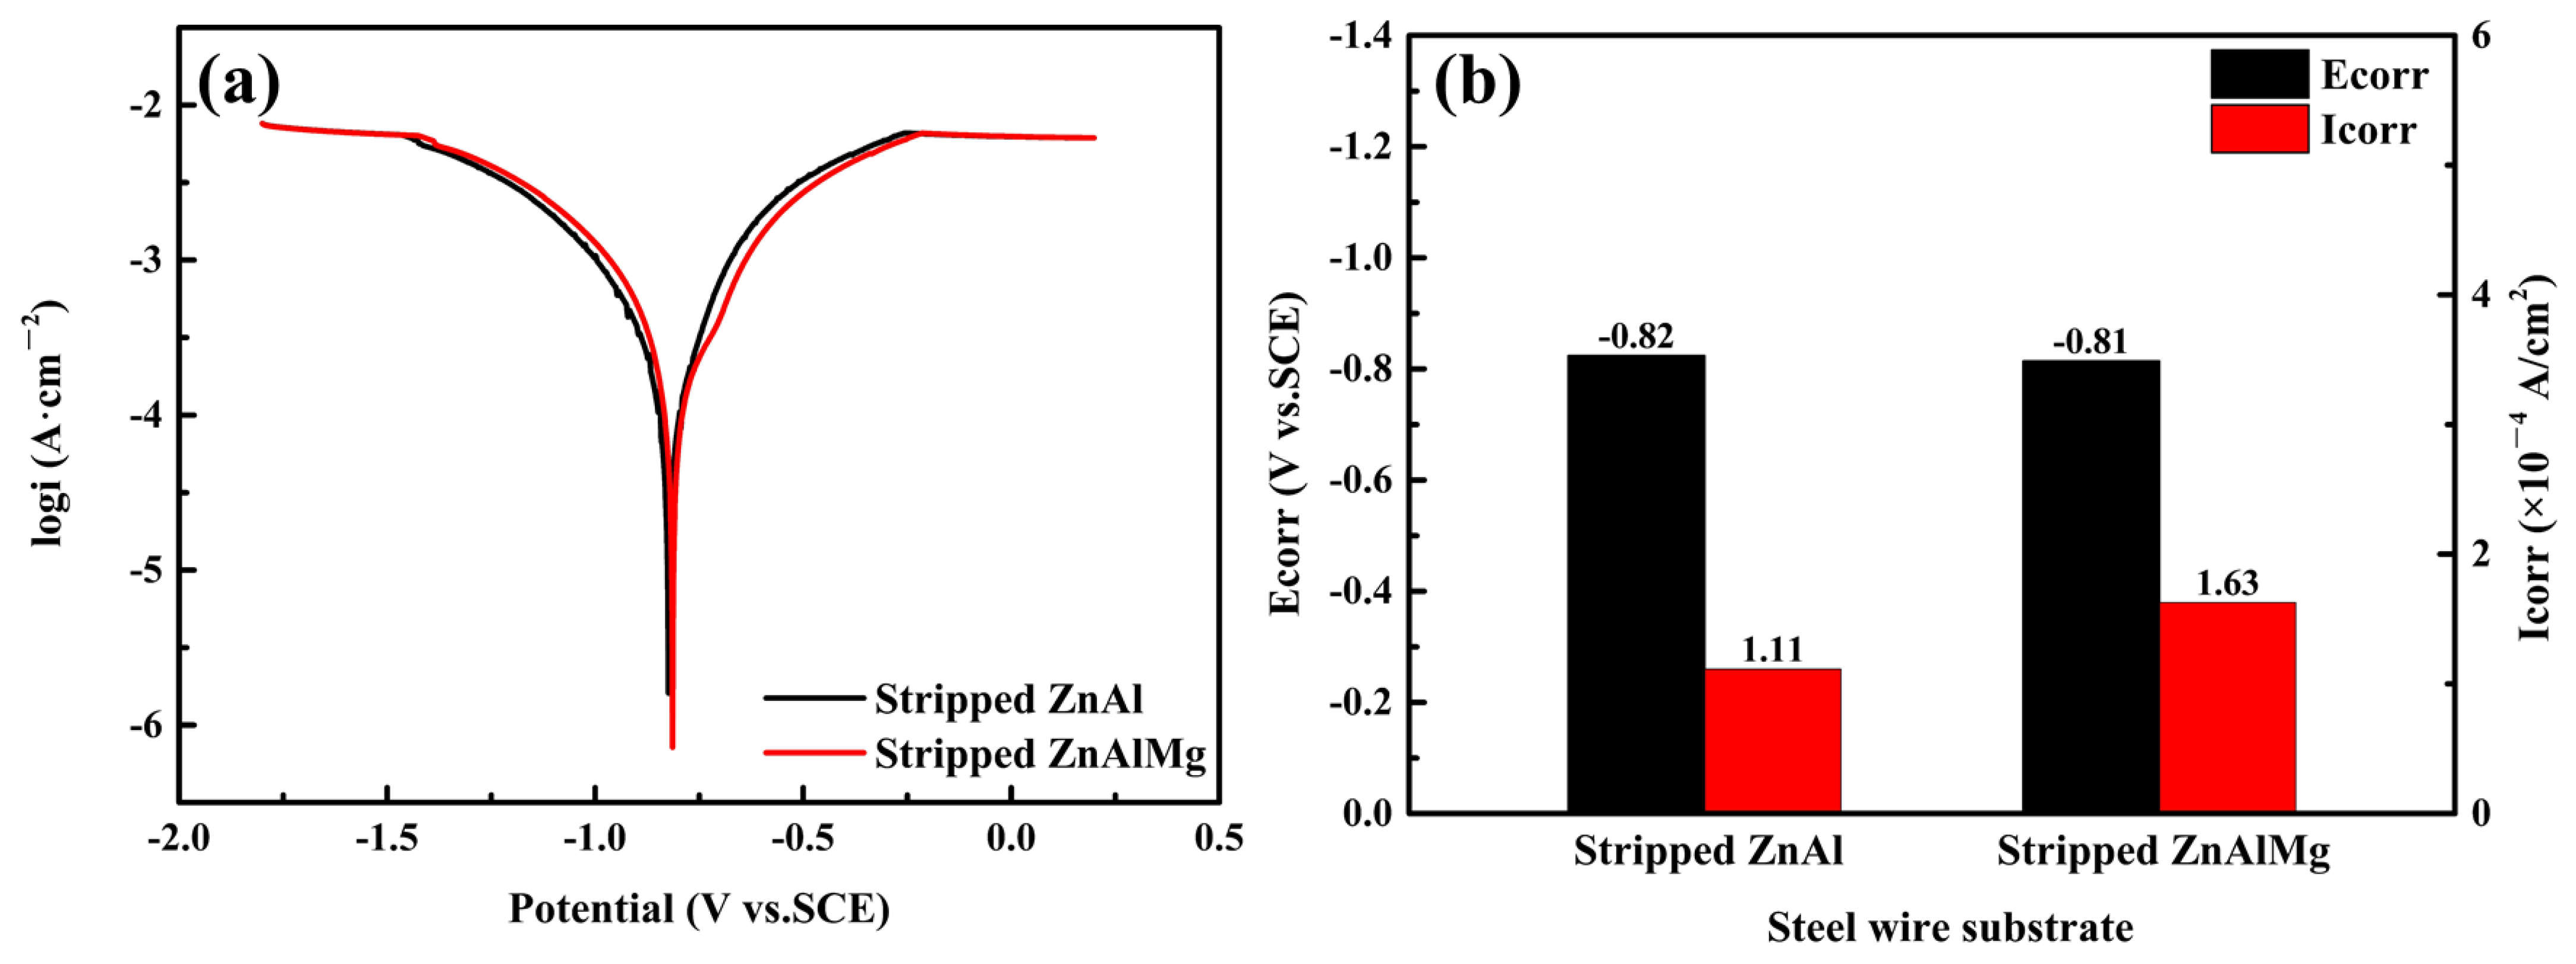
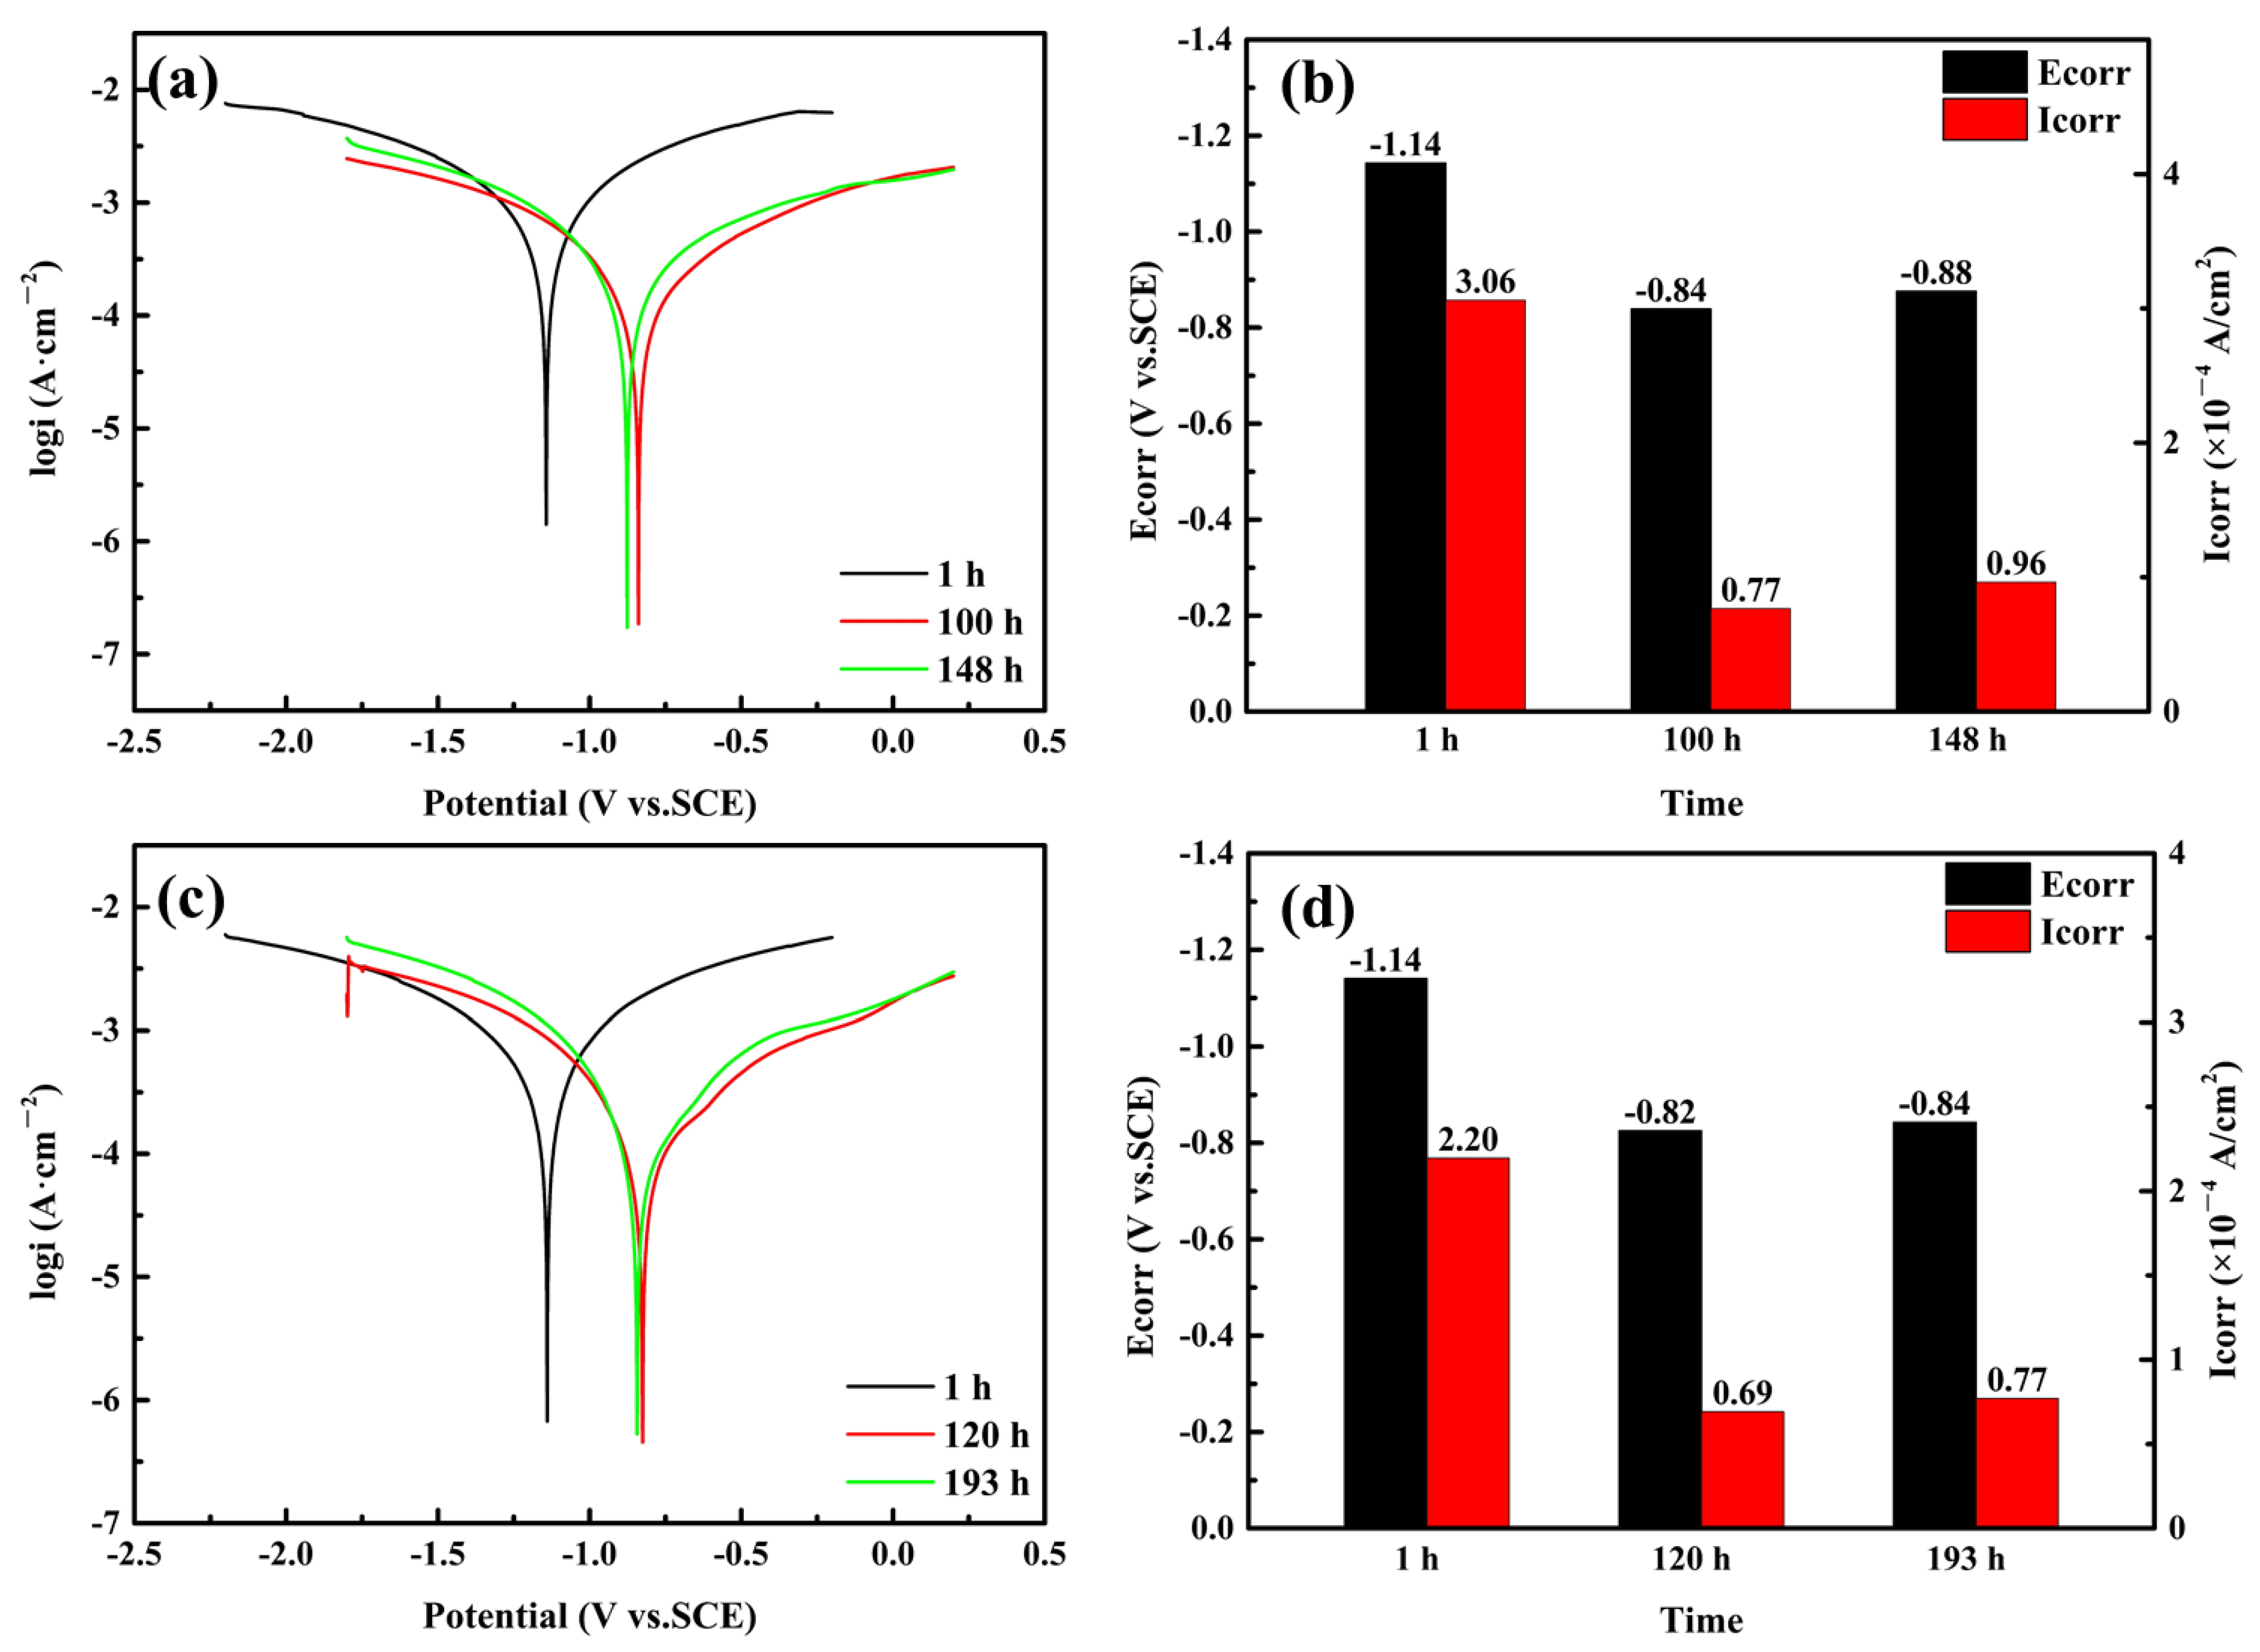
3.3. Corrosion Behavior during the Stress Corrosion Process

The fractured time of the steel wire under the applied load of 80%Fmax was too short to monitor its corrosion behavior during stress corrosion. Therefore, the applied load was 70%Fmax by default during the electrochemical testing. The evolution in corrosion resistance of the wire was continuously monitored during the electrochemical measurement. The corrosion resistance of the steel wire substrate hardly changes with time, so a set of data was selected for the analysis. However, the corrosion resistance of coated steel wire changes significantly, so the data from three representative time points were selected for the analysis. Figure 11 shows the Nyquist diagram and Bode diagram of the steel wire substrate under stress corrosion. The points represent the measured values and the lines represent the fitting values. The Nyquist diagram shows an incompletely sunken capacitive arc affected by dispersion (Figure 11a). The arc of the capacitive reactance is induced to shrink in the low-frequency region, indicating that the SCN is adsorbed on the steel surface [21].
Figure 12 shows the Nyquist and Bode diagrams of ZnAl-coated steel wire in the process of stress corrosion. Figure 13 depicts Nyquist and Bode diagrams of the ZnAlMg-coated steel wire in the process of stress corrosion. The Bode diagram of the ZnAlMg-coated steel wire is different from that of the ZnAl-coated steel wire at the initial stage of stress corrosion due to the different coating types. The EIS of the ZnAlMg-coated steel wire is typical, so the stress corrosion process of ZnAlMg-coated steel wire is analyzed as an example. The stress corrosion process of coated steel wire can be divided into three stages: the initial stress corrosion stage, the corrosion inhibition stage, and the substrate corrosion stage. In the initial stress corrosion stage, the coating was relatively complete and the peak phase angle was located in the high-frequency region (Figure 13d). During the corrosion inhibition period, two semi-circles appeared in the Nyquist diagram (Figure 13b) and peak phase angles appeared in both the high-frequency and low-frequency regions of the Bode diagram (Figure 13e), indicating two time constants. Similar to Figure 11b, the peak value of the phase angle in Figure 13f only appeared in the low-frequency region, indicating that the crack reached the steel wire substrate at this time.
In order to further analyze the EIS in Figure 11, Figure 12 and Figure 13, an electrical equivalent circuit model was used to fit the original data. Figure 14 presents the electrical equivalent circuit diagram, and the circuit description code is LR(QR)(QR). In Figure 14, L1 represents the inductance, R1 represents the resistance of the solution, R2 represents the resistance of the corrosion product film, and R3 represents the charge transfer resistance. Due to the heterogeneity of the surface film, a constant phase element (CPE) is used to represent the non-ideal capacitance responses of the interface. CPE1 (Q1) represents the interface of the corrosion product and CPE2 (Q2) represents the interface between the corrosion product and the coating surface [22].
The expression of ZCPE is shown in Equation (8):
ZCPE = {Y0(jw)n}−1
where Y0 is the admittance magnitude of CPE, j is the imaginary number (j2 = −1), w is the angular frequency, and n is the exponent (−1 < n < 1). When the n values are close to 1, the CPE will approach an ideal capacitance [21].
Table 4 and Table 5 list the specific values of the electrochemical impedance fitting parameters of the steel wire substrate and coated steel wire. As can be seen from Table 5, the R2 value of the coated steel wire firstly increases and then decreases with the extension of time, indicating that the corrosion rate is faster in the initial stage of corrosion. The subsequent corrosion product film can inhibit the corrosion process and increase the R2 value. However, with the extension of time, the corrosion product film is gradually destroyed, and R2 decreases at this time.
Figure 15a shows the potentiodynamic polarization curve of the steel wire substrate. In Figure 15b, the corrosion potential (Ecorr) and corrosion current density (Icorr) values were taken from the polarization curve in Figure 15a. Figure 16a,b exhibit the polarization curve and corresponding Ecorr and Icorr values of the ZnAl-coated steel wire. Figure 16c,d depict the polarization curve and corresponding Ecorr and Icorr values of the ZnAlMg-coated steel wire. The corrosion potential of the ZnAl- and ZnAlMg-coated steel wires at the initial corrosion stage is −1.14V. The corrosion potentials are lower than −1000 mV/SCE, which indicates a hydrogen evolution process taking place on the surface of the coated steel wires [32,33]. However, Yao et al. [7] found that the rational range of protection voltages is between −1.130 V and −1.150 V. Therefore, both the corrosion development and hydrogen embrittlement of the steel wire substrates were inhibited within this range [7]. Taking the ZnAlMg-coated steel wire as an example, the Ecorr value of the coated steel wire (−1.14 V) is lower than that of the steel wire substrate (−0.81 V), and the Icorr value (2.20 × 10⁻⁴ A/cm2) is higher than that of the steel wire substrate (1.63 × 10⁻⁴ A/cm2) at the initial stage of stress corrosion. The ZnAl-coated steel wire also showed the same trend. The first step of the crack initiation under stress corrosion conditions for the coated steel wire is local corrosion of the outermost coatings [34]. The hot-dip alloy coating on the surface of the steel wire has two functions: coating material protection and electrochemical protection. The purpose of the coating material protection is to isolate the steel wire substrate from the corrosive environment, so as to play a shielding protection role. The purpose of the electrochemical protection is to hot-dip the active metal material on the surface of the steel wire substrate so that the coating is preferentially corroded [7]. After the coating is completely corroded, the steel wire substrate begins to corrode locally, which can extend the service life of the steel wire substrate. In the corrosion inhibition stage, the value of Icorr descended from 2.20 × 10⁻⁴ A/cm2 to 0.69 × 10⁻⁴ A/cm2 and Ecorr increased from −1.14 V to −0.82 V. In this stage, a dense corrosion product film may be formed on the surface of the steel wire substrate, reducing the corrosion tendency and corrosion rate. In the substrate corrosion stage, the Ecorr value decreased from −0.82 V to −0.84 V and Icorr increased from 0.69 × 10⁻⁴ A/cm2 to 0.77 × 10⁻⁴ A/cm2. This indicates that cracks may appear in the corrosion product film at this time, and the corrosion liquid penetrates into the steel wire substrate through the cracks, which increases the corrosion tendency and corrosion rate. The corrosion current density of the ZnAlMg-coated steel wire (2.20 × 10⁻⁴ A/cm2) is lower than that of the ZnAl-coated steel wire (3.06 × 10⁻⁴ A/cm2), indicating that ZnAlMg-coated steel wire has better corrosion resistance. Therefore, the protective effect of the ZnAlMg coating on the steel wire substrate is stronger and the stress corrosion fracture time of the steel wire substrate can be prolonged significantly (Figure 5).

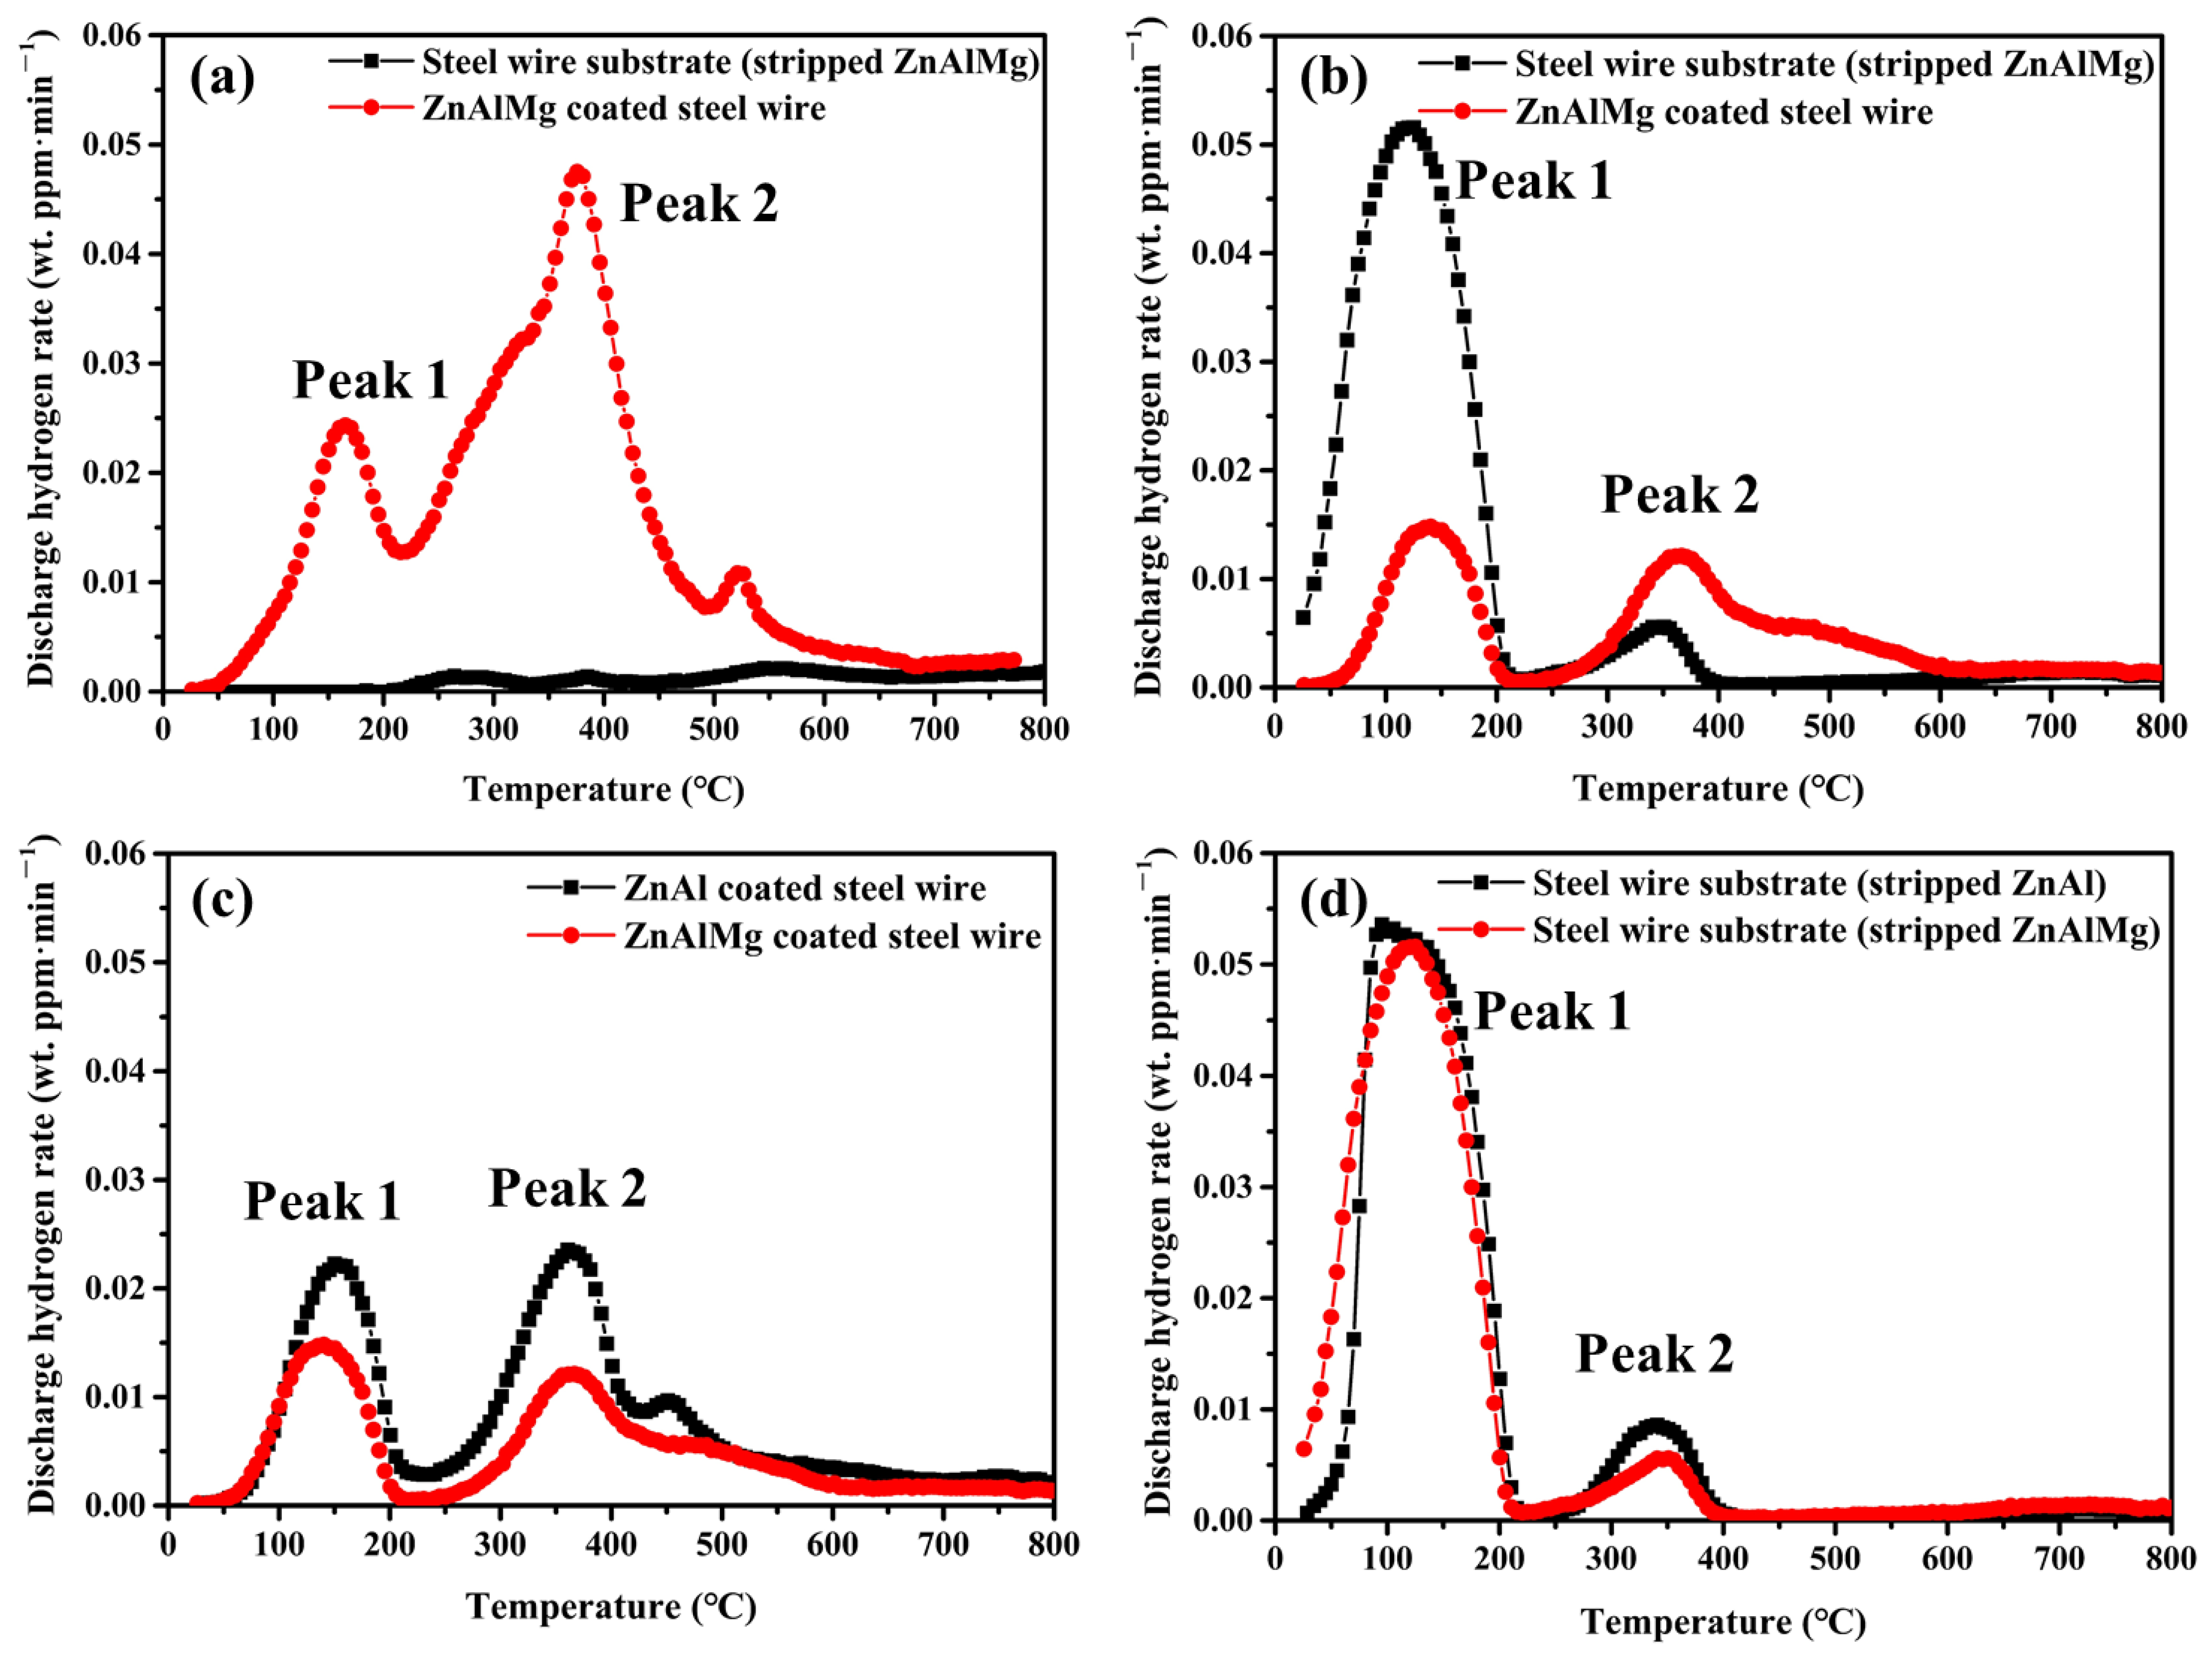
3.4. Thermal Desorption Analysis (TDA)

Due to the differences in the test samples and test methods, the test results were different from those reported in the literature [5]. A thermal desorption analysis (TDA) is widely used to measure the diffused hydrogen content [25,35]. Figure 17 shows the thermal desorption analysis profiles of hydrogen. The hydrogen content in the sample before charging the hydrogen is shown in Figure 17a. Surprisingly, the hydrogen content of the ZnAlMg-coated steel wire itself is very high, and the hydrogen content decreases after removing the coating. This suggests that the coating could be a hydrogen trap. The phenomenon is explained in the literature, whereby the Zn coating acts as a barrier against hydrogen penetration and diffusion, retaining the hydrogen in its crystal structure due to the interstitial spaces in the hexagonal Zn lattice [32,36]. The ZnAlMg alloy coating has a large Zn-rich phase, so the above rules are also applicable to this scenario. In addition, the low hydrogen content in the steel wire substrate indicates that with the method of removing the coating by HCl pickling, it is difficult to introduce a large amount of hydrogen into the steel wire substrate. The hydrogen content in the sample after being hydrogen-charged for 24 h is shown in Figure 17b–d. It is reported that the peak 2 hydrogen, desorbed at temperatures above 200 °C as determined by the TDA, had no significant effect on the hydrogen embrittlement susceptibility [24]. In contrast, the hydrogen embrittlement susceptibility increased in the presence of the peak 1 hydrogen, desorbed from room temperature to 200 °C. Compared with before hydrogen charging, the content of peak 1 hydrogen in the ZnAlMg-coated steel wire decreased after the hydrogen was charged for 24 h (Figure 17a,b). This may have been due to the release of hydrogen after the conversion of the Zn-rich phase to ZnS (Figure 9b and Figure 10). As shown in Figure 17b, the content of peak 1 hydrogen in the ZnAlMg-coated steel wire is much lower than that in the steel wire substrate. This suggests that the corrosion product layer may act as a barrier to the penetration of atomic hydrogen into the steel. Therefore, the fracture time of the ZnAlMg-coated steel wire is significantly longer than that of the steel wire substrate (Figure 5). As depicted in Figure 17c, the content of peak 1 hydrogen in the ZnAlMg-coated steel wire is slightly lower than that in the ZnAl-coated steel wire. Therefore, the protective effect of the ZnAlMg coating on the steel wire substrate is better than that of the ZnAl coating (Figure 5). The hydrogen contents of the steel wire substrates after hydrogen charging for 24 h were compared. The results showed that the hydrogen embrittlement sensitivity levels of the steel wire substrates are almost the same (Figure 17d). However, the corrosion resistance test showed that the corrosion resistance of the steel wire substrate with stripped ZnAlMg is worse than that of the steel wire substrate with stripped ZnAl. In summary, the stress corrosion fracture time is related to both the hydrogen embrittlement sensitivity and corrosion resistance.

4. Conclusions

The effects of ZnAl and ZnAlMg coatings on the stress corrosion performance of bridge cable steel wire was studied using an FIP test and the fracture morphology was characterized. The corrosion products of the coated steel wires in NH4SCN solution (50 °C, 20 wt.%) were analyzed by SEM and XRD. The corrosion resistance of the steel wires was measured using the electrochemical technique. The hydrogen content and states were analyzed using a TDA. The conclusions are as follows:
(1)
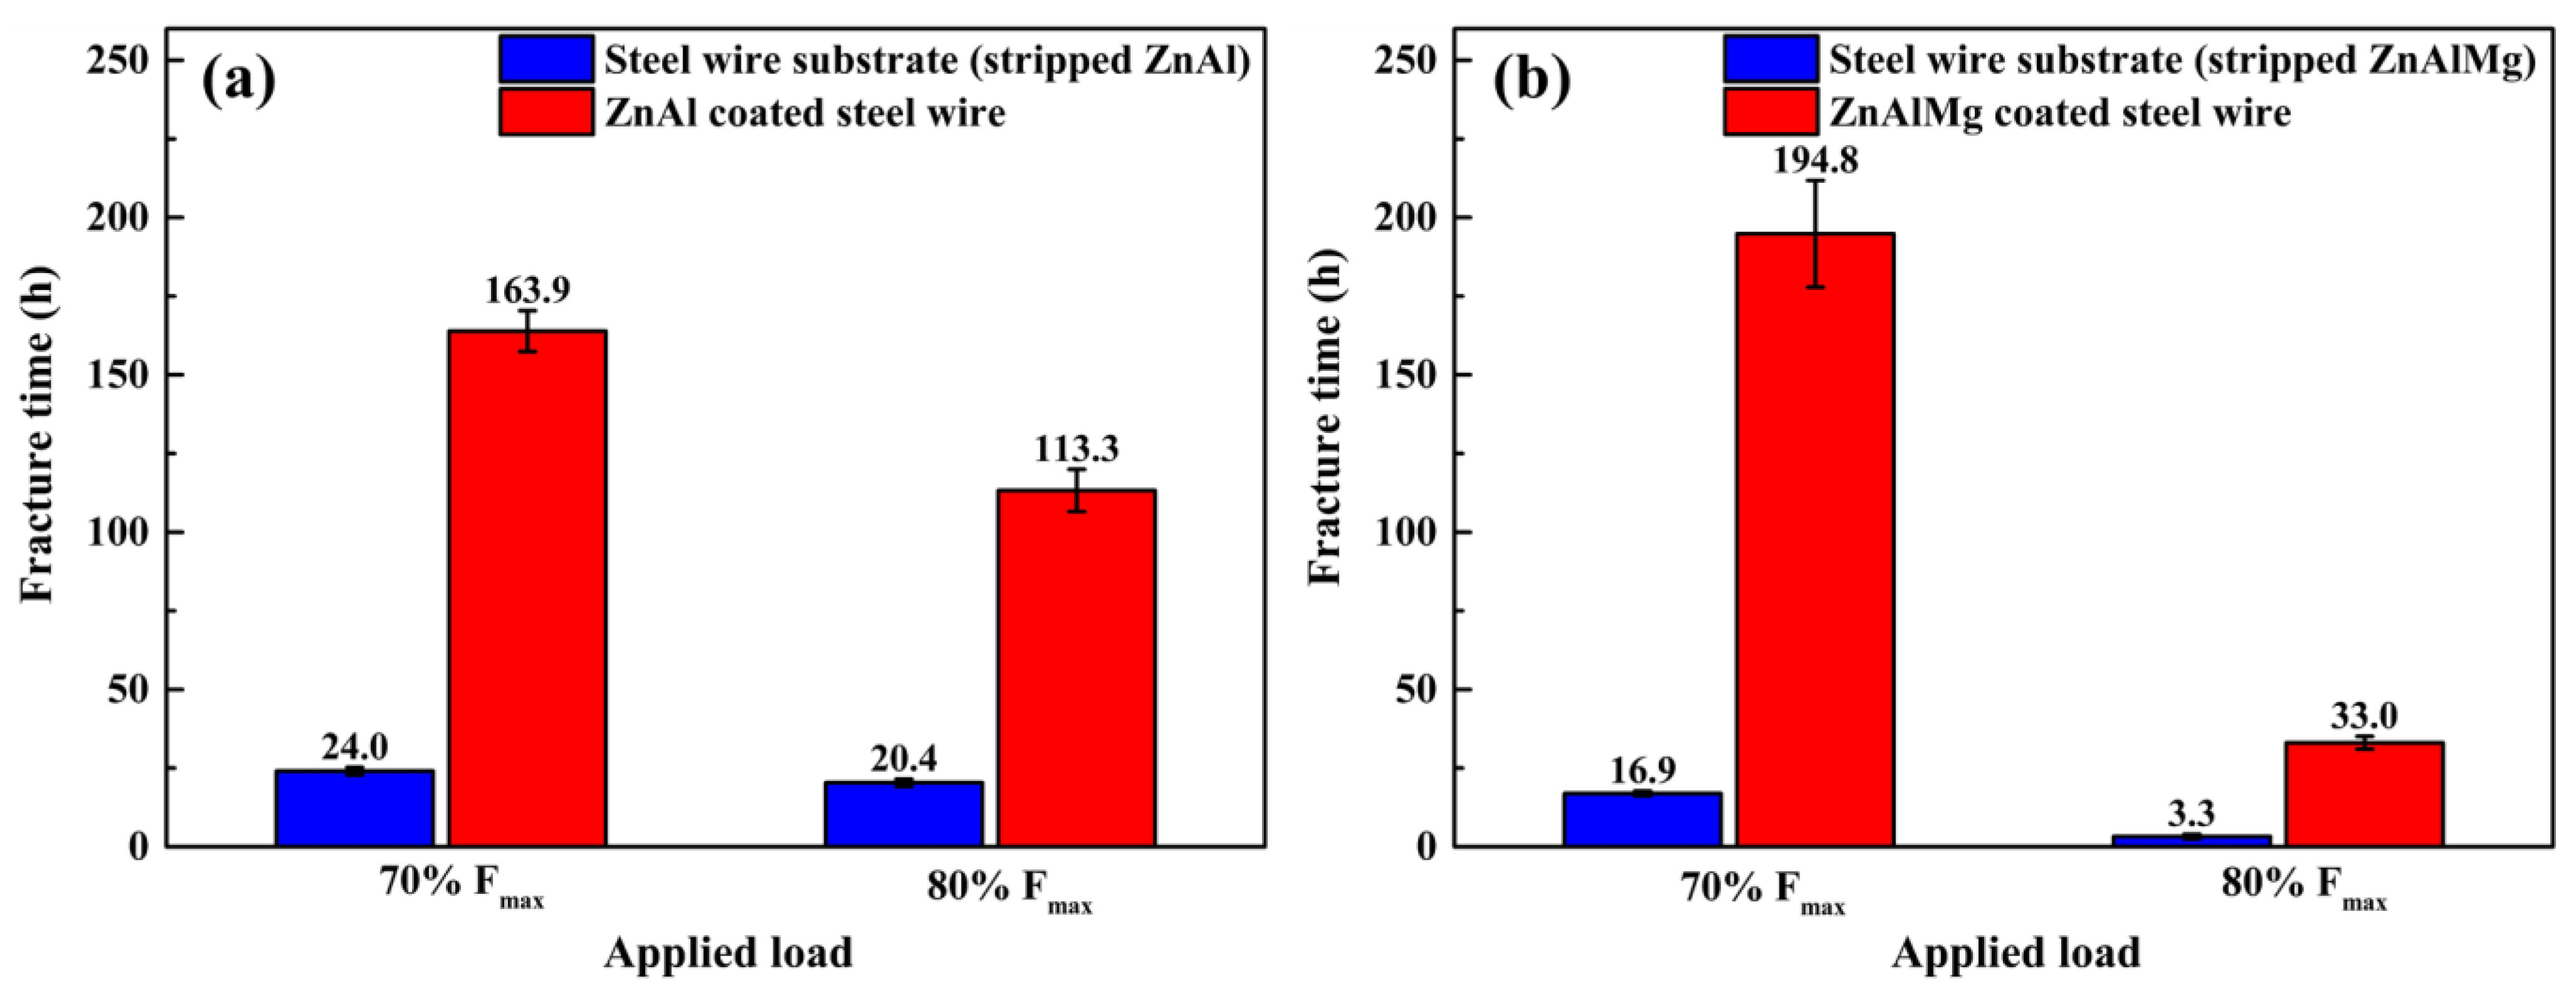
The stress corrosion fracture time of coated steel wire is related to the corrosion resistance of the coating, the quality of the steel wire substrate, and the applied load. At an applied load of 70%Fmax, the fracture times of the ZnAl- and ZnAlMg-coated steel wires were 6.8 and 11.5 times that of the steel wire substrate, respectively. Under the applied load of 80%Fmax, the fracture times of the ZnAl- and ZnAlMg-coated steel wires were 5.6 and 10 times that of steel wire substrate, respectively;
(2)
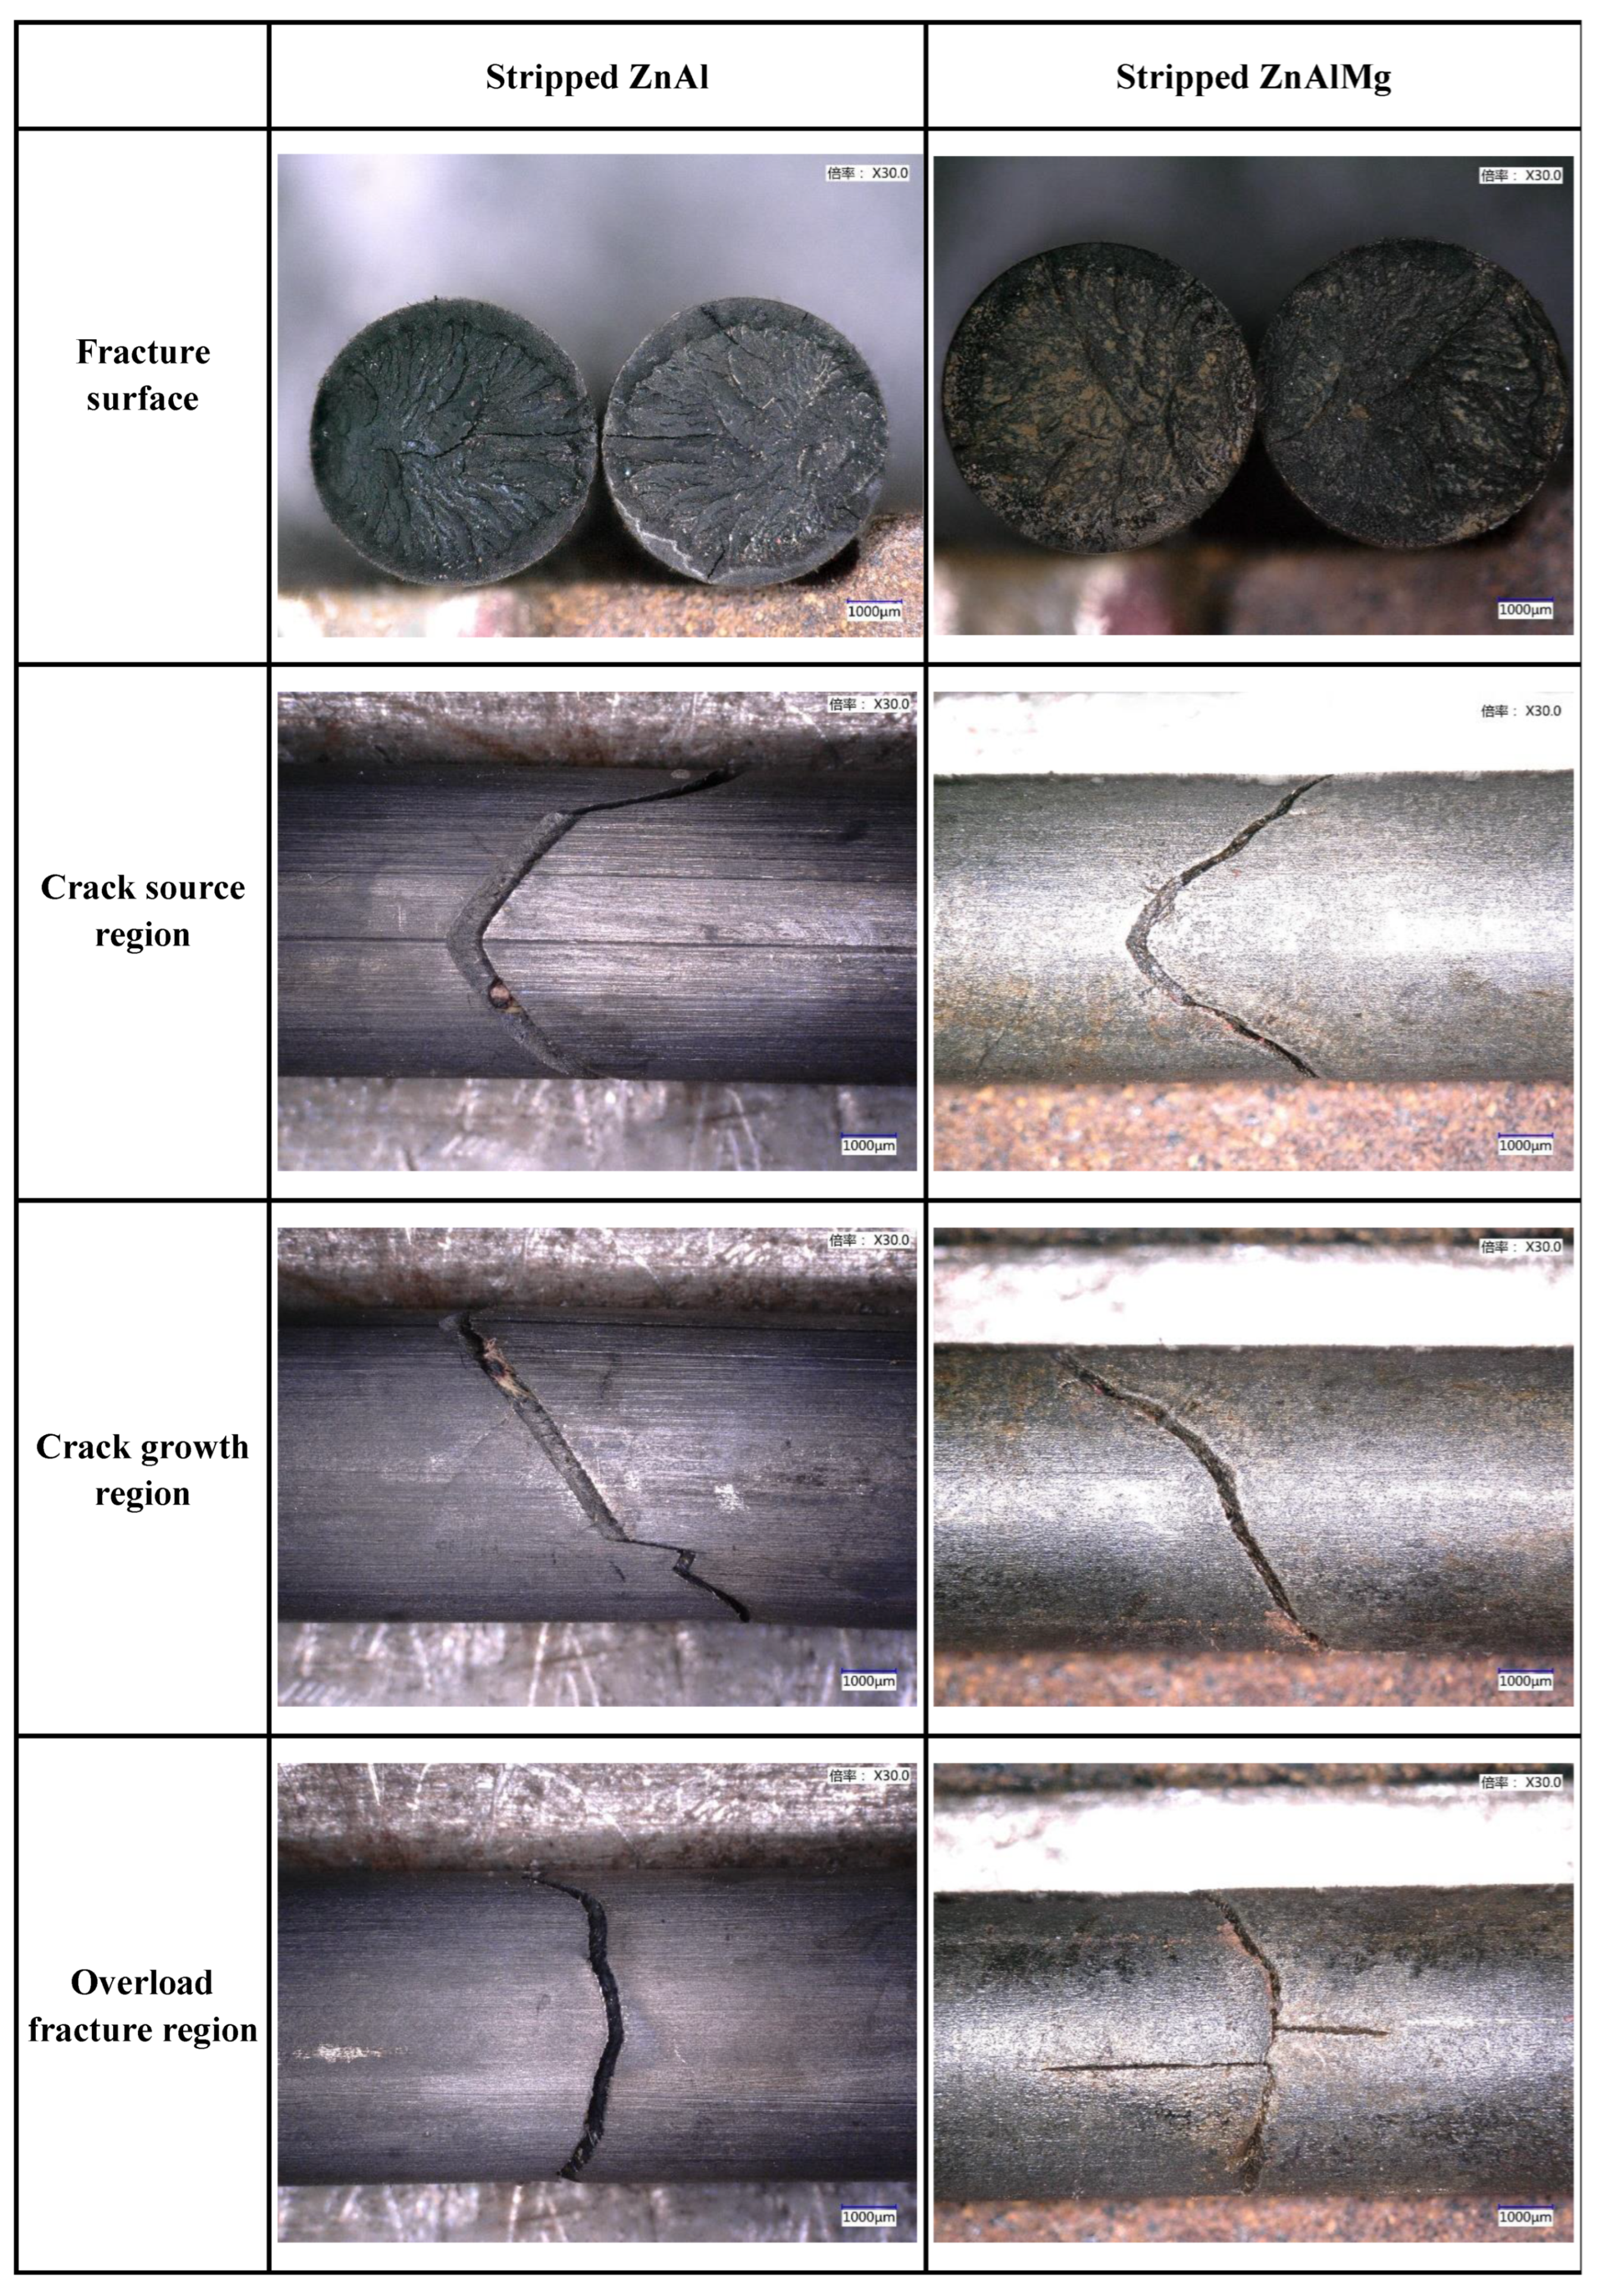
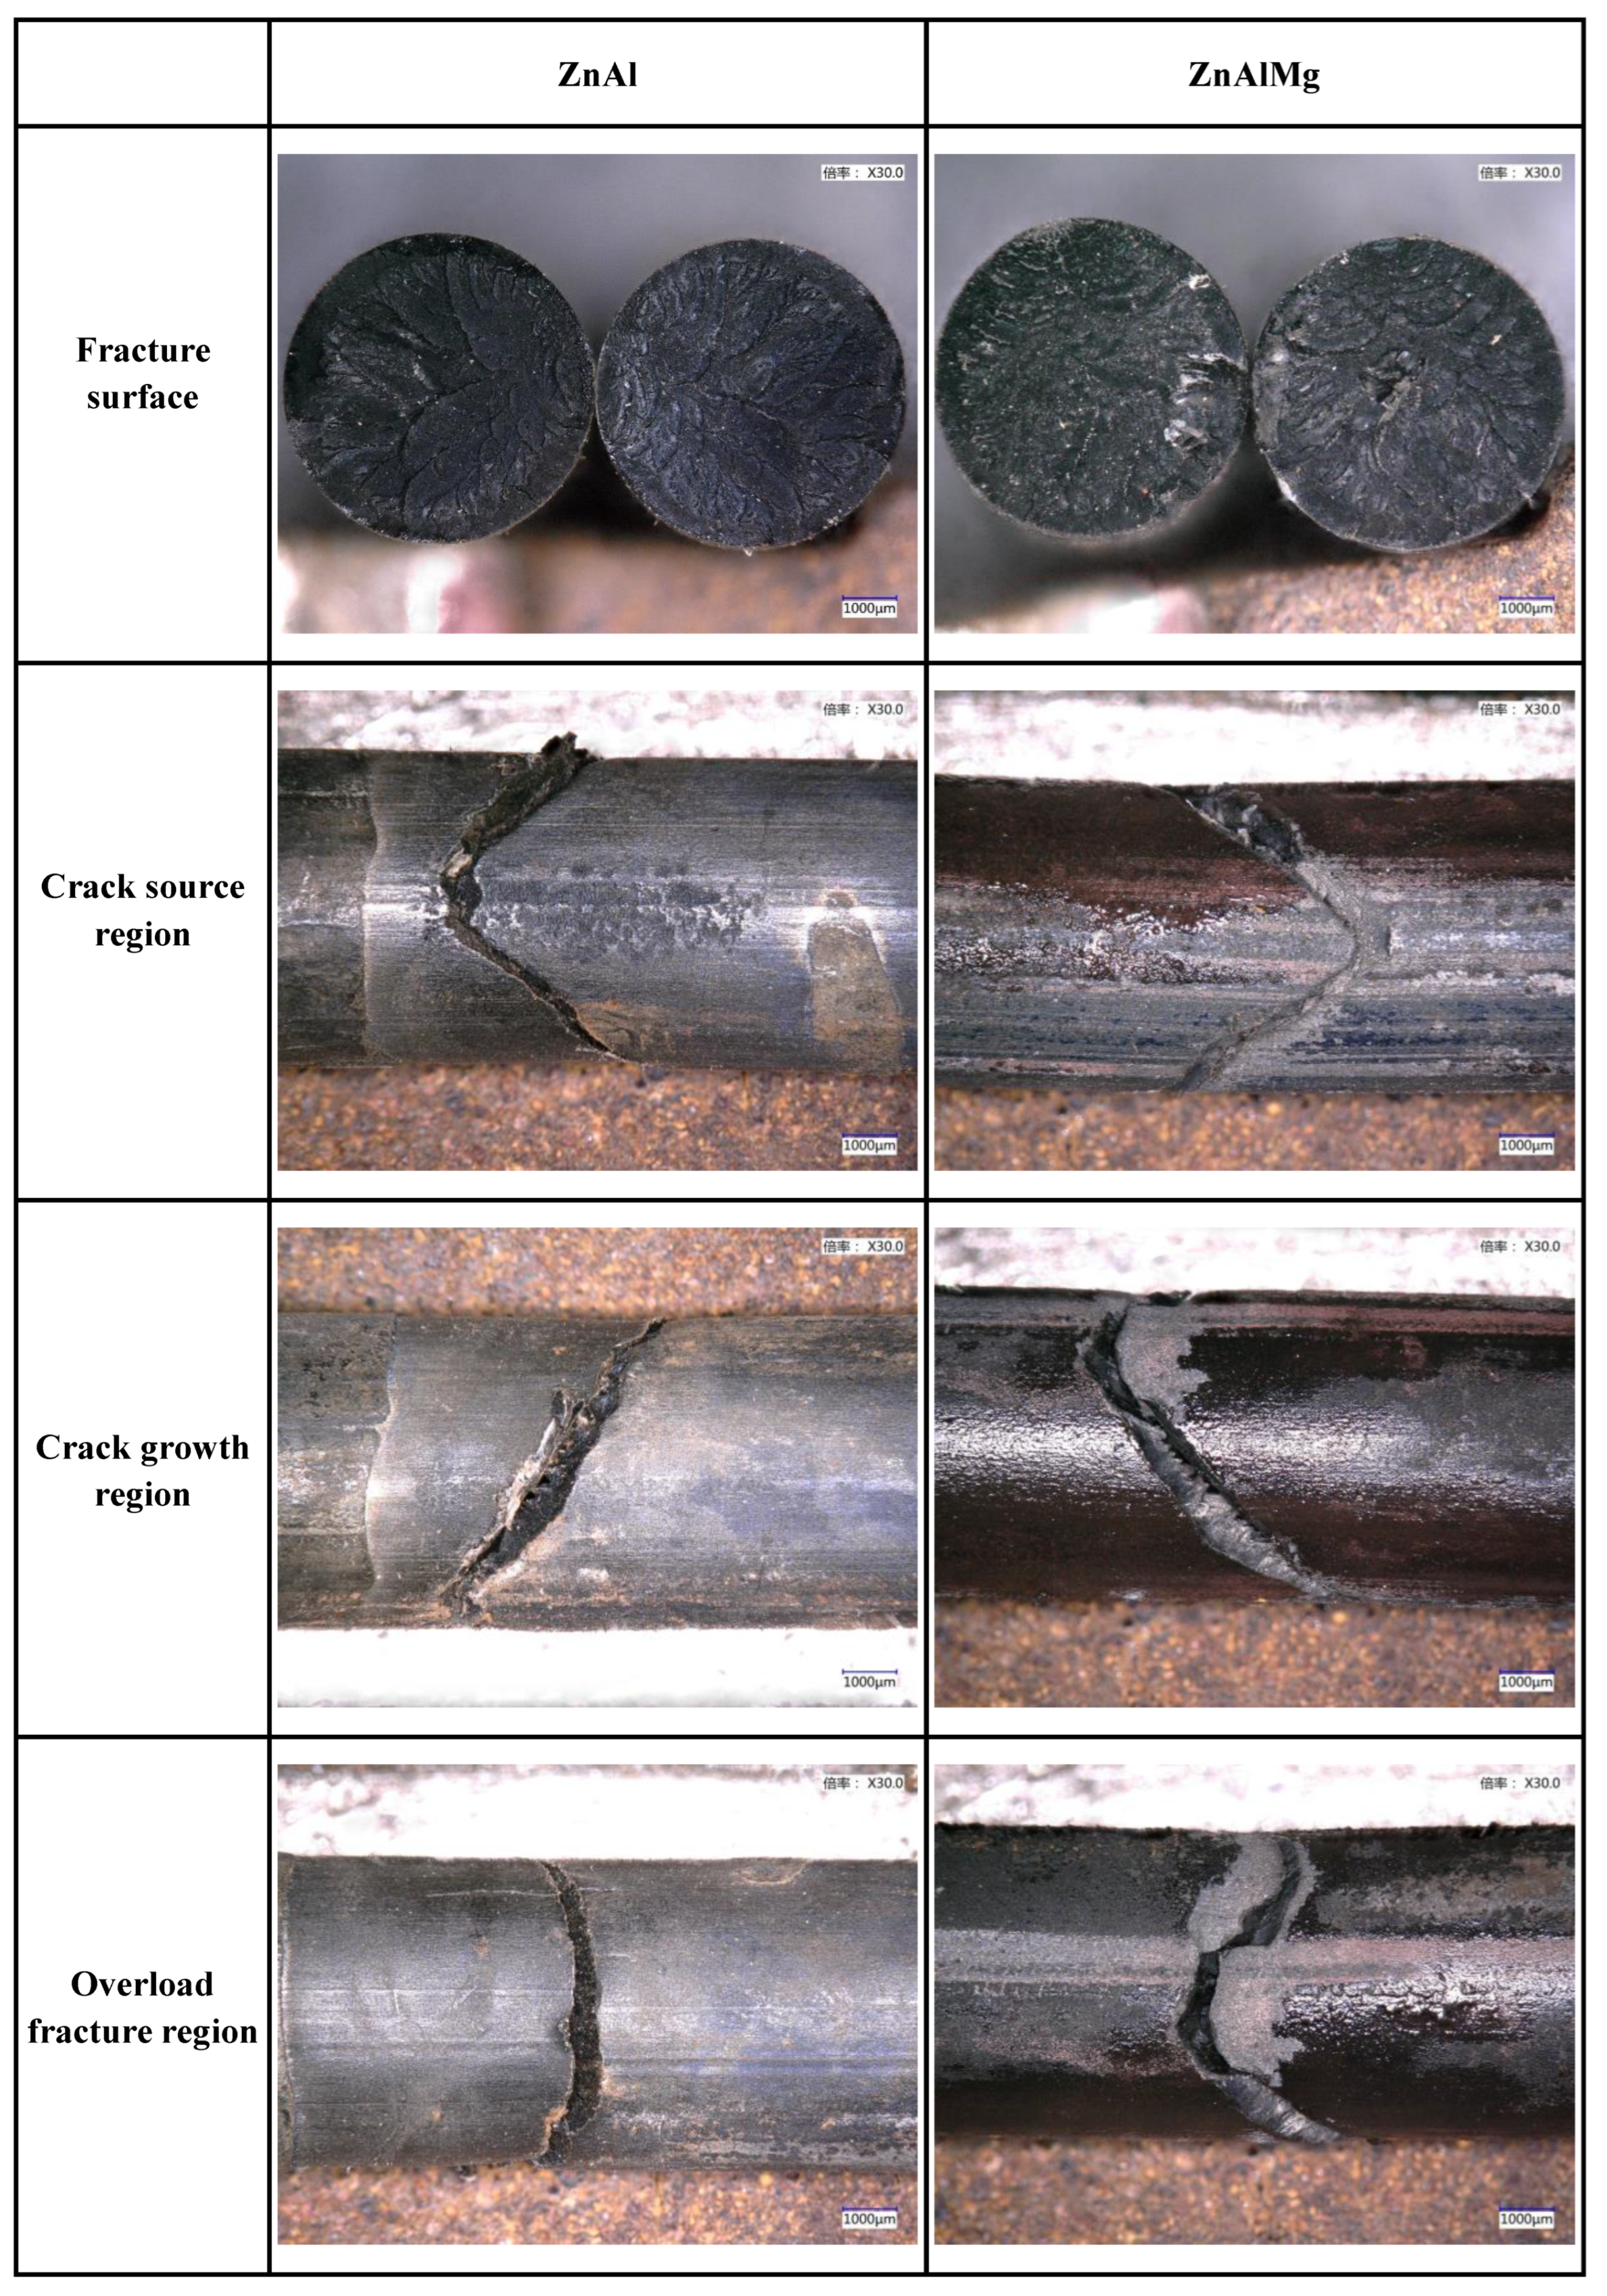
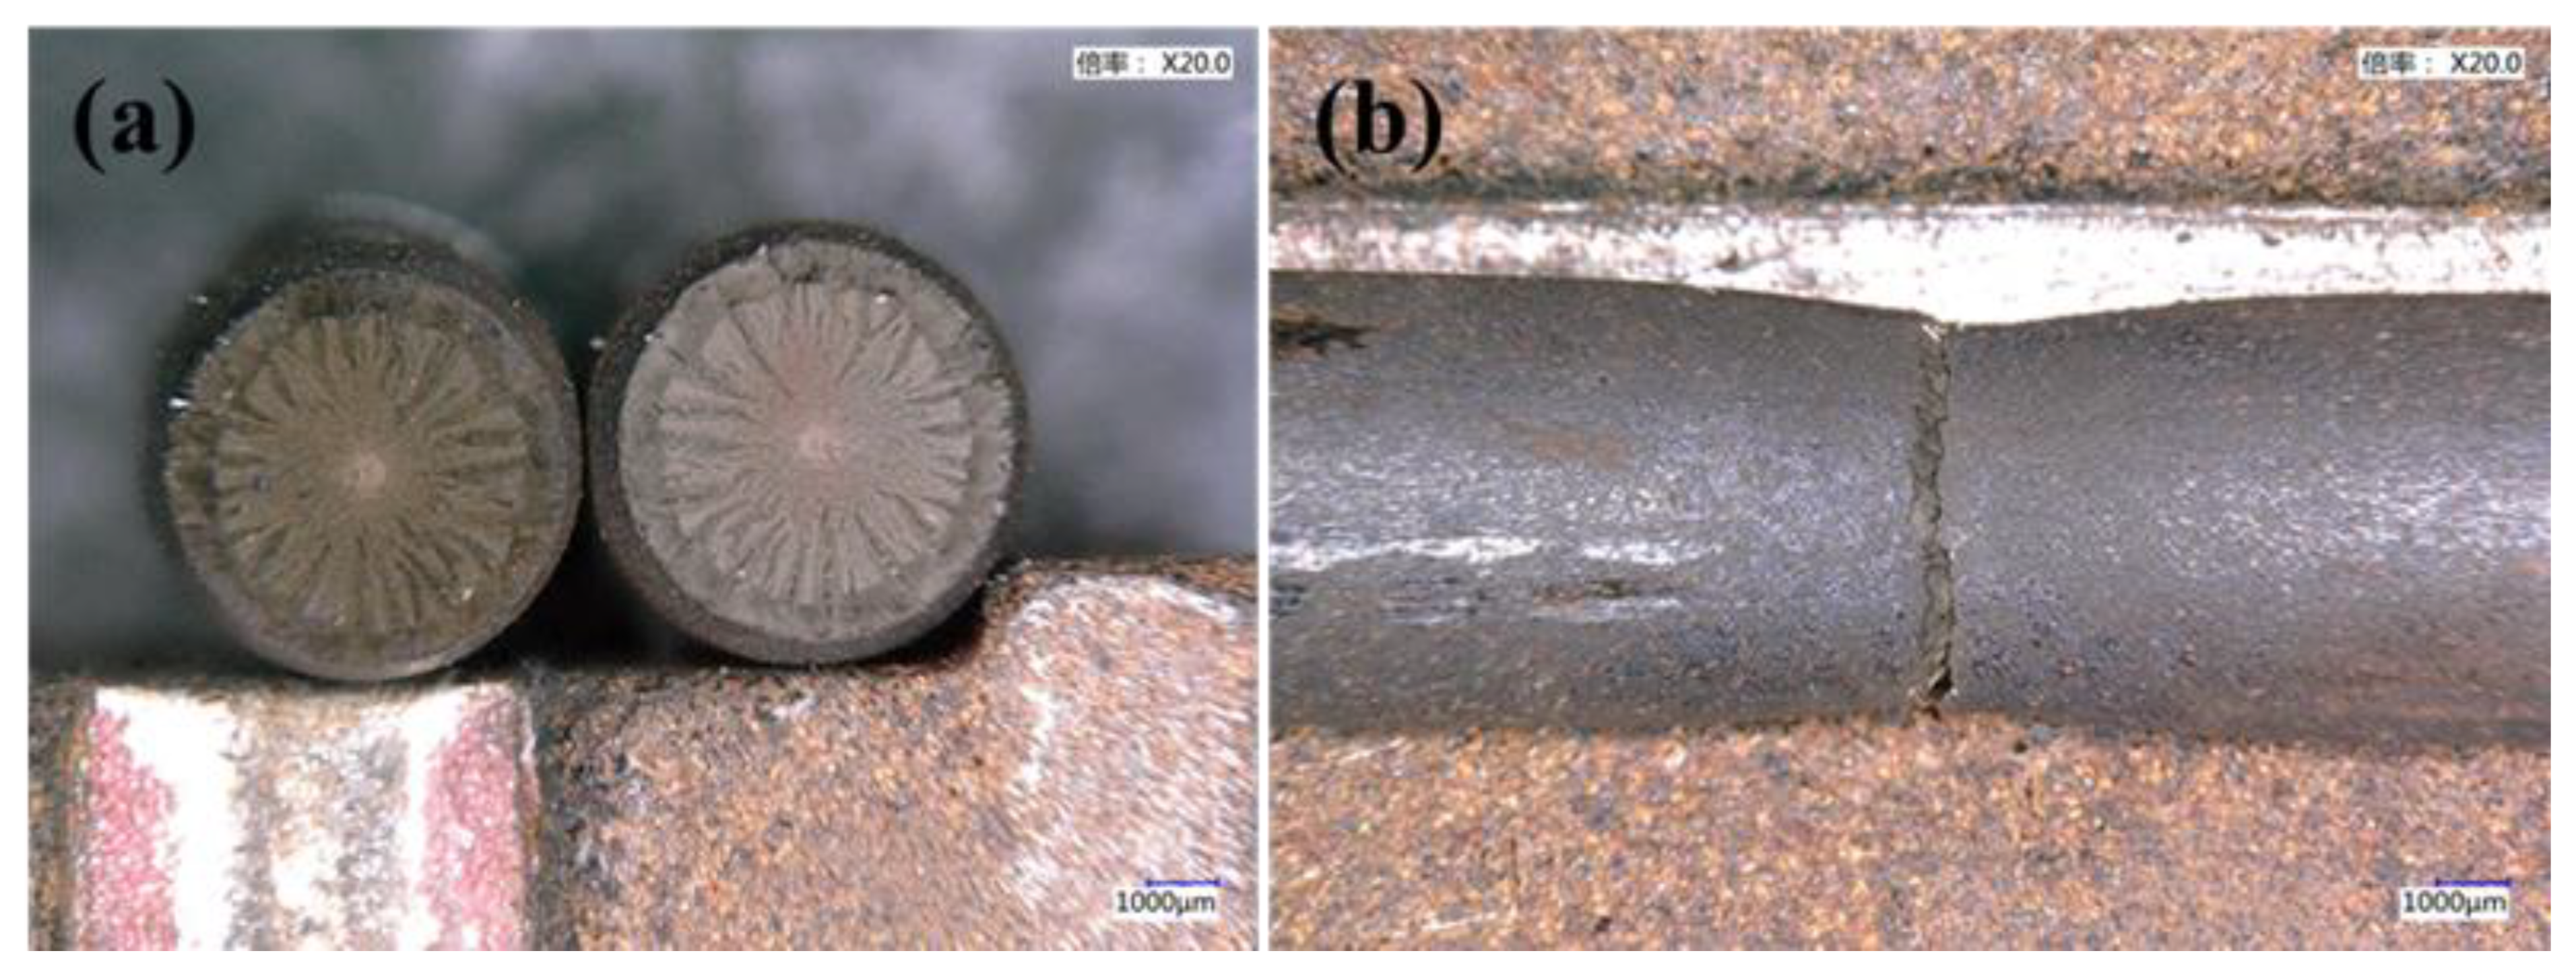
The coating type has little effect on the fracture morphology of bridge cable wire. From a macroscopic perspective, the stress corrosion cracking fracture is a brittle fracture caused by hydrogen embrittlement. The angle between the crack propagation direction and the applied stress direction is approximately 45°;
(3)
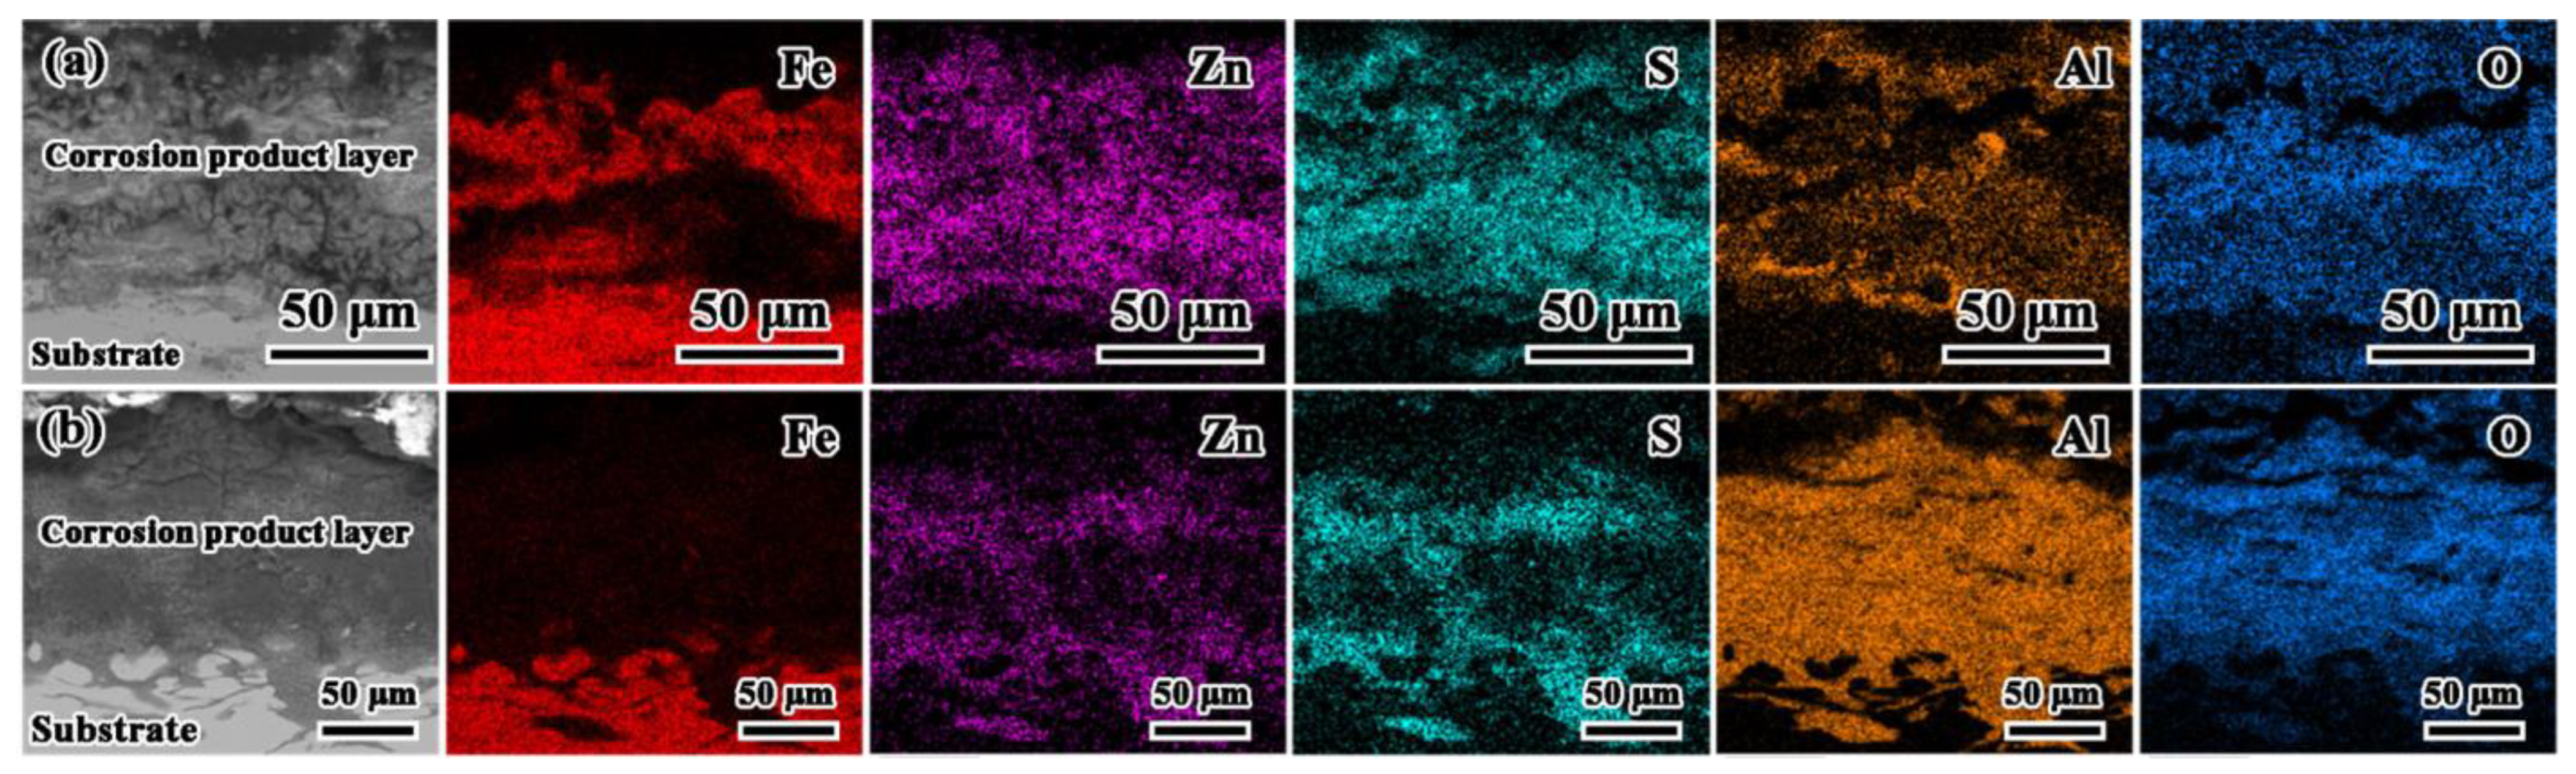
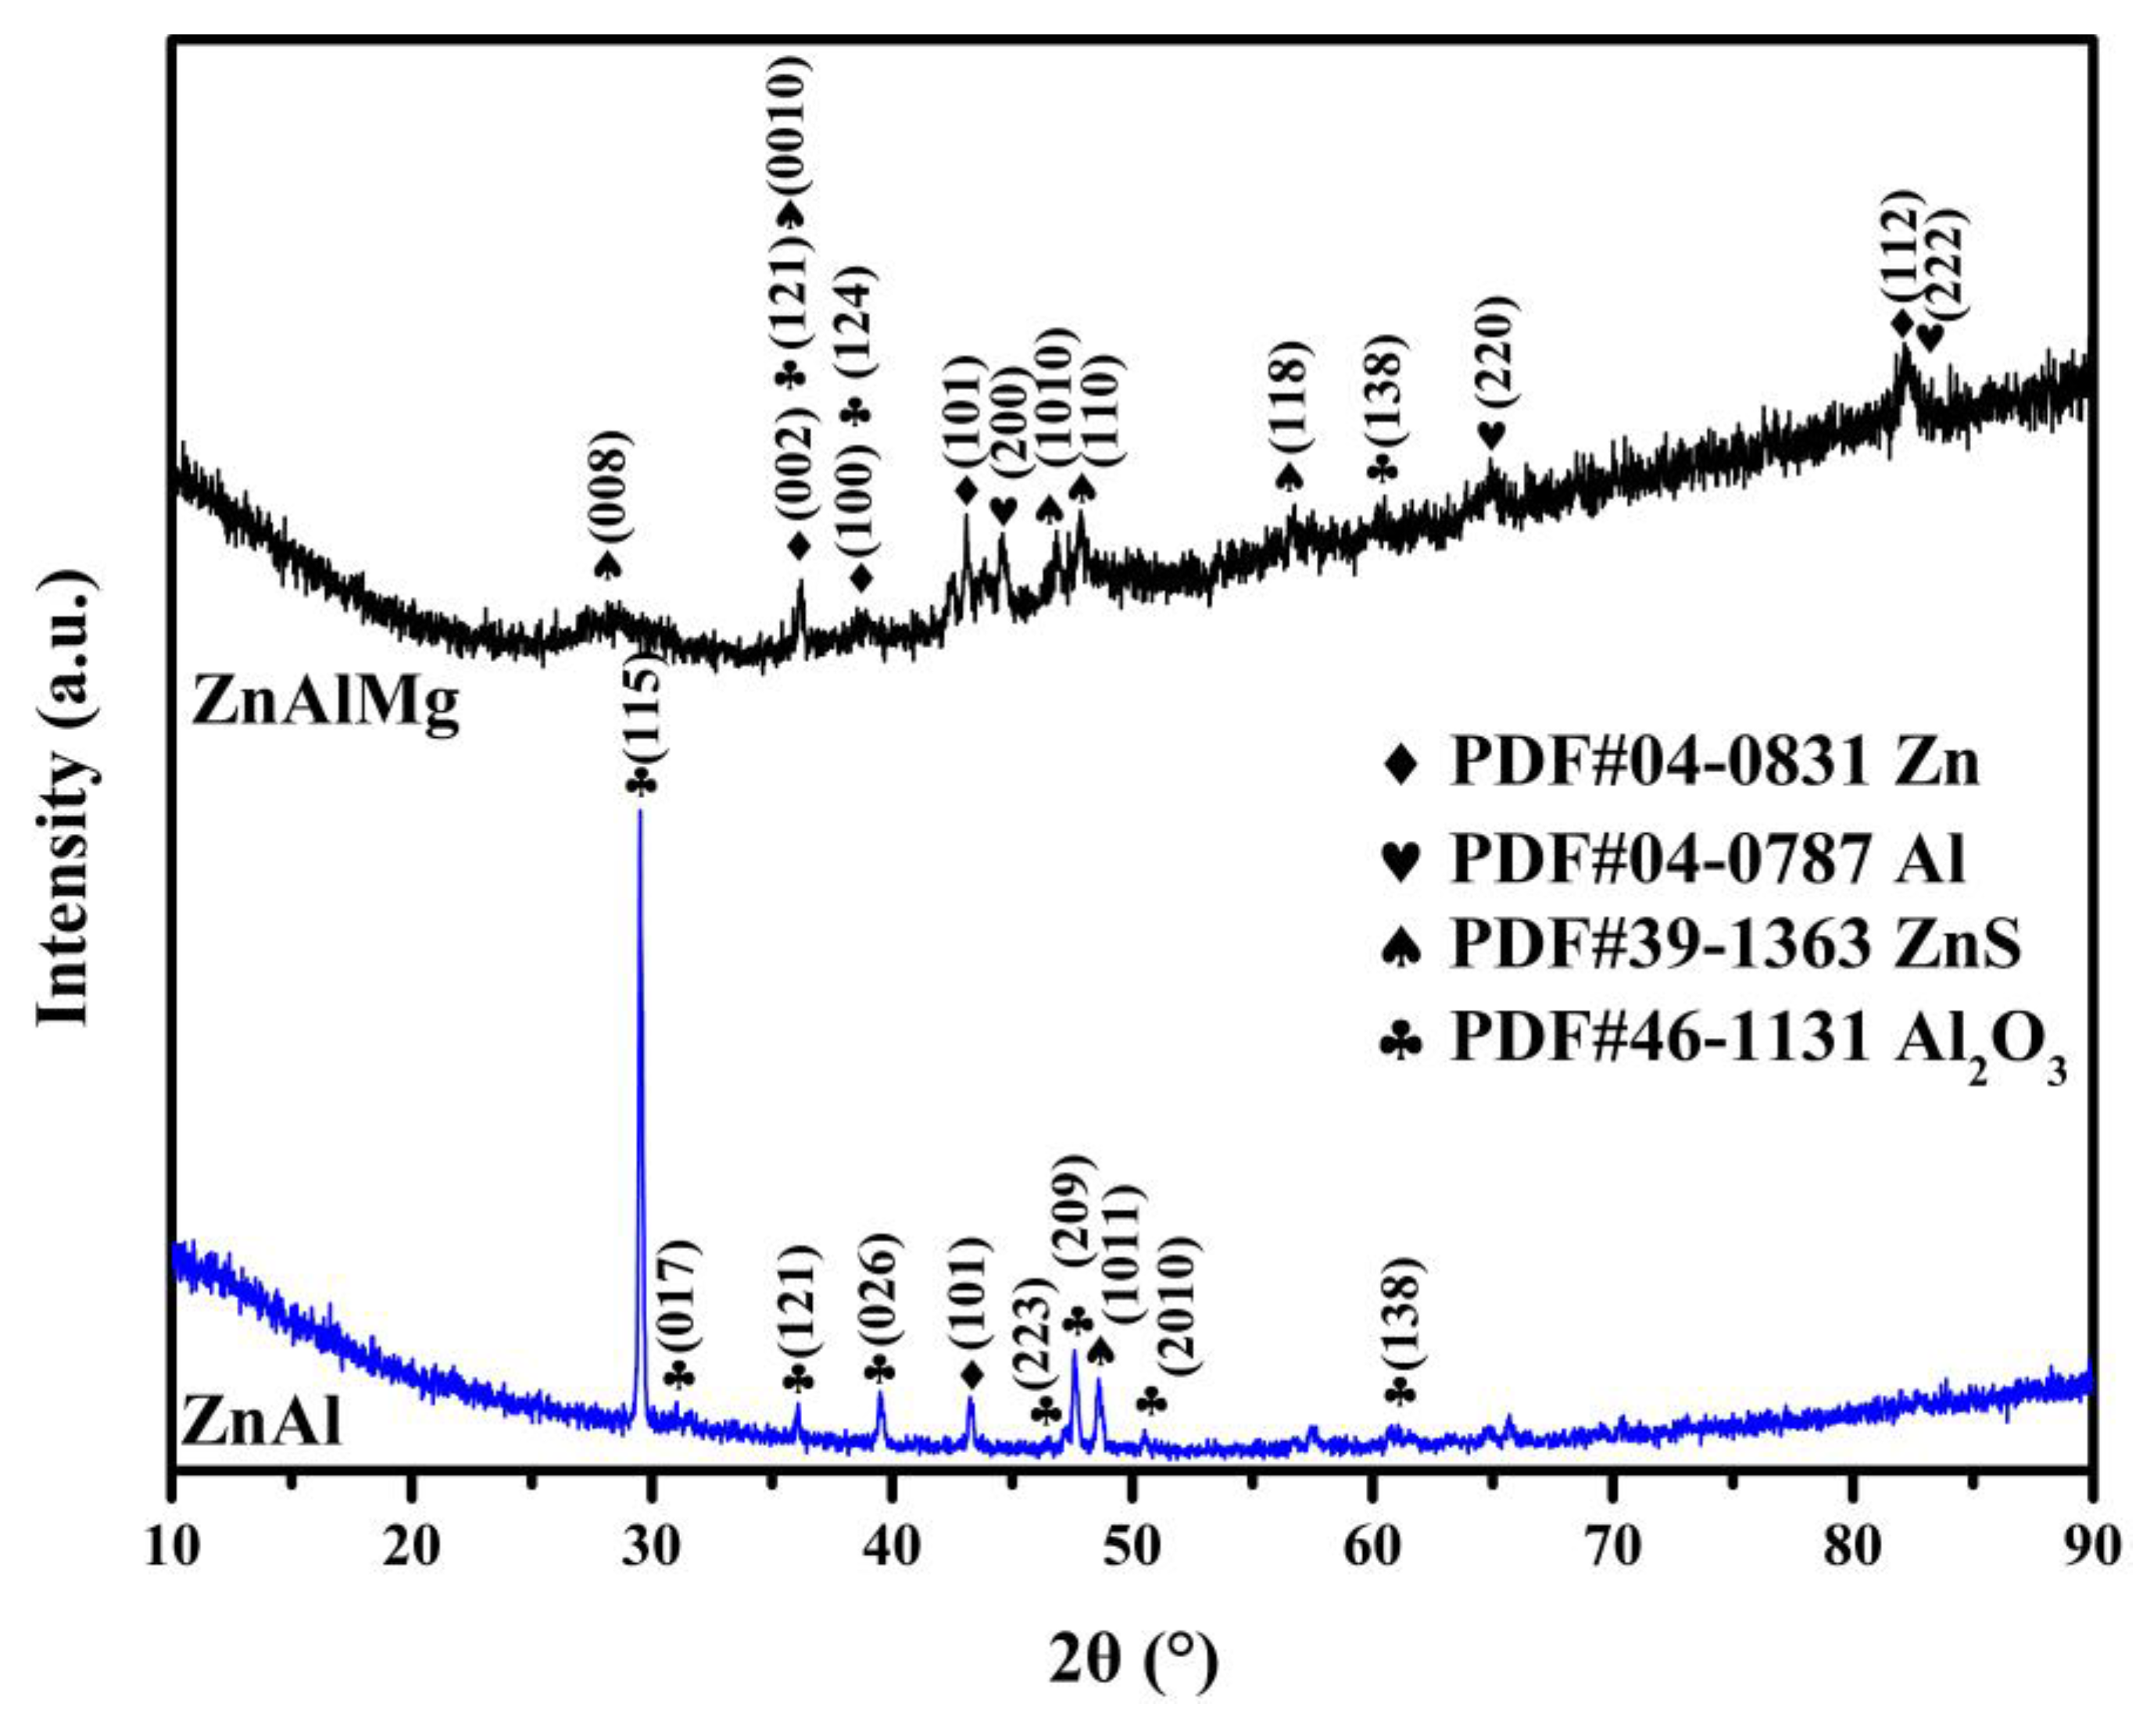
In NH4SCN solution (50 °C, 20 wt.%), a corrosion product layer composed of ZnS and Al2O3 is formed on the surface of the coated steel wire substrate;
(4)
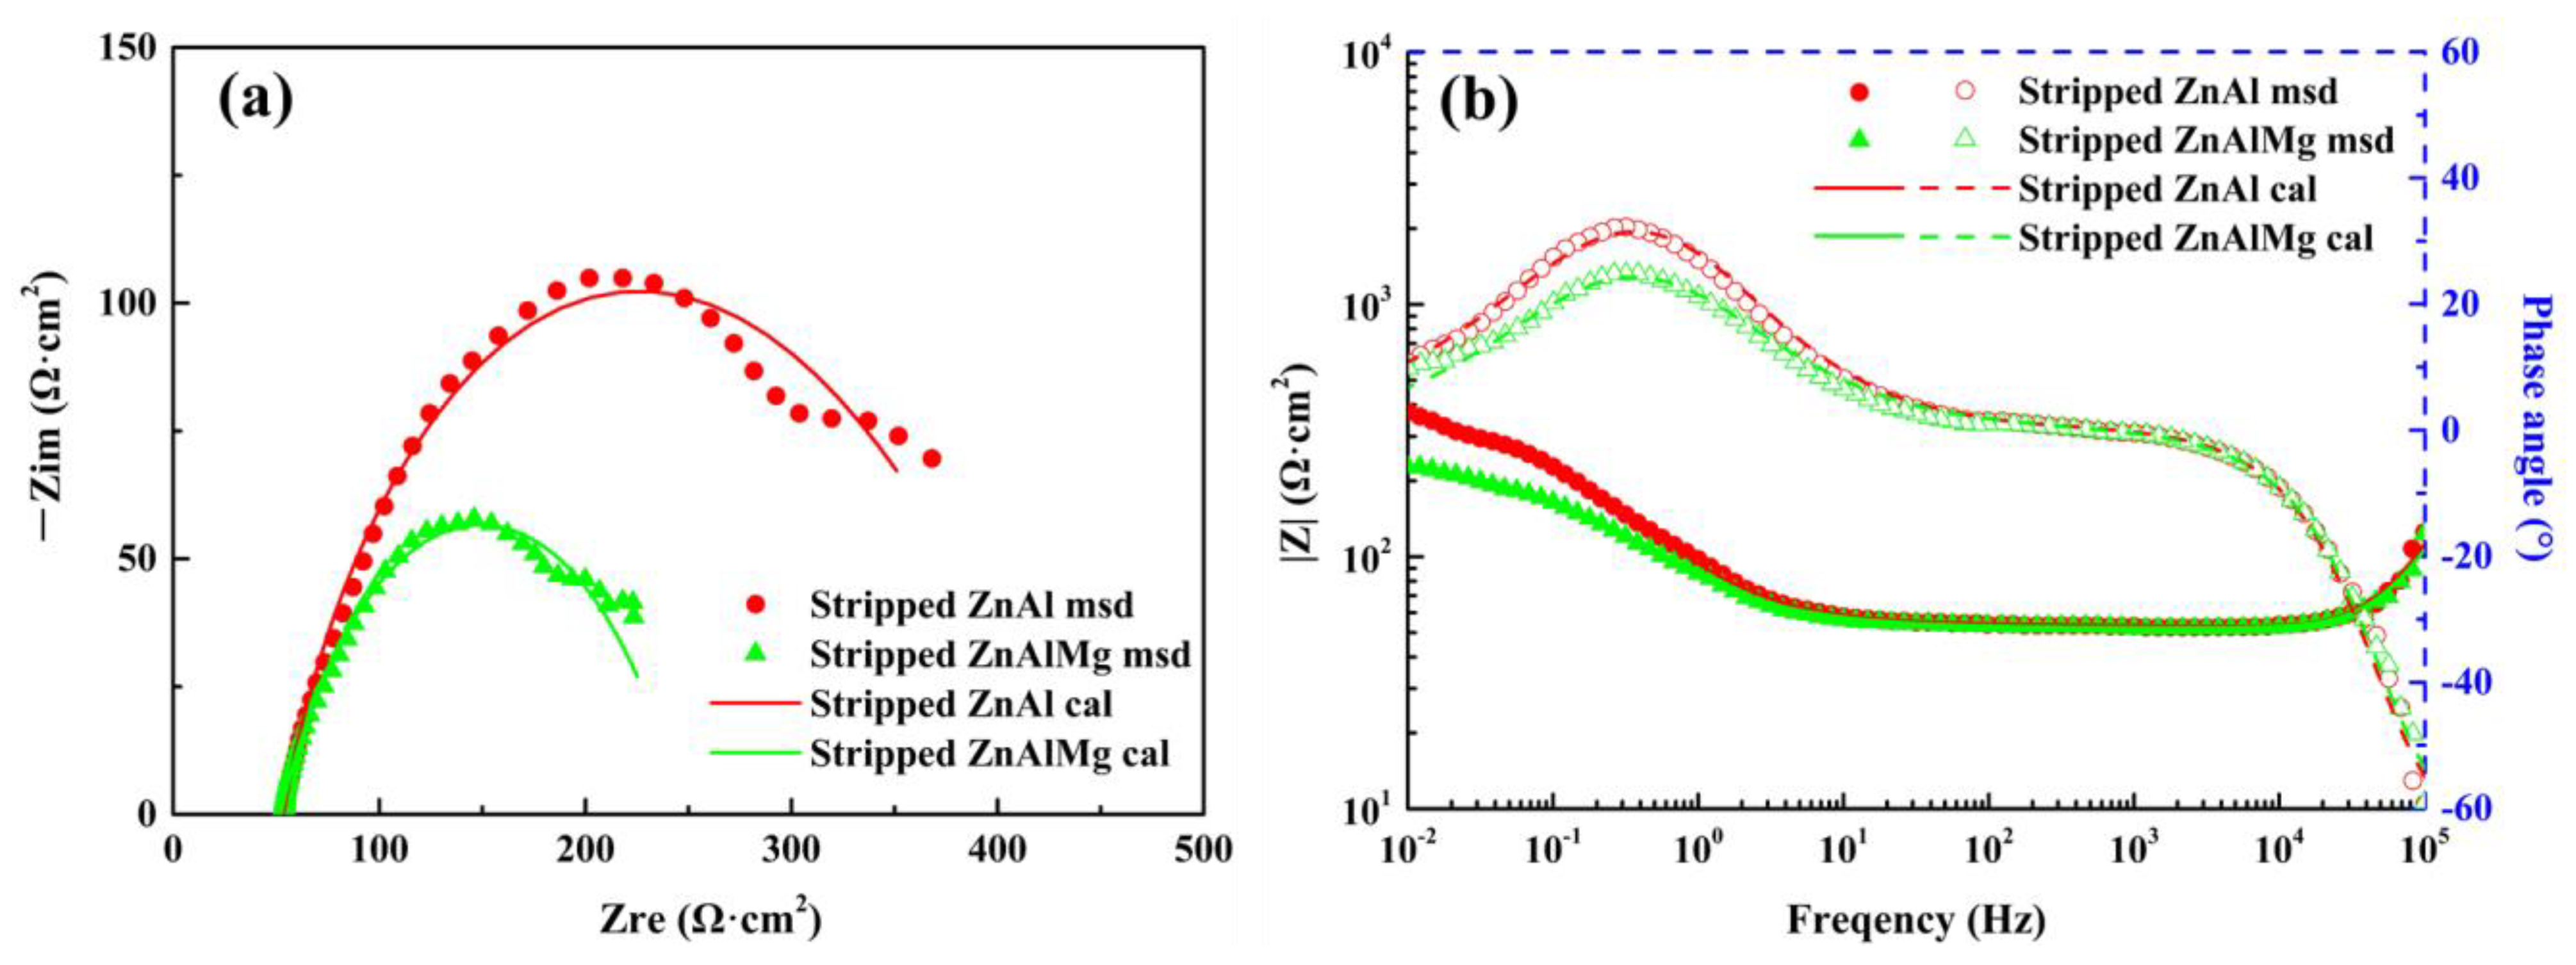
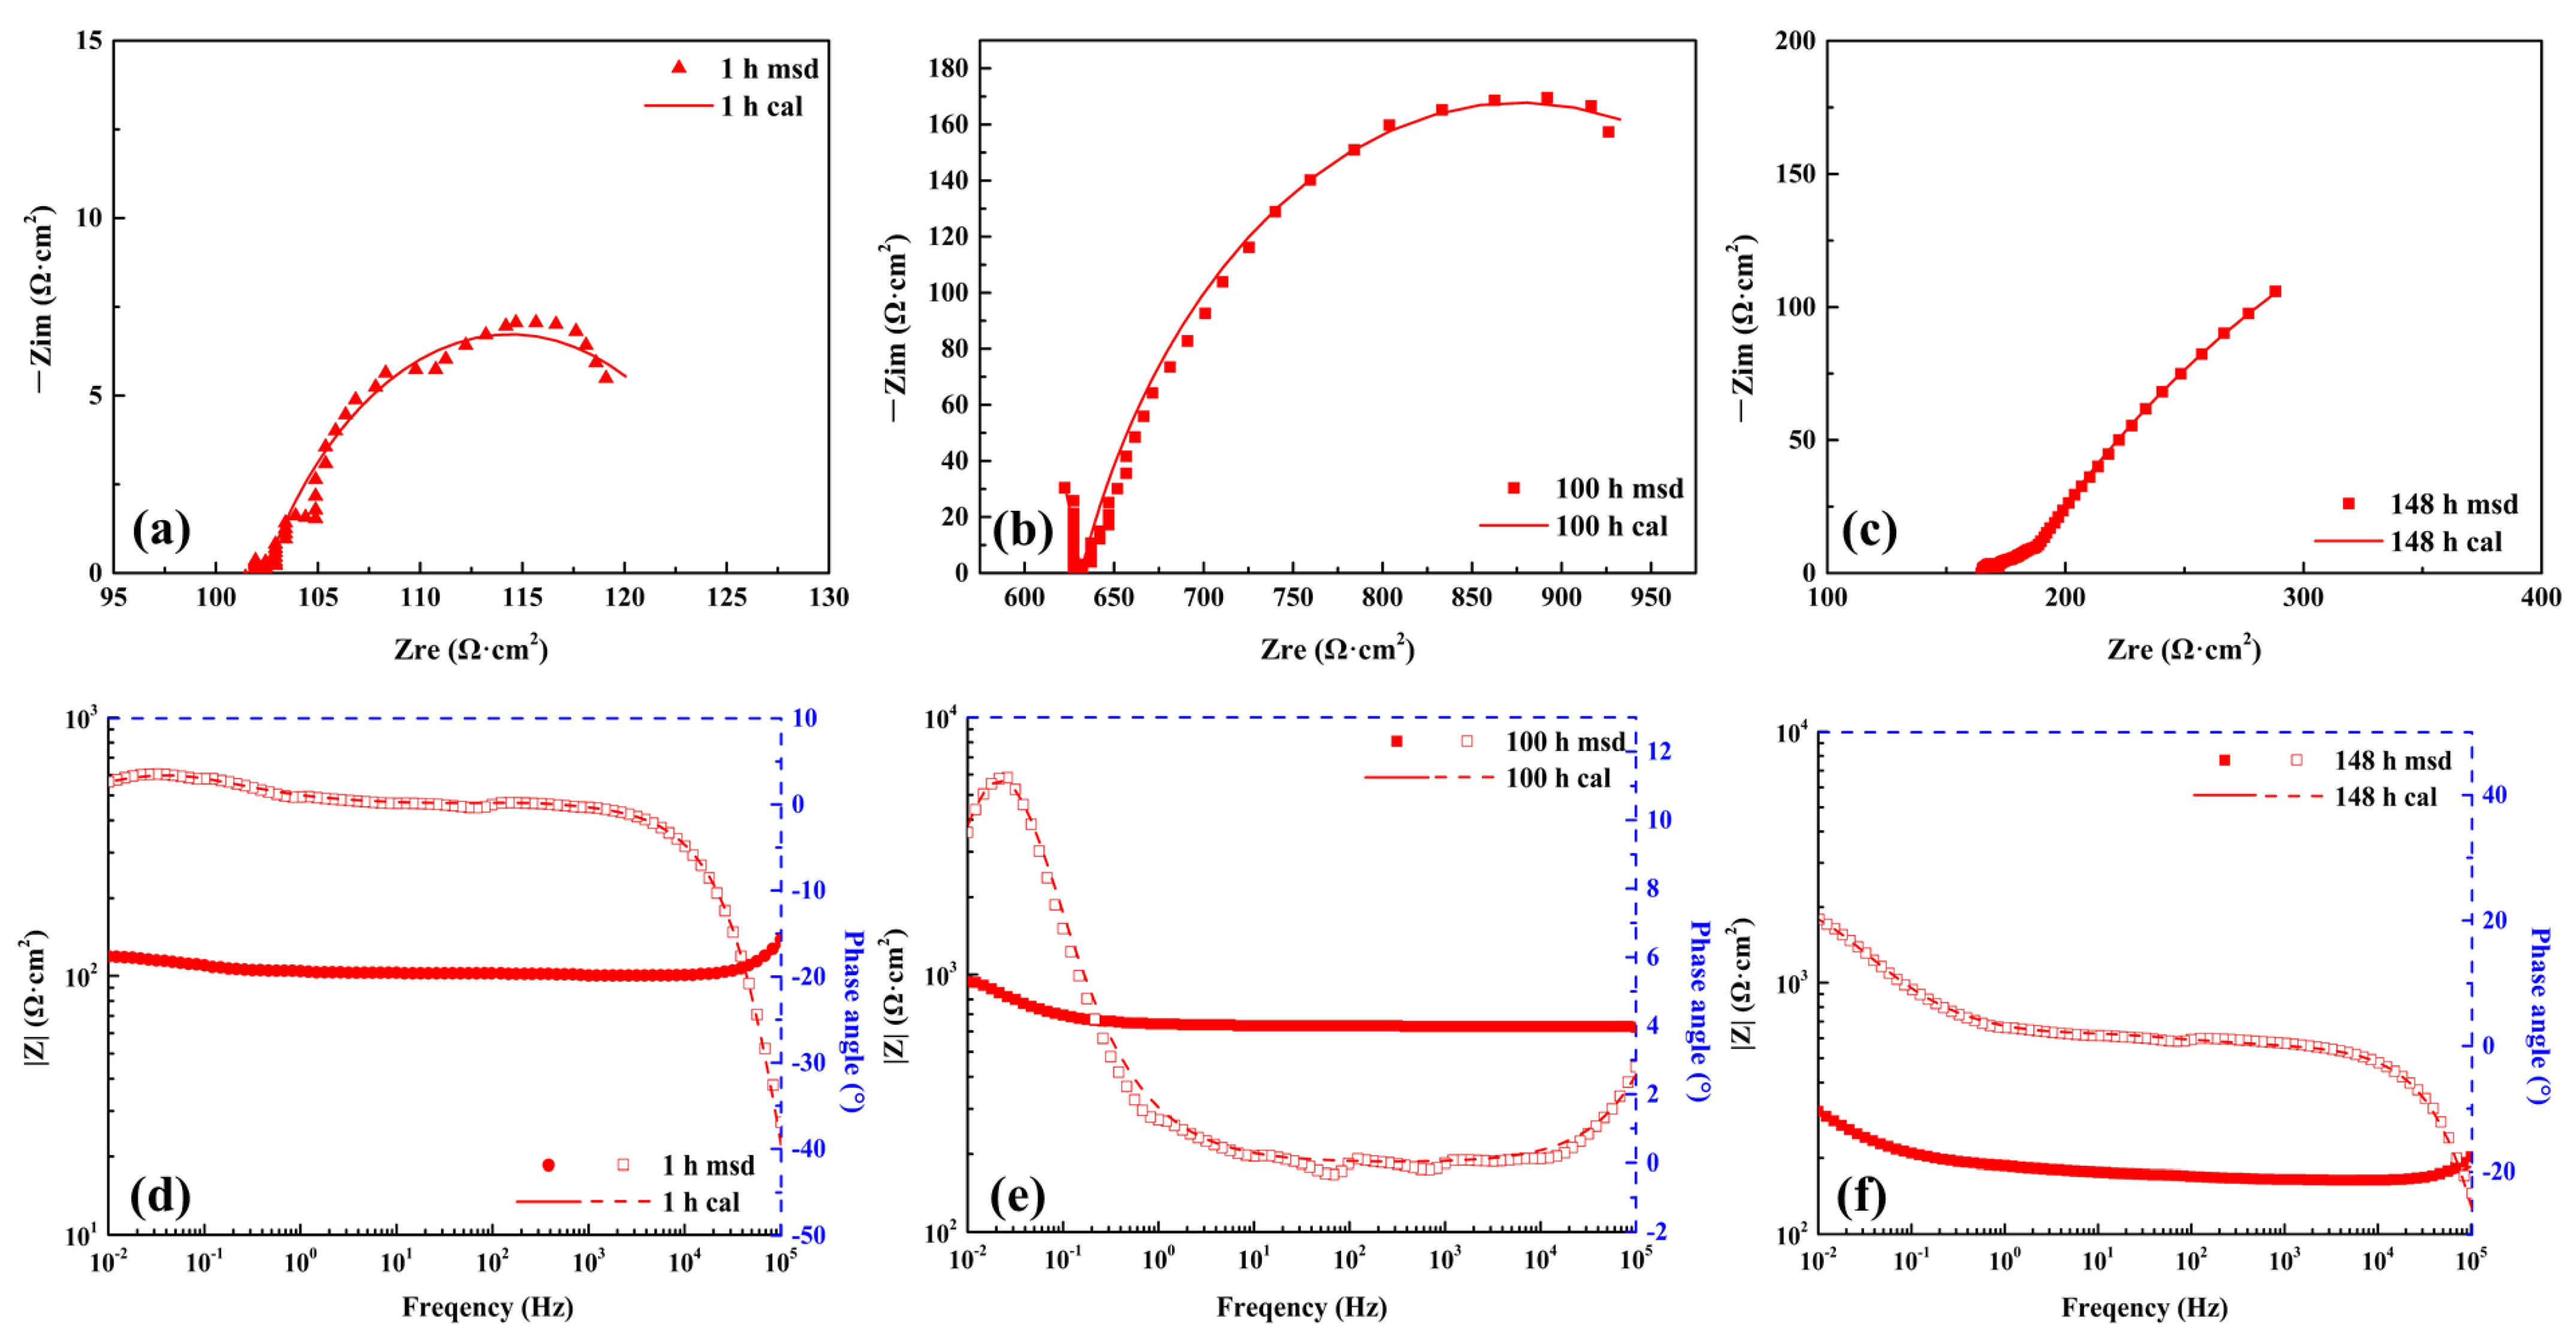
The electrochemical analysis showed that the corrosion resistance of the ZnAlMg coating is better than that of the ZnAl coating;
(5)
The results of the TDA showed that the steel wire substrate has the highest sensitivity to hydrogen embrittlement. The coating can reduce the hydrogen embrittlement sensitivity of steel wire, and the protective effect of the ZnAlMg coating on the steel wire substrate is stronger than that of the ZnAl coating.

Author Contributions

Conceptualization, Z.Z., L.W. and F.F.; methodology, Z.Z. and L.W.; validation, H.Z. (Hao Zhou), L.W. and Z.Z.; formal analysis, Z.Z., L.W. and F.F.; investigation, Z.Z. and L.W.; data curation, Z.Z., L.W. and H.Z. (Hao Zhou); writing—original draft preparation, Z.Z. and F.F.; writing—review and editing, Z.Z. and F.F.; supervision, L.W., L.T., H.Z. (Hailiang Zhang), S.S. and F.F; project administration, L.W., L.T., H.Z. (Hailiang Zhang), S.S. and F.F; funding acquisition, L.W., L.T., H.Z. (Hailiang Zhang), S.S. and F.F. All authors have read and agreed to the published version of the manuscript.

Funding

This work was supported by the Key-Area Research and Development Program of Guangdong Province (2019B111106002), National Natural Science Foundation of PR China (No. 52171110), and Jiangsu Key Laboratory of Advanced Metallic Materials, Southeast University, PR China (No. AMM2020A02).

Institutional Review Board Statement

Not applicable.

Informed Consent Statement

Not applicable.

Data Availability Statement

The data that support the findings of this study are available from the corresponding author upon reasonable request.

Acknowledgments

The materials used for the experiments were donated by Baosteel Group Nantong Wire Products Co., Ltd., and Shanghai Pujiang Cable Co., Ltd.

Conflicts of Interest

The authors declare no conflict of interest.

References

  1. Li, X.M.; Chen, D.H.; Chen, J.W.; Long, H.P.; Zhou, I.T. Effect of Temperature on Corrosion Behavior of Galvanized Steel Bridge Wires in Simulated Acid Rain. Corros. Sci. Prot. Technol. 2010, 22, 14–17. [Google Scholar]
  2. Zhu, X.; Shen, Y.; Ge, Y.; Zhang, S. Effect of Hot Dip Plating Process Parameters on Microstructure and Properties of Zinc–10%Aluminum–Mischmetal Alloy Coated for Bridge Cable Steel Wire. Metals 2022, 12, 1257. [Google Scholar] [CrossRef]
  3. Nakamura, S.-i.; Suzumura, K. Hydrogen Embrittlement and Corrosion Fatigue of Corroded Bridge Wires. J. Constr. Steel Res. 2009, 65, 269–277. [Google Scholar] [CrossRef]
  4. Wuyang, C.; Lijie, Q.; Kewei, G. Investigation of Stress Corrosion Cracking under Anodic Dissolution Control. Chin. Sci. Bull. 2001, 46, 717–722. [Google Scholar]
  5. Barton, S.C.; Vermaas, G.W.; Duby, P.F.; West, A.C.; Betti, R. Accelerated Corrosion and Embrittlement of High-Strength Bridge Wire. J. Mater. Civ. Eng. 2000, 12, 33–38. [Google Scholar] [CrossRef]
  6. Krkoška, L.; Moravčík, M.; Zgútová, K.; Neslušan, M.; Uhričík, M.; Bahleda, F.; Pitoňák, M. Investigation of Barkhausen Noise Emission in Steel Wires Subjected to Different Surface Treatments. Coatings 2020, 10, 912. [Google Scholar] [CrossRef]
  7. Yao, G.; He, X.; Liu, J.; Guo, Z.; Chen, P. Test Study of the Bridge Cable Corrosion Protection Mechanism Based on Impressed Current Cathodic Protection. Lubricants 2023, 11, 30. [Google Scholar] [CrossRef]
  8. Lebrini, M.; Fontaine, G.; Gengembre, L.; Traisnel, M.; Lerasle, O.; Genet, N. Corrosion Protection of Galvanized Steel and Electroplating Steel by Decanoïc Acid in Aqueous Solution: Electrochemical Impedance Spectroscopy, XPS and ATR-FTIR. Corros. Sci. 2009, 51, 1201–1206. [Google Scholar] [CrossRef]
  9. Dasheng, W.; Jueming, Y.; Guoqiang, L.; Feng, F.; Jianqing, J. Research Progress of Hot-Dip Coating for Bridge Cable Steel Wires. Surf. Technol. 2019, 48, 91–105. [Google Scholar]
  10. Ji, G.; Macía, L.F.; Allaert, B.; Hubin, A.; Terryn, H. Odd Random Phase Electrochemical Impedance Spectroscopy to Study the Corrosion Behavior of Hot Dip Zn and Zn-Alloy Coated Steel Wires in Sodium Chloride Solution. J. Electrochem. Soc. 2018, 165, C246–C257. [Google Scholar] [CrossRef]
  11. López, G.A.; Mittemeijer, E.J.; Straumal, B.B. Grain Boundary Wetting by a Solid Phase; Microstructural Development in a Zn-5 Wt% Al Alloy. Acta Mater. 2004, 52, 4537–4545. [Google Scholar] [CrossRef]
  12. Zhao, Y.; Su, B.T.; Fan, X.B.; Yuan, Y.G.; Zhu, Y.Y. Corrosion Fatigue Degradation Characteristics of Galvanized and Galfan High-Strength Steel Wire. Materials 2023, 16, 708. [Google Scholar] [CrossRef]
  13. Fan, H.; Wei, X.; Linfeng, W.; Guoqiang, L.; Feng, F.; Jianqing, J. Microstructure and Corrosion Resistance of Hot Dip Znalmg Coating for Bridge Cable Wire. Surf. Technol. 2021, 50, 279–286. [Google Scholar]
  14. Tano, K.; Higuchi, S. Development and properties of zinc-aluminum alloy coated steel sheet with high corrosion resistance (Super Zinc). Nippon Steel Tech. Rep. 1985, 25, 29–37. [Google Scholar]
  15. Tsujimura, T.; Komatsu, A.; Andoh, A. Influence of Mg content in coating layer and coating structure on corrosion resistance of hot-dip Zn-Al-Mg alloy coated steel sheet. In Proceedings of the 5th International Conference on Zinc and Zinc Alloy Coated Steel, GALVATECH, Brussels, Belgium, 26–28 June 2001; pp. 145–152. [Google Scholar]
  16. Volt, M.; Bleeker, R.; Maalman, T.; van Perlstein, E. MagiZincTM: A new generation of hot-dip galvanized products. In Proceedings of the Galvanized Steel Sheet Forum, ILZRO and IZA, Duesseldorf, Germany, 30–31 May 2006; pp. 13–24. [Google Scholar]
  17. Kania, H. Structure and Corrosion Resistance of Coatings Obtained by the Batch Double Hot Dip Method in Eutectoid ZnAl Bath with the Addition of Mg and Si. Coatings 2022, 12, 1207. [Google Scholar] [CrossRef]
  18. Schuerz, S.; Fleischanderl, M.; Luckeneder, G.H.; Preis, K.; Haunschmied, T.; Mori, G.; Kneissl, A.C. Corrosion Behaviour of Zn-Al-Mg Coated Steel Sheet in Sodium Chloride-Containing Environment. Corros. Sci. 2009, 51, 2355–2363. [Google Scholar] [CrossRef]
  19. Elices, M.; Caballero, L.; Valiente, A.; Ruiz, J.; Martin, A. Hydrogen Embrittlement of Steels for Prestressing Concrete: The FIP and DIBt Tests. Corrosion 2008, 64, 164–174. [Google Scholar] [CrossRef]
  20. Wu, S.; Chen, H.; Ramandi, H.L.; Hagan, P.C.; Crosky, A.; Saydam, S. Effects of Environmental Factors on Stress Corrosion Cracking of Cold-Drawn High-Carbon Steel Wires. Corros. Sci. 2018, 132, 234–243. [Google Scholar] [CrossRef]
  21. Lv, S.; Li, K.; Chen, J.; Li, X. Corrosion of High-Strength Steel Wires under Tensile Stress. Materials 2020, 13, 4790. [Google Scholar] [CrossRef]
  22. Katayama, H.; Kuroda, S. Long-Term Atmospheric Corrosion Properties of Thermally Sprayed Zn, Al and Zn-Al Coatings Exposed in a Coastal Area. Corros. Sci. 2013, 76, 35–41. [Google Scholar] [CrossRef]
  23. Ares, A.E.; Gassa, L.M. Corrosion Susceptibility of Zn-Al Alloys with Different Grains and Dendritic Microstructures in NaCl Solutions. Corros. Sci. 2012, 59, 290–306. [Google Scholar] [CrossRef]
  24. Doshida, T.; Takai, K. Dependence of Hydrogen-Induced Lattice Defects and Hydrogen Embrittlement of Cold-Drawn Pearlitic Steels on Hydrogen Trap State, Temperature, Strain Rate and Hydrogen Content. Acta Mater. 2014, 79, 93–107. [Google Scholar] [CrossRef]
  25. Ichiba, M.; Sakai, J.; Doshida, T.; Takai, K. Corrosion Reaction and Hydrogen Absorption of Steel for Prestressed Concrete in a 20 Mass% Ammonium Thiocyanate Solution. Scr. Mater. 2015, 102, 59–62. [Google Scholar] [CrossRef]
  26. Narayanan, T.S.N.S. Surface Pretreatment by Phosphate Conversion Coatings—A Review. Rer. Adv. Mater. Sci. 2005, 9, 48. [Google Scholar]
  27. Wang, Y.; Zhang, W.; Zheng, Y. Experimental Study on Corrosion Fatigue Performance of High-Strength Steel Wire with Initial Defect for Bridge Cable. Appl. Sci. 2020, 10, 2293. [Google Scholar] [CrossRef] [Green Version]
  28. Deng, Y.; Deng, L. Corrosion Fatigue Test and Performance Evaluation of High-Strength Steel Wires Based on the Suspender of a 11-Year-Old Concrete-Filled Steel Tube Arch Bridge. Coatings 2022, 12, 1475. [Google Scholar] [CrossRef]
  29. Marder, A.R. The Metallurgy of Zinc-Coated Steel. Prog. Mater. Sci. 2000, 45, 191–271. [Google Scholar] [CrossRef]
  30. Thierry, D.; Persson, D.; Luckeneder, G.; Stellnberger, K.H. Atmospheric Corrosion of ZnAlMg Coated Steel during Long Term Atmospheric Weathering at Different Worldwide Exposure Sites. Corros. Sci. 2019, 148, 338–354. [Google Scholar] [CrossRef]
  31. Ogawa, Y.; Hino, M.; Nakamura, M.; Matsunaga, H. Pearlite-Driven Surface-Cracking and Associated Loss of Tensile Ductility in Plain-Carbon Steels under Exposure to High-Pressure Gaseous Hydrogen. Int. J. Hydrogen Energy 2021, 46, 6945–6959. [Google Scholar] [CrossRef]
  32. Recio, F.J.; Alonso, M.C.; Gaillet, L.; Sánchez, M. Hydrogen Embrittlement Risk of High Strength Galvanized Steel in Contact with Alkaline Media. Corros. Sci. 2011, 53, 2853–2860. [Google Scholar] [CrossRef] [Green Version]
  33. Tan, Z.Q.; Hansson, C.M. Effect of Surface Condition on the Initial Corrosion of Galvanized Reinforcing Steel Embedded in Concrete. Corros. Sci. 2008, 50, 11. [Google Scholar] [CrossRef]
  34. Roffey, P. The Fracture Mechanisms of Main Cable Wires from the Forth Road Suspension. Eng. Fail. Anal. 2013, 31, 430–441. [Google Scholar] [CrossRef]
  35. Yu, S.H.; Jeong, H.B.; Lee, J.S.; Lee, Y.K. Micro-Axial Cracking in Unnotched, Cold-Drawn Pearlitic Steel Wire: Mechanism and Beneficial Effect on the Resistance to Hydrogen Embrittlement. Acta Mater. 2022, 225, 117567. [Google Scholar] [CrossRef]
  36. Roberge, R.; Zheng, W. Hydrogen Embrittlement Susceptibility of Galvanized 4135 Steel in Cement Environment. Corros. Sci. 1993, 35, 507–514. [Google Scholar] [CrossRef]
Figure 1. Schematic diagram of steel wire production process.
Coatings 13 01339 g001
Figure 2. SEM and EDS mapping images of the transverse sections of (a) ZnAl- and (b) ZnAlMg-coated steel wires.
Coatings 13 01339 g002
Figure 3. SEM images of the transverse sections of (a) ZnAl- and (b) ZnAlMg-coated steel wires. (1,2,3,7,8,9: Zn-rich phase; 4,5,6,10,11,12: eutectic phase).
Coatings 13 01339 g003
Figure 4. XRD patterns of coated steel wires.
Coatings 13 01339 g004
Figure 5. Stress corrosion fracture times of (a) ZnAl- and (b) ZnAlMg-coated steel wires and corresponding steel wire substrate under different applied loads.
Coatings 13 01339 g005
Figure 6. Optical micrographs of fracture surfaces and sides of steel wire substrates after stress corrosion cracking. (“倍率” in the figure means magnification).
Coatings 13 01339 g006
Figure 7. Optical micrographs of fracture surfaces and sides of coated steel wires after stress corrosion cracking. (“倍率” in the figure means magnification).
Coatings 13 01339 g007
Figure 8. Optical micrographs of (a) fracture surfaces and (b) sides of steel wire substrates after tensile test in the air. (“倍率” in the figure means magnification).
Coatings 13 01339 g008
Figure 9. SEM images and corresponding EDS element mapping of (a) ZnAl- and (b) ZnAlMg-coated steel wires after 48 h of stress corrosion.
Coatings 13 01339 g009
Figure 10. XRD patterns of coated steel wires after 24 h of stress corrosion.
Coatings 13 01339 g010
Figure 11. (a) Nyquist diagram and (b) Bode diagram of steel wire substrate under stress corrosion.
Coatings 13 01339 g011
Figure 12. (a) Nyquist diagram and (d) Bode diagram of ZnAl-coated steel wire at the initial stage of stress corrosion. (b) Nyquist diagram and (e) Bode diagram of ZnAl-coated steel wire at the corrosion inhibition stage. (c) Nyquist diagram and (f) Bode diagram of ZnAl-coated steel wire at the substrate corrosion stage.
Coatings 13 01339 g012
Figure 13. (a) Nyquist diagram and (d) Bode diagram of ZnAlMg-coated steel wire at the initial stage of stress corrosion. (b) Nyquist diagram and (e) Bode diagram of ZnAlMg-coated steel wire at the corrosion inhibition stage. (c) Nyquist diagram and (f) Bode diagram of ZnAlMg-coated steel wire at the substrate corrosion stage.
Coatings 13 01339 g013
Figure 14. Electrical equivalent circuit in stress corrosion environment.
Coatings 13 01339 g014
Figure 15. (a) Potentiodynamic polarization curve, (b) corrosion potential, and corrosion current density of steel wire substrate during stress corrosion.
Coatings 13 01339 g015
Figure 16. (a) Potentiodynamic polarization curve, (b) corrosion potential, and corrosion current density of ZnAl-coated steel wire during stress corrosion. (c) Potentiodynamic polarization curve, (d) corrosion potential, and current density of ZnAlMg-coated steel wire during stress corrosion.
Coatings 13 01339 g016
Figure 17. Thermal desorption analysis profiles of hydrogen: (a) the ZnAlMg-coated steel wire and steel wire substrate (stripped ZnAlMg) before charging with hydrogen; (b) the ZnAlMg-coated steel wire and steel wire substrate (stripped ZnAlMg) after hydrogen charging for 24 h; (c) the ZnAl-coated steel wire and ZnAlMg-coated steel wire after hydrogen charging for 24 h; (d) the steel wire substrate (stripped ZnAl) and steel wire substrate (stripped ZnAlMg) after hydrogen charging for 24 h.
Coatings 13 01339 g017
Table 1. Chemical composition of raw wire rods (wt.%).
Composition (wt.%)CSiMnPSCrCuNiFe
Steel wire substrate (stripped ZnAl)0.921.250.600.0070.0020.300.050.02Bal.
Steel wire substrate (stripped ZnAlMg)0.901.000.720.0070.0020.180.01\Bal.
Table 2. Specific information about the test sample.
TestThe Total Number of SamplesSamples Information
FIP16ZnAl-coated steel wire
ZnAlMg-coated steel wire
Steel wire substrate (stripped ZnAl)
Steel wire substrate (stripped ZnAlMg)
Electrochemical4
TDS6
SEM-EDS4ZnAl-coated steel wire
ZnAlMg-coated steel wire
XRD4
Table 3. Chemical composition in micro-areas (EDS) at each position of the coating (wt.%).
Coating TypesPositionZnAlMg
ZnAl198.41.6\
297.82.2\
398.31.7\
490.39.7\
593.07.0\
685.414.6\
ZnAlMg799.01.0\
899.50.5\
999.40.6\
1090.35.83.9
1168.723.77.6
1287.38.64.1
Table 4. Fitting parameters for the EIS of the steel wire substrate.
Coating TypeL1
(H·cm2)
R1
(Ω·cm2)
Q1-Y0
−1·cm2·Sn)
Q1-nR2
(Ω·cm2)
Q2-Y0
−1·cm2·Sn)
Q2-nR3
(Ω·cm2)
ZnAl1.5 × 10−453.270.2445151.950.0046650.7201297.5
ZnAlMg1.4 × 10−452.48743.50.99991.0430.0064960.6778192.8
Table 5. Fitting parameters for the EIS of the coated steel wires.
Coating TypeTime
(h)
L1
(H·cm2)
R1
(Ω·cm2)
Q1-Y0
−1·cm2·Sn)
Q1-nR2
(Ω·cm2)
Q2-Y0
−1·cm2·Sn)
Q2-nR3
(Ω·cm2)
ZnAl11.33 × 10−4101.50.00071310.87360.11490.649924.02
1006.87 × 10−100.027068.26 × 10−80.8539631.30.01230.7641490.6
1481.29 × 10−4166.60.031390.618618.660.02820.6108670
ZnAlMg11.86 × 10−524.652.32 × 10−60.8549128.20.00066130.854510.34
1201.47 × 10−535.490.0048240.733720142.38 × 10−60.9071222
1931.42 × 10−4148.50.0083810.424328.290.0080710.81362018
Disclaimer/Publisher’s Note: The statements, opinions and data contained in all publications are solely those of the individual author(s) and contributor(s) and not of MDPI and/or the editor(s). MDPI and/or the editor(s) disclaim responsibility for any injury to people or property resulting from any ideas, methods, instructions or products referred to in the content.

