
Preparation of Nitrogen-Doped ZnFe2O4-Modified Carbon Composite and Its Collaborative Energy Storage Mechanism

Abstract
:1. Introduction
2. Experimental Part
2.1. Preparation of Sap-Fe/Zn, SAP-Fe/Zn&N, and SAP-Fe/Zn&NC Samples
2.2. The Preparation of Electrochemical Performance Test
2.2.1. Electrode Anode Paste Preparation Process
- Beating: Use electronic scales according to the active substances/acetylene black (SP)/oily adhesive (PVDF) = 8:1:1. Put an amount according to the proportion of the total weight for 1 g of powder material into the beaker anode paste mixing configuration. Firstly, dissolve 0.1 g PVDF in NMP solution in a ratio of 1:29. Secondly, place the prepared solution in a drying oven at 120 °C until the PVDF is completely dissolved. Then, add 0.1 g acetylene black and 0.8 g active substance. In the fourth step, add six ball mills including one of a large particle size, two of medium particle size, and three of small particle size. Wrap the small beaker with aluminum foil and seal the beaker with plastic wrap. Finally, put the beaker into the agate can and ball mill for 6~8 h at a constant speed of 18 r s−1.
- Coating: Start the dehumidifier, wipe the knife table and the surface of the coating machine with alcohol, and adjust the knife table to zero. Keep the copper foil rough face up and open the vacuum pump, so that the copper foil closely adsorbs on the surface of the coater. Adjust the scale of the knife table to 10–12 μm, apply the pulp to the right side of the copper foil using the medication spoon, place the knife edge parallel to the right side of the pulp, start the coater, move the knife table to the left at a speed of 7 mm s−1, wipe the knife edge, and set it to zero after coating. The coated electrode sheet should be placed in the oven at 120 °C for more than 30 min to dry it, and the NMP should be volatilized.
- To roll: Start to roll the machine, using alcohol to clean the roller. Press the roller to exert pressure; after drying the pole piece of the roller, measure the roller pressure; after pressure relief, wipe the roller press and roller wheel again.
- Plate: the plate will not be kept to roll the sheet after coating, and the oriented anode plate machine using a dedicated fine structure will suppress the cathode piece into a 1.4 cm diameter size small round plate.
- Weighing: Blunt the circular pole piece weighing, and record the data; choose a quality close to the plate and make sure that the surface level is smooth; minus the bare copper foil quality of 15.1 mg, and multiply it by 0.8; this should conclude the quality of the active material.
- Drying: After weighing the sheet number, place it in a vacuum drying oven and adjust the temperature to 60 °C and the pressure in the cabinet to 1 MPa under the condition of drying for more than 12 h Set aside.
2.2.2. Buckle Battery Assembly
- The negative shell will be in the glove box on the table.
- Use clean tweezers; make sure that the clip of the lithium surface is smooth and concaves upward, and that the cathode shell is central.
- The flat diaphragm should cover the lithium.
- Using a pipetting gun, place 50 μL electrolytic liquid droplets in the surface of the diaphragm, so that they are fully infiltrated.
- Then, place the cathode piece, coated with active substances, face down in the middle of the diaphragm.
- Clip the gasket onto the cathode piece, and gently squeeze with forceps.
- Clip the shrapnel and maintain the small mouth up. The positive shell should cover it.
- Apply light pressure to ensure that the cover is on.
- Using plastic tweezers, clip the batteries in the tableting machine, with pressure of 100 Pa; maintain the pressure for 3~5 s, and make sure that there is pressure to take out the battery assembly of good batteries, saving more than 8 h of waiting for the test at room temperature.
2.2.3. Battery Performance Test
- Battery formation: At room temperature of 25 °C, the formation steps are as follows: Stand for 5 min; then, charge to 0.01 V at 0.1 A g−1 current density and stand for 5 min; at 0.1 A g−1 current constant, charge to 3.0 V, and then discharge at 0.1 A g−1. The process should be repeated three times and then be ended (the current changes according to the quality of the active substance in the electrode).
- The cell cycle: with 25 DHS C at room temperature and a charge and discharge voltage range of 0.01~3 V, the battery should be turned to the button cell, with cycles of 100~1000 times; when the charge and discharge current is set up according to turning it into the size of the battery charge given set, it can be divided into 0.1, with a 2 A g−1 charge and discharge cycle.
- Ratio test: this should come after the battery, respectively, in a 0.1, 0.2, 0.5, 1, and 2 A g−1 charge and discharge test, under different ratios of each cycle for six laps.
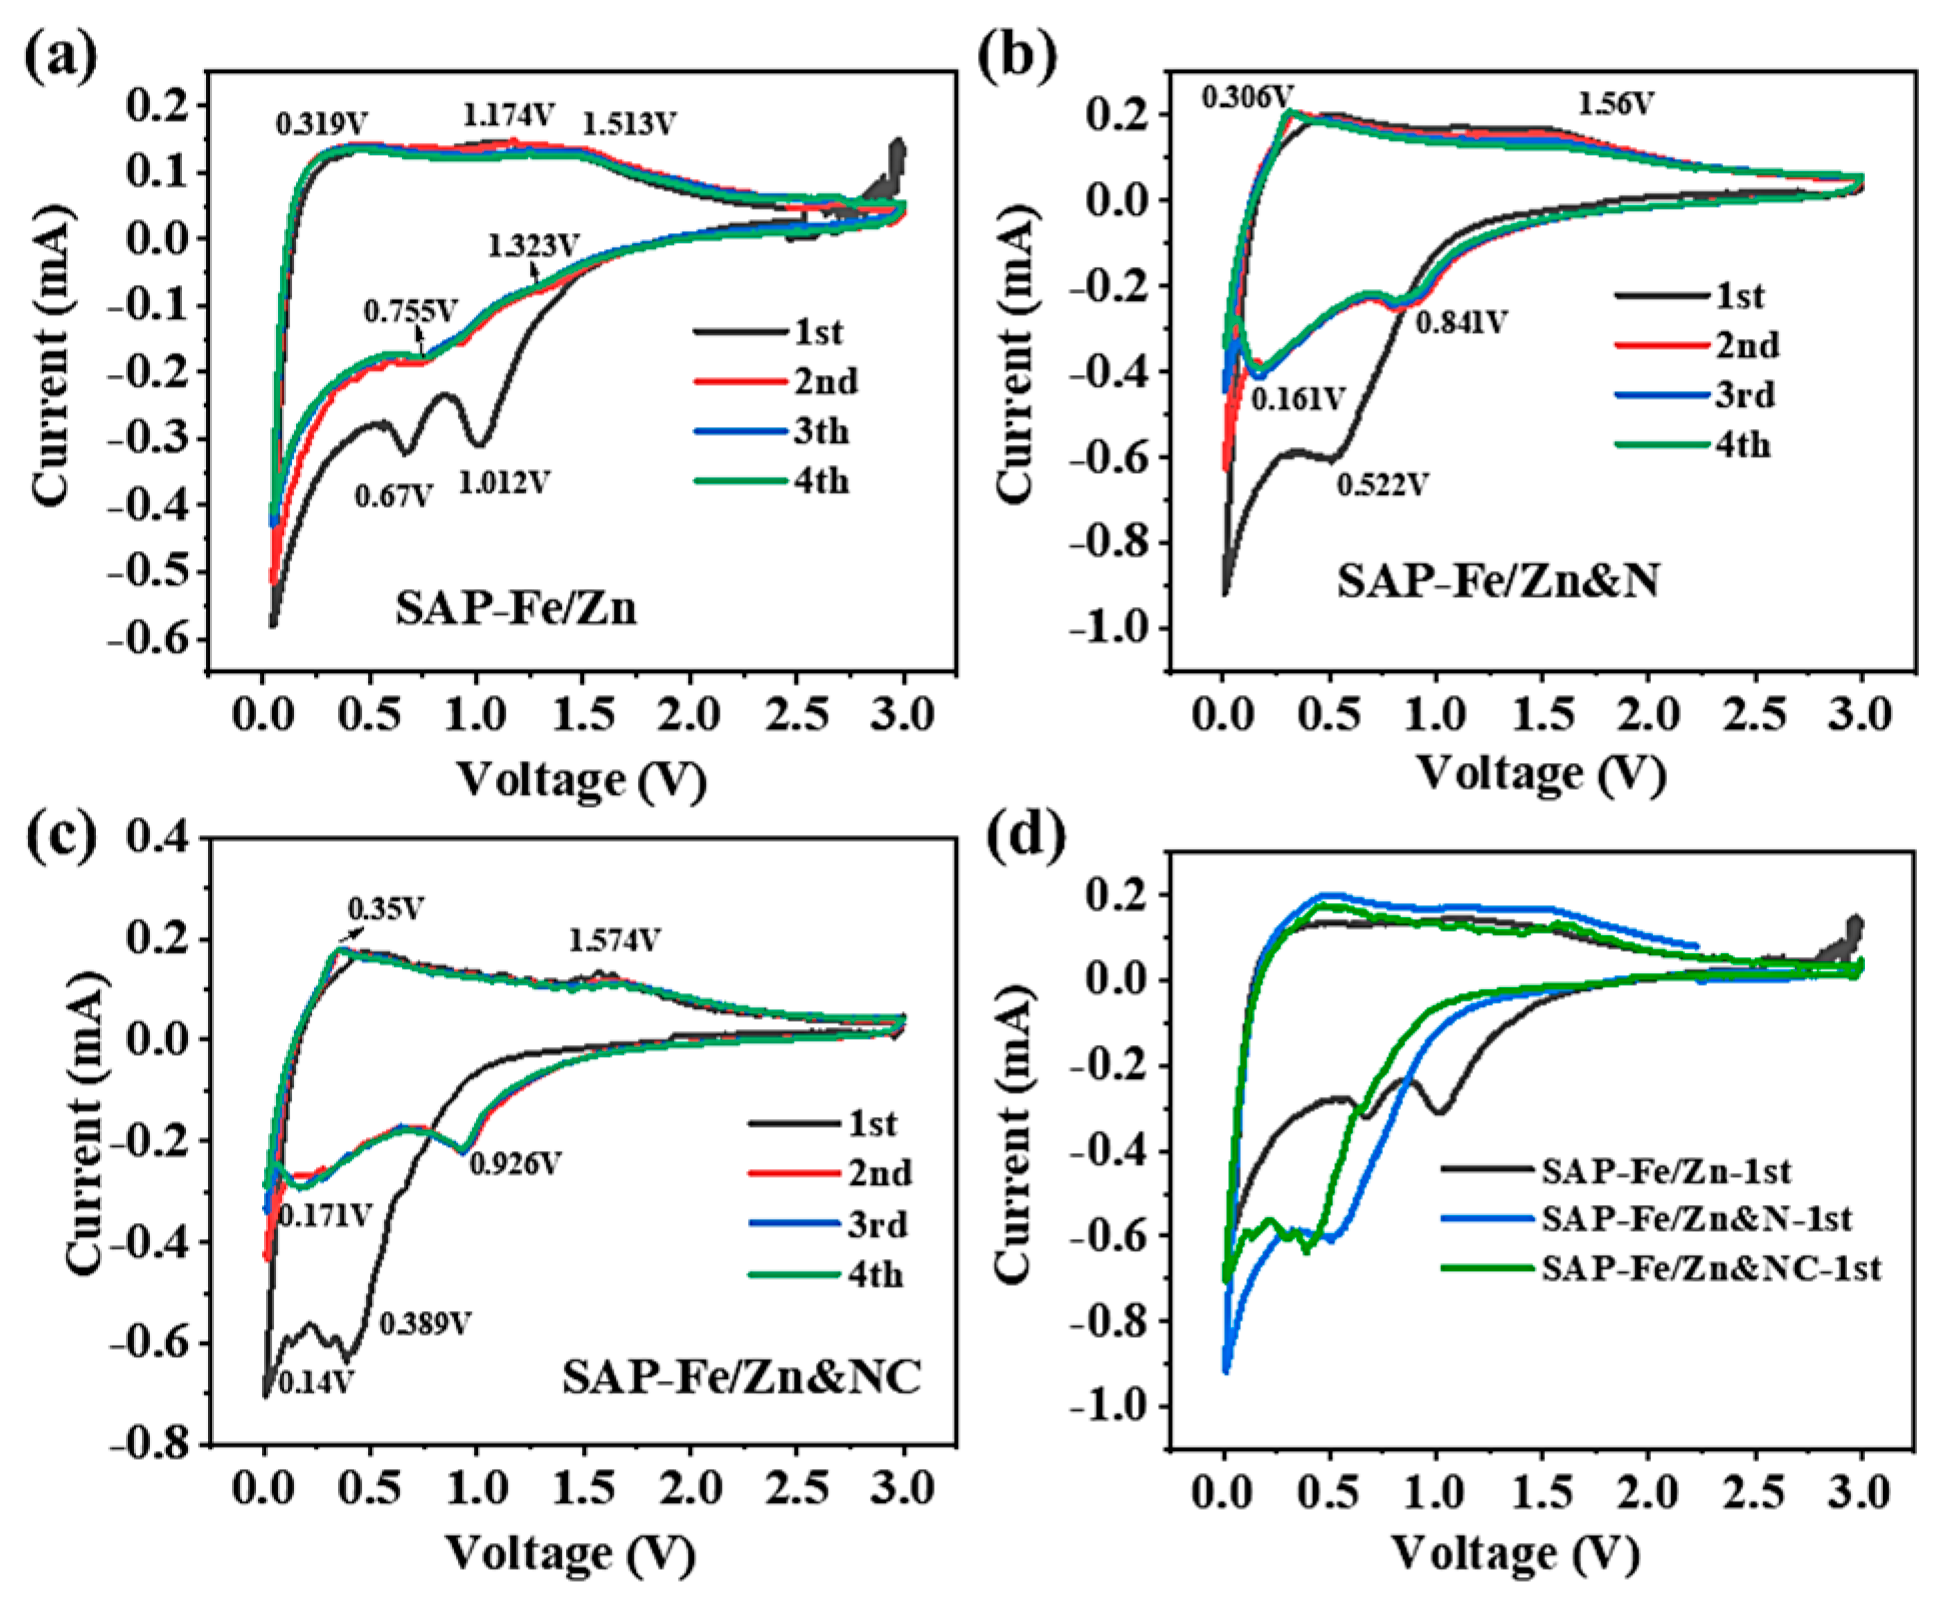
- The cyclic voltammetry test: This should be completed upon the assembly of the battery, at room temperature; set the voltage range to 0.01~3 V and the scan rate to 0.1 mV s−1 in the cyclic voltammetry test, and analyze the material in the case of REDOX reaction voltage. Moreover, the properties of the materials can be judged according to the REDOX peaks’ coincidence degree via the CV curves of multiple cycles.
- AC impedance test: to assess EIS after the battery test, test the frequency in the range of 0.01–106 Hz, create the curve fitting using Zview software (Zview 3.2.0.49), and carry out electrochemical impedance analysis on the battery.
3. Results and Discussion
4. Conclusions
Author Contributions
Funding
Institutional Review Board Statement
Informed Consent Statement
Data Availability Statement
Acknowledgments
Conflicts of Interest
References
- Feng, K.; Li, M.; Liu, W.; Kashkooli, A.G.; Xiao, X.; Cai, M.; Chen, Z. Silicon-based anodes for lithium-ion batteries: From fundamentals to practical applications. Small 2018, 14, 1702737. [Google Scholar] [CrossRef] [PubMed]
- Fang, Y.; Yu, X.Y.; Lou, X.W. Nanostructured electrode materials for advanced sodium-ion batteries. Matter 2019, 1, 90–114. [Google Scholar] [CrossRef] [Green Version]
- Zhou, L.; Zhang, K.; Hu, Z.; Tao, Z.; Mai, L.; Kang, Y.M.; Chou, S.L.; Chen, J. Recent developments on and prospects for electrode materials with hierarchical structures for lithium-ion batteries. Adv. Energy Mater. 2018, 8, 1701415. [Google Scholar] [CrossRef]
- Choi, N.S.; Chen, Z.; Freunberger, S.A.; Ji, X.; Sun, Y.K.; Amine, K.; Yushin, G.; Nazar, L.F.; Cho, J.; Bruce, P.G. Challenges facing lithium batteries and electrical double-layer capacitors. Angew. Chem. Int. Ed. 2012, 51, 9994–10024. [Google Scholar] [CrossRef] [PubMed]
- Xu, N.; Li, X.; Zhao, X.; Goodenough, J.B.; Huang, K. A novel solid oxide redox flow battery for grid energy storage. Energy Environ. Sci. 2011, 4, 4942–4946. [Google Scholar] [CrossRef] [Green Version]
- Dunn, B.; Kamath, H.; Tarascon, J.M. Electrical energy storage for the grid: A battery of choices. Science 2011, 334, 928–935. [Google Scholar] [CrossRef] [Green Version]
- Nayak, P.K.; Yang, L.; Brehm, W.; Adelhelm, P. From lithium-ion to sodium-ion batteries: Advantages, challenges, and surprises. Angew. Chem. Int. Ed. 2018, 57, 102–120. [Google Scholar] [CrossRef]
- Zhang, Q.; Chen, H.; Luo, L.; Zhao, B.; Luo, H.; Han, X.; Wang, J.; Wang, C.; Yang, Y.; Zhu, T.; et al. Harnessing the concurrent reaction dynamics in active Si and Ge to achieve high performance lithium-ion batteries. Energy Environ. Sci. 2018, 11, 669–681. [Google Scholar] [CrossRef]
- Sun, Y.; Guo, S.; Zhou, H. Exploration of advanced electrode materials for rechargeable sodium-ion batteries. Adv. Energy Mater. 2019, 9, 1800212. [Google Scholar] [CrossRef]
- Palacin, M.R. Recent advances in rechargeable battery materials: A chemist’s perspective. Chem. Soc. Rev. 2009, 38, 2565–2575. [Google Scholar] [CrossRef]
- Ma, M.; Dai, Y.; Zou, J.L.; Wang, L.; Pan, K.; Fu, H.G. Synthesis of iron oxide/partly graphitized carbon composites as a high-efficiency and low-cost cathode catalyst for microbial fuel cells. ACS Appl. Mater. Interfaces 2014, 6, 13438–13447. [Google Scholar] [CrossRef] [PubMed]
- Fei, H.; Peng, Z.; Li, L.; Yang, Y.; Lu, W.; Samuel, E.L.; Fan, X.; Tour, J.M. Preparation of carbon-coated iron oxide nanoparticles dispersed on graphene sheets and applications as advanced anode materials for lithium-ion batteries. Nano Res. 2014, 7, 502–510. [Google Scholar] [CrossRef]
- Jeong, Y.; Park, J.; Lee, S.; Oh, S.H.; Kim, W.J.; Ji, Y.J.; Park, G.Y.; Seok, D.; Shin, W.H.; Oh, J.M.; et al. Iron oxide-carbon nanocomposites modified by organic ligands: Novel pore structure design of anode materials for lithium-ion batteries. J. Electroanal. Chem. 2022, 904, 115905. [Google Scholar] [CrossRef]
- Ding, Y.; Liu, B.; Cai, R.; Xin, T.; Li, C.; Xia, L.; Wang, Y. One-pot synthesis of α-Fe2O3 nanospindles as high-performance lithium-ion battery anodes. Nano 2018, 13, 1850018. [Google Scholar] [CrossRef] [Green Version]
- Zhang, Y.; Pelliccione, C.J.; Brady, A.B.; Guo, H.; Smith, P.F.; Liu, P.; Marschilok, A.C.; Takeuchi, K.J.; Takeuchi, E.S. Probing the Li insertion mechanism of ZnFe2O4 in Li-ion batteries: A combined X-ray diffraction, extended X-ray absorption fine structure, and density functional theory study. Chem. Mater. 2017, 29, 4282–4292. [Google Scholar] [CrossRef]
- Tan, Q.; Kong, X.; Guan, X.; Wang, C.; Xu, B. Crystallization of zinc oxide quantum dots on graphene sheets as an anode material for lithium ion batteries. CrystEngComm 2020, 22, 320–329. [Google Scholar] [CrossRef]
- Laurenti, M.; Garino, N.; Porro, S.; Fontana, M.; Gerbaldi, C. Zinc oxide nanostructures by chemical vapour deposition as anodes for Li-ion batteries. J. Alloys Compd. 2015, 640, 321–326. [Google Scholar] [CrossRef]
- Guo, X.; Lu, X.; Fang, X.; Mao, Y.; Wang, Z.; Chen, L.; Xu, X.; Yang, H.; Liu, Y. Lithium storage in hollow spherical ZnFe2O4 as anode materials for lithium ion batteries. Electrochem. Commun. 2010, 12, 847–850. [Google Scholar] [CrossRef]
- Li, L.; Bi, H.; Gai, S.; He, F.; Gao, P.; Dai, Y.; Zhang, X.; Yang, D.; Zhang, M.; Yang, P. Uniformly dispersed ZnFe2O4 nanoparticles on nitrogen-modified graphene for high-performance supercapacitor as electrode. Sci. Rep. 2017, 7, 43116. [Google Scholar] [CrossRef] [Green Version]
- Wu, J.; Song, Y.; Zhou, R.; Chen, S.; Zuo, L.; Hou, H.; Wang, L. Zn–Fe–ZIF-derived porous ZnFe2O4/C@ NCNT nanocomposites as anodes for lithium-ion batteries. J. Mater. Chem. A 2015, 3, 7793–7798. [Google Scholar] [CrossRef]
- Ding, Y.; Yang, Y.; Shao, H. High capacity ZnFe2O4 anode material for lithium ion batteries. Electrochim. Acta 2011, 56, 9433–9438. [Google Scholar] [CrossRef]
- Yang, C.; Sun, M.; Zhang, L.; Liu, P.; Wang, P.; Lu, H. ZnFe2O4@ carbon core–shell nanoparticles encapsulated in reduced graphene oxide for high-performance Li-ion hybrid supercapacitors. ACS Appl. Mater. Interfaces 2019, 11, 14713–14721. [Google Scholar] [CrossRef] [PubMed]
- Jiang, B.; Han, C.; Li, B.; He, Y.; Lin, Z. In-situ crafting of ZnFe2O4 nanoparticles impregnated within continuous carbon network as advanced anode materials. ACS Nano 2016, 10, 2728–2735. [Google Scholar] [CrossRef] [PubMed]
- Xie, J.; Song, W.; Cao, G.; Zhu, T.; Zhao, X.; Zhang, S. One-pot synthesis of ultrafine ZnFe2O4 nanocrystals anchored on graphene for high-performance Li and Li-ion batteries. RSC Adv. 2014, 4, 7703–7709. [Google Scholar] [CrossRef]
- Naveen, A.N.; Selladurai, S. Investigation on physiochemical properties of Mn substituted spinel cobalt oxide for supercapacitor applications. Electrochim. Acta 2014, 125, 404–414. [Google Scholar] [CrossRef]
- Zhang, J.; Fan, S.; Wang, H.; Qian, J.; Yang, H.; Ai, X.; Liu, J. Surface-bound silicon nanoparticles with a planar-oriented n-type polymer for cycle-stable li-ion battery anode. ACS Appl. Mater. Interfaces 2019, 11, 13251–13256. [Google Scholar] [CrossRef]
- Lai, Q.; Zheng, J.; Tang, Z.; Bi, D.; Zhao, J.; Liang, Y. Optimal configuration of N-doped carbon defects in 2D turbostratic carbon nanomesh for advanced oxygen reduction electrocatalysis. Angew. Chem. 2020, 132, 12097–12104. [Google Scholar] [CrossRef]
- Li, J.; Li, X.; Zeng, L.; Fan, S.; Zhang, M.; Sun, W.; Chen, X.; Tadé, M.O.; Liu, S. Functionalized nitrogen-doped carbon dot-modified yolk shell ZnFe 2O4 nanospheres with highly efficient light harvesting and superior catalytic activity. Nanoscale 2019, 11, 3877–3887. [Google Scholar] [CrossRef]
- Asenbauer, J.; Passerini, S.; Bresser, D. ZnO-Based Conversion/Alloying Negative Electrodes for Lithium-Ion Batteries: Impact of Mixing Intimacy. Energy Technol. 2021, 9, 2001084. [Google Scholar] [CrossRef]
- Duncan, H.; Courtel, F.M.; Abu-Lebdeh, Y. A study of the solid-electrolyte-interface (SEI) of ZnMn2O4: A conversion-type anode material for Li-ion batteries. J. Electrochem. Soc. 2015, 162, A7110. [Google Scholar] [CrossRef]
- Wang, M.; Huang, Y.; Chen, X.; Wang, K.; Wu, H.; Zhang, N.; Fu, H. Synthesis of nitrogen and sulfur co-doped graphene supported hollow ZnFe2O4 nanosphere composites for application in lithium-ion batteries. J. Alloys Compd. 2017, 691, 407–415. [Google Scholar] [CrossRef]
- Liu, S.; Xie, J.; Fang, C.; Cao, G.; Zhu, T.; Zhao, X. Self-assembly of a CoFe2O4/graphene sandwich by a controllable and general route: Towards a high-performance anode for Li-ion batteries. J. Mater. Chem. 2012, 22, 19738–19743. [Google Scholar] [CrossRef]
- Zhang, L.; Wei, T.; Yue, J.; Sheng, L.; Jiang, Z.; Yang, D.; Yuan, L.; Fan, Z. Ultra-small and highly crystallized ZnFe2O4 nanoparticles within double graphene networks for super-long life lithium-ion batteries. J. Mater. Chem. A 2017, 5, 11188–11196. [Google Scholar] [CrossRef]
- Bini, M.; Ambrosetti, M.; Spada, D. ZnFe2O4, a green and high-capacity anode material for lithium-ion batteries: A review. Appl. Sci. 2021, 11, 11713. [Google Scholar] [CrossRef]


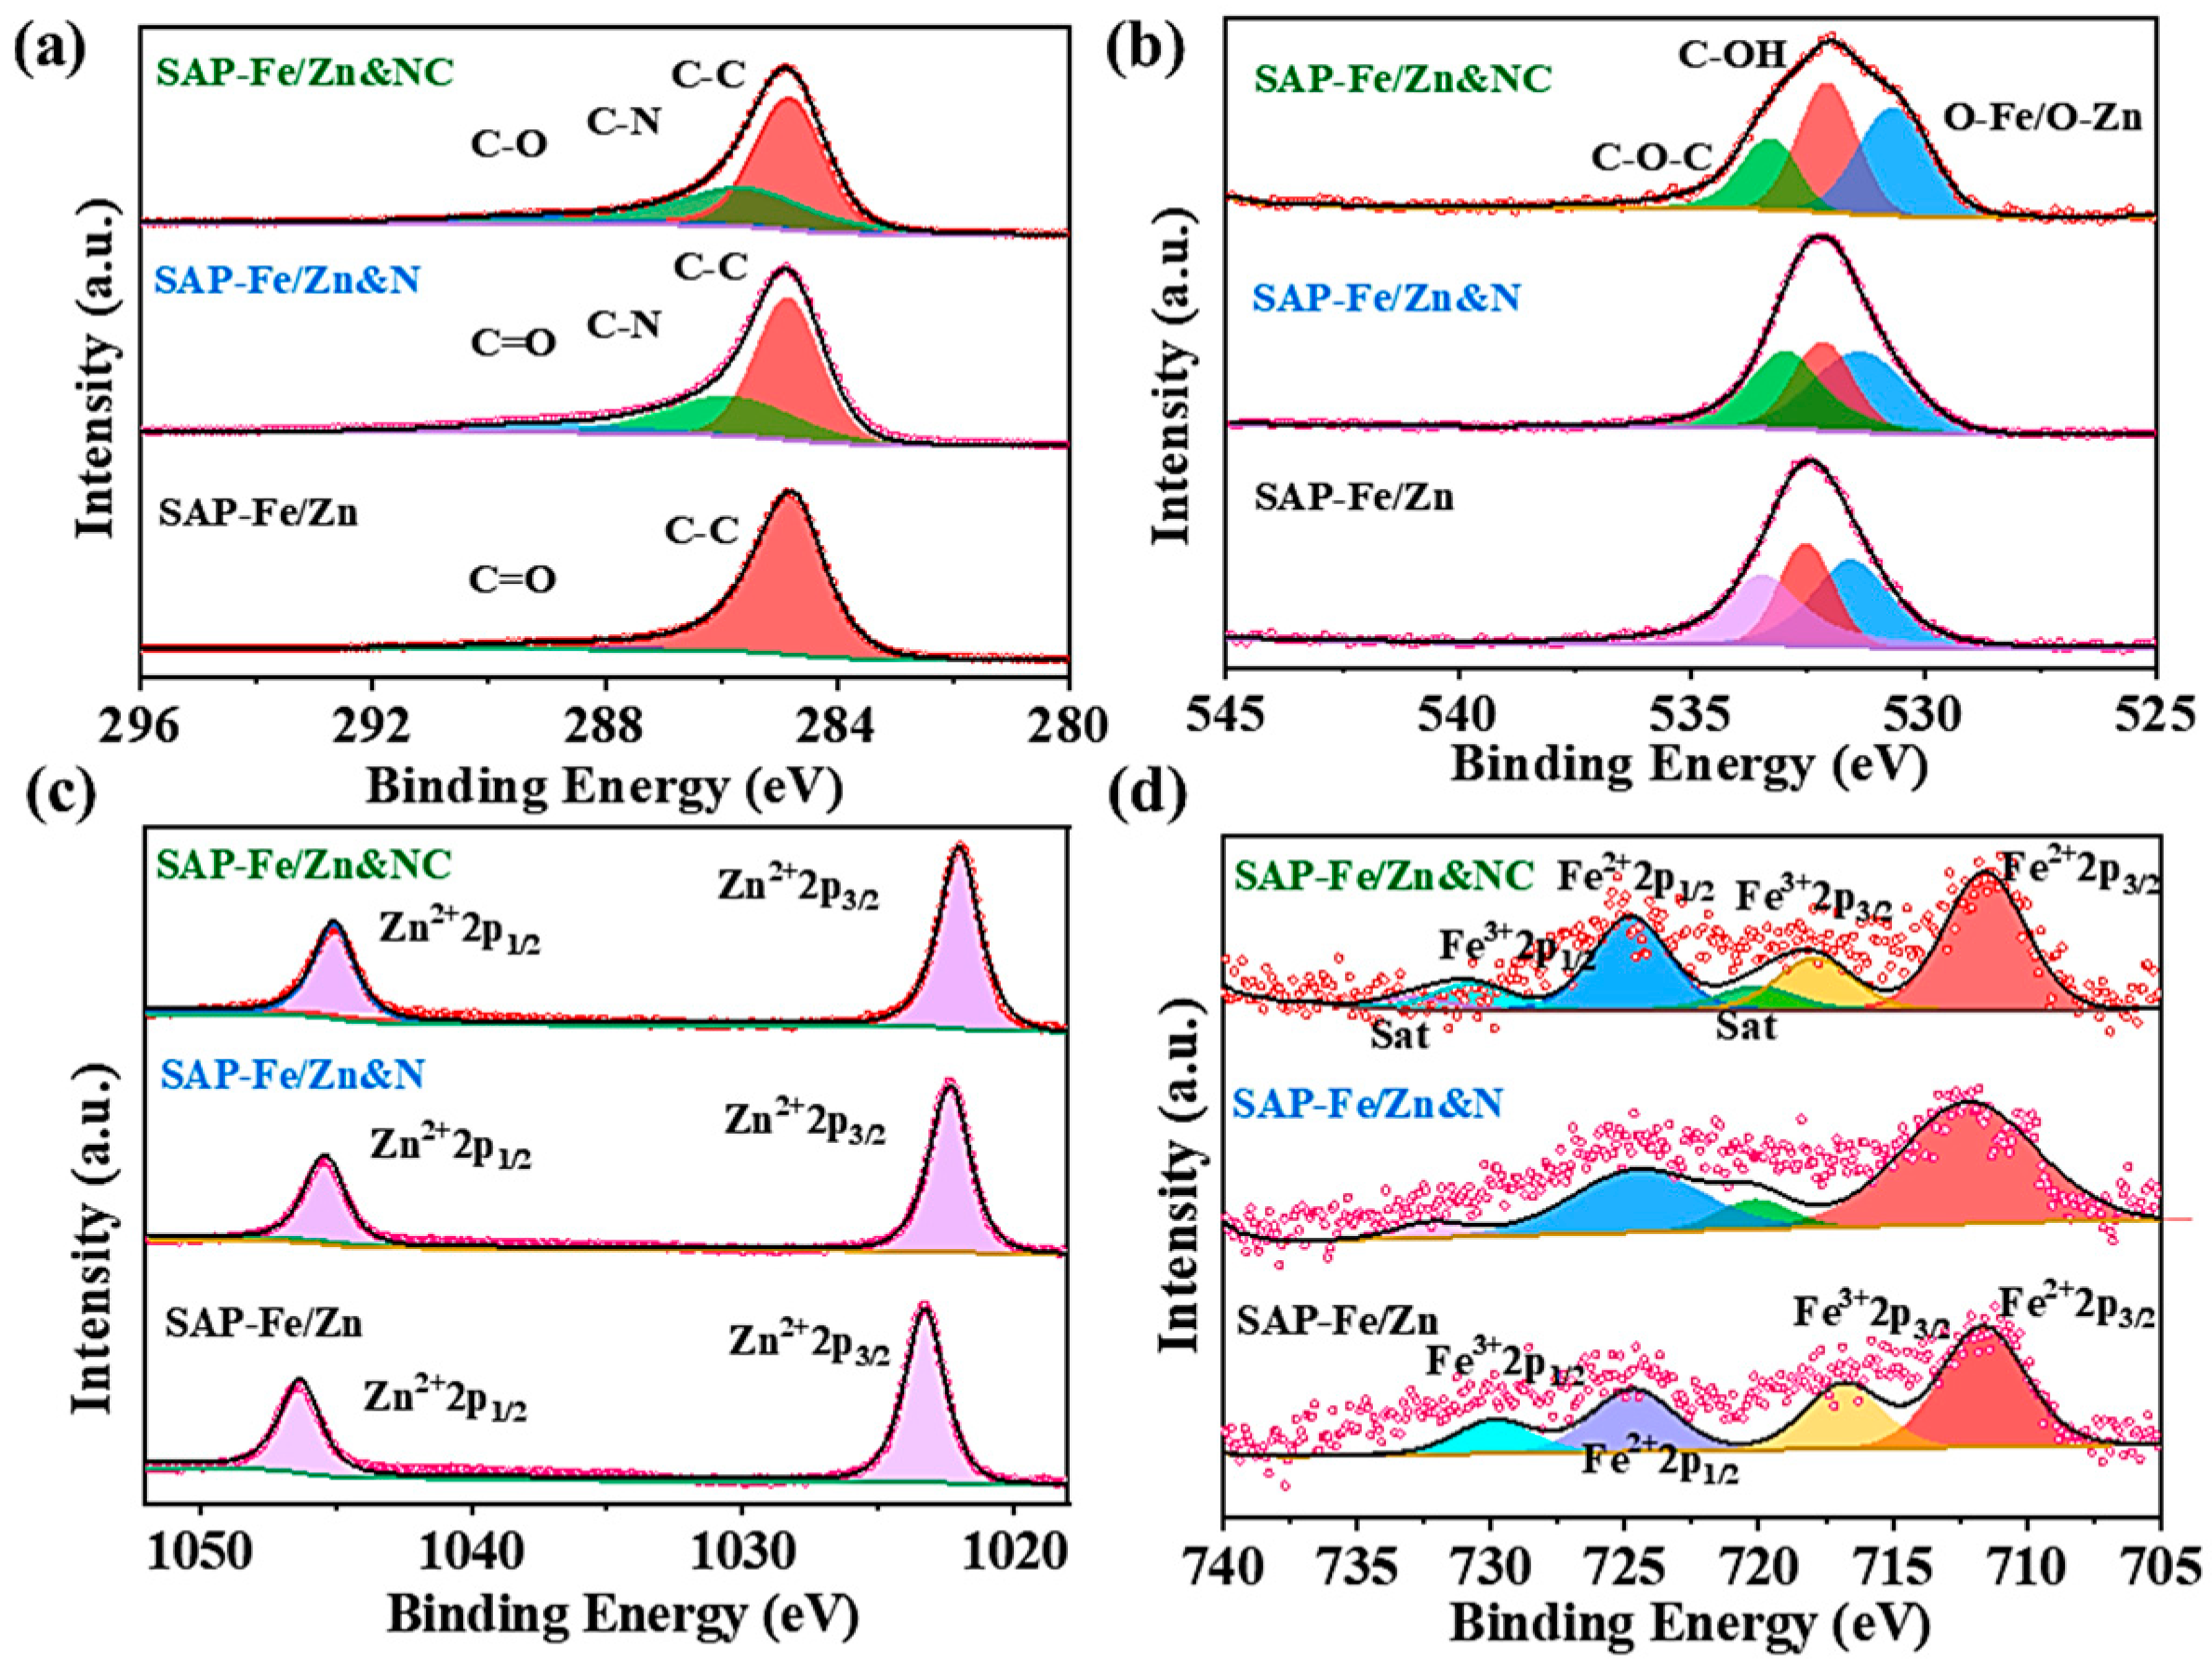
| Types of N | Graphitic-N | Pyridinic-N | Pyrrolic-N | |
|---|---|---|---|---|
| Atomic (%) | SAP-Fe/Zn&N | 0.07 | 0.39 | 0.18 |
| SAP-Fe/Zn&NC | 0.03 | 0.39 | 0.25 | |
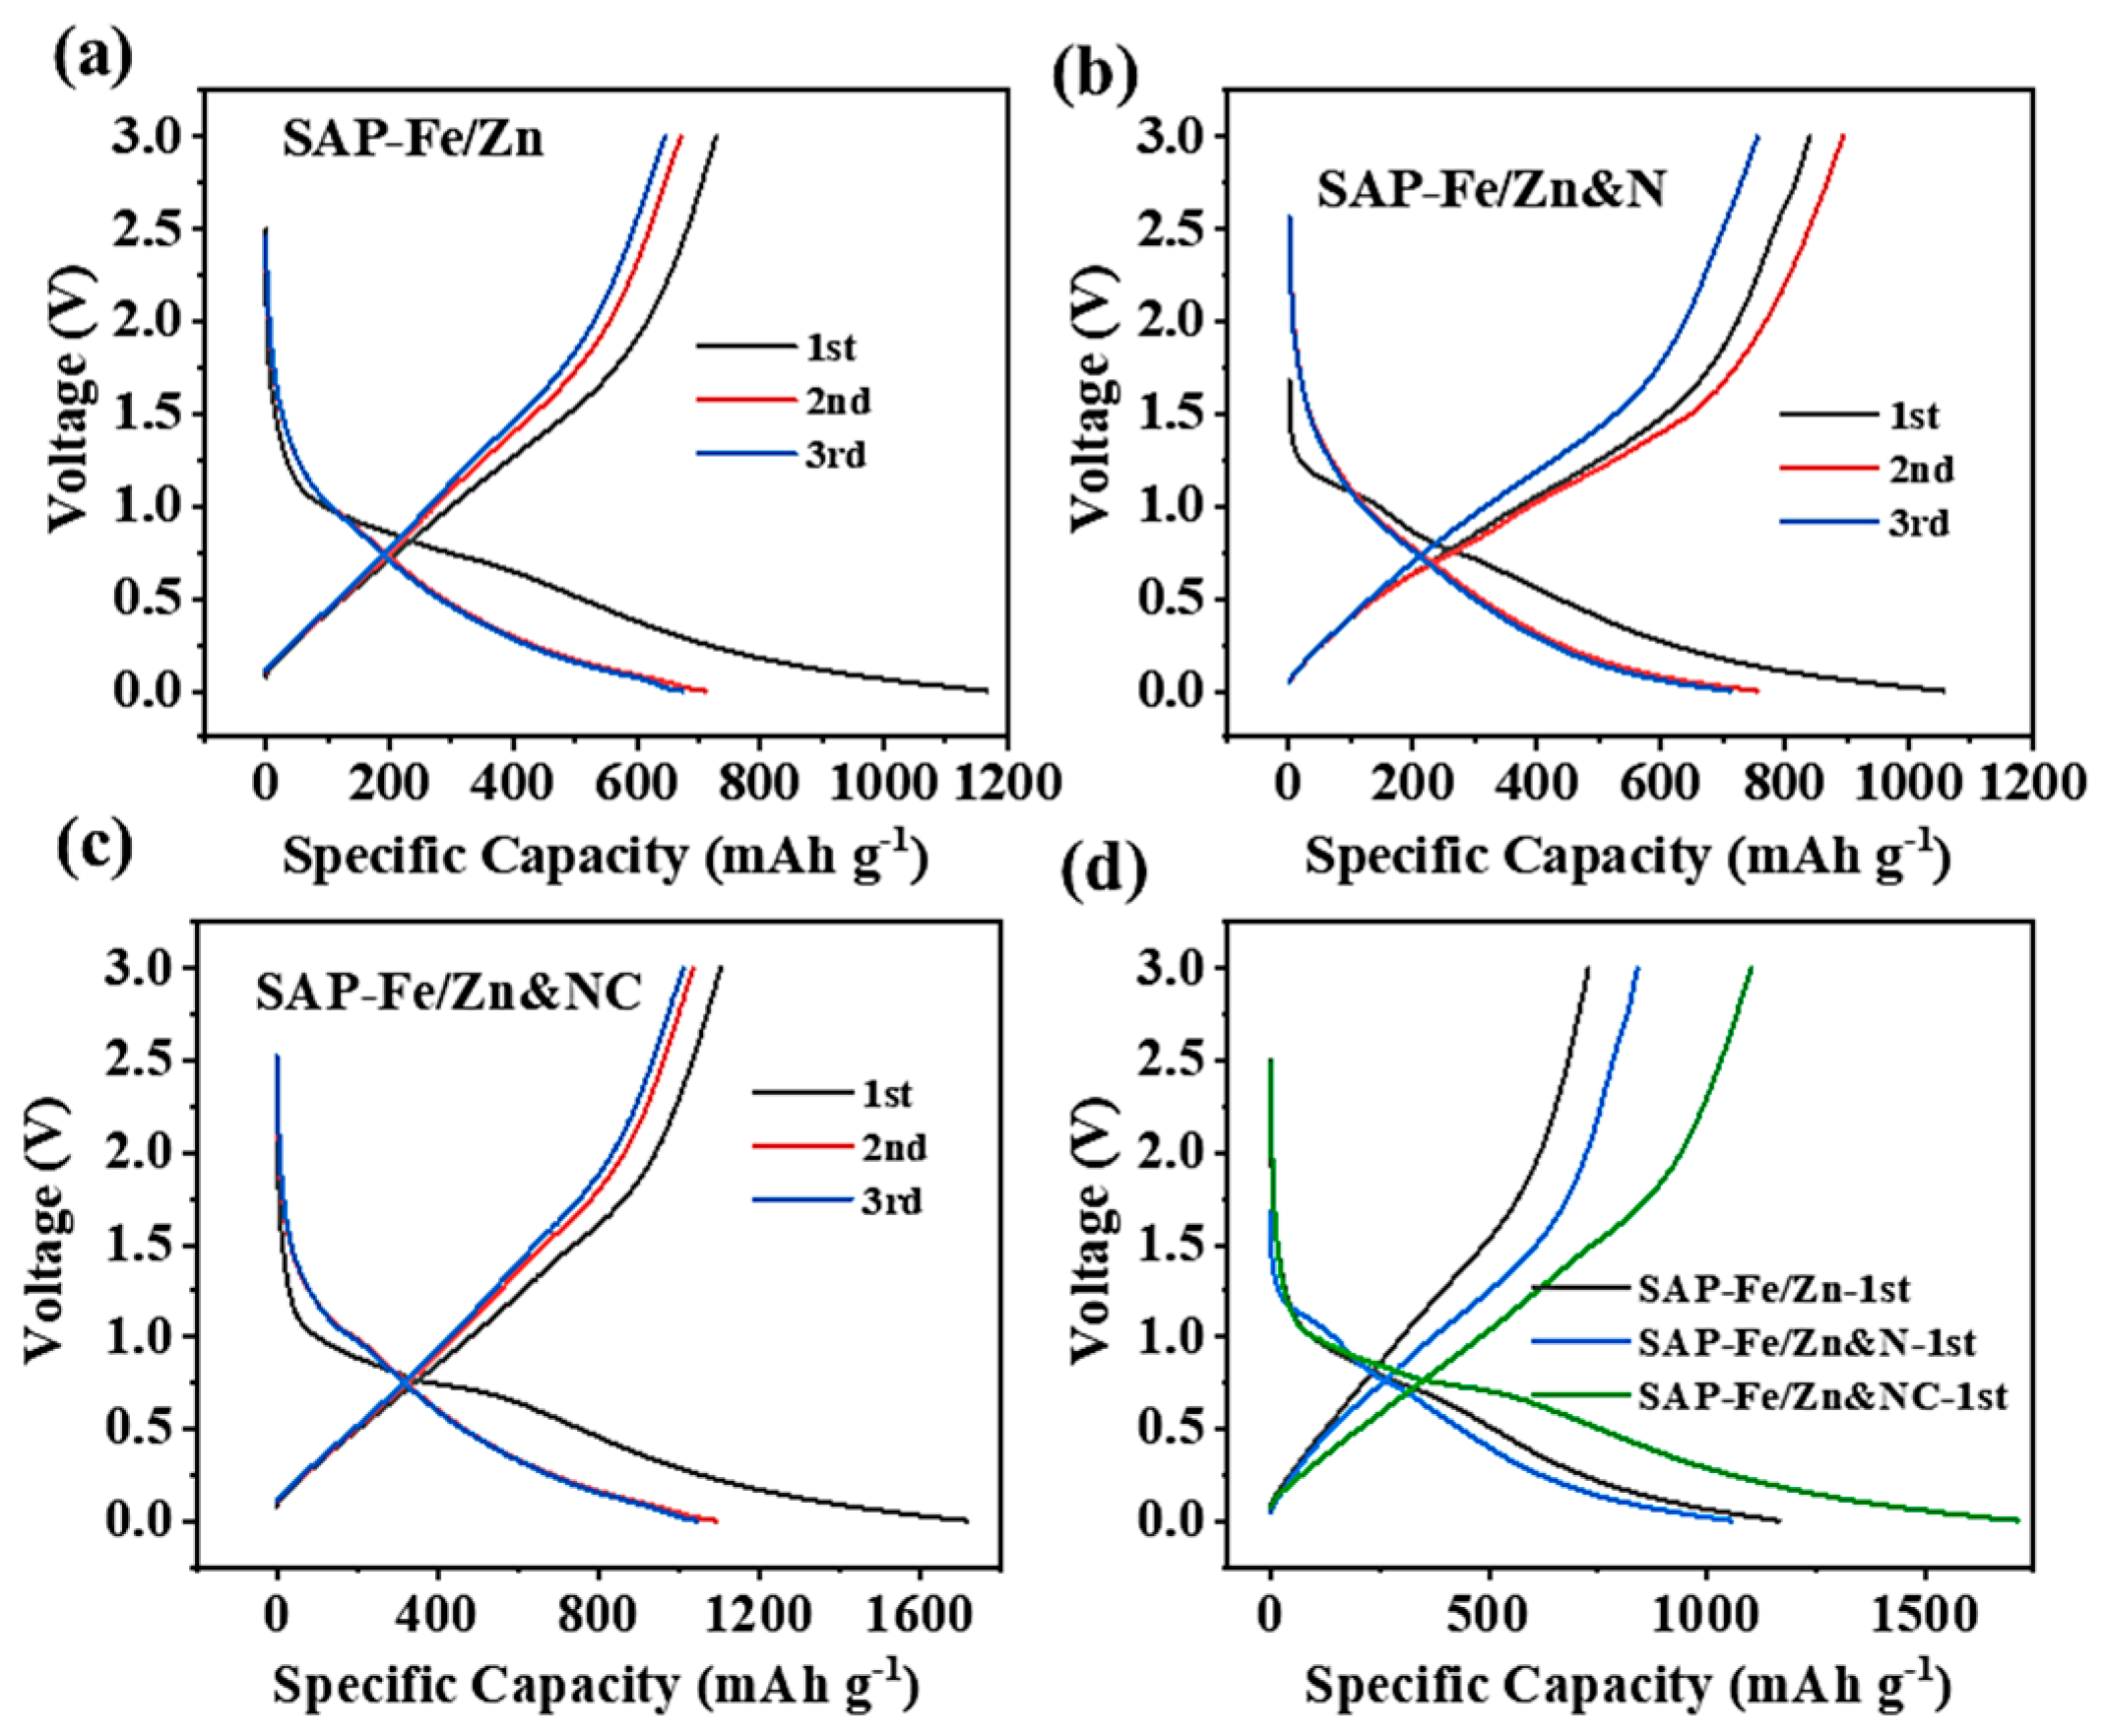
| Sample | First Discharge-Specific Capacity (mAh g−1) | First Charge-Specific Capacity (mAh g−1) | First Charge and Discharge Efficiency (%) |
|---|---|---|---|
| SAP-Fe/Zn | 1165.5 | 728.0 | 62.5 |
| SAP-Fe/Zn&N | 1056.9 | 840.2 | 79.5 |
| SAP-Fe/Zn&NC | 1712.5 | 1101.6 | 64.3 |
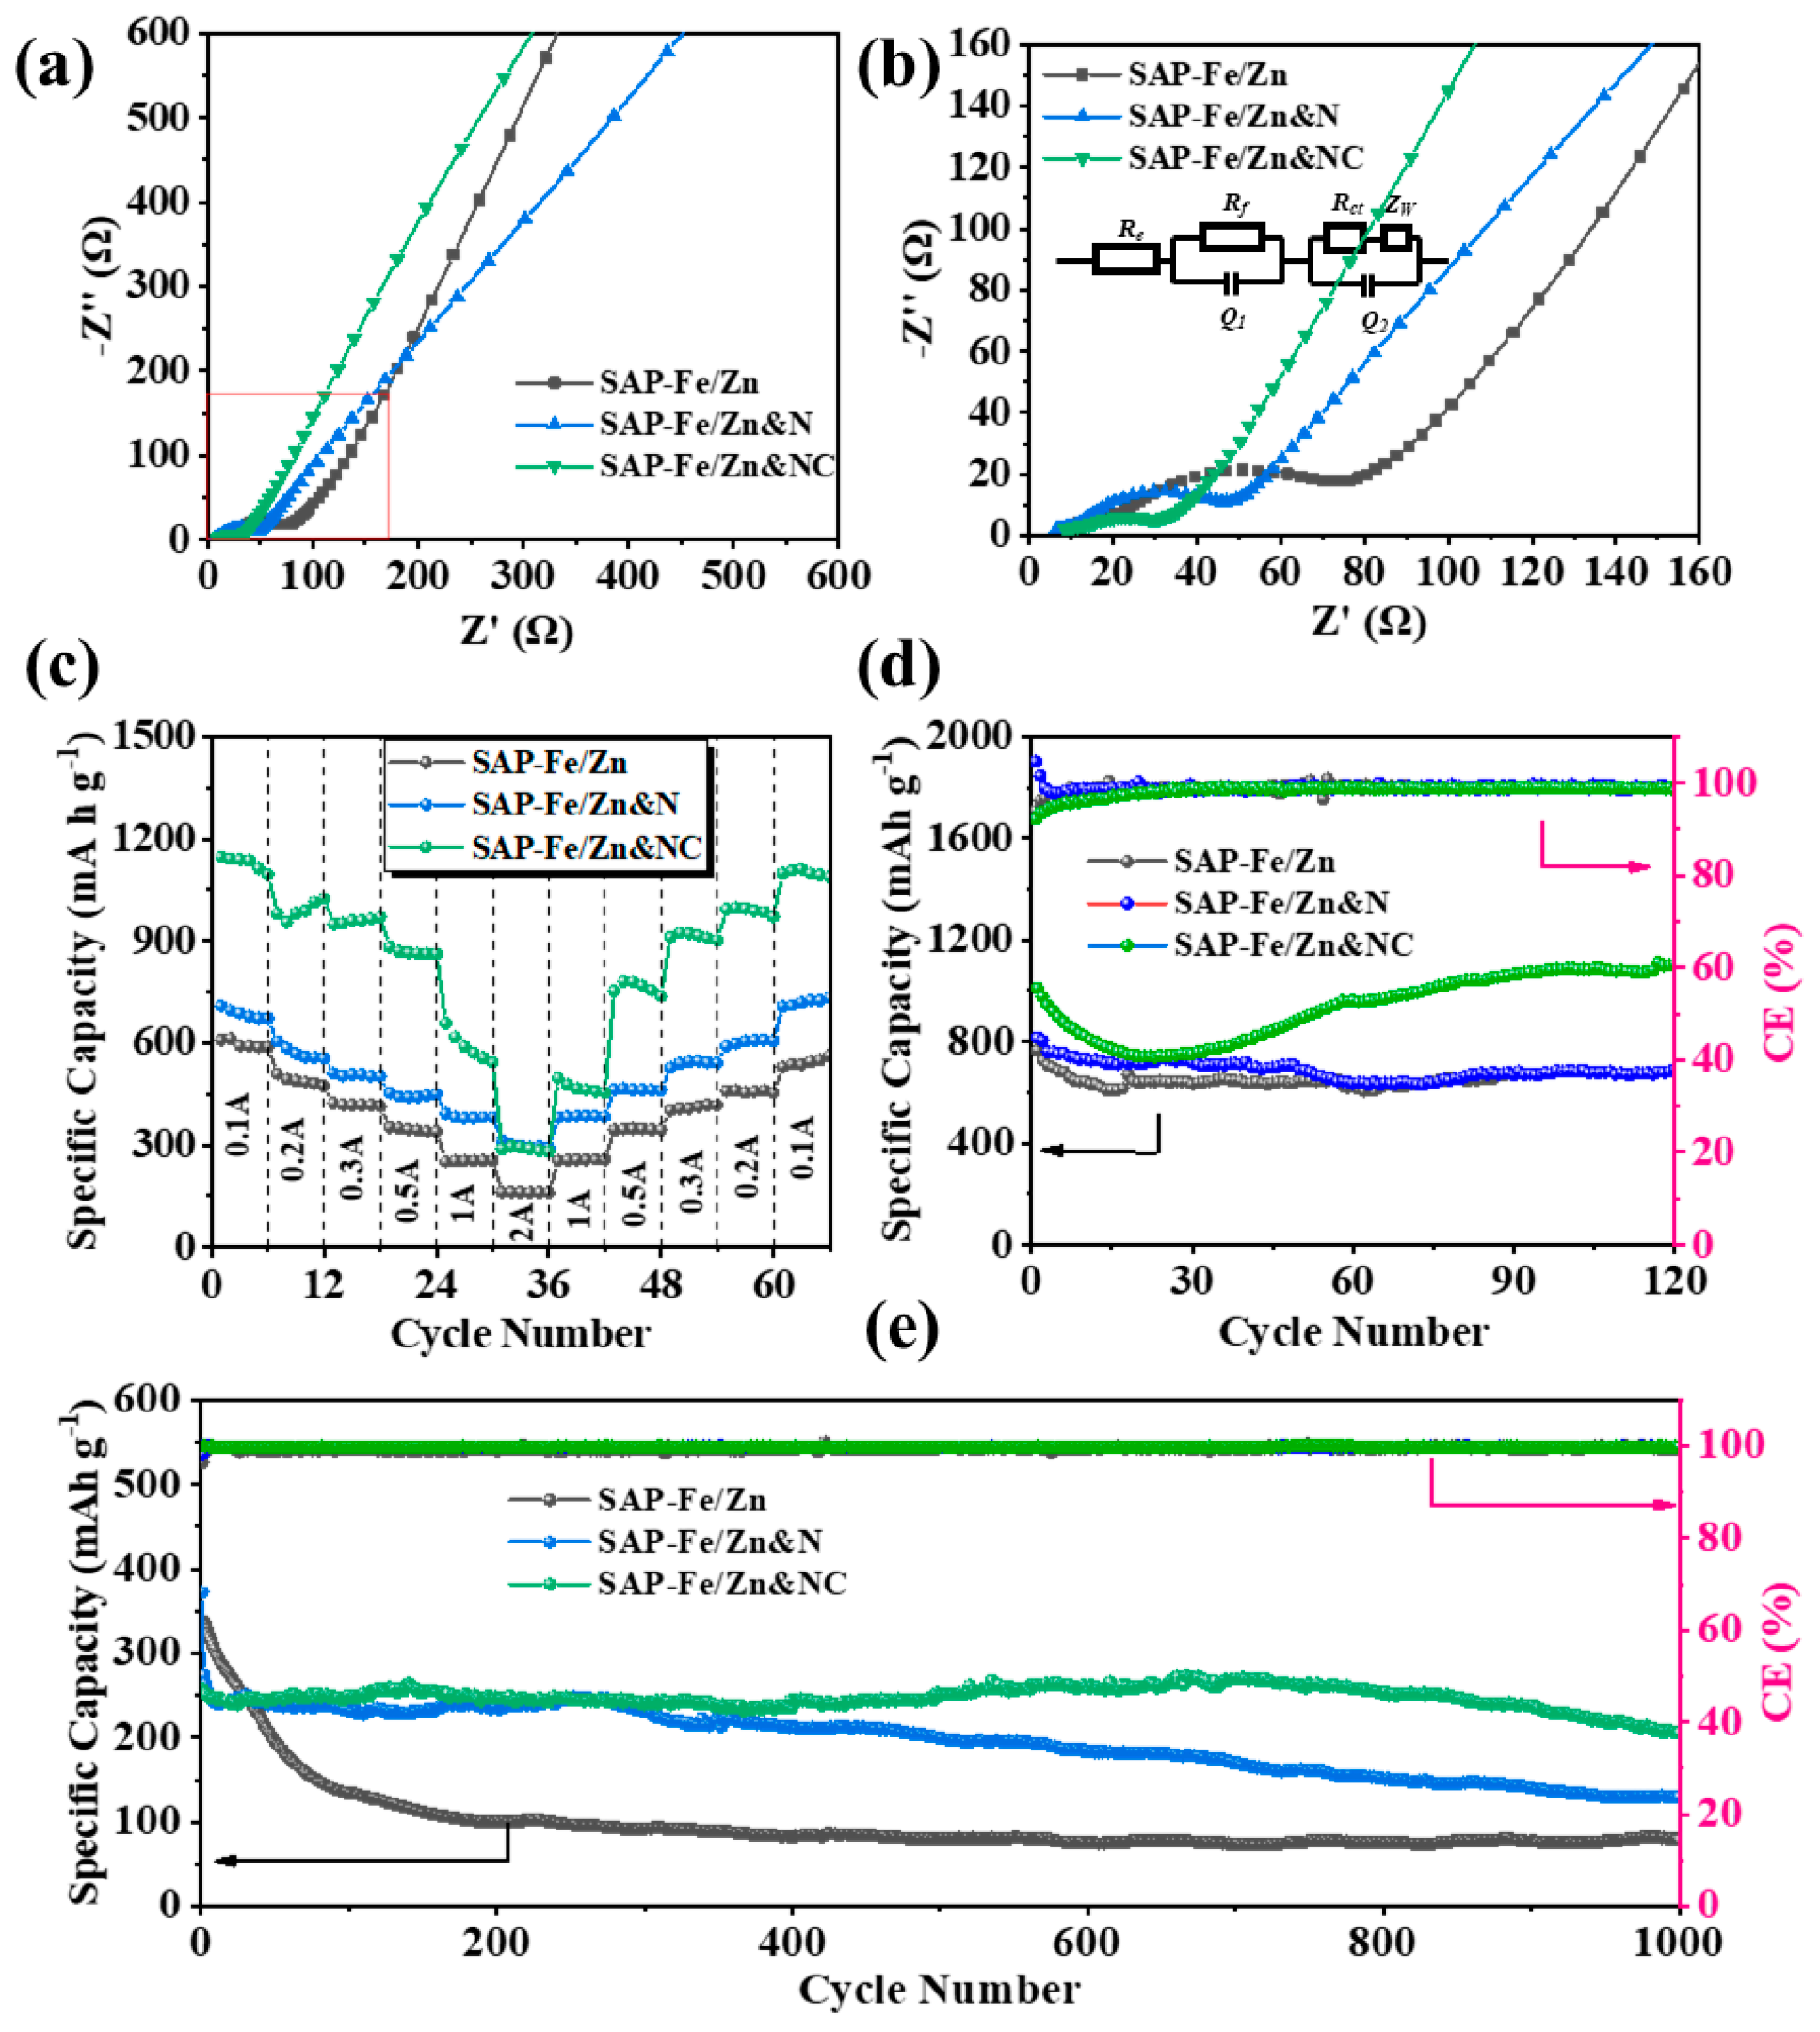
| Sample | Re (ohm) | Rct (ohm) | W0 (ohm) |
|---|---|---|---|
| SAP-Fe/Zn | 10.69 | 89.0 | 0.37 |
| SAP-Fe/Zn&N | 6.02 | 47.34 | 0.62 |
| SAP-Fe/Zn&NC | 6.20 | 35.13 | 0.70 |
| Sample | Specific Capacity for First Charge (mAh g−1) | After 120 Cycles of Charge-Specific Capacity (mAh g−1) | Cycle Retention Rate (%) |
|---|---|---|---|
| SAP-Fe/Zn | 765.8 | 679.3 | 88.7 |
| SAP-Fe/Zn&N | 814.7 | 682.8 | 83.8 |
| SAP-Fe/Zn&NC | 1010.6 | 1102.1 | 109.1 |
| Sample | Specific Capacity for First Charge (mAh g−1) | After 1000 Cycles of Charge-Specific Capacity (mAh g−1) | Cycle Retention Rate (%) |
|---|---|---|---|
| SAP-Fe/Zn | 337.4 | 79.4 | 23.5 |
| SAP-Fe/Zn&N | 274.4 | 130.2 | 47.4 |
| SAP-Fe/Zn&NC | 254.7 | 205.6 | 80.7 |
Disclaimer/Publisher’s Note: The statements, opinions and data contained in all publications are solely those of the individual author(s) and contributor(s) and not of MDPI and/or the editor(s). MDPI and/or the editor(s) disclaim responsibility for any injury to people or property resulting from any ideas, methods, instructions or products referred to in the content. |
© 2023 by the authors. Licensee MDPI, Basel, Switzerland. This article is an open access article distributed under the terms and conditions of the Creative Commons Attribution (CC BY) license (https://creativecommons.org/licenses/by/4.0/).
Share and Cite
Wang, L.; Li, B.; Bai, H.; Ding, H.; Xu, N.; Yin, C.; Xiong, J.; Yang, Z.; Rao, X.; Dong, B. Preparation of Nitrogen-Doped ZnFe2O4-Modified Carbon Composite and Its Collaborative Energy Storage Mechanism. Coatings 2023, 13, 1126. https://doi.org/10.3390/coatings13061126
Wang L, Li B, Bai H, Ding H, Xu N, Yin C, Xiong J, Yang Z, Rao X, Dong B. Preparation of Nitrogen-Doped ZnFe2O4-Modified Carbon Composite and Its Collaborative Energy Storage Mechanism. Coatings. 2023; 13(6):1126. https://doi.org/10.3390/coatings13061126
Chicago/Turabian StyleWang, Li, Baobao Li, Hongyu Bai, Hong Ding, Na Xu, Chaofan Yin, Jingjing Xiong, Zhiwei Yang, Xianfa Rao, and Binbin Dong. 2023. "Preparation of Nitrogen-Doped ZnFe2O4-Modified Carbon Composite and Its Collaborative Energy Storage Mechanism" Coatings 13, no. 6: 1126. https://doi.org/10.3390/coatings13061126