Article

Morphological Evolution of La2NiO4 Coatings Synthesized by Reactive Magnetron Sputtering (RMS) at High Pressure as Cathode for Intermediate Temperature Solid Oxide Fuel Cell (IT-SOFC)

1
FEMTO-ST Institute (UMR CNRS 6174), UBFC/UTBM, Site de Montbéliard, F-90010 Belfort, France
2
USR FC Lab (CNRS FR3539), F-90010 Belfort, France
3
School of Materials Science and Engineering, Xi’an University of Science and Technology, Xi’an 710054, China
4
Faculty of Metallurgical and Energy Engineering, Kunming University of Science and Technology, Kunming 650093, China
5
ICB (UMR CNRS 6303), UBFC/UTBM, Site de Sévenans, F-90010 Belfort, France
*
Authors to whom correspondence should be addressed.
Coatings 2023, 13(6), 1113; https://doi.org/10.3390/coatings13061113
Submission received: 30 May 2023 / Revised: 13 June 2023 / Accepted: 15 June 2023 / Published: 16 June 2023

Abstract

:
This work focuses on the evolution of the morphology and structure of La2NiO4 (namely, LNO) coatings deposited by reactive magnetron sputtering (RMS) with subsequent annealing processes. The LNO coatings start to crystallize at 600 °C, and the LNO with K2NiF4 structure was formed at 700 °C. A small amount of La3Ni2O7 appeared in the La2NiO4 coatings at 1100 °C. Interestingly, the LNO coatings realize the transformation from dense to different porous morphologies due to the annealing process. The LNO coating with abundant pores was formed after annealing treatment at 1000 °C for 2 h. This porous morphology can be stably maintained after short-term thermal stability experiments at 750 °C for 120 h. The electrochemical impedance spectroscopy (EIS) measurement of the LNO/YSZ/LNO symmetrical half-cells shows that the LNO cathode coating after annealing at 1000 °C for 2 h exhibits lower polarization resistance (Rpol) and activation energy.

1. Introduction

As an energy conversion device, the solid oxide fuel cell (SOFC) can directly convert chemical energy into electrical energy. However, the SOFC working in the high temperature range of 800–1000 °C causes high cost in materials and challenges in compatibility [1]. The last generation of solid oxide fuel cells operating at intermediate temperatures (IT, 500–750 °C) can alleviate these drawbacks and increase the cell lifetime [2]. However, the low operating temperature leads to the catalytic activity for the oxygen reduction reaction (ORR), which in turn degrades the cell performance. To address this issue, considerable efforts have been devoted to developing novel materials with enhanced ORR performance [3,4,5]. Some materials such as La1-xSrxCo1-yFeyO3-δ (LSCF), La0.6Sr0.4CoO3-δ (LSC), La0.8Sr0.2MnO3 (LSM), Sm0.5Sr0.5CoO3-δ (SSC), or Ba0.5Sr0.5Co0.8Fe0.2O3-δ (BSCF) have been proposed as the cathode [6,7,8]. Unfortunately, these cathode materials were still not perfect for practical applications, mainly due to insufficient ORR activity or stability, and/or incompatibility with other cell components (electrolyte or interconnectors). On the other hand, in attempts to find new materials that can be used as cathodes for IT-SOFC, a class of perovskite-type materials with K2NiF4 structure has received more attention due to their mixed ionic and electronic conductivity (MIEC) [9]. La2NiO4 is a typical K2NiF4-type material that exhibits excellent performance on surface oxygen exchange and chemical stability from room temperature up to 1300 °C [10,11]. In addition, the thermal expansion coefficient of La2NiO4 (13.0 × 10⁻⁶ K−1) is close to that of the commonly used electrolyte yttria stabilized zirconia (YSZ, 11.6 × 10⁻⁶ K−1) and ferritic steel interconnect materials (11.0–12.5 × 10⁻⁶ K−1) [12,13]. The application of La2NiO4 to half cells and single cells with different electrolytes has been studied and has shown interesting results. The Rp of La2NiO4 in a symmetrical cell configuration are 5.2 Ω·cm2 [14] and 2.2 Ω·cm2 [15] at 600 °C in air, which is much lower than 72.54 Ω·cm2 for La0.8Sr0.2MnO3 (LSM) [16].
Physical vapor deposition techniques are widely used to deposit dense electrolyte layers [17] or barrier layers [18] in the field of SOFC. Recently, cathode coatings deposited by this technique have also gained attention [19,20]. Previous work in our laboratory has demonstrated that Ln2NiO4 (Ln = La, Pr, Nd) coatings as the cathode on the half-cell and/or single cell can be successfully synthesized by RMS with promising results [10,20,21]. However, the morphology evolution of the coatings deposited by magnetron sputtering deserves further investigation in order to obtain suitable porous structures. This is helpful to further promote the application of magnetron sputtering in SOFC cathode preparation.
This work focuses mainly on the exploration of the synthesis of a porous LNO cathode by RMS. The evolution of the morphology and structure of the LNO coating was investigated as a function of the annealing treatment temperature. The electrochemical performance of LNO cathodes with different morphologies was evaluated by measuring the electrochemical impedance spectroscopy of LNO/YSZ/LNO symmetric cells. The link between the electrochemical performance and morphology of LNO cathodes deposited by magnetron sputtering is demonstrated. This work can provide a reliable reference for the synthesis of porous SOFC cathode layers by magnetron sputtering.

2. Experimental Procedure

2.1. Deposition Device

The DC reactive magnetron sputtering technique was used to synthesize La2NiO4 material by using metallic La and Ni targets with a purity of 99.9% (ϕ145 × 6 mm) in a mixture atmosphere of argon and oxygen. A 90 L sputtering chamber vacuumed by a turbo molecular pump allowing less than 10−5 Pa as the base vacuum was used. The argon and oxygen flow rates were controlled by using Brooks flowmeters, and the total pressure measurement was performed via an MKS Baratron gauge. The substrates were positioned on a substrate holder at the draw distance of 70 mm parallel to the sources and rotated to ensure a homogenous deposition. The targets mounted on the unbalanced magnetron were powered through pulsed DC generators allowing the power discharge control. Alumina ceramic and yttria stabilized zirconia (YSZ) pellets as well as glass slides were used as substrate supporting coating to measure various properties such as structure, conductivity, chemical composition, electrical properties, and optical transmittance. All substrates were cleaned with alcohol and soap, and then rinsed with water and dried prior to deposition.

2.2. Characterization

The morphology and composition of the coatings were characterized by scanning electron microscopy (SEM) equipped with energy dispersive spectroscopy (EDS) via a JEOL JSM 5800 LV. The pore size distribution of the coating was obtained from the SEM results by using Nano Measurer 1.2. The structure of the coatings was determined by X-ray diffraction (XRD, BRUKER D8) with Co-Kα1+α2 at 35 kV and 40 mA. The diffraction patterns were collected at room temperature in the angle range of 20° ≤ 2θ ≤ 90° with a scan step of 0.019°. The thickness of the coatings was measured using an Altysurf profilometer allowing an accuracy of about 20 nm. A UV-visible-NIR Shimadzu VU-3600 spectrophotometer controlled by UV probe 2.33 software was used to measure the optical transmittance of the coatings deposited on the glass substrate.
The four-point probe method was used to measure the electrical conductivity of the coatings deposited on alumina substrates by using Agilent 3458 A with four Pt aligned electrodes. The two outer probes act as current-carrying electrodes (I1, I2), while the two inner ones are used to measure the voltages (E1, E2). The LNO/YSZ/LNO symmetric cells were used for EIS experiments through a Solartron 1260 impedance/gain-phase analyzer equipped with a furnace (Pekly, Thions Gardais, France) allowing temperatures from room temperature to 1000 °C under ambient air. One side of the symmetrical cell is in contact with a platinum plate, and the other side is placed with a platinum grid to ensure electrical contact. The EIS measurements were performed in the frequency range of 1 MHz–1 Hz with an amplitude voltage of 0.2 V under ambient air in the temperature range of 700–900 °C. The impedance spectra data were fitted by Z-View 3.5 software to extract impedance information.

3. Results and Discussion

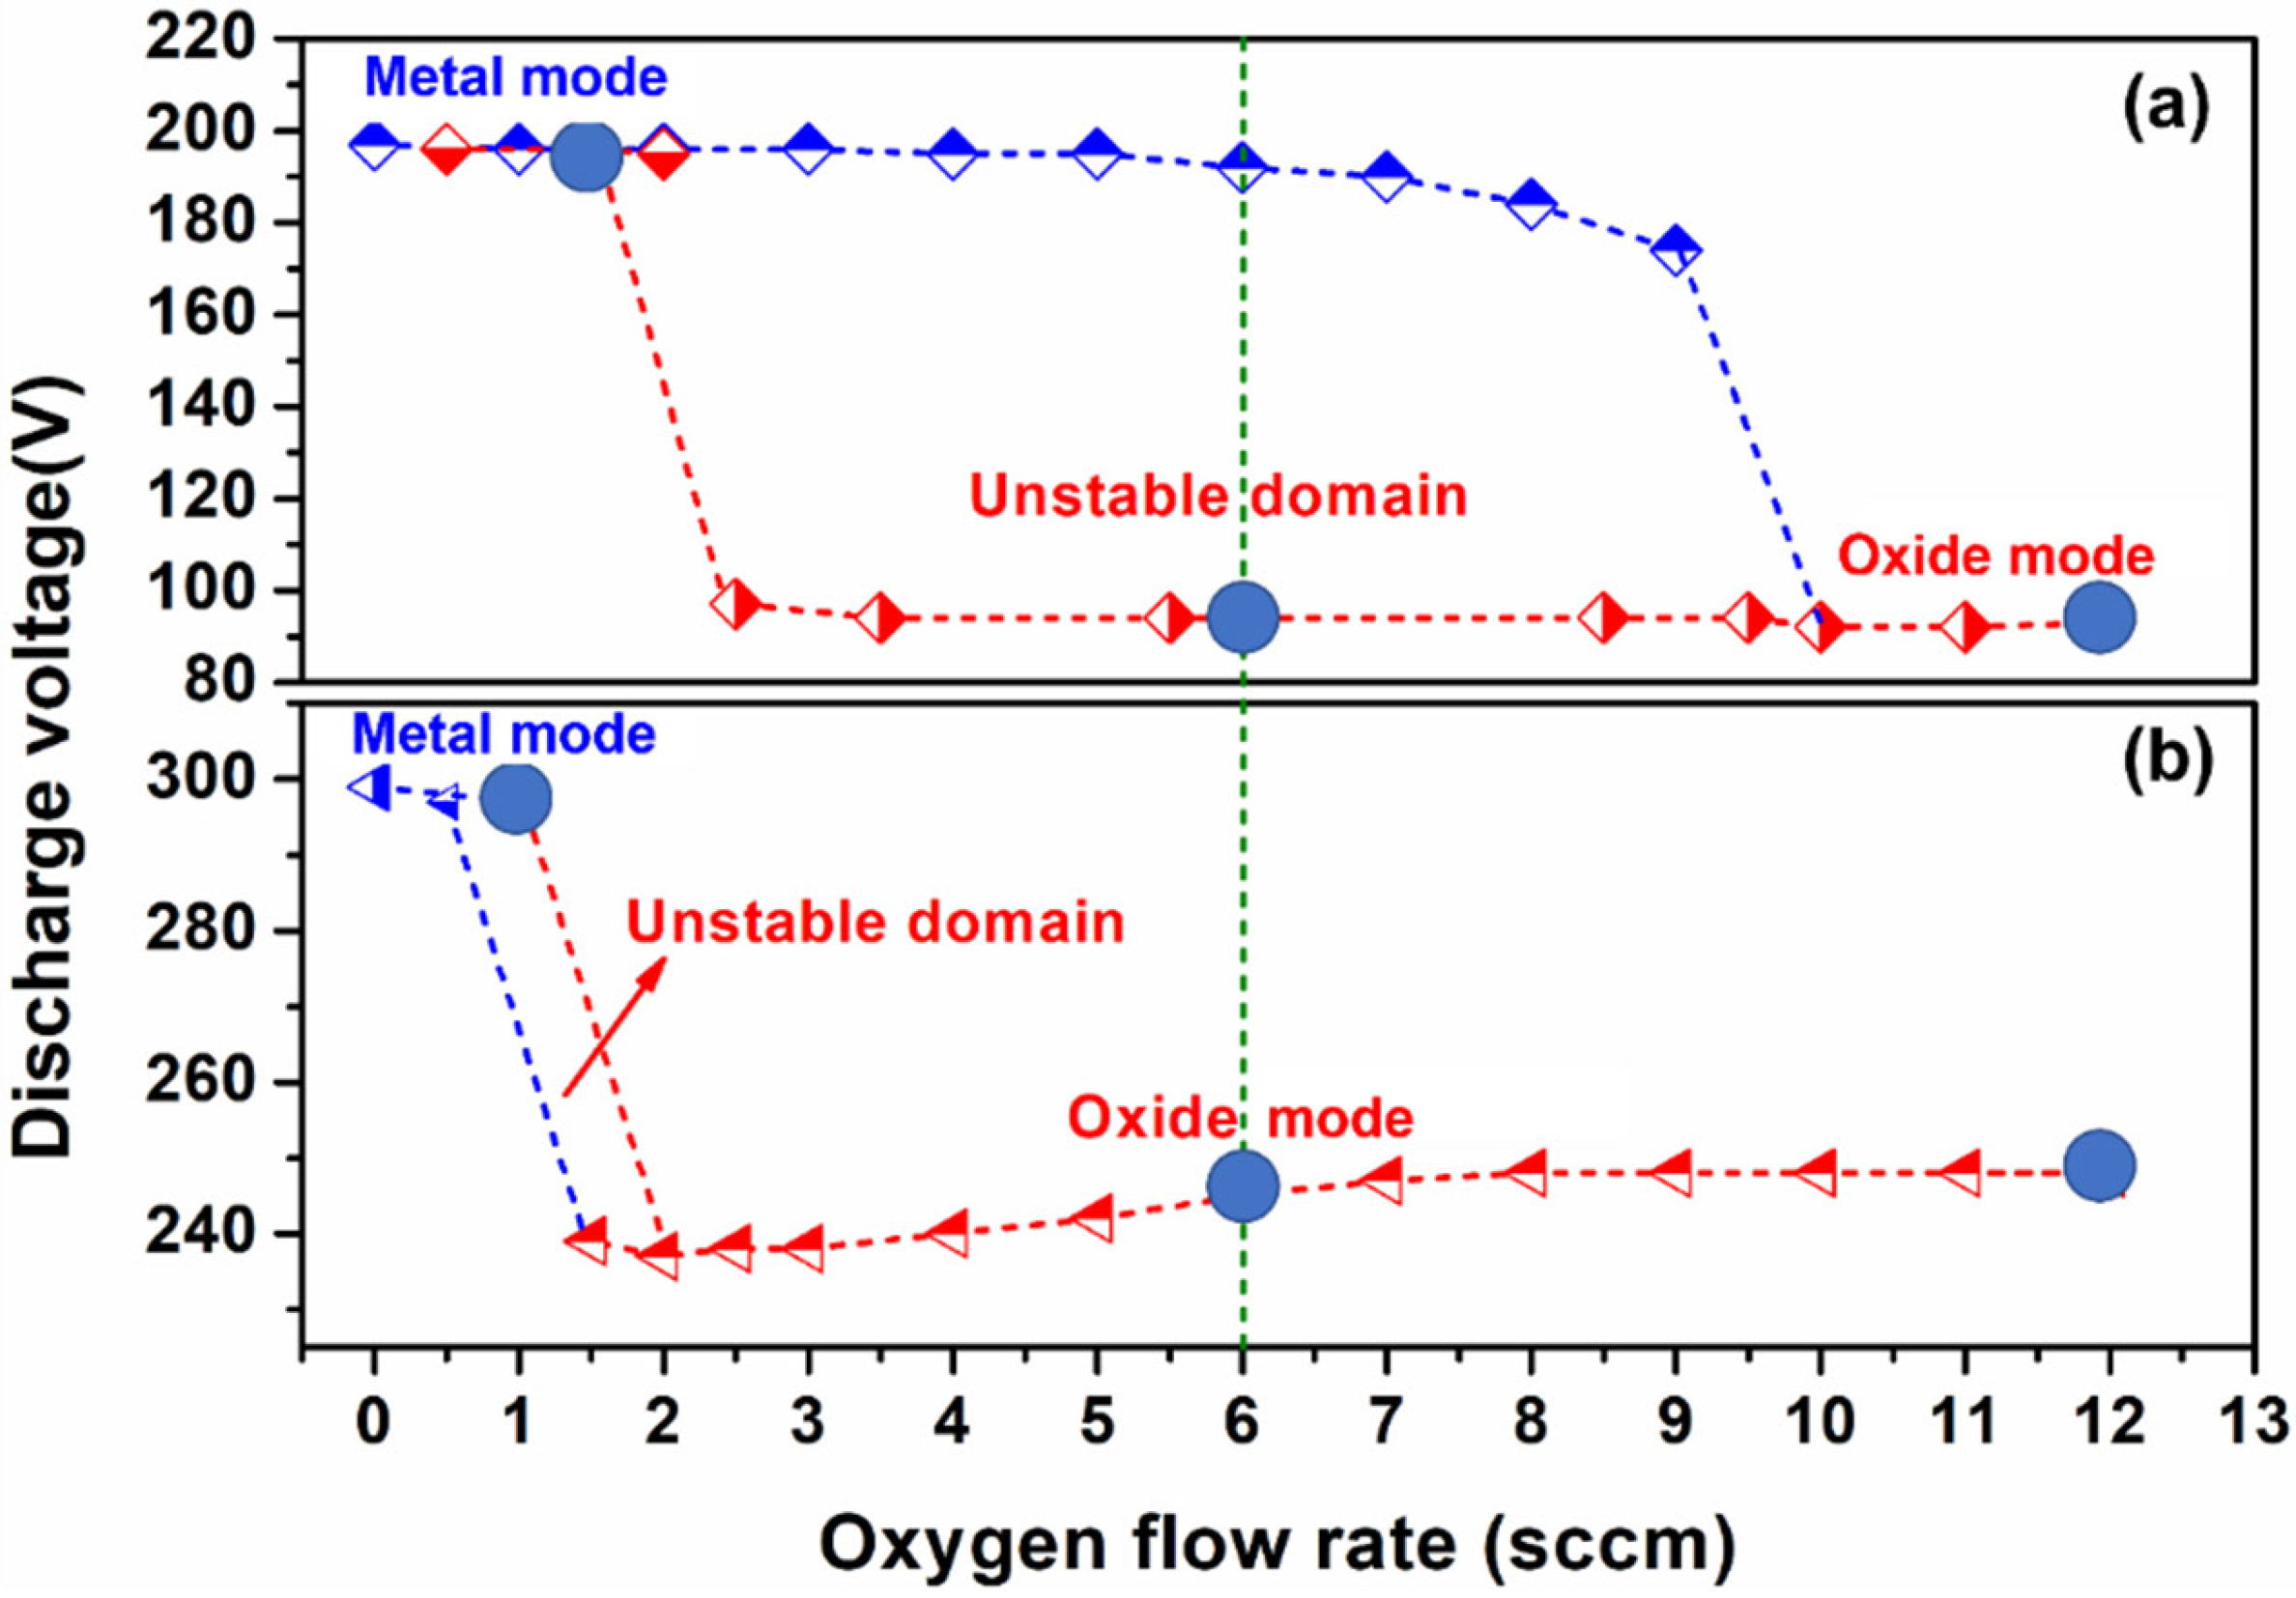
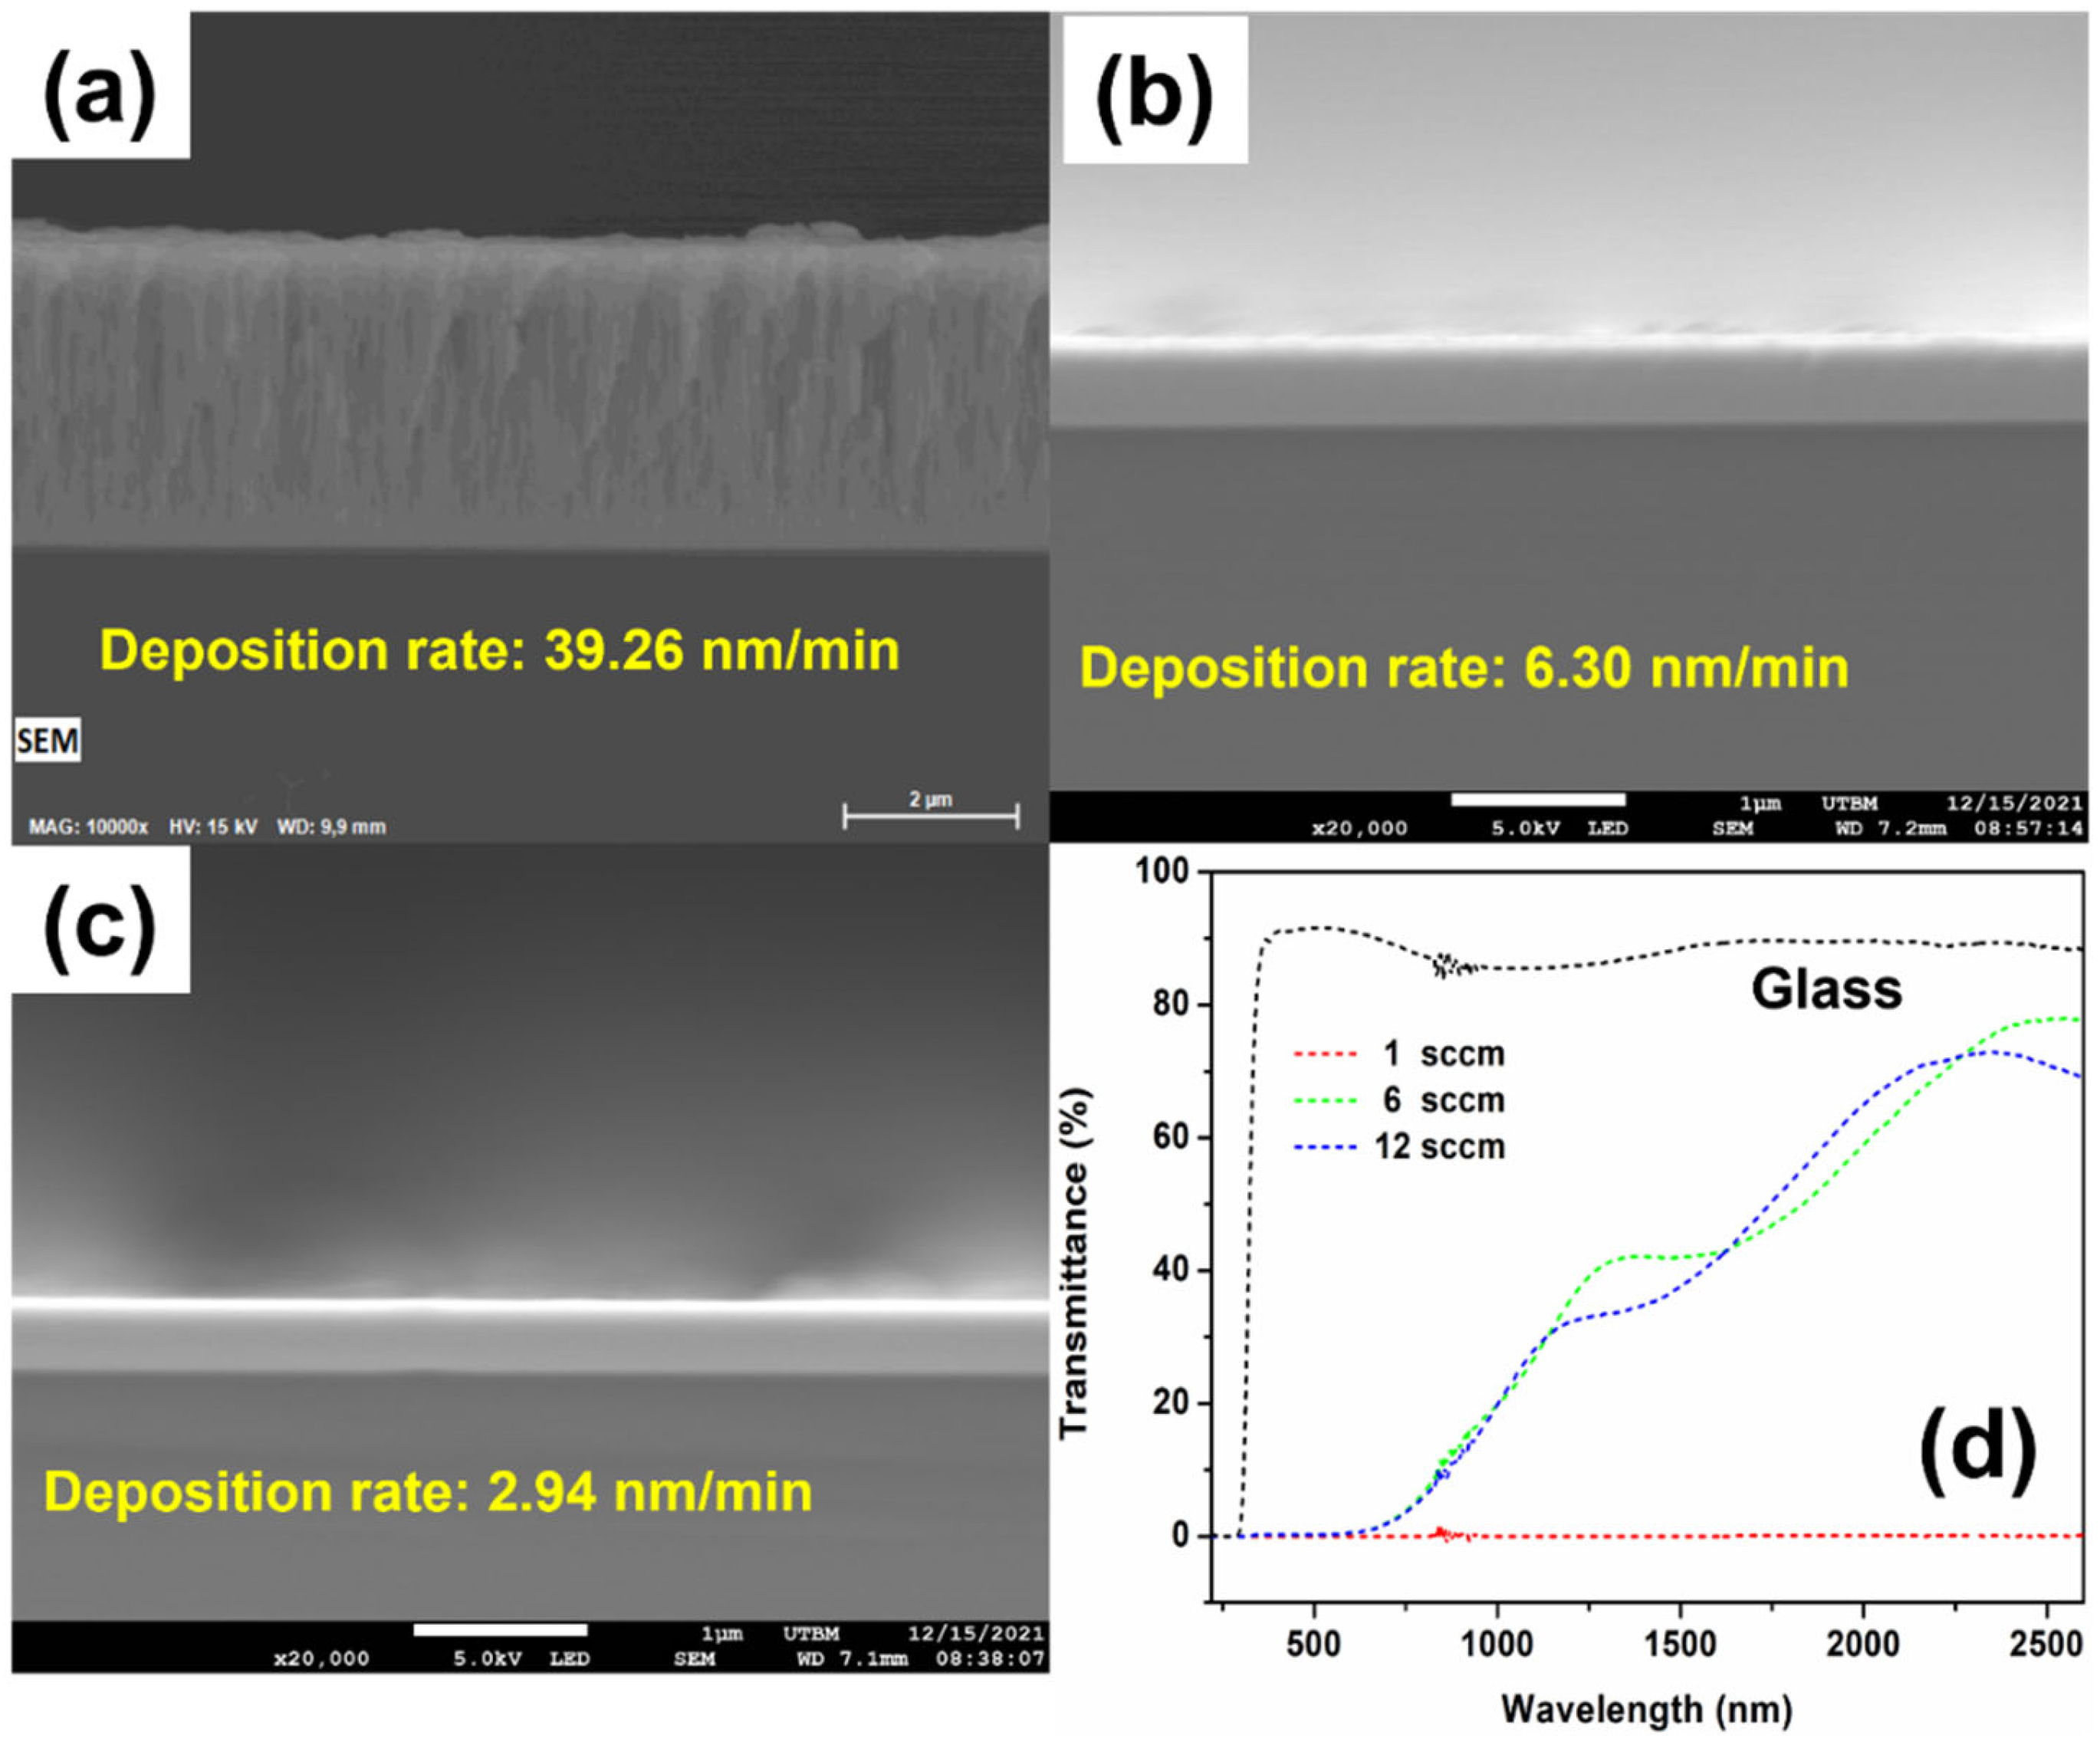
3.1. Deposition of La–Ni–O Coatings

A transition of deposition mode (metallic mode ↔ oxide mode) occurs with the oxygen flow rate during the reactive deposition of oxide coatings by magnetron sputtering. Depending on the reactivity of the metal–metalloid system, the sputtering mode as a function of oxygen flow rate can be unstable, with the presence of a hysteresis loop. Figure 1 shows the discharge voltages of La and Ni targets as a function of oxygen flow rate under the applied discharge currents of 2.5 A and 0.5 A, respectively. Both curves present a hysteresis loop. For the lanthanum metallic target (Figure 1a), the target operates in the metallic mode up to an oxygen flow rate of 9 sccm, with a rather high deposition rate and a partial oxidation of the coating. A further increase in oxygen flow rate yields the drop of target voltage, which corresponds to the full target oxidation. Deposition in the so-called oxide mode with a sharp decrease in the deposition rate yields a fully oxidized coating. While decreasing oxygen flow rate, the target still operates in the oxide mode. When the oxygen flow rate continues to decrease between 2.0 and 2.5 sccm, the deposition mode returns to the metal mode. Likewise, a similar curve is observed on the Ni metallic target (Figure 1b) with a narrow unstable domain of the Ni–O system. With increasing oxygen flow rate, the metallic-to-oxide sputtering mode transition occurs between the oxygen flow rate of 1.5 and 2, while the opposite oxide-to-metallic transition appears between the oxygen flow rate of 1.5 and 2 by decreasing the oxygen flow rate from the oxide mode. Figure 2 shows the SEM cross-sections, deposition rate, and transmittance of three La–Ni–O coatings deposited under a rather high pressure of 2.4 Pa using an argon flow rate of 200 sccm. Oxygen flow rates were chosen in the metallic mode (oxygen flow rate of 1 sccm) and in the oxide mode (oxygen flow rate of 12 sccm) for both La and Ti targets. A third coating was deposited in the intermediate domain (oxygen flow rate of 6 sccm) of the hysteresis loop for the La target with a setpoint maintained in the oxide mode. From Figure 2a, the coating deposited under the metallic mode (oxygen flow rate of 1 sccm) presents a rather high deposition rate of 39.26 nm/min. As expected, the coating presents a metallic aspect with a strong light absorption (Figure 2d). The coating deposited under the oxide mode (oxygen flow rate of 12 sccm) presents a strong drop of the deposition rate (around 2.9 nm/min) conformal to the full oxidation of both La and Ni targets (Figure 2c). Its transmittance is weak at the wavelength up to about 600 nm and progressively increases with the wavelength to reach about 70% in the near-infrared domain at a 2500 nm wavelength (Figure 2d). The coating deposited under the oxygen flow rate of 6 sccm presents characteristics close to that of the coating deposited under the oxygen flow rate of 12 sccm: It has a higher deposition rate of around 6.3 nm/min (Figure 2b) and transmittance comparable to coatings deposited at the oxygen flow rate of 12 sccm (Figure 2d).

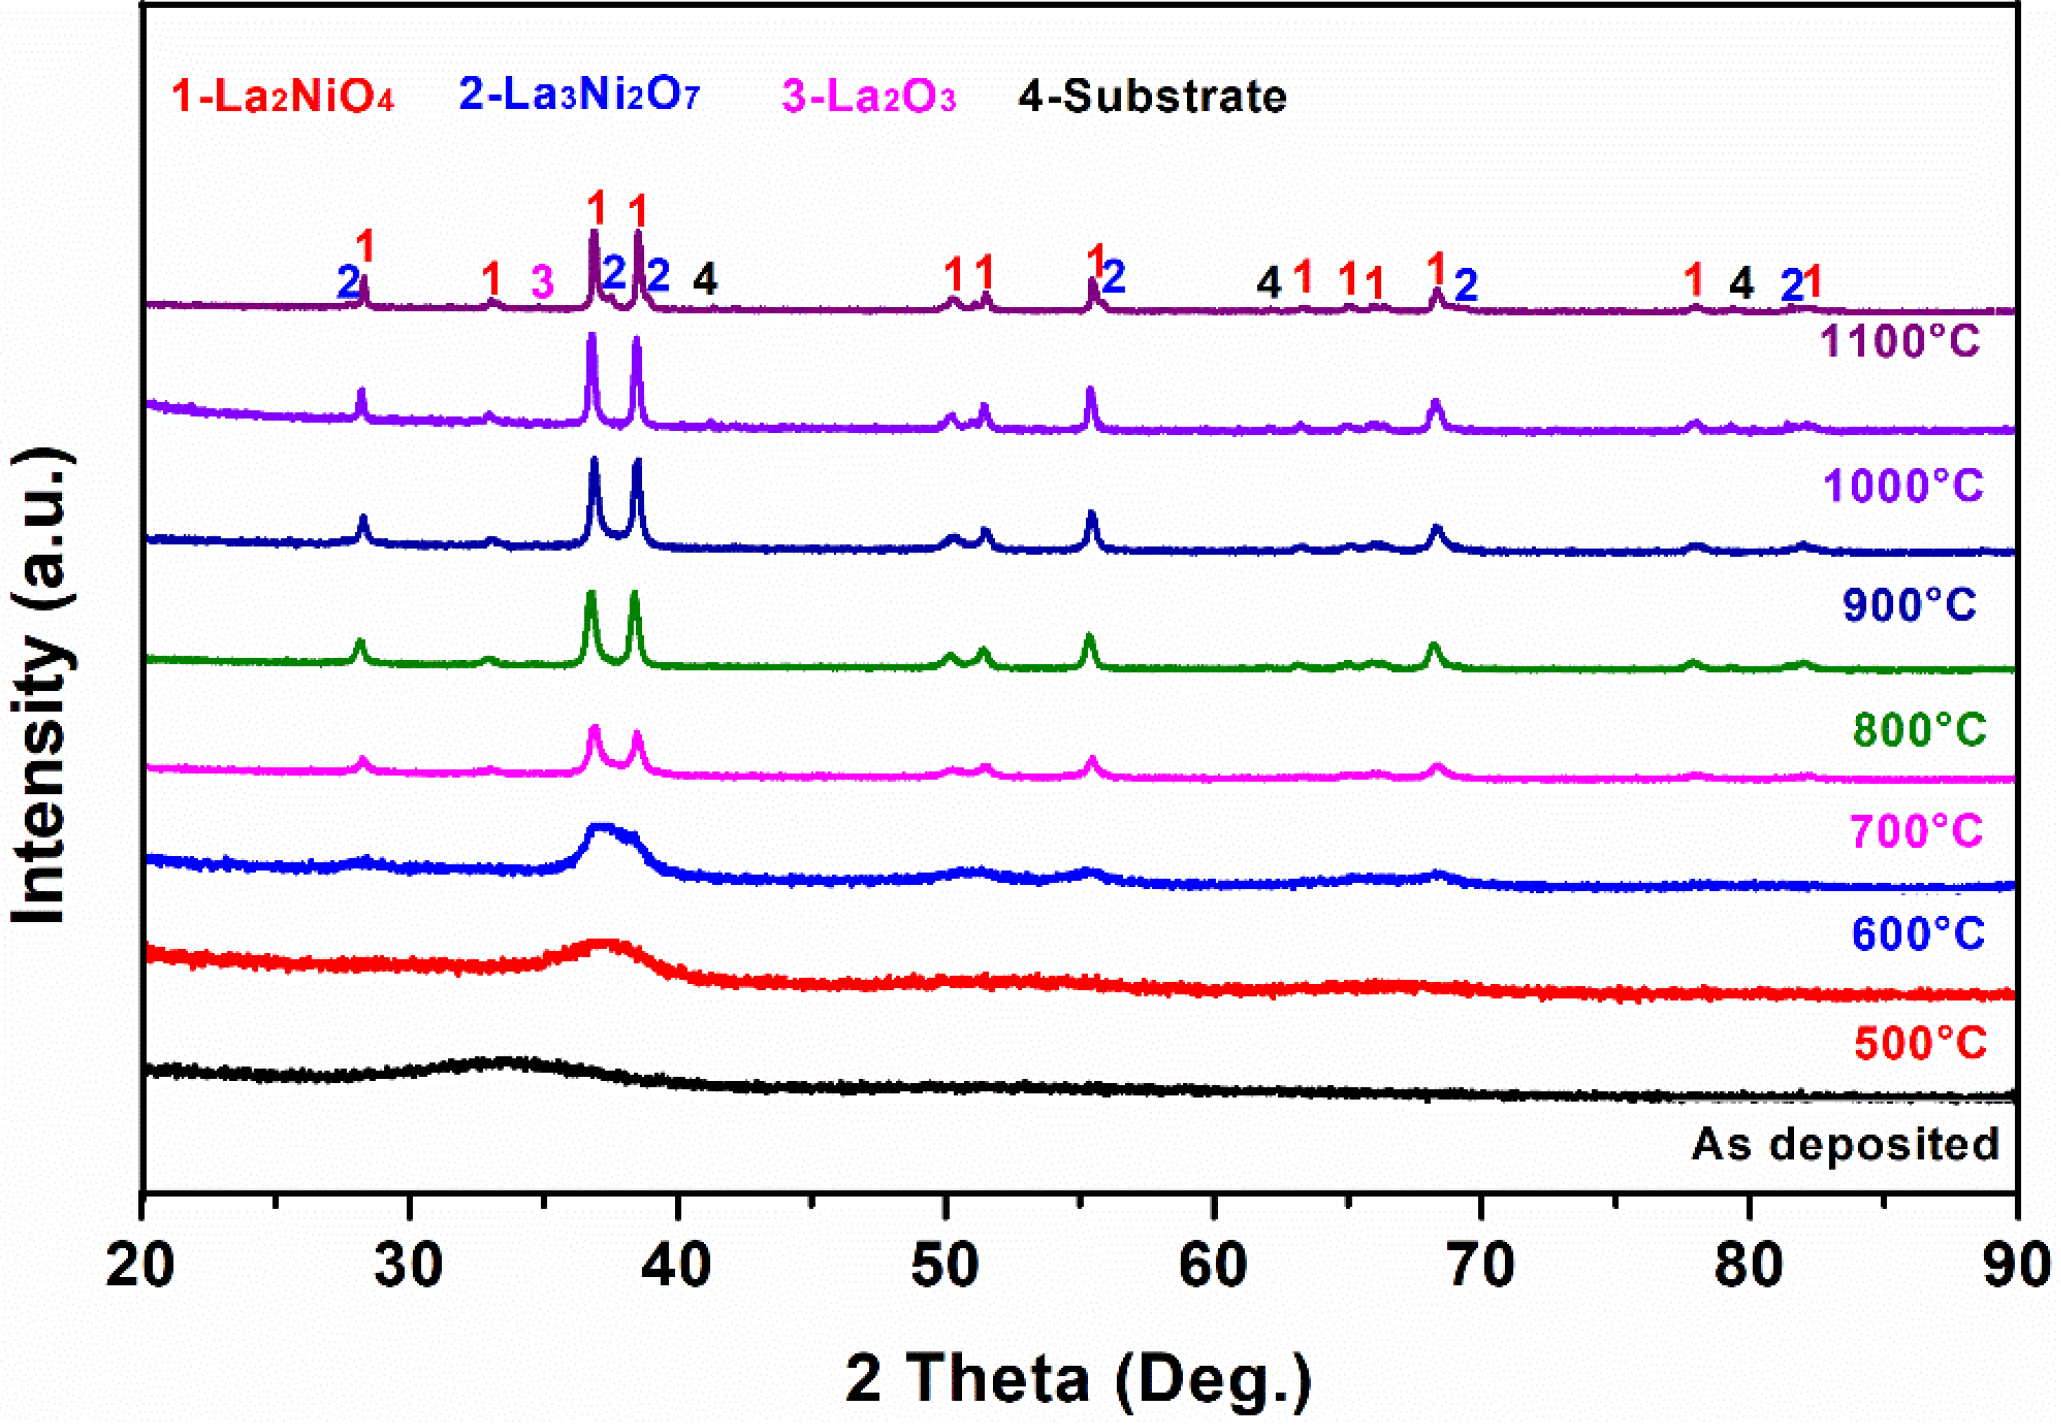
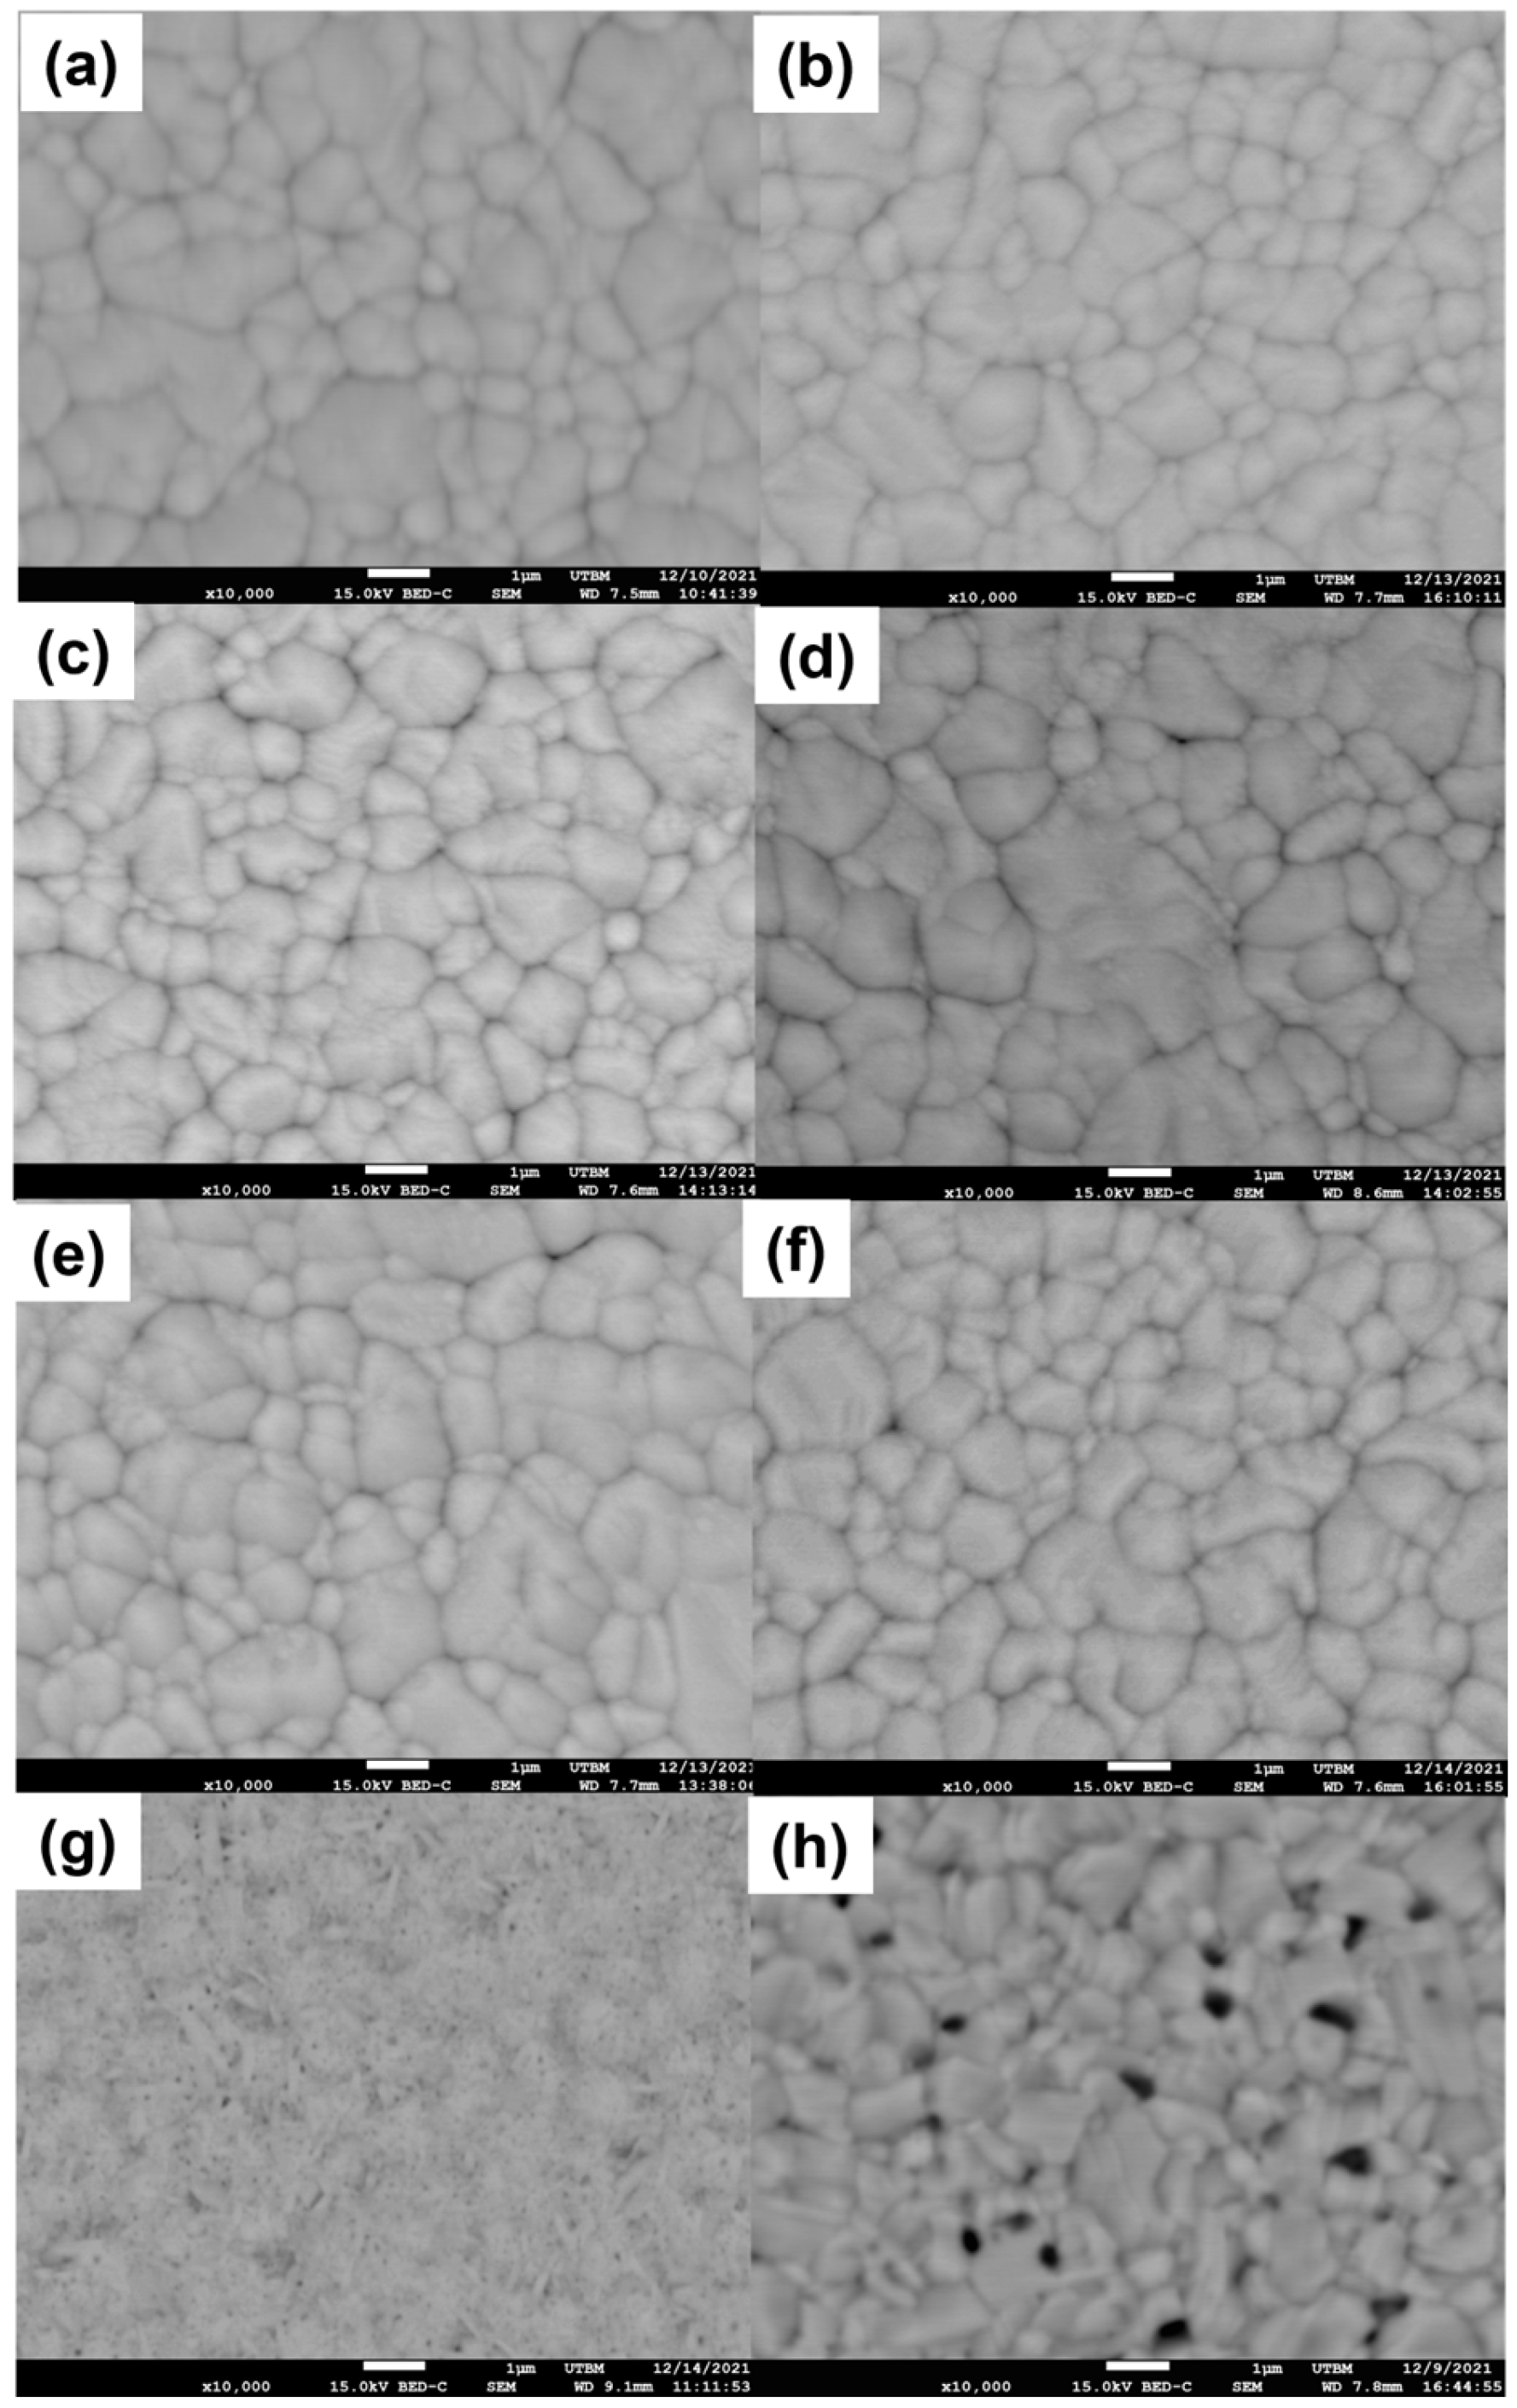
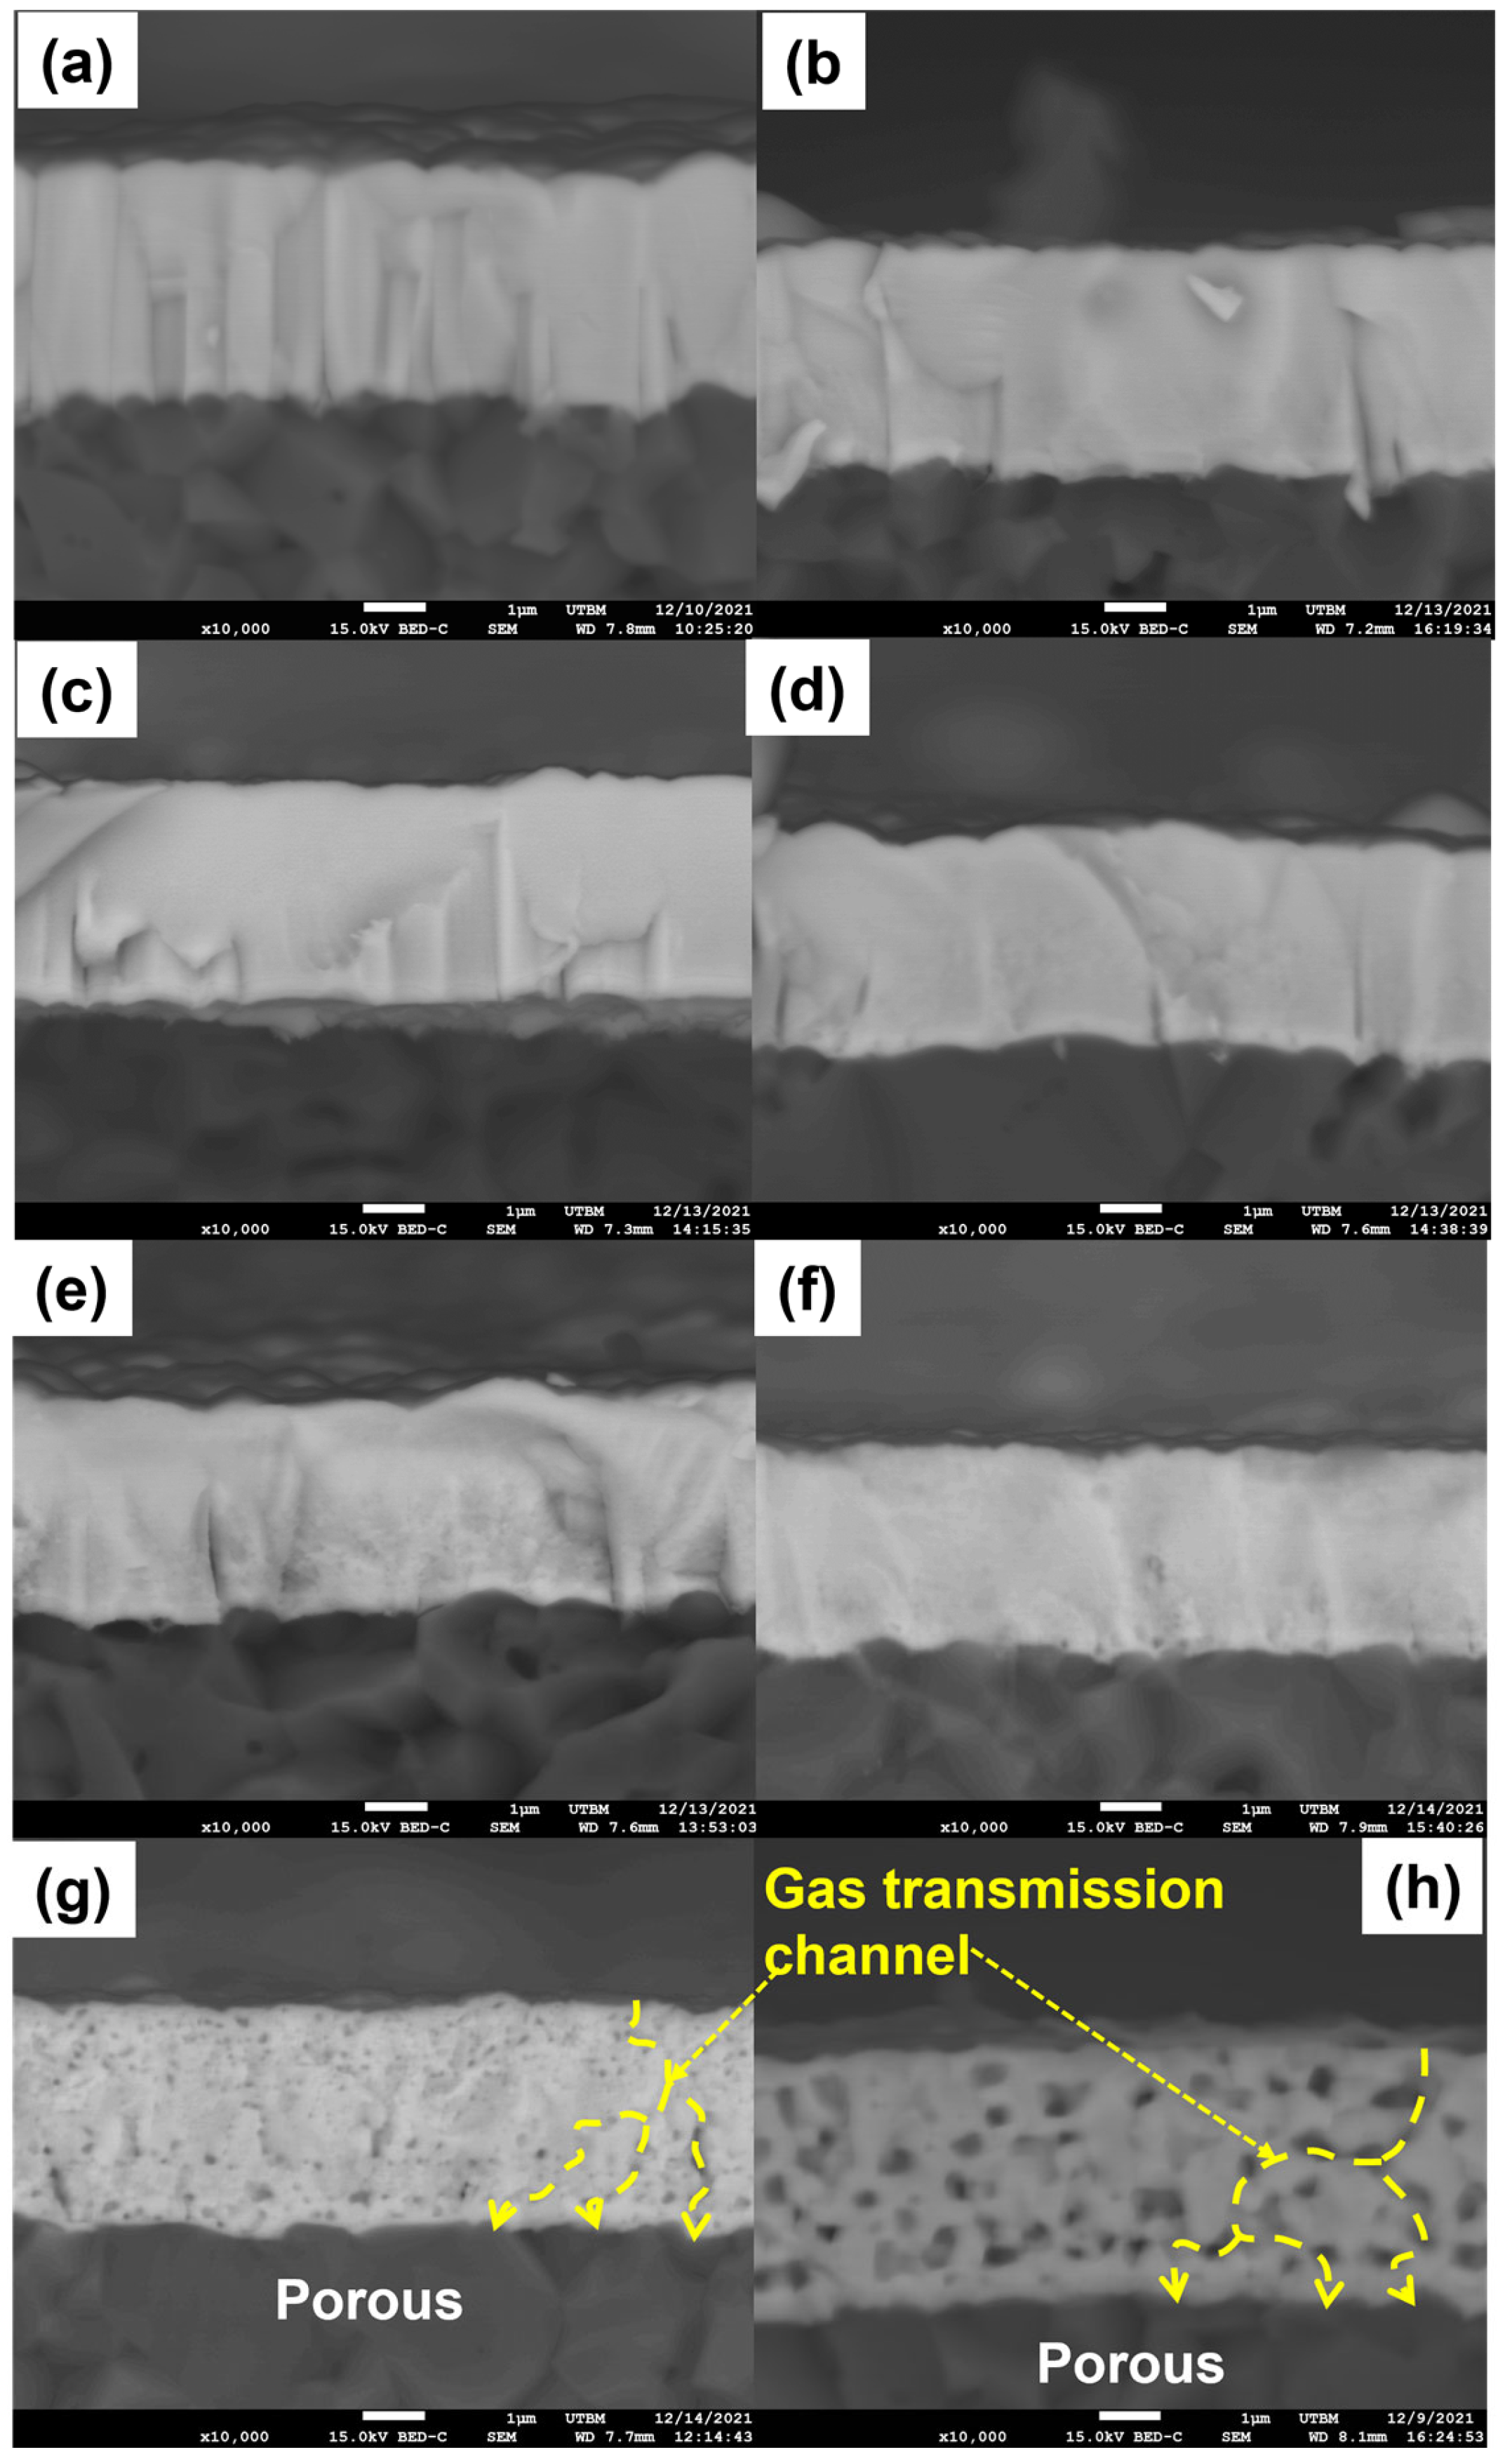
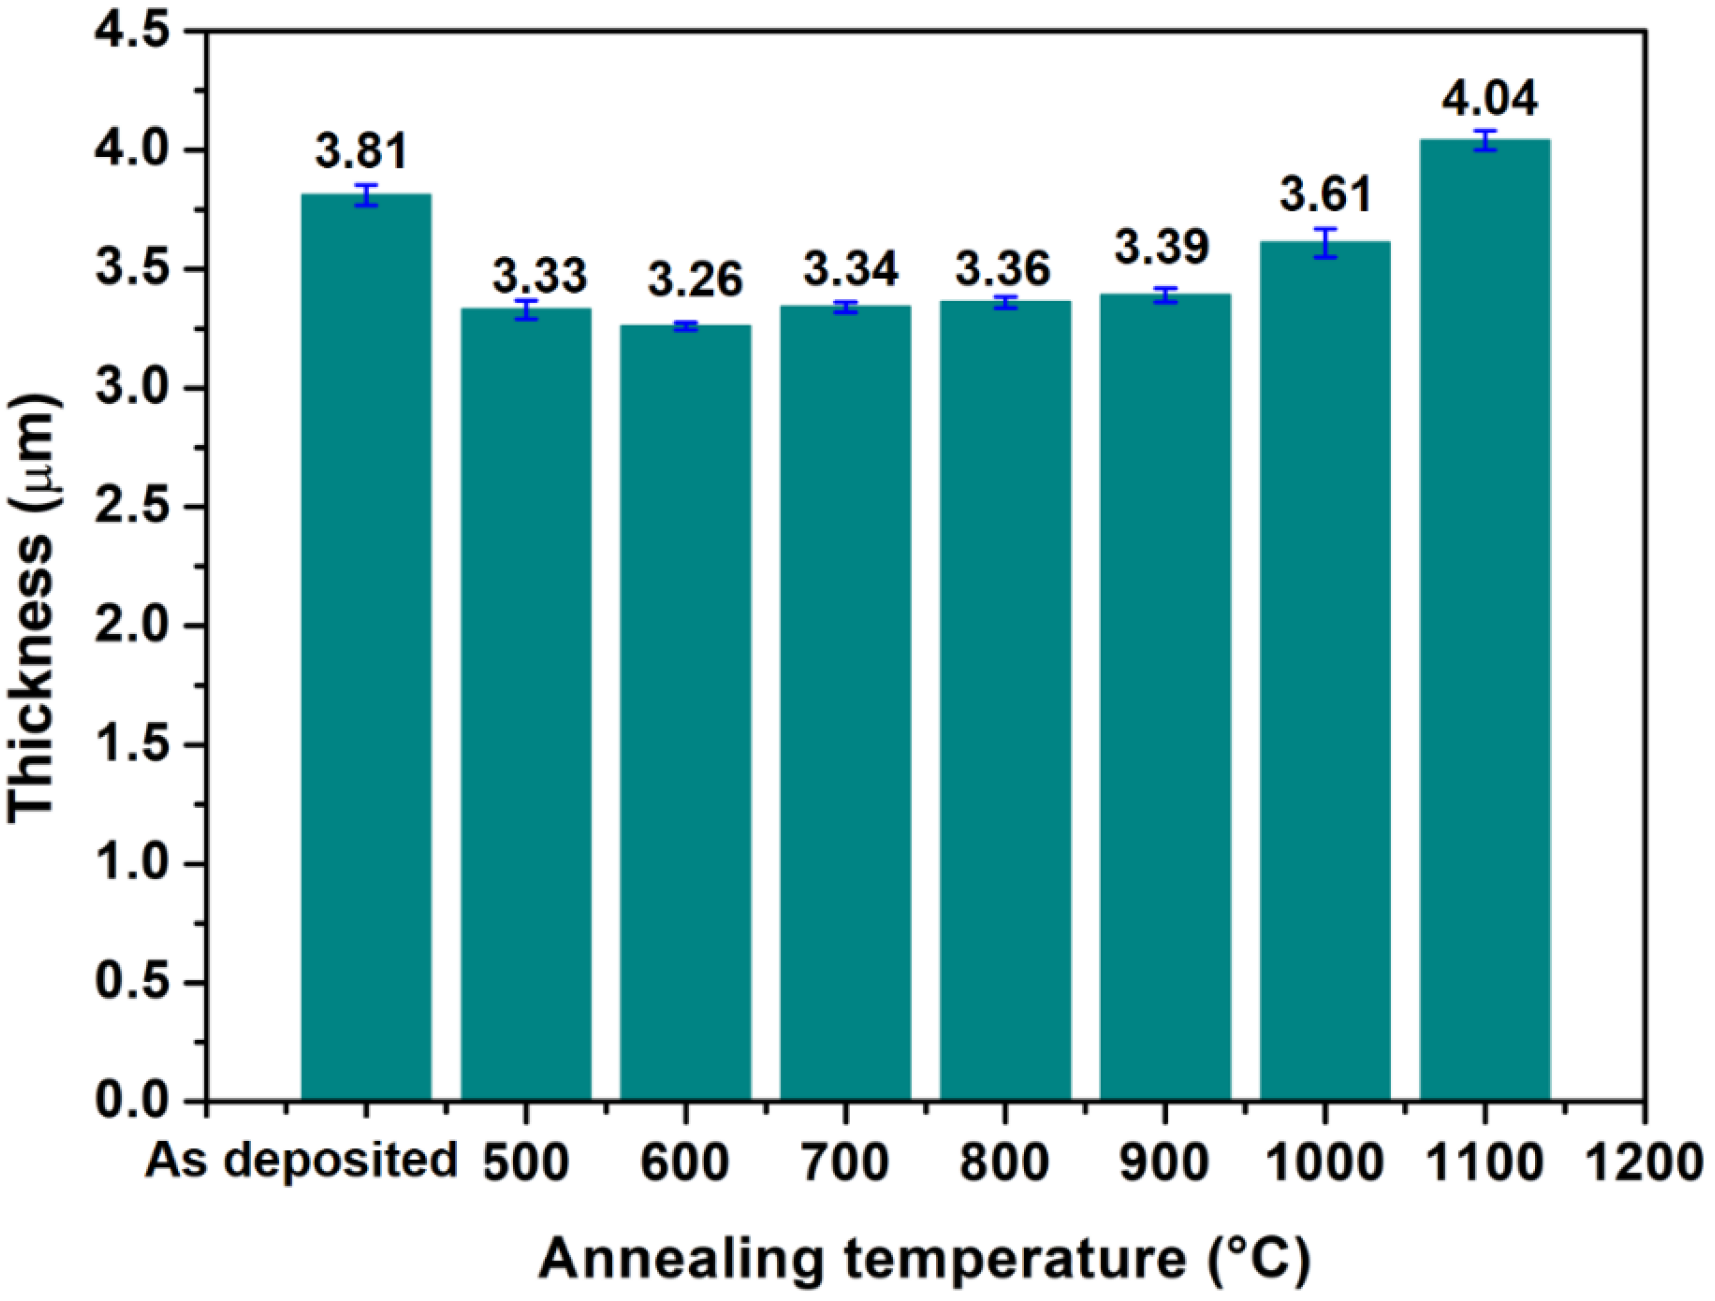
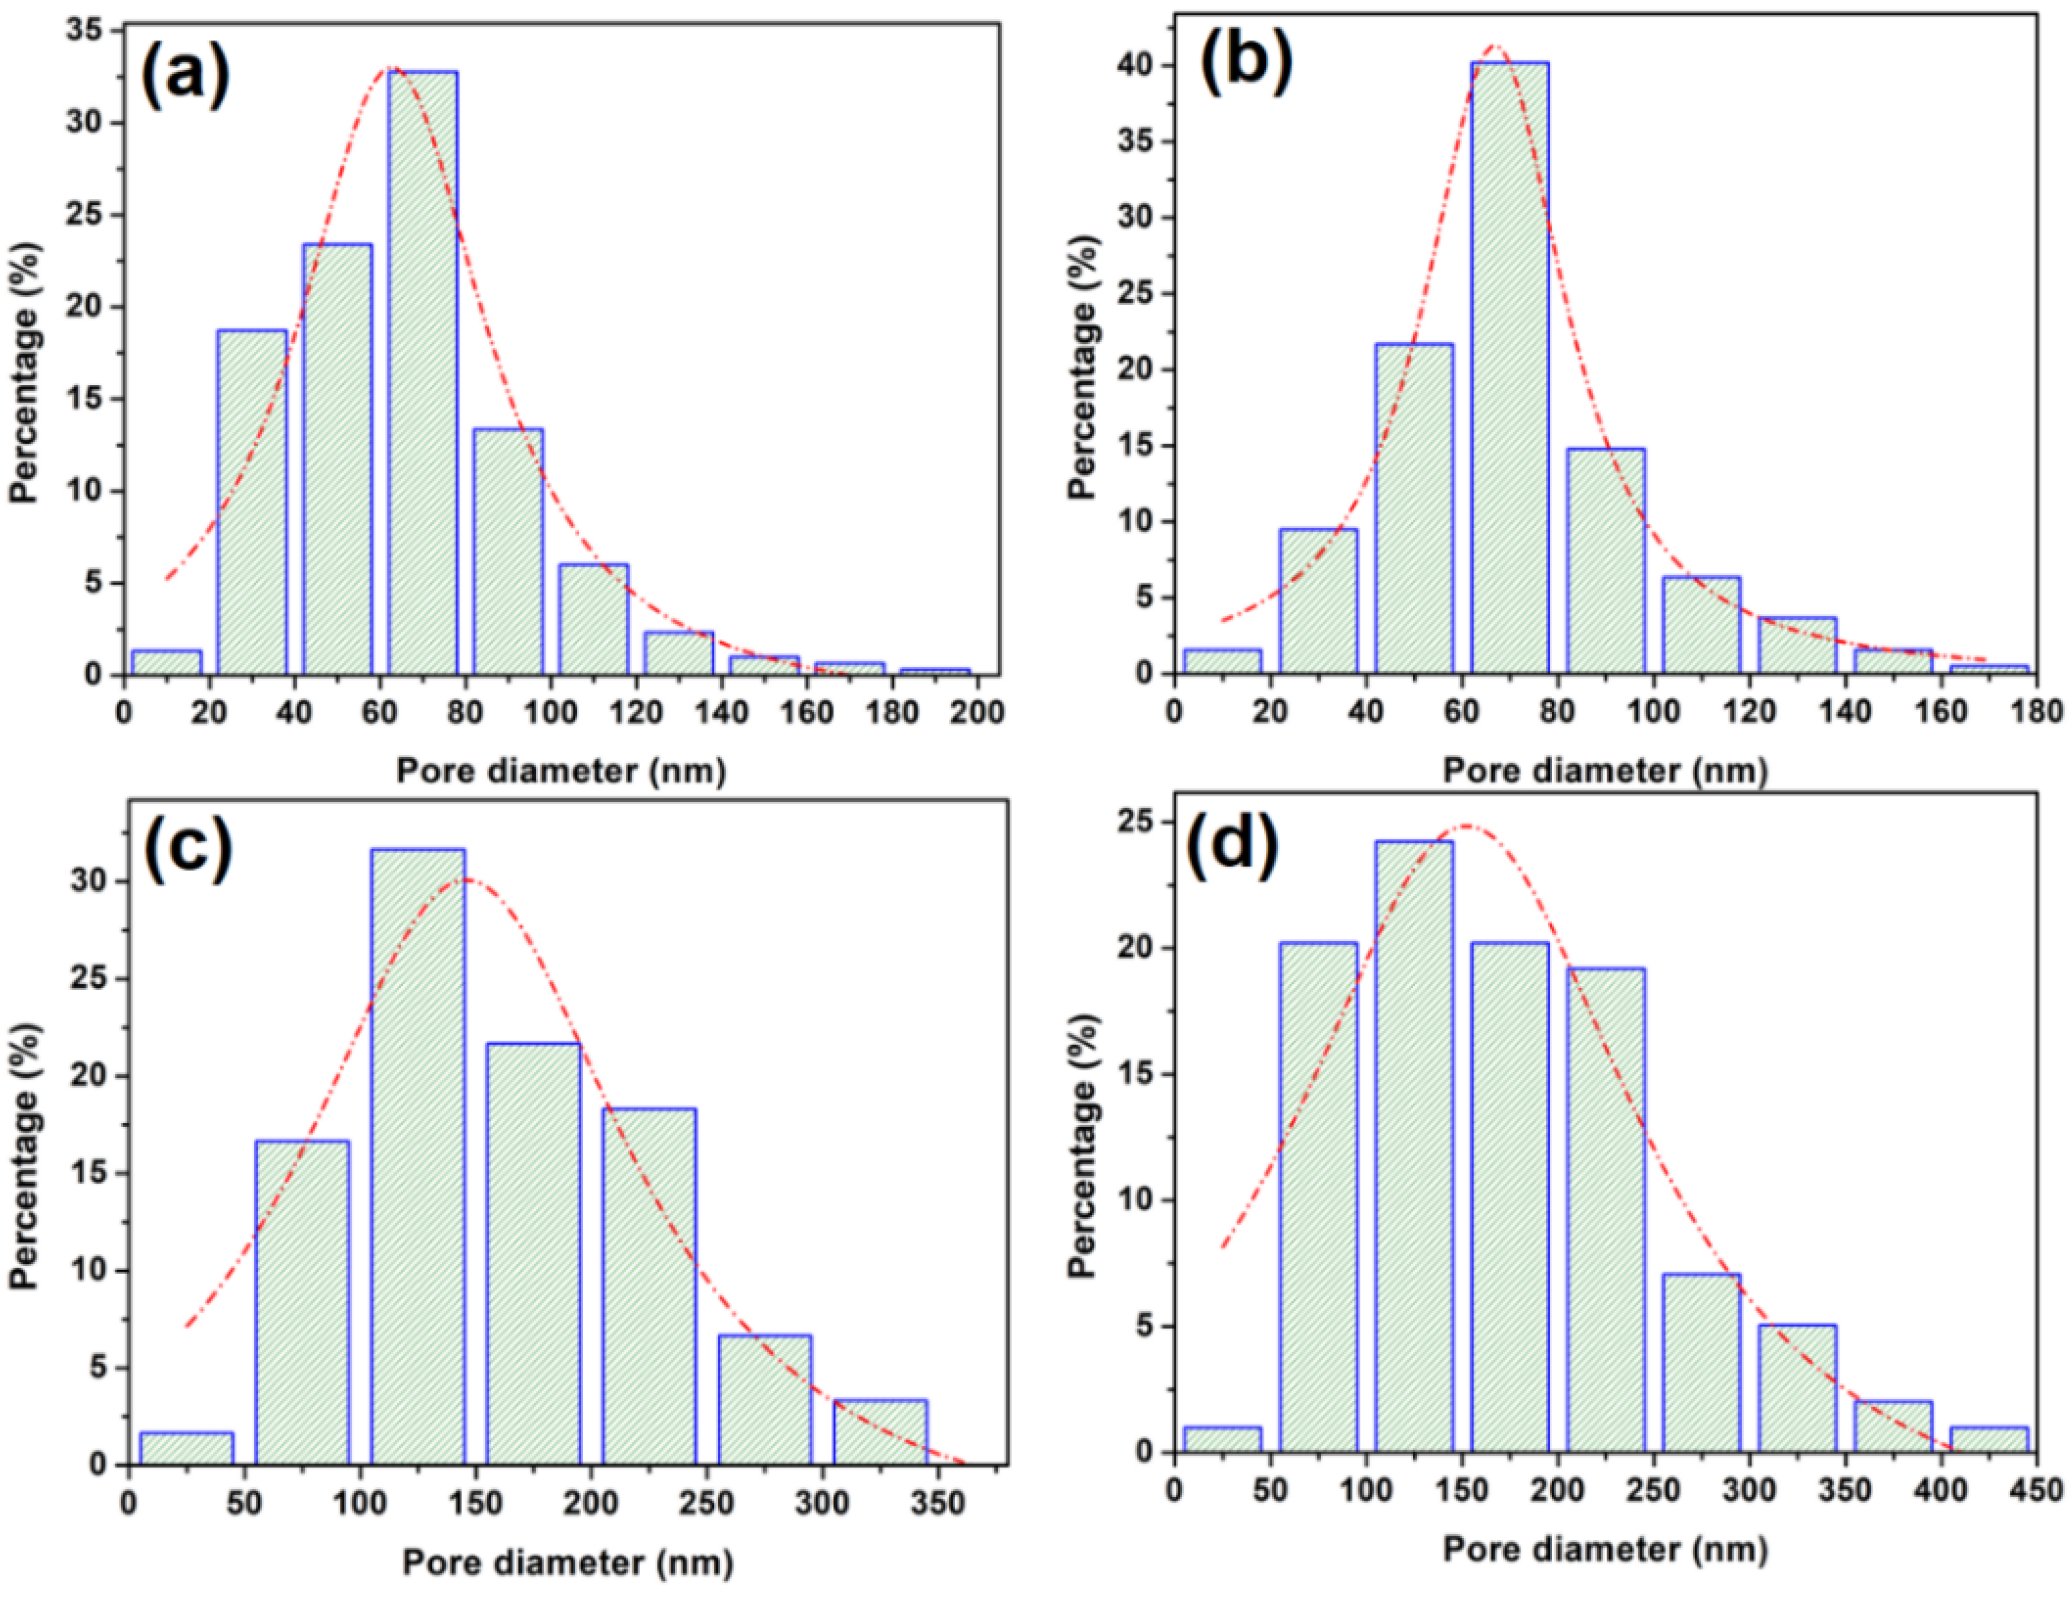
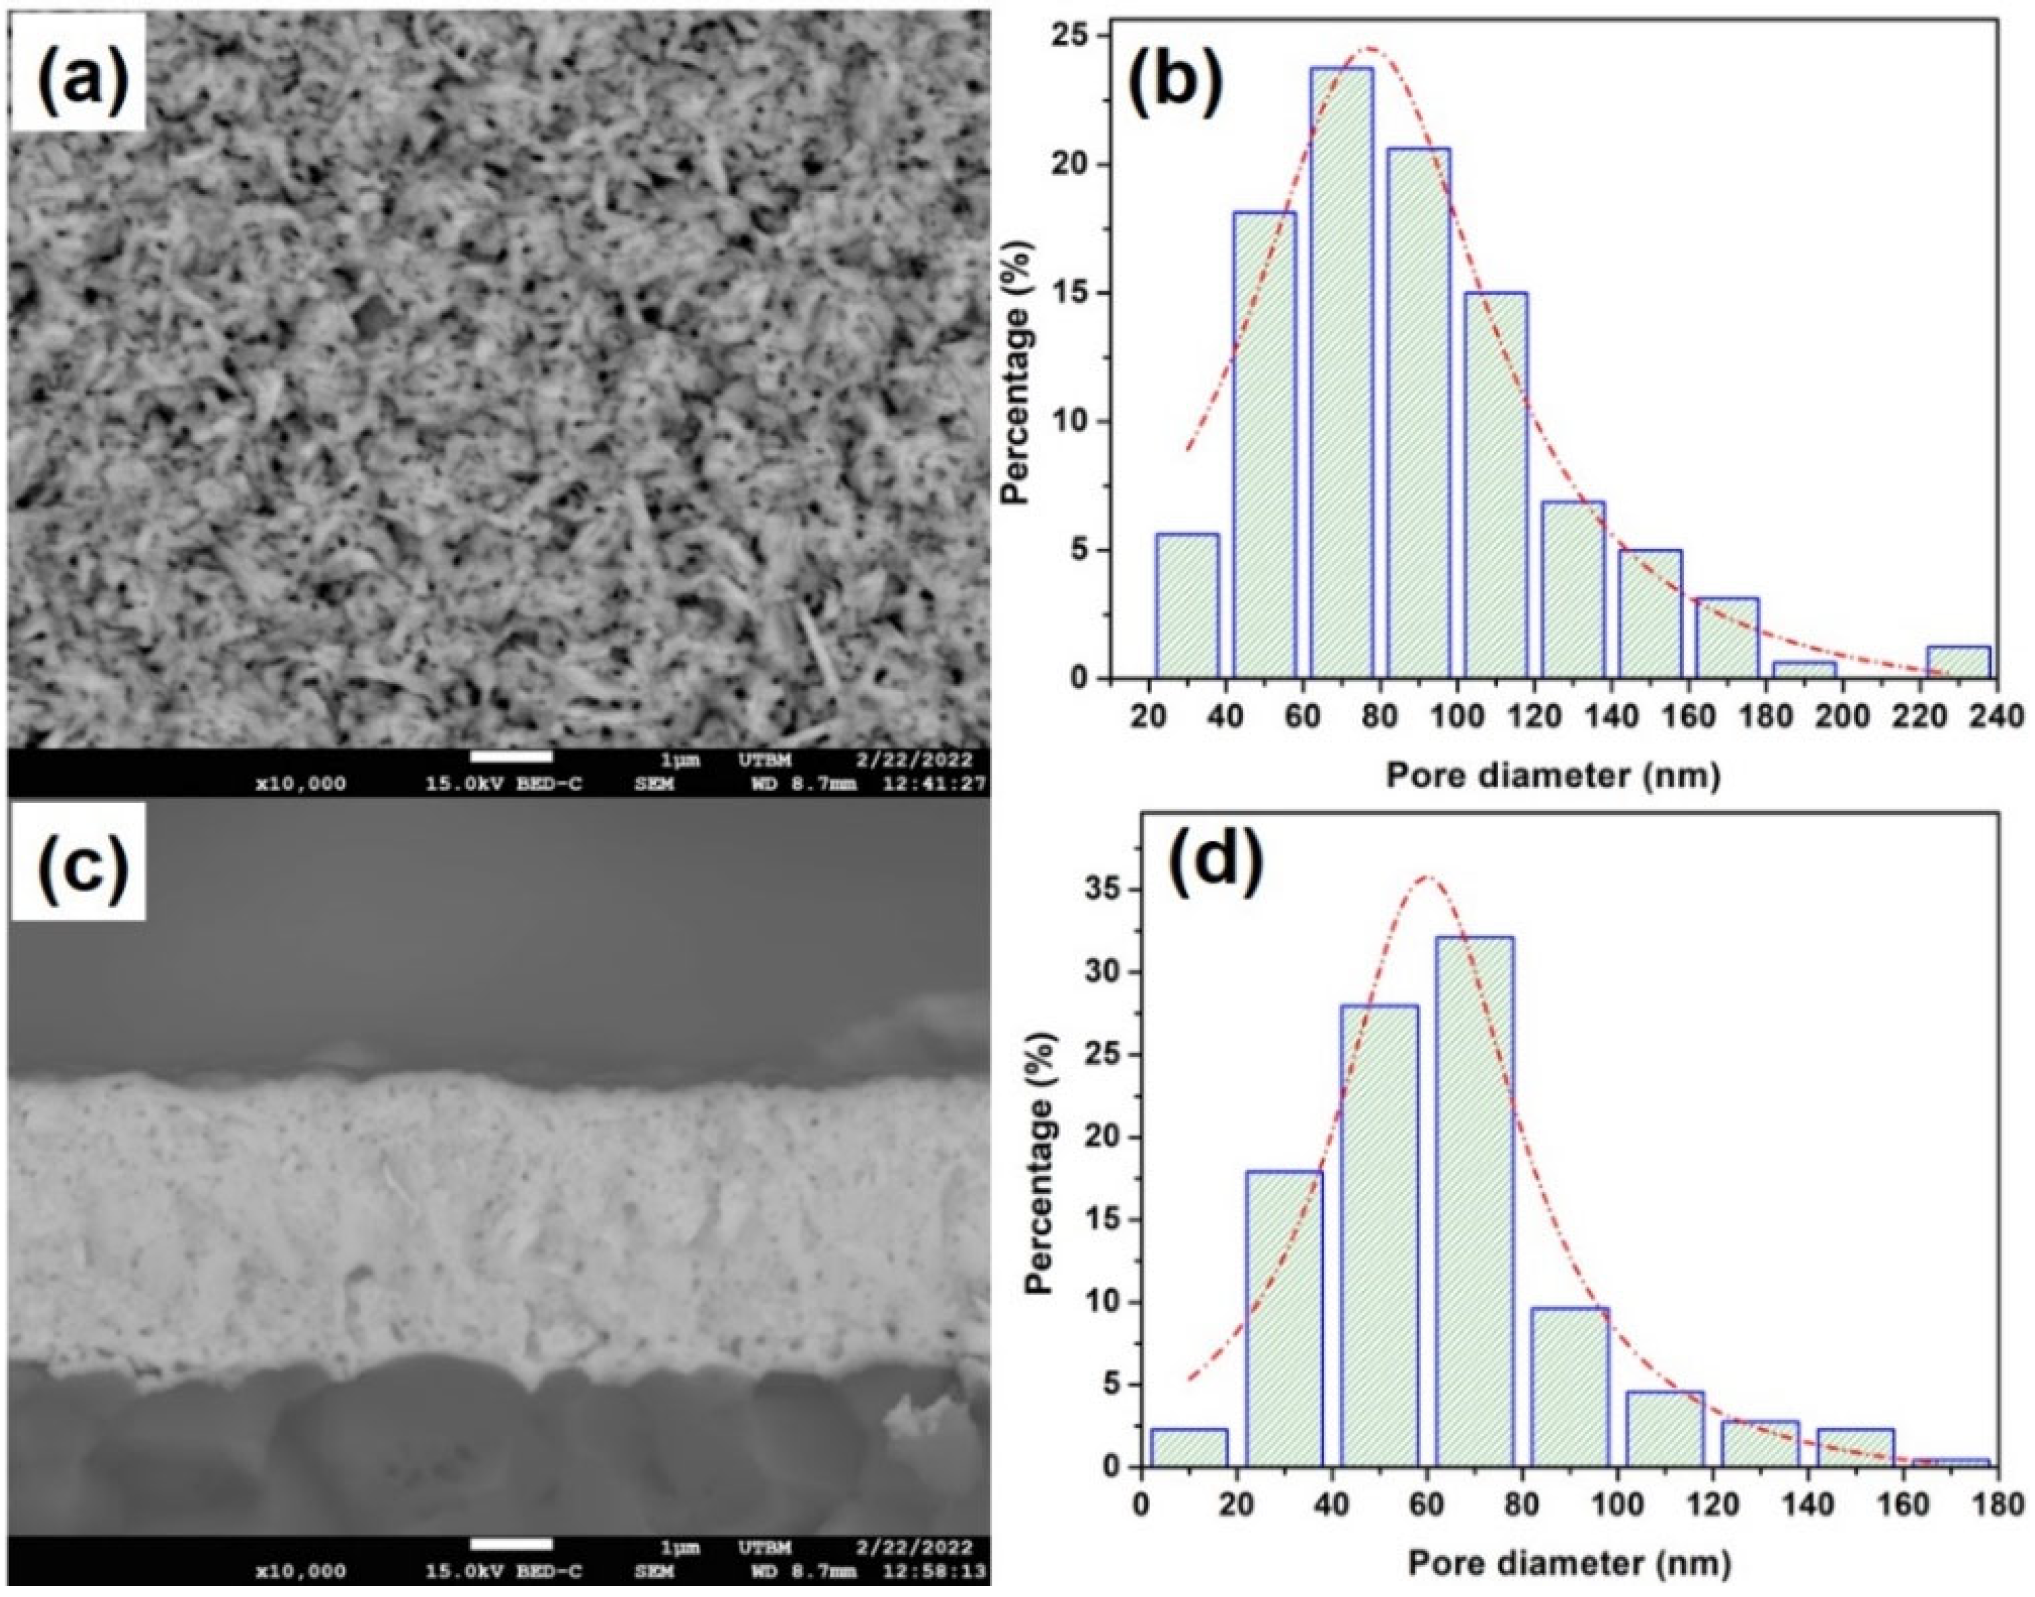
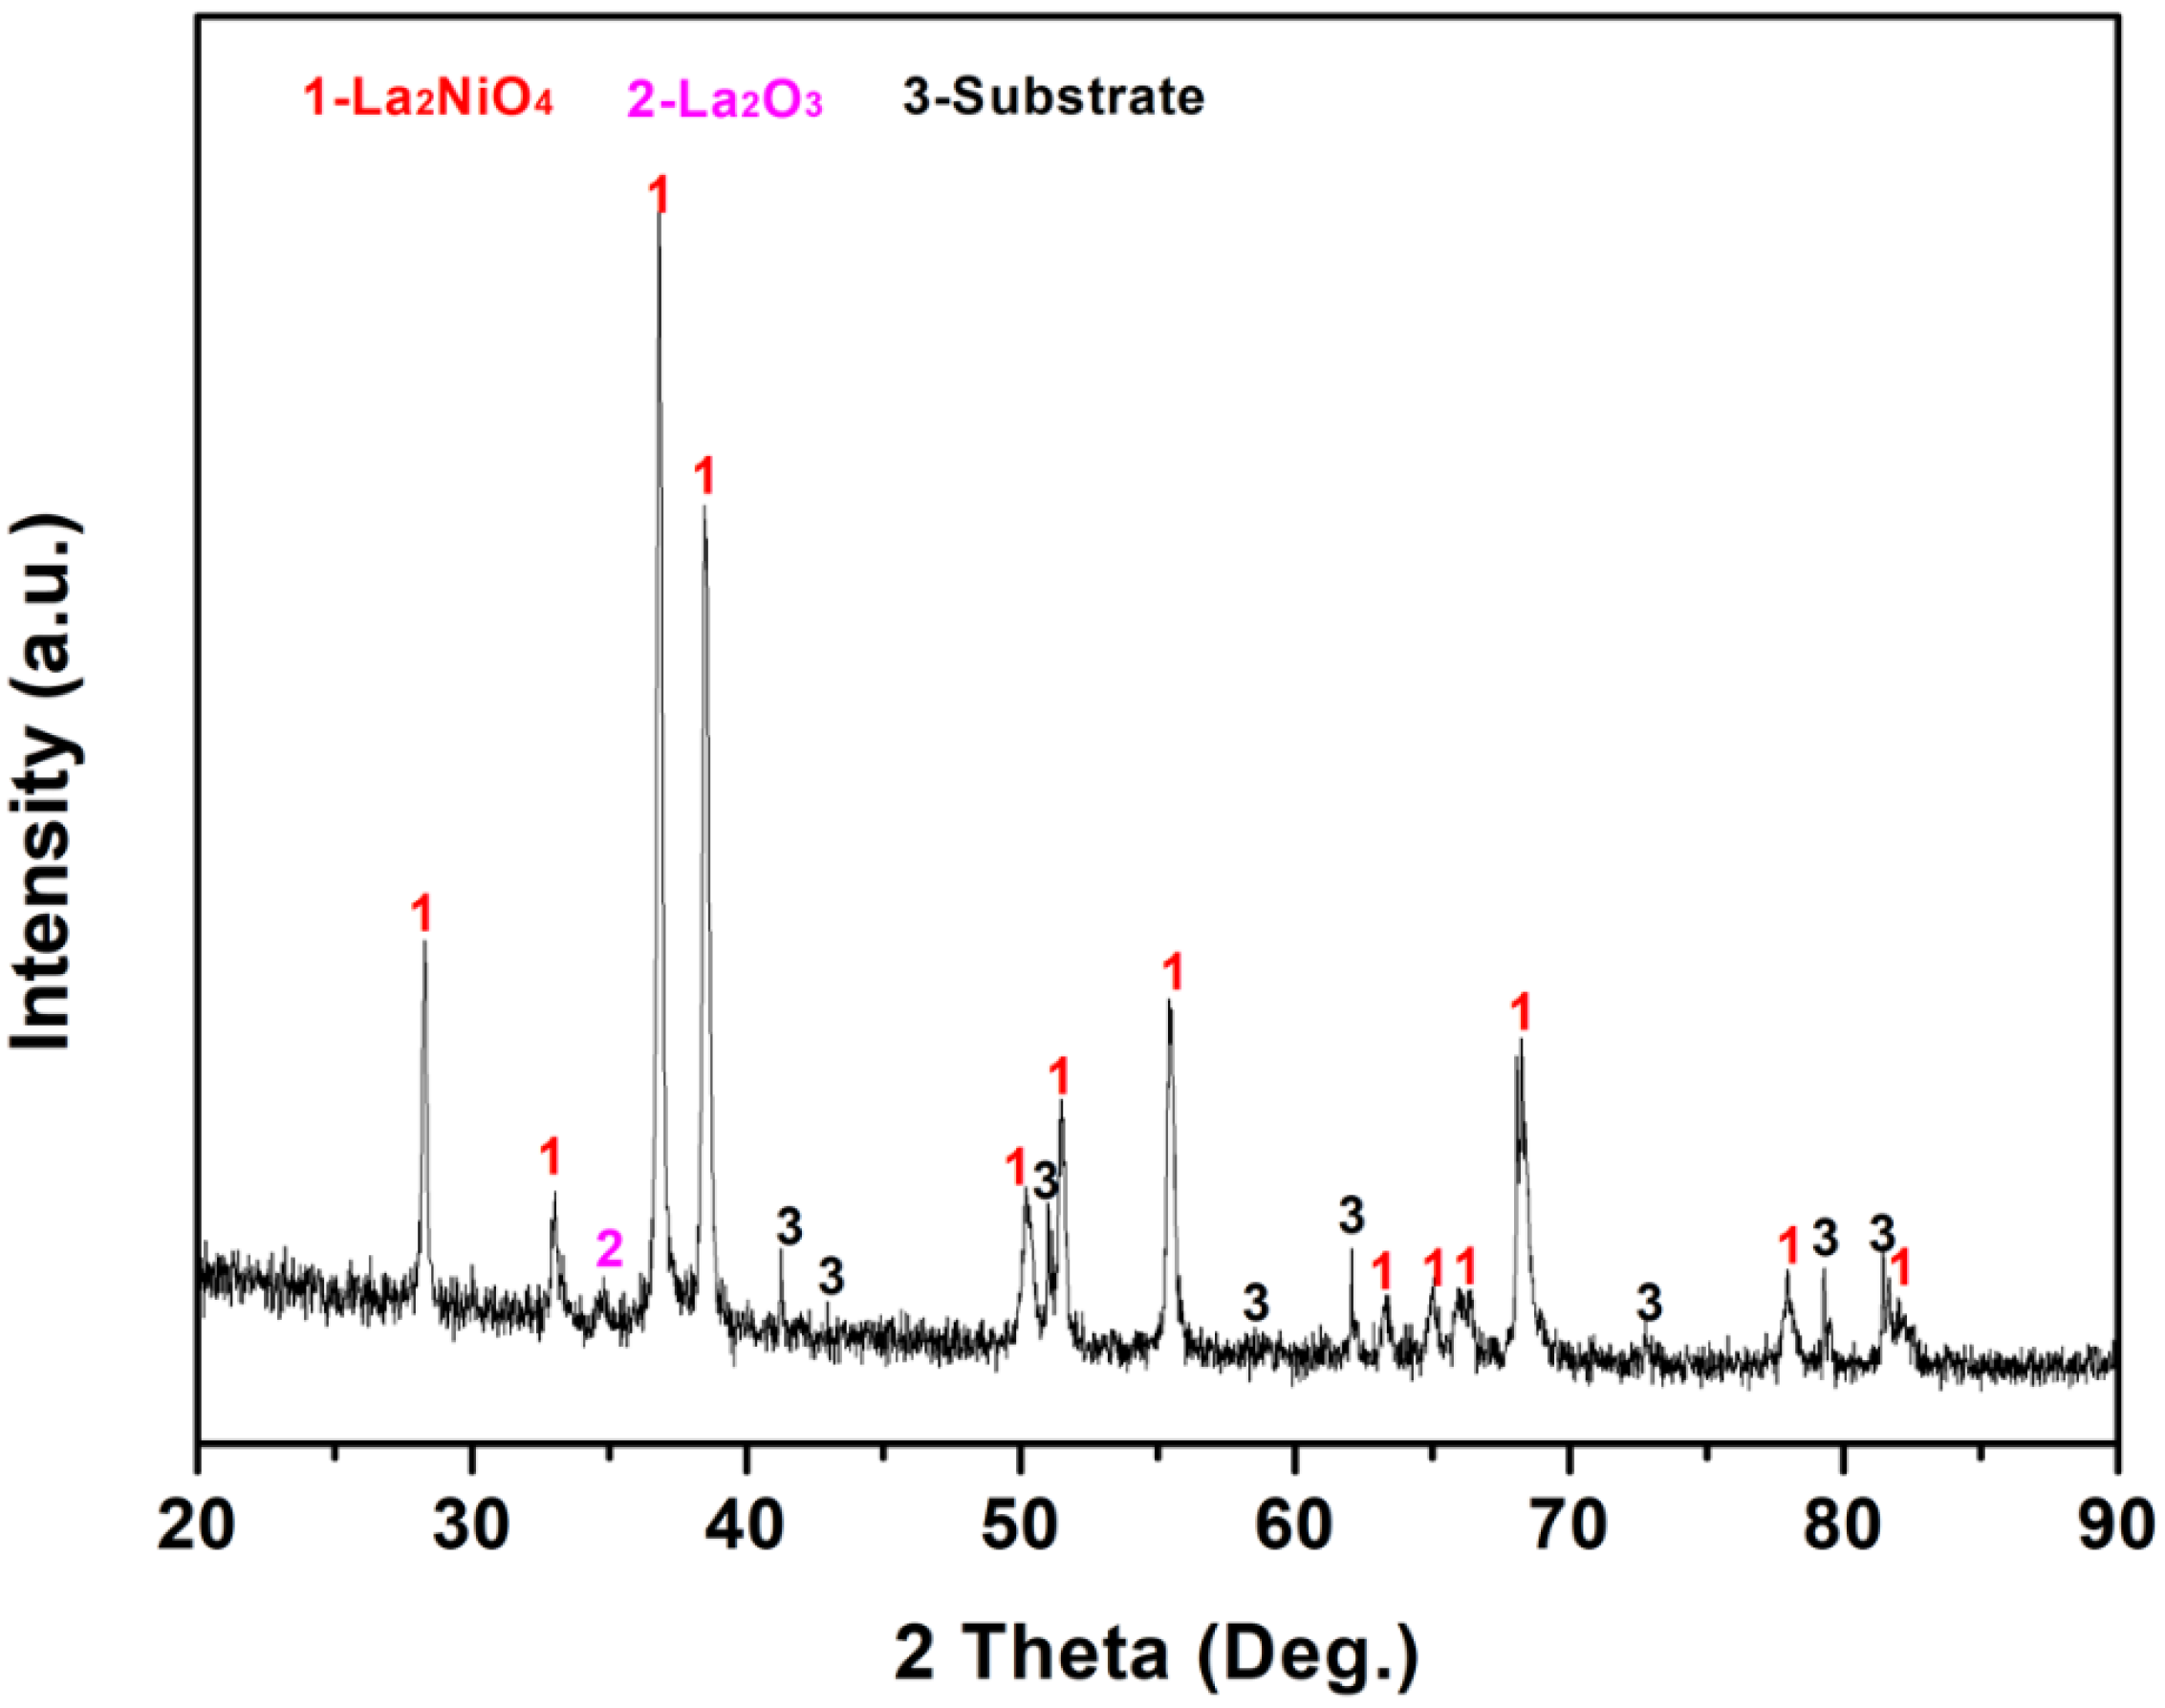
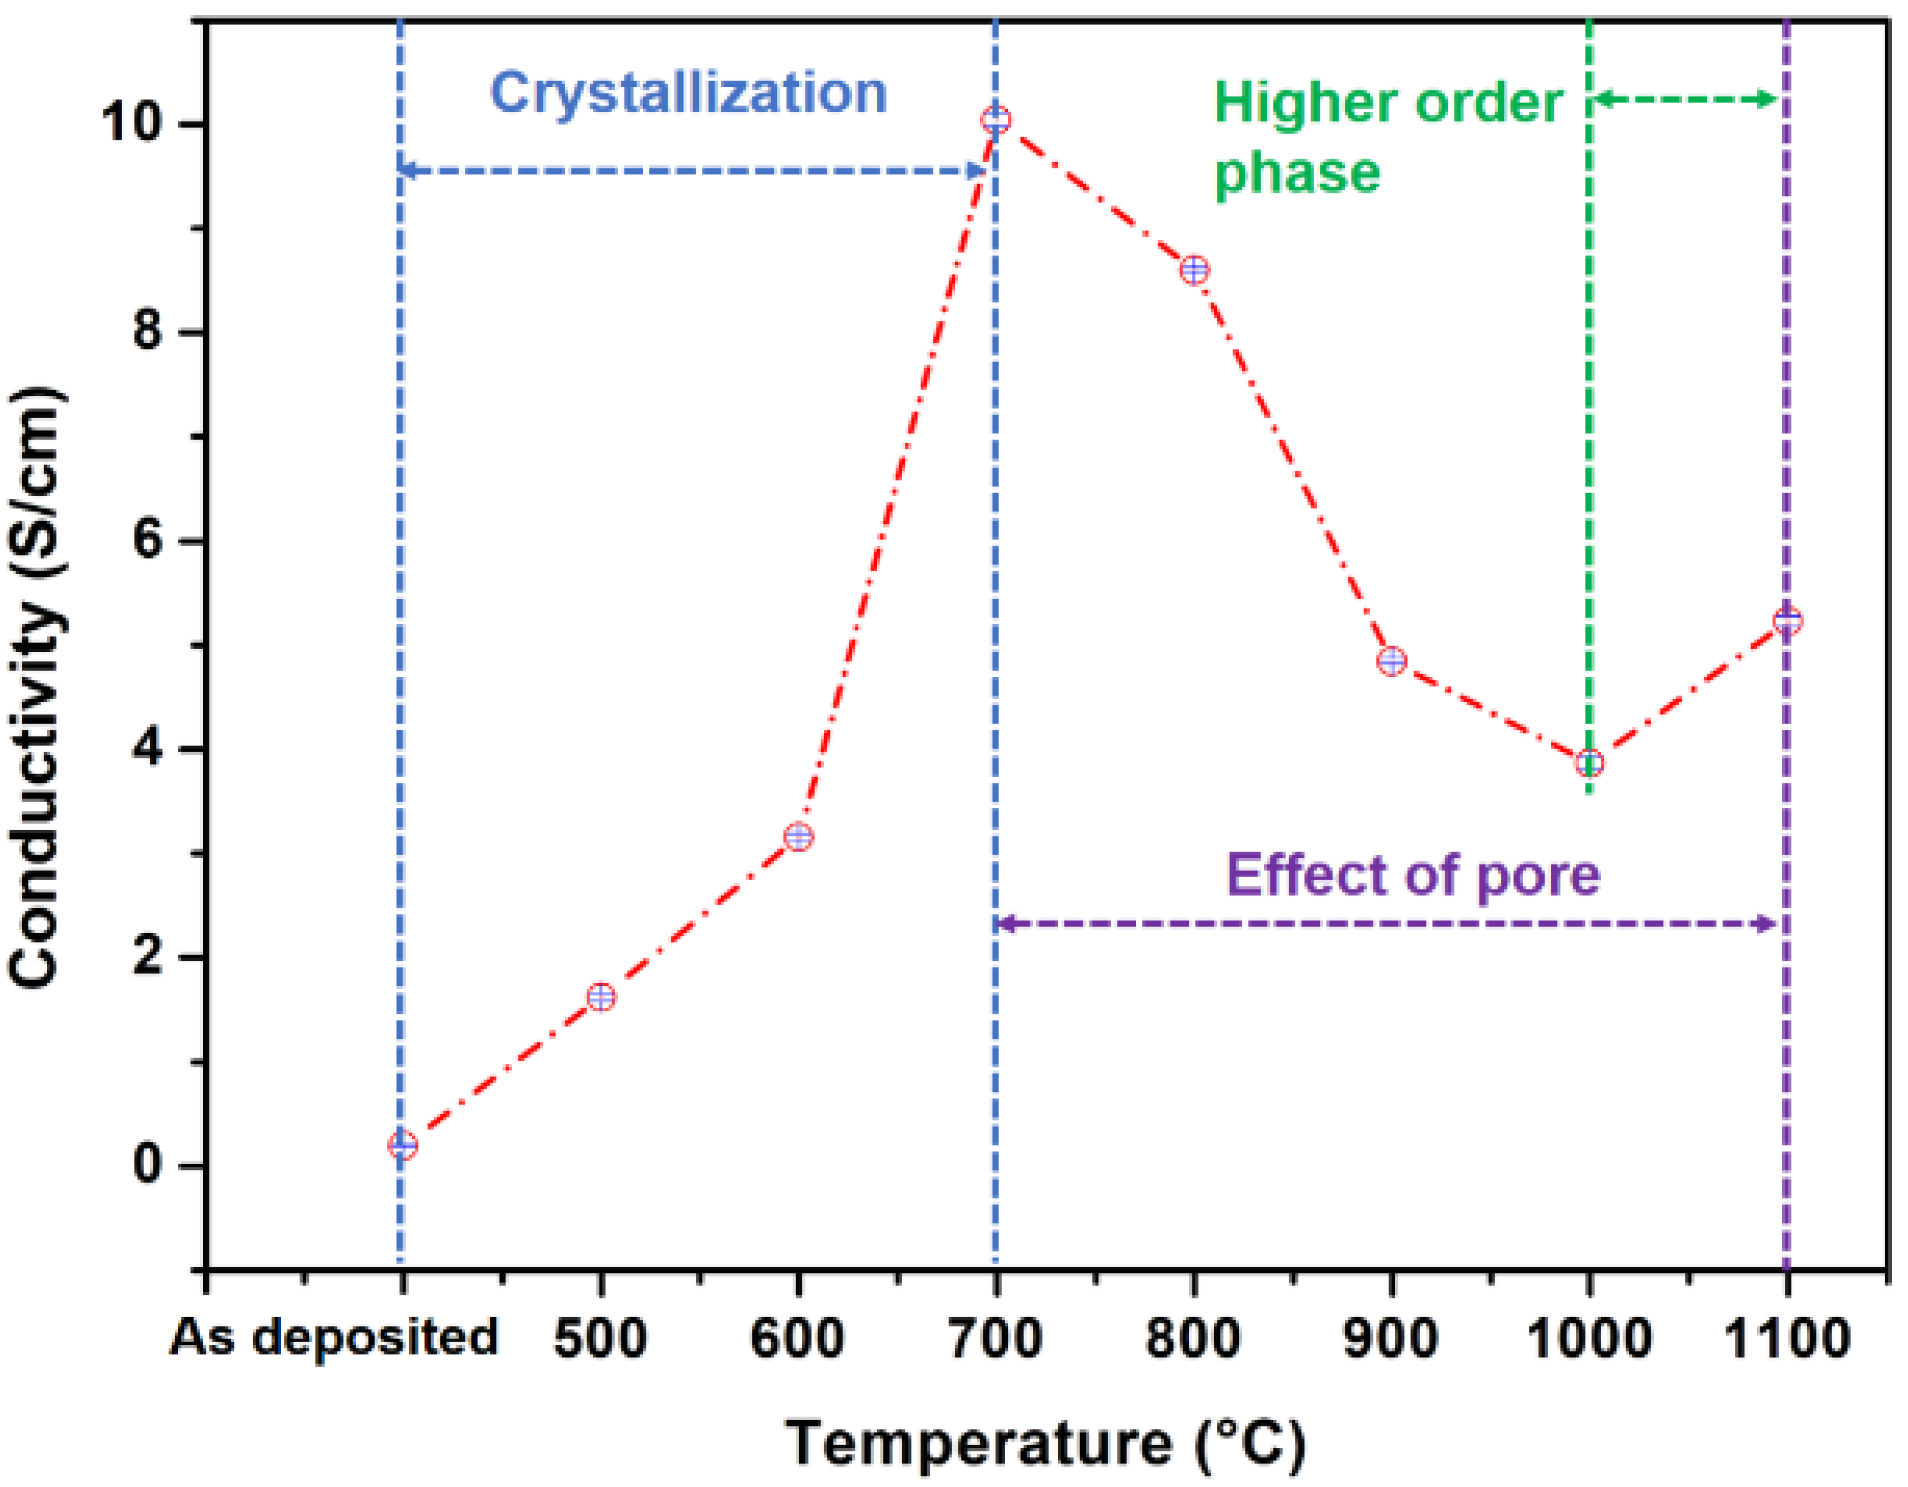
3.2. The Structure and Morphology Evolution of the La–Ni–O Coatings with the La/Ni Atomic Ratio of 2.04

Based on the above analysis, the La2NiO4 coatings were deposited in the intermediate domain, and the deposition parameters that allow a coating with a La/Ni atomic ratio of 2.04 are shown in Table 1. The coatings were deposited by co-sputtering of La and Ni metallic targets under the mixed Ar/O2 of 200/6 sccm. Previous work in our laboratory has shown that La2NiO4 coatings can be successfully synthesized by controlling the La/Ni atomic ratio close to 2 followed by suitable annealing treatment [20]. According to the Thornton’s diagram revised by Anders [22], the morphology of the coatings becomes less dense as the average energy of the impinging species decreases by increasing the deposition pressure. Previous works have shown that dense La2NiO4 coatings are deposited under a low pressure of 0.4 Pa [21]. The present work was carried out at a higher pressure of 2.4 Pa followed by an annealing treatment in order to obtain the appropriate porous coatings.
The as-deposited coatings were amorphous (Figure 3). Successive annealing treatments were realized under air for 2 h from 500 °C to 1100 °C, with steps of 100 °C, in order to obtain their crystallization. Annealing at 500 °C is characteristic of atomic rearrangements since the position of the maximum of the continuous background modulation shifts from about 34° to 38°. The coating starts to crystallize toward the La2NiO4 phase at 600 °C, while a relatively complete La2NiO4 phase appears at 700 °C. This can be judged from the appearance of two main peaks at 36.7° and 38.5° ascribed to the La2NiO4 phase. An ideal La2NiO4 coating with K2NiF4 structure can be obtained at 800 °C, which is consistent with the literature results [20]. Interestingly, a La3Ni2O7 phase appeared after annealing at 1100 °C. This may promote the conductivity of the coatings due to the appearance of higher-order Kn+1NinO3n+1 [23]. Additionally, the average grain size of the coating increases with the annealing temperature (Table 2). In particular, the average grain size increases sharply at 700 °C.
The morphological features of the coatings deposited on alumina plates were characterized by scanning electron microscopy with a backscattered electron detector (SEM-BED). Figure 4 and Figure 5 shows the top surface and cross-section morphologies of the coatings as the annealing progresses. For the as-deposited coating, the morphology reproduces the alumina substrate roughness. Columnar growth was observed from the cross-section, which is consistent with the characteristics of general coatings deposited by magnetron sputtering. In addition, the coatings cover the substrate tightly and exhibit good adhesion. As the annealing temperature increased, the morphology of the coatings changed. The micro (or nano) pores began to appear in the coating near the alumina substrate at 700 °C with a whole volume that does not change much up to 900 °C (Figure 4d–f, Figure 5d–f and Figure 6). These pores should come from the elimination of intrinsic atomic-scale defects. At this time, the pores were not open, which was not conducive to oxygen diffusion. A porous morphology of a large size was observed on the top surface of the coating after annealing at 1000 °C (Figure 4g). Pores in the top surface of the coating after annealing at 1000 °C with a diameter between 20 and 120 nm occupy more than 90% (Figure 7a). As the annealing temperature increased to 1100 °C, the number of pores on the top surface of the coating decreased, but their size further increased (Figure 4h). The pore size of the coating after annealing at 1100 °C is concentrated mainly between 50 and 250 nm, accounting for more than 90% (Figure 7c). For the porous morphology, the cross-section of the coatings from 1000 °C to 1100 °C shows the same phenomenon as the top surface (Figure 4g–h and Figure 7b,d). As the annealing temperature increases, the grain size increases, which in turn causes the micron (nano) pores to be aggregated into macropores accompanied by volume increase (Figure 6). Moreover, there are channels between the pores inside the coating, which is conducive to oxygen diffusion (Figure 4g,h). However, increasing the pore size reduces the number of small pores (from 1000 to 1100 °C), which may reduce the specific surface area inside the coating.
A short-term stability experiment was performed to examine the stability of the coating. The coating deposited on the alumina plate after annealing at 1000 °C for 2 h was continuously annealing at 750 °C for 120 h. The structure and the porous morphology of the coating were assessed by XRD and SEM, respectively, as shown in Figure 8 and Figure 9. The porous morphology of the coating was still well maintained (Figure 8a). Figure 8b shows that the number of the pores of the top surface in the larger pore size range (120–240 nm) was slightly increased compared to Figure 7a. However, the pore size distribution of the cross-section is still concentrated mainly in the 20–120 nm range. On the other hand, no obvious difference was observed in the cross-section (Figure 8c,d) of the coating compared to Figure 4g and Figure 6b. This suggests that the porous morphology of the coating obtained after annealing at 1000 °C for 2 h remains relatively stable. The XRD result indicates the chemical stability of this coating at 750 °C (Figure 9), but the average grain size is increased (Table 2).

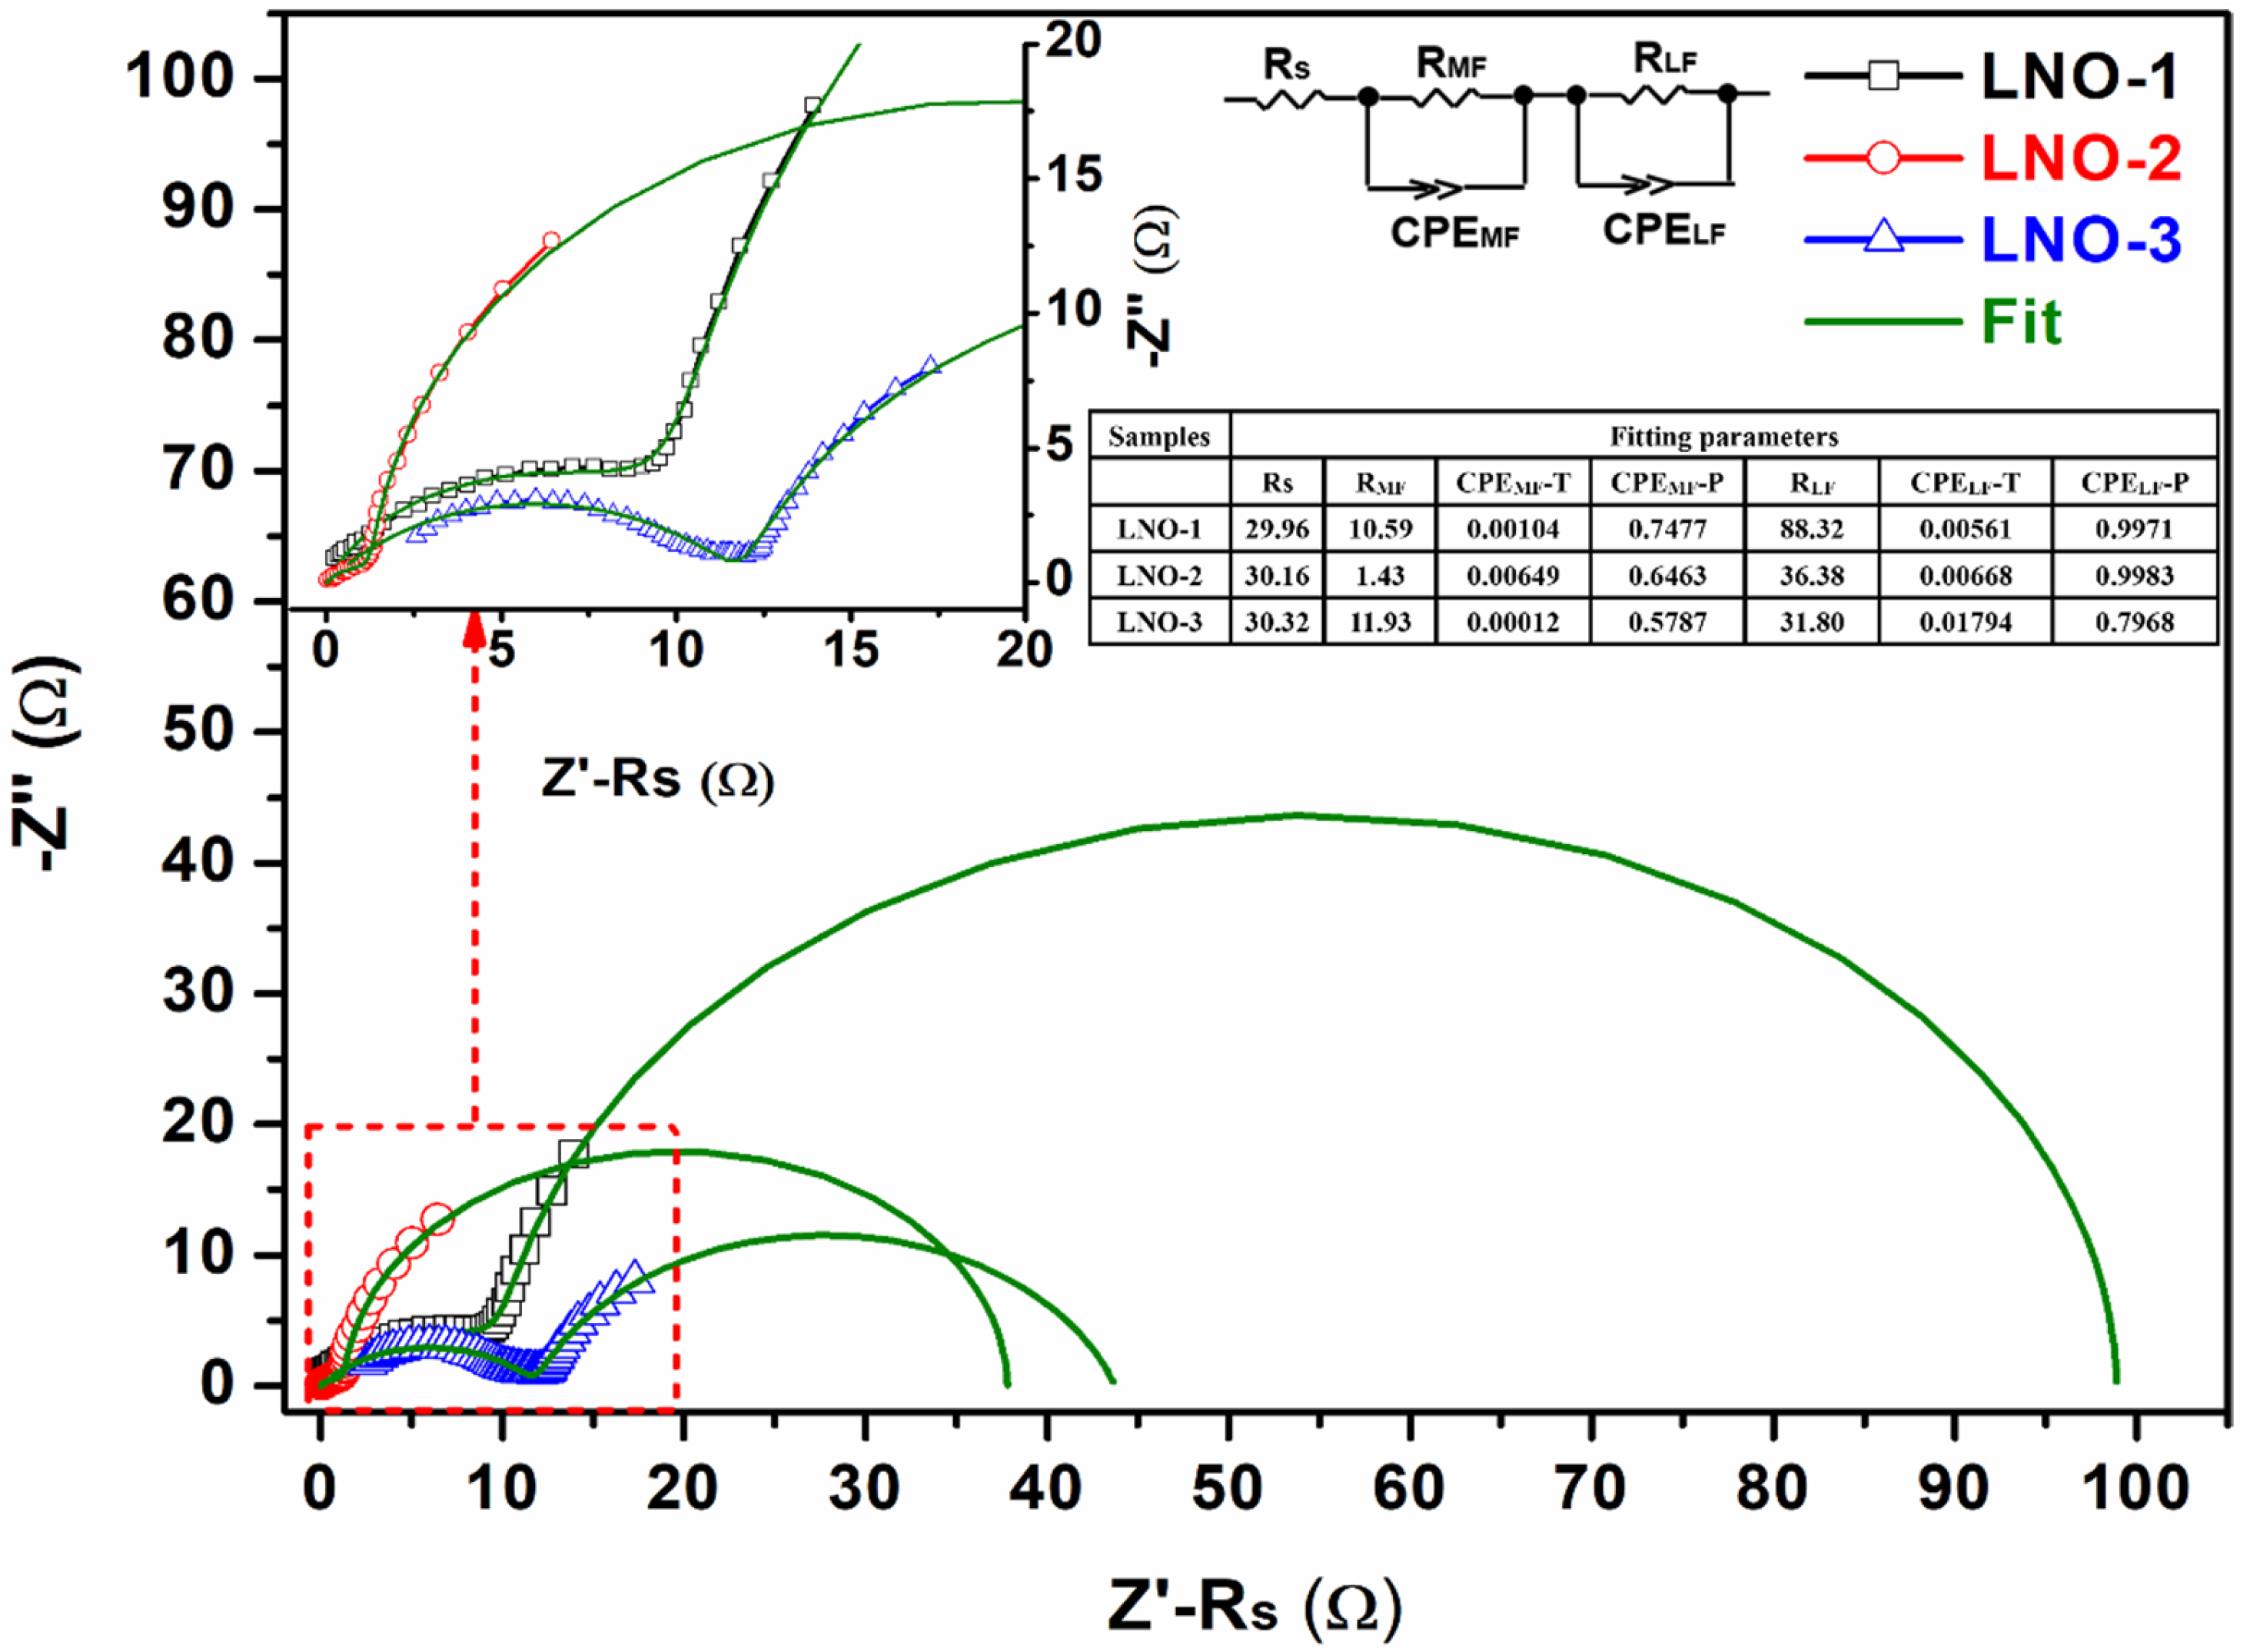
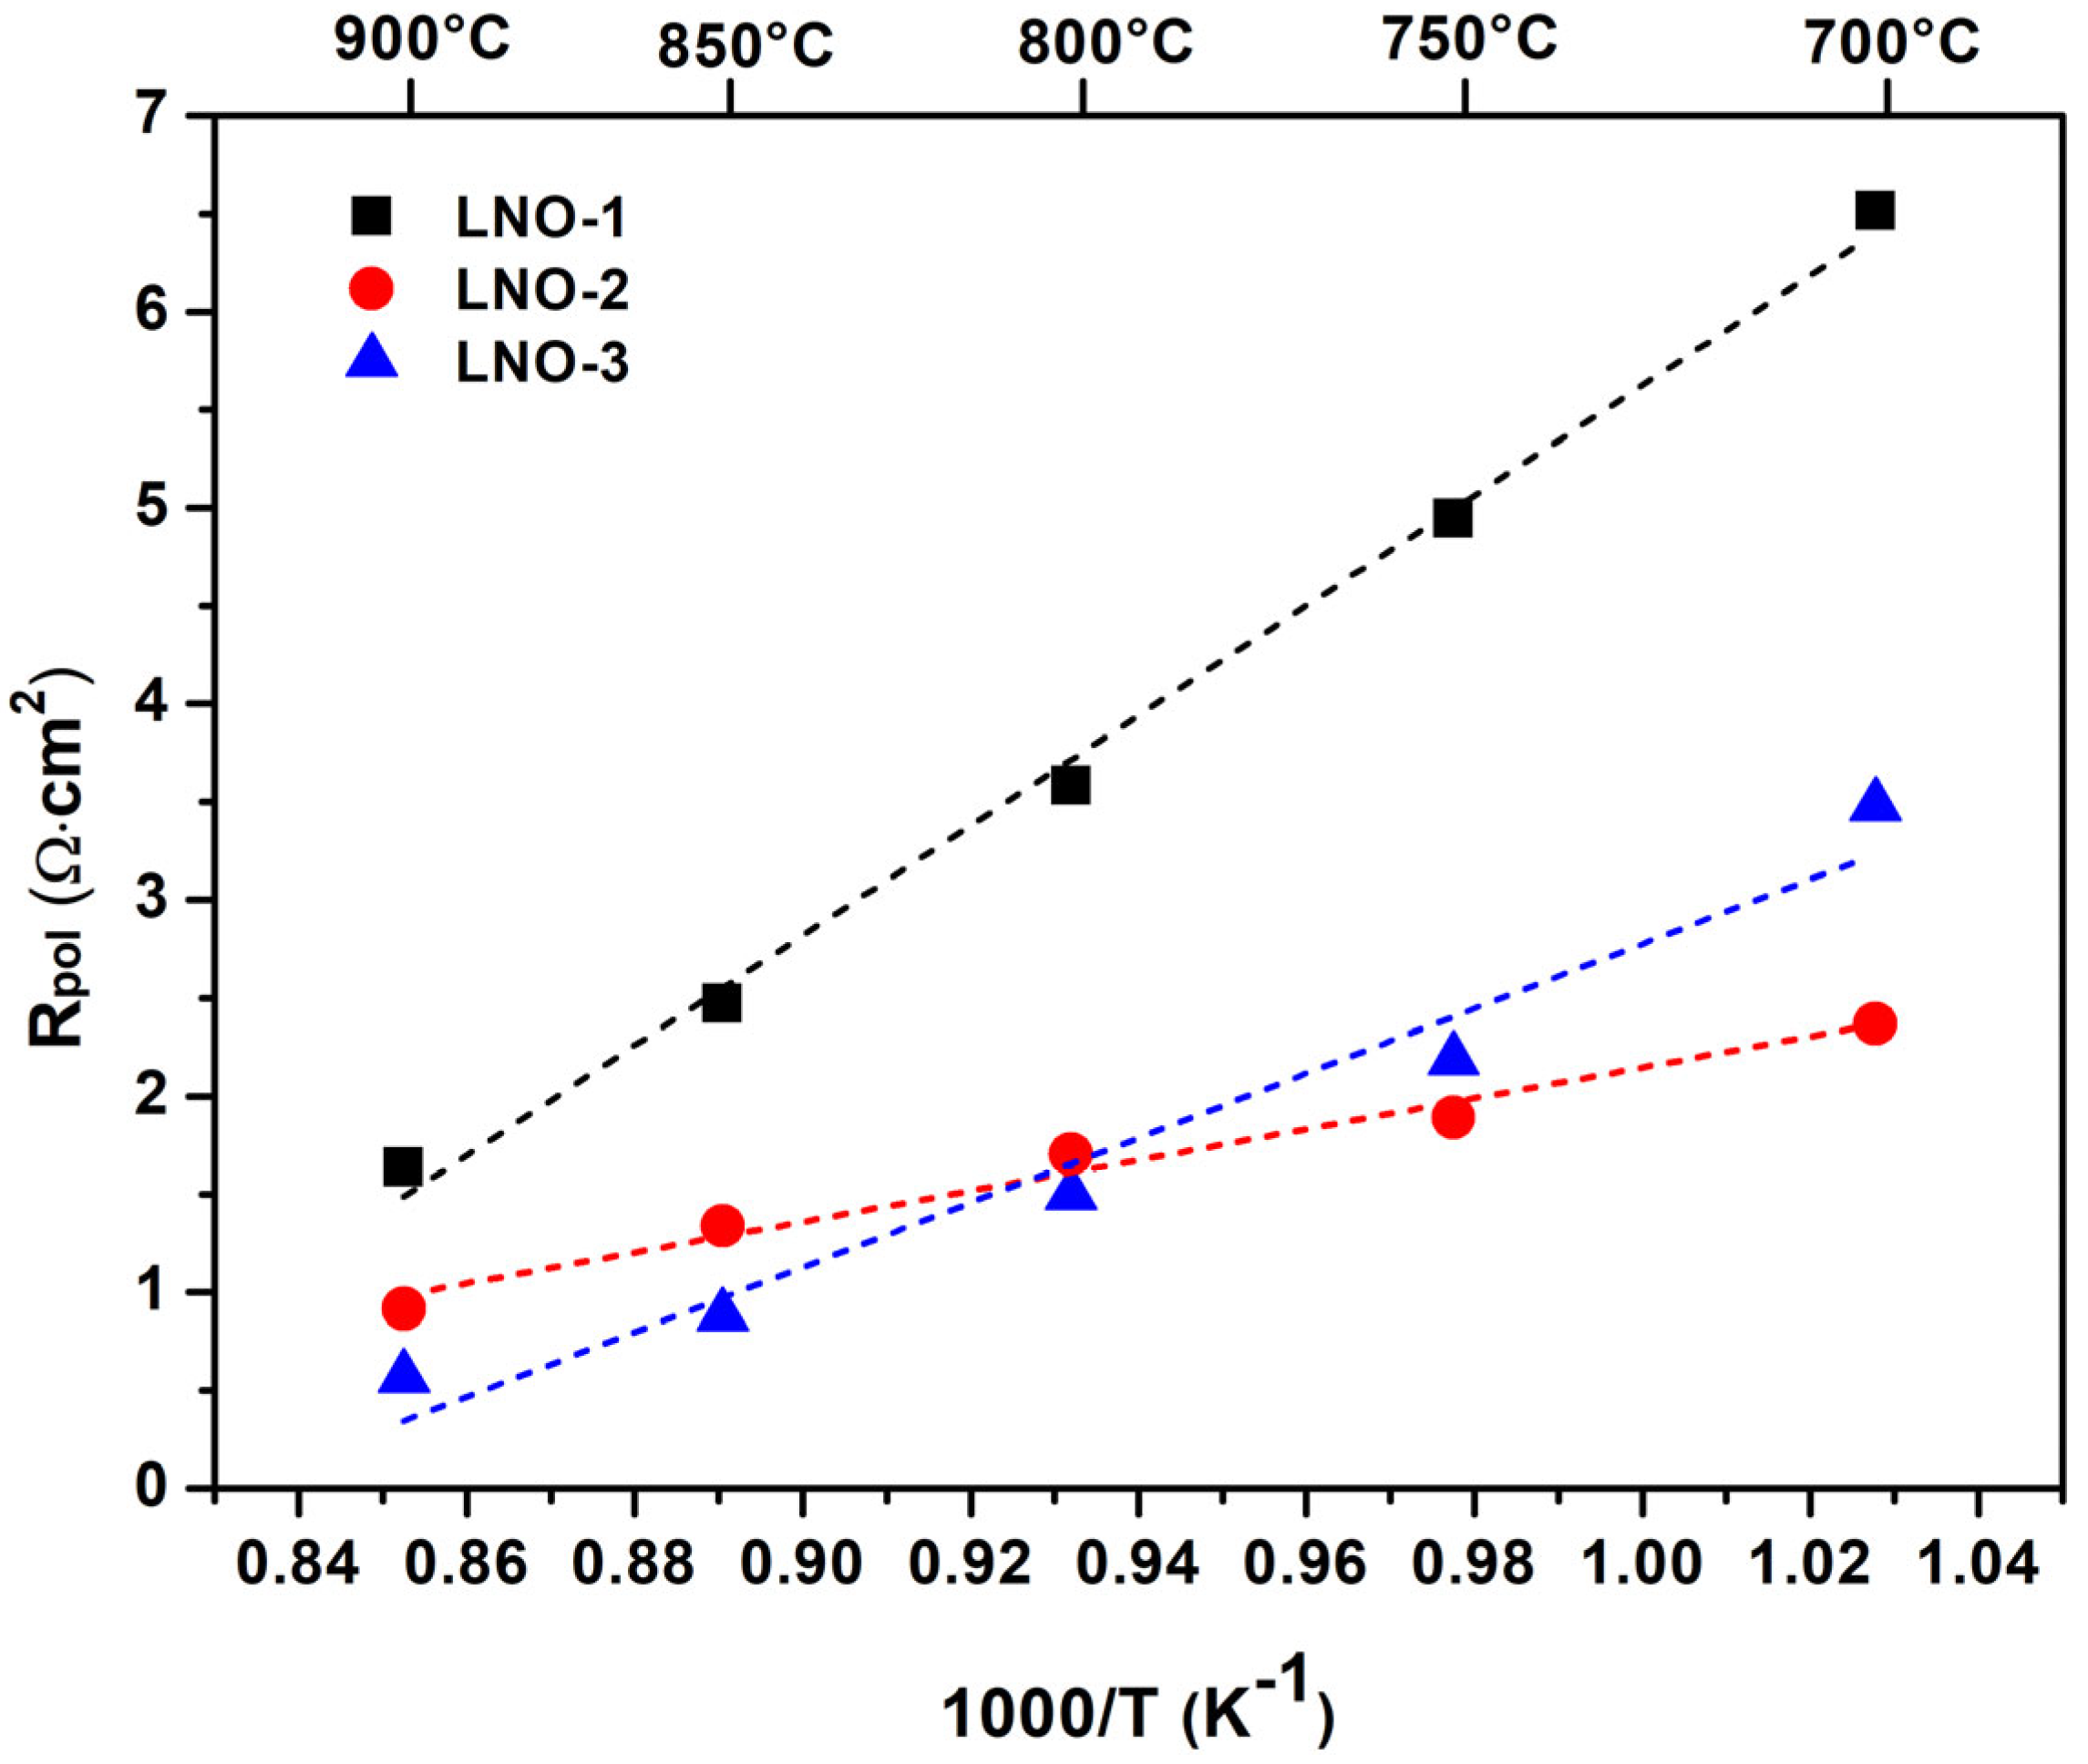
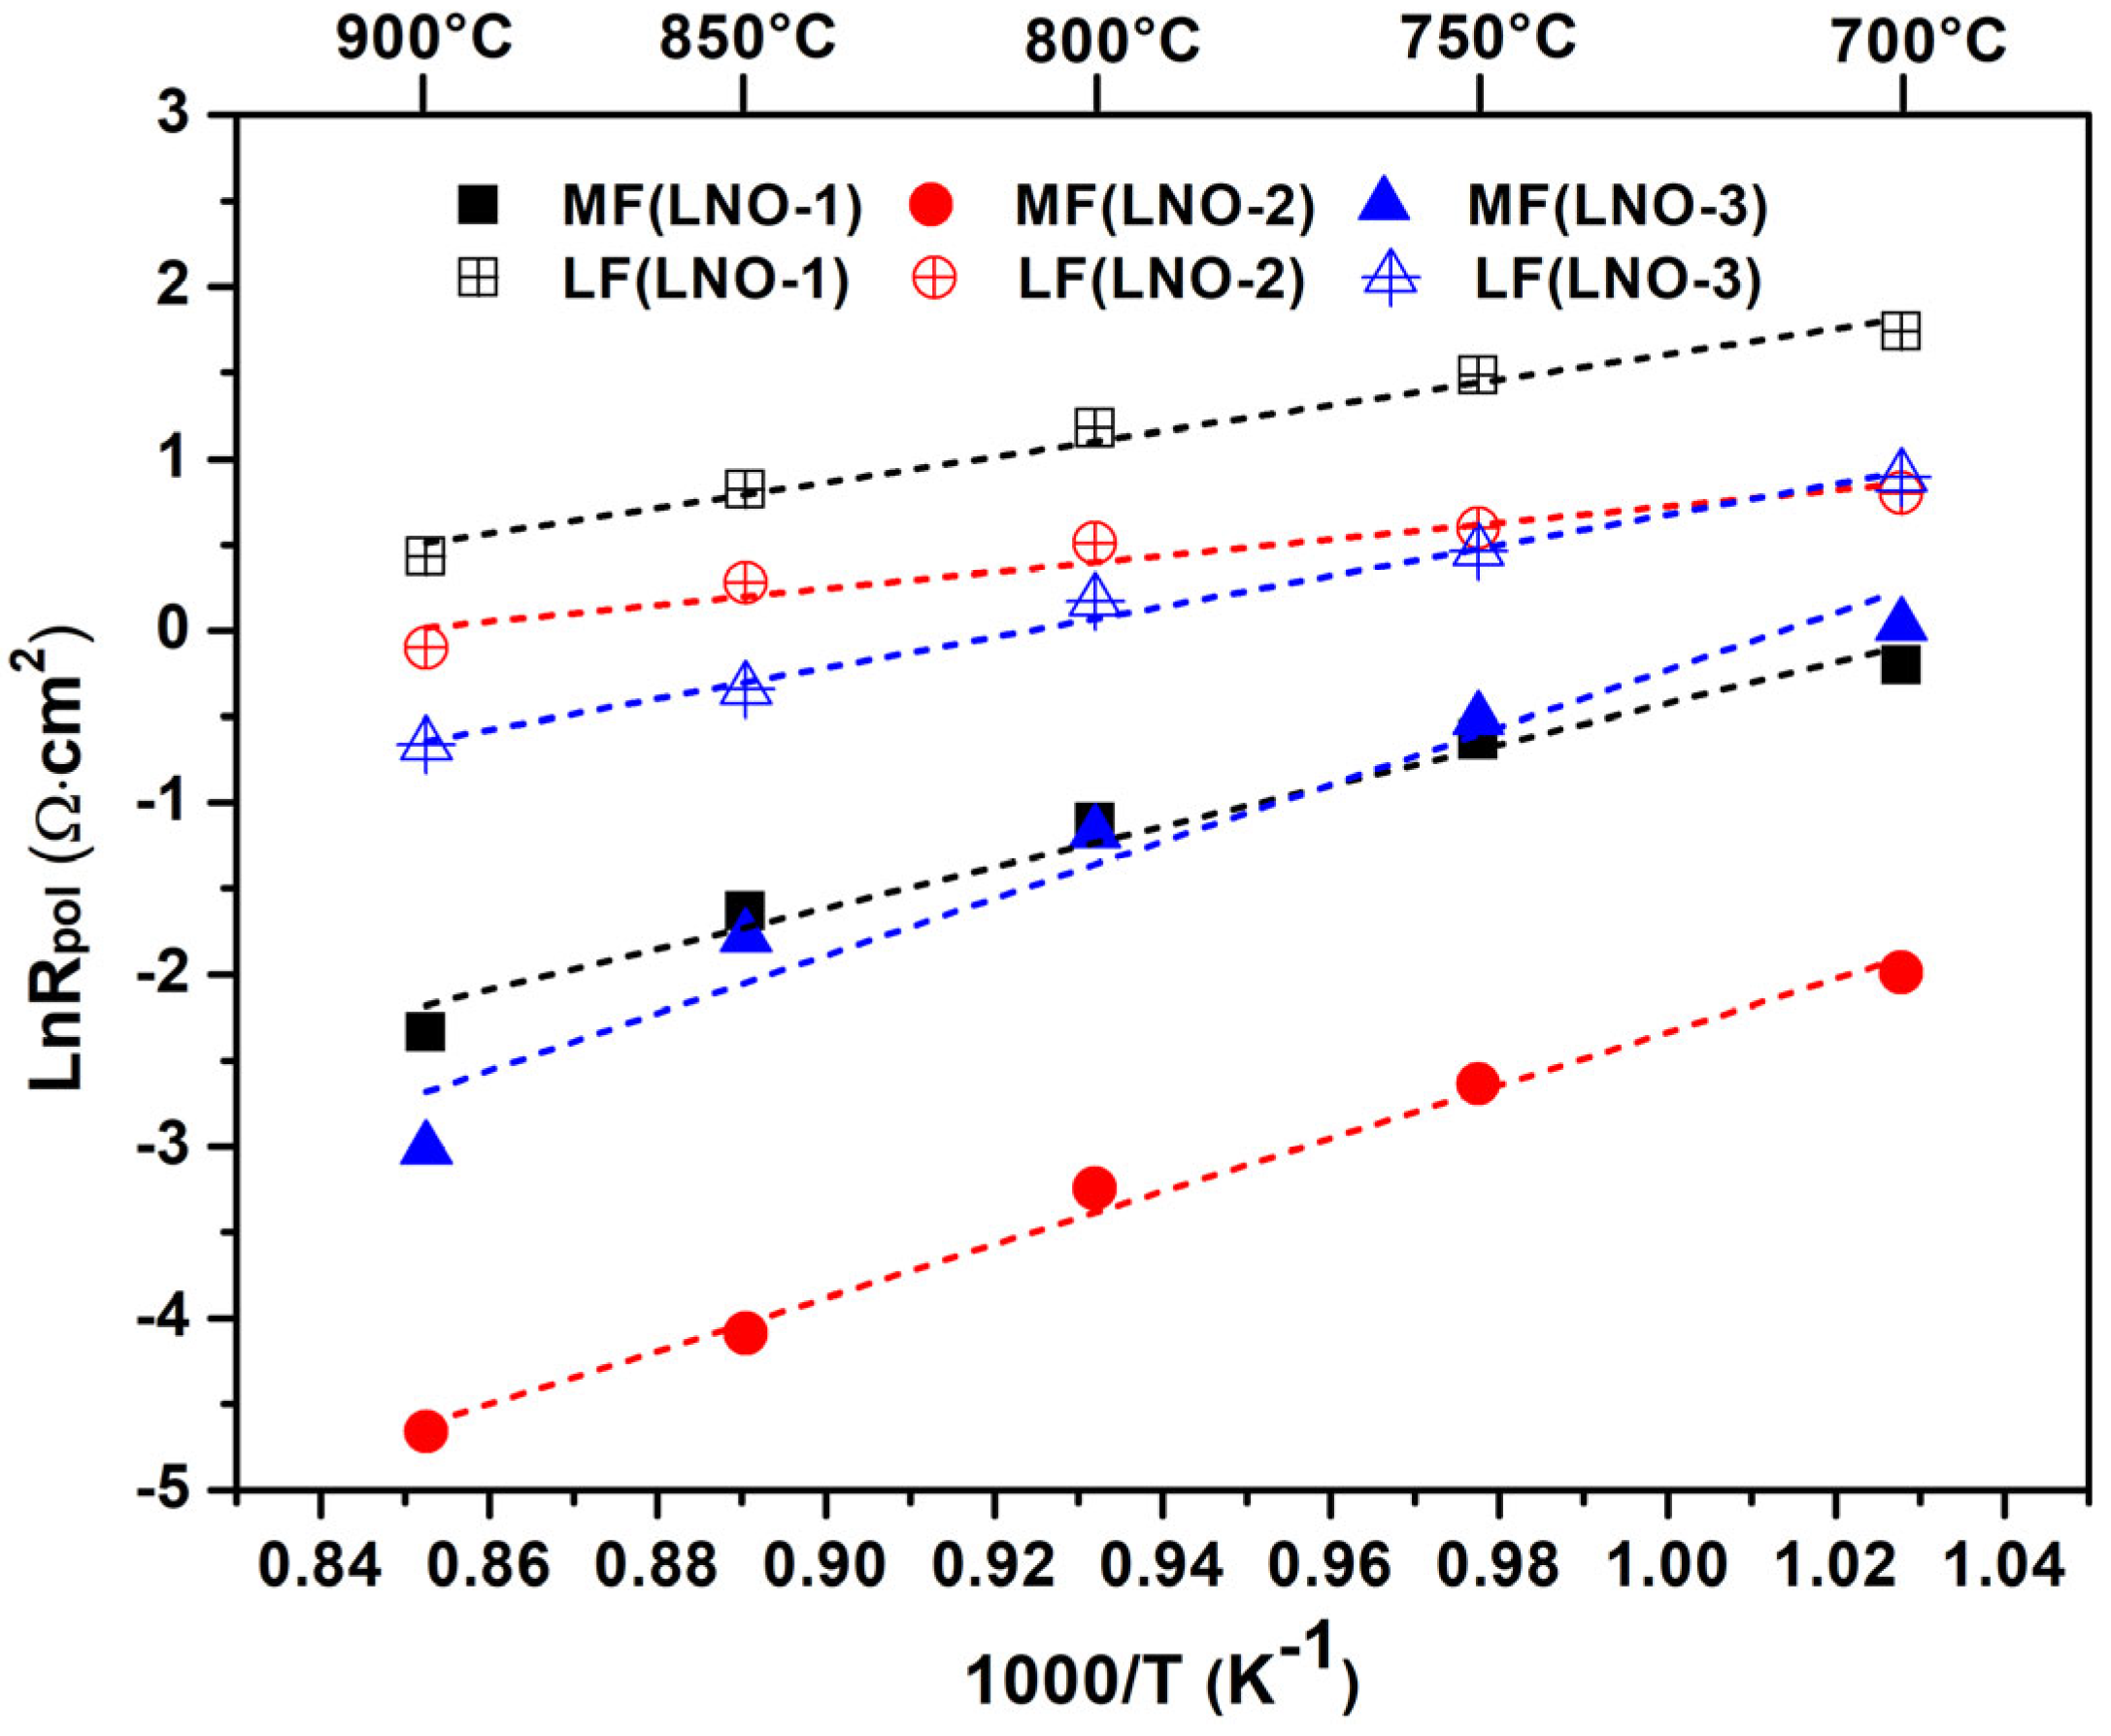
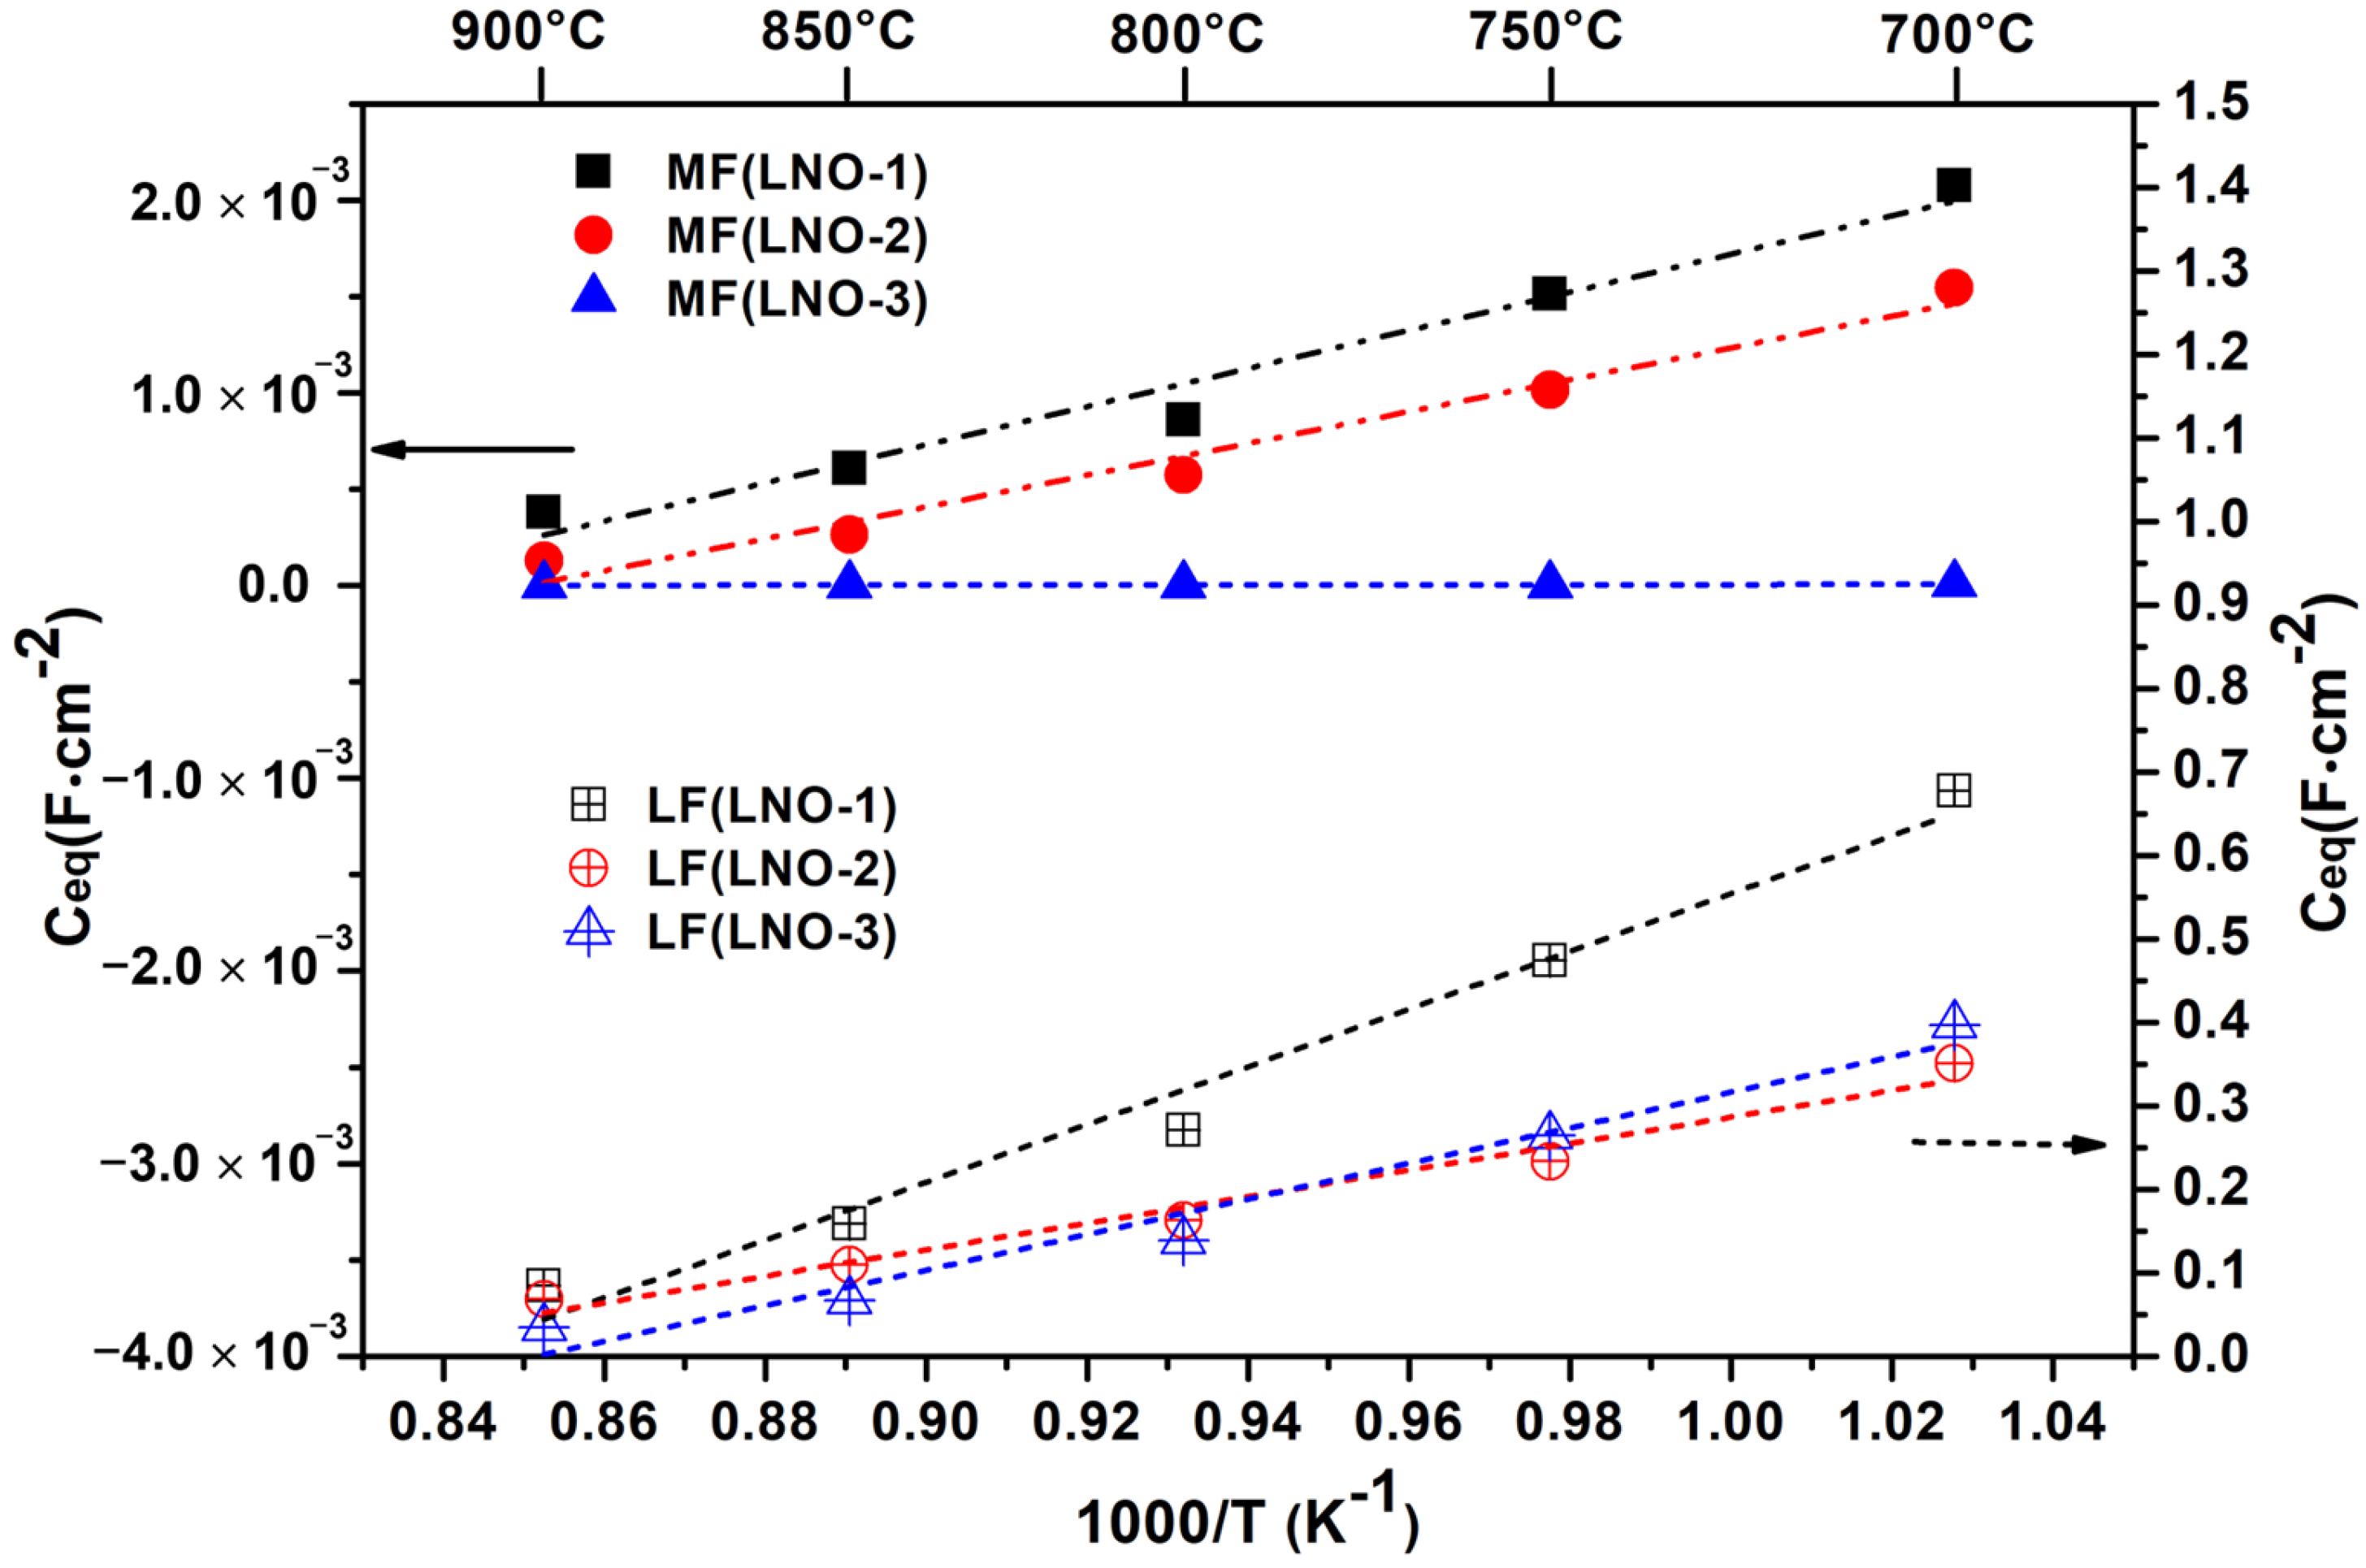
3.3. Electrical and Electrochemical Properties of the La2NiO4 Coatings

The coatings undergo crystallization, structure change, and morphology evolution during annealing treatments, which may affect their performance. In this work, the electrical conductivity of LNO coatings subjected to different annealing treatments and the electrochemical behavior of LNO/YSZ/LNO symmetric half-cells were assessed. The electrical conductivity of the LNO coatings deposited on alumina plates after different annealing treatments was analyzed by the four-point probe method under air (Figure 10). The electrical conductivity of LNO coatings undergoes three stages as a function of the annealing temperature. It first increases with the annealing temperature up to 700 °C, which may be attributed to the crystallization of the coatings. From 700 °C to 1000 °C, a decrease in electronic conductivity of the coating was observed, which may be affected by its increasing number of pores. The formation of higher-order phases (La3Ni2O7) may be an important factor for the increase in the electronic conductivity observed from 1000 °C to 1100 °C [23]. Therefore, the electronic conductivity of the coating was affected by crystallization, phase nature, and morphology.
To determine the electrochemical performances of the coatings as a function of the annealing temperature, coatings with thickness of 1.6 μm were deposited on both sides of the YSZ plates, named LNO−1 (annealing at 900 °C), LNO−2 (annealing at 1000 °C), and LNO−3 (annealing at 1100 °C), respectively. Electrochemical impedance spectroscopy (EIS) measurements of the LNO/YSZ/LNO symmetric half-cells were performed under air from 700 °C to 900 °C by steps of 50 °C. These EIS experiments were carried out with a voltage amplitude of 0.1 V in the frequency range from 10 MHz to 1 Hz with 11 points per decade. The impedance of all cells was normalized by multiplying the superficial area (0.1 cm2).
Nyquist plots of the symmetric half-cells obtained at 750 °C for LNO−1, LNO−2, and LNO−3 are shown in Figure 11. Three contributions are identified in the high, medium, and low frequency ranges. The contribution in medium and low frequency ranges can be explained as follows [24,25,26]: (i) the semicircle in the medium frequency range (MF) was attributed to the transfer of O2− from the electrode to the electrolyte; and (ii) the large depress arc in low frequency range (LF) represents an oxygen adsorption/dissociation step overlapping with the diffusion process. Generally, high frequency resistance (Rs) was attributed to electrolyte resistance. To facilitate analysis of the LNO cathode, Rs was removed. The contributions appearing in MF and LF ranges corresponding to that of the LNO electrode were fitted by an equivalent circuit consisting of two Resistance–Constant Phase Elements (R-CPE) in parallel, associated in series (see Figure 11).
The Nyquist plots were fitted by Z-View software, where the open symbols represent the experimental measurements, and the green lines represent the fitting results. Relevant resistance and capacitance information were extracted from the fitting results to calculate polarization resistance, activation energy, and equivalent capacitance. The polarization resistance was calculated by the Formula (1):
R p = R MF + R LF × S 2
where RMF and RLF were the resistance values at the MF and LF ranges, respectively, and S is the superficial area (0.1 cm2).
The activation energy (Ea) for electrochemical behavior was calculated according to the Arrhenius relation from the slope of the curve Ln R = f (1000/T). The equivalent capacitance (Ceq) was calculated using Formula (2):
C eq = Re 1 n n × CPE 1 n
where R was the electrical resistance, n, the decentering parameter of the Constant Phase Element, and CPE, the capacitance of the Constant Phase Element.
Figure 12 presents the Rp calculated from EIS measurements from 700 °C to 900 °C for LNO−1, LNO−2, and LNO−3. The Rp of all the samples decreased with increasing temperature. LNO-2 and LNO-3 exhibit lower Rp than LNO−1, which may be attributed to the porous morphology if we refer to previous work [9]. At an intermediate temperature (700 °C), the Rp of LNO−2 is 2.37 Ω·cm2, which is in agreement with the 4.0 Ω·cm2 of Zhao et al. [27], the 7.77 Ω·cm2 of Escudero et al. [28], and the 2.1 Ω·cm2 of Benamira et al. [29]. For the activation energy of electrochemical phenomena, LNO−2 shows the lowest value of 0.44 eV compared to LNO−1 and LNO−3, which is close to the previous work of 0.4 eV and lower than the values of the literature (Table 3).
Furthermore, Figure 13 and Figure 14 present the Arrhenius plots of Rp and equivalent capacities at the MF and LF ranges, corresponding to different electrochemical responses. It can be seen from Figure 13 that LNO−1 has the highest Rp in the LF range, which may be limited by the O2 diffusion caused by the closed micro (nano) pore morphology. Similarly, LNO−3 exhibits the lowest Rp in the LF range, thanks to the porous morphology with a larger pore size. LNO−2 has a clear advantage in the MF range compared to LNO−1 and LNO−3, which may be the result of a combination of two reasons: (i) the abundant porous morphology promotes the diffusion of O2; and (ii) more specific surface area provides more oxygen adsorption sites and thus enhances the ORR. From Figure 14, the equivalent capacitance in the MF range was much lower than that in the LF range for LNO−1, LNO−2, and LNO−3, which was consistent with the study by Mauvy et al. [24]. In general, low capacitance was thought to be associated with ion transport, gas adsorption/desorption, and ORR [9,30,31]. The equivalent capacitance of LNO−2 was between LNO−1 and LNO−3 in the MF range, which may also verify that LNO−2 has the lowest Rp in the MF range due to the combined effect of the two reasons mentioned above.

4. Conclusions

The La–Ni–O coating with a La/Ni atomic ratio of about 2.04 deposited by reactive magnetron sputtering was subjected to a suitable annealing treatment process to obtain a porous LNO coating with a La2NiO4 phase. The annealing temperature was crucial to the formation of the La2NiO4 phase and the porous morphology. The LNO coating with abundant pores was obtained after annealing at 1000 °C for 2 h. Electrochemical impedance spectroscopy (EIS) characterization of the symmetrical cells indicated that the LNO−2 cathode obtained by annealing at 1000 °C exhibited lower polarization resistance compared to the LNO−1 (annealing at 900 °C) and LNO−3 (annealing at 1100 °C) cathodes. The short-term stability experiment confirmed the stability of this porous morphology at the operating temperature of 750 °C. This work aims to provide a reference for the direct synthesis of appropriate porous LNO cathodes on electrolyte by magnetron sputtering. Nevertheless, further works must be carried out, such as lowering the subsequent annealing temperature to facilitate more flexible applications in the fabrication of metal-supported solid oxide fuel cells (MS-SOFC) operating at intermediate temperatures.

Author Contributions

Conceptualization, H.L.; Data curation, X.Y.; Formal analysis, M.H.; Investigation, X.Y.; Methodology, X.Y.; Resources, P.B. (Pascal Briois); Visualization, H.L. and P.B. (Pierre Bertrand); Writing—original draft, X.Y.; Writing—review & editing, P.B. (Pascal Briois), H.L., A.B. and P.B. (Pierre Bertrand). All authors have read and agreed to the published version of the manuscript.

Funding

This research was funded by China Scholarship Council (No. 201808530576) and Natural Science Basic Research Plan in Shaanxi Province of China (2022JQ-551).

Institutional Review Board Statement

Not applicable.

Informed Consent Statement

Not applicable.

Data Availability Statement

Not applicable.

Acknowledgments

The authors thank the China Scholarship Council, Natural Science Basic Research Plan in Shaanxi Province of China, and Pays de Montbéliard Agglomeration for their financial support of this work.

Conflicts of Interest

The authors declare no conflict of interest.

References

  1. Vohs, J.M.; Gorte, R.J. High-performance SOFC cathodes prepared by infiltration. Adv. Mater. 2009, 21, 943–956. [Google Scholar] [CrossRef]
  2. Yang, L.; Wang, S.; Blinn, K.; Liu, M.; Liu, Z.; Cheng, Z.; Liu, M. Enhaned sulfur and coking tolerance of a mixed ion conductor for SOFCs: BaZr0.1Ce0.7Y0.2–x YbxO3–δ. Science 2009, 326, 126–129. [Google Scholar] [CrossRef] [PubMed] [Green Version]
  3. Li, M.; Zhao, M.; Li, F.; Zhou, W.; Peterson, V.K.; Xu, X.; Shao, Z.; Gentle, I.; Zhu, Z. A niobium and tantalum co-doped perovskite cathode for solid oxide fuel cells operating below 500 °C. Nat. Commun. 2017, 8, 13990. [Google Scholar] [CrossRef] [PubMed] [Green Version]
  4. Chen, Y.; Choi, Y.; Yoo, S.; Ding, Y.; Yan, R.; Pei, K.; Qu, C.; Zhang, L.; Chang, I.; Zhao, B.; et al. A highly efficient multi-phase catalyst dramatically enhances the rate of oxygen reduction. Joule 2018, 2, 938–949. [Google Scholar] [CrossRef]
  5. Alenazey, F.; Alyousef, Y.; AlOtaibi, B.; Almutairi, G.; Minakshi, M.; Cheng, C.K.; Vo, D.V.N. Degradation behaviors of solid oxide fuel cell stacks in steady-state and cycling conditions. Energy Fuels 2020, 34, 14864–14873. [Google Scholar] [CrossRef]
  6. DiGiuseppe, G.; Sun, L. Electrochemical performance of a solid oxide fuel cell with an LSCF cathode under different oxygen concentrations. Int. J. Hydrogen Energy 2011, 36, 5076–5087. [Google Scholar] [CrossRef]
  7. Zhang, Y.; Chen, B.; Guan, D.; Xu, M.; Ran, R.; Ni, M.; Zhou, W.; O’hayre, R.; Shao, Z. Thermal-expansion offset for high-performance fuel cell cathodes. Nature 2021, 591, 246–251. [Google Scholar] [CrossRef]
  8. Xu, K.; Pei, K.; Zhao, B.; Zhao, Y.; Niu, Q.; Chen, Y. An oxygen reduction reaction active and durable SOFC cathode/electrolyte interface achieved via a cost-effective spray-coating. Int. J. Hydrogen Energy 2021, 46, 32242–32249. [Google Scholar] [CrossRef]
  9. Dailly, J.; Fourcade, S.; Largeteau, A.; Mauvy, F.; Grenier, J.C.; Marrony, M. Perovskite and A2MO4-type oxides as new cathode materials for protonic solid oxide fuel cells. Electrochim. Acta 2010, 55, 5847–5853. [Google Scholar] [CrossRef]
  10. Burriel, M.; Santiso, J.; Rossell, M.D.; Tendeloo, G.V.; Figueras, A.; Garcia, G. Enhancing total conductivity of La2NiO4+δ epitaxial thin films by reducing thickness. J. Phys. Chem. C 2008, 112, 10982–10987. [Google Scholar] [CrossRef]
  11. Flura, A.; Dru, S.; Nicollet, C.; Vibhu, V.; Fourcade, S.; Lebraud, E.; Rougier, A.; Bassat, J.-M.; Grenier, J.-C. Chemical and structural changes in Ln2NiO4+δ (Ln = La, Pr or Nd) lanthanide nickelates as a function of oxygen partial pressure at high temperature. J. Solid State Chem. 2015, 228, 189–198. [Google Scholar] [CrossRef]
  12. Fondard, J.; Billard, A.; Bertrand, G.; Briois, P. Ln2NiO4+δ (Ln = La, Pr, Nd) coatings deposited by reactive magnetron sputtering as cathode material for intermediate temperature solid oxide fuel cell. Vacuum 2018, 152, 97–108. [Google Scholar] [CrossRef] [Green Version]
  13. Wu, J.; Liu, X. Recent development of SOFC metallic interconnect. J. Mater. Sci. Technol. 2010, 26, 293–305. [Google Scholar] [CrossRef]
  14. Zhao, K.; Wang, Y.P.; Chen, M.; Xu, Q.; Kim, B.H.; Huang, D.P. Electrochemical evaluation of La2NiO4+δ as a cathode material for intermediate temperature solid oxide fuel cells. Int. J. Hydrogen Energy 2014, 39, 7120–7130. [Google Scholar] [CrossRef]
  15. Philippeau, B.; Mauvy, F.; Mazataud, C.; Fourcade, S.; Grenier, J.C. Comparative study of electrochemical properties of mixed conducting Ln2NiO4+δ (Ln = La, Pr and Nd) and La0.6Sr0.4Fe0.8Co0.2O3−δ as SOFC cathodes associated to Ce0.9Gd0.1O2−δ, La0.8Sr0.2Ga0.8Mg0.2O3−δ and La9Sr1Si6O26.5 electrolytes. Solid State Ion. 2013, 249, 17–25. [Google Scholar] [CrossRef]
  16. Yang, S.H.; Kim, K.H.; Yoon, H.H.; Kim, W.J.; Choi, H.W. Comparison of combustion and solid-state reaction methods for the fabrication of SOFC LSM cathodes. Mol. Cryst. Liq. Cryst. 2011, 539, 50–390. [Google Scholar] [CrossRef]
  17. Solovyev, A.; Burmistrov, I.N.; Rabotkin, S.; Shipilova, A.; Yalovenko, D.V.; Semenov, V.; Bredikhin, S.I. Electrochemical Characterization of Intermediate-Temperature Solid Oxide Fuel Cells with PVD-Coated Electrolyte. ECS Trans. 2021, 103, 105. [Google Scholar] [CrossRef]
  18. Gannon, P.; Deibert, M.; White, P.; Smith, R.; Chen, H.; Priyantha, W.; Gorokhovsky, V. Advanced PVD protective coatings for SOFC interconnects. Int. J. Hydrogen Energy 2008, 33, 3991–4000. [Google Scholar] [CrossRef]
  19. Jung, W.; Kim, J.J.; Tuller, H.L. Investigation of nanoporous platinum thin films fabricated by reactive sputtering: Application as micro-SOFC electrode. J. Power Source 2015, 275, 860–865. [Google Scholar] [CrossRef] [Green Version]
  20. Briois, P.; Perry, F.; Billard, A. Structural and electrical characterisation of lanthanum nickelate reactively sputter-deposited thin films. Thin Solid Films 2008, 516, 3282–3286. [Google Scholar] [CrossRef]
  21. Fondard, J.; Billard, A.; Bertrand, G.; Briois, P. Synthesis and characterization of La2NiO4+δ coatings deposited by reactive magnetron sputtering using plasma emission monitoring. Solid State Ion. 2014, 265, 73–79. [Google Scholar] [CrossRef] [Green Version]
  22. Anders, A.X. A structure zone diagram including plasma-based deposition and ion etching. Thin Solid Films 2010, 518, 4087–4090. [Google Scholar] [CrossRef] [Green Version]
  23. Amow, G.; Davidson, I.J.; Skinner, S.J. A comparative study of the Ruddlesden-Popper series, Lan+1NinO3n+1 (n = 1, 2 and 3), for solid-oxide fuel-cell cathode applications. Solid State Ion. 2006, 177, 1205–1210. [Google Scholar] [CrossRef] [Green Version]
  24. Mauvy, F.; Lalanne, C.; Bassat, J.M.; Grenier, J.C.; Zhao, H.; Huo, L.; Stevens, P. Electrode properties of Ln2NiO4+δ (Ln = La, Nd, Pr): AC impedance and DC polarization studies. J. Electrochem. Soc. 2006, 153, A1547. [Google Scholar] [CrossRef]
  25. Minakshi, M.; Mitchell, D.R.; Munnangi, A.R.; Barlow, A.J.; Fichtner, M. New insights into the electrochemistry of magnesium molybdate hierarchical architectures for high performance sodium devices. Nanoscale 2018, 10, 13277–13288. [Google Scholar] [CrossRef] [PubMed] [Green Version]
  26. Barmi, M.J.; Minakshi, M. Tuning the redox properties of the nanostructured CoMoO4 electrode: Effects of surfactant content and synthesis temperature. ChemPlusChem 2016, 81, 964–977. [Google Scholar] [CrossRef]
  27. Zhao, H.; Mauvy, F.; Lalanne, C.; Bassat, J.M.; Fourcade, S.; Grenier, J.C. New cathode materials for ITSOFC: Phase stability, oxygen exchange and cathode properties of La2−xNiO4+δ. Solid State Ion. 2008, 179, 2000–2005. [Google Scholar] [CrossRef]
  28. Escudero, M.J.; Aguadero, A.; Alonso, J.A.; Daza, L. A kinetic study of oxygen reduction reaction on La2NiO4 cathodes by means of impedance spectroscopy. J. Electroanal. Chem. 2007, 611, 107–116. [Google Scholar] [CrossRef]
  29. Benamira, M.; Ringuedé, A.; Cassir, M.; Horwat, D.; Lenormand, P.; Ansart, F.; Bassat, J.M.; Viricelle, J.P. Enhancing oxygen reduction reaction of YSZ/La2NiO4+δ using an ultrathin La2NiO4+δ interfacial layer. J. Alloys Compd. 2018, 746, 413–420. [Google Scholar] [CrossRef] [Green Version]
  30. Garbayo, I.; Esposito, V.; Sanna, S.; Morata, A.; Pla, D.; Fonseca, L.; Sabaté, N.; Tarancón, A. Porous La0.6Sr0.4CoO3−δ thin film cathodes for large area micro solid oxide fuel cell power generators. J. Power Source 2014, 248, 1042–1049. [Google Scholar] [CrossRef] [Green Version]
  31. Boukamp, B.A.; Hildenbrand, N.; Nammensma, P.; Blank, D.H. The impedance of thin dense oxide cathodes. Solid State Ion. 2011, 192, 404–408. [Google Scholar] [CrossRef]
Figure 1. Hysteresis loop of the different targets under Ar flow of 200 sccm: (a) Applied 2.5 A on La target, (b) Applied 0.5 A on Ni.
Coatings 13 01113 g001
Figure 2. SEM cross-sections of La–Ni–O coatings deposited with 200 sccm Ar and (a) 1 ccm O2, (b) 6 sccm O2 with La target operating in the compound mode, (c) 12 sccm O2. Optical transmission vs. wavelength of those three coatings (d).
Coatings 13 01113 g002
Figure 3. XRD measurements of La–Ni–O coatings with the La/Ni atomic ratio of 2.04 as function of annealing temperature for 2 h.
Coatings 13 01113 g003
Figure 4. SEM-BED top views (ah) of La–Ni–O coatings with the La/Ni atomic ratio of 2.04 deposited on alumina plates after annealing in air at different temperatures for 2 h: (a) as deposited, (b) 500 °C, (c) 600 °C, (d) 700 °C, (e) 800 °C, (f) 900 °C, (g) 1000 °C, and (h) 1100 °C.
Coatings 13 01113 g004
Figure 5. SEM-BED cross-sections (ah) of of La–Ni–O coatings with the La/Ni atomic ratio of 2.04 deposited on alumina plates after annealing in air at different temperatures for 2 h: (a) as deposited, (b) 500 °C, (c) 600 °C, (d) 700 °C, (e) 800 °C, (f) 900 °C, (g) 1000 °C, and (h) 1100 °C.
Coatings 13 01113 g005
Figure 6. Thickness of the La–Ni–O coatings with the La/Ni atomic ratio of 2.04 deposited on alumina plate as a function of annealing temperature.
Coatings 13 01113 g006
Figure 7. Pore size distribution of La–Ni–O coatings with La/Ni atomic ratio of 2.04: (a) top surface of after annealing at 1000 °C, (b) cross-section of after annealing at 1000 °C, (c) top surface of after annealing at 1100 °C, (d) cross-section of after annealing at 1100 °C.
Coatings 13 01113 g007
Figure 8. SEM-BED views and pore size distribution of La2NiO4 coatings after annealing in air at 1000 °C for 2 h followed by annealing at 750 °C in air for 120 h: SEM-BED view of top surface (a) and cross-section (c) and pore size distribution of top surface (b) and cross-section (d).
Coatings 13 01113 g008
Figure 9. XRD measurements of La2NiO4 coatings after annealing at 1000 °C in air for 2 h followed by annealing at 750 °C in air for 120 h.
Coatings 13 01113 g009
Figure 10. The conductivity of La–Ni–O coatings with La/Ni atomic ratio of 2.04 deposited on alumina substrate as function of annealing temperature for 2 h measured at room temperature.
Coatings 13 01113 g010
Figure 11. Nyquist plots of LNO symmetrical cells deposited on YSZ electrolyte at 750 °C: LNO−1 after annealing at 900 °C for 2 h, LNO−2 after annealing at 1000 °C for 2 h, LNO−3 after annealing at 1100 °C for 2 h.
Coatings 13 01113 g011
Figure 12. The Arrhenius curves of polarization resistance (Rpol) for LNO−1, LNO−2, and LNO−3 from 700 °C to 900 °C.
Coatings 13 01113 g012
Figure 13. The Arrhenius curves of polarization resistance (Rpol) in the medium and low frequency range of LNO−1, LNO−2, and LNO−3 from 700 °C to 900 °C.
Coatings 13 01113 g013
Figure 14. The Arrhenius curves of the equivalent capacities calculated from the fitting values in the medium and low frequency range of LNO−1, LNO−2, and LNO−3 from 700 °C to 900 °C.
Coatings 13 01113 g014
Table 1. Sputtering parameters for deposition of La–Ni–O coatings with the La/Ni atomic ratio of 2.04.
ParametersLa TargetNi Target
Ar flow rate (sccm)200200
O2 flow rate (sccm)66
Total pressure (Pa)2.42.4
Drawing distance (mm)7070
Power (W)500102
Frequency (kHz)5050
Toff (μs)55
Table 2. Average grain size of samples subjected to different annealing treatments.
Annealing TreatmentAverage Grain Size (nm)
As deposited1.9
500 °C for 2 h3.7
600 °C for 2 h5.1
700 °C for 2 h27.0
800 °C for 2 h32.0
900 °C for 2 h36.2
1000 °C for 2 h42.9
1100 °C for 2 h71.2
1000 °C 2 h–750 °C 120 h47.6
Table 3. The activation anergy of LNO−1, LNO−2, and LNO−3.
SamplesEa Calculated from Rpol (eV)
LNO−10.67
LNO−20.44
LNO−30.89
LNO 1.47 [25], 1.2 [26], 1.0 [28], 0.4 [9]
Disclaimer/Publisher’s Note: The statements, opinions and data contained in all publications are solely those of the individual author(s) and contributor(s) and not of MDPI and/or the editor(s). MDPI and/or the editor(s) disclaim responsibility for any injury to people or property resulting from any ideas, methods, instructions or products referred to in the content.

