Article

Applicability Analysis of Nickel Steel Plate Friction Coefficient Model Based on Fractal Theory

1
College of Nuclear Science and Technology, Naval University of Engineering, Wuhan 430030, China
2
College of Weaponry Engineering, Naval University of Engineering, Wuhan 430030, China
3
PLA 91515 Unit, Sanya 572016, China
*
Author to whom correspondence should be addressed.
Coatings 2023, 13(6), 1096; https://doi.org/10.3390/coatings13061096
Submission received: 19 April 2023 / Revised: 10 May 2023 / Accepted: 12 June 2023 / Published: 13 June 2023
(This article belongs to the Special Issue Friction and Wear Behaviors in Mechanical Engineering)

Abstract

:
In the field of aerospace, weapons and other complex assembly, there are more than 50 factors affecting the performance degradation of joint structures, among which the friction coefficient is the main factor. Nickel steel is widely used in large complex equipment due to its advantages of high strength. Therefore, this paper first establishes a theoretical model of friction coefficient based on fractal theory. Secondly, the friction coefficient experiment was carried out to measure the friction coefficient of nickel steel plates with different roughness under different normal loads. Finally, the experimental results are compared with the theoretical results, and the accuracy and error analysis of the model is carried out. The results show that the friction coefficient increases with the increase in roughness. When the normal load is greater than 50 kg, the friction coefficient gradually tends to be stable. The error of identification results of correction factor a was all within 5%. The error between theoretical model prediction and experimental data is 6%–15%, which indicates that the calculation of the friction coefficient has high accuracy. The results of this study can provide data and theoretical support for the friction coefficient evaluation of nickel steel plate joint structures, and contribute to the health detection and reliability evaluation of nickel steel plate joint structures.

1. Introduction

Mechanical structures are usually assembled and connected on the basis of bonding surfaces, which are subject to friction phenomena under external loads, resulting in energy dissipation, surface wear and changes in mechanical properties, which in turn affect the performance stability of the connected structure. Therefore, the friction phenomenon of the joint surface has an important effect on the performance of the mechanical structure. As an important parameter characterizing friction phenomenon, the friction coefficient has important research significance. Many scholars have carried out a lot of research on the friction coefficient.
In order to study solid friction without lubrication, Tabor [1] proposed a formula for calculating the friction coefficient of rough surfaces without lubrication. In addition, it is pointed out that in the calculation of the friction coefficient of a rough surface, the external normal force is expressed in the microscopic domain as the combined force of the actual contact load and the molecular force at the microscopic bonding point. Zhang et al. [2] studied the adhesion mechanism of high-speed wheel–rail and carried out adhesion experiments with axle weight and speed as variables for three working conditions of wheel–rail surface states with no lubrication, water lubrication and oil lubrication, and proposed an expression for the friction coefficient between wheel–rail based on the experimental results. According to Shen et al. [3], the friction coefficient of 7050 aluminum alloy was determined using the circular upsetting method, and the influence of deformation speed, temperature and lubricant on the friction coefficient was discussed.
Fouvry et al. [4] studied the sliding standard problem under ball-surface contact. The evolution process of local tangential force near the contact point in the sphere–surface contact is analyzed systematically. A model for calculating the local friction coefficient of the outer sliding ring with partial slip is proposed and compared with the experimental results. Finally, it is found that the mixed slip state is related to the dissipated energy in the contact process. The dissipated energy indirectly interacts with the diffusion in the viscous region, which increases the friction coefficient in the annular slip region. Ali et al. [5] found that the wear of the brake disc has a great impact on the braking performance and braking noise. By coating the wear-resistant material tungsten carbide cobalt on the surface of the brake disc, lower braking noise and higher braking performance can be obtained. Zhao et al. [6] prepared titanium carbide composite coating on the base surface of No. 45 steel. The friction and wear testing machine was used to detect the coating. Based on the designed static friction force measuring device, Peng et al. [7] studied the static friction force of aluminum plates, glass plates and other materials. The experimental results show that the physical shape of the friction pair has a great influence on the friction coefficient, and it is not possible to simply use the friction coefficient between materials to replace the friction coefficient between particulate matter and plate. Amir et al. [8] studied the influence of factors such as processor type and finishing treatment on the friction coefficient between yarn and metal and focused on testing the friction coefficient between 36 kinds of spinning samples and metal. Chen [9] analyzed the main factors affecting the friction coefficient of the wheel–rail friction pair at different temperatures. The research shows that the speed has a greater influence on the friction coefficient and the load has a smaller influence on the friction coefficient in the early sliding stage. Yan et al. [10] studied the friction coefficient of the friction cone in the synchronizer. The relationship between the friction coefficient and the displacement mass is analyzed and the friction coefficient of the friction cone in the synchronizer is controlled near the expected value of 0.08. Liqun et al. [11] studied the friction coefficient of different kinds of magnesium alloys by using a compression ring experiment. The results show that the friction coefficient of magnesium alloy is usually between 0.35 and 0.4 under dry friction, 0.10 to 0.18 under water lubrication, and 0.10 to 0.17 under molybdenum lubrication.
According to Silberberg [12], the physical quantities of hydraulic permeability and reflection coefficient, both of which describe the thermodynamic aspects of the fluid in the process of interest through the coefficient of friction, were investigated and a simplified theoretical model of hydraulic permeability was developed based on the hydraulic permeability and reflection coefficient. Davis et al. [13] studied the friction coefficient between a rolling cylindrical element and a deformable flat plate, treating the rolling cylindrical original as a rigid body and a plane that deforms plastically during rolling friction, proposing a friction coefficient model based on the rolling angle, and proposing a corresponding theoretical model based on the experimental results. In addition to the above studies, scholars have also carried out a large number of studies on the friction coefficient of research objects that do not pass under different work controls [14,15,16,17,18,19].
The friction coefficient is indeed fixed in the case of material processing technology and surface treatment technology. However, the main purpose of this paper is to explore the influencing factors and the physical mechanism behind the friction coefficient and verify these factors and physical mechanisms through experiments. Although the friction coefficient test is relatively common, the friction pair we choose is two nickel steel plates, both of which are elastic–plastic plates. Nickel steel has important properties such as formability, weldability and ductility, and has good corrosion resistance. As an important material, nickel steel is widely used in the connection structure of complex assembly fields such as aerospace and large equipment. At present, there are few research studies on the friction coefficient of nickel steel material at home and abroad. Therefore, this paper studies the variation rule of the friction coefficient between nickel steel plates based on the plate structure, deduces and establishes the theoretical model of the friction coefficient between nickel steel plates, and has the basic ability to predict the friction coefficient between nickel steel plates. The correction factor of the friction coefficient model between nickel steel plates needs to be identified by friction experiment. Based on the surface roughness and load, the sliding friction experiment between nickel steel plates was carried out, and the curve of friction was recorded in real time. The friction coefficients under different normal loads and surface roughness degrees were obtained through data processing and fitting. The experimental data were compared with the results of the theoretical model of friction coefficient, so as to verify the accuracy of the fractal theory of the friction coefficient model between nickel steel plates. The research results of this paper can be applied to the preload parameter setting of bolted connection structures in large complex equipment, aerospace and other fields, and can provide a theoretical basis for the study of tribological phenomena between nickel steel plates, as well as theoretical support for the study of interface wear, stiffness degradation, stress relaxation of connecting flanges in large complex equipment and the study of preload setting of bolted connection structures.

2. Methods

2.1. Theoretical Model of Friction Coefficient Based on Fractal Theory

The fractal contact model assumes that the contour curve of a rough surface has fractal characteristics on a transverse section and all fractal contact models are based on this assumption. The fractal contact model has a wide range of applications and few constraints on rough surfaces. Moreover, fractal parameters can be associated with macroscopic physical parameters such as surface roughness, so it has become the most important method to study the microscopic contact of rough surfaces. Therefore, the friction coefficient between nickel steel plates is studied based on fractal theory. The friction pair consists of two nickel steel plates, both of which are elastic–plastic plates. For the convenience of the study, the friction pair is simplified as the contact friction between a rigid plate and an elastic–plastic nickel steel plate. At the initial contact, the tip of the micro-convex body first contacts the rigid plane, the radius of curvature of the tip is small, the stress is relatively concentrated, and pure plastic deformation occurs. With the continuous downward pressure of the plane, the radius of curvature at the top of the micro-convex body keeps increasing due to deformation, mutual fusion and other reasons, and the characteristics of elastic behavior are constantly enhanced. The contact interface is in the mixed contact state of elastic–plastic, and the transition point between the pure plastic contact state and the mixed contact state of elastic–plastic is called the elastic–plastic critical point.
In order to describe the variation pattern of the coefficient of friction between nickel steel plates, a theoretical model of the coefficient of friction is required. This paper is based on classical friction theory [20] as in Equation (1), a model of the friction coefficient between nickel steel flat plates is established.
μ = τ S P
where μ is the coefficient of friction, τ is the shear strength, S is the actual contact area and P is the normal load.
(1)
Theoretical model for the purely plastic contact state
When s m s c , the micro-convex body is in pure plastic contact, at which point the actual contact area and normal load between the flat plates can be expressed as
S = S p = ( D 1 3 D ) s m
P s u m = N s u m s 1 s m P p ( s i ) f ( s i ) d s i = a ( D 1 3 D ) H s m
where H is the material hardness, D is the fractal dimension, s is the truncated area of the micro-convex body, s i is the truncated area of the serial number i , s m is the maximum cut-off area, s c is the critical cut-off area, a is the correction factor, P p is the ideal elastic contact load, P s u m is the total load of the slightly convex body and f ( s i ) is the probability density function of the truncated area of the slightly convex body.
Combined (1), (2) and (3), the model for the coefficient of friction between flat plates in a purely plastic contact state can be obtained as
μ = τ S P s u m = τ ( D 1 D 3 ) s m a H ( D 1 D 3 ) s m = τ a H
(2)
Theoretical model of elastic–plastic contact state
When s m > s c , the elastic and plastic contact of the micro-convex body exists simultaneously, at which point the actual contact area and the normal load between the flat plates can be expressed as
S = D 1 6 2 D [ 1 + ( s c s m ) ( 3 D ) / 2 ] s m
P s u m = D 1 3 D a H ( s c s m ) ( 3 D ) / 2 s m + 2 D 2 π E * G D 2 ( D 1 ) 3 ( 5 2 D ) s m D 1 2 ( s m 5 2 D 2 s c 5 2 D 2 ) = p ( a , s m )
where E * is the equivalent Young’s modulus and G is the fractal scale parameter.
By (1), (5) and (6), the model for the coefficient of friction between flat plates in the elastic–plastic contact state can be obtained as
μ = τ p ( a , s m ) D 1 6 2 D [ 1 + ( s c s m ) ( 3 D ) / 2 ] s m
Based on the density function of the truncated area of the micro-convex body, the critical truncated area of the micro-convex body and the normal force model based on the stress continuity, the friction coefficient model between plates with the maximum truncated area of the micro-convex body, and the fractal dimension and the correction factor as parameters can be determined with the expression [21]:
μ = { τ a H I f   s m s c τ p ( a , s m ) D 1 6 2 D [ 1 + ( s c s m ) ( 3 D ) / 2 ] s m e l s e
Based on the material parameters of nickel steel, the friction coefficient model is identified and a friction coefficient model for nickel steel plates is obtained. The material parameters of the nickel steel are shown in Table 1, with the units of the reference physical quantities being international standard units [22]. The units of the reference physical quantities are international standard units.
Substituting the nickel steel material parameters in Table 1 into Equation (8), the theoretical model for the coefficient of friction between nickel steel plates is obtained as
μ = { 2.0992 a I f   s m s c τ p ( a , s m ) D 1 6 2 D [ 1 + ( 1.67   ×   10 6 s m ) ( 3 D ) / 2 ] s m e l s e
The friction coefficient can be measured experimentally, and the correction factor a can be directly obtained according to Equation (4), but the condition for its establishment is s m s c , s m and it is an unknown parameter that cannot be measured. Therefore, it is necessary to judge whether the friction pair is in a pure plastic contact state according to the experimental results. According to the experimental data obtained in the pure plastic contact state, the least square method was used to fit the correction factor a. The criteria for judging the contact state are:
(1)
Constant friction coefficient
As can be seen from Equation (4), the friction coefficient in the pure plastic contact state has nothing to do with normal load and surface roughness, but is only related to the properties of materials such as shear strength and hardness. Therefore, the friction coefficient in this state presents a constant character.
(2)
Pure plastic contact occurs under small normal load conditions
According to the above analysis, in the friction coefficient model based on fractal theory, plastic deformation appears at the initial loading stage. With the gradual increase of load, the radius of curvature at the top of the micro-convex body becomes larger and gradually shows elastic characteristics. Therefore, in the friction experiment, the normal load gradually increases from zero, and the contact state changes from pure plastic contact to an elastoplastic contact state.
Through the above two conditions, it is determined that the friction experiment is in a pure plastic contact state, and the value of correction factor a can be obtained by substituting the friction coefficient and normal force data measured in the experiment into Formula (4).

2.2. Friction Test Design of Nickel Steel Plate

2.2.1. Experimental Apparatus

The experimental device mainly consists of a force-bearing table, load cell, drive system and other components. The force-bearing table is the main force-bearing part of the friction experiment, all flat plates, specimens and load-loading devices are placed in this area; the load cell is mainly composed of a GY-SA dual-use S-type load cell and an external computer, mainly to achieve real-time measurement of friction in the experiment; the drive system consists of two slow-speed motors and pulley sets to provide a stable driving force, the drive system motor with a winch. The winch wire is connected to the slider after steering by the pulley, and the experimental setup and principle are shown. During the experiment, the motors rotate at a constant speed and the driving force is transferred to the slider, driving the slider to slide at a constant speed of 0.1 m/s. The schematic diagram of its principle and the physical diagram of the device are shown in Figure 1.

2.2.2. Experimental Key Measurement Device

(1)
Nickel steel plate roughness measuring instrument
The surface roughness measuring instrument used in this experiment is SJ-210 roughness measuring instrument purchased from China Changzhou Sanfeng Instrument Technology Co., LTD (Changzhou, China). During the experiment, the sampling length was 2.5 mm and the number of sampling segments was ×3 L.
In the experiment, the roughness measurement was completed by the SJ-210 roughness measuring instrument, which was verified to ensure that the roughness error of the specimen was within the range of ±10%; the technical specification table is shown in Table 2.
(2)
Force sensor
The mechanical sensor used in the experiment is GY-SA pressure tension dual purpose S-type weighing sensor produced by China Guangya Machinery Technology Company (Zhejiang, China). Its form and technical specifications are shown in Table 3. The dead weight of the sensor is 1.8 kg, which is mainly used for measuring axial pressure and tension under large loads. The S-shaped body of the sensor is divided into two measuring arms with threaded connecting holes, which are used to connect the sensor with the measured object during measurement.
In the experiment, the GY-SA mechanical sensor was used to measure the friction in the process of friction. Based on the new four-channel guide rail test platform, the change data of friction could be measured and recorded in real time, so as to further control the experimental process and optimize the experimental scheme.

2.2.3. Surface Roughness Check

Before the friction experiment, the surface roughness of the plate and slider are checked to meet the requirements of roughness. The roughness checking method is: 9 points are selected for the plate, 5 points are selected for the slider to test its roughness, and then the average value is taken. If the error is within 10% of the standard value, the sample is qualified. The specific location of the point is shown in Figure 2.
The surface roughness test results of different roughness plate and slide specimens are shown in Table 4. The roughness test results of all specimens meet the standard of error within 10%, so the nominal roughness can be tested as the actual roughness.
The microscopic surface contour of some plates and sliders is shown in Figure 3, It can be seen that the microscopic contours of rough surfaces have fractal characteristics and are suitable for the friction coefficient model based on fractal theory. Model parameters can be identified through experimental data, and the theoretical model of the friction coefficient between nickel steel plates can be established and verified.

3. Results and Discussion

3.1. Analysis of Experimental Results

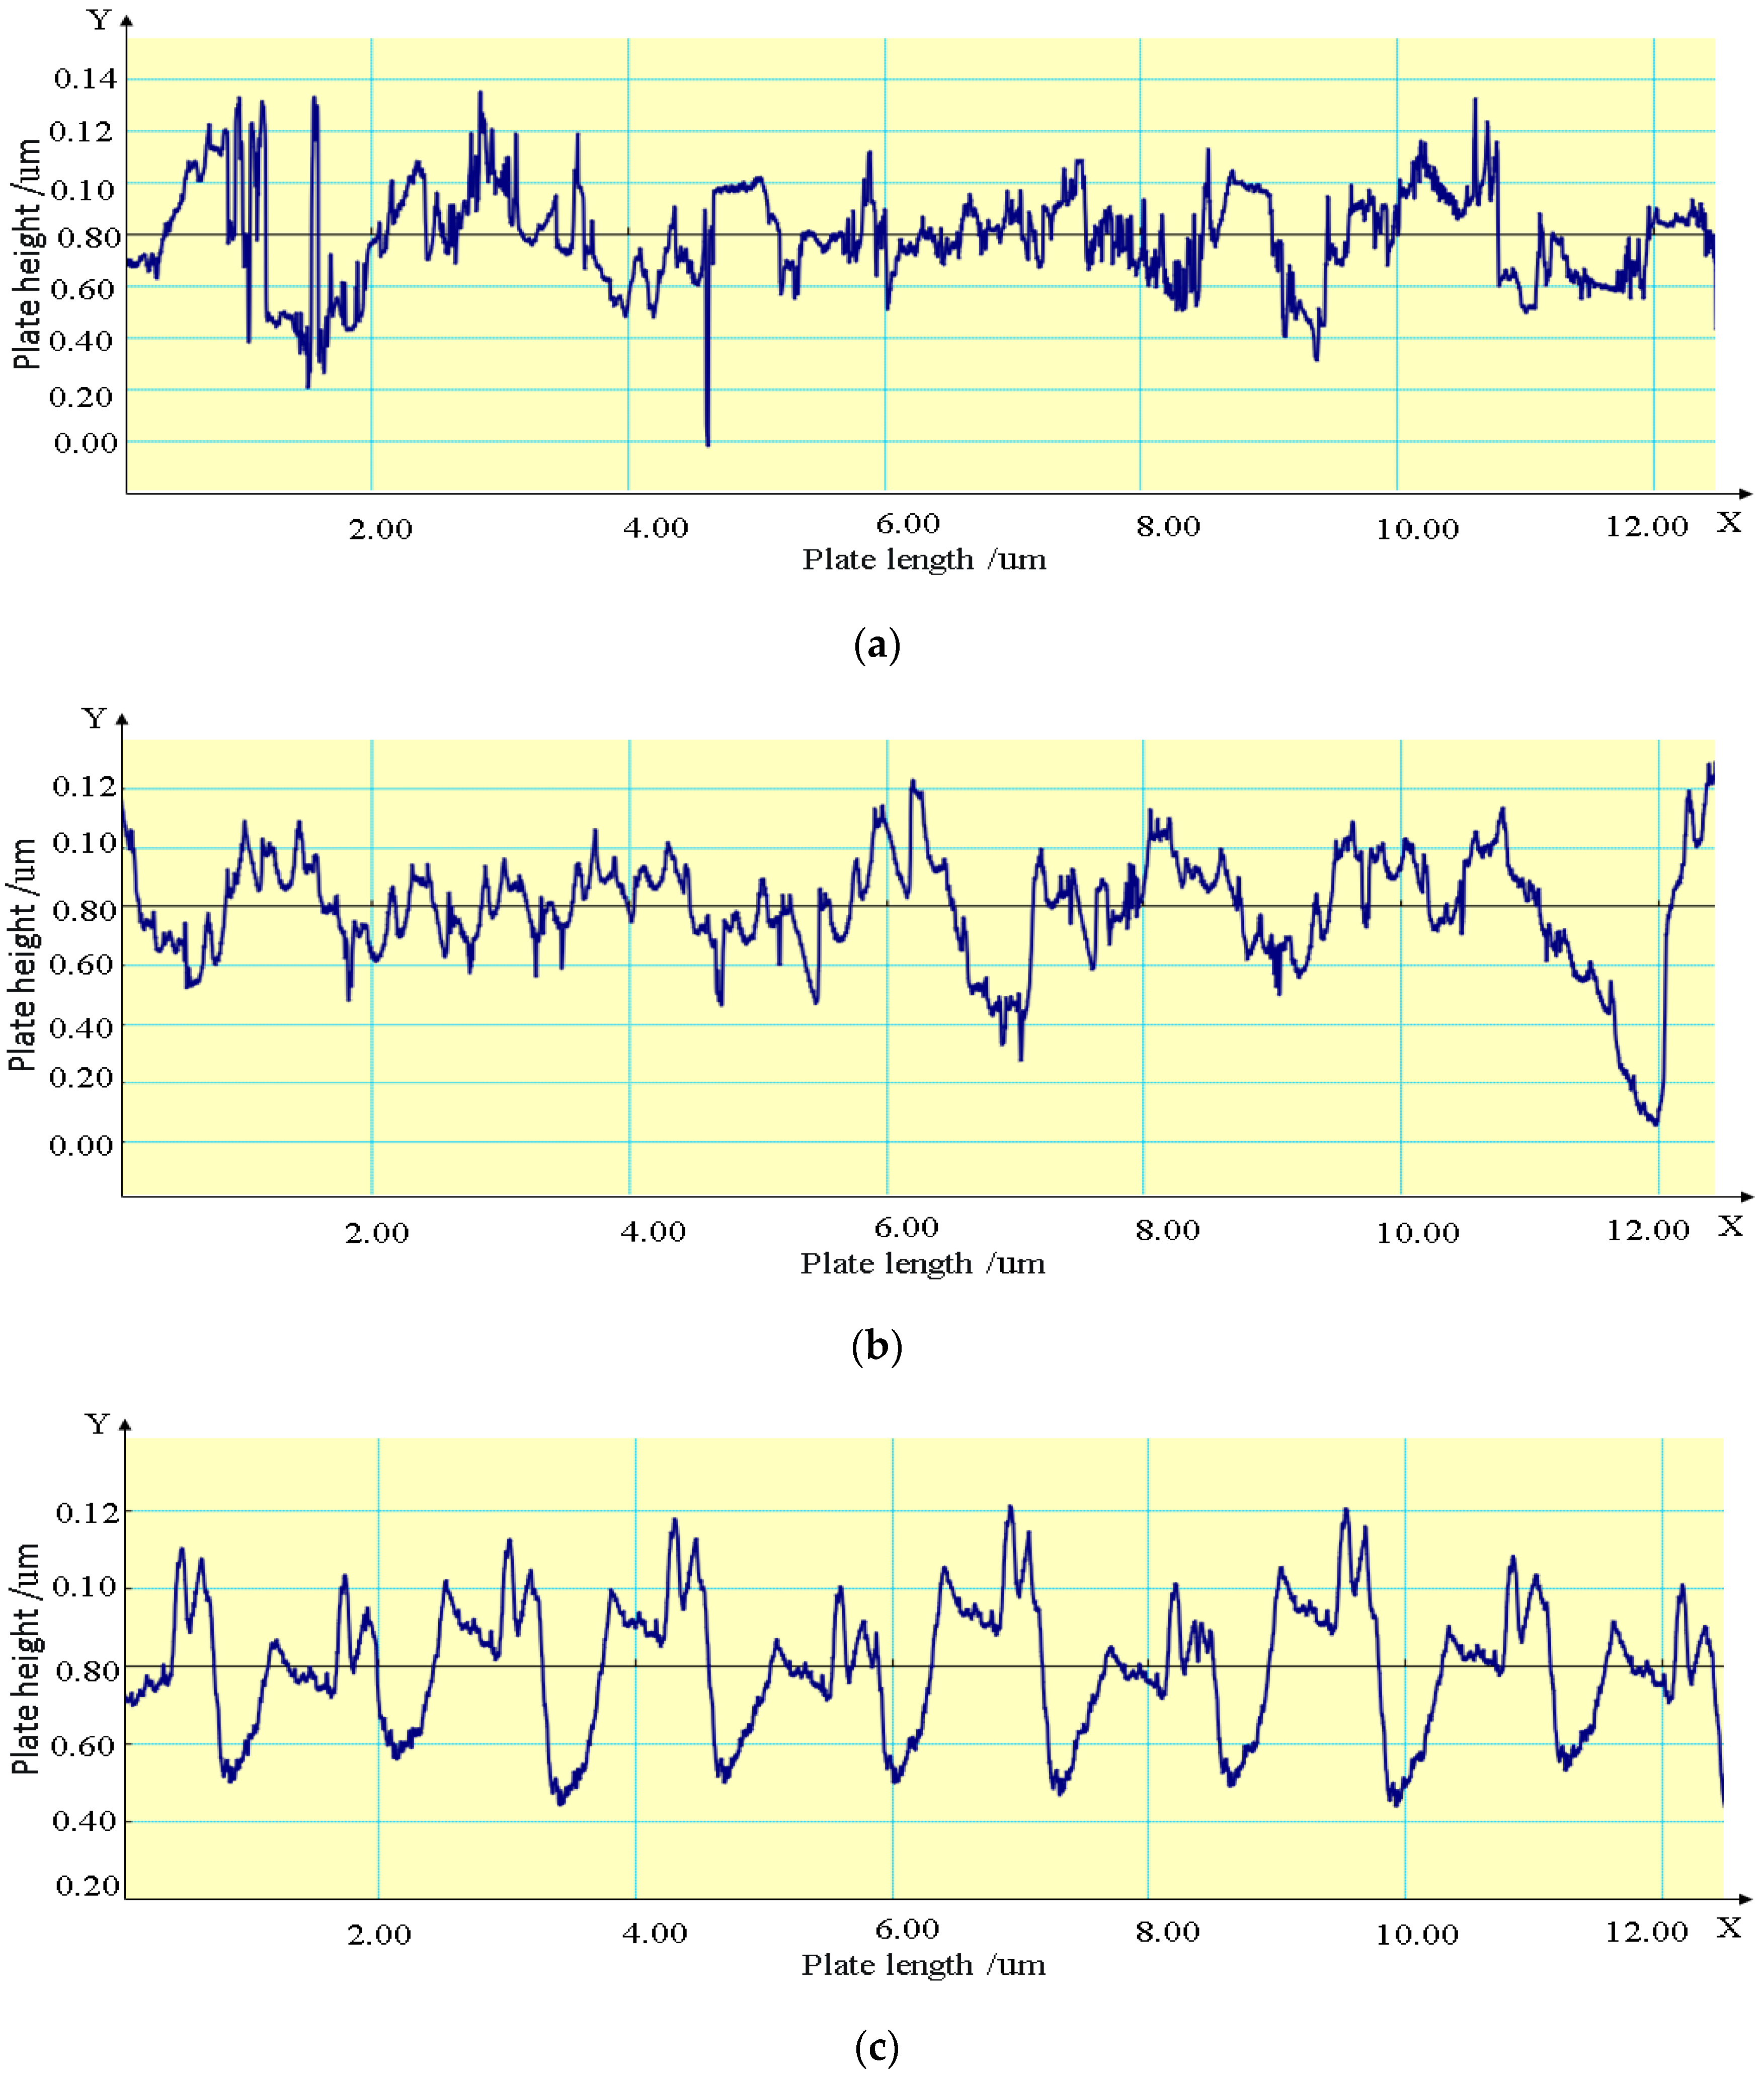
During the experiments, weights were used to load the normal loads, where the slider weighed 5 kg and the weights were 10 kg, 20 kg, 28.4 kg, 42 kg and 43 kg, and so on. Thus, in the friction experiments, the loading of the normal load is carried out by a combination of different masses of weights. The test piece during the experiments consists of a flat plate and a slider. The flat plate is used as the friction substrate and has dimensions of 200 × 680 mm. The slider is shaped as a square flat plate, and in order to facilitate the loading of the load during the experiment, the slider has a larger size of 200 × 200 mm and the thickness of both the slider and the flat plate is 14 mm. The initial surface roughness of the friction surface of the flat plate and the slider is controlled by the surface machining process with a surface roughness Ra of 12.5, 6.3, 3.2, 1.6 and 0.8. Roughness error is less than 10%. Sliders and plates, both made of nickel steel.
The sliding speed of the slider is controlled at 0.1 m/s uniform motion. The normal load was loaded sequentially from small to large, with each roughness as a large group, distinguished by A, B, C, D and E. Each load within the large group was a small group distinguished by numbers, and each group of experiments was carried out twice to reduce the influence of experimental chance, and the friction coefficient measurement results of each group of experiments were recorded. The initial normal load was 5 kg as the slider weighed 5 kg. The normal load loading and experimental group numbers are shown in Table 5.
When measuring, each set of data was measured twice, so there were a total of 5 × 13 × 2 = 130 sets of data. When each set of experiments was implemented, the measurement curve of the friction force was not an ideal straight line and fluctuated to a certain extent due to a series of reasons, such as the preload of the experimental wire, the self-weight of the equipment itself, the elasticity of the wire and the static friction force.
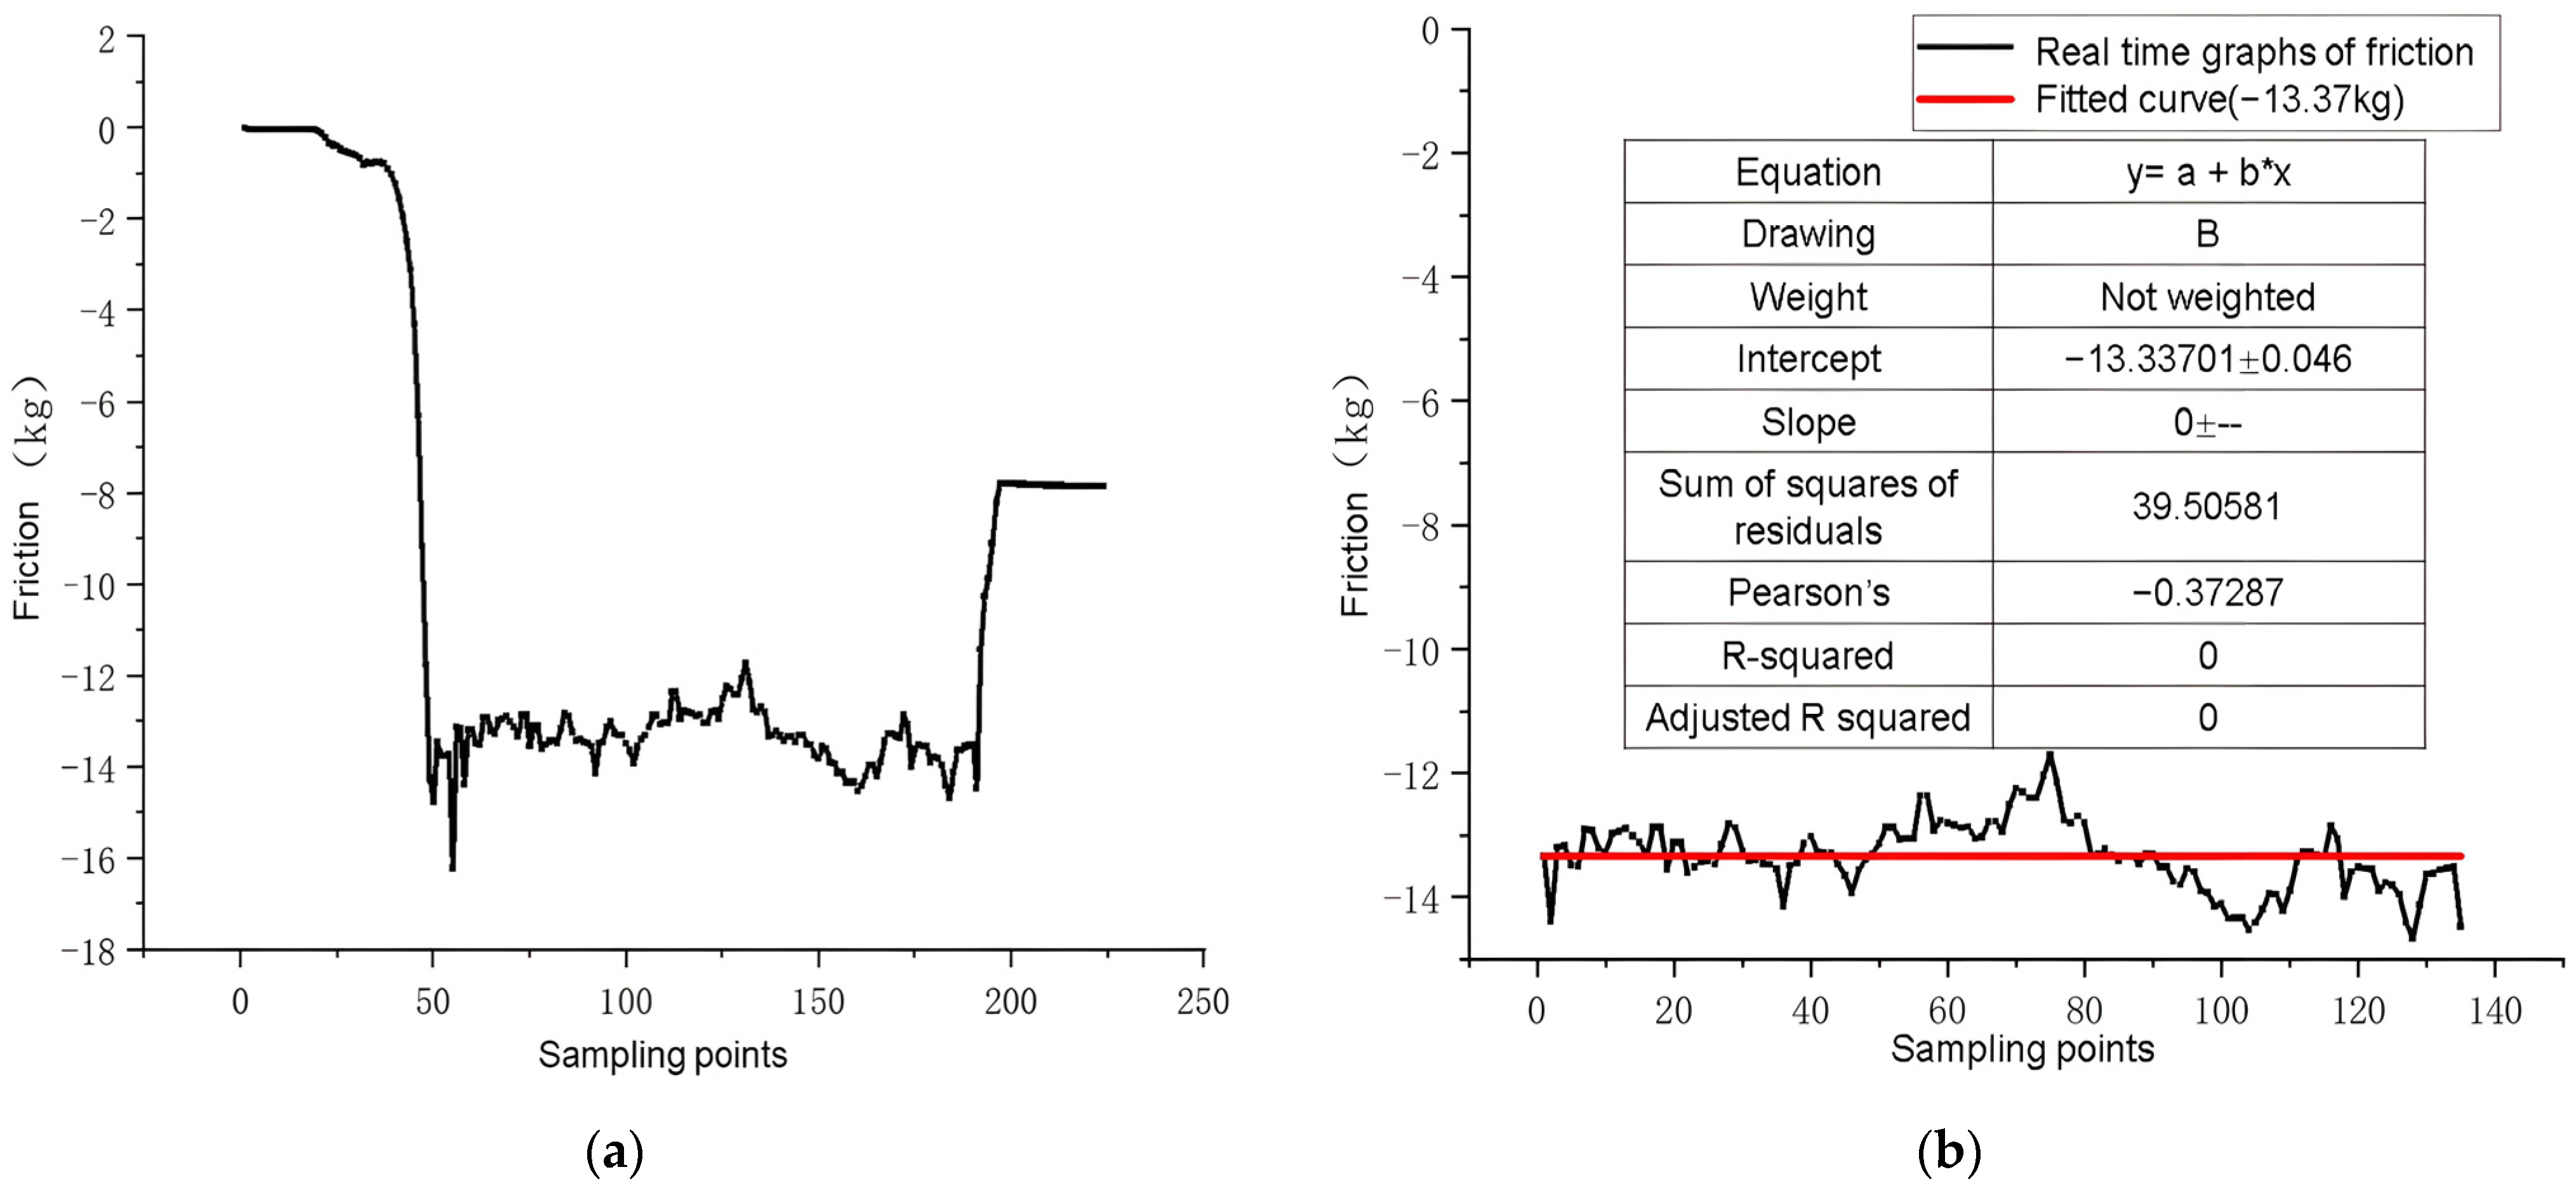
The GY-SA compression and tension S-type weighing sensor and its supporting software used in this experiment all use kilogram-force, and the positive and negative sign of the friction value represents the direction of the force. Taking the experimental data of group B7 as an example, Figure 4a is a real-time graph of the friction force for the first experiment in group B7. It can be seen that before the experiment started, the system was at rest and the friction force was 0; then, the slow motor started and began to apply the driving force, the friction force increased sharply at this time and then reached a great value. At this time, the slider entered the state of uniform motion from rest, the great value of the friction force was the static friction force between the slider and the plate; then, the slider slid on the plate at a uniform speed and the friction force remained basically stable. Finally, when the drive motor stopped working, the friction force appeared as large fluctuations.
The GY-SA dual-purpose S load cell measures 8 sets of data per second, so each set of friction has at least 72 data points. The first experimental data from group B7, where the data fluctuates, was used as an example, as shown in Figure 4b, to fit the friction data for each group of experiments by least squares. A stable friction measurement was required for each group of experiments, so the slope of the fit was taken to be 0. The slope of the linear fit was the required friction.
After data processing and fitting, the final friction data for the two experiments were obtained as shown in Table 6 and Table 7.
When the roughness of the plate is constant, the friction force will increase with the increase of the load, which is a common phenomenon in friction experiments. However, when the load is constant, the friction force does not increase with the increase of the coarse excess. When Ra is 0.8–1.6, the friction force increases, but when Ra is 1.6–3.2, the friction force will decrease, and then the friction force returns to the normal change. In order to explore the factors affecting the change of friction force, this paper will continue to study the change of friction coefficient.
According to Coulomb’s theory of friction, the coefficient of friction for each group of experiments was obtained by dividing the friction force (kg) by the load (kg), avoiding errors due to gravitational acceleration measurements; Figure 5 shows the relationship between friction coefficient and normal load.
When the load is determined, as the roughness increases, the friction coefficient first increases at Ra=0.8–1.6, then decreases at Ra=1.6–3.2, and, finally, Ra gradually increases to 3.2–12.5. There are two extreme points in the curve, and the curve of friction coefficient generally presents an increasing trend [23].
In the case that the roughness is determined, when the load is greater than 50 kg, the friction coefficient fluctuates slightly with the increase of the load but generally approaches the stable value, which is consistent with the research results of Wei et al. [24]. This is more obvious in soft materials prone to wear. In the literature [25,26], factors affecting the friction coefficient of MoS2 thin film have been studied. The results show that in the same sliding velocity, the larger the normal phase load is, the smaller the friction coefficient will be. Specifically, the greater the normal load, the more serious the wear of the friction pair, the smaller the maximum truncation area Sm, and the smaller the friction coefficient. In this paper, the friction pair is a nickel steel plate with high strength, and the change of Sm is small, so the change of friction coefficient is small. When the load is less than 50 kg, the friction coefficient fluctuates greatly with the change in normal load, which may be related to the measurement accuracy of the instrument under a small load. Leopold et al. [27] also reached a similar conclusion in their study. The maximum relative error is shown in Table 8.
In general, roughness is the main factor affecting the friction coefficient of nickel steel plates. A large normal load has little influence on the friction coefficient, while a small normal load has a great influence on the friction coefficient. In this paper, the data of small load conditions are discarded, and the correction factor a is used for the next analysis of large load conditions.

3.2. Modified Factor Fitting

According to the above analysis, the least squares method was used to identify the correction factor a. The results of the identification of the correction factor a are shown in Table 9. The correction factor within the roughness of Ra = 08–1.6 and Ra = 3.2–12.5 is negatively correlated with the surface roughness. The segmentation with Ra = 3.2 May be caused by the fact that the surface roughness processing of the sample is processed by grinding machine in Ra=0.8–1.6 and milling machine in Ra = 3.2–12.5. The surface processing technology has a great influence on the friction coefficient. For each group of roughness in the two experiments, the correction factor a basically tends to be the same, and except for the surface roughness of the Ra = 3.2 group, the error of the other groups is within 5%.
According to the results of the correction factor identification, the friction coefficient model can be obtained and compared with the experimental data; the maximum error is shown in Table 10. The error of the friction coefficient results of the first experiment and the second experiment is similar, mostly less than 10%, and there is a relatively large error in the Ra = 12.5 first experimental group, which is different from the second experimental group with the same roughness. Considering the magnitude of the error in the other groups of experiments, the Ra = 12.5 first experimental group may be caused by accidental factors such as unstable load loading, and the Ra = 12 is not adopted in the experiments 12.5 first group data.
Therefore, the experimental deviation from the theoretical model is ±6%–15% and the theoretical model of the friction coefficient of nickel steel flat plates is applicable for load conditions greater than 50 kg.
In general, after the elastoplastic critical point, the changing trend of the friction coefficient is consistent with the model prediction. Before and at the elastoplastic critical point, the theoretical model has a slight deviation from the experimental results, but the relative error is still acceptable. The error of most data points between the experimental results and the theoretical model is 6%–15%, which proves that the theoretical model is accurate in predicting the changing trend of the friction coefficient between nickel steel plates. The model of the friction coefficient between nickel steel plates based on a fractal theory proposed in this paper has high accuracy and is suitable for the prediction of the friction coefficient of nickel steel plates under loading conditions greater than 50 kg.

4. Conclusions

In this paper, the friction coefficient model between nickel steel plates is established using fractal theory, and the pure plastic deformation and elastoplastic mixed deformation at the initial contact between the sliding block and friction pair are analyzed. The friction coefficient model between plates is determined by taking the maximum truncated area, fractal dimension and correction factor as parameters, and the theoretical model of friction coefficient based on fractal theory is established. In view of the correction factor in the friction coefficient model between nickel steel plates, parameter identification should be carried out by friction experiment. Based on the surface roughness and load as the group basis, the sliding friction coefficient experiment between nickel steel plates was carried out to obtain the friction coefficient under different normal loads and surface roughness degrees. The experimental data were compared with the results of the theoretical model of friction coefficient. To verify the accuracy of the friction coefficient model between nickel steel plates based on fractal theory. Through experiment and analysis, the following conclusions can be obtained:
(1)
Under the condition that the surface roughness remains unchanged when the normal load is greater than 50 kg, it has little effect on the friction coefficient, and the friction coefficient gradually tends toward a stable value. The experimental results are in good agreement with the theoretical results. When the normal load is less than 50 kg, the maximum relative error of the friction coefficient is 16%–64%, which may be caused by the great influence of load dead weight and system error under low load conditions, so it is not suitable for the study in this paper.
(2)
Under the premise that normal load remains unchanged, roughness has a significant influence on the friction coefficient. The curve of friction coefficient shows an inflection point when Ra = 1.6, which may be due to the fact that the surface machining process has a great influence on the friction coefficient when Ra is processed by a grinding machine and Ra is processed by a milling machine when RA is processed by 3.2–12.5. In general, the friction coefficient increases with the increase of surface roughness.
(3)
Except for the Ra = 3.2 group, the error of the identification results of correction factor a was all within 5%. It shows that the calculation method of the correction factor is correct and can provide support for the establishment of a theoretical model of friction coefficient.
(4)
Taking the elastoplastic critical point as the turning point, the variation trend of the friction coefficient after the elastoplastic critical point is consistent with the model prediction, while the variation trend before the critical point is slightly different from the model prediction result, with an error of ±6%–15%, but the error is within a reasonable range.
(5)
The calculation of the friction coefficient of nickel steel plate based on fractal theory has high accuracy and can provide experimental support for the verification of the theoretical model of friction coefficient of nickel steel plate. At the same time, it can provide theoretical support for the research of interface wear, stiffness degradation, stress relaxation and preload setting of bolt-connected structures of large complex equipment and aerospace connection flanges.
In this paper, there is a large deviation between the experimental results and the theoretical results of the friction coefficient under the small load condition. In the follow-up work, it is necessary to carry out error research on the small load condition and explore the factors affecting the deviation under the small load condition. At the same time, this paper does not limit the type of metal materials, which can be extended to the plate contact condition of other materials after test verification, with stronger theory and applicability.

Author Contributions

X.L. and M.Z. conceived and designed the project. H.L. performed the experiments and analyzed the data. H.C. wrote and edited the manuscript. F.W. reviewed and edited the manuscript. All authors have read and agreed to the published version of the manuscript.

Funding

This research received no external funding.

Institutional Review Board Statement

Not applicable.

Informed Consent Statement

Not applicable.

Data Availability Statement

Data sharing does not apply to this article.

Conflicts of Interest

The authors declare that they have no conflict of interest.

References

  1. Tabor, D. Friction-The Present State of Our Understanding. J. Lubr. Technol. 1981, 103, 169–179. [Google Scholar] [CrossRef]
  2. Zhang, W.H.; Zhou, W.X.; Chen, L.Q.; Jin, X.S.; Huang, L.X. Experimental study on the adhesion mechanism of high-speed wheels and rails. J. Railw. 2000, 20–25. [Google Scholar]
  3. Shen, W.T.; Zhang, P.; Zhao, T.; Gao, L. Determination of high-temperature deformation friction coefficient of 7050 aluminum alloy using circular upsetting method. Large Cast. Forg. 2016, 5, 32–35. [Google Scholar]
  4. Fouvry, S.; Kapsa, P.; Vincent, L. Developments of fretting sliding criteria to quantify the local friction coefficient evolution under partial slip condition. Tribol. Interface Eng. Ser. 1998, 34, 161–172. [Google Scholar]
  5. Öz, A.; Gürbüz, H.; Yakut, A.K.; Sağiroğlu, S. Braking performance and noise in excessive worn brake discs coated with HVOF thermal spray process. J. Mech. Sci. Technol. 2017, 31, 535–543. [Google Scholar] [CrossRef]
  6. Zhao, Y.; Yu, T.; Guan, C.; Sun, J.; Tan, X. Microstructure and friction coefficient of ceramic (TiC, TiN and B4C) reinforced Ni-based coating by laser cladding. Ceram. Int. 2019, 45, 20824–20836. [Google Scholar] [CrossRef]
  7. Peng, Z.; Wang, L.; Jiang, Y. Measurement and analysis of static friction coefficient of particle and solid interface. J. Shandong Univ. (Sci. Ed.) 2011, 46, 42–45. [Google Scholar]
  8. Shahzad, A.; Ahmad, N.; Ali, Z.; Afzal, A.; Qadir, M.B.; Khaliq, Z.; Khan, M.Q. Statistical analysis of yarn to metal frictional coefficient of cotton spun yarn using Taguchi design of experiment. J. Strain Anal. Eng. Des. 2018, 53, 485–493. [Google Scholar] [CrossRef]
  9. Chen, K. Experimental Study on Influencing Factors of Dynamic Friction Coefficient of Wheel and Rail; Lanzhou Jiaotong University: Lanzhou, China, 2017. [Google Scholar]
  10. Yan, H.; Xu, Z.; Yuan, J.; Liu, M.; Ge, W. Friction Coefficient Compensation Control in Synchronizer Synchronization Process for Transmission. Appl. Sci. 2019, 9, 3096. [Google Scholar] [CrossRef] [Green Version]
  11. Ruan, L.Q.; Maeda, A.; Ezaki, S.; Shen, S. Evaluation of Friction Coefficient by Ring Compression of Magnesium Alloys. Adv. Mater. Res. 2015, 1064, 9–16. [Google Scholar] [CrossRef]
  12. Silberberg, A. Separation Flow in Matrices—Redefinition of Friction Coefficients. Biorheology 1983, 20, 719–727. [Google Scholar] [CrossRef] [PubMed]
  13. Davis, F.; Sackey, M.N.; Andrews, A.; Owusu-Ofori, S.P. Realistic friction coefficient model between a rolling cylindrical element and a deformable flat surface. Tribol. Int. 2017, 109, 252–257. [Google Scholar] [CrossRef]
  14. Gao, P.H.; Chen, B.Y.; Wang, W.; Jia, H.; Li, J.P.; Yang, Z.; Guo, Y.C. Simultaneous increase of friction coefficient and wear resistance through HVOF sprayed WC-(nano WC-Co). Surf. Coat. Technol. 2019, 363, 379–389. [Google Scholar] [CrossRef]
  15. Fleury, R.M.N.; Paynter, R.J.H.; Nowell, D. Estimation of the coefficient of friction in partial slip contacts between contacting nickel superalloys. Tribol. Int. 2017, 108, 156–163. [Google Scholar] [CrossRef]
  16. Han, H.N.; Kim, H.S.; Oh, K.H.; Lee, D.N. Analysis of Coefficient of Friction in Compression of Porous Metal Rings. Powder Metall. 1994, 37, 259–264. [Google Scholar] [CrossRef]
  17. Ren, S.; Zhou, C.; Ye, K.; Feng, H.; Zhang, Y. Experimental study on the friction coefficient of rolling linear guide substrates. J. Tribol. 2022, 42, 305–313. [Google Scholar]
  18. Zewang, Y.; Chun, T.; Mengling, W. Modelling and parameter identification of friction coefficient for brake pair on urban rail vehicle. Int. J. Rail Transp. 2021, 9, 368–379. [Google Scholar]
  19. Hu, J.; Sun, Q. The effect of high temperature and pressure on rock friction coefficient: A review. Int. J. Earth Sci. 2020, 109, 409–419. [Google Scholar] [CrossRef]
  20. Xiong, X.; Hua, L.; Wan, X.; Yang, C.; Xie, C.; He, D. Experiment and simulation of friction coefficient of polyoxymethylene. Ind. Lubr. Tribol. 2018, 70, 273–281. [Google Scholar] [CrossRef]
  21. Cao, H.; Zhu, M.; Li, B.; Lu, X.; Li, H.; Guo, M.; Wu, F.; Xu, Z. Theoretical Study of the Friction Coefficient in the M-B Model. Coatings 2022, 12, 1386. [Google Scholar] [CrossRef]
  22. Yu, Y.; Cui, Y.; Zhang, H.; Wang, D.; Zhong, J. A rough surface contact model for metal static seals considering substrate deformation. J. Tribol. 2023, 43, 439–445. [Google Scholar]
  23. Prajapati, D.K.; Tiwari, M. Effect of topography parameter, load, and surface roughness on friction coefficient in mixed lubrication regime. Lubr. Sci. 2019, 31, 218–228. [Google Scholar] [CrossRef]
  24. Wei, B.; Sun, K.; Wang, Y.; Fang, L.; Chen, C. Finite Element Simulation of Friction Coefficient of High Speed Dry Sliding. J. Xi’an Jiaotong Univ. 2020, 54, 82–89. [Google Scholar]
  25. Chen, S.; Wang, Y.; Li, S.; Xin, H.; Li, H. Study on Mathematical Model of Friction Coefficient and wear Amount of MoS2 thin Film. Surf. Technol. 2022, 51, 51–56+75. [Google Scholar]
  26. Cai, S.; Guo, P.; Zuo, X.; Zhang, D.; Zhi, L.; Ke, P.; Wang, A. Effects of Load on tribological behavior of MoS2/C composite Films. Chin. J. Frict. 2018, 38, 8. [Google Scholar]
  27. Hrabovský, L.; Fries, J.; Kudrna, L.; Gaszek, J. Determination of the Coefficient of Friction in a Pulley Groove by the Indirect Method. Coatings 2022, 12, 606. [Google Scholar] [CrossRef]
Figure 1. Friction apparatus. (a) Schematic diagram of device. (b) Physical drawing of device.
Coatings 13 01096 g001
Figure 2. Location of the surface roughness measurement points.
Coatings 13 01096 g002
Figure 3. Microscopic profile curves of samples corresponding to each surface roughness. (a) Scanning map of surface profile of Ra0.8 sample; (b) surface profile scanning of Ra1.6 sample; (c) scanning map of Ra3.2 sample surface profile; (d) scanning map of Ra6.3 sample surface profile; (e) scanning map of surface profile of Ra12.5 sample.
Coatings 13 01096 g003aCoatings 13 01096 g003b
Figure 4. Fitting curve for group B7 friction. (a) Real-time graph of friction for the first experiment in group B7. (b) Fitting curve for group B7 friction.
Coatings 13 01096 g004
Figure 5. Friction coefficient as a function of normal load. (a) Image of the coefficient of friction for the first experiment. (b) Image of the coefficient of friction for the second experiment.
Coatings 13 01096 g005
Table 1. Material parameters for nickel steel plates.
Equivalent Young’s Modulus E* (GPa)Shear Strength τ
(MPa)
Brinell Hardness H
(N/mm2)
230550262
Table 2. Technical specification of roughness measuring instrument.
Roughness Meter TypeSJ-210
Translation Range12.5 mm (5″)
Weight0.48 kg
Probe Travel350 μm
Measuring Range300 μm (±150 μm)
Measurement ParameterRa, Ry, Rz, Rt, Rp, Rq, Sm, S, Pc, P3z, mr
Sampling Length0.25, 0.8, 2.5 mm
Dimension62 × 156.5 × 52 mm
Table 3. Technical specification for type S technical sensor.
Model NumberGY-SA Pressure and Tension Dual Purpose S-type Weighing Sensor
Range0–500 kgMaterialAlloy Steel
Output Sensitivity2.0 ± 10% mV/VImpedance350 Ω
Hysteresis and Nonlinearity0.03% F.S.Operating Temperature Range−20–80 °C
Response Frequency10 kHzService VoltageDC 5–15 V
Table 4. Roughness check before experiment.
Nominal Roughness RaSampleMeasured Mean RoughnessErrorWhether Qualified or Not
0.8Slider0.79−1.3%Yes
Flat plate0.77−3.8%Yes
1.6Slider1.51−5.6%Yes
Flat plate1.642.5%Yes
3.2Slider3.313.4%Yes
Flat plate3.14−1.9%Yes
6.3Slider6.432.1%Yes
Flat plate6.320.3%Yes
12.5Slider13.215.7%Yes
Flat plate11.37−9.0%Yes
Table 5. Experimental grouping table.
Load (kg)Roughness Ra
0.81.63.26.312.5
5A1B1C1D1E1
15A2B2C2D2E2
25A3B3C3D3E3
35A4B4C4D4E4
45A5B5C5D5E5
50A6B6C6D6E6
70A7B7C7D7E7
92A8B8C8D8E8
112A9B9C9D9E9
135A10B10C10D10E10
155A11B11C11D11E11
183.4A12B12C12D12E12
203.4A13B13C13D13E13
Table 6. Friction data during the first experiment (unit: kg).
Load (kg)Roughness Ra
0.81.63.26.312.5
50.7731.0000.6100.9731.101
152.5523.0512.3793.3334.550
252.3105.2994.1905.1145.913
356.2778.3585.6967.3798.776
455.79510.4837.6109.51212.066
508.50312.5308.0169.25611.679
7010.99916.67811.56212.63316.993
9215.12617.87415.19717.27422.708
11219.12322.63118.49722.09633.224
13523.40227.91822.38227.13736.144
15526.18032.86125.86531.98949.584
183.429.75539.63031.23939.12147.209
203.434.90347.29536.58243.59250.502
Table 7. Friction data during the second experiment (unit: kg).
Load (kg)Roughness Ra
0.81.63.26.312.5
50.821 0.733 0.848 1.130 1.483
152.611 3.293 2.406 3.526 4.039
251.604 5.368 4.188 5.342 5.831
355.676 8.030 5.883 7.568 9.753
456.658 10.723 7.553 9.378 11.225
508.908 11.881 8.090 9.527 11.720
7010.999 16.708 11.394 13.337 16.390
9217.752 18.698 15.066 16.769 22.412
11220.244 21.850 18.641 20.009 30.243
13523.464 28.213 22.800 30.444 36.431
15525.529 32.806 25.443 33.140 37.694
183.431.033 39.089 30.717 36.314 43.972
203.433.673 44.966 35.907 42.701 52.313
Table 8. Maximum relative error of friction coefficient under small load conditions.
Surface Roughness (Ra)0.81.63.26.312.5
Maximum relative error of the first experiment45.9%20.3%27.8%16.7%27.4%
Maximum relative error of the second experiment64.0%38.2%4.7%18.7%6.4%
Table 9. Identification results of the correction factor a.
Surface Roughness (Ra)0.81.63.26.312.5
First experiment4.13.04.13.42.4
Second experiment3.93.03.23.42.6
Average4.03.03.653.42.5
Maximum relative error2.5%0.0%12.3%0.0%4.0%
Table 10. Maximum relative error in friction coefficient after fitting the curve.
Surface Roughness (Ra)0.81.63.26.312.5
First experiment14.48%7.54%15.08%14.07%20.95%
Second experiment11.64%10.38%6.24%9.96%8.39%
Disclaimer/Publisher’s Note: The statements, opinions and data contained in all publications are solely those of the individual author(s) and contributor(s) and not of MDPI and/or the editor(s). MDPI and/or the editor(s) disclaim responsibility for any injury to people or property resulting from any ideas, methods, instructions or products referred to in the content.

