Article

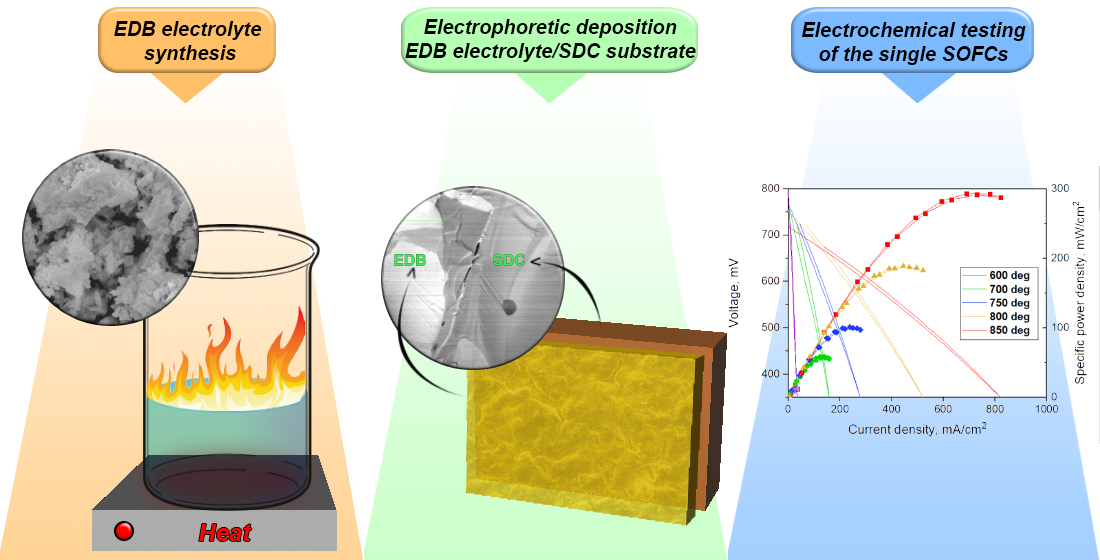
Electrophoretic Deposition and Characterization of Er-Doped Bi2O3 Cathode Barrier Coatings on Non-Conductive Ce0.8Sm0.2O1.9 Electrolyte Substrates

1
Laboratory of Complex Electrophysic Investigations, Institute of Electrophysics, Ural Branch of the Russian Academy of Sciences, 620016 Yekaterinburg, Russia
2
Department of Physical and Inorganic Chemistry, Institute of Natural Sciences and Mathematics, Ural Federal University, 620002 Yekaterinburg, Russia
3
Laboratory of Chemistry of Compounds of Rare-Earth Elements, Institute of Solid State Chemistry, Ural Branch of the Russian Academy of Sciences, 620990 Yekaterinburg, Russia
4
Laboratory of Solid Oxide Fuel Cells, Institute of High Temperature Electrochemistry, Ural Branch of the Russian Academy of Sciences, 620137 Yekaterinburg, Russia
5
Department of Environmental Economics, Institute of Economics and Management, Ural Federal University, 620002 Yekaterinburg, Russia
*
Author to whom correspondence should be addressed.
Coatings 2023, 13(6), 1053; https://doi.org/10.3390/coatings13061053
Submission received: 4 May 2023 / Revised: 25 May 2023 / Accepted: 4 June 2023 / Published: 6 June 2023
(This article belongs to the Special Issue Electrochemical Deposition: Properties and Applications)

Abstract

:
In this study, the formation of thin-film barrier coatings based on a highly conductive Bi1.60Er0.4O3 (EDB) solid electrolyte on supporting Ce0.8Sm0.2O1.9 (SDC) electrolyte substrates was implemented for the first time using electrophoretic deposition (EPD). The electrokinetic properties of EDB-based suspensions in a non-aqueous dispersion medium of isopropanol modified with small additions of polyethyleneimine (PEI, 0.26 g/L) and acetylacetone (0.15 g/L), as well as in a mixed isopropanol/acetylacetone (70/30 vol.%) medium, were studied. The dependences of the thickness of the EDB coatings on voltage and deposition time were obtained using deposition on a model Ni foil electrode. Preliminary synthesis of a conductive polypyrrole (PPy) polymer film was used to create surface conductivity on non-conductive SDC substrates. The efficiency of using a modified dispersion medium based on isopropanol to obtain a continuous EDB coating 12 μm thick, sintered at a temperature of 850 °C for 5 h, is shown. The microstructure and morphology of the surface of the EDB coating were studied. A Pt/SDC/EDB/Pt cell was used to characterize the coating’s conductivity. The EPD method is shown to be promising for the formation of barrier coatings based on doped bismuth oxide. The developed method can be used for creating cathode barrier layers in SOFC technology.

Graphical Abstract

1. Introduction

The major challenge for the commercialization of solid oxide fuel cells (SOFCs) is to reduce their operating temperature to an intermediate temperature (IT) range of 600–750 °C while maintaining the cell performance as comparable with those of high-temperature devices [1]. An increase in the ohmic resistance of an electrolyte membrane with a decrease in operating temperatures is the main problem for achieving the set goals of maintaining a high performance for IT-SOFCs. Alternative electrolytes having higher ionic conductivity than conventional stabilized zirconia have therefore become increasingly attractive for use in IT-SOFCs [2,3]. To date, most studies on electrolytes possessing satisfactory oxygen ion conductivity at decreased temperatures have been focused on oxide materials with cubic fluorite structures, such as doped CeO2 [4,5] and Bi2O3 [6,7]. Nevertheless, despite high ionic conductivity, which is very attractive for designing IT-SOFCs, these electrolytes, along with having advantages over traditional electrolytes based on zirconium dioxide, have a number of disadvantages.
CeO2-based materials are thermodynamically stable over a wide range of temperatures, in the presence of water vapor, hydrocarbons, and hazardous gases, and are chemically compatible with a wide range of oxide electrodes. One of the major problems of using CeO2 electrolytes as SOFCs’ membranes is that at low partial pressures of oxygen, partial reduction of cerium Ce4+→Ce3+ occurs, which leads to the appearance of electronic conductivity in the material and can cause an internal short circuit in the SOFC, resulting in reductions in open-circuit voltage (OCV) and cell power, as well as fuel utilization efficiency [5]. As a solution to the problem of internal circuiting in CeO2 electrolytes, the formation of blocking layers on the anode side based on yttria-stabilized zirconia or barium cerate-zirconate is used [8]. However, due to their lower ionic conductivity compared with electrolytes based on cerium dioxide, the introduction of such blocking layers may cause a decrease in the overall conductivity of the electrolyte membrane [9]. In this regard, the most promising technological decision is to use a more conductive electrolyte for the blocking layer compared with CeO2, such as stabilized Bi2O3 electrolytes [10,11].
The use of bismuth oxide as a solid electrolyte is limited by its thermodynamic instability under reducing conditions—namely, the oxide is reduced to metallic bismuth at pO2 < 10−13 atm [12]. Improving the thermodynamic stability of Bi2O3 is achieved by doping it, for example, with Er or Y, which also makes it possible to increase its ionic conductivity [13]. The formation of blocking layers of doped bismuth oxide on the cathode side of the doped ceria electrolyte is aimed at reducing the internal leakage current in the cell; on the other hand, the main ceria electrolyte prevents the reduction of bismuth oxide by eliminating its contact with the reducing atmosphere. Studies on the effect of a doped Bi2O3-based blocking layer on the performance of ceria electrolyte-supported SOFCs showed the possibility of improving the maximum power density (MPD); however, the growth in OCV was less significant than expected and achieved at a blocking layer thickness of no less than 30 μm [14,15]. The low effect on the OCV value can be explained by an insufficient density of Bi-containing blocking layers, which is strongly influenced by the deposition method [16]. The highest OCV for the cell with a Sm-doped (SDC) 1 mm thick electrolyte in the range of 1.006–0.900 V at 500–800 °C was reached by using a Bi1.6Er0.4O3 cathode barrier layer (30 μm) obtained using dip coating [16]. Among other methods used for the deposition of doped Bi2O3 coatings are screen-printing [15,17,18], magnetron sputtering [19], and pulsed laser deposition (PLD) [20].
The method of electrophoretic deposition (EPD) is promising for the formation of various barrier layers, since this method ensures rapid formation of coatings of complex chemical compositions on substrates of different shapes (flat or tubular) with a reproducible coating thickness. The advantage of the EPD method is the simplicity of its technological implementation and scalability [21,22,23]. The application of the EPD method is associated with the preparation of suspensions of powder materials of various morphologies and dispersions. The movement and deposition of powder particles in suspension on the substrate occurs under the influence of an external electric field, which is accompanied by the formation of a coating, which is subsequently subjected to drying and high-temperature sintering. To the best of our knowledge, there are a few published studies on the EPD of Bi2O3 [24,25] and BiVO4 [26,27] coatings for photo-electrochemical cells and photocatalytic applications. However, the preparation of stable suspensions based on doped Bi2O3 with following electrophoretic deposition on non-conductive dense electrolyte substrates is not a covered topic. In the present work, we have for the first time carried out the formation of a coating based on erbium-doped bismuth oxide, Bi1.6Er0.4O3 (EDB), on an SDC solid electrolyte using the EPD method. The choice of the EDB electrolyte was based on that fact that EDB is stable under the cathode conditions of SOFCs, as this material has been used not only as a cathode interlayer for ceria- or zirconia-based materials [17], but also in a nanocomposite electrolyte in a mixture with a YSZ electrolyte [28], and as a component of composite cathodes for IT-SOFCs [29,30,31,32]. The stability of the EDB-containing structures was demonstrated in durability tests from 200 to 580 h. We studied the electrokinetic properties of EDB suspensions in a non-aqueous dispersion medium, the features of the formation and sintering of EDB coatings and their morphology, and the characteristics of a Pt/SDC/EDB/Pt single cell in order to determine the effect of the EDB blocking layer on the OCV values.

2. Materials and Methods

2.1. Synthesis and Characterization of the Electrolytes

Powders of Bi1.60Er0.4O3 (EDB) were synthesized using solution combustion synthesis (SCS). Erbium oxide (Er2O3) (99.90% purity, Sigma-Aldrich, St. Louis, MI, USA), bismuth nitrate [Bi(NO3)3*5H2O] (98.00% purity, Riedel Chemicals, Seelze, Germany), glycine [C2H5NO2] (AMK Ltd., Russia), and citric acid [C6H8O7] (>98% purity, Weifang Ensign Industry Co. Ltd., Weifang, China) were used as the starting raw materials. An aqueous solution of metal nitrates in distilled water was mixed in stoichiometric ratio. Appropriate amounts of glycine and citric acid (as fuel and complexing agents) were then added to the mixed nitrate solution. The nitrates acted as oxidizer in the mixed solution. The molar ratio of fuel to nitrate was set at 1.4:1 (fuel enrichment range) to ensure complete complexation of Bi and for smooth and controlled combustion of the mixed solution of bismuth and erbium nitrates. In addition, increasing the amount of fuel above stoichiometric (φ = 1) leads to an increase in the amount of gas-phase product, which is an important factor in controlling the product-specific surface area [33]. The ratio of glycine and citric acid was 1:1. The mixed solution was heated on a hotplate under stirring to form a gel, which was further heated until combustion occurred. The foam-like powder obtained after combustion was crushed and calcined at 600 °C for 5 h to remove residual organics. After that, the powder was calcined at 700 °C for 5 h for subsequent phase analysis.
The Ce0.8Sm0.2O1.9 (SDC) powder for the supporting electrolyte substrates was fabricated with a solid-state reaction method using CeO2 (99.9% wt) and Sm2O3 (99.9% wt) as the starting reagents. The reagents were mixed in a PM 100 planetary mill (Retsch, St. Petersburg, Russia) in ethyl alcohol medium using plastic drums and stainless-steel grinding bodies, dried, and then calcined in alumina crucibles at 950 °C (10 h) and 1050 °C (10 h) with intermediate ball-milling for 1 h. After the final calcination step, the powder was ball-milled for 1 h, dried, and dry-pressed into disks at 300 MPa. The disks were then sintered at 1600 °C for 3 h. To perform XRD characterization, the SDC sintered disk was crushed.
The XRD characterization of the obtained materials was performed using an XRD-7000 diffractometer (Shimadzu, Kyoto, Japan) in CuKα1 radiation in the 25° ≤ 2θ ≤ 80° angle range with a scanning step of Δ(2θ) = 0.02° and a fixed time of 5 s at each point. The parameters of the crystal structure of the obtained materials were refined using FullProf Suite software [34]. The specific surface area of the EDB powder used for the suspension preparation was determined using a SORBI N 4.1 instrument (Meta, Novosibirsk, Russia). The morphology of the EDB powder was investigated using a JSM-6390 LA scanning electron microscope (JEOL, Tokyo, Japan).

2.2. Preparation of the Suspensions Based on the Electrolyte Materials and Their Characterization

Suspensions based on EDB powder with a concentration of 10 g/L were prepared in a mixed dispersion medium of isopropanol/acetylacetone (70/30 vol.%), as well as in an isopropanol medium with the addition of polyethyleneimine (PEI, 0.26 g/L) and acetylacetone (0.15 g/L). EDB suspensions were sonicated using an ultrasonic bath UZV-13/150-TH (Reltec, Yekaterinburg, Russia) at a generator power of 210 W and an operating frequency of 22 kHz for 125 min at room temperature. The electrokinetic zeta potential and pH in the as-prepared suspensions were measured with the electroacoustic method using a DT-300 analyzer (Dispersion Technology, Bedford Hills, NY, USA).

2.3. Electrophoretic Deposition of the Barrier Electrolyte Layers on the SDC Substrates and Their Characterization

Electrophoretic deposition was performed using a specialized computerized experimental setup (Institute of Electrophysics, UB RAS, Yekaterinburg, Russia) with vertically arranged electrodes. The supporting SDC electrolyte disks were polished using a diamond disk to 550 μm in thickness and 13 mm in diameter. The substrates were cleaned in the ultrasonic bath for 10 min and calcined at 900 °C for 1 h to eliminate surface contamination. A conductive polymer film of polypyrrole (PPy) was synthesized on the surface of the SDC substrate using chemical polymerization of pyrrole in an aqueous solution with ammonium persulfate serving as an oxidizing agent (98%, 0.03 M), sodium salt of p-toluenesulfonic acid serving as a dopant (97.5%, 0.03 M), and pyrrole monomer (98%, 0.03 M) [35]. To perform the EPD process, the SDC substrate with the deposited PPy conductive polymer film was placed on the EPD cell cathode electrode at a distance of 10 mm from the stainless-steel counter electrode, which was 12 mm in diameter. The deposition was performed in the constant voltage mode, and current strength during the deposition process was controlled using an Intelligent Digital Multimeter UNI-T UT71E (Uni-Trend Technology, Guangdong, China). The morphology of the surface of the deposited layers was examined using an ST-VS-520 optical microscope (Yekaterinburg, Russia). The microstructure and element composition of the deposited films were studied by means of a JSM-6390 LA scanning electron microscope (JEOL, Tokyo, Japan) equipped with a system of energy-dispersion X-ray microanalysis (EDX).

2.4. Single Cell Fabrication and Electrochemical Characterization

To study the effect of the EDB blocking layer on the OCV values, a Pt/SDC/EDB/Pt single cell was fabricated. Platinum electrodes with an effective area of approximately 0.3 cm2 were paint-brushed symmetrically on both sides of the SDC electrolyte disks with the deposited and sintered EDB barrier coating. The electrodes were sintered at 900 °C for 2 h. To reduce polarization resistance of the electrodes, they were activated through impregnation with an ethyl alcohol solution of Pr(NO3)3 (99.9% wt) (cathode side) and water solution of Ce(NO3)3 (99.9% wt) (anode side). Nitrate decomposition was performed at 600 °C for 2 h, with a rate of heating/cooling of 100 °C/h.
The measuring cell consisted of the YSZ tube with deposited Pt electrodes serving as electrochemical pump and sensor. The Pt/SDC/EDB/Pt cell was fixed on the top of the measuring YSZ cell, with the Pt anode activated with Ce inside and the Pr cathode activated with Pr outside the YSZ tube. The sample was first fixed using Aremco Ceramabond™ 571 (Aremco Products Inc., Valley Cottage, NY, USA) and then adhered tightly to the tube using a high-temperature sealant through heating up to 930 °C, with a holding time of 10 min, and a heating/cooling rate of 150 °/h. The electrochemical study was performed using a B2901A precision source/measure unit (Keysight, Santa Rosa, CA, USA). The spectra under the OCV conditions were collected using a Parstat 3000A potentiostat/galvanostat (Ametek Scientific Instruments, Newark, NJ, USA) at 30 mV in a frequency range of 2 MHz–0.1 Hz, 30 points per decade. Z-View2 software (version 3.5i, 2021, Scribner Associates, Southern Pines, NC, USA) was used to fit the obtained spectra.
To start the measurements, the cell was heated up to 600 °C and then the oxidizing atmosphere in the anode channel (inside the tube) was gradually replaced with argon and then with humidified hydrogen (3% H2O, 5 L/h flow rate). The air was pumped to the cathode side at a rate of 5.7 L/h. After the establishment of the necessary atmosphere in the anode channel, the EMF measurements using the electrochemical sensor placed on the YSZ-based measuring cell at 600 °C were equal to 1120 mV, which is characteristic for the YSZ electrolyte [36]. The measurements were carried out at 600–850 °C by sequentially recording the OCV values on the Pt/SDC/EDB/Pt cell, the cell impedance spectrum under OCV conditions, and the cell volt-ampere characteristics. The polarization and ohmic (IR) resistance of the cell were measured using the current interruption method with an RTM3004 oscillograph (Rohde & Schwarz, Munich, Germany).

3. Results and Discussion

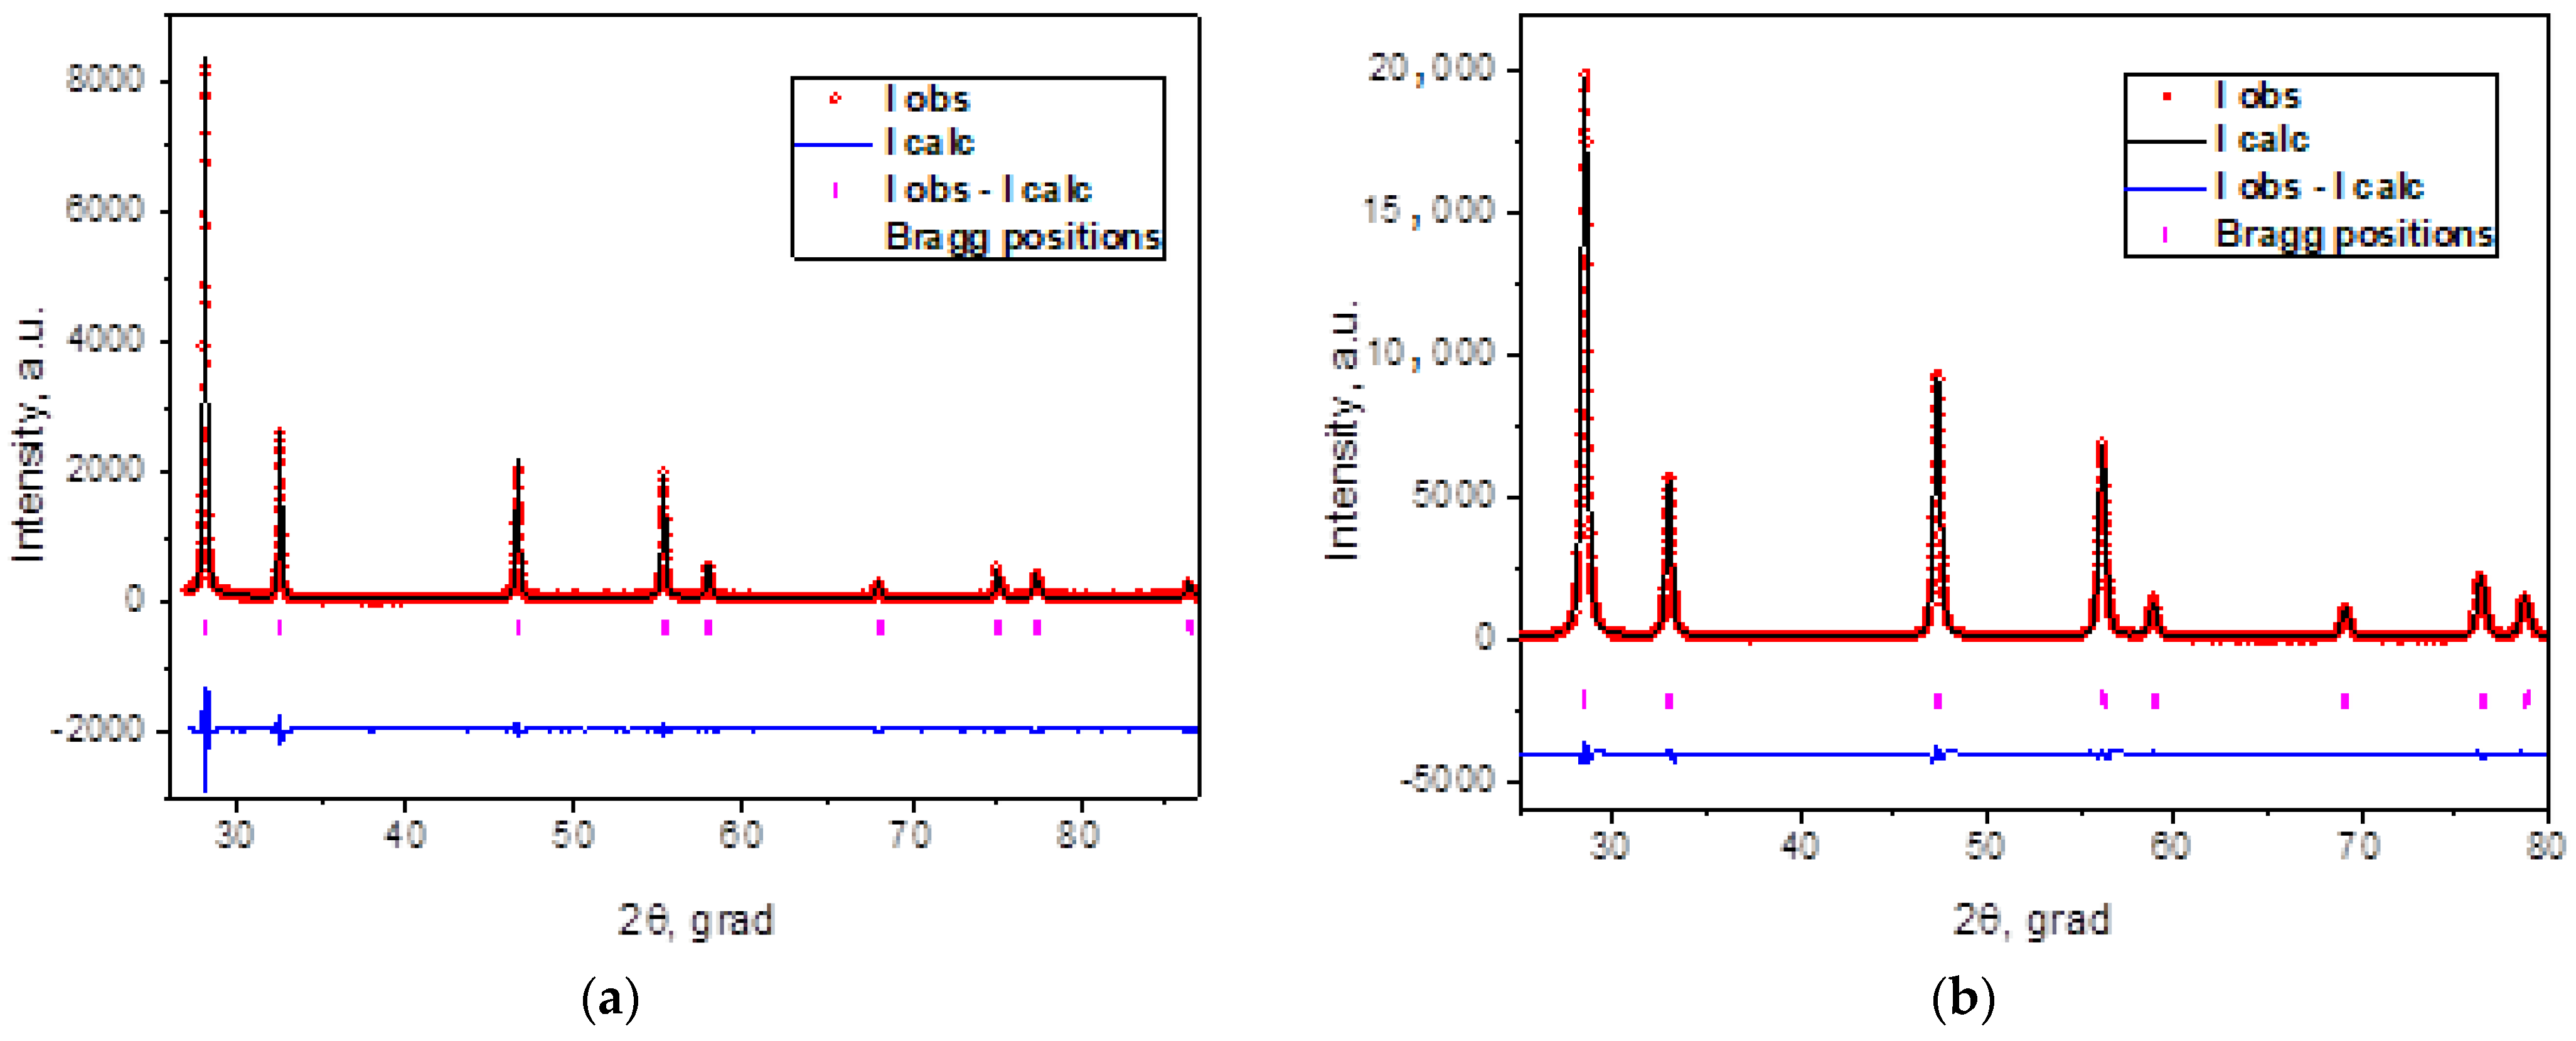
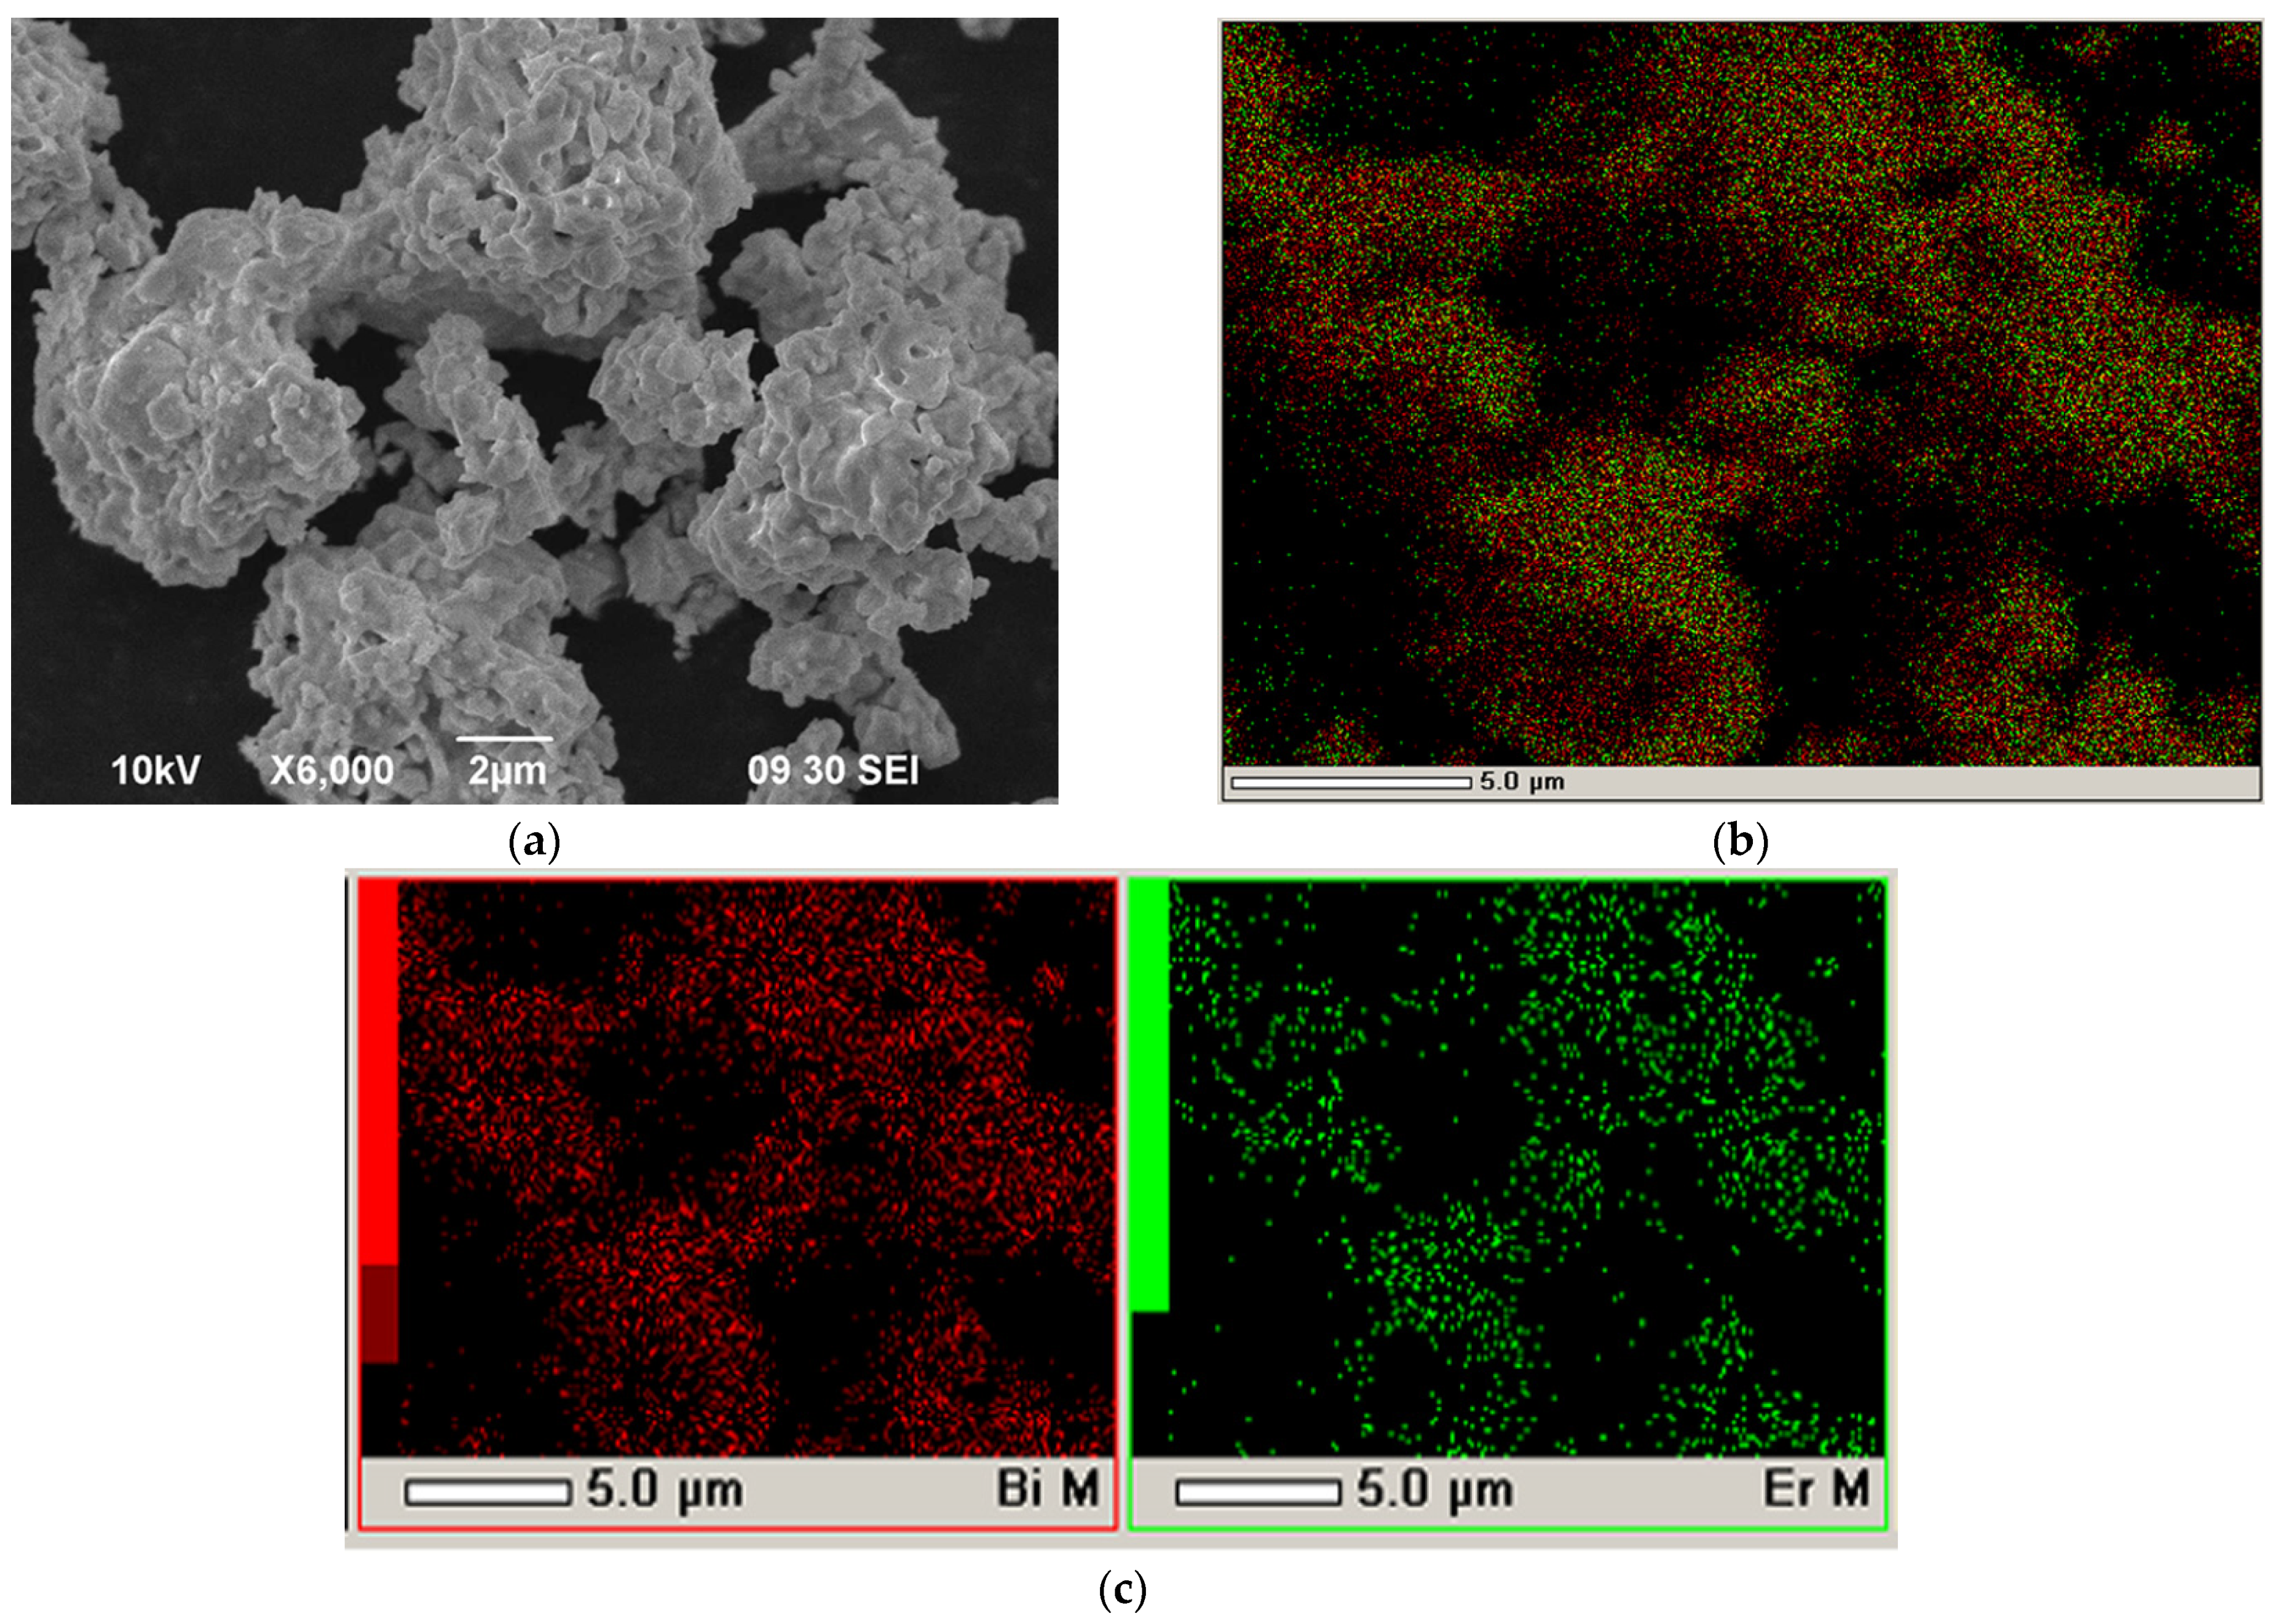
3.1. Characterization of the Electrolyte Powder Materials

The results of the XRD characterization of the EDB and SDC electrolyte materials are represented in Figure 1. The materials were single-phase and exhibited a cubic-type structure (Table 1), with the unit cell parameters being close to those presented in the literature [5,37,38].
The powder after synthesis was characterized by the formation of large agglomerates up to 10 µm in size, consisting of irregularly shaped submicron particles (Figure 2a). EDX analysis revealed the uniform distribution of elements in the particles (Figure 2b,c). Along with the presence of agglomerates, the EDB powder was also characterized by the presence of individual particles with a size of 0.1 μm or greater. The morphological inhomogeneity of the powder can lead to an uneven distribution of electrolyte powder particles over the substrate surface and subsequent multidirectional sintering in different parts of the surface during the formation of the EDB electrolyte layer. The crystallite size of the powder calcined at 700 °C, as determined by the Scherrer formula, and was about 175 nm. The powder was additionally ball-milled for 1 h in an ethanol medium. After that, the specific surface area of the EDB powder reached 3 m2/g with an average particle size of 222 nm, calculated according to [39].

3.2. Preparation of Suspensions for EPD and Study of Kinetic Properties

The electrokinetic properties of suspensions of the EDB powder (10 g/L) in an isopropanol/acetylacetone (70/30 vol.%) dispersion medium were studied after ultrasonic treatment (UST) for 5–125 min; the results are presented in Table 2. A slight increase in the zeta potential of up to +20 mV during ultrasonic treatment for 125 min was noted, while the pH shifted from 6.8 to 6.2, which characterizes a change in the ionic composition of the suspension due to improved solvation of the particles by the dispersion medium. In the course of the experiments, another variant of the composition of the dispersion medium for the preparation of the EDB suspension was used: isopropanol with the addition of polyethyleneimine (PEI, 0.26 g/L) and acetylacetone (0.15 g/L). The EDB suspension preparation was carried out in the following sequence. First, the EDB powder was introduced into an isopropanol medium with the addition of PEI (0.26 g/L), and UST was performed for 125 min. After that, the measured zeta potential value was +10 mV at pH = 11.0. However, in a suspension of EDB in an isopropanol medium with the addition of PEI, the deposition process did not occur. In the second step of the preparation, the resulting suspension was further modified by the addition of a small amount of acetylacetone (0.15 g/L). The amount of acetylacetone added as a dispersant was calculated on the specific surface of the EDB powder, namely in the amount of 5 mg/m2. The principles of introducing acetylacetone as a dispersant were described in our recent study [40]. After the addition of acetylacetone (0.15 g/L) to the suspension of EDB in isopropanol with PEI and UST for 125 min, the zeta potential and pH values were +9 mV and 10.5, respectively. Despite the addition of acetylacetone having no significant effect on the values of the zeta potential and pH, the modification of the EDB suspension with the addition of the acetylacetone dispersant made it possible to carry out the EPD process.

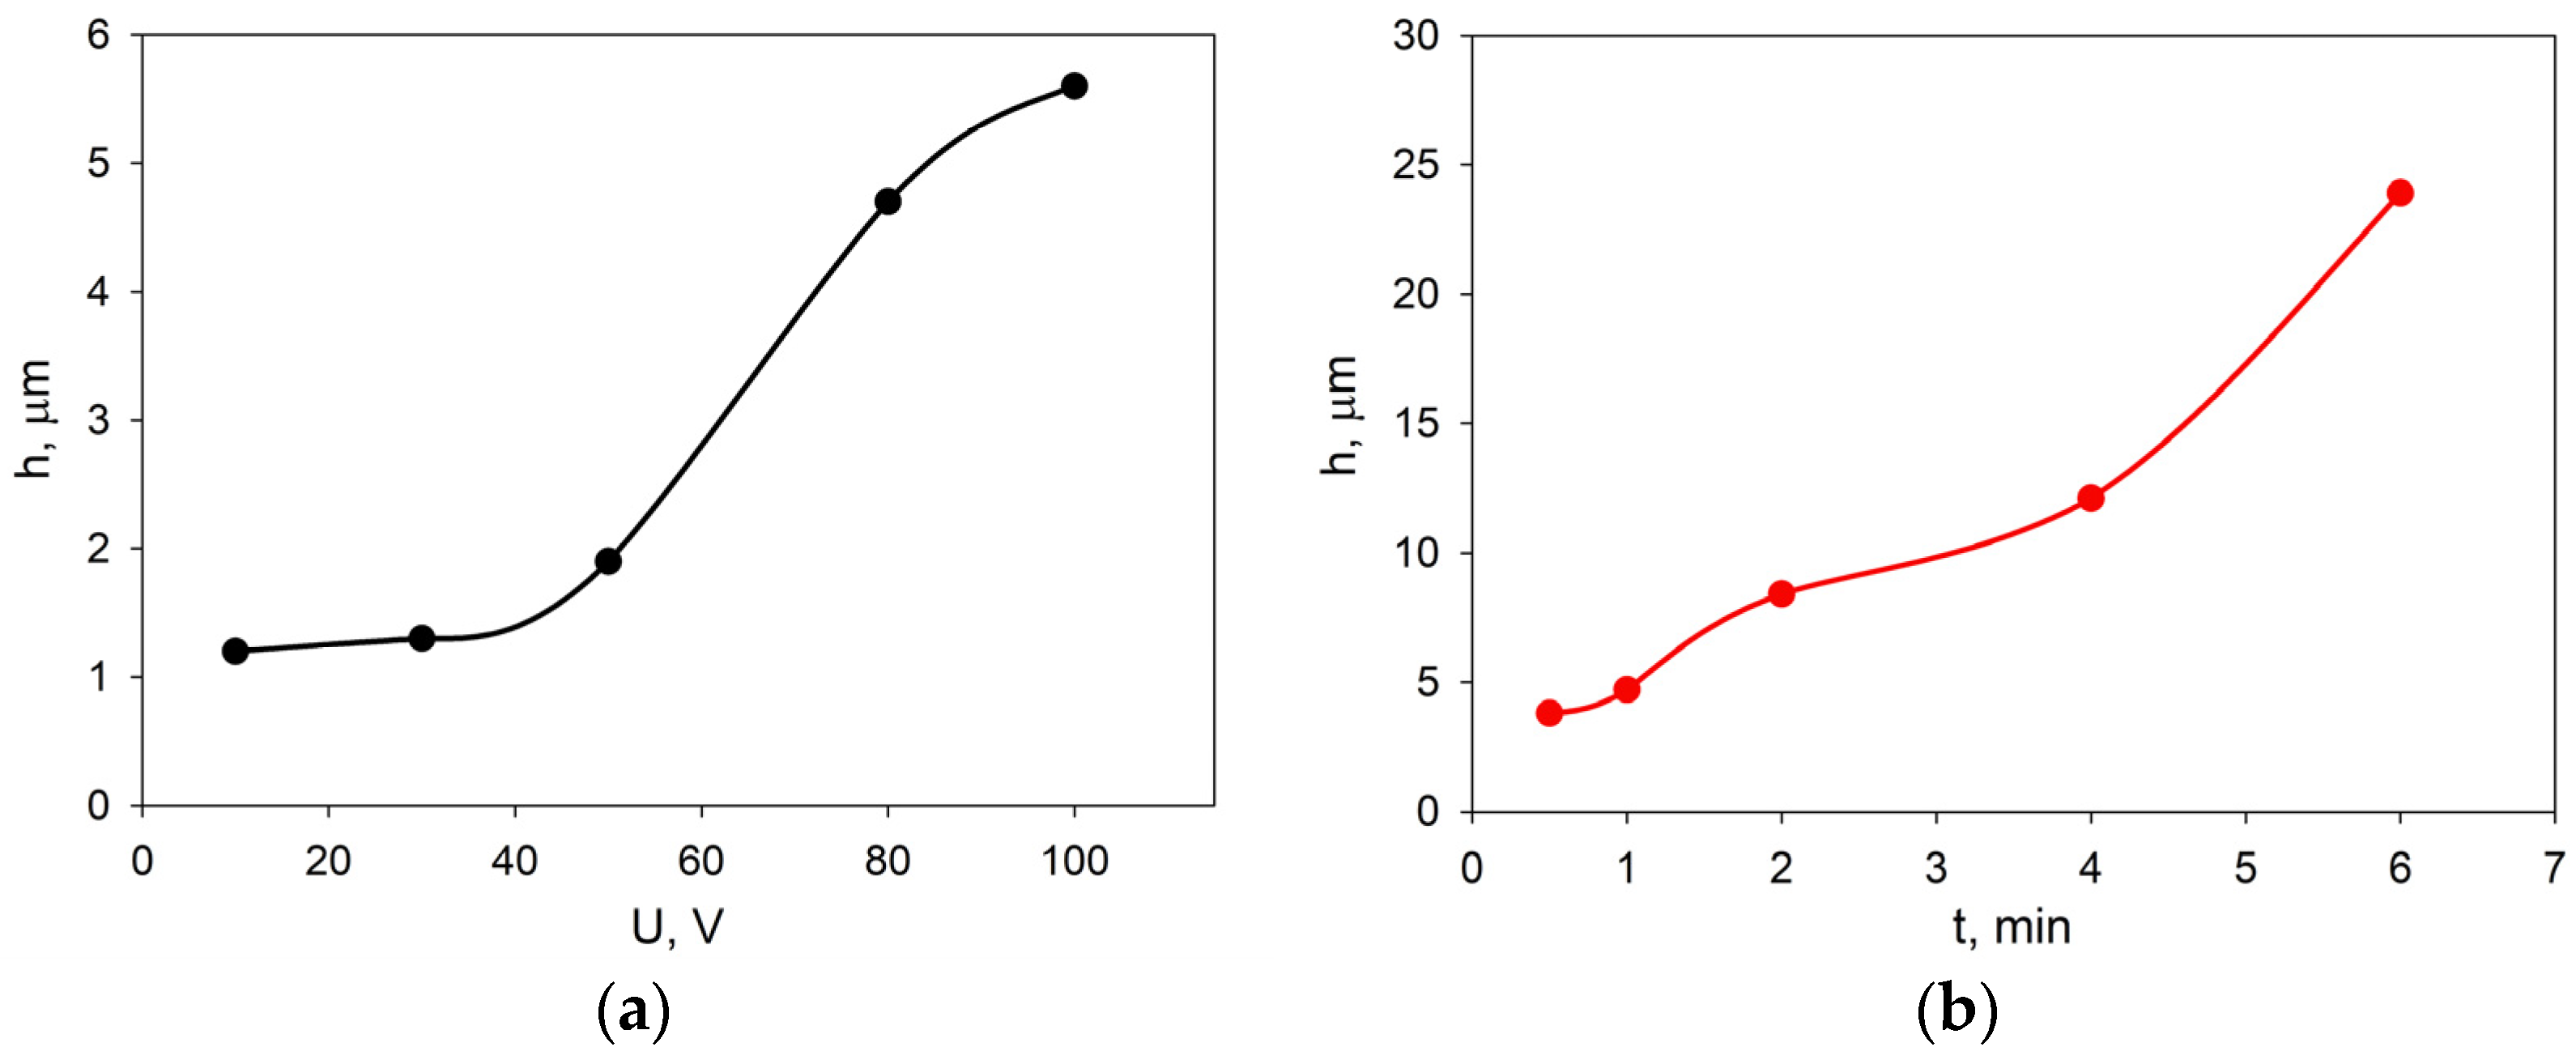
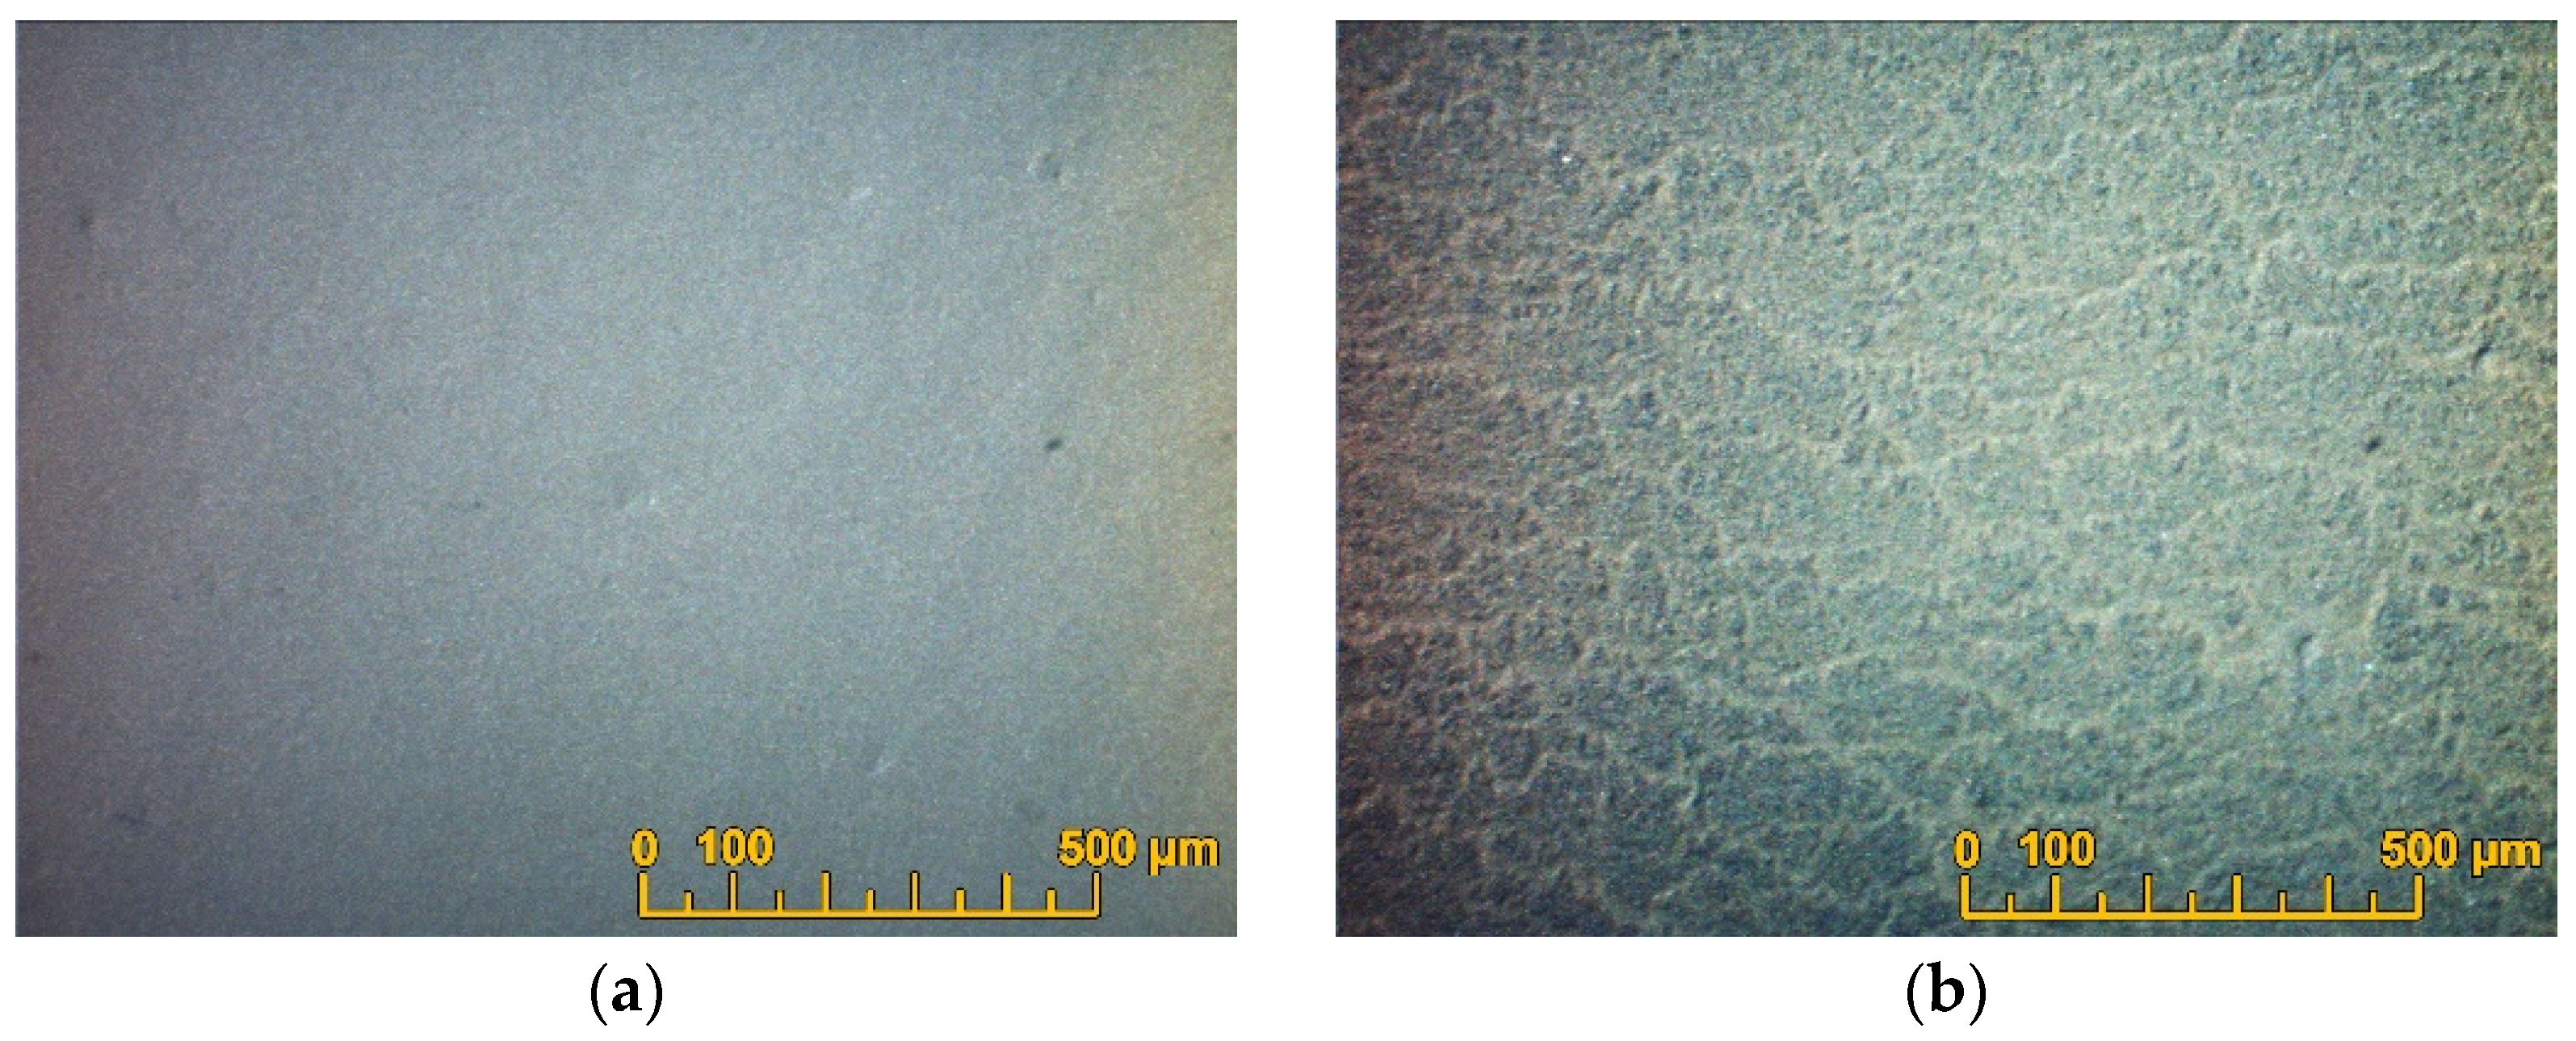
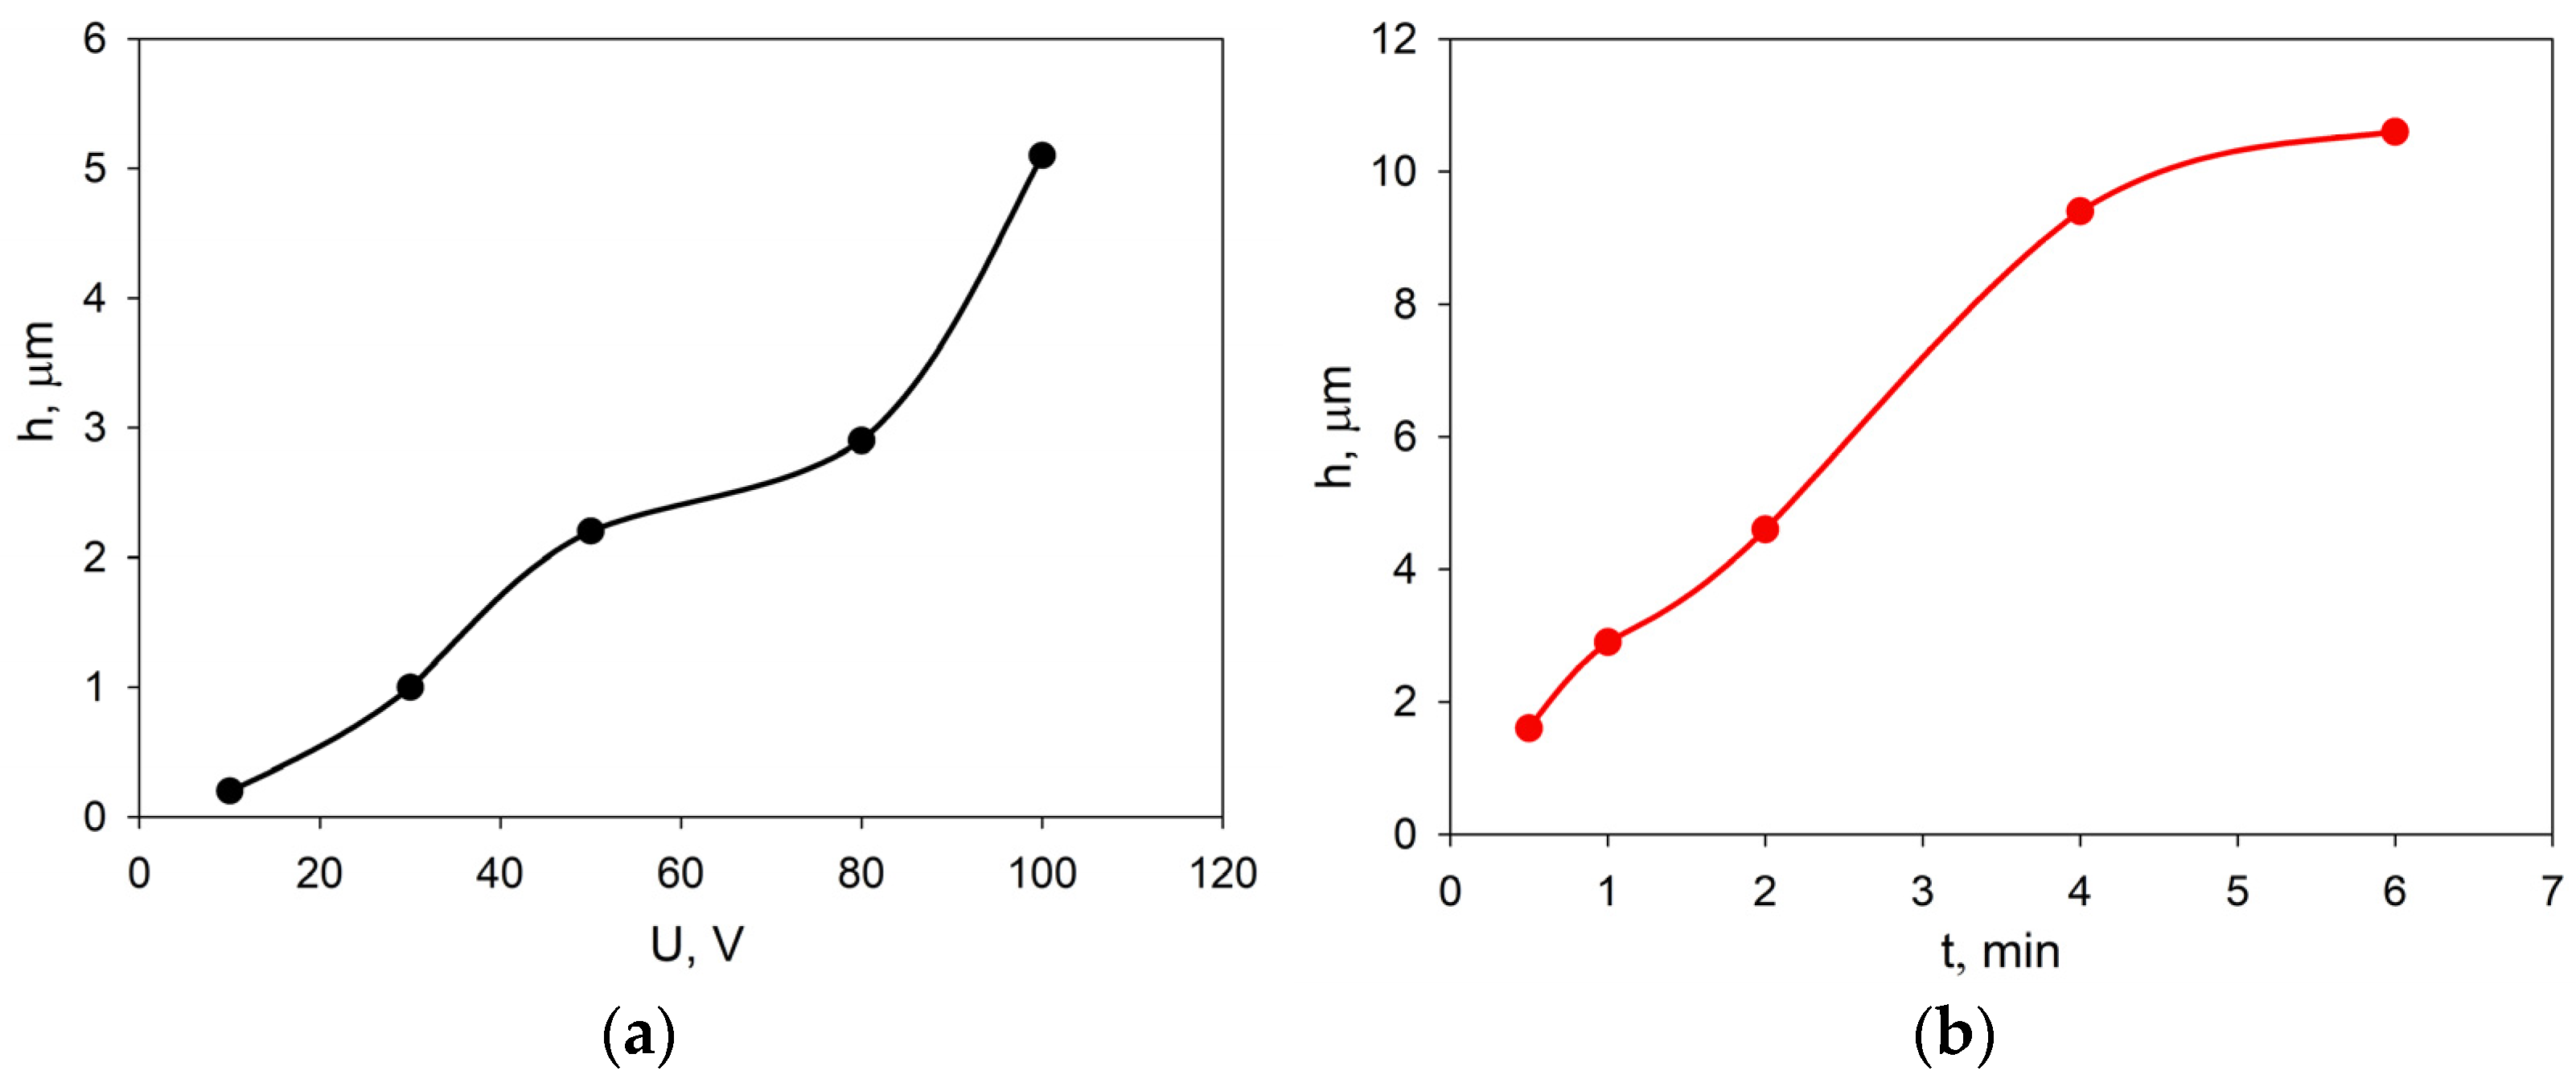
3.3. EPD from the EDB Suspensions on a Model Ni Foil Substrate

The selection of EPD modes was carried out on the basis of preliminary experiments on the deposition of the EDB powder from the prepared suspension in the isopropanol/acetylacetone 70/30 vol.% medium onto a model electrode (Ni foil). The dependences of the EDB coating thickness on the voltage at a fixed deposition time (1 min), as well as at a constant voltage of 80 V and various deposition times, are shown in Figure 3. A steady increase in the thickness of the EDB coating was observed in the voltage range of 50–80 V (Figure 3a). The dependence of the coating thickness on time (Figure 3b) was close to linear.
A continuous EDB coating on the model substrate was formed at a voltage of 80–100 V (Figure 4a), while at lower voltages an inhomogeneous network coating appeared (Figure 4b). According to the obtained results, for the following deposition on the SDC substrate an EPD mode of U = 80 V and t = 1 min was chosen to obtain a continuous EDB coating with a thickness of 5 µm. The deposition current was ~0.1 mA.
The same scheme was used to study the effect of EPD modes on the coating thickness on a model electrode (Ni foil) deposited from the EDB suspension in an isopropanol medium modified with PEI and acetylacetone. The results are shown in Figure 5.
At a voltage of more than 80 V, the growth of the EDB coating thickness was accelerated (Figure 5a); an increase in the deposition time to more than 4 min led to a slowdown in the growth of the coating thickness (Figure 5b). It was established that to obtain a continuous EDB coating, the deposition must be carried out at a voltage of at least 80 V, and to obtain a thickness of 5 μm, the deposition time must be ~2 min (Figure 6a). Lower voltages and deposition times (e.g., 30 V and 1 min) resulted in a non-uniform coating structure (Figure 6b). Based on the results obtained, for the following experiments a deposition mode of U = 80 V and t = 2 min was chosen to obtain a 5 μm thick EDB coating from a suspension in isopropanol with PEI and acetylacetone additives. The deposition current was 0.1 mA.

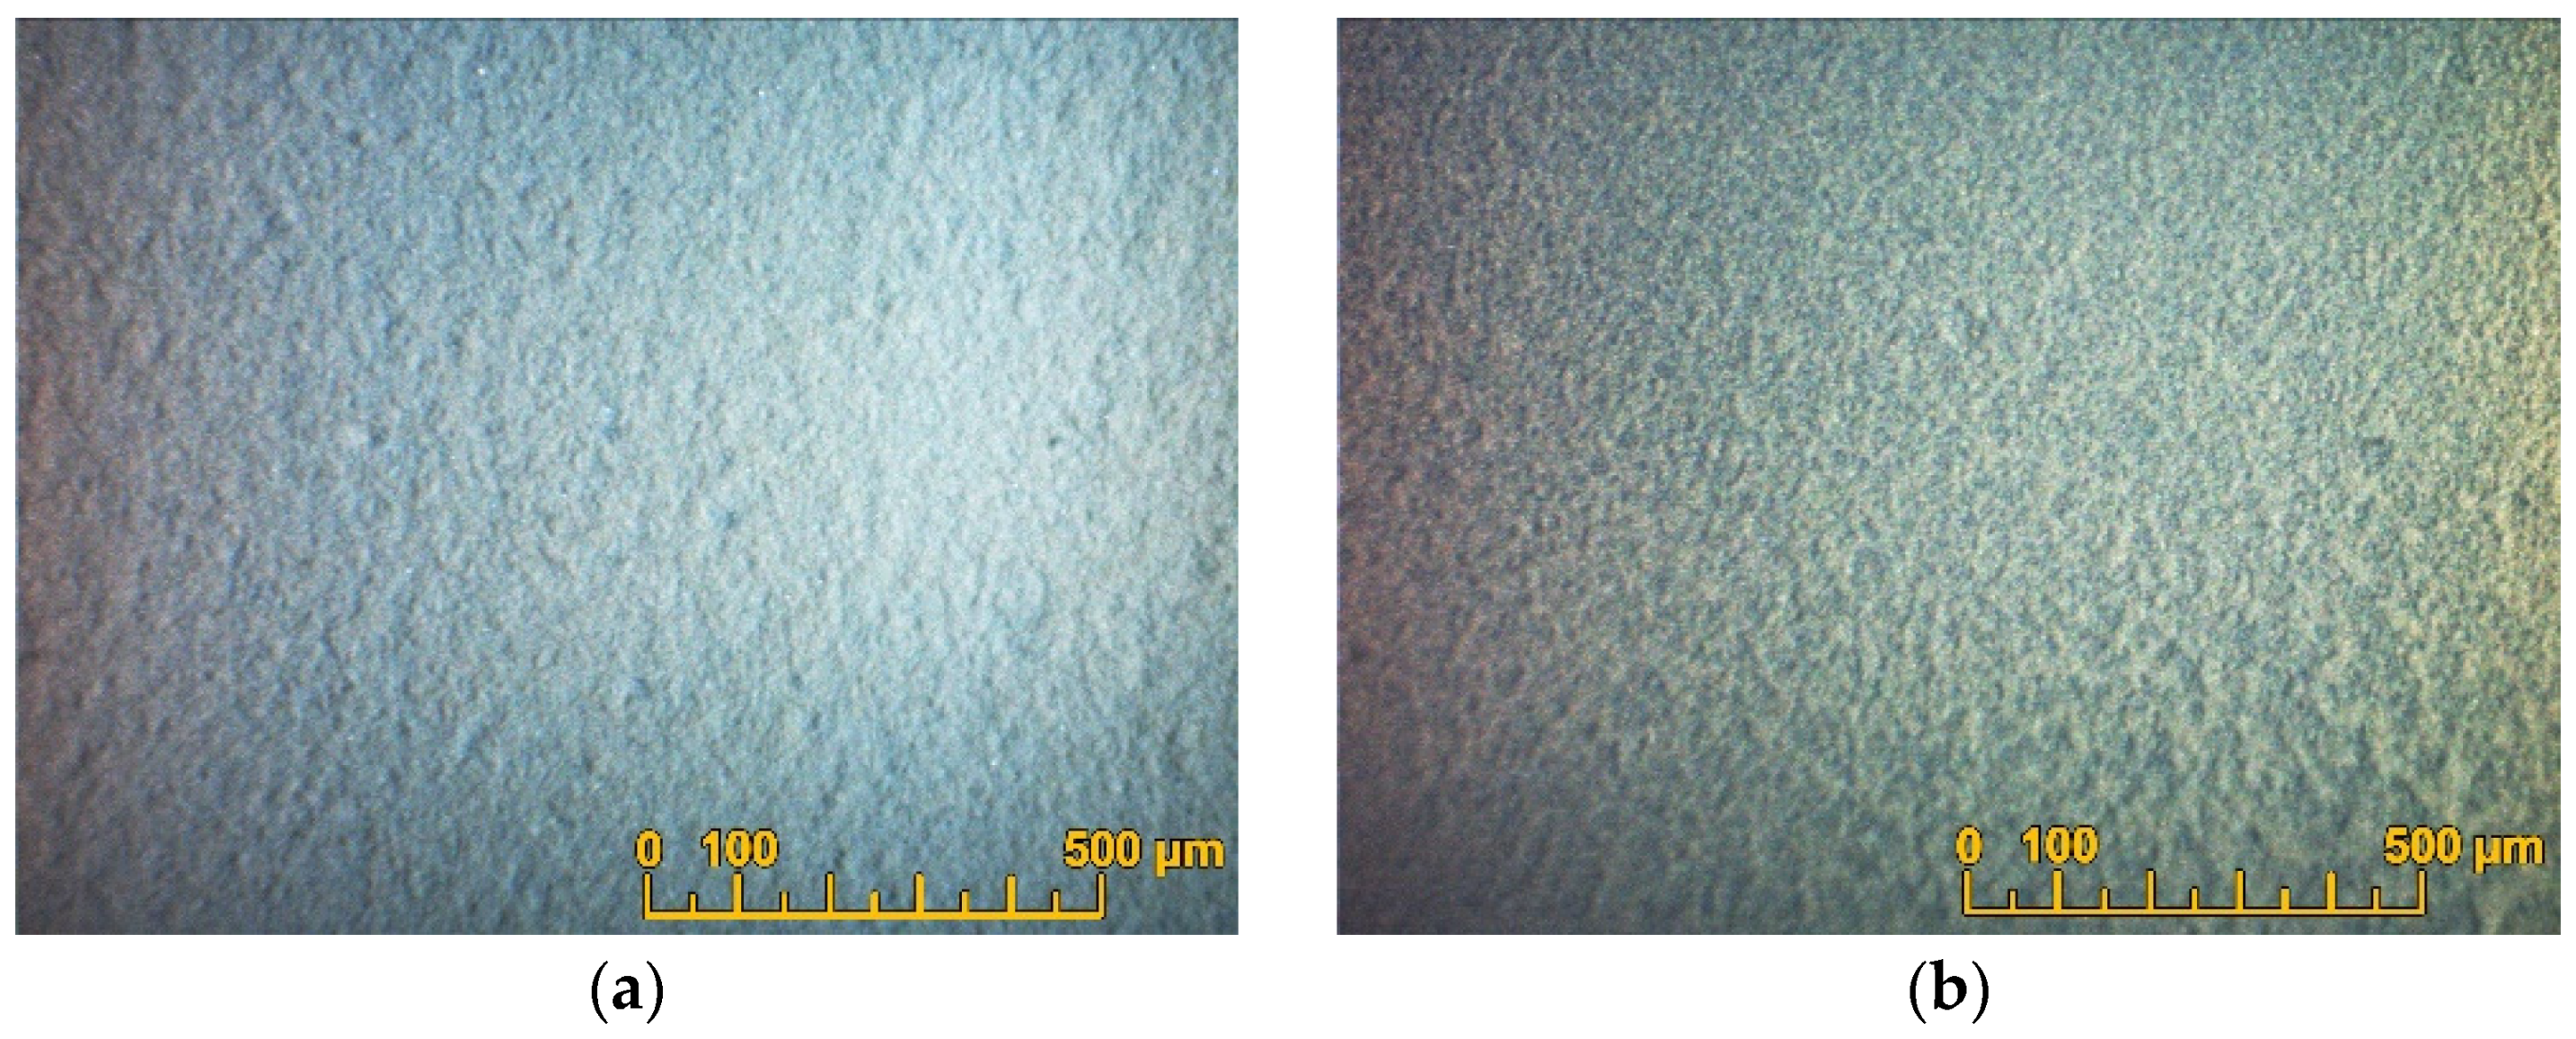
3.4. Formation of EDB Coatings on the Dense SDC Electrolyte Substrates

The implementation of the EPD method is related to the need to use a conductive substrate. Using EPD on non-conductive dense (solid-state electrolyte membranes) or low-porosity (NiO-based cermet anodes) substrates is possible by creating a conductive sublayer on their surface. Creating surface conductivity can be achieved through the deposition of conductive graphite layers [41,42,43], through metallizing the substrate surface with silver or platinum [44], or through the deposition of a polypyrrole (PPy) coating [45]. The synthesis of PPy was chosen in this study. It is known that PPy films exhibit conductivity sufficient for EPD (~500 S/m) and a small thickness, which ensures the integrity of the electrolyte coating when burning PPy during sintering [35,46,47]. In this work, a conductive PPy film was synthesized on the surface of the dense SDC substrate through the chemical polymerization of a pyrrole monomer using the reagents described in Section 2. The reagents were intensively mixed at 0 °C to obtain a homogeneous reaction mixture, into which the SDC substrate was immersed immediately after the start of synthesis. Chemical polymerization of PPy occurs according to the following reaction: Coatings 13 01053 i001
The thickness of the resulting PPy sublayer was approximately 0.5 μm. On the SDC substrate with a PPy sublayer, the EDB barrier coating was deposited from the isopropanol/acetylacetone-based suspension in the constant voltage mode of U = 80 V and t = 1 min (Sample EDB-1). The EDB layer was dried at room temperature in a Petri dish. The thickness of the dried coating was 6 µm. The coating was sintered at a temperature of 850 °C for 5 h in a closed crucible with the EDB powder being poured around the substrate. The EDB coating was uniform and crack-free in the central zone of the substrate (Figure 7a), but breaks in the coating were observed along the edges of the SDC substrate. An attempt was made to close the formed defects in the coating by applying the second EDB layer with EDB. The deposition was carried out according to a similar scheme: a PPy layer was synthesized on the surface of the sintered EDB layer and the second EDB layer was deposited (U = 80 V and t = 1 min), followed by being dried and sintered at a temperature of 850 °C for 5 h. The total thickness of the EDB coating after two deposition–sintering cycles was 11 µm. However, as a result, a net of breaks was observed on the surface of the sintered coating (Figure 7b).
The formation of cracks and breaks in the EDB coating of the EDB-1 sample may be associated with the effect of shrinkage of the EDB electrolyte material. However, individual fragments of the EDB electrolyte layer had a sintered structure, which allowed us to conclude that the selected sintering temperature of 850 °C is sufficient. To reduce the degree of shrinkage and evaporation of the EDB electrolyte material during sintering, we carried out additional annealing of the initial EDB powder at a temperature of 650 °C for 1 h. However, it was found that the annealed powder was not suitable for the preparation of a stable suspension in the isopropanol/acetylacetone 70/30 medium vol.%, and subsequent deposition from this suspension did not occur. Based on the results obtained, the composition of the dispersion medium was changed; namely, the powder was dispersed in an isopropanol medium with PEI and acetylacetone additives, as described in Section 3.2. The following formation of the EDB barrier layer was carried out on an SDC substrate with a PPy sublayer with two deposition–sintering cycles (EDB-2 sample). In the first deposition cycle, a 5 μm thick EDB barrier layer was obtained in the EPD mode at a constant voltage of 80 V for 2 min, after which it was dried and sintered at a temperature of 850 °C for 5 h. The surface SEM image of the resulting EDB coating is shown in Figure 8. The EDB was not continuous; however, no breaks in the material or delamination of the coating were observed. The non-continuity of the coating was probably caused by shrinkage of the EDB electrolyte material during sintering. Therefore, to heal the defects, a second cycle of deposition–sintering was carried out.
The second EDB layer was deposited in the same EPD mode, and a total coating thickness of 12 µm was obtained. The obtained EDB barrier layer on the EDB-2 sample did not contain breaks or cracks in the coating (Figure 9). This sample was used for the subsequent fabrication of a single button cell and its electrochemical characterization.

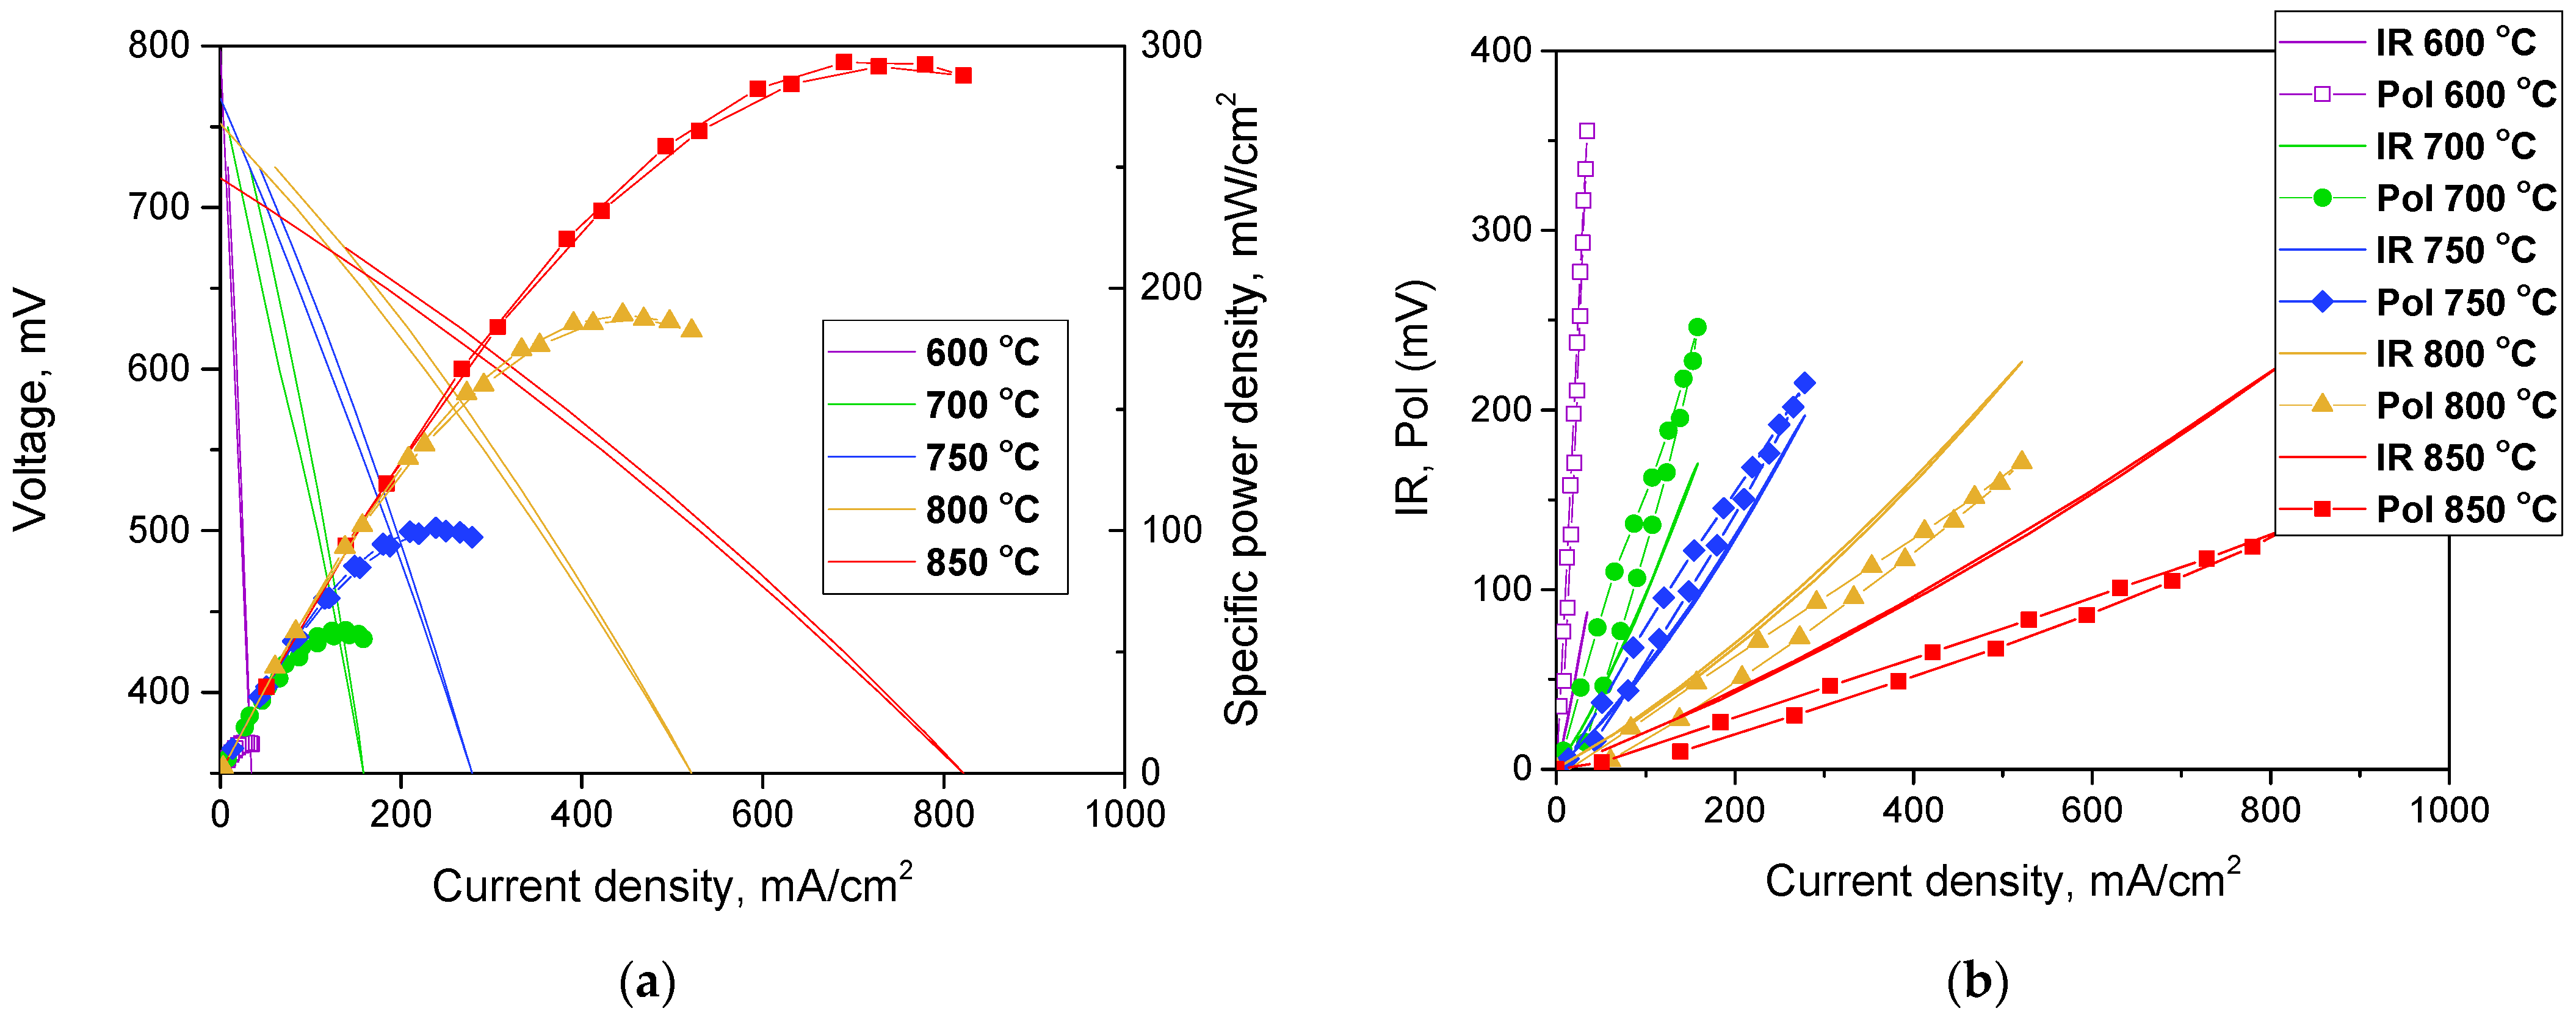
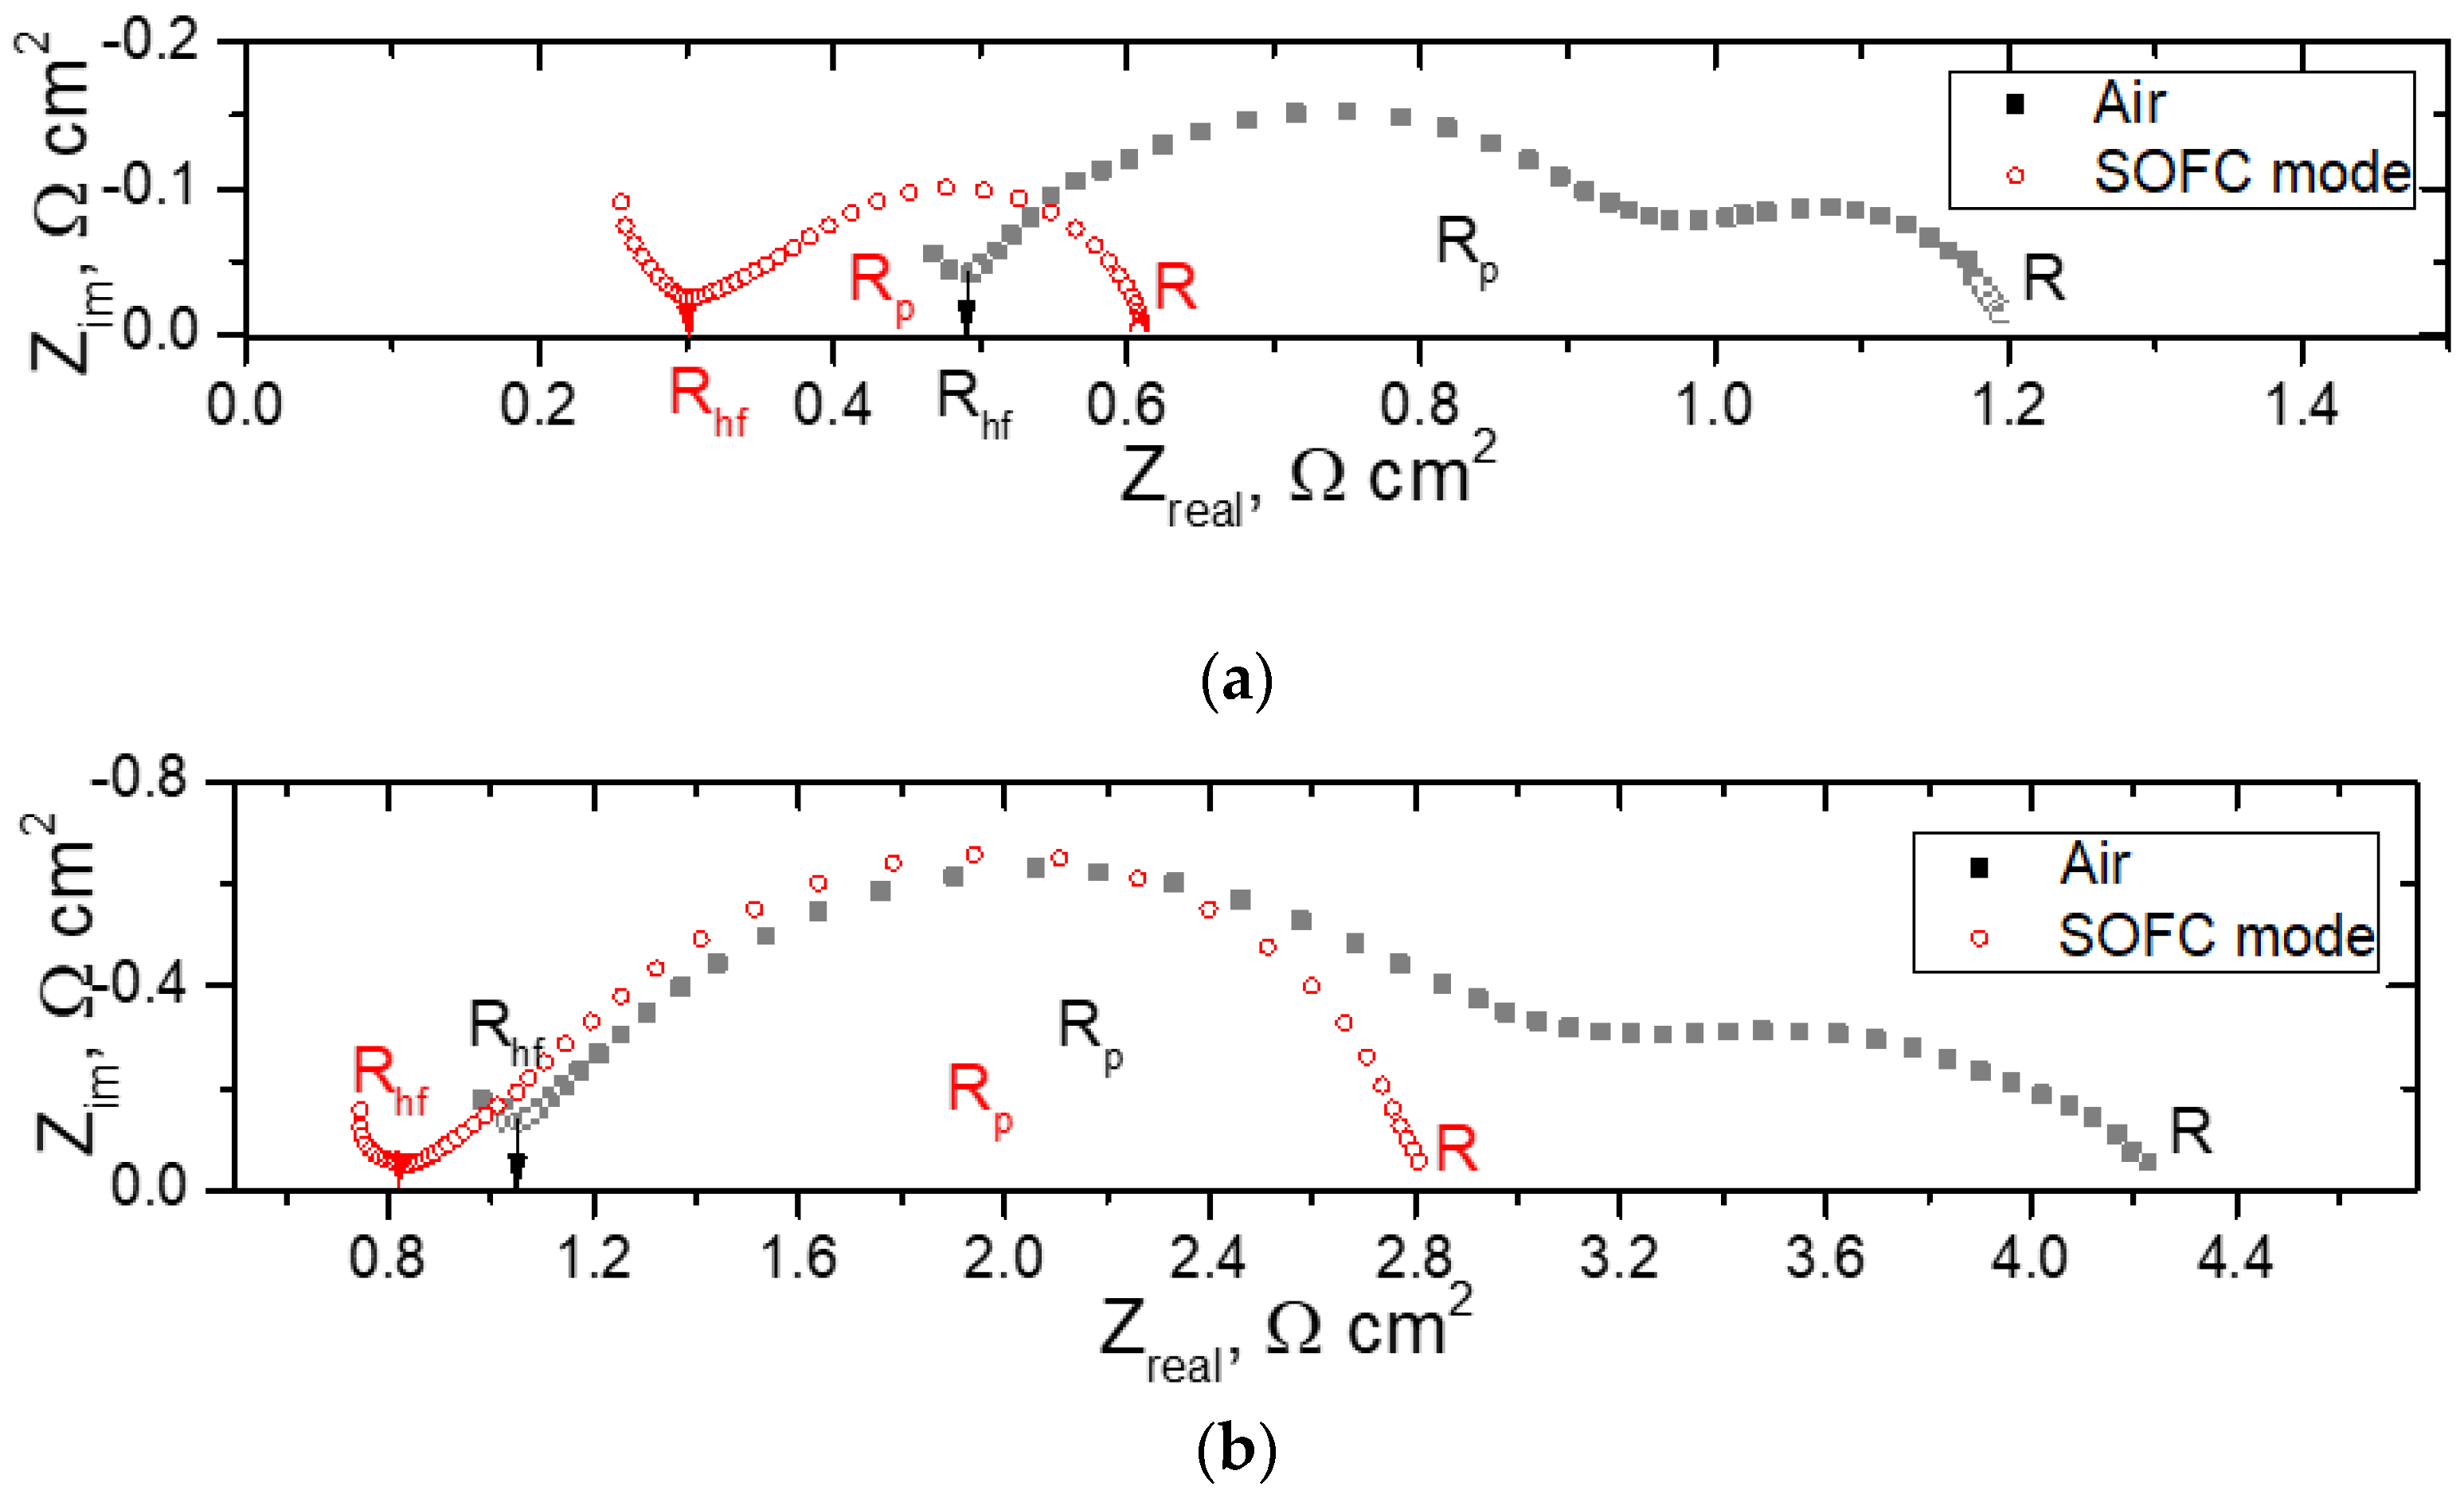
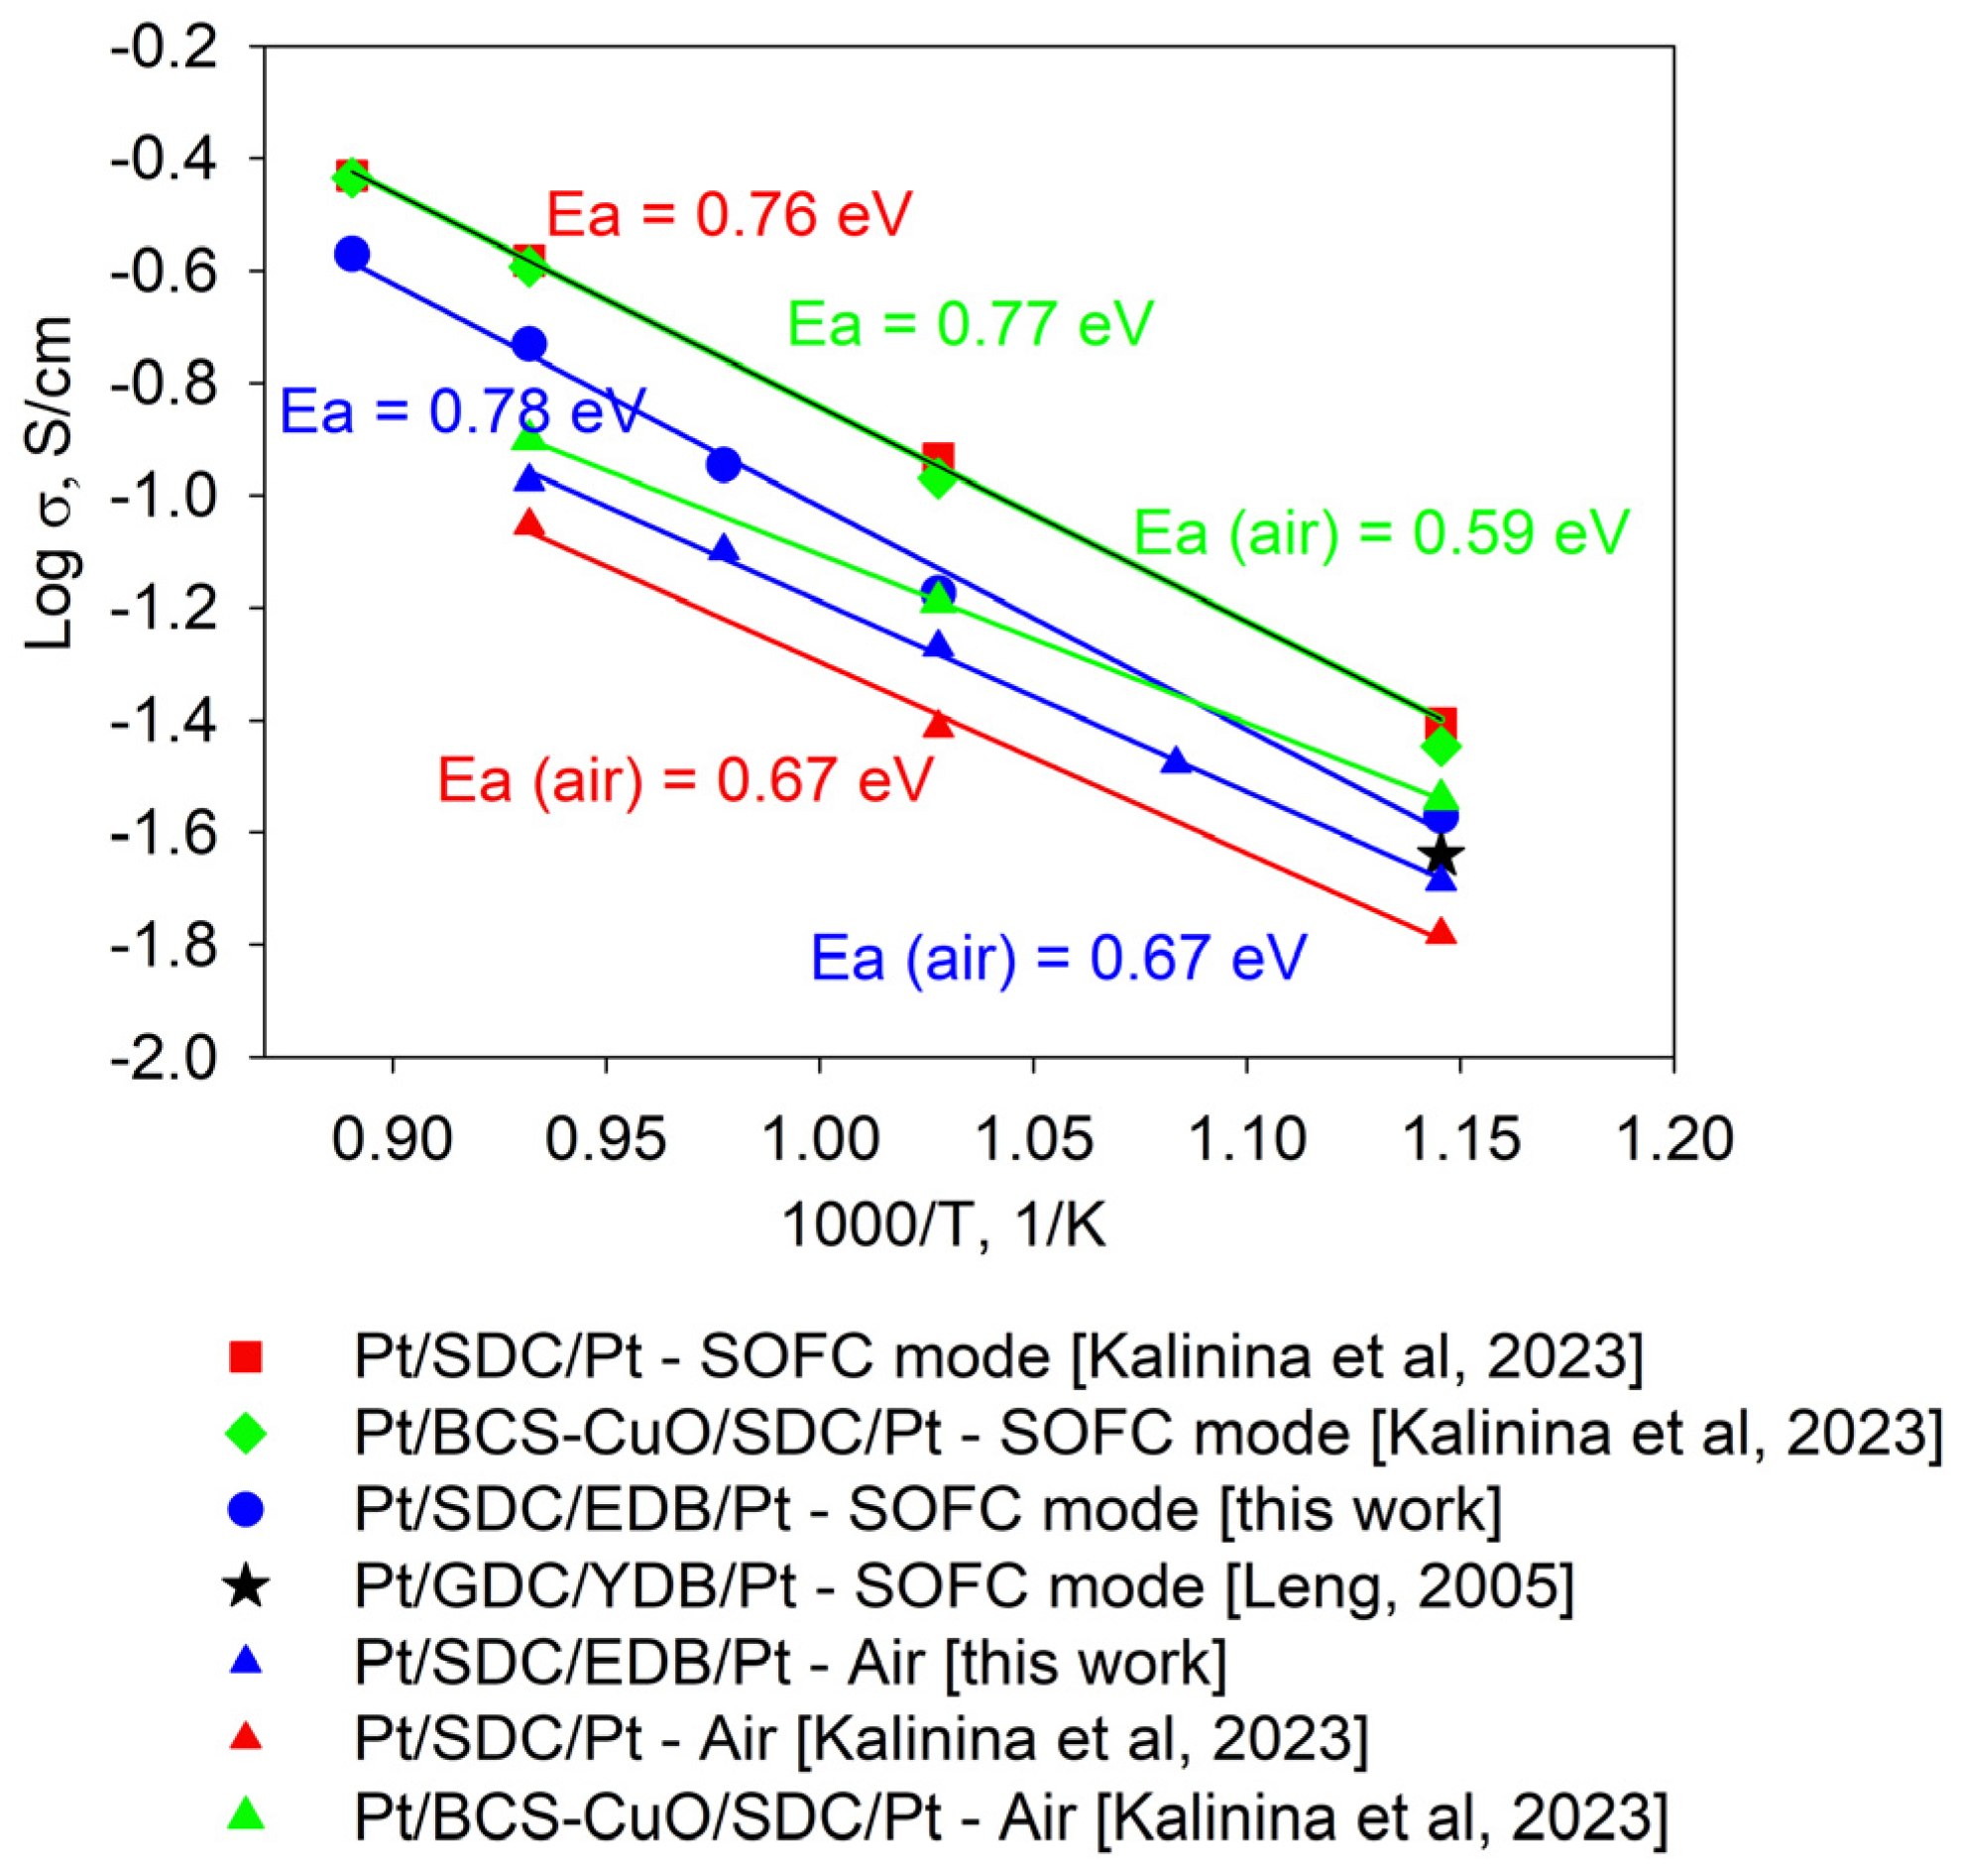
3.5. Electrochemical Testing of Single SOFCs with a Supporting SDC Electrolyte Membrane and EDB Electrolyte Coating Applied Using EPD on the Cathode Side

For electrochemical characterization of the SDC electrolyte with an EDB barrier layer, a Pt/SDC/EDB/Pt cell was fabricated, as described in Section 2.4. The current–voltage characteristics were collected in the temperature range of 600–850 °C and the MPD values were calculated. Additionally, the polarization and ohmic (IR) resistance of the cell were measured using the current interruption method. The results are shown in Figure 10a and Figure 10b, respectively. The main characteristic of the cell is the constant increase in the MPD values up to 850 °C, which is not typical for cells with supporting MIEC electrolytes. Usually, the cell performance decreases at temperatures higher than 800 °C due to the reduction of ceria in the anode conditions, which becomes significant at such high temperatures [5,48]. The MPD values are 12.6, 58.9, 101.2, 187.3, and 293.2 mW cm−2 at temperatures of 600, 700, 750, 800, and 850 °C, respectively. The obtained values are much higher than those obtained by Wachsman et al. in a cell with a supporting SDC electrolyte with an Er-doped Bi2O3 barrier layer and Pt/Au electrodes (51 mW cm−2 at 800 °C [14]) due to the reduction in the total electrolyte thickness from 800 to 562 µm. The OCV values obtained in this study were in the range of 725–750 mV and were close to those obtained for cells with doped Bi2O3 layers of similar thicknesses deposited with dip coating [16]. It should be noted that the polarization resistance of Pt electrodes was quite high and exceeded the ohmic resistance contribution even at such a high temperature as 750 °C. Due to the low sintering temperature established in this study for the EDB layer deposited using EPD, for future studies it would be preferable to use composite electrodes with Bi2O3 additives with reduced sintering temperatures that have been developed in various studies [49,50], including our own [51], which possess excellent electrochemical activity at decreased temperatures (polarization resistance as low as 0.6 Ω cm2 at 600 °C [3]). This is important, as electrode polarization influences not only the cell performance, but also the OCV value. Thus, the replacement of the model Pt cathodes used in this study would help further improve the cell performance.
To obtain information about the contributions of the electrolyte and the electrodes, the impedance of the cell was measured under air in both channels (designated as “Air”) and under OCV conditions with air and wet hydrogen (3% H2O) in the cathode and anode channels, respectively (designated as “SOFC mode”). The typical spectra are presented in Figure 11. Although the single-cell impedance was fairly complicated, the intercept of the impedance arc at the low-frequency side with the real axis usually embodies the overall cell resistance (R), while the inflection point on the impedance spectra at the high-frequency section represents the serial resistance (Rhf), which includes the electrolyte ohmic resistance as the main component, as well as the electrode/electrolyte interface resistance and the lateral resistance of the electrodes. Therefore, the difference between two intercepts represents the overall polarization resistance (Rp) from both the anode and cathode.
Table 3 summarizes the cell ohmic resistance and the polarization resistance of the electrodes, as well as the overall percentage of the ohmic resistance to the total resistance at different temperatures. The electrolyte ohmic resistance accounted for 44 and 49% of the total cell resistance at 850 °C, while at 600 °C it was only 3 and 16%. The presence of electronic conductivity in the electrolyte in the SOFC mode facilitates electrode reactions, thus decreasing Rp. Thus, as we mentioned above, at decreased temperatures, electrode polarization is the main deteriorating factor for the cell considered in this study. This agrees with data obtained using the current interruption method. Nevertheless, it should be noted that the Rp values of the cell presented in this study were significantly lower than those observed by Wachsman et al. [14], which ranged from 2 to 2.9 Ω cm2 at 800 °C depending on the EDB thickness. This result is due to the electrode activation used in the study.
The electrolyte conductivity was calculated from the EIS data as follows:
σ e l = h / R h f
where h is the total electrolyte thickness, including the supporting SDC electrolyte and the EDB coating. Figure 12 shows a comparison of the Arrhenius dependence of the conductivity with those obtained for SDC electrolytes without and with various barrier layers formed by EPD [9,15]. In the SOFC mode, the electrolyte conductivity is lower than that of SDC without electron-blocking layers and with a BaCe0.8Sm0.2O3 + 1 wt. % CuO (BCS-CuO) anode barrier layer. However, it is similar to that of SDC with an Y-doped Bi2O3 coating, thus demonstrating the superior effectiveness of Bi-based cathodes to block electrons. In air, the SDC-EDB conductivity is higher than that of the SDC electrolyte due to the higher conductivity of EDB, and lower than that of BCS-CuO-SDC due to electronic conductivity in the BCS-CuO electrolyte under air conditions. The deposition of an EDB layer results in increasing the electrolyte conductivity; however, it does not change the activation energy of its conductivity (values are shown in Figure 12 using the relevant colors).

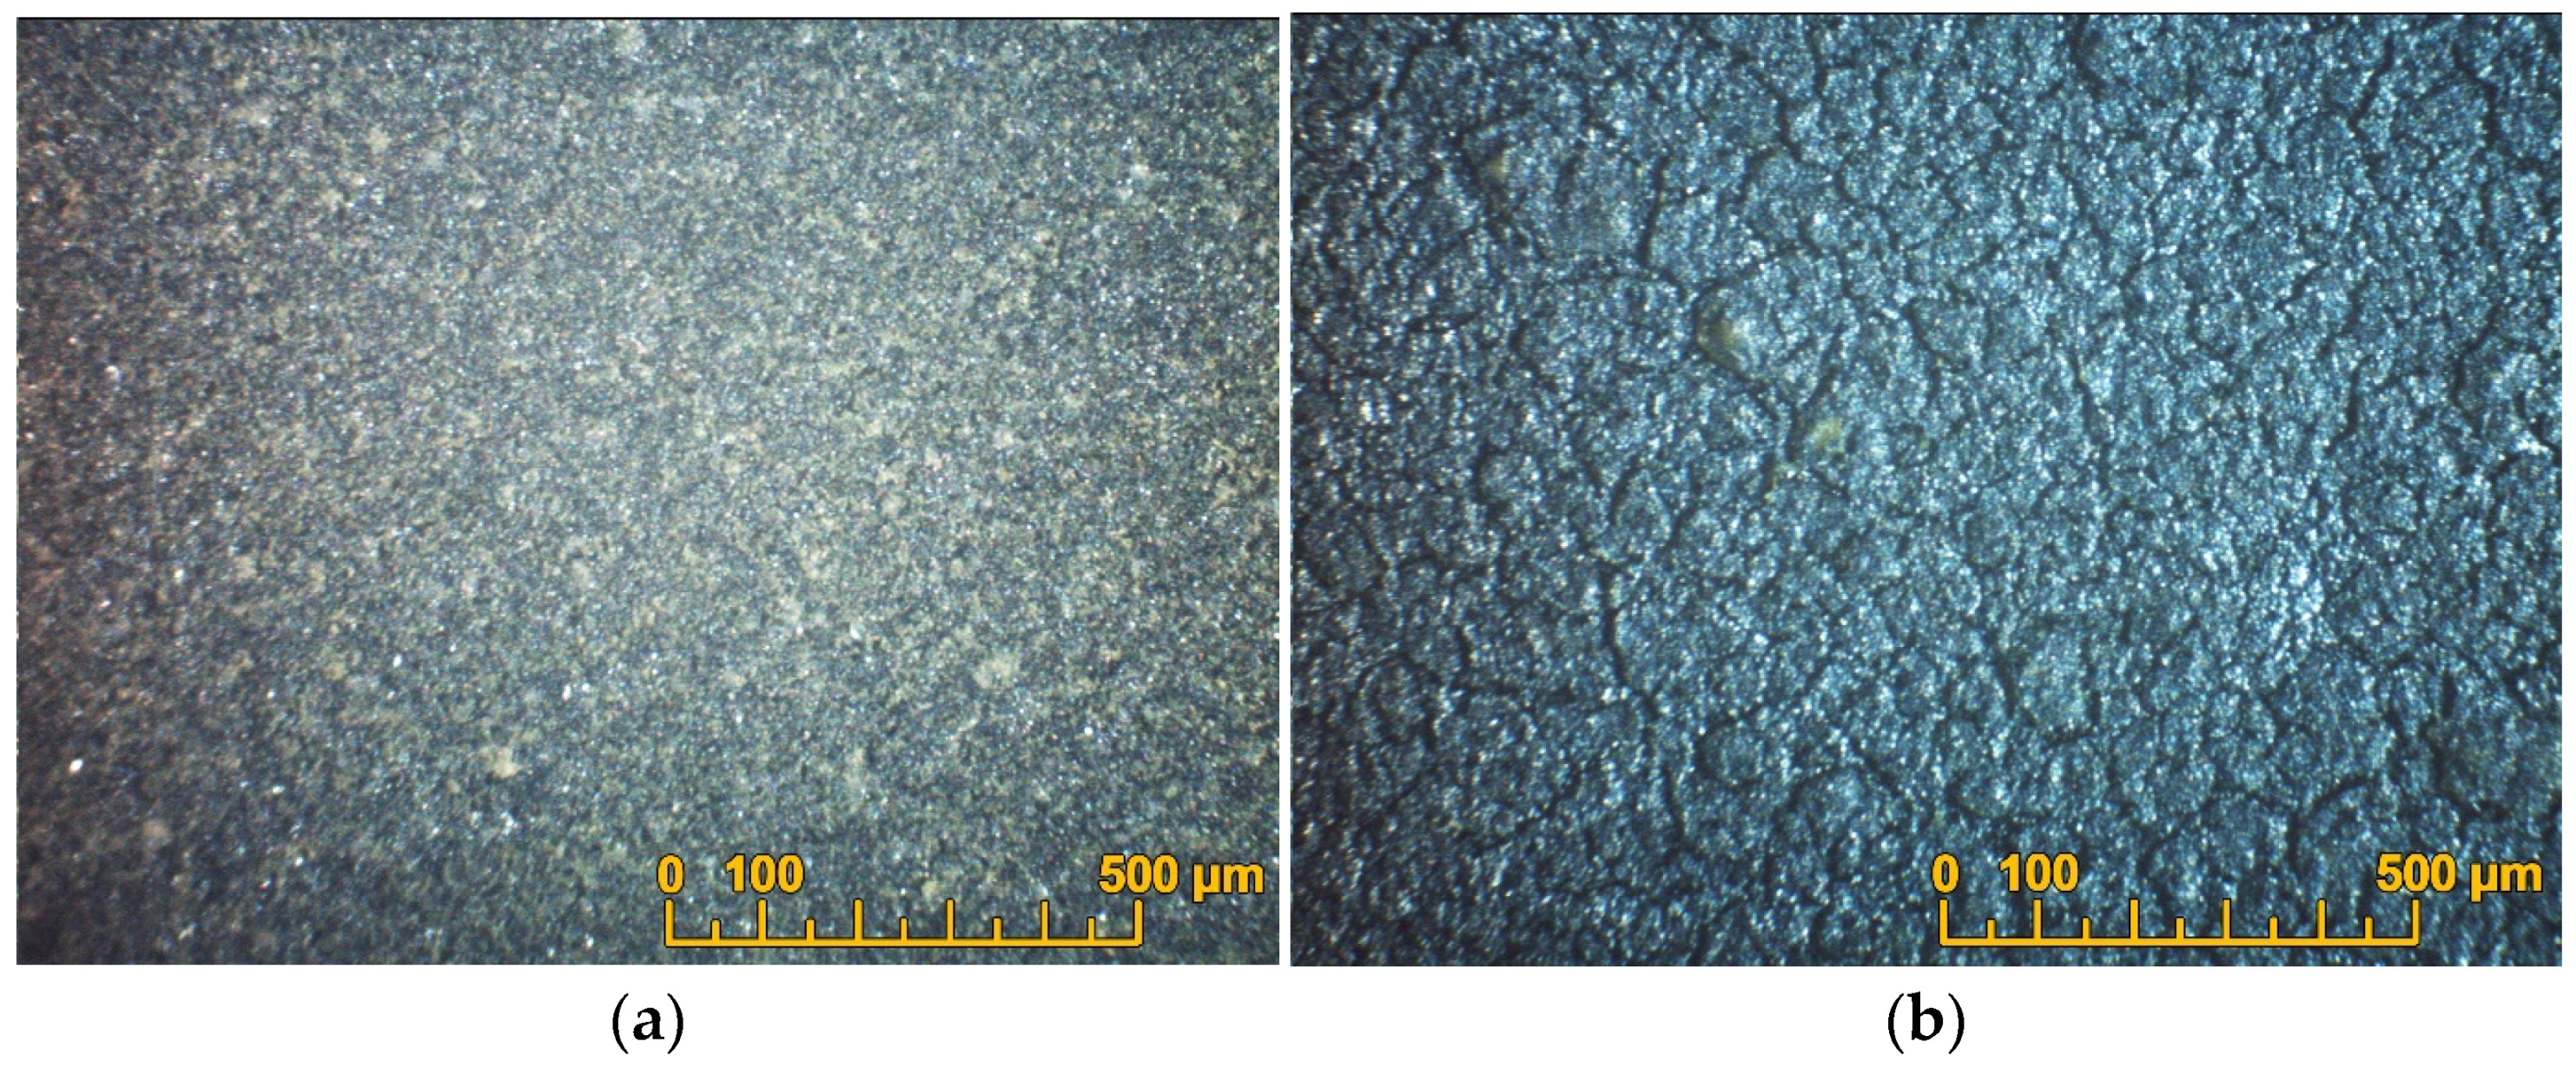
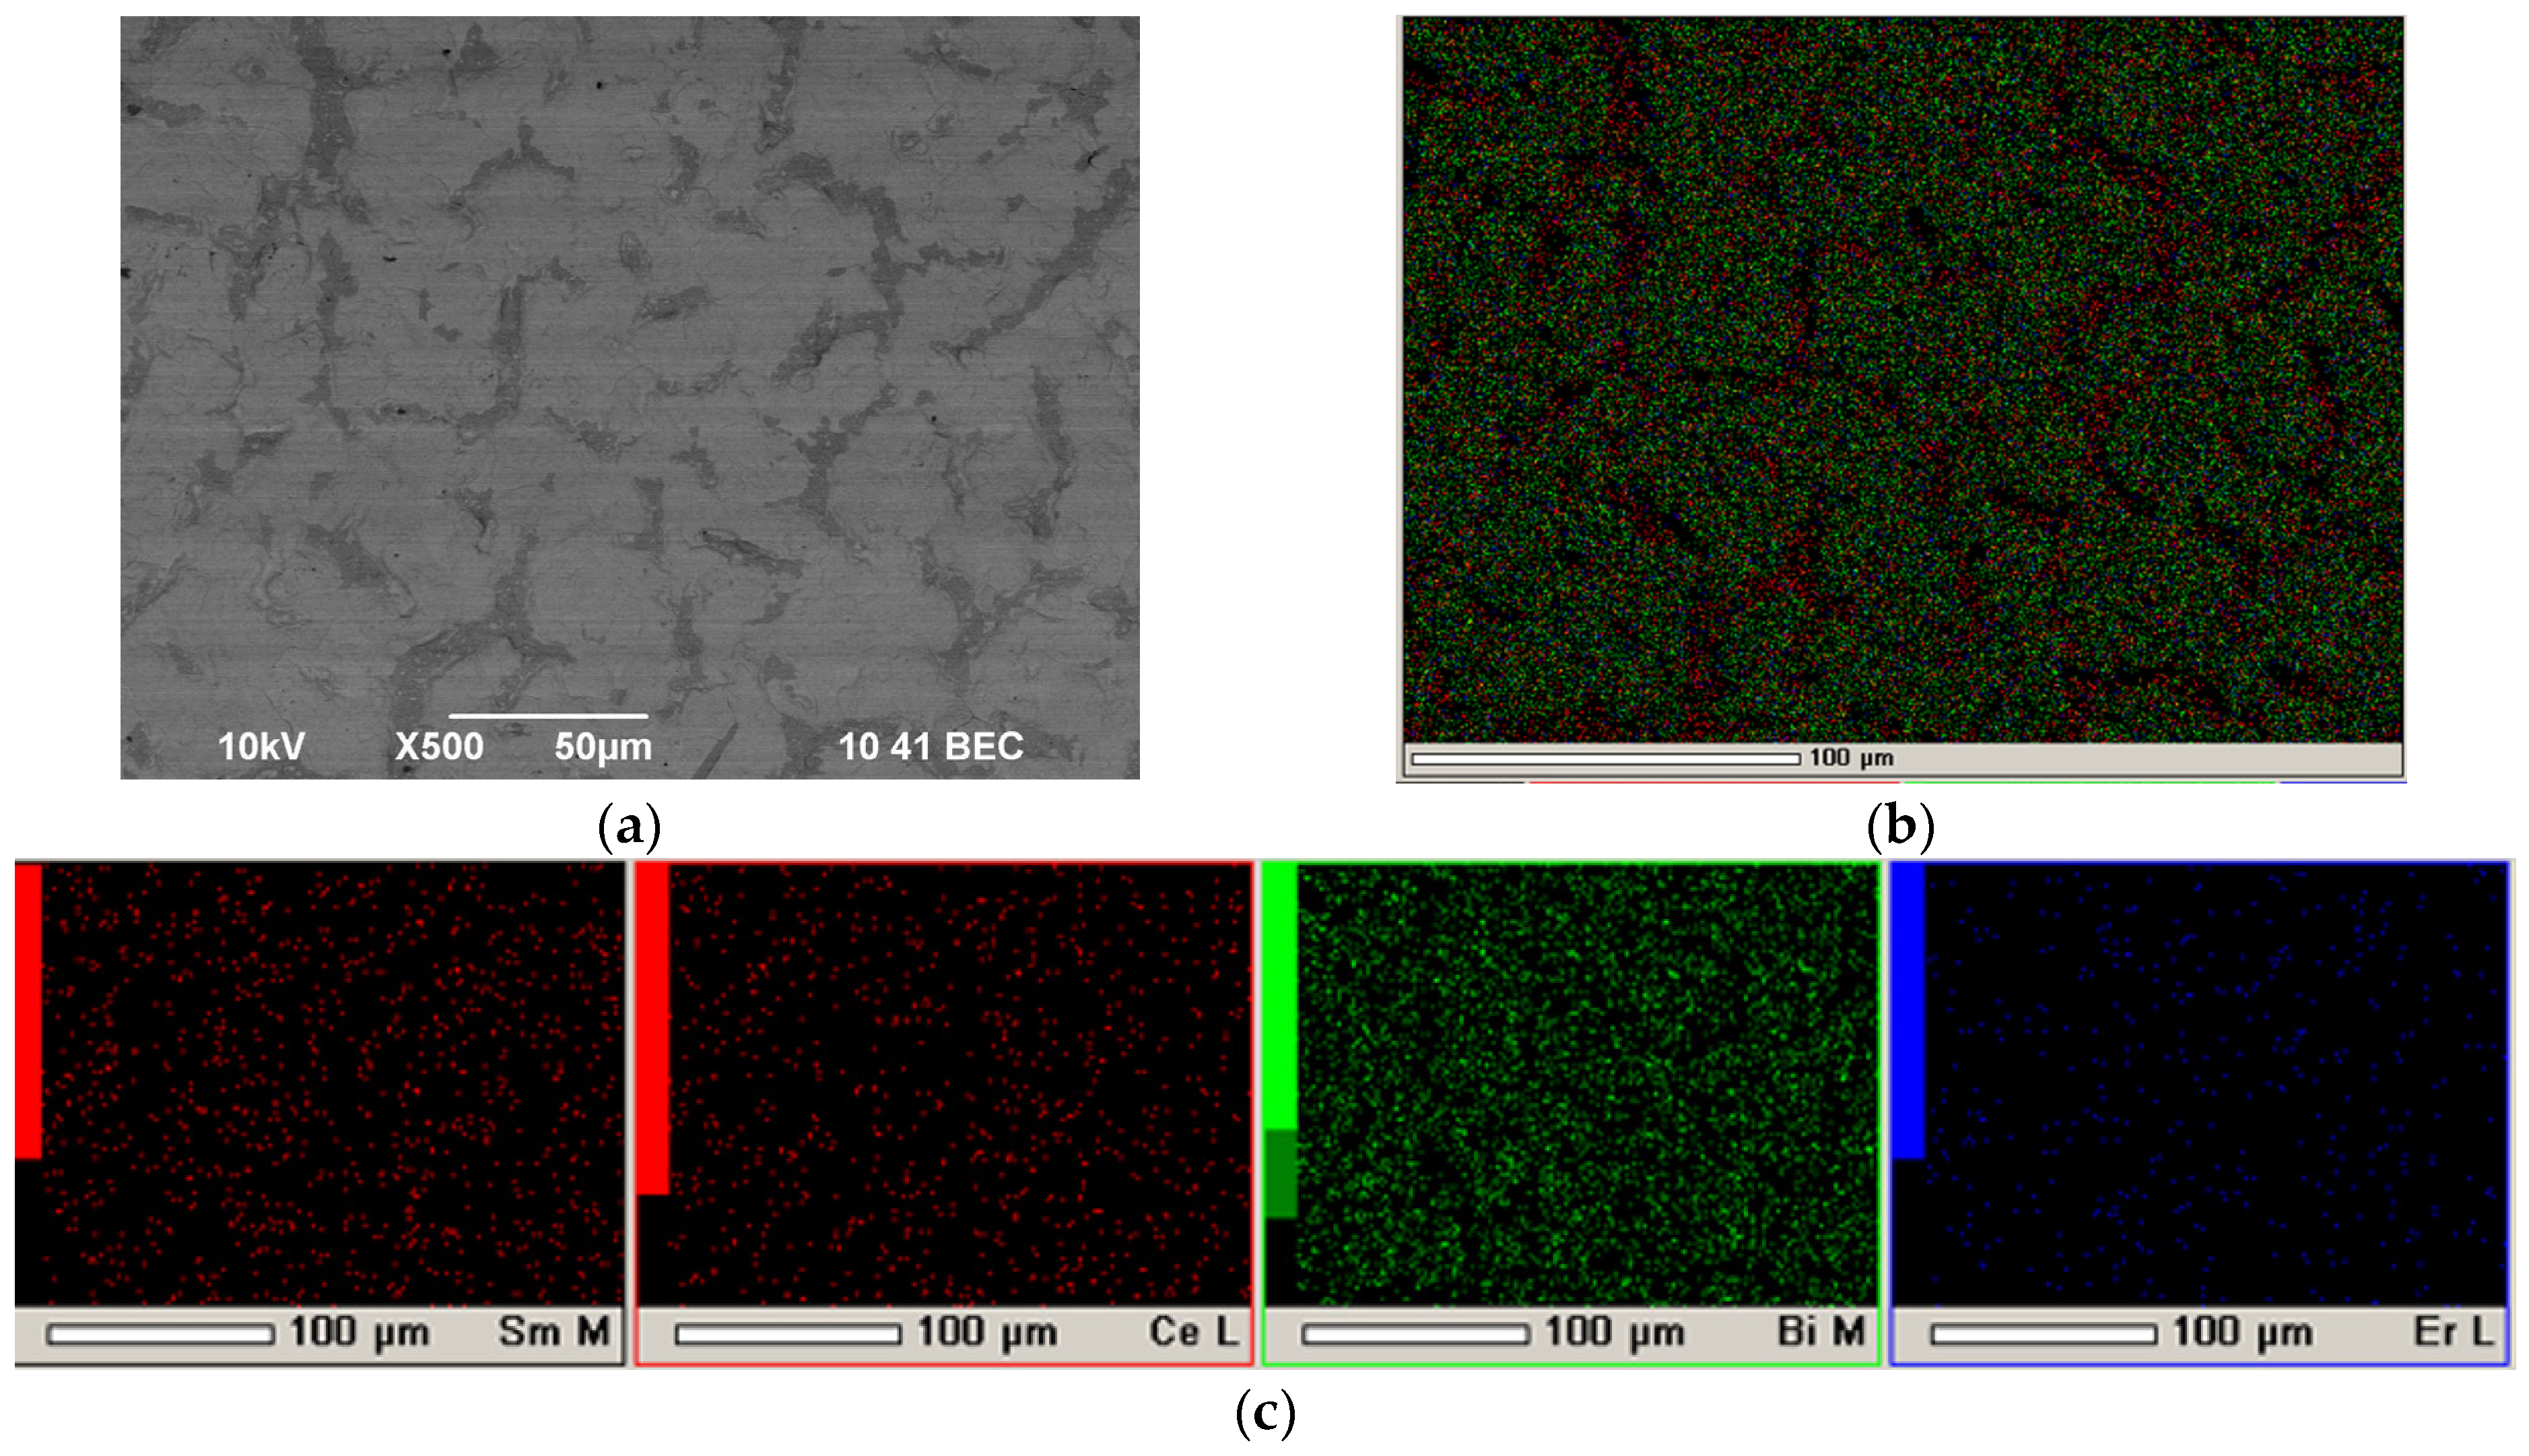
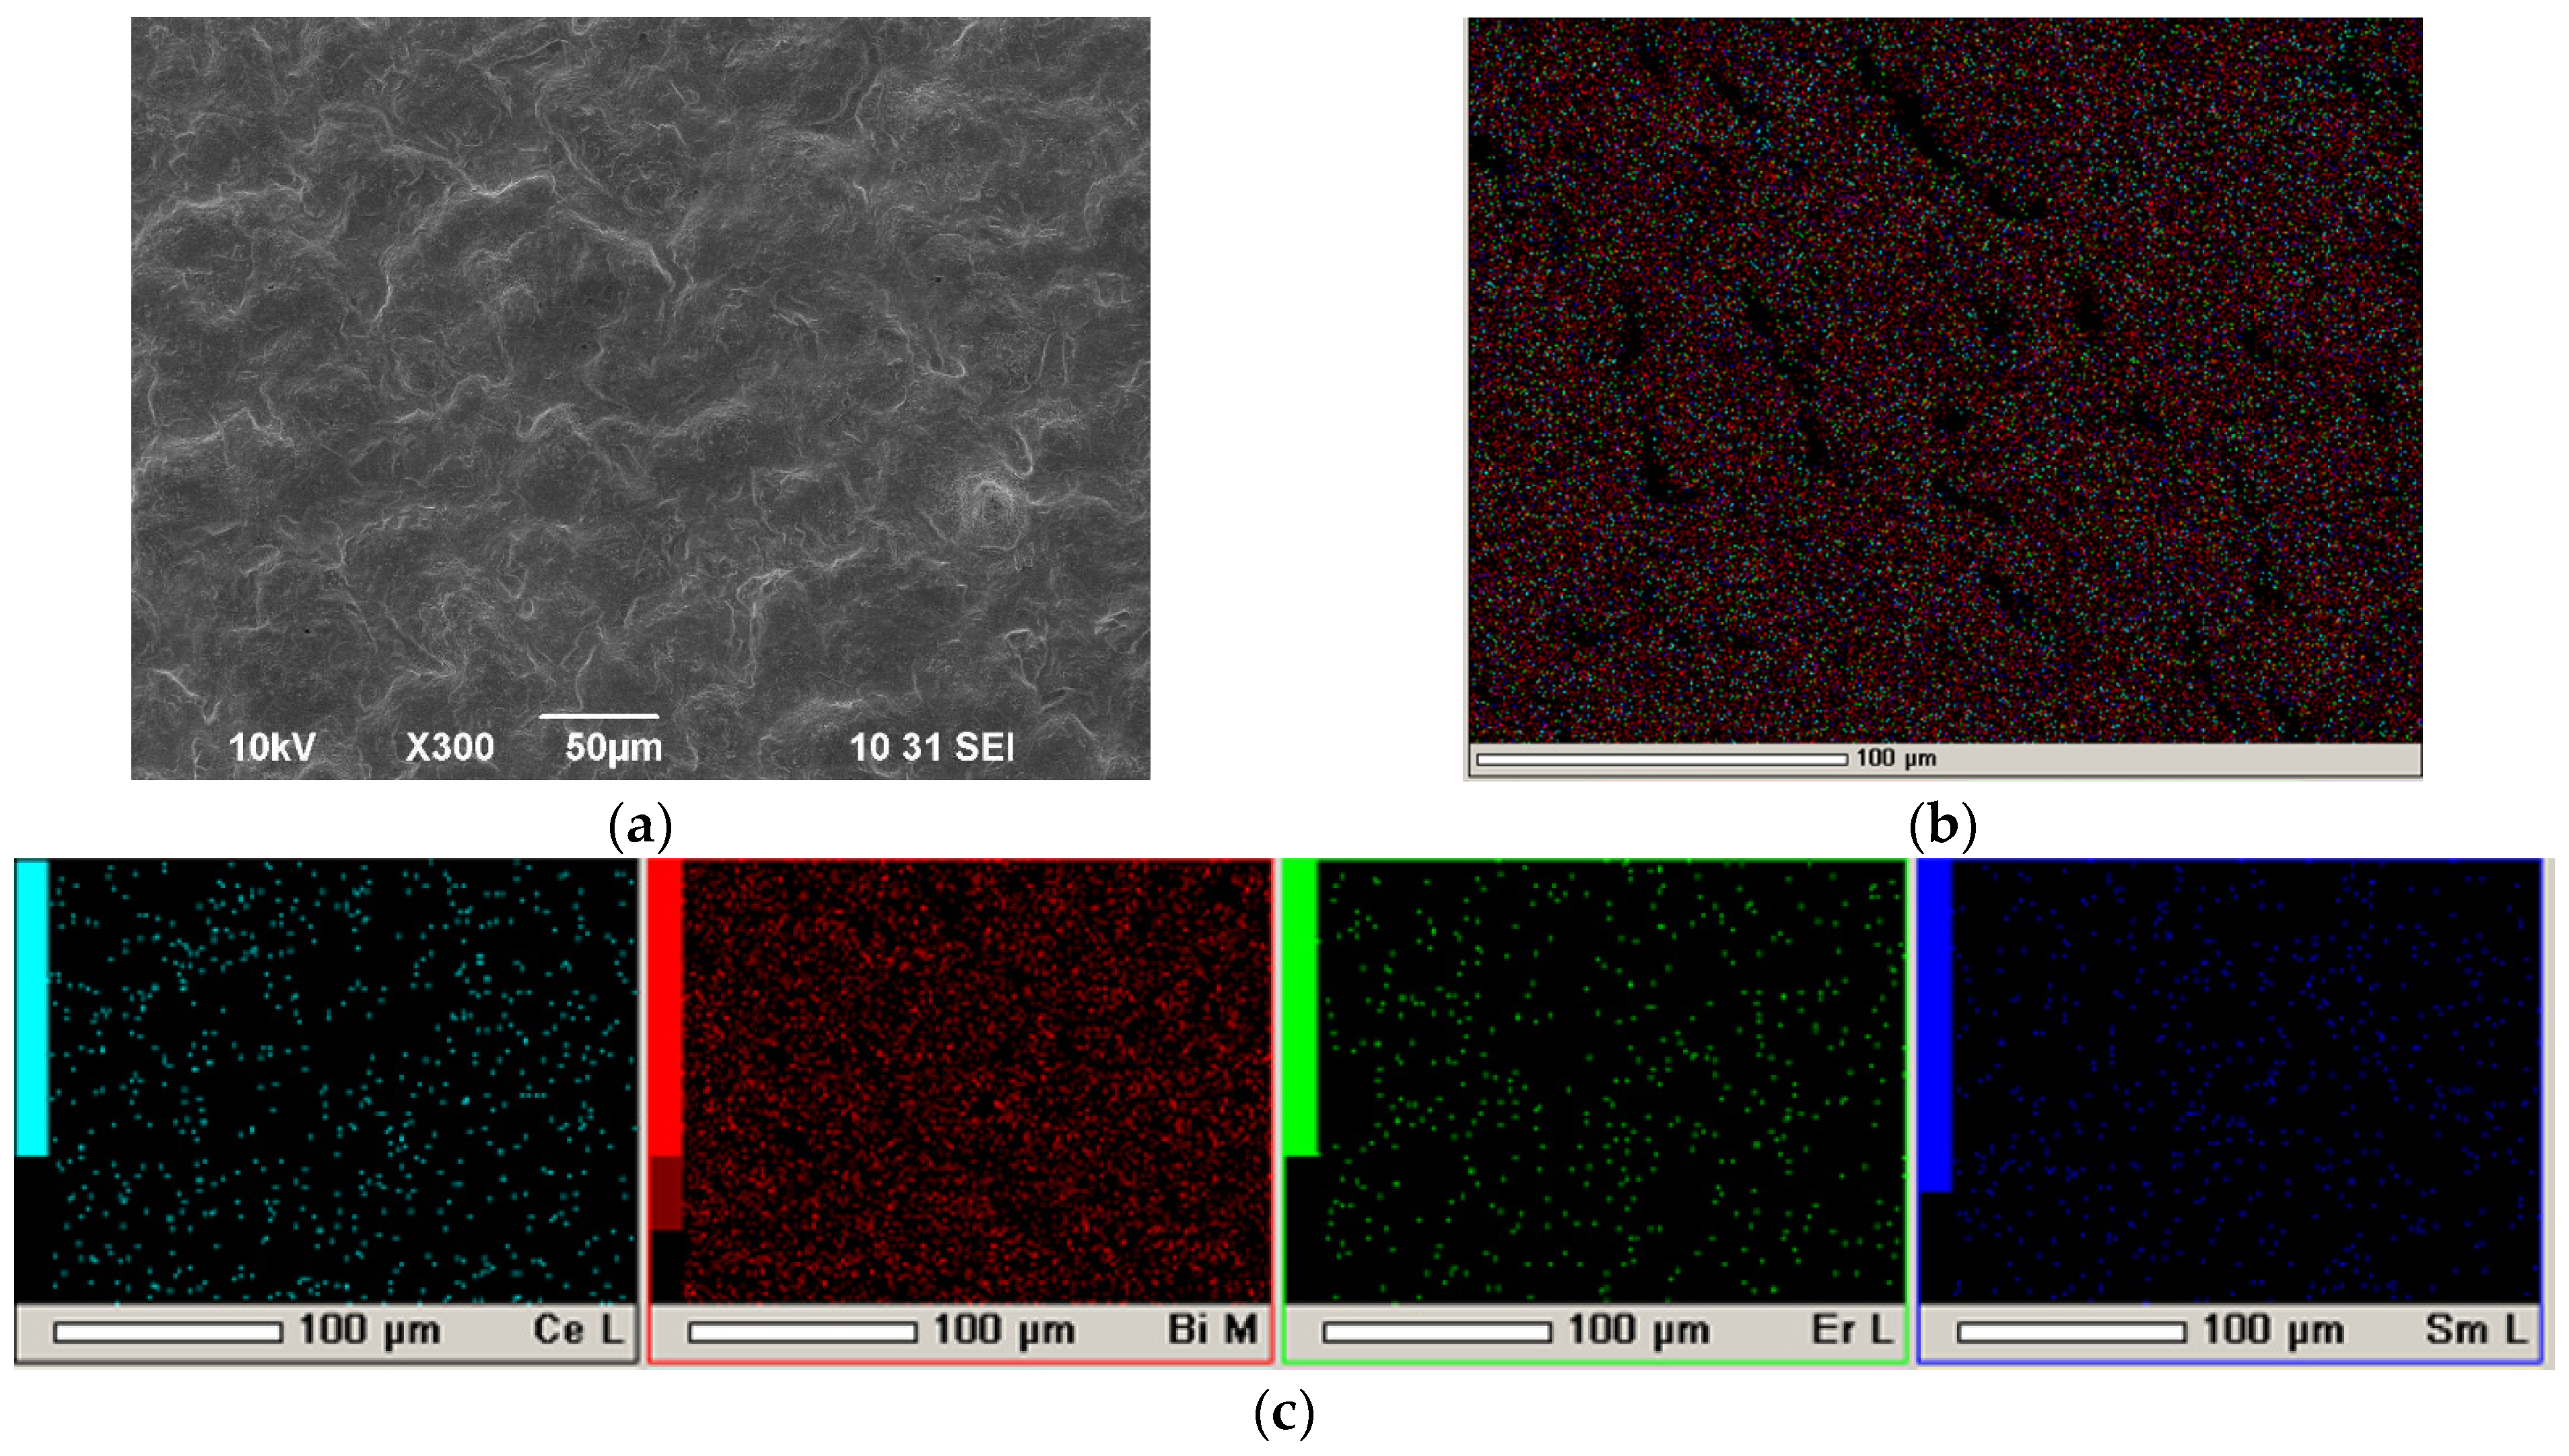
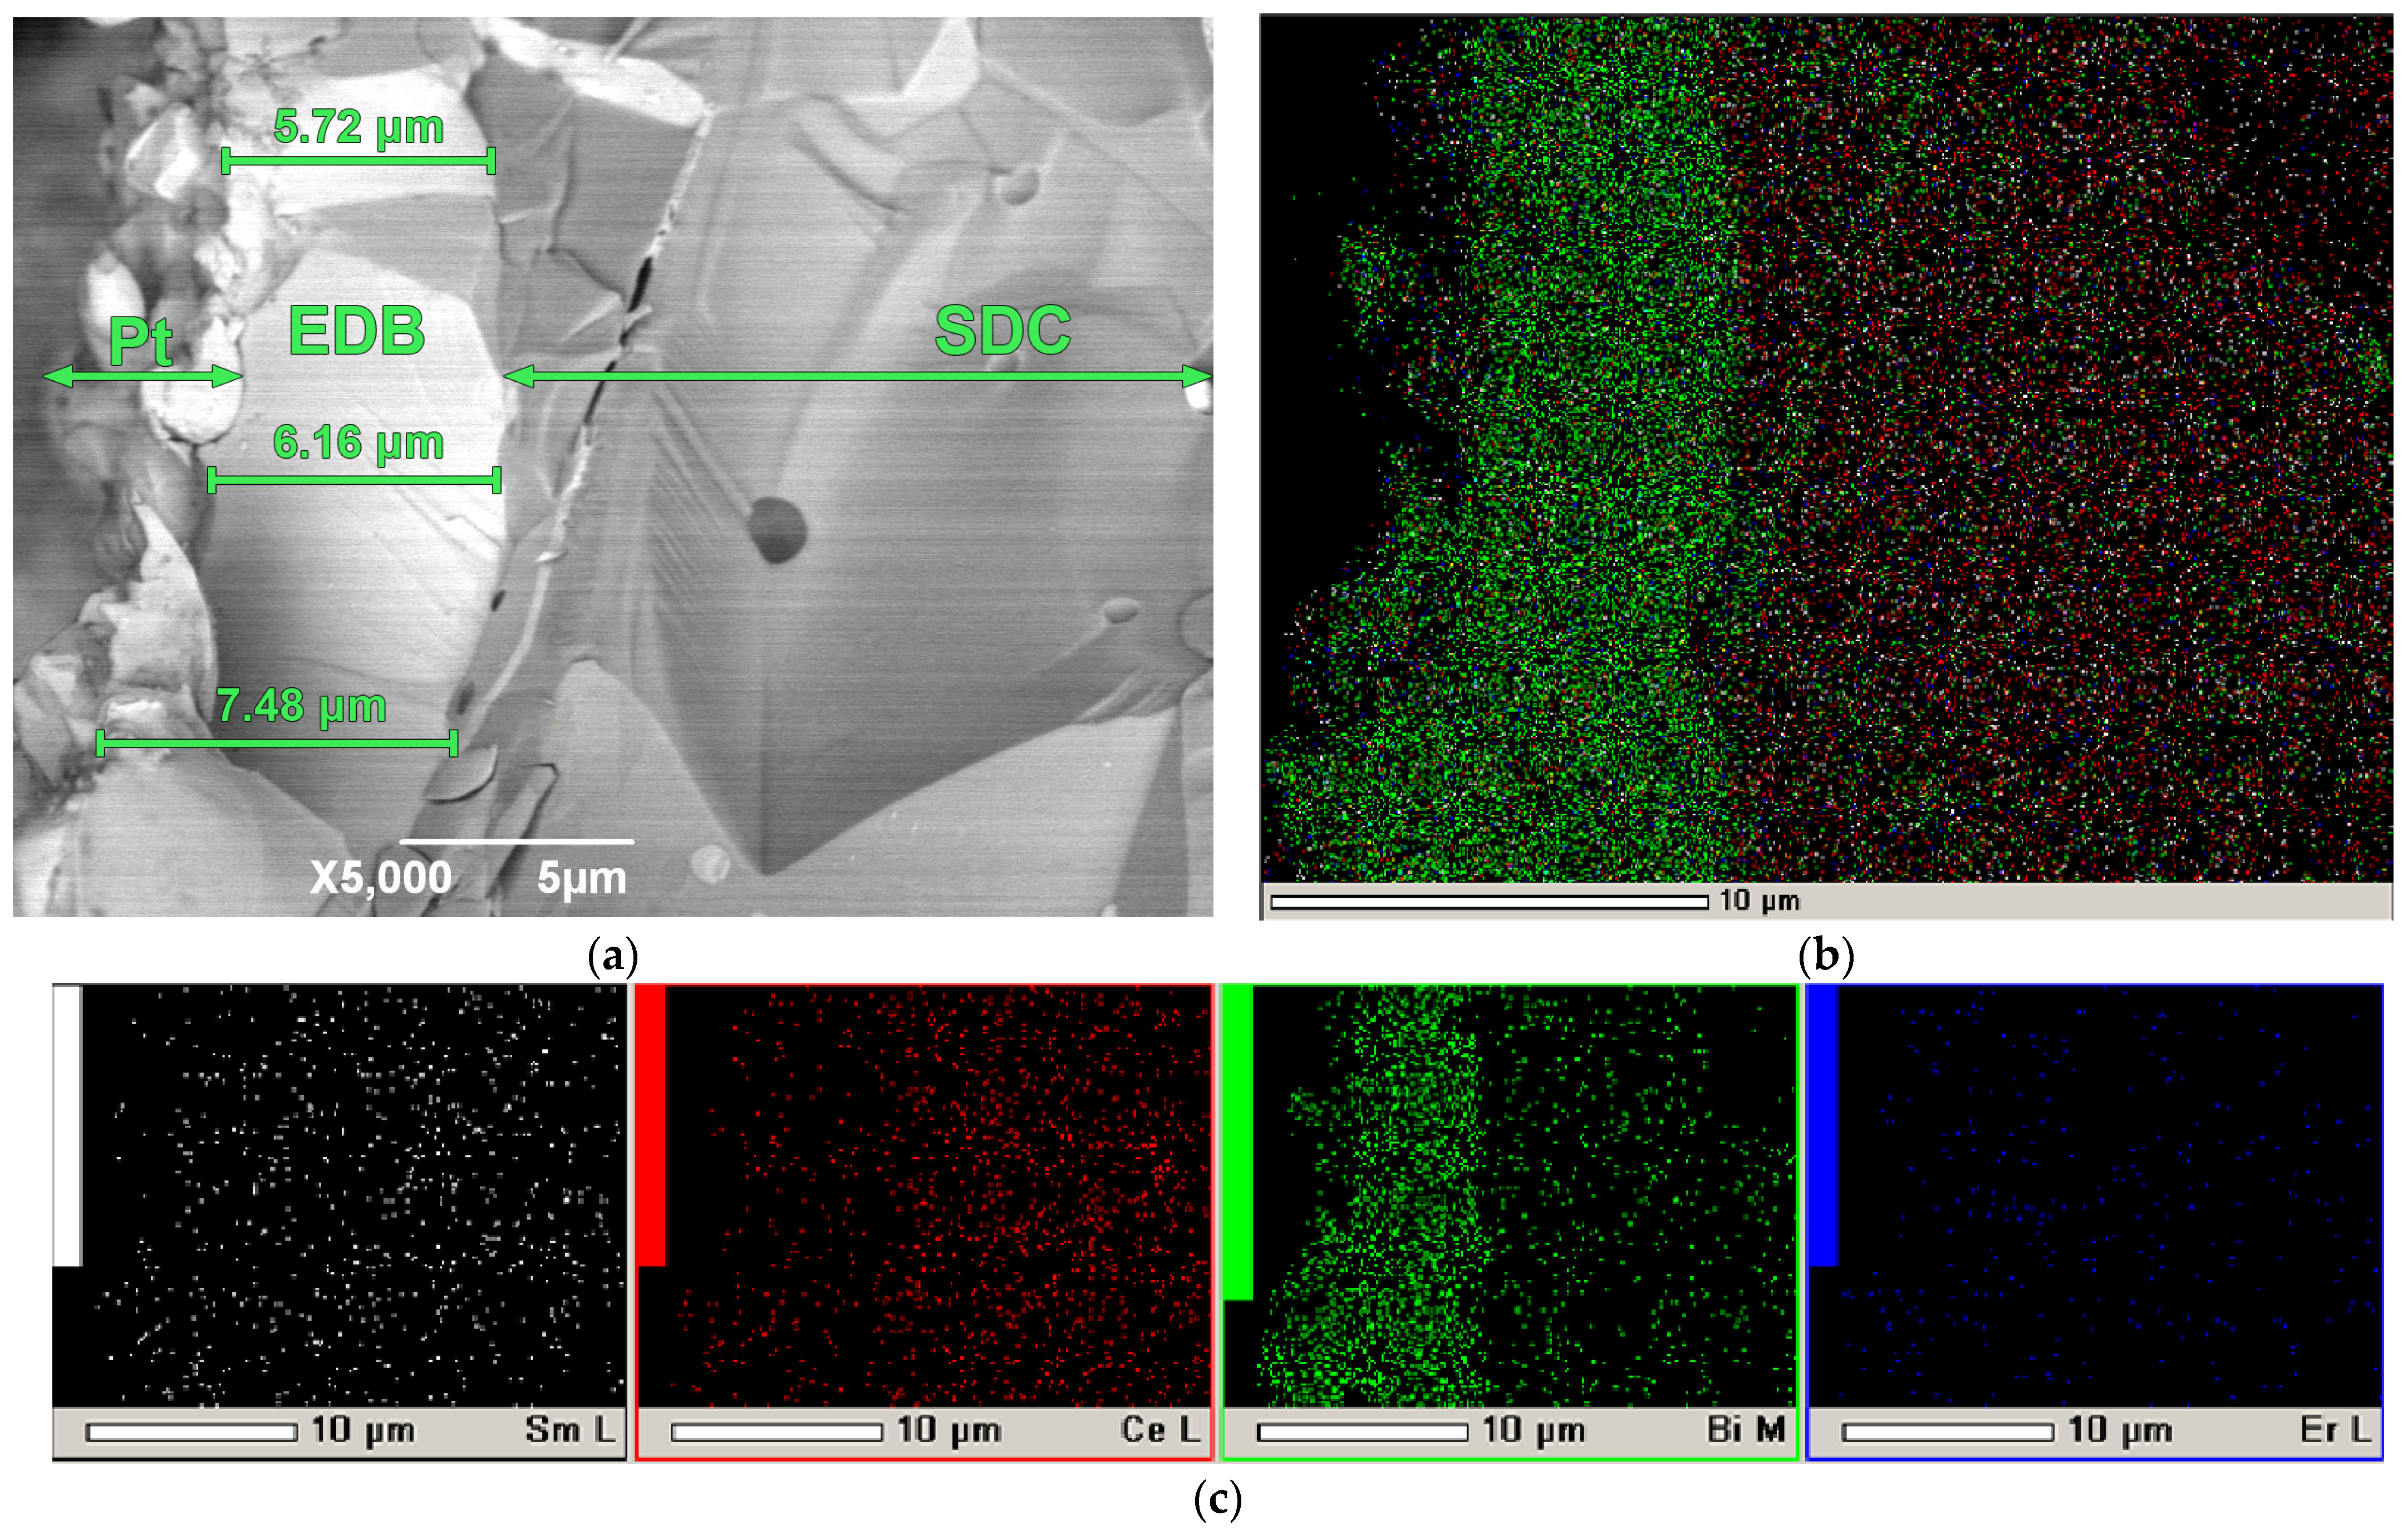
3.6. Microstructural Characterization of the SDC/EDB Electrolyte after Testing in the SOFC Mode

Figure 13 shows the SEM image of a Pt/SDC/EDB/Pt cell after testing in the SOFC mode. As shown in Figure 13a, the EDB layer has a dense sintered structure, and the layer thickness is in the range of 5–7 µm, which is lower than the calculated one. Good adhesion between the EDB layer and the SDC substrate should be noted, and this was maintained after three days of testing. Diffusion of bismuth cations was observed in the bulk of the SDC substrate. The inhomogeneity of the EDB layer may be related to its partial evaporation during the sintering process as well as baking of the Pt electrodes. However, the effect of the EDB layer manifested itself on the conductivity and power characteristics of the Pt/SDC/EDB/Pt cell (Figure 11 and Figure 12). It should also be noted that the EDB layer obtained using EPD had a superior density compared with Bi-containing coatings obtained with screen-printing [15,20,52]. In general, obtaining dense Bi-containing layers is a challenging task, which can mainly be realized through complicated physical methods such as PLD and magnetron sputtering [20]. In this sense, a simple and inexpensive method of electrophoretic deposition offers undoubted advantages.

4. Conclusions

In the present work, we studied the electrophoretic formation of an EDB electron-blocking coating on a supporting SDC electrolyte using a sublayer of a conductive polymer, polypyrrole. A variant of preparing a suspension of EDB powder based on isopropanol with small additions of polyethyleneimine (PEI, 0.26 g/L) and acetylacetone (0.15 g/L) is proposed to obtain continuous EPD coatings and eliminate cracking of the coatings after sintering at a temperature of 850 °C for 5 h. The electrokinetic properties of suspensions based on the EDB powder were studied. A non-sintered electrophoretically deposited EDB coating with a thickness of 12 µm was obtained; after sintering (850 °C, 5 h), the thickness of the EDB coating was 5–7 µm. The EDB coating was characterized by a dense sintered structure, the absence of pores, and good adhesion to the SDC substrate, including after testing in the SOFC mode for three days. Inhomogeneity in the thickness of the EDB coating after sintering was noted due to the partial evaporation of bismuth oxide. On the fabricated Pt/SDC/EDB/Pt SOFC cell, a monotonic increase in the maximum specific power with an increase in temperature up to 850 °C was noted. Therefore, the applied electron-blocking EDB layer decreased the effect of CeO2 reduction from the anode side at high temperatures on the cell performance. The MPD values were 12.6, 58.9, 101.2, 187.3, and 293.2 mW cm−2 at temperatures of 600, 700, 750, 800, and 850 °C, respectively. The OCV values of the cell were not high; namely, they were in the range of 725–750 mV at temperatures of 600–850 °C. We suppose that such low values are due to high electrode polarization and can be improved by using electrodes that are highly active at lower temperatures. Measurements of the Pt/SDC/EDB/Pt cell showed that the conductivity in the SOFC mode decreased with respect to the Pt/SDC/Pt cell due to the blocking effect of the EDB layer. However, in air, the conductivity of the Pt/SDC/EDB/Pt cell was higher due to higher conductivity of the EDB layer. The results obtained within the framework of this study revealed that the EPD method can be considered as a promising technology for the formation of barrier layers based on highly conductive doped bismuth oxide, such as in SOFC technology, as well as in other application fields.

Author Contributions

Conceptualization, E.K. and E.P.; methodology, E.K.; software, E.P.; validation, E.K., L.E. and E.P.; investigation, E.K. and L.E.; resources, L.E.; data curation, E.K. and E.P.; writing—original draft preparation, E.K.; writing—review and editing, E.P.; visualization, E.K. and L.E.; supervision, E.P.; project administration, E.K. All authors have read and agreed to the published version of the manuscript.

Funding

This research received no external funding.

Institutional Review Board Statement

Not applicable.

Informed Consent Statement

Not applicable.

Data Availability Statement

The original contributions presented in this study are included in the article; further inquiries can be directed to the corresponding author.

Acknowledgments

The XRD studies were performed using the facilities of the Ural-M collective center (IMET UB RAS, Yekaterinburg, Russia). The authors are grateful to Sergey Pikalov (IMET UB RAS) and Elena Filonova (Ural Federal University, Yekaterinburg, Russia) for the XRD data treatment. The SEM studies were performed using the facilities of the ISSC UB RAS shared-access center (Yekaterinburg, Russia). The authors acknowledge Kirill Shubin (IHTE UB RAS, Yekaterinburg, Russia) for the electrochemical experiments.

Conflicts of Interest

The authors declare no conflict of interest.

References

  1. Mendonça, C.; Ferreira, A.; Santos, D.M.F. Towards the Commercialization of Solid Oxide Fuel Cells: Recent Advances in Materials and Integration Strategies. Fuels 2021, 2, 393–419. [Google Scholar] [CrossRef]
  2. Sreedhar, I.; Agarwal, B.; Goyal, P.; Singh, S.A. Recent Advances in Material and Performance Aspects of Solid Oxide Fuel Cells. J. Electroanal. Chem. 2019, 848, 113315. [Google Scholar] [CrossRef]
  3. Singh, B.; Ghosh, S.; Aich, S.; Roy, B. Low Temperature Solid Oxide Electrolytes (LT-SOE): A Review. J. Power Sources 2017, 339, 103–135. [Google Scholar] [CrossRef]
  4. Arunkumar, P.; Meena, M.; Babu, K.S. A Review on Cerium Oxide-Based Electrolytes for ITSOFC. Nanomater. Energy 2012, 1, 288–305. [Google Scholar] [CrossRef]
  5. Pikalova, E.Y.; Kalinina, E.G. Solid Oxide Fuel Cells Based on Ceramic Membranes with Mixed Conductivity: Improving Efficiency. Russ. Chem. Rev. 2021, 90, 703–749. [Google Scholar] [CrossRef]
  6. Azad, A.M.; Larose, S.; Akbar, S.A. Bismuth Oxide-Based Solid Electrolytes for Fuel Cells. J. Mater. Sci. 1994, 29, 4135–4151. [Google Scholar] [CrossRef]
  7. Jeong, I.; Jeong, S.J.; Yun, B.-H.; Lee, J.-W.; Lee, C.-W.; Jung, W.; Lee, K.T. Physically Driven Enhancement of the Stability of Bi2O3-Based Ionic Conductors via Grain Boundary Engineering. NPG Asia Mater. 2022, 14, 53. [Google Scholar] [CrossRef]
  8. Shri Prakash, B.; Pavitra, R.; Senthil Kumar, S.; Aruna, S.T. Electrolyte Bi-Layering Strategy to Improve the Performance of an Intermediate Temperature Solid Oxide Fuel Cell: A Review. J. Power Sources 2018, 381, 136–155. [Google Scholar] [CrossRef]
  9. Kalinina, E.G.; Pikalova, E.Y. Electrophoretic Deposition of Dense Anode Barrier Layers of Doped ZrO2 and BaCeO3 on a Supporting Ce0.8Sm0.2O2−δ Solid Electrolyte: Problems and Search for Solutions in SOFC Technology. Int. J. Hydrog. Energy, 2023; in press. [Google Scholar] [CrossRef]
  10. Ling, Y.; Wang, X.; Ma, Z.; Wei, K.; Wu, Y.; Khan, M.; Zheng, K.; Shen, S.; Wang, S. Review of Experimental and Modelling Developments for Ceria-Based Solid Oxide Fuel Cells Free from Internal Short Circuits. J. Mater. Sci. 2020, 55, 1–23. [Google Scholar] [CrossRef]
  11. Wachsman, E.D.; Lee, K.T. Lowering the Temperature of Solid Oxide Fuel Cells. Science 2011, 334, 935–939. [Google Scholar] [CrossRef]
  12. Pesaran, A.; Jaiswal, A.; Ren, Y.; Wachsman, E.D. Development of a New Ceria/Yttria-Ceria Double-Doped Bismuth Oxide Bilayer Electrolyte Low-Temperature SOFC with Higher Stability. Ionics 2019, 25, 3153–3164. [Google Scholar] [CrossRef]
  13. Concha-Balderrama, A.; Martinez-Rodriguez, H.A.; Rojas-George, G.; Esparza-Ponce, H.E.; Orozco-Carmona, V.; Pizá-Ruiz, P.; Bocanegra-Bernal, M.H.; Reyes-Rojas, A. Enhanced Ionic Transport and Compressive Residual Stress in Er-Doped Bi2O3 with Lower Er3+ Concentrations. J. Electron. Mater. 2018, 47, 5422–5432. [Google Scholar] [CrossRef]
  14. Wachsman, E.D.; Jayaweera, P.; Jiang, N.; Lowe, D.M.; Pound, B.G. Stable High Conductivity Ceria/Bismuth Oxide Bilayered Electrolytes. J. Electrochem. Soc. 1997, 144, 233–236. [Google Scholar] [CrossRef]
  15. Leng, Y.J. Development of YDB/GDC Composite Electrolyte For Low-Temperature Solid Oxide Fuel Cells. ECS Proc. Vol. 2005, 2005–2007, 1110–1116. [Google Scholar] [CrossRef]
  16. Park, J.-Y.; Wachsman, E.D. Stable and High Conductivity Ceria/Bismuth Oxide Bilayer Electrolytes for Lower Temperature Solid Oxide Fuel Cells. Ionics 2006, 12, 15–20. [Google Scholar] [CrossRef] [Green Version]
  17. Duan, N.; Ma, J.; Li, J.; Yan, D.; Chi, B.; Pu, J.; Li, J. High Performance Cathode-Unsintered Solid Oxide Fuel Cell Enhanced by Porous Bi1.6Er0.4O3 (ESB) Interlayer. Int. J. Hydrog. Energy 2018, 43, 12713–12719. [Google Scholar] [CrossRef]
  18. Lee, J.G.; Park, M.G.; Yoon, H.H.; Shul, Y.G. Application of GDC-YDB Bilayer and LSM-YDB Cathode for Intermediate Temperature Solid Oxide Fuel Cells. J. Electroceram. 2013, 31, 231–237. [Google Scholar] [CrossRef]
  19. Zhang, L.; Xia, C.; Zhao, F.; Chen, F. Thin Film Ceria–Bismuth Bilayer Electrolytes for Intermediate Temperature Solid Oxide Fuel Cells with La0.85Sr0.15MnO3−δ–Y0.25Bi0.75O1.5 Cathodes. Mater. Res. Bull. 2010, 45, 603–608. [Google Scholar] [CrossRef]
  20. Ahn, J.S.; Camaratta, M.A.; Pergolesi, D.; Lee, K.T.; Yoon, H.; Lee, B.W.; Jung, D.W.; Traversa, E.; Wachsman, E.D. Development of High Performance Ceria/Bismuth Oxide Bilayered Electrolyte SOFCs for Lower Temperature Operation. J. Electrochem. Soc. 2010, 157, B376. [Google Scholar] [CrossRef]
  21. Pikalova, E.Y.; Kalinina, E.G. Place of Electrophoretic Deposition among Thin-Film Methods Adapted to the Solid Oxide Fuel Cell Technology: A Short Review. Int. J. EQ 2019, 4, 1–27. [Google Scholar] [CrossRef] [Green Version]
  22. Pikalova, E.Y.; Kalinina, E.G. Electrophoretic Deposition in the Solid Oxide Fuel Cell Technology: Fundamentals and Recent Advances. Renew. Sust. Energy Rev. 2019, 116, 109440. [Google Scholar] [CrossRef]
  23. Kalinina, E.G.; Pikalova, E.Y. New Trends in the Development of Electrophoretic Deposition Method in the Solid Oxide Fuel Cell Technology: Theoretical Approaches, Experimental Solutions and Development Prospects. Russ. Chem. Rev. 2019, 88, 1179–1219. [Google Scholar] [CrossRef]
  24. Guo, X.; Li, X.; Lai, C.; Li, W.; Zhang, D.; Xiong, Z. Cathodic Electrophoretic Deposition of Bismuth Oxide (Bi2O3) Coatings and Their Photocatalytic Activities. Appl. Surf. Sci. 2015, 331, 455–462. [Google Scholar] [CrossRef]
  25. Liang, T.; Guo, X. Remarkably Facile Preparation of Superhydrophobic Functionalized Bismuth Trioxide (Bi2O3) Coatings. Appl. Sci. 2019, 9, 2653. [Google Scholar] [CrossRef] [Green Version]
  26. Megnin, C. Electrophoretic Deposition of BiVO₄ Layers on FTO Substrates for Photo Electro-chemical Cells. Ceramics-Silikaty 2019, 63, 124–130. [Google Scholar] [CrossRef]
  27. Chahkandi, M.; Zargazi, M. New Water Based EPD Thin BiVO4 Film: Effective Photocatalytic Degradation of Amoxicillin Antibiotic. J. Hazard. Mater. 2020, 389, 121850. [Google Scholar] [CrossRef]
  28. Joh, D.W.; Park, J.H.; Kim, D.Y.; Yun, B.-H.; Lee, K.T. High Performance Zirconia-Bismuth Oxide Nanocomposite Electrolytes for Lower Temperature Solid Oxide Fuel Cells. J. Power Sources 2016, 320, 267–273. [Google Scholar] [CrossRef]
  29. Park, J.W.; Joh, D.W.; Yun, B.-H.; Samdani, K.J.; Lee, K.T. Development of Nanostructured La0.8Sr0.2MnO3−δ-Er0.4Bi1.6O3 Cathodes via an Infiltration Process with Different Polymeric Agents for Intermediate Temperature Solid Oxide Fuel Cells. Int. J. Hydrog. Energy 2017, 42, 6332–6337. [Google Scholar] [CrossRef]
  30. Wang, Z.; Sun, H.; Li, J.; Guo, X.; Hu, Q.; Yang, Z.; Yu, F.; Li, G. Modified La0.6Sr0.4Co0.2Fe0.8O3−δ Cathodes with the Infiltration of Er0.4Bi1.6O3 for Intermediate-Temperature Solid Oxide Fuel Cells. Int. J. Hydrog. Energy 2021, 46, 22932–22941. [Google Scholar] [CrossRef]
  31. Sadykov, V.; Usoltsev, V.; Yeremeev, N.; Mezentseva, N.; Pelipenko, V.; Krieger, T.; Belyaev, V.; Sadovskaya, E.; Muzykantov, V.; Fedorova, Y.; et al. Functional Nanoceramics for Intermediate Temperature Solid Oxide Fuel Cells and Oxygen Separation Membranes. J. Europ. Ceram. Soc. 2013, 33, 2241–2250. [Google Scholar] [CrossRef]
  32. Li, J.; Wang, S.; Wang, Z.; Liu, R.; Wen, T.; Wen, Z. La0.84Sr0.16MnO3−δ Cathodes Impregnated with Bi1.4Er0.6O3 for Intermediate-Temperature Solid Oxide Fuel Cells. J. Power Sources 2009, 194, 625–630. [Google Scholar] [CrossRef]
  33. Mukasyan, A.S.; Epstein, P.; Dinka, P. Solution Combustion Synthesis of Nanomaterials. Proc. Combust. Inst. 2007, 31, 1789–1795. [Google Scholar] [CrossRef]
  34. Rodríguez-Carvajal, J. Recent Developments of the Program FULLPROF, in Commission on Powder Diffraction (IUCr). Newsletter 2001, 26, 12–19. Available online: http://journals.iucr.org/iucr-top/comm/cpd/Newsletters (accessed on 1 January 2023).
  35. Kalinina, E.; Shubin, K.; Pikalova, E. Electrophoretic Deposition and Characterization of the Doped BaCeO3 Barrier Layers on a Supporting Ce0.8Sm0.2O1.9 Solid-State Electrolyte. Membranes 2022, 12, 308. [Google Scholar] [CrossRef]
  36. Chiodelli, G.; Malavasi, L. Electrochemical Open Circuit Voltage (OCV) Characterization of SOFC Materials. Ionics 2013, 19, 1135–1144. [Google Scholar] [CrossRef]
  37. Cobaner, S.; Yilmaz, S. Electrical and Structural Properties of New Type Er and Yb Doped Bismuth Oxide Solid Electrolytes Synthesized by Pechini Method. J. Electroceram. 2021, 46, 83–92. [Google Scholar] [CrossRef]
  38. Arasteh, S.; Maghsoudipour, A.; Alizadeh, M.; Nemati, A. Effect of Y2O3 and Er2O3 Co-Dopants on Phase Stabilization of Bismuth Oxide. Ceram. Int. 2011, 37, 3451–3455. [Google Scholar] [CrossRef]
  39. Kirillov, S.A. Surface Area and Pore Volume of a System of Particles as a Function of Their Size and Packing. Micropor. Mesopor. Mater. 2009, 122, 234–239. [Google Scholar] [CrossRef]
  40. Kalinina, E.; Ivanov, M. The Electrophoretic Deposition of Nanopowders Based on Yttrium Oxide for Bulk Ceramics Fabrication. Inorganics 2022, 10, 243. [Google Scholar] [CrossRef]
  41. Hosomi, T.; Matsuda, M.; Miyake, M. Electrophoretic Deposition for Fabrication of YSZ Electrolyte Film on Non-Conducting Porous NiO–YSZ Composite Substrate for Intermediate Temperature SOFC. J. Europ. Ceram. Soc. 2007, 27, 173–178. [Google Scholar] [CrossRef]
  42. Azarian Borojeni, I.; Raissi, B.; Maghsoudipour, A.; Kazemzad, M.; Talebi, T. Fabrication of Solid Oxide Fuel Cells (SOFCs) Electrolytes by Electrophoretic Deposition (EPD) and Optimizing the Process. KEM 2015, 654, 83–87. [Google Scholar] [CrossRef]
  43. Suarez, G.; Nguyen, N.T.K.; Rendtorff, N.M.; Sakka, Y.; Uchikoshi, T. Electrophoretic Deposition for Obtaining Dense Lanthanum Silicate Oxyapatite (LSO). Ceram. Inter. 2016, 42, 19283–19288. [Google Scholar] [CrossRef]
  44. Kalinina, E.G.; Pikalova, E.Y. Formation of a Single- and Two-Layer Solid Electrolyte by Electrophoresis on Anodic Substrates Metalized with Silver or Platinum. Russ. J. Phys. Chem. 2022, 96, 2763–2773. [Google Scholar] [CrossRef]
  45. Suzuki, H.T.; Uchikoshi, T.; Kobayashi, K.; Suzuki, T.S.; Sugiyama, T.; Furuya, K.; Matsuda, M.; Sakka, Y.; Munakata, F. Fabrication of GDC/LSGM/GDC Tri-Layers on Polypyrrole-Coated NiO-YSZ by Electrophoretic Deposition for Anode-Supported SOFC. J. Ceram. Soc. Jpn. 2009, 117, 1246–1248. [Google Scholar] [CrossRef] [Green Version]
  46. Das, D.; Basu, R.N. Electrophoretic Deposition of Zirconia Thin Film on Nonconducting Substrate for Solid Oxide Fuel Cell Application. J. Am. Ceram. Soc. 2014, 97, 3452–3457. [Google Scholar] [CrossRef]
  47. Uchikoshi, T.; Furumi, S.; Shirahata, N.; Suzuki, T.S.; Sakka, Y. Conductive Polymer Coating on Nonconductive Ceramic Substrates for Use in the Electrophoretic Deposition Process. J. Am. Ceram. Soc. 2008, 91, 1674–1677. [Google Scholar] [CrossRef]
  48. Jaiswal, N.; Tanwar, K.; Suman, R.; Kumar, D.; Upadhyay, S.; Parkash, O. A Brief Review on Ceria Based Solid Electrolytes for Solid Oxide Fuel Cells. J. Alloys Compd. 2019, 781, 984–1005. [Google Scholar] [CrossRef]
  49. Jung, W.C.; Chang, Y.-J.; Fung, K.-Z.; Haile, S. High Electrochemical Activity of Bi2O3-Based Composite SOFC Cathodes. J. Korean Ceram. Soc. 2014, 51, 278–282. [Google Scholar] [CrossRef] [Green Version]
  50. Fang, W.; Yang, T.; Huang, K. In Situ Synthesis of a High-Performance Bismuth Oxide Based Composite Cathode for Low Temperature Solid Oxide Fuel Cells. Chem. Commun. 2019, 55, 2801–2804. [Google Scholar] [CrossRef]
  51. Pikalova, E.; Bogdanovich, N.; Kolchugin, A.; Shubin, K.; Ermakova, L.; Eremeev, N.; Farlenkov, A.; Khrustov, A.; Filonova, E.; Sadykov, V. Development of Composite LaNi0.6Fe0.4O3−δ-Based Air Electrodes for Solid Oxide Fuel Cells with a Thin-Film Bilayer Electrolyte. Int. J. Hydrog. Energy 2021, 46, 16947–16964. [Google Scholar] [CrossRef]
  52. Leng, Y.J.; Chan, S.H. Anode-Supported SOFCs with Y2O3-Doped Bi2O3/Gd2O3-Doped CeO2 Composite Electrolyte Film. Electrochem. Solid-State Lett. 2006, 9, A56–A59. [Google Scholar] [CrossRef]
Figure 1. Observed (points) and calculated (lines) XRD patterns for Bi1.60Er0.4O3 (a) and Ce0.8Sm0.2O1.9 (b) powders.
Coatings 13 01053 g001
Figure 2. SEM image of the EDB electrolyte powder (Tcalc = 700 °C) (SEM image): (a) agglomerates, ×6000; (b) integral map of elements’ distribution; (c) and individual element’s maps.
Coatings 13 01053 g002
Figure 3. Dependences of the thickness of the EDB coating obtained from suspension in the isopropanol/acetylacetone 70/30 vol.% medium on the Ni foil model electrode: (a) at a constant deposition time of 1 min and various voltages; (b) at a fixed voltage of 80 V and various deposition times.
Coatings 13 01053 g003
Figure 4. Optical surface images of the dried EDB coatings obtained from a suspension in an isopropanol/acetylacetone 70/30 vol.% medium on a Ni foil model electrode: (a) at a deposition time of 1 min and a voltage of 80 V; (b) at a deposition time of 1 min and a voltage of 30 V.
Coatings 13 01053 g004
Figure 5. Dependences of the EDB coating thickness, obtained from a suspension in isopropanol with the addition of PEI and acetylacetone, on a Ni foil model electrode: (a) at a constant deposition time of 1 min and various voltages; (b) at a fixed voltage of 80 V and various deposition times.
Coatings 13 01053 g005
Figure 6. The surfaces of dried EDB coatings obtained from a suspension in isopropanol with the addition of PEI and acetylacetone, on a Ni foil model electrode: (a) U= 80 V and t = 2 min; (b) U = 30 V and t = 1 min.
Coatings 13 01053 g006
Figure 7. Optical image of the surface of the sintered coating of the EDB electrolyte (sample EDB-1, Tsint = 850 °C, 5 h), obtained from a suspension in isopropanol/acetylacetone 70/30 vol.%, on a dense SDC substrate: (a) after EDB and sintering the first layer 6 µm thick; (b) after the second cycle of deposition–sintering of the EDB coating with a total thickness of 11 μm.
Coatings 13 01053 g007
Figure 8. SEM image of the surface of the EDB coating (first deposition–sintering cycle) on the SDC substrate (EDB-2 sample, Tsint = 850 °C, 5 h) obtained using EPD from an EDB suspension in isopropanol with PEI and acetylacetone additives: (a) surface, ×500; (b) integral map of elements’ distribution; (c) individual element’s maps.
Coatings 13 01053 g008
Figure 9. SEM image of the surface of the final EDB coating (two deposition–sintering cycles) on the SDC substrate (EDB-2 sample, Tsint = 850 °C, 5 h) obtained using EPD from EDB suspension in isopropanol medium with PEI and acetylacetone additives: (a) surface, ×300; (b) integral map of elements’ distribution; (c) individual element maps.
Coatings 13 01053 g009
Figure 10. Electrochemical characterization of the Pt/SDC/EDB/Pt electrolyte-supported cell: (a) volt-ampere characteristics and cell power density; (b) ohmic and polarization cell resistances measured with the current interruption method.
Coatings 13 01053 g010
Figure 11. Typical spectra collected for the Pt/SDC/EDB/Pt electrolyte-supported cell collected in Aie and SOFC mode: (a) at 800 °C; (b) at 700 °C.
Coatings 13 01053 g011
Figure 12. Arrhenius dependences (this work and [9,15]) of the electrolyte conductivity calculated from EIS data for the cells with the supporting SDC electrolyte with/without electron-blocking layers.
Coatings 13 01053 g012
Figure 13. SEM image of a Pt/SDC/EDB/Pt cell after testing in the SOFC mode: (a) cleavage, ×5000. On the left, the Pt layer is shown, which was the electrode (cathode) during measurements in the SOFC mode; (b) integrated map of elements; (c) individual maps of elements.
Coatings 13 01053 g013
Table 1. Structural characteristics of the EDB and SDC electrolyte materials.
Electrolyte MaterialCrystal Lattice Type, Space GroupLattice Parameters, Å
EDBcubic, Fm-3ma = 5.4960(1)
SDCcubic, Fm-3ma = 5.4324(3)
Table 2. Electrokinetic properties of the EDB suspensions (10 g/L) in various dispersion media: isopropanol/acetylacetone (70/30 vol.%); isopropanol-PEI; isopropanol-PEI-HAcAc.
SuspensionUT, minZeta Potential, mV (pH)
EDB isopropanol/
acetylacetone 70/30 vol.%
5+16 (6.8)
25+19 (6.6)
125+20 (6.2)
EDB isopropanol-PEI125+10 (11.0)
EDB isopropanol-PEI-HAcAc125+9 (10.5)
Table 3. Pt/SDC/EDB/Pt cell characteristics calculated from the EIS data.
TemperatureAir (Anode)/Air (Cathode)Hydrogen (Anode)/Air (Cathode)
Rhf,
Ω cm2
Rp,
Ω cm2
Rhf/(Rhf + Rp)
×100, %
Rhf,
Ω cm2
Rp,
Ω cm2
Rhf/(Rhf + Rp)
×100, %
850---0.210.1558
8000.490.67440.300.3149
7500.701.27360.490.7839
7001.043.41230.831.9630
6501.6820.957---
6002.7295.9332.0812.0916
Disclaimer/Publisher’s Note: The statements, opinions and data contained in all publications are solely those of the individual author(s) and contributor(s) and not of MDPI and/or the editor(s). MDPI and/or the editor(s) disclaim responsibility for any injury to people or property resulting from any ideas, methods, instructions or products referred to in the content.

