Article

Evaluation of the Thickness of Each Layer of Cu/Al Laminate Using Laser Ultrasonic

1
School of Mechanical Engineering, University of Science and Technology Beijing, Beijing 100083, China
2
Shunde Innovation School, University of Science and Technology Beijing, Foshan 528399, China
3
College of Mechanical Engineering, Beijing Institute of Petrochemical Technology, Beijing 102617, China
*
Authors to whom correspondence should be addressed.
Coatings 2023, 13(3), 645; https://doi.org/10.3390/coatings13030645
Submission received: 20 February 2023 / Revised: 11 March 2023 / Accepted: 13 March 2023 / Published: 18 March 2023

Abstract

:
A new method of detecting the thickness of each layer of Cu/Al laminates based on laser ultrasound was proposed for the online non-contact measurement of the thickness of each layer of Cu/Al laminates during the rolling process. This method utilized a laser to excite and detect ultrasounds remotely and then obtains the transit time of the longitudinal wave pulse in the copper layer and aluminum layer to calculate their thicknesses. The finite element method was used for investigating the propagation behavior of longitudinal wave in Cu/Al laminate, and the minimum thickness of the copper layer that can be detected by this method was analyzed. The laser ultrasonic experimental platform was set up in the laboratory, and a sample of Cu/Al laminate with step shape was made. The experimental results demonstrate that the laser ultrasound can realize the non-contact and high-precision detection of the thickness of each layer of Cu/Al laminates and has the potential of online thickness measurement.

1. Introduction

The Cu/Al laminate is a new composite material, with aluminum as the matrix and copper as the cladding. Cu/Al laminates are used extensively in modern industries, such as power, communication, aerospace, etc. [1,2,3]. Due to the uncertainty in the manufacturing process, Cu/Al laminates will inevitably have an uneven distribution of materials, which will affect the stability of product quality. Therefore, it is urgent to accurately measure the thickness of each layer online, so as to realize real-time monitoring of product quality and optimize the rolling process.
Cu/Al laminate is a typical substrate-cladding structure, which is composed of substrate and cladding. The common thickness measurement method for substrate cladding structures is the destructive testing method, which includes metallographic analysis, mechanical gauging, and microscopic measurements [4]. The metallographic analysis method is very accurate, but it needs to destroy the sample, which is a destructive detection method. It can only detect the thickness of the coating on the section, but cannot detect the thickness of the coating at each position of the sample. The non-destructive testing methods suitable for thickness testing of substrate-cladding structure include ultrasonic [5,6,7], X-ray [8,9], and eddy current [10,11,12,13]. X-ray can directly observe the detection results with high accuracy, but the X-ray method is costly and harmful to experimenters [14]. The eddy current method of the thickness measurement requires that the substrate is a non-ferromagnetic metal material and the cladding is a non-conductive material. The ultrasonic method is less limited by the material to be measured and is widely used. It has become an important research direction for the nondestructive measurement of coating thickness.
In recent years, many academics have performed a great deal of research on the measurement methods for coating thickness based on ultrasonic waves. The variation of coating thickness changes the dispersion characteristics of surface waves. Schneider et al. [15,16] characterized and evaluated the coating thickness by measuring the variation of surface wave dispersion characteristics. Lakestain et al. [17] measured the thickness of metal coatings using the surface wave method. Ostiguy et al. [18] used piezoelectric probes to excite and detect guided waves in the S0 mode in a substrate-coating structure and characterized the coating thickness by measuring the variation of the group velocity of the guided waves. Wu et al. [19] proposed a detection method for detecting the thickness of adhesions on the plate surface based on the horizontal shear (SH) wave, which uses the variation of the dispersion characteristics of the SH wave to characterize the thickness of adhesions. Kanja et al. [20] proposed a method for measuring the thickness of surface films based on superimposed ultrasonic standing waves. The ultrasonic reflection coefficient phase spectrum [21] and amplitude spectrum [22] were used to measure the coating thickness. Due to the movement of the Cu/Al laminate, the real-time online measurement of the thickness of each layer of the Cu/Al laminate is a complicated problem. Although the above methods can measure the thickness of the coating, it cannot realize real-time online detection. Therefore, it is necessary to develop a new non-contact detection method to measure the thickness of the cladding and substrate of the Cu/Al laminates at the same time.
Laser ultrasonic has the characteristics of long-distance excitation and the detection of ultrasound, making it suitable for non-contact dynamic detection in high-temperature environments [23,24,25]. The thickness measurement methods using laser ultrasound have been successfully used to measure the wall thickness of hot-rolled steel pipes online [26,27]. These methods use the time difference between two pulse echoes to calculate the thickness of steel pipes, which is only suitable for the thickness measurement of a single material. Due to the complex propagation behavior of ultrasonic waves in multilayer composite materials, the above methods are not suitable for measuring the thickness of each layer of multilayer composite materials.
In this paper, a novel thickness measurement method using laser ultrasound is proposed, which can measure the thickness of the cladding and substrate simultaneously. The propagation of laser ultrasound in Cu/Al laminates and the factors affecting the measurement error are studied by the finite element method. The experimental results demonstrate that the method we proposed can measure the thickness of each layer of Cu/Al laminates with high precision and has the potential of online measurement.

2. Thickness Measurement Principles and Experiments

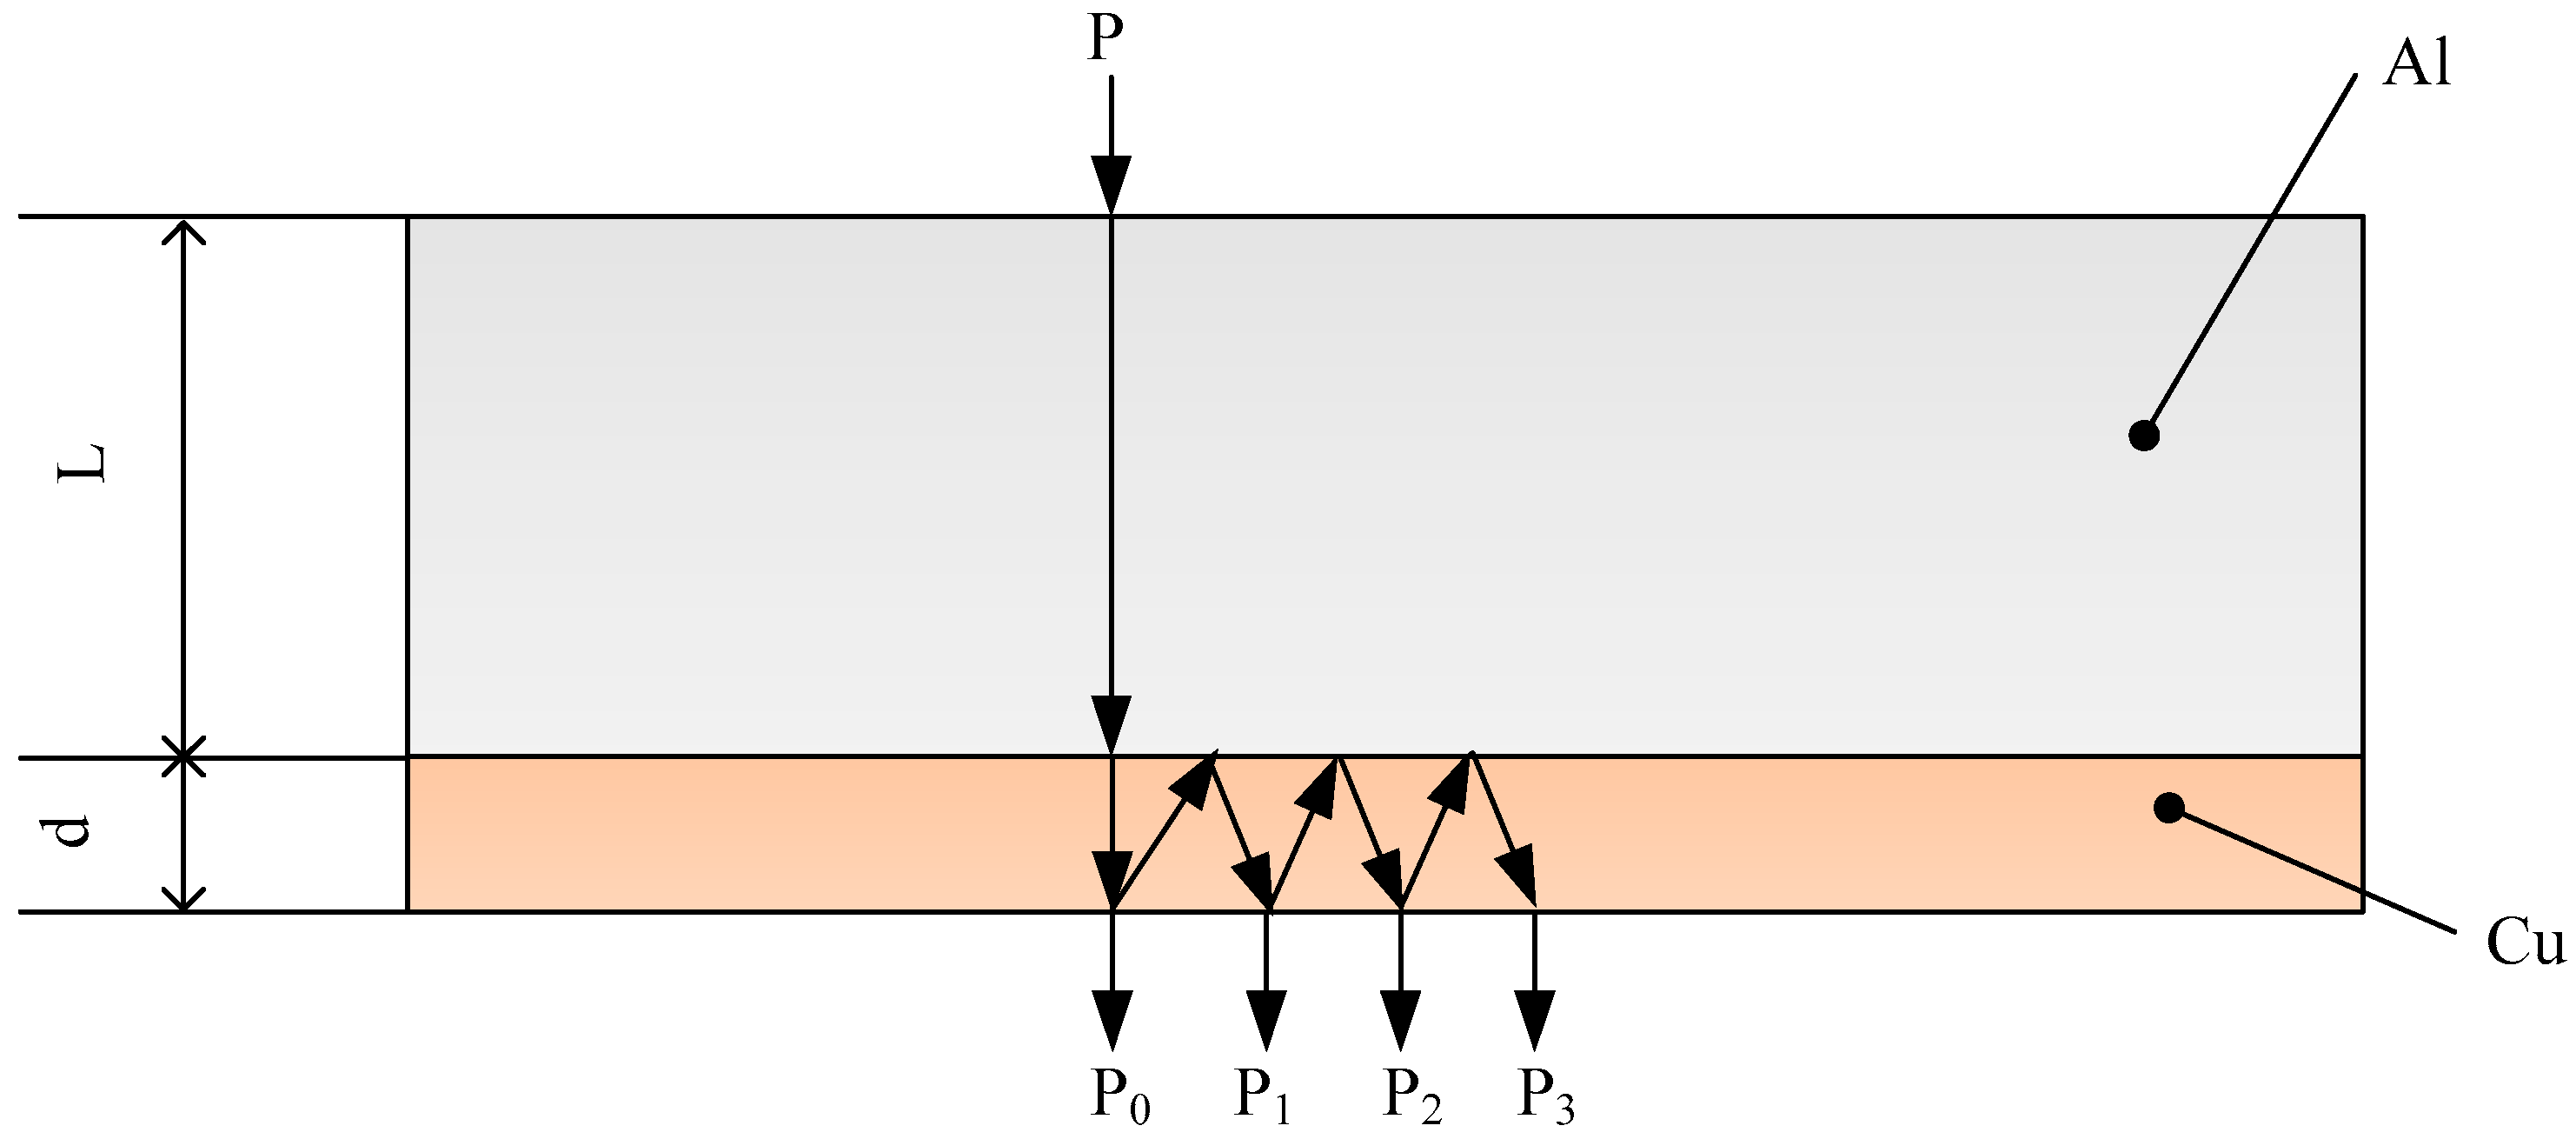
2.1. Propagation Model of Ultrasonic in Cu/Al Laminates

The pulse transmission method is utilized to measure the thickness of each layer. The ultrasound is excited on the surface of the Al layer and detected on the surface of the Cu layer. The ultrasound first propagates in the aluminum layer and then propagates into the copper layer through the composite interface. As shown in Figure 1, the transmitted wave is marked as P0, and the transmitted wave is reflected multiple times between the top and bottom boundaries of the copper layer, marked as P1, P2, P3, etc. The thicknesses of the aluminum layer and copper layer are marked as L and d, respectively. The velocities of the longitudinal waves in Cu and Al are 4404.4 m/s and 6210.0 m/s respectively.

2.2. Numerical Simulation

In laser ultrasonic non-destructive testing, the thermos-elastic method is utilized to excite ultrasonic waves. As the pulsed laser radiates the surface of the Cu/Al composites, the material absorbs part of the laser energy, and instant thermal expansion produces elastic waves. The excitation and propagation of the ultrasonic wave in the bimetallic composites were analyzed by numerical calculation method.
Figure 2 shows the 2D axisymmetric finite element model. The ultrasonic wave is excited on the Al side and detected on the Cu side. The cylindrical coordinate system is established with the center position of the pulsed laser spot as the origin, the horizontal direction as the r-axis, and the vertical direction as the z-axis. The detection laser beam is perpendicular to the surface of the specimen, and the axis of the detection laser beam should coincide with the z-axis. During thickness measurement, the axis of the detection laser may not coincide with the z-axis. The distance between the axis of the detection laser and the z-axis is marked as PRD. To explore the propagation process of the laser ultrasound in Cu/Al laminates, the finite element models are established, with a radius of 20 mm, in which the thickness of the Al layer is 2.5 mm and the thicknesses of the Cu layers are 0.06 mm, 0.08 mm, 0.1 mm, 0.2 mm, 0.3 mm, 0.4 mm, and 0.5 mm respectively. The element size of models with Cu layer thicknesses of 0.06 mm, 0.08 mm, and 0.1 mm is 2 μm, and the iteration time is 0.2 ns. The element size of models with Cu layer thicknesses of 0.2 mm, 0.3 mm, 0.4 mm, and 0.5 mm is 5 μm, and the iteration time is 0.5 ns. Table 1 shows the thermos-physical parameters of Cu and Al applied for numerical simulation. The laser pulse is equivalent to the heat flux load applied to the surface of aluminum layer to excite ultrasonic waves. The heat flux load Q can be described as [28,29].
Q = I 0 ( 1 R ) f ( r ) g ( t )
where I 0 is the power density the laser pulse, R is the reflectivity of pulsed laser on the surface of Al, and f ( r ) and g ( t ) are the spatial and temporal distributions of pulsed laser energy, respectively. f ( r ) and g ( t ) are given by
f ( r ) = exp ( r 2 2 σ r 2 )
g ( t ) = t t 0 exp ( t t 0 )
where σ r = 0.33 r 0 , r 0 is the radius of the laser spot, and t 0 is the pulse rise time.
To ensure sufficient calculation accuracy, the iteration time and the element length should be determined according to the following conditions [28]:
Δ t 1 180 f max
L e λ min 20
where Δ t is the integration time, f max is the highest frequency of laser ultrasonic, L e is the element length, and λ min is the minimum wavelength of laser ultrasonic.

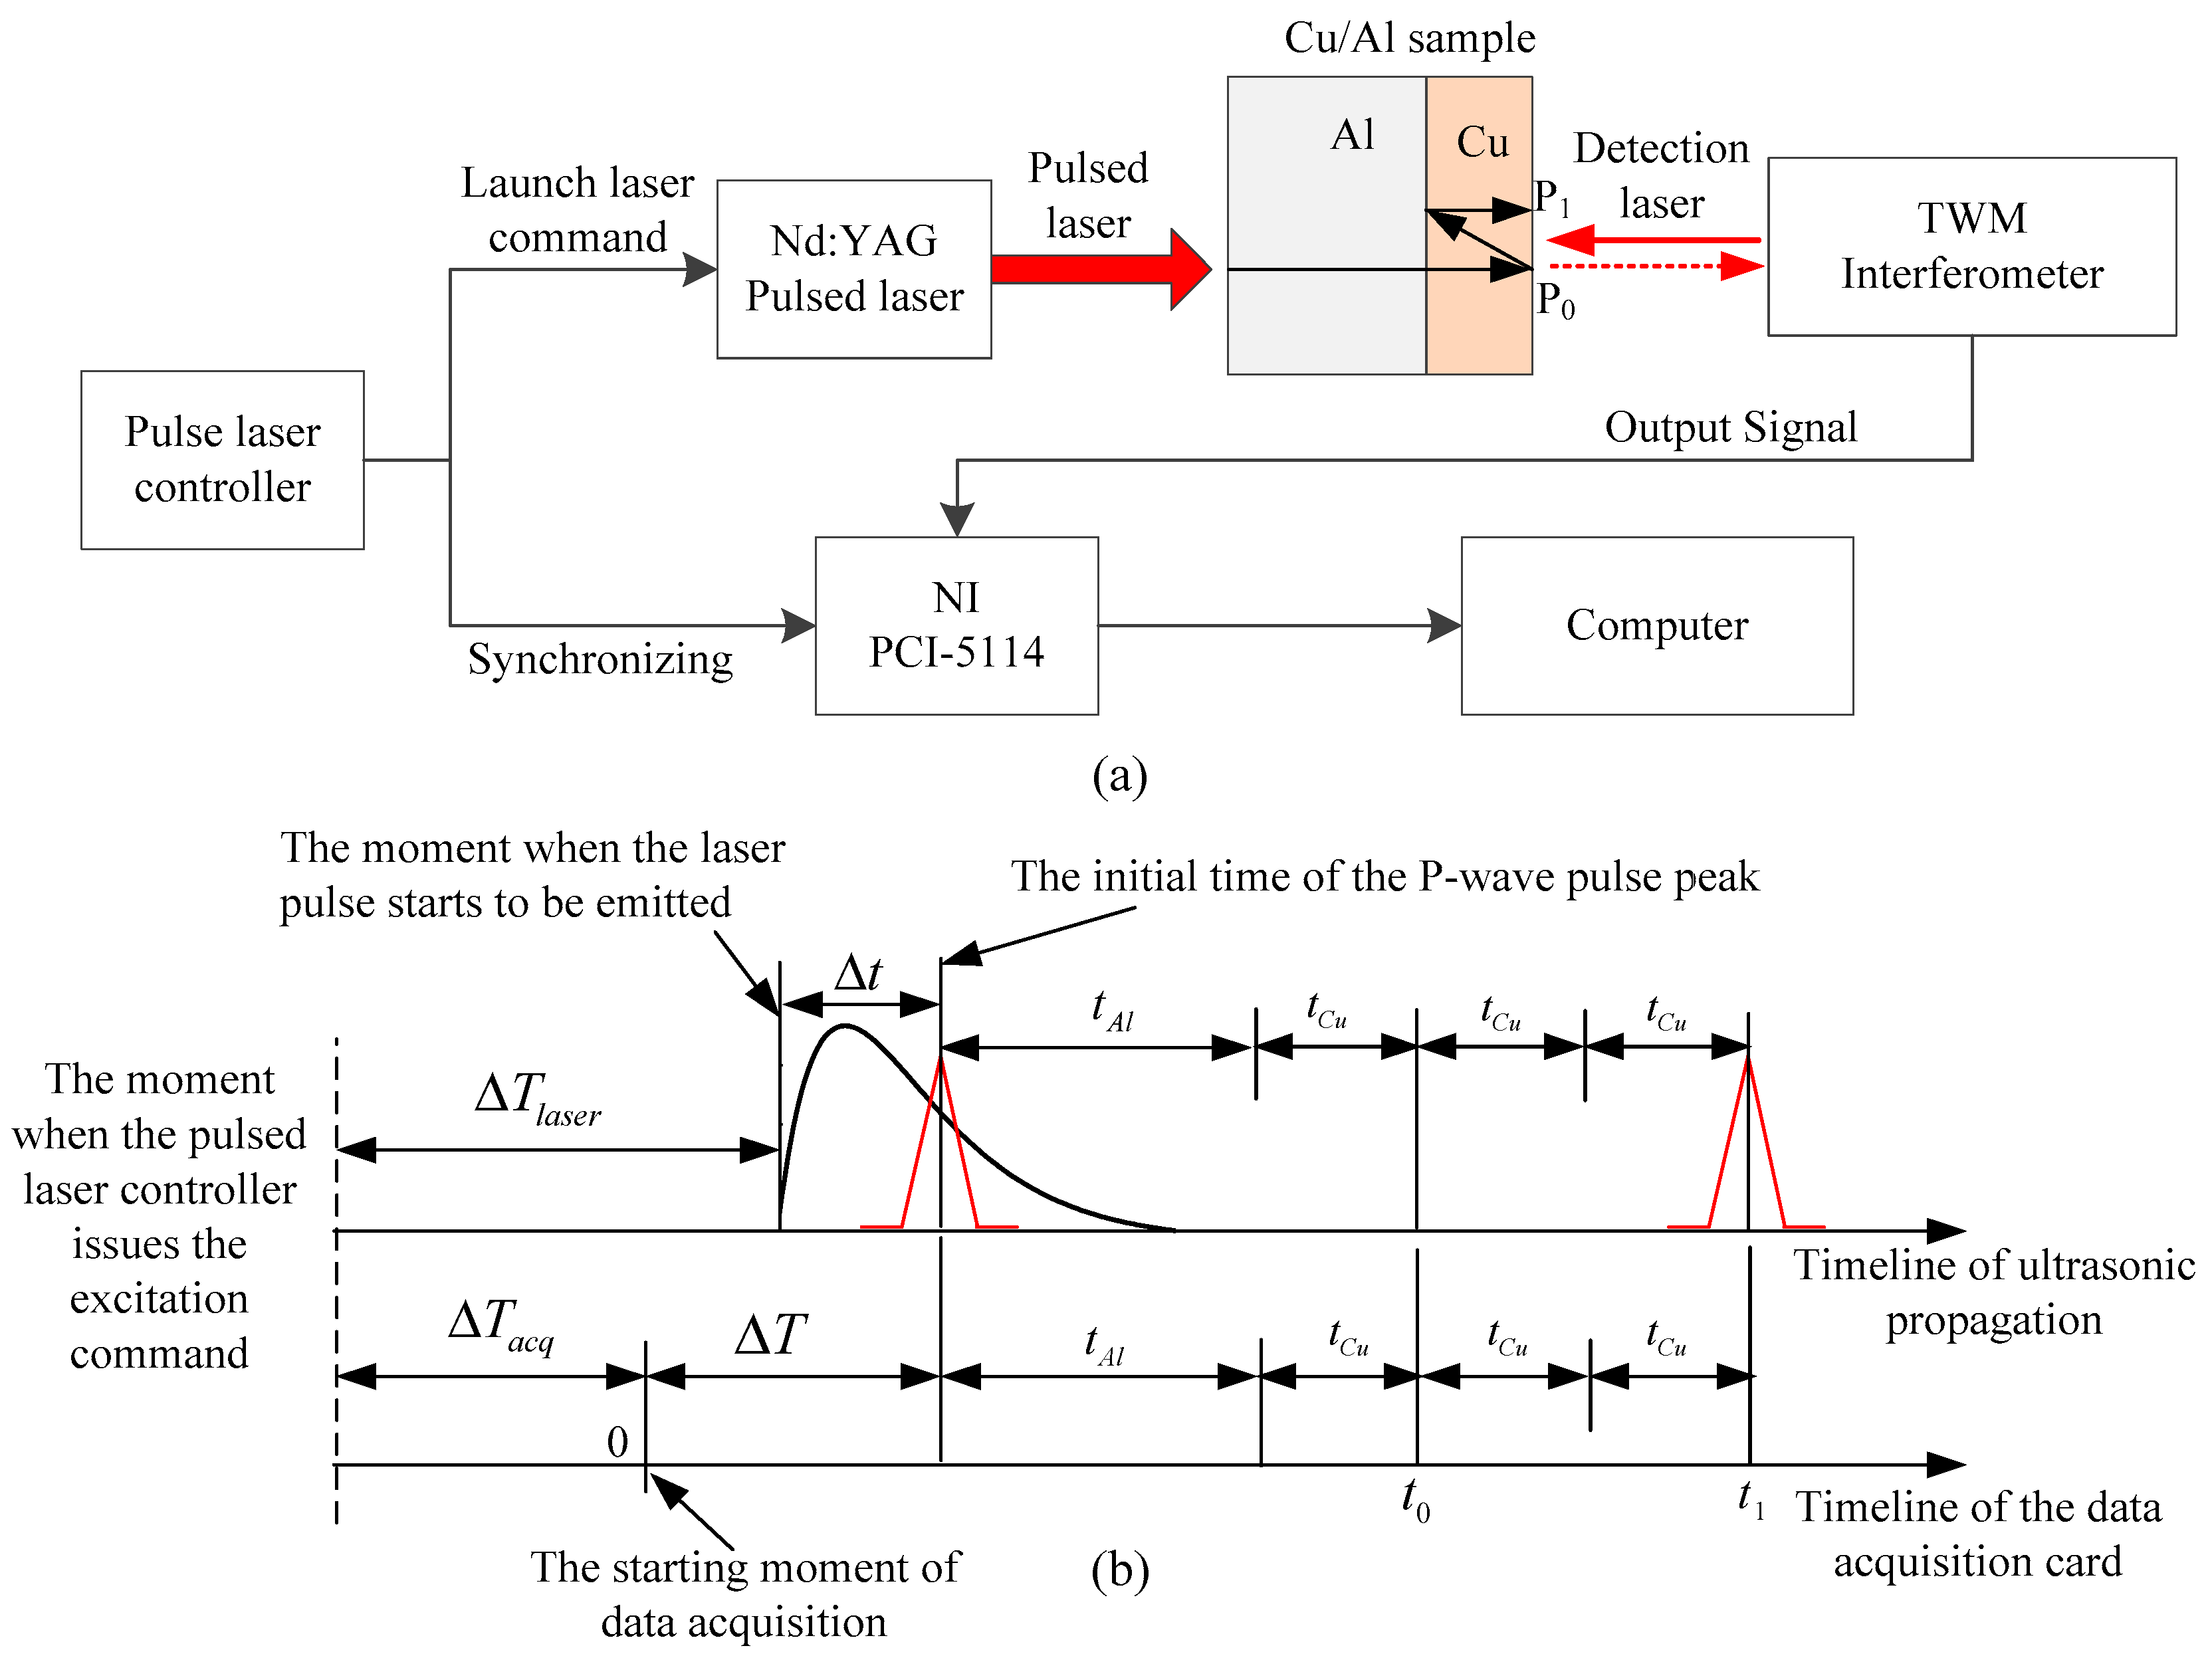
2.3. Experimental Setup and Thickness Calculation Method

Figure 3a shows the laser ultrasonic thickness measurement system. The pulse laser with rise time of 8 ns, wavelength of 1064 nm, maximum repetition frequency of 20 Hz, pulse energy range of 0–50 mJ, and spot diameter of 1 mm is used to excite ultrasound on the surface of the aluminum layer. A two-wave mixing (TWM) interferometer is utilized to collect ultrasonic signals on the copper surface. The spot diameter of the detection laser is about 200 μm. The excitation laser and the detection laser are perpendicular to the surface of the specimen. The axes of the pulse laser beam and the detection laser beam coincide. Different materials have great differences in laser absorptivity [30]. Appropriate pulse laser energy and detection power are set based on the laser absorptivity of copper and aluminum. The maximum sampling frequency of the data acquisition card (NI-PCI5114) is 250 MHz.
The timeline of the ultrasonic wave excited by pulsed laser in the Cu/Al laminate is shown in Figure 3b. The controller of the pulsed laser sends a trigger signal and commands to the data acquisition card and the pulsed laser synchronously. The pulsed laser emits a laser after Δ T l a s e r , and the data acquisition card begins to collect data after Δ T a c q . When using experimental data to calculate the thickness of the aluminum layer, the Δ T needs to be calibrated. The one-way times of the longitudinal wave pulse propagating in the aluminum layer and copper layer are t A l and t C u , and the peak arrival times of P0 and P1 are t 0 and t 1 , which satisfy the following equations:
t 0 = Δ T + t C u + t A l
t 1 = Δ T + 3 t C u + t A l
According to Equations (6) and (7), the one-way time of ultrasonic propagating in the copper layer and aluminum layer can be expressed as:
t C u = t 1 t 0 2
t A l = 3 t 0 t 1 2 Δ T 2
The calculation expressions for d and L can be described as:
d = t 1 t 0 2 c L C u
L = 3 t 0 t 1 2 Δ T 2 c L A l
where c L C u and c L A l represent the velocity of longitudinal waves in copper and aluminum, respectively.

2.4. Numerical Simulation

The experimental specimen, with step shape, is shown in Figure 4. A specific thickness is milled on the Cu surface by milling to simulate the thickness variation of the Cu layer. The length of the sample is 60 mm. The thicknesses of the positions Ⅰ, Ⅱ, and Ⅲ are 2.982 mm, 2.732 mm, and 2.648 mm, respectively.

3. Results and Discussion

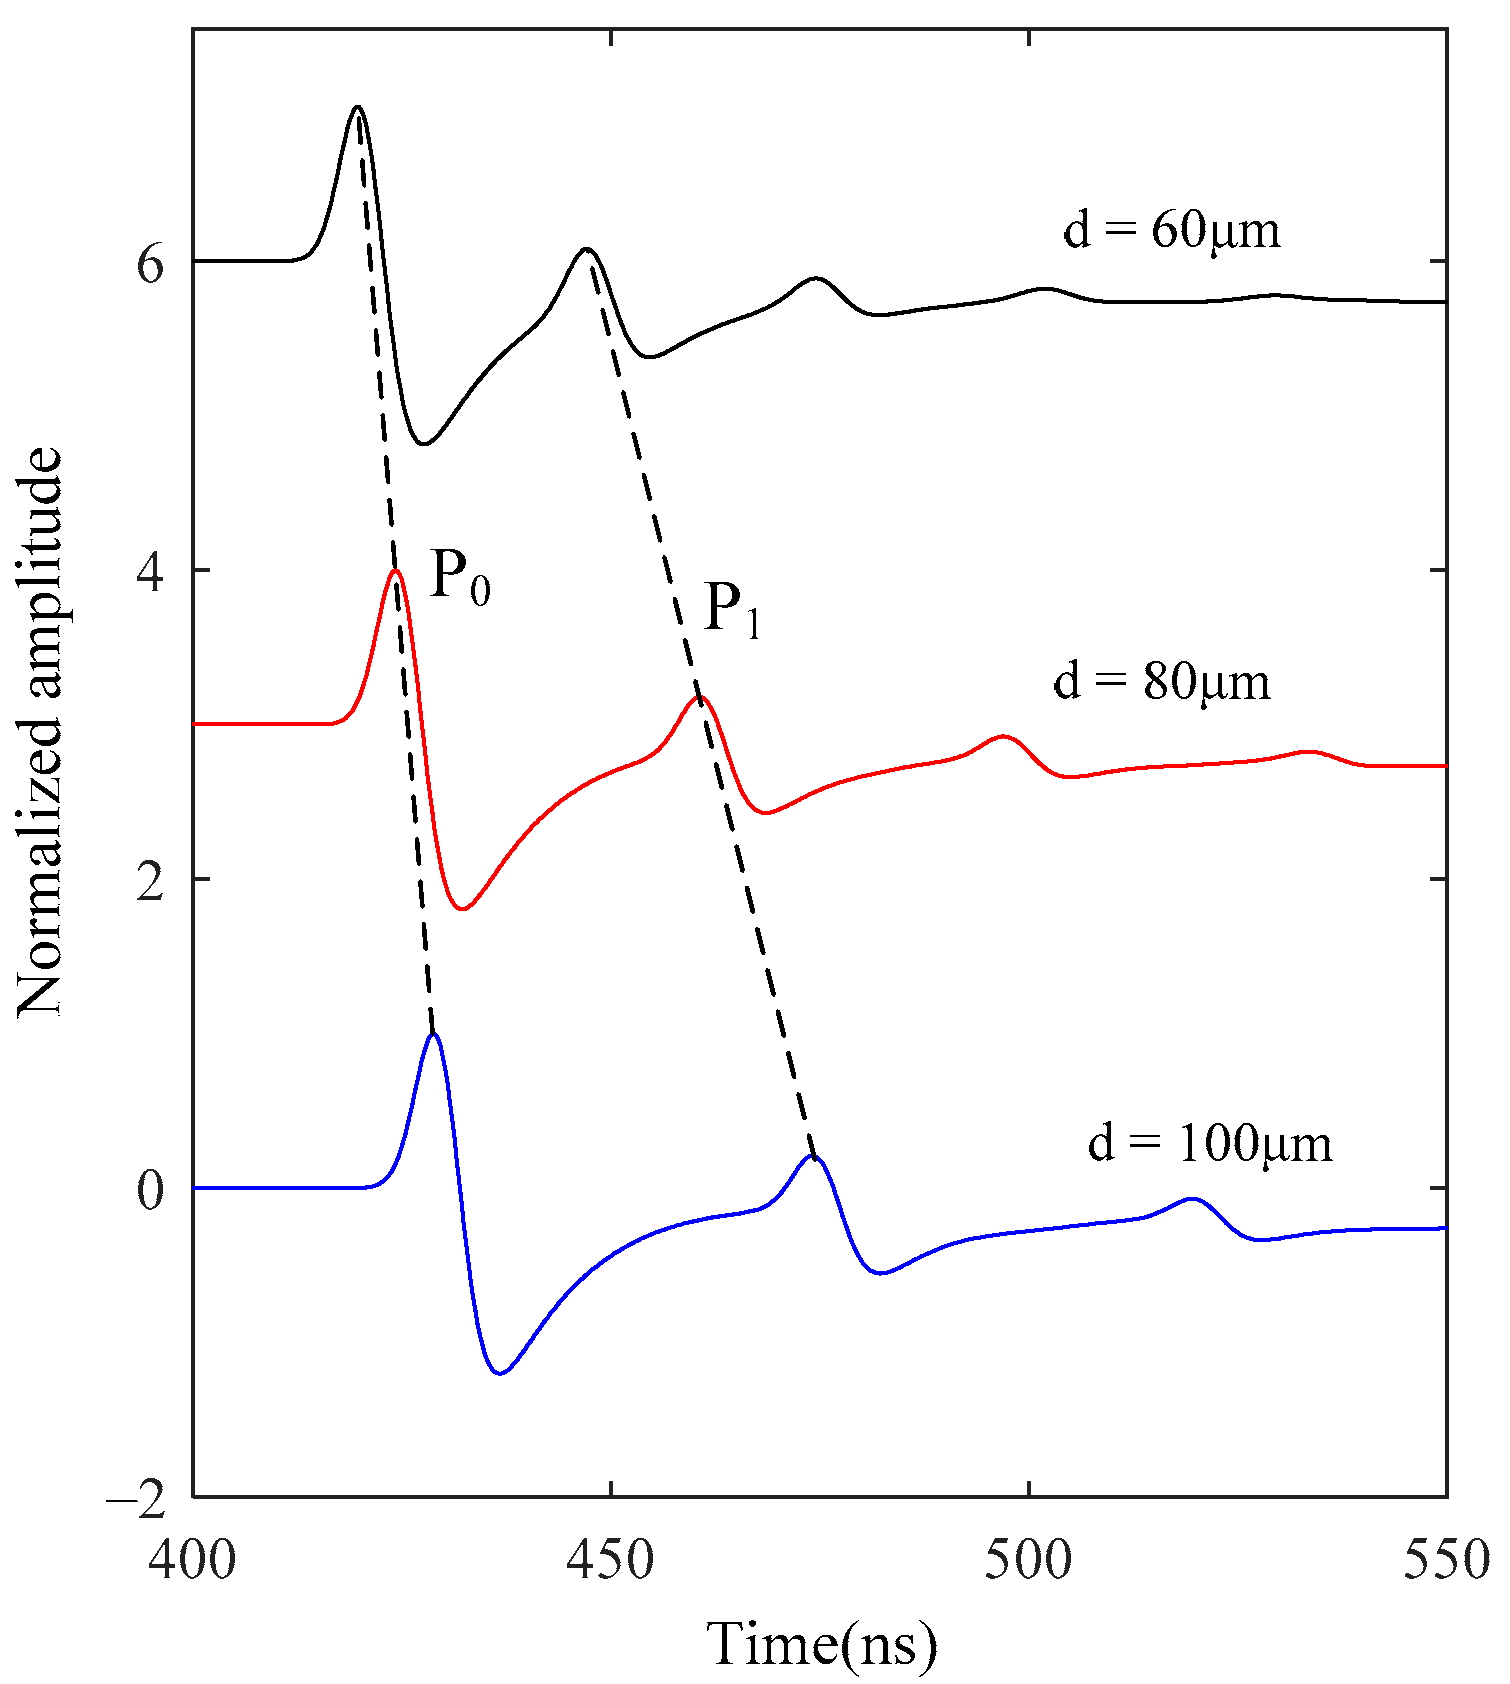
3.1. Influence of the Thickness of Copper Layer

The out-of-plane velocity curves of nodes with PRD = 0 in the models with copper layer thickness of 0.2 mm, 0.3 mm, 0.4 mm, and 0.5 mm are extracted and normalized, as shown in Figure 5. In Figure 5, P0 represents the transmitted longitudinal wave, and P1 and P2 represent the primary reflected longitudinal wave and the secondary reflected longitudinal wave of the composite interface, respectively. S0 represents transmitted transverse wave, and S1 represents the transverse wave reflected by the Cu/Al interface. As the thickness of the copper layer decreases, the peak arrival times of P0, P1, P2, S0, and S1 are advanced, and the time advances show a linear change. As the echo count increases, the echo amplitude decreases rapidly.

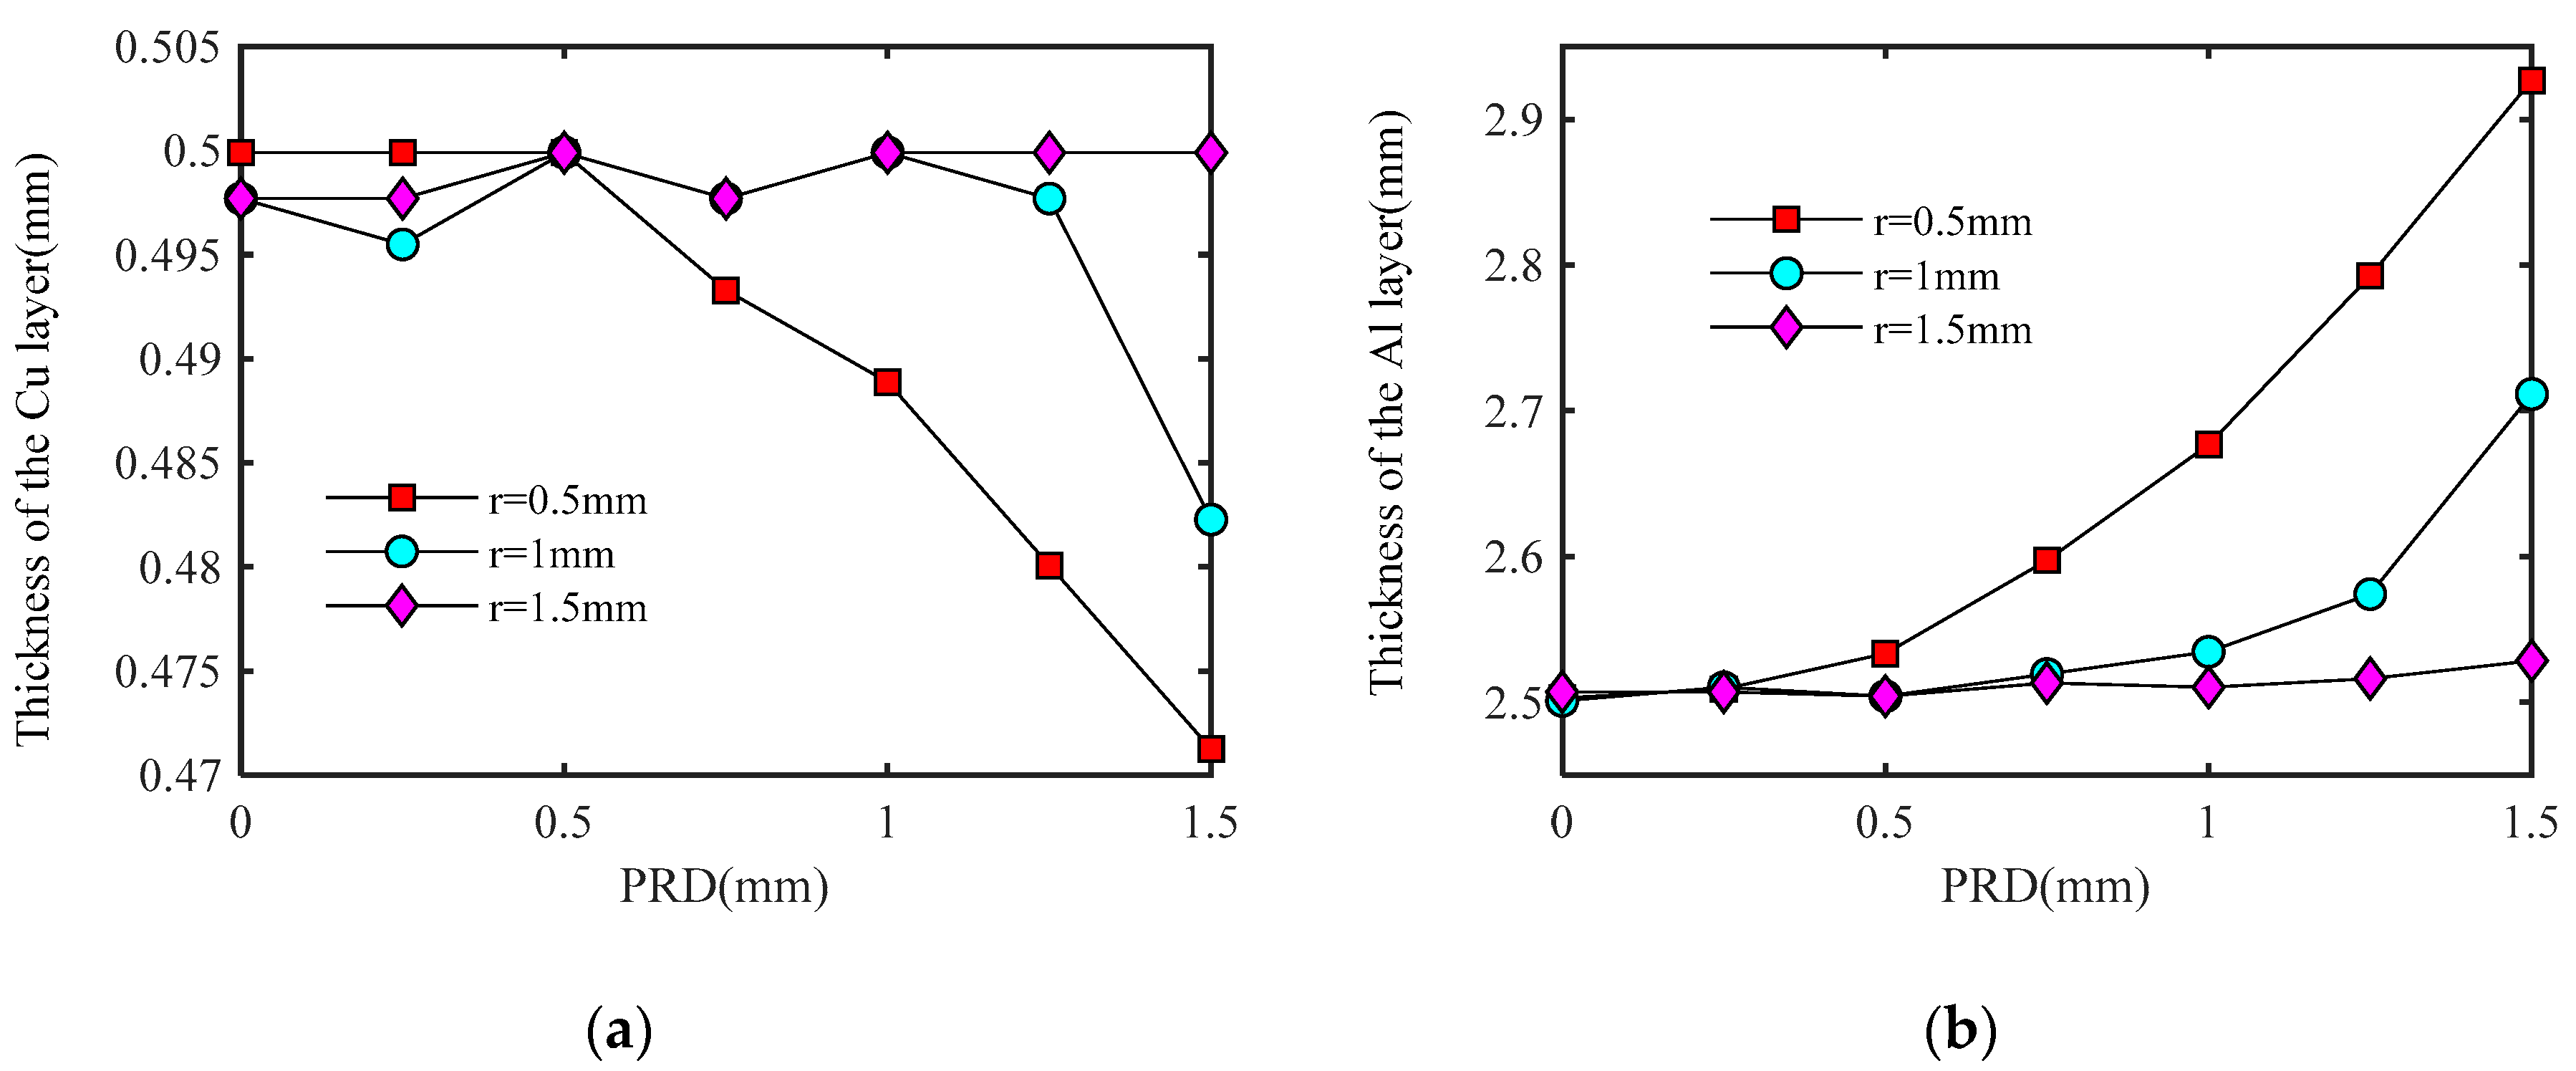
3.2. Influence of the PRD and Pulsed Laser Spot Radius

When the axis of the detection laser is not coincident with the z-axis (PRD ≠ 0), the propagation path of the ultrasonic wave changes, and the peak arrival time changes accordingly. The spot radius of the pulse laser beam affects the acoustic field distribution and the peak arrival time. In the model with a copper layer thickness of 0.5 mm, different pulse laser spot radii are used, and the values of the spot radii are 0.5 mm, 1 mm, and 1.5 mm, respectively. It can be seen from Figure 3b that, when the L is calculated by using simulation data, the Δ T in Equation (11) must be replaced by Δ t , as shown in Equation (12), and Δ t was determined to be 10 ns by simulation analysis.
L = 3 t 0 t 1 2 Δ t 2 c L A l
The peak arrival times of P0 and P1 of nodes with PRD values of 0 mm, 0.25 mm, 0.5 mm, 0.75 mm, 1 mm, 1.25 mm, and 1.5 mm are extracted and then substituted into Equations (10) and (12) to calculate the thickness of the Cu layer and the Al layer. The relationship between the calculated results of the thickness of each layer and PRD is shown in Figure 6. With the increase of PRD, the calculated results of d show a decreasing trend, while the calculated results of L show an increasing trend. When the PRD is constant, the error between the calculated and actual values of the thickness of Cu and Al layers decrease with the increase of the pulsed laser radius. According to the above analysis, when using laser ultrasound to measure the thickness of Cu/Al laminates by transmission method, the spot radius of the pulsed laser should be set to a larger value to reduce the impact of PRD on the measurement results.

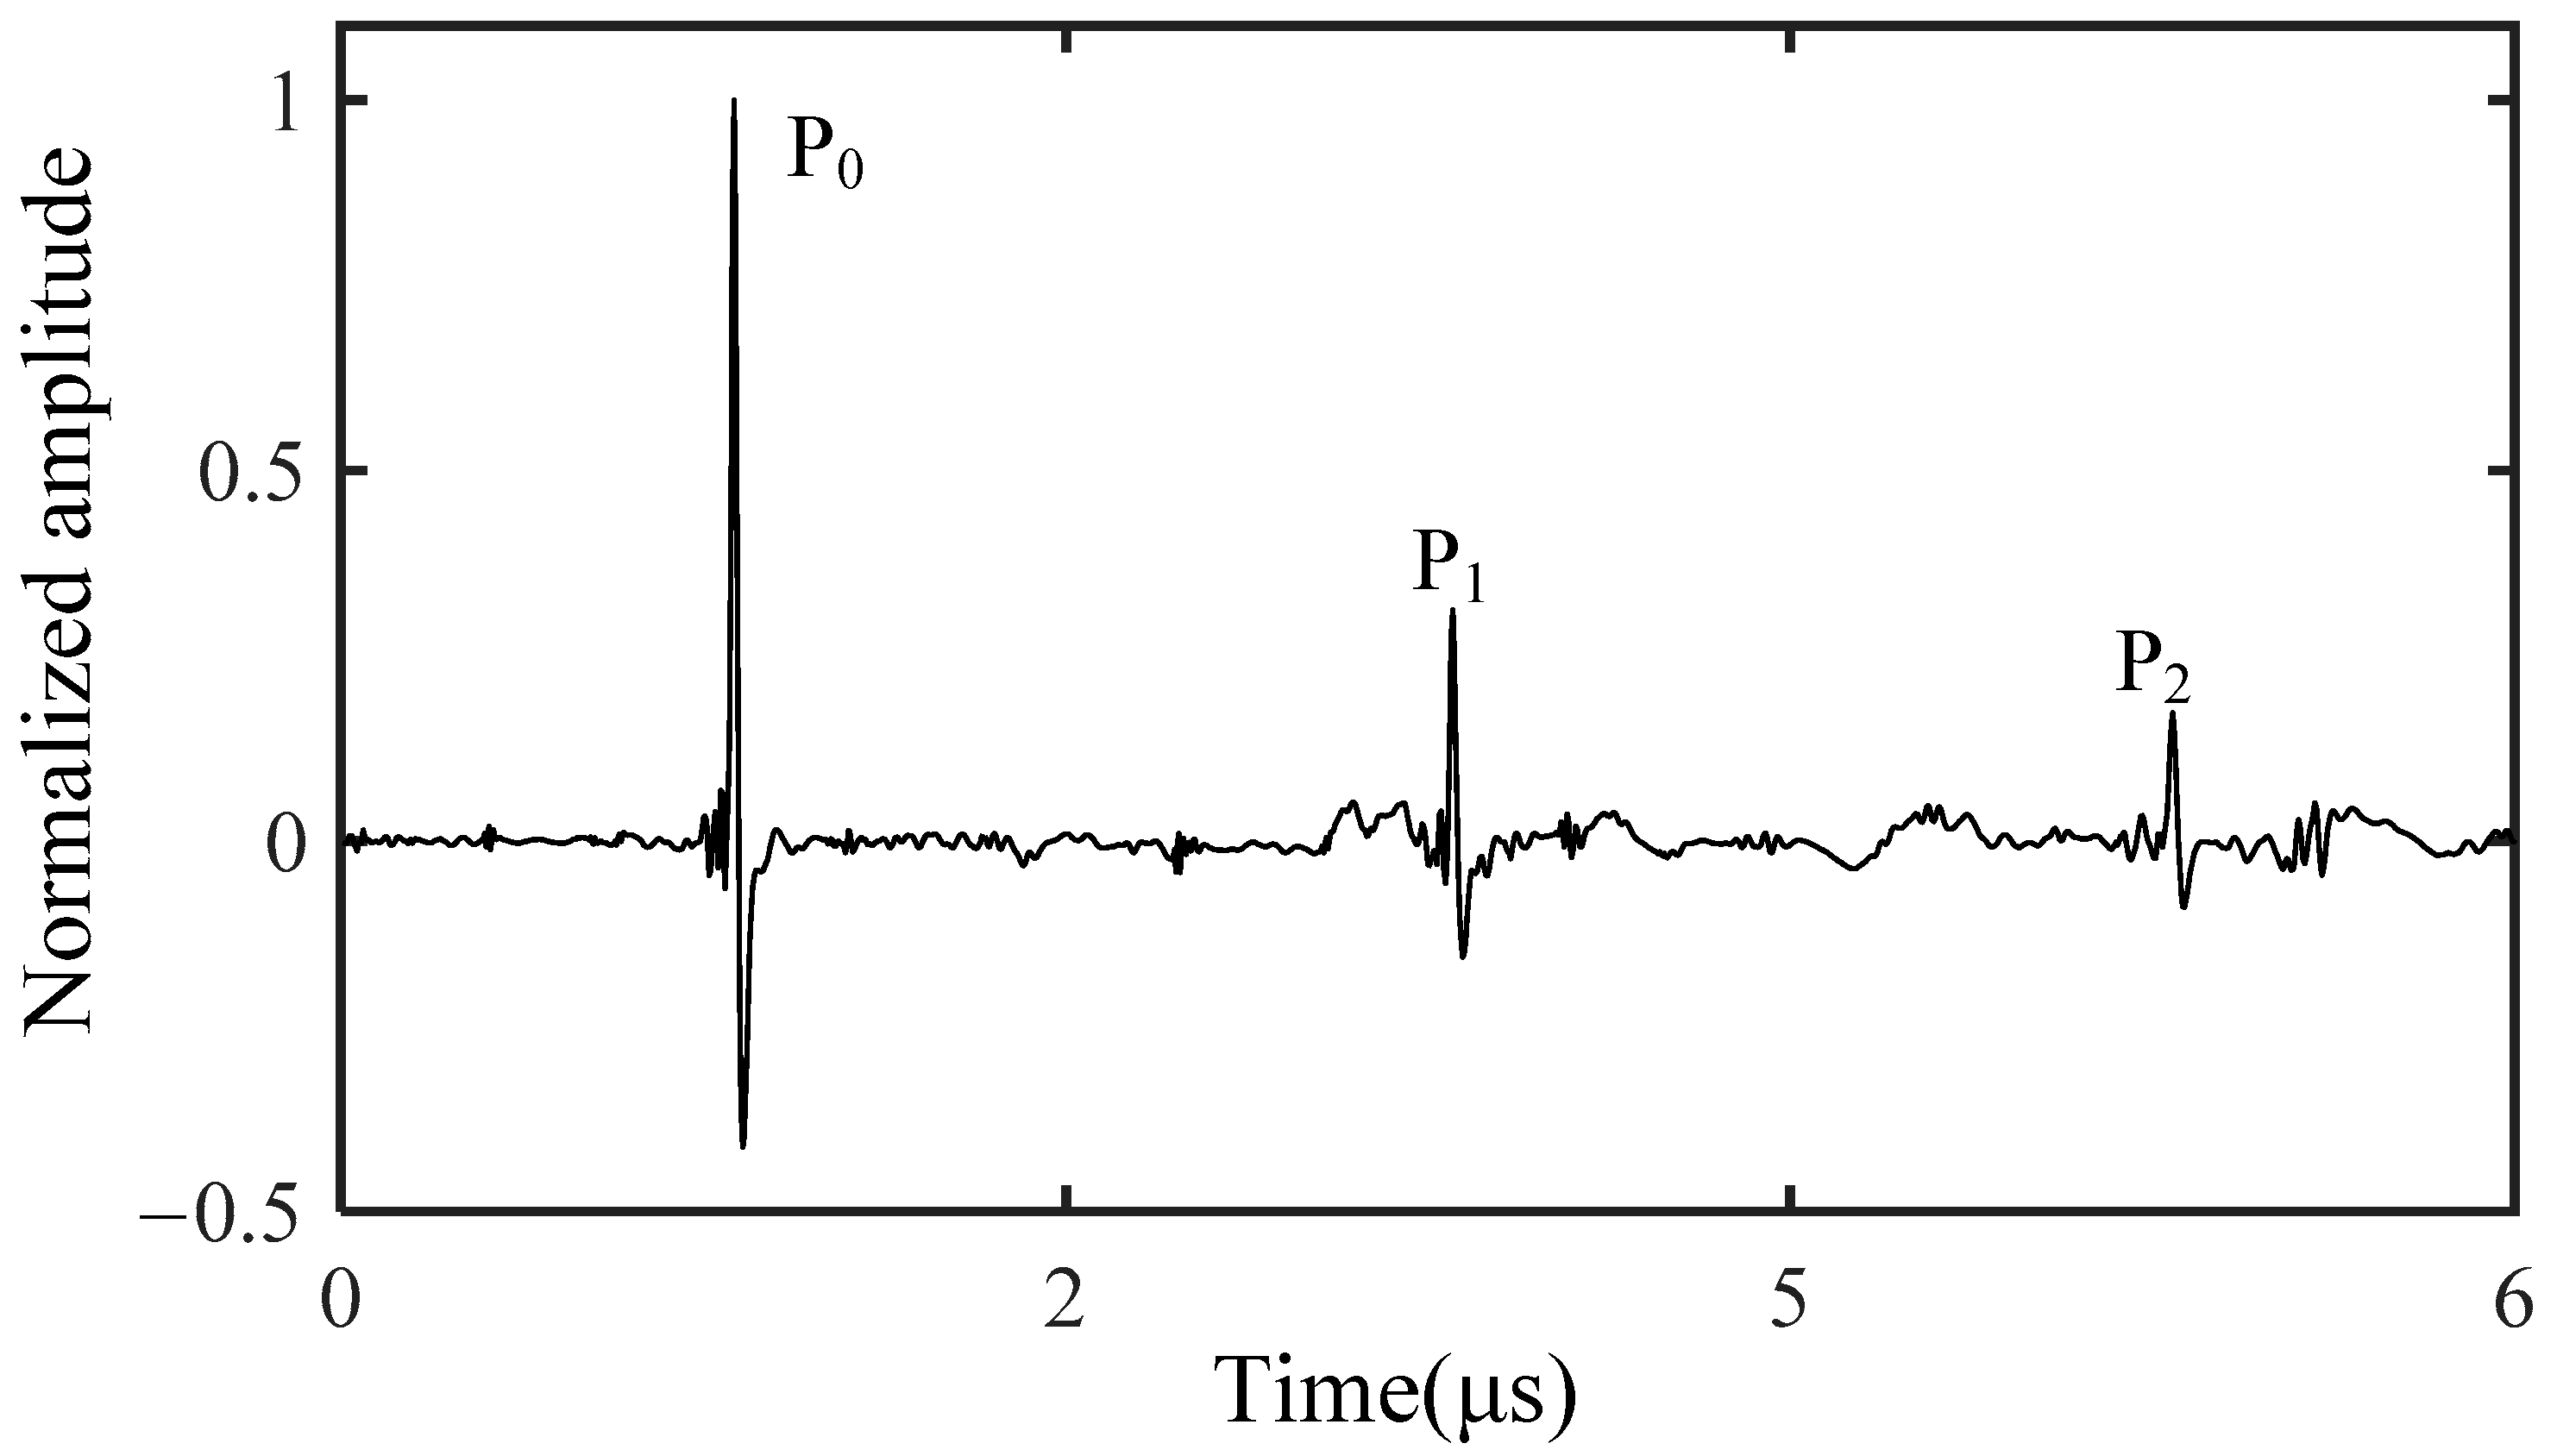
3.3. Waveform Overlapping Analysis

In the traditional thickness measurement method based on the longitudinal wave, when d < 2 λ ( d is the thickness of the object being measured, λ is the wavelength of longitudinal wave), the longitudinal wave is aliased in the time domain, which makes the peak time of each echo indistinguishable and limits the use of the method based on longitudinal wave. In this section, the limit of measuring the minimum thickness of the copper layer by longitudinal wave is studied by finite element analysis.
The waveform curves of nodes with PRD = 0 in the models with Cu layer thickness of 60 μm, 80 μm, and 100 μm are extracted and normalized, as shown in Figure 7. When the thickness of the Cu layer is 100 μm, the wave tail of P0 begins to overlap with the wave head of P1, that is, overlapping has occurred, but the peak and valley of each longitudinal wave pulse can still be recognized. With the decrease of the thickness of the Cu layer, the aliasing phenomenon is further aggravated, which makes it more difficult to identify the peak and valley of each longitudinal wave pulse.
The arrival time of P0 and P1 in Figure 7 are extracted, and the thickness of the Cu layer is calculated according to Equation (10). The results are shown in Table 2. As the thickness of the Cu layer decreases, the relative error of the thickness of the Cu layer, calculated according to the simulation data, increases gradually. The simulation results show that the thickness of the Cu layer can also be measured under the condition of waveform overlapping. In the application, a picosecond laser or femtosecond laser can be used to excite higher-frequency ultrasonic waves to avoid aliasing and improve accuracy.

3.4. System Delay Calibration

The Cu/Al laminated plate in Figure 3a was replaced by an aluminum plate with a thickness of 6 mm. The laser ultrasonic signal was excited and collected on the surface of aluminum sample, as shown in Figure 8. The one-way propagation time of the P-wave pulse in the direction of aluminum thickness is constant, so the system delay satisfies the following equation:
T 0 Δ T = T 1 T 0 2
The peak arrival times T0 and T1 of P0 and P1 are 1083.5 ns and 3070 ns, respectively. Substituting T0 and T1 into Equation (13), we can determine that the system delay Δ T is about 90 ns.

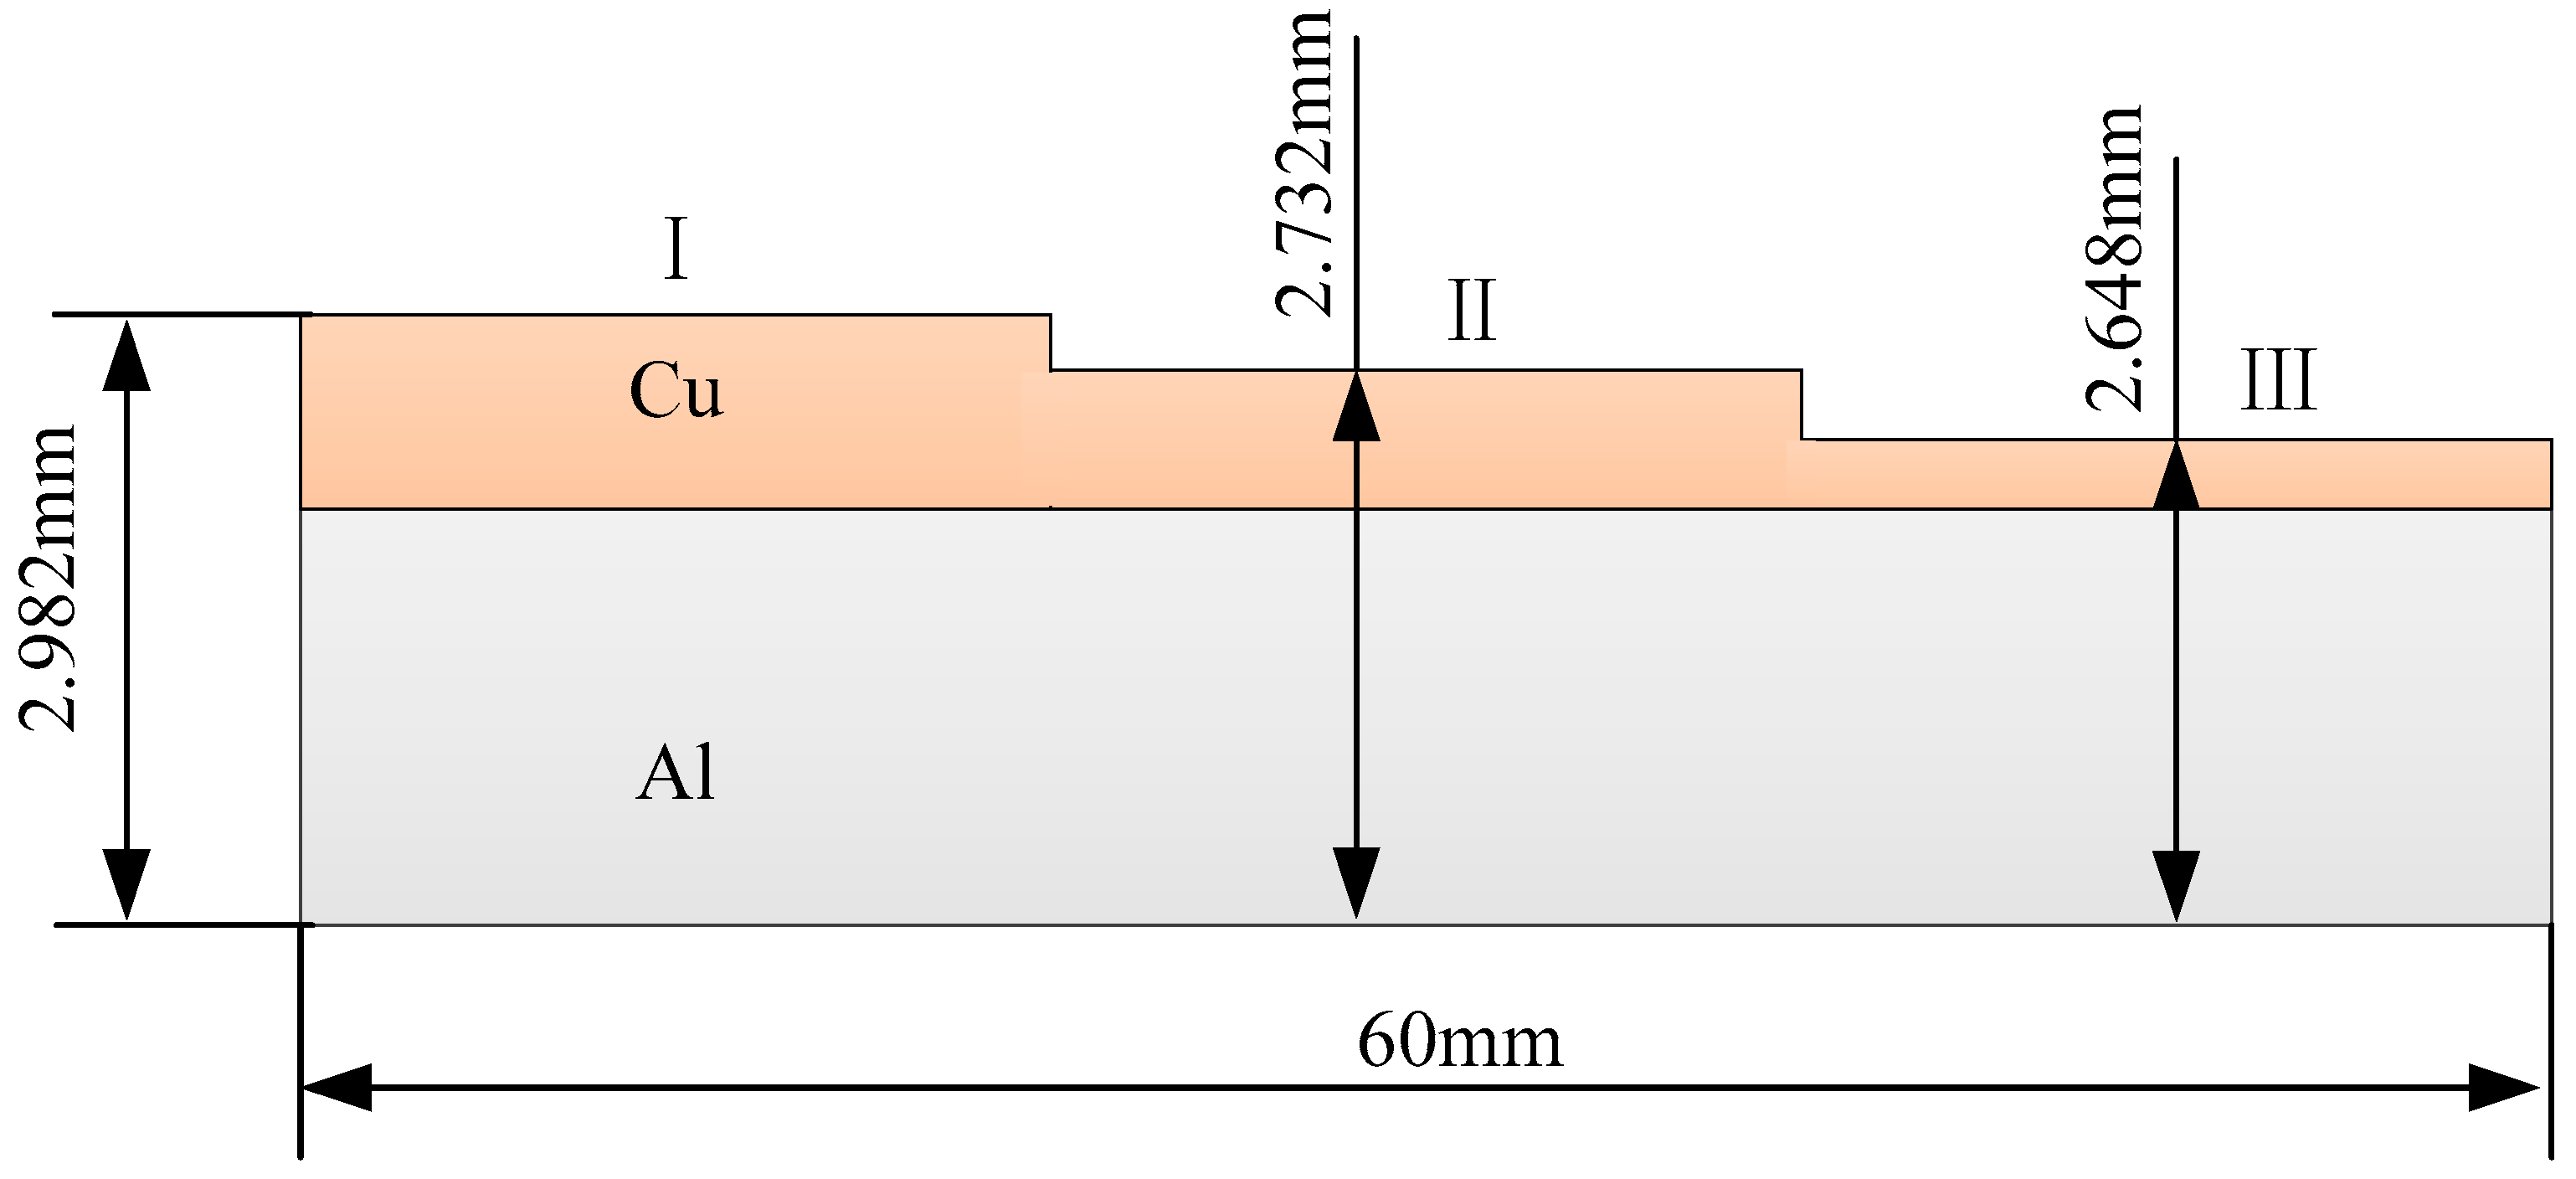
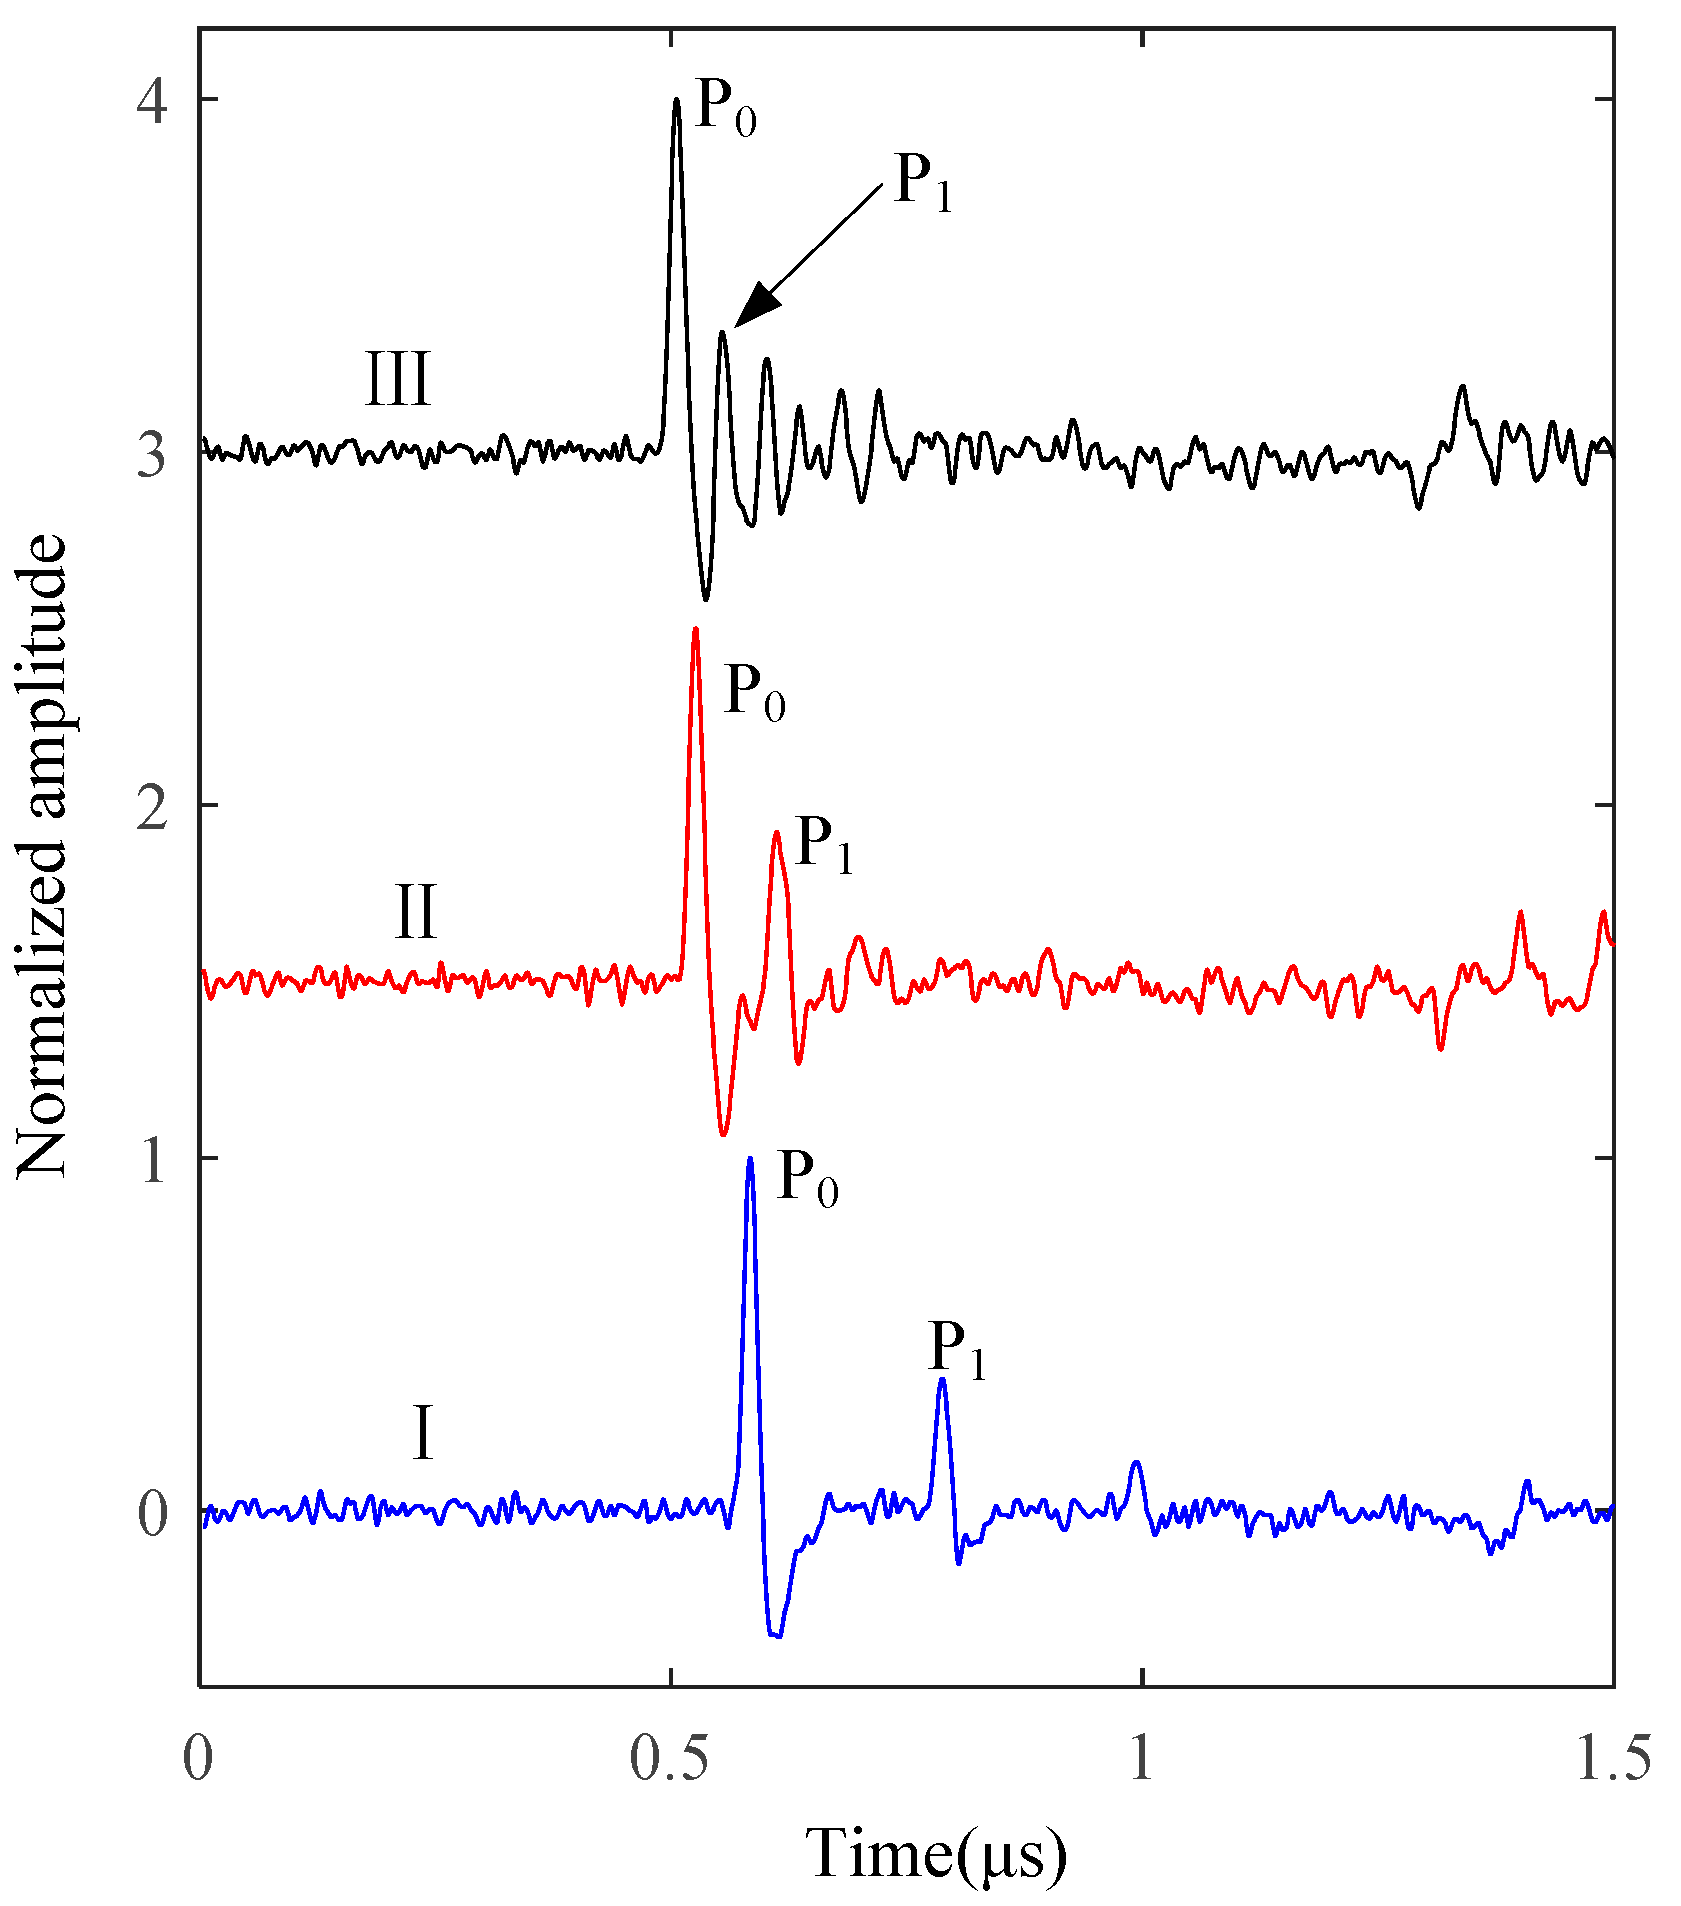
3.5. Experimental Results

The laser ultrasonic is excited and detected at the positions Ⅰ, Ⅱ, and Ⅲ of the sample, respectively. The experimental signal is de-noised by wavelet and then normalized. The time domain waveforms of the three positions after signal processing are shown in Figure 9. It is obvious that, with the decrease of the thickness of the Cu layer, the time difference between P0 and P1 decreases gradually. The waveform is aliased at position Ⅲ. The peak arrival times of P0 and P1 are extracted, and the thicknesses of Cu layer and Al layer are calculated according to Equations (10) and (11).
Table 3 shows the experimental measurement results of each layer thickness. It is obvious that the measured values are consistent with the real values, and the relative errors of the thickness measuring system fluctuate between 1.48% and 2.17%. As the thickness of the copper layer decreases, the aliasing phenomenon gradually occurs, and the difficulty of the wave peak detection increases. The maximum sampling frequency of the data acquisition card becomes an important factor limiting the improvement of the detection accuracy. The experimental results show that the laser ultrasound can realize the non-contact and high-precision measurement of the thickness of each layer of the Cu/Al laminate and have the potential of an online thickness measurement.

4. Conclusions

A new method of measuring the thickness of each layer of the Cu/Al laminates based on the laser ultrasound was proposed for online non-contact measurement during the rolling process. The calculation formula of aluminum layer thickness is corrected by using the system delay error of the detection system. The system delay of laser ultrasonic detection system is about 90 ns through the calibration experiment. The influence of PRD and pulsed laser spot radius on thickness measurement error was analyzed by the finite element method, and it was found that a larger spot radius can reduce the influence of PRD on thickness measurement error. The experimental results demonstrate that the proposed thickness measurement method using laser ultrasonic can simultaneously measure the thickness of each layer of the Cu/Al laminate, and the measured values of the total thickness are basically consistent with the true values. The thickness measurement method proposed in this study can be used to measure the thickness of each layer of the Cu/Al laminates in real-time and to optimize the production process, which is of great significance for improving the quality of Cu/Al laminates.

Author Contributions

Conceptualization, B.J. and Q.Z.; methodology, B.J., H.Z. and J.C.; software, H.Z.; validation, B.J. and J.C.; formal analysis, B.J. and H.Z.; investigation, B.J.; resources, J.C.; data curation, H.Z.; writing—original draft preparation, B.J.; writing—review and editing, B.J., H.Z., J.C. and Q.Z.; visualization, B.J.; supervision, B.J.; project administration, B.J.; funding acquisition, J.C. and Q.Z. All authors have read and agreed to the published version of the manuscript.

Funding

This research was funded by the National Natural Science Foundation of China (grant No. 51575040), the Natural Science Foundation of Beijing Municipality (grant No. 3202019), and the Natural Science Foundation of Beijing Municipality (grant No. 3182008).

Conflicts of Interest

The authors declare no conflict of interest.

References

  1. Zhang, Q.; Li, S.; Li, R.; Zhang, B. Multiscale Comparison Study of Void Closure Law and Mechanism in the Bimetal Roll-Bonding Process. Metals 2019, 9, 343. [Google Scholar] [CrossRef] [Green Version]
  2. Jin, J.Y.; Hong, S.I. Effect of heat treatment on tensile deformation characteristics and properties of Al3003/STS439 clad composite. Mater. Sci. Eng. A 2014, 596, 1–8. [Google Scholar] [CrossRef]
  3. Ji, B.; Cao, J.; Yu, M.; Chen, Z.; Zhang, Q. Application of laser ultrasonic for detecting delamination in Cu/Al composites. Optik 2021, 243, 167426. [Google Scholar] [CrossRef]
  4. He, C.; Yang, Y.E.; Wu, B. Experimental study on thickness detection of thermal barrier coatings using microwave. Chin. J. Sci. Instrum. 2011, 32, 2590–2595. [Google Scholar]
  5. Zhang, J.; Cho, Y.; Kim, J.; Malikov, A.K.; Kim, Y.H.; Yi, J.-H.; Li, W. Non-Destructive Evaluation of Coating Thickness Using Water Immersion Ultrasonic Testing. Coatings 2021, 11, 1421. [Google Scholar] [CrossRef]
  6. Malikov, A.K.; Cho, Y.; Kim, Y.H.; Kim, J.; Park, J.; Yi, J.-H. Ultrasonic Assessment of Thickness and Bonding Quality of Coating Layer Based on Short-Time Fourier Transform and Convolutional Neural Networks. Coatings 2021, 11, 909. [Google Scholar] [CrossRef]
  7. Xu, C.; He, L.; Xiao, D.; Ma, P.; Wang, Q. A Novel High-Frequency Ultrasonic Approach for Evaluation of Homogeneity and Measurement of Sprayed Coating Thickness. Coatings 2020, 10, 676. [Google Scholar] [CrossRef]
  8. Porcinai, S.; Ferretti, M. X-ray fluorescence-based methods to measure the thickness of protective organic coatings on ancient silver artefacts. Spectrochim. Acta Part B 2018, 149, 184–189. [Google Scholar] [CrossRef]
  9. Ariyasu, A.; Hattori, Y.; Otsuka, M. Non-destructive prediction of enteric coating layer thickness and drug dissolution rate by near-infrared spectroscopy and X-ray computed tomography. Int. J. Pharm. 2017, 525, 282–290. [Google Scholar] [CrossRef] [PubMed]
  10. Wang, Y.; Fan, M.; Cao, B.; Ye, B.; Wen, D. Measurement of coating thickness using lift-off point of intersection features from pulsed eddy current signals. NDT E Int. 2020, 116, 102333. [Google Scholar] [CrossRef]
  11. Kim, T.O.; Kim, H.Y.; Kim, C.M.; Ahn, J.H. Non-Contact and In-Process Measurement of Film Coating Thickness by Combining Two Principles of Eddy-Current and Capacitance Sensing. CIRP Ann. 2007, 56, 509–512. [Google Scholar] [CrossRef]
  12. Grosso, M.; Pacheco, C.J.; Arenas, M.P.; Lima, A.H.M.; Margarit-Mattos, I.C.P.; Soares, S.D.; Pereira, G.R. Eddy current and inspection of coatings for storage tanks. J. Mater. Res. Technol. 2018, 7, 356–360. [Google Scholar] [CrossRef]
  13. Ansari, Z.A.; Abu-Nabah, B.A.; Alkhader, M.; Muhammed, A. Experimental evaluation of nonmagnetic metal clad thicknesses over nonmagnetic metals using apparent eddy current conductivity spectroscopy. Measurement 2020, 164, 108053. [Google Scholar] [CrossRef]
  14. Shirakawa, Y. A build-up treatment for thickness gauging of steel plates based on gamma-ray transmission. Appl. Radiat. Isot. 2000, 53, 581–586. [Google Scholar] [CrossRef]
  15. Schneider, D.; Schwarz, T.; Bradford, A.S.; Shan, Q.; Dewhurst, R.J. Controlling the quality of thin films by surface acoustic waves. Ultrasonics 1997, 35, 345–356. [Google Scholar] [CrossRef]
  16. Ollendorf, H.; Schneider, D.; Schwarz, T.; Mucha, A. Non-destructive evaluation of TiN films with interface defects by surface acoustic waves. Surf. Coat. Technol. 1995, 74–75, 246–252. [Google Scholar] [CrossRef]
  17. Lakestani, F.; Coste, J.-F.; Denis, R. Application of ultrasonic Rayleigh waves to thickness measurement of metallic coatings. NDT E Int. 1995, 28, 171–178. [Google Scholar] [CrossRef]
  18. Ostiguy, P.-C.; Quaegebeur, N.; Masson, P. Non-destructive evaluation of coating thickness using guided waves. NDT E Int. 2015, 76, 17–25. [Google Scholar] [CrossRef]
  19. Wu, B.; Li, Y.; Zheng, Y.; He, C. Thickness Measurement of Surface Attachment on Plate with SH Wave. Chin. J. Mech. Eng. 2012, 48, 78–84. [Google Scholar] [CrossRef]
  20. Kanja, J.; Mills, R.; Li, X.; Brunskill, H.; Hunter, A.K.; Dwyer-Joyce, R.S. Non-contact measurement of the thickness of a surface film using a superimposed ultrasonic standing wave. Ultrasonics 2021, 110, 106291. [Google Scholar] [CrossRef]
  21. Ma, Z.; Luo, Z.; Lin, L.; Krishnaswamy, S.; Lei, M. Quantitative characterization of the interfacial roughness and thickness of inhomogeneous coatings based on ultrasonic reflection coefficient phase spectrum. NDT E Int. 2019, 102, 16–25. [Google Scholar] [CrossRef]
  22. Zhao, Y.; Lin, L.; Li, X.M.; Lei, M.K. Simultaneous determination of the coating thickness and its longitudinal velocity by ultrasonic nondestructive method. NDT E Int. 2010, 43, 579–585. [Google Scholar] [CrossRef]
  23. Zhou, Z.; Zhang, K.; Zhou, J.; Sun, G.; Wang, J. Application of laser ultrasonic technique for non-contact detection of structural surface-breaking cracks. Opt. Laser Technol. 2015, 73, 173–178. [Google Scholar] [CrossRef]
  24. Ji, B.; Zhang, Q.; Cao, J.; Li, H.; Zhang, B. Non-contact detection of delamination in stainless steel/carbon steel composites with laser ultrasonic. Optik 2021, 226, 165893. [Google Scholar] [CrossRef]
  25. Ji, B.; Zhang, Q.; Cao, J.; Zhang, B.; Zhang, L. Delamination Detection in Bimetallic Composite Using Laser Ultrasonic Bulk Waves. Appl. Sci. 2021, 11, 636. [Google Scholar] [CrossRef]
  26. Klein, M.; Bodenhamer, T.; Raita, E.; Kamshilin, A. Laser based online monitoring of eccentricity and wall thickness of seamless tube. NDT World Rev. 2006, 33, 32–33. [Google Scholar]
  27. Lévesque, D.; Kruger, S.E.; Lamouche, G.; Kolarik Ii, R.; Jeskey, G.; Choquet, M.; Monchalin, J.P. Thickness and grain size monitoring in seamless tube-making process using laser ultrasonics. NDT E Int. 2006, 39, 622–626. [Google Scholar] [CrossRef] [Green Version]
  28. Zhang, K.; Li, S.; Zhou, Z. Detection of disbonds in multi-layer bonded structures using the laser ultrasonic pulse-echo mode. Ultrasonics 2019, 94, 411–418. [Google Scholar] [CrossRef]
  29. Liu, P.; Nazirah, A.W.; Sohn, H. Numerical simulation of damage detection using laser-generated ultrasound. Ultrasonics 2016, 69, 248–258. [Google Scholar] [CrossRef]
  30. Khorasani, M.; Ghasemi, A.; Leary, M.; Sharabian, E.; Cordova, L.; Gibson, I.; Downing, D.; Bateman, S.; Brandt, M.; Rolfe, B. The effect of absorption ratio on meltpool features in laser-based powder bed fusion of IN718. Opt. Laser Technol. 2022, 153, 108263. [Google Scholar] [CrossRef]
Figure 1. The ultrasonic propagation model of pulse transmission method.
Coatings 13 00645 g001
Figure 2. The schematic diagram of 2D axisymmetric finite element model.
Coatings 13 00645 g002
Figure 3. Experimental platform: (a) the schematic diagram of measurement system; (b) the system delay sequence diagram.
Coatings 13 00645 g003
Figure 4. The Cu/Al composites sample.
Coatings 13 00645 g004
Figure 5. The normalized out-of-plane velocity curves.
Coatings 13 00645 g005
Figure 6. The influence of PRD and radius of pulsed laser spot on calculated results: (a) Cu; (b) Al.
Coatings 13 00645 g006
Figure 7. Waveform overlapping caused by thin copper layer.
Coatings 13 00645 g007
Figure 8. The signal collected by the system time delay calibration experiment.
Coatings 13 00645 g008
Figure 9. The signals collected by experiment.
Coatings 13 00645 g009
Table 1. Material properties of Cu/Al laminate applied for numerical simulation.
Material PropertiesCuAl
Thermal conductivity (W × m−1 × K−1)386.4209
Density (g × cm³)8.962.71
Poisson’s ratio0.3260.33
Thermal expansion coefficient (10−6K−1)17.223.6
Young’s modulus (GPa)11971.7
Heat capacity (J × kg−1 × K−1)394880
Table 2. The thickness of the copper layer calculated based on simulation data.
Copper Layer Thickness (μm)t0 (ns)t1 (ns)Calculated Thickness (μm)Absolute Error (μm)Relative Error (%)
100428.77474.1499.9138−0.08620.0862
80424.18460.6480.29220.29220.3653
60419.68447.0660.29620.29620.4937
Table 3. The experimental data and calculated results.
Position
t0 (ns)588.5530.5510.0
t1 (ns)786.0610.5552.5
d (mm)0.43490.17620.0936
L (mm)2.50282.50752.4966
d + L (mm)2.93782.68372.5902
Sample thickness (mm)2.9822.7322.648
Absolute error (mm)0.04420.04830.0575
Relative error (%)1.481.772.17
Disclaimer/Publisher’s Note: The statements, opinions and data contained in all publications are solely those of the individual author(s) and contributor(s) and not of MDPI and/or the editor(s). MDPI and/or the editor(s) disclaim responsibility for any injury to people or property resulting from any ideas, methods, instructions or products referred to in the content.

