
Densification, Microstructure and Anisotropic Corrosion Behavior of Al-Mg-Mn-Sc-Er-Zr Alloy Processed by Selective Laser Melting
Abstract
:1. Introduction
2. Materials and Methods
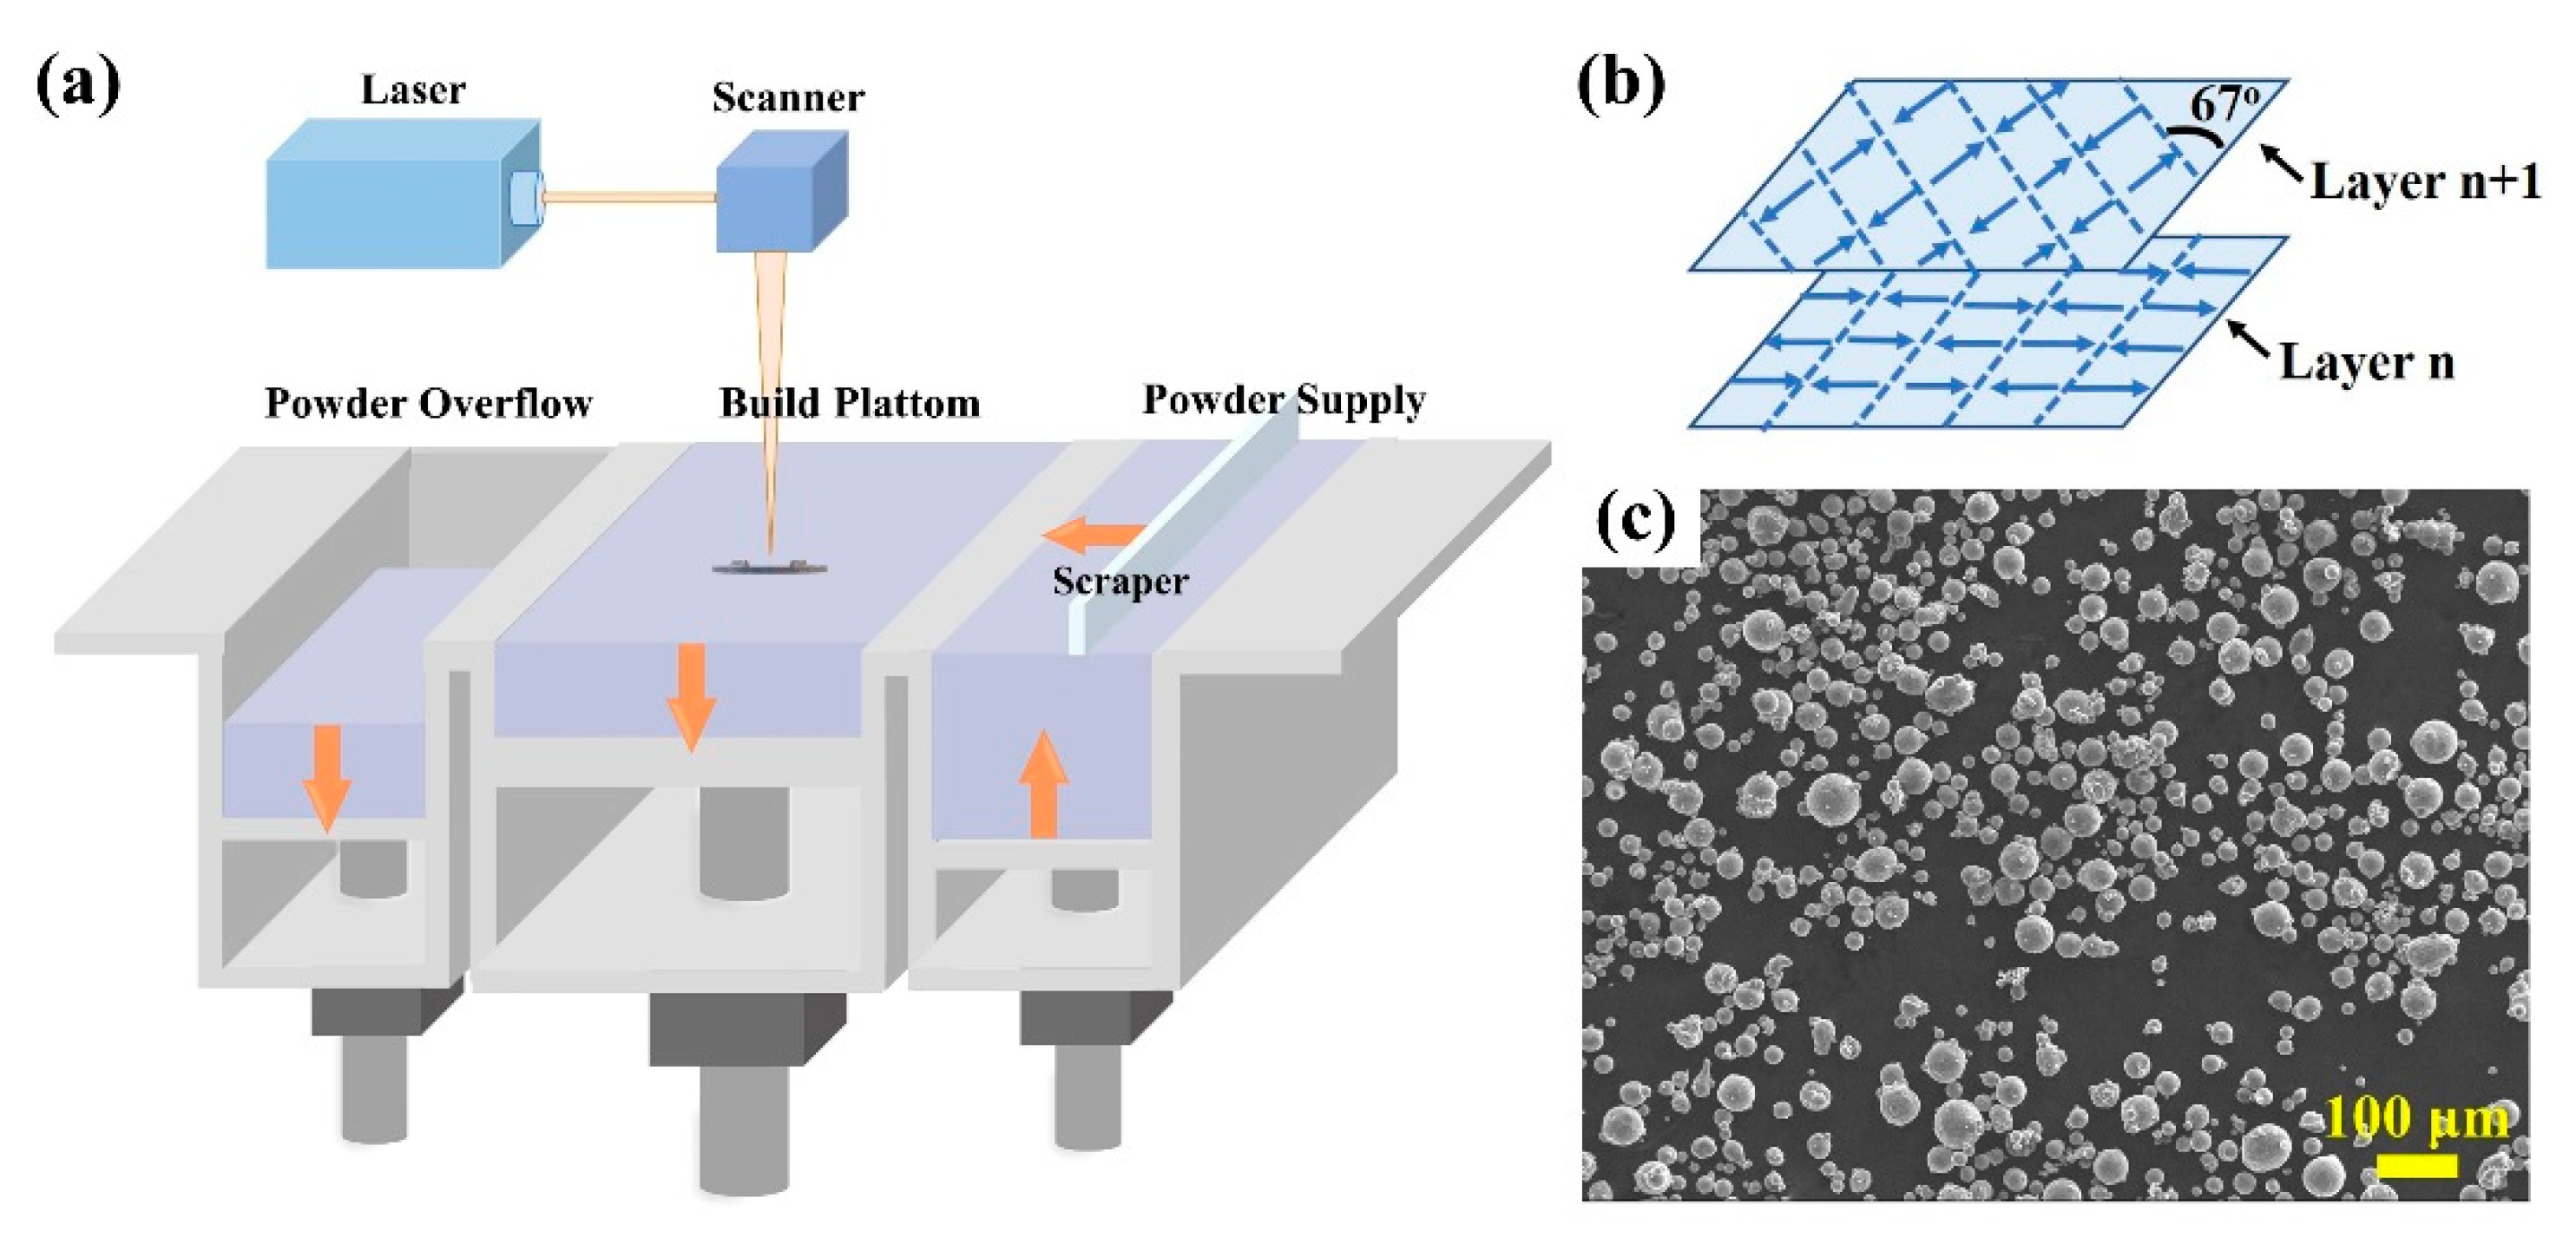
2.1. Powder Materials and SLM Process
2.2. Measurements of Corrosion Behavior
2.3. Microstructure Characterizations
3. Results
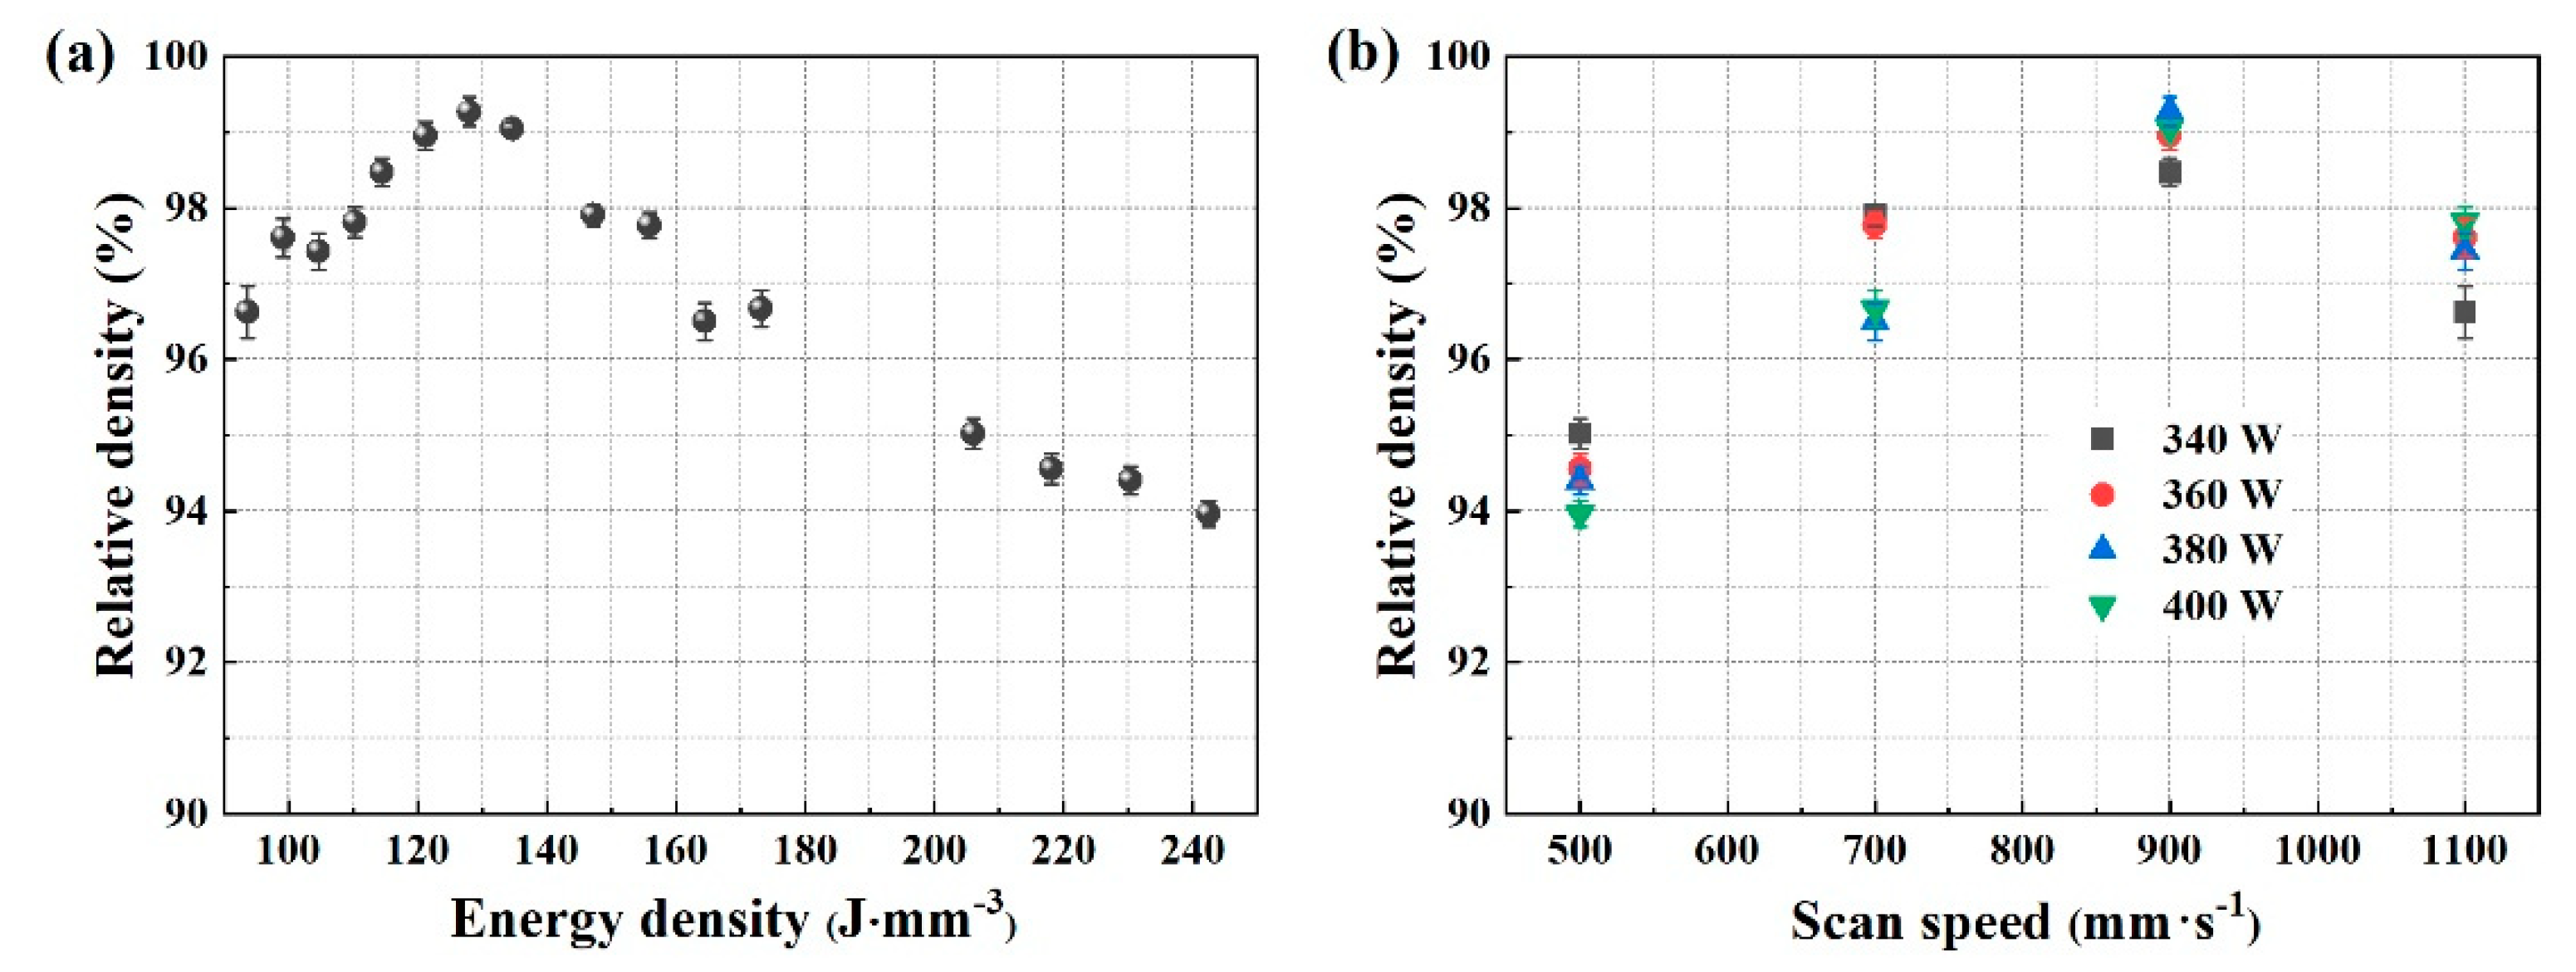
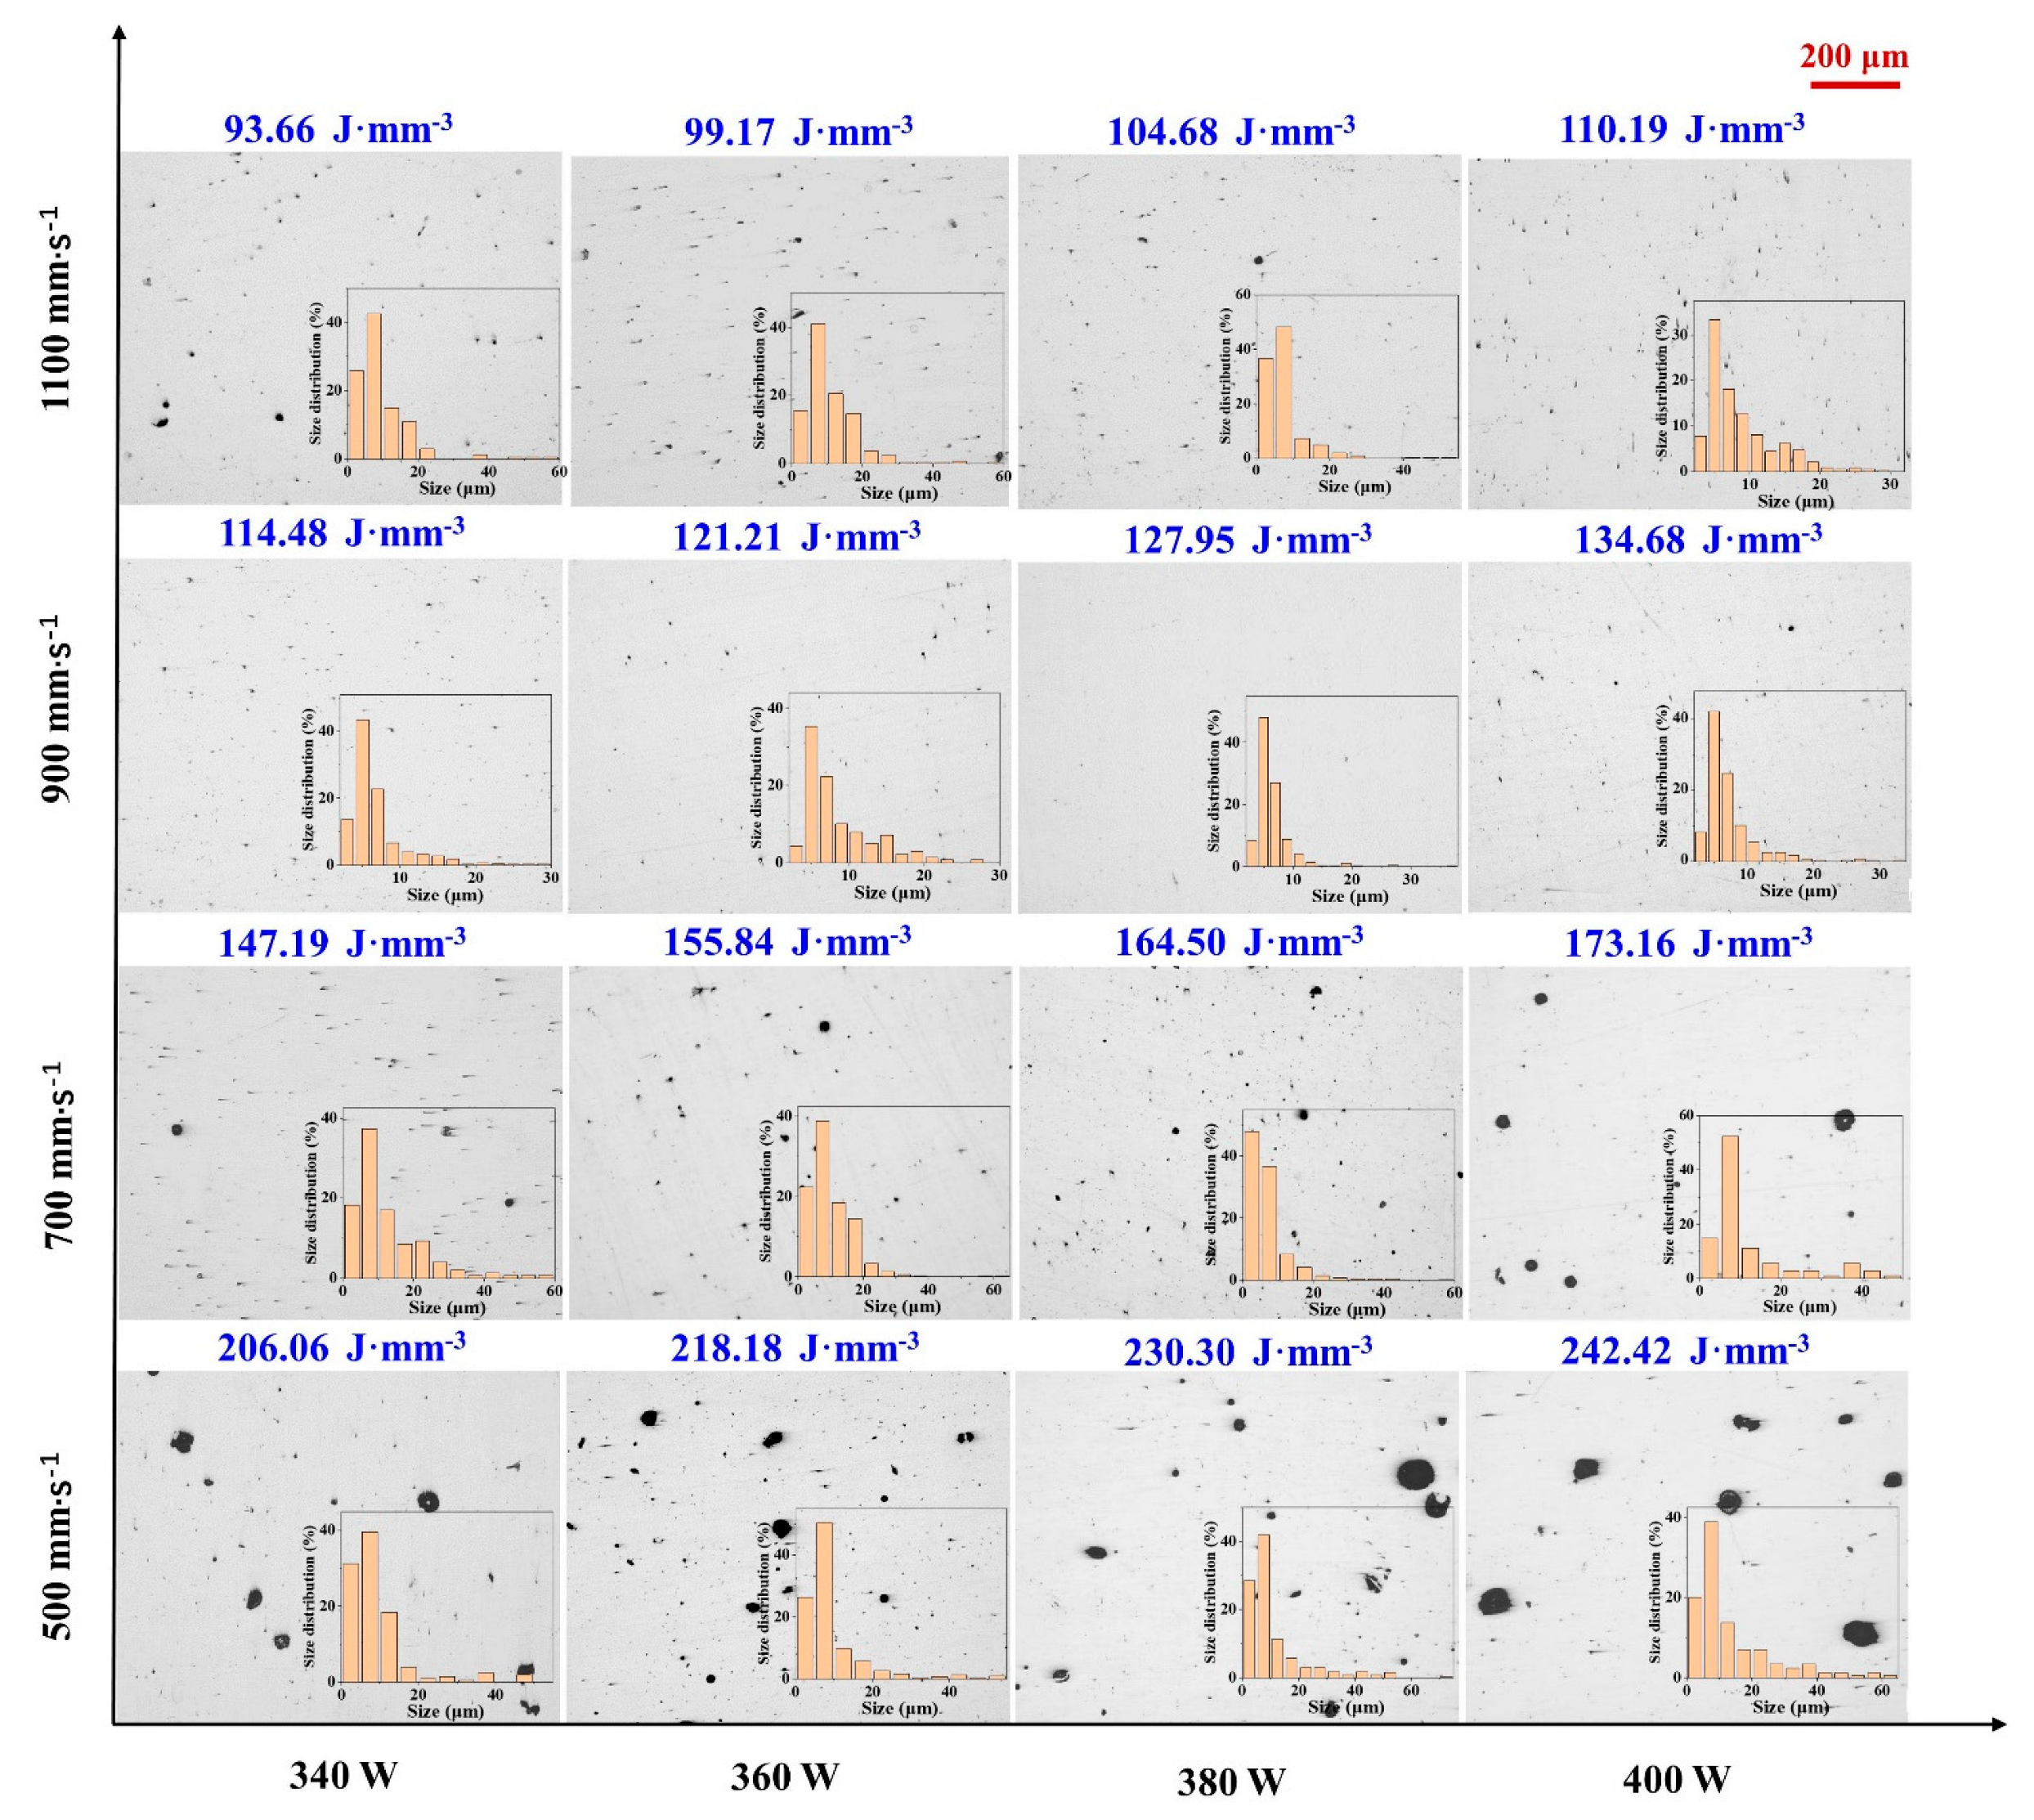
3.1. Densification
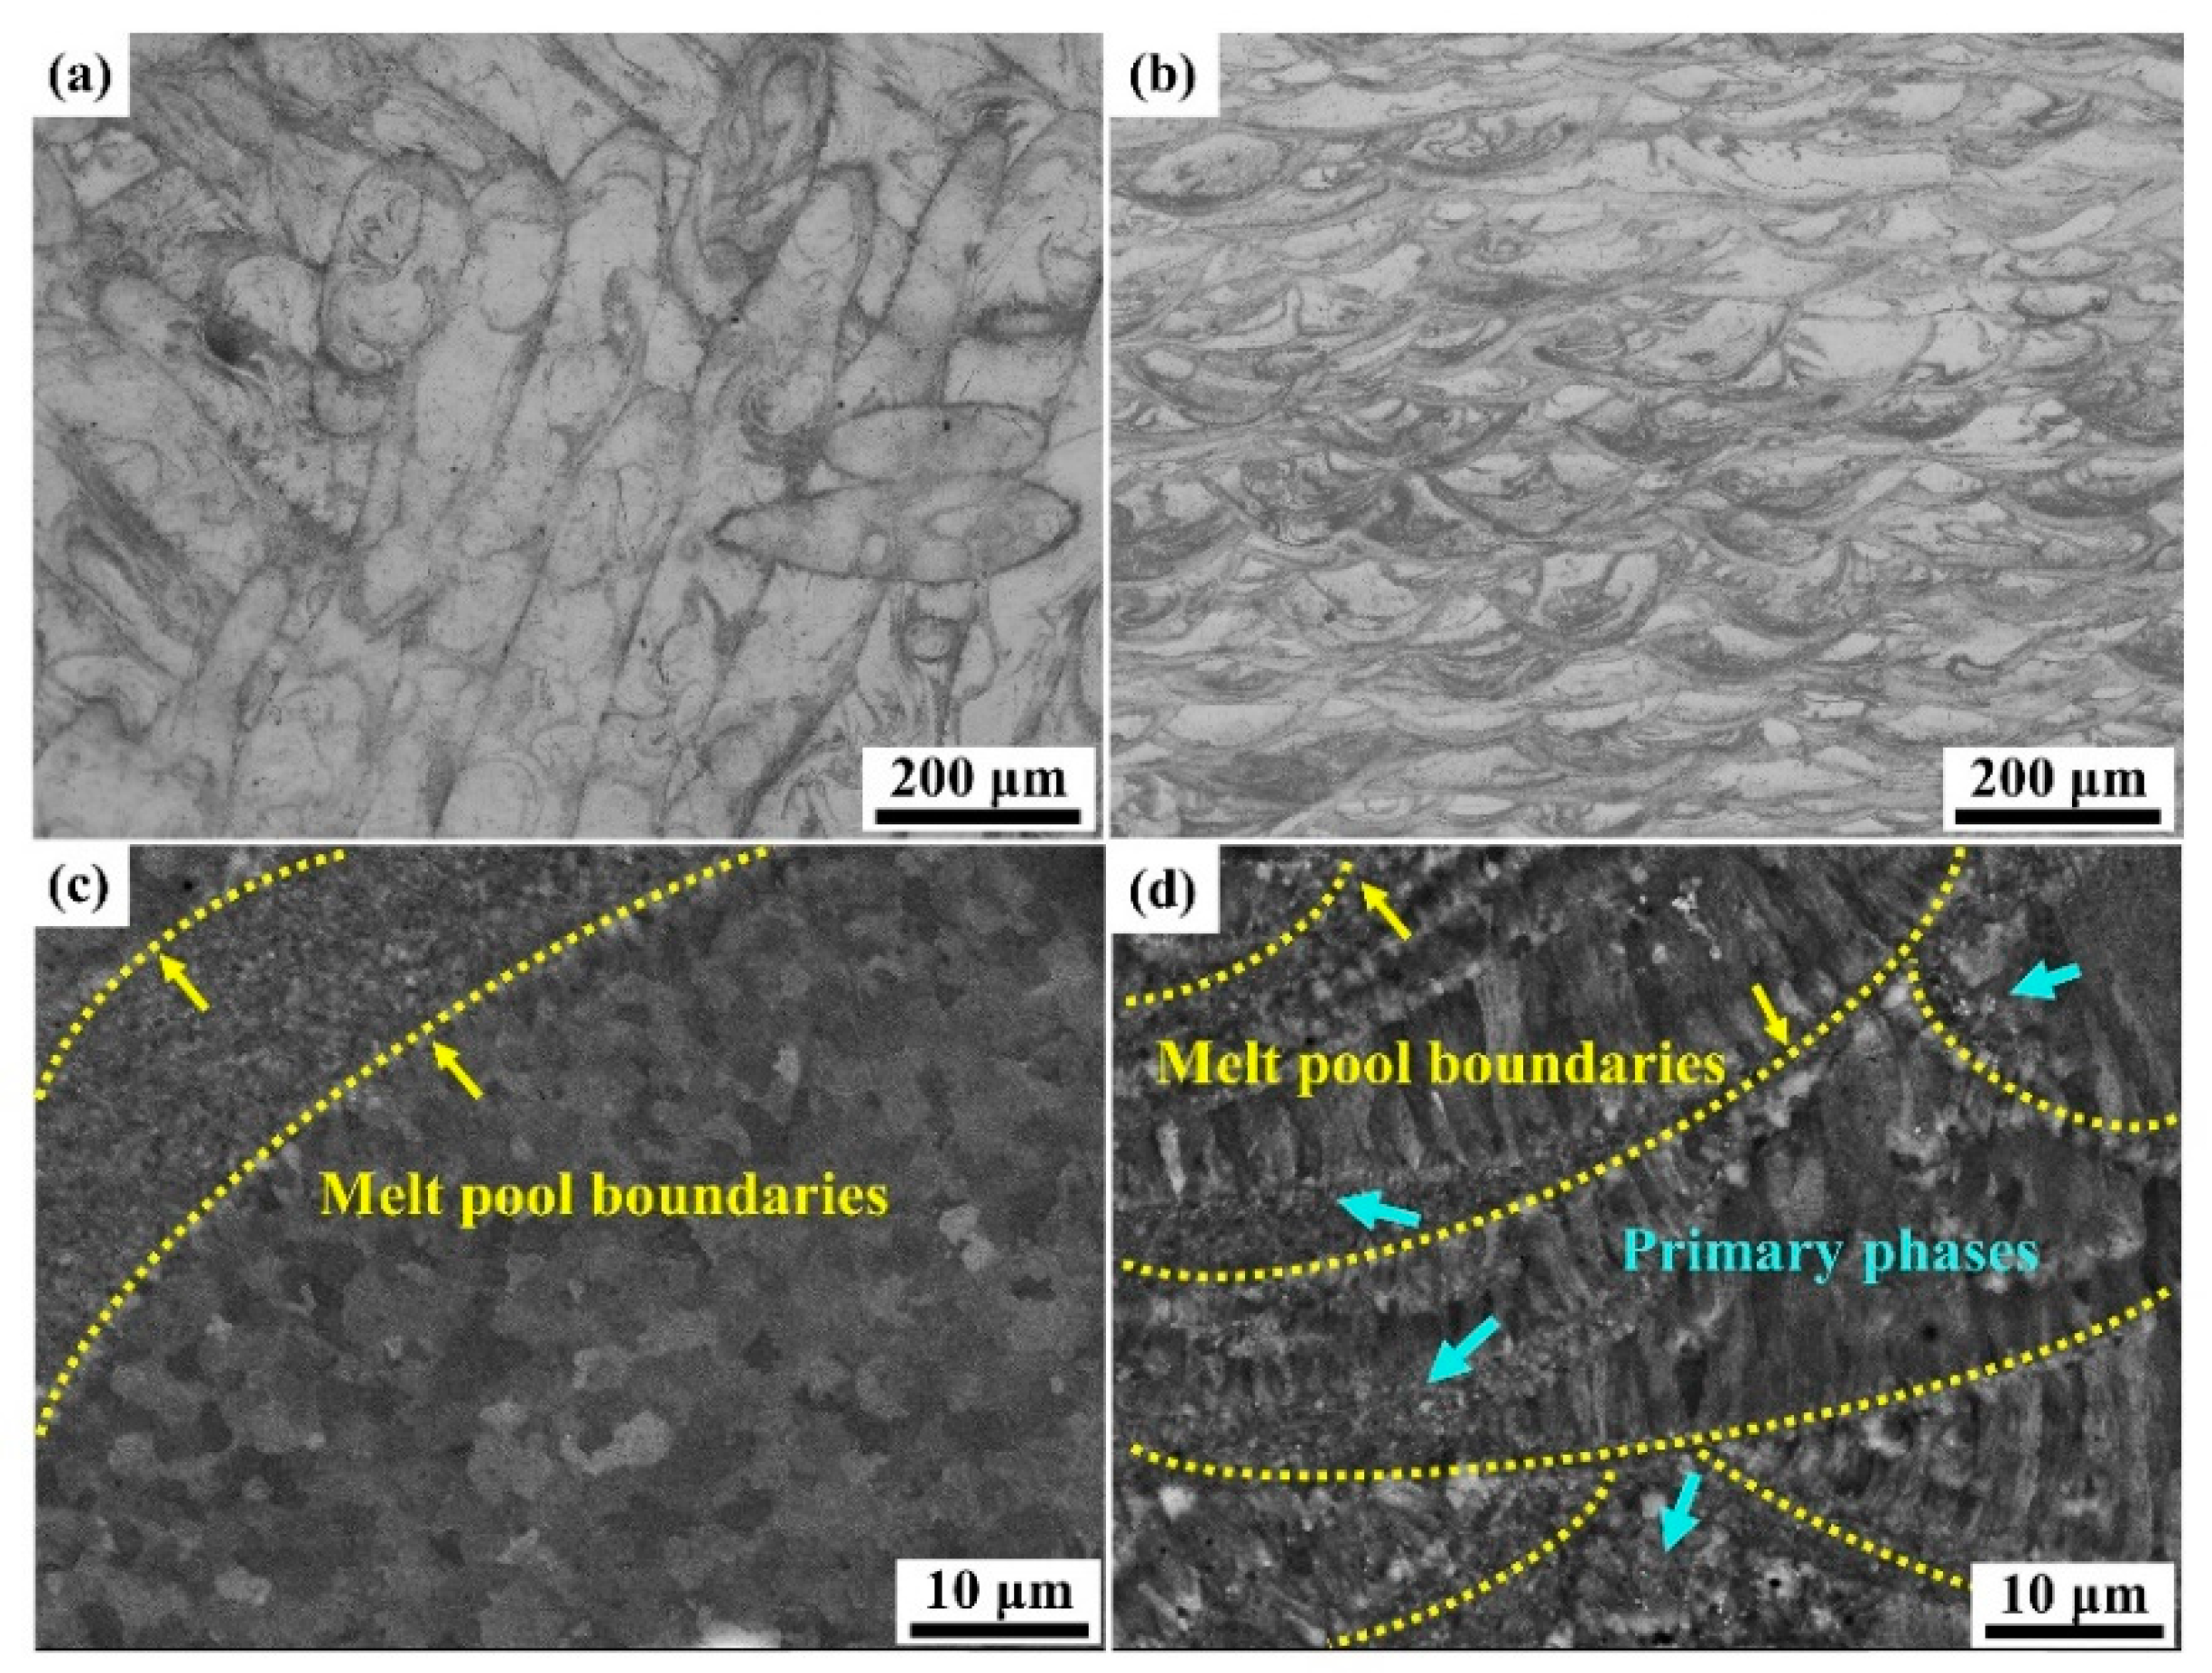
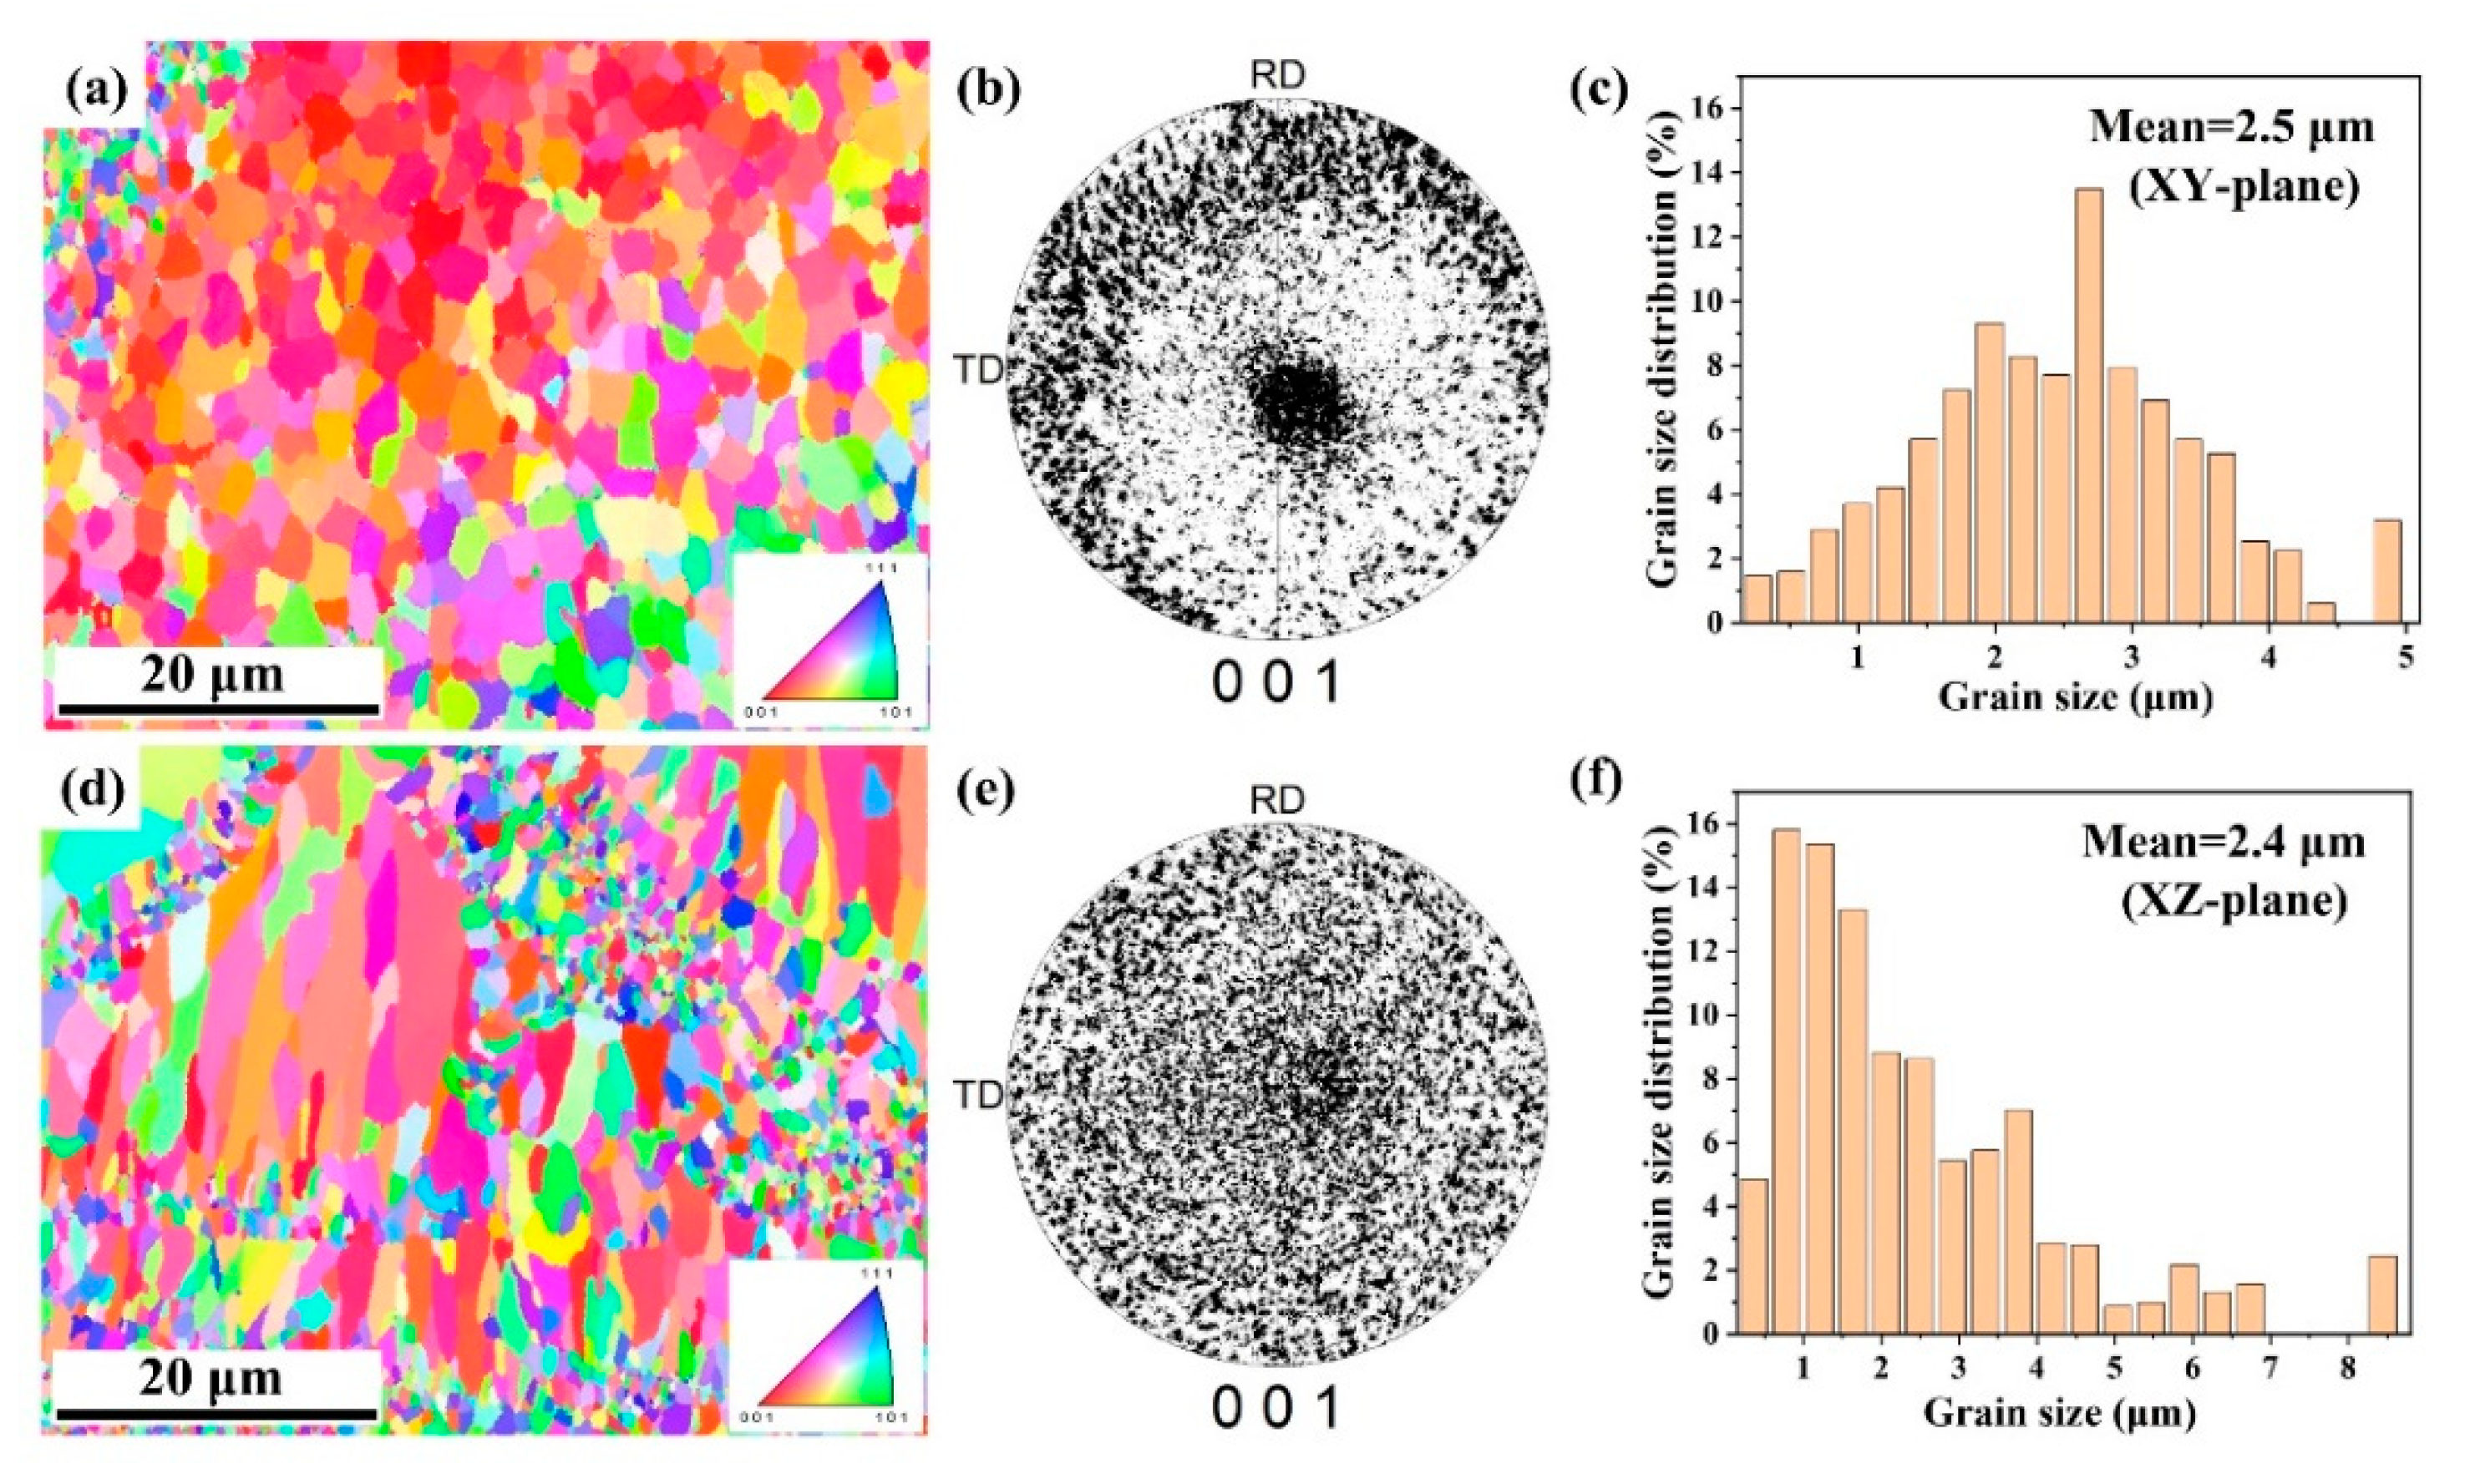
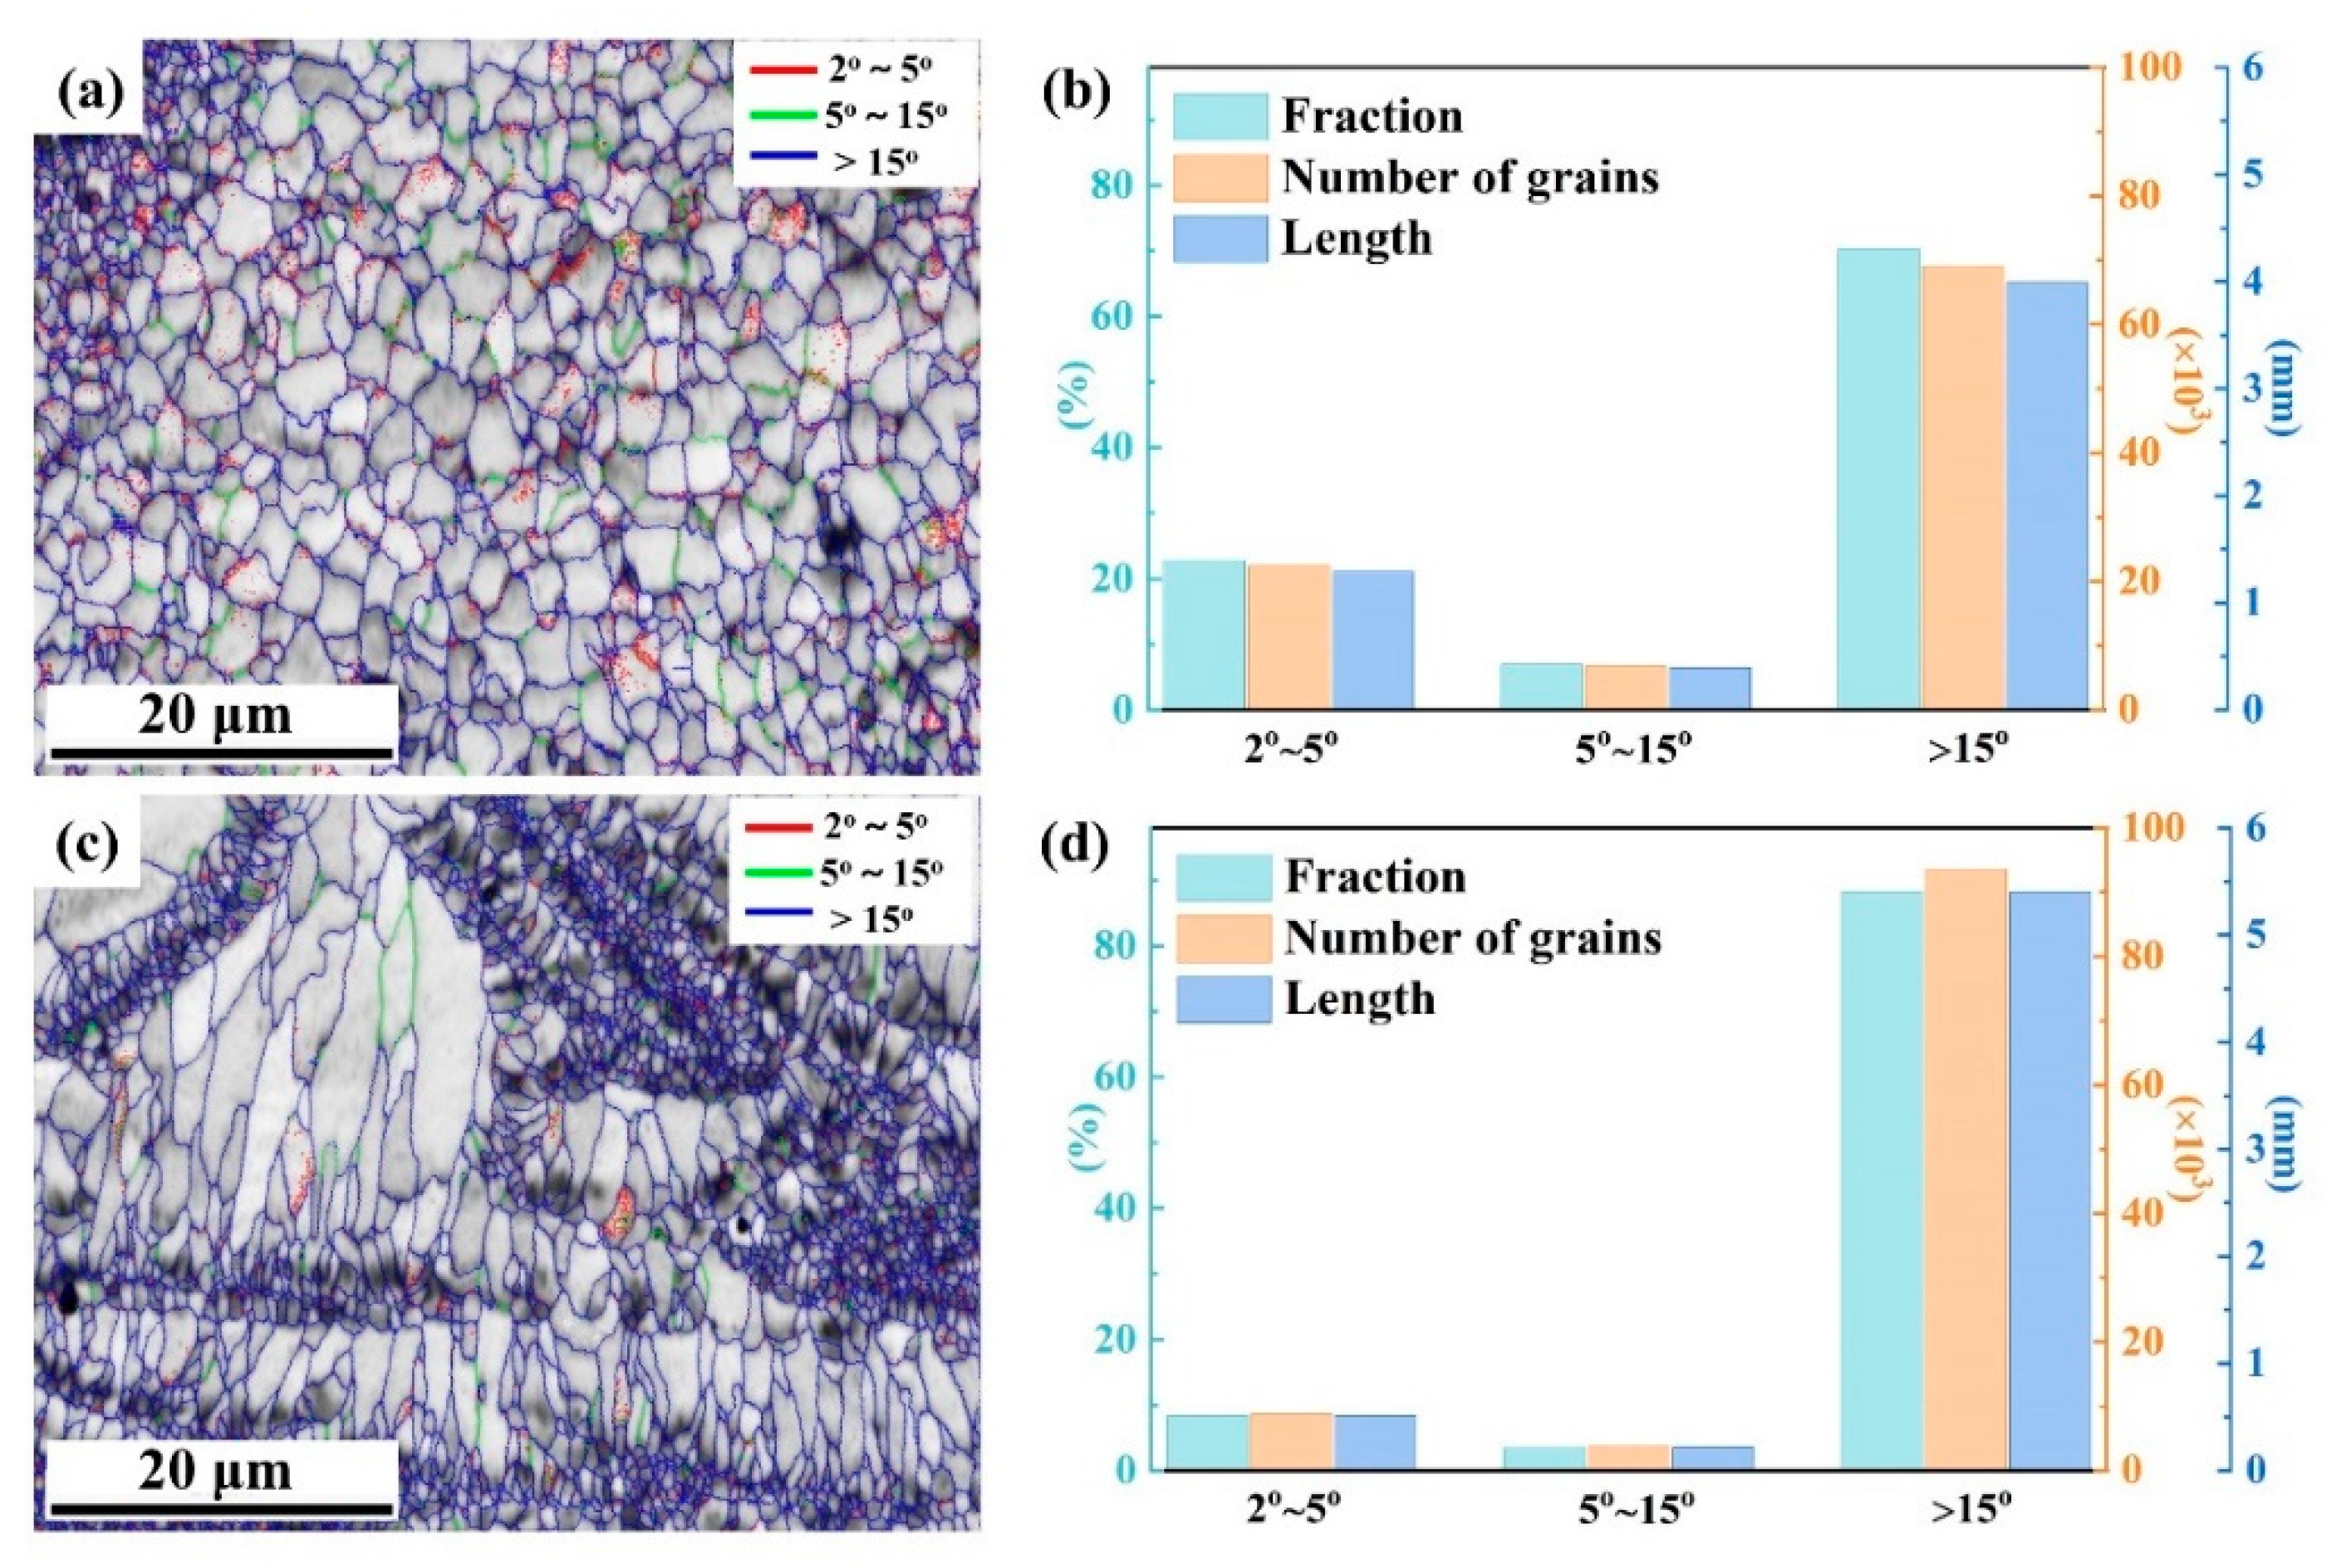
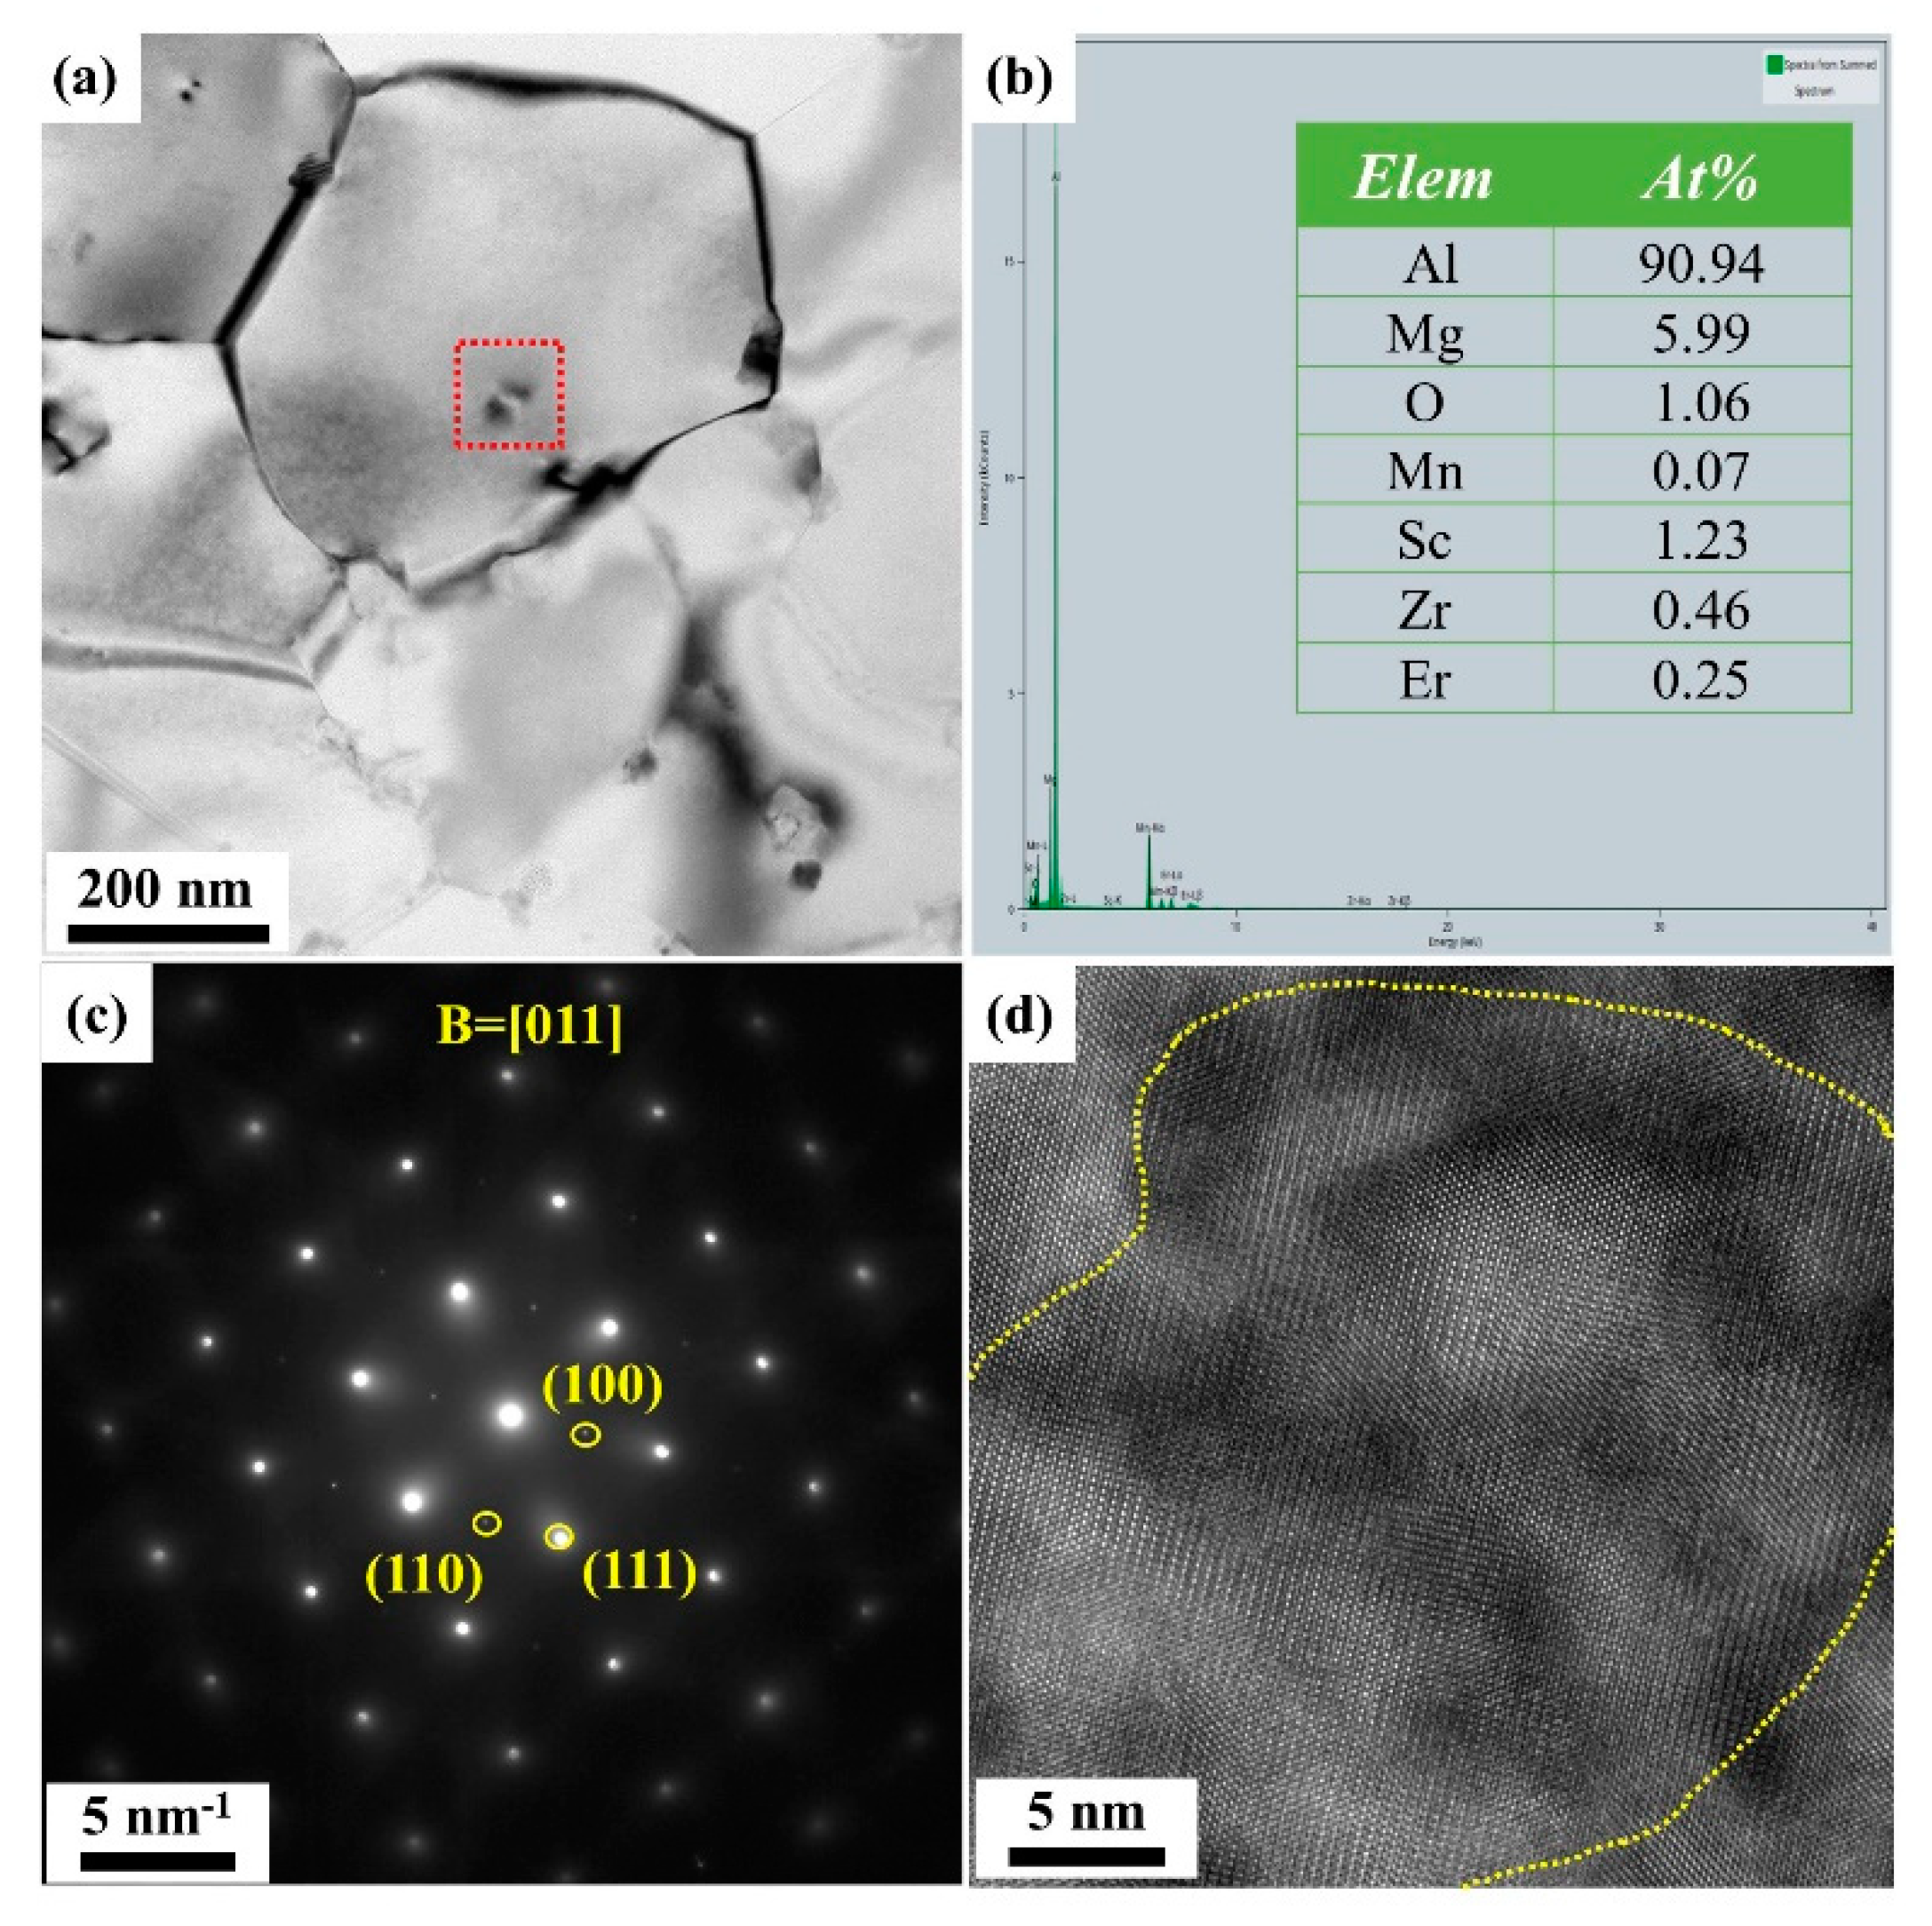
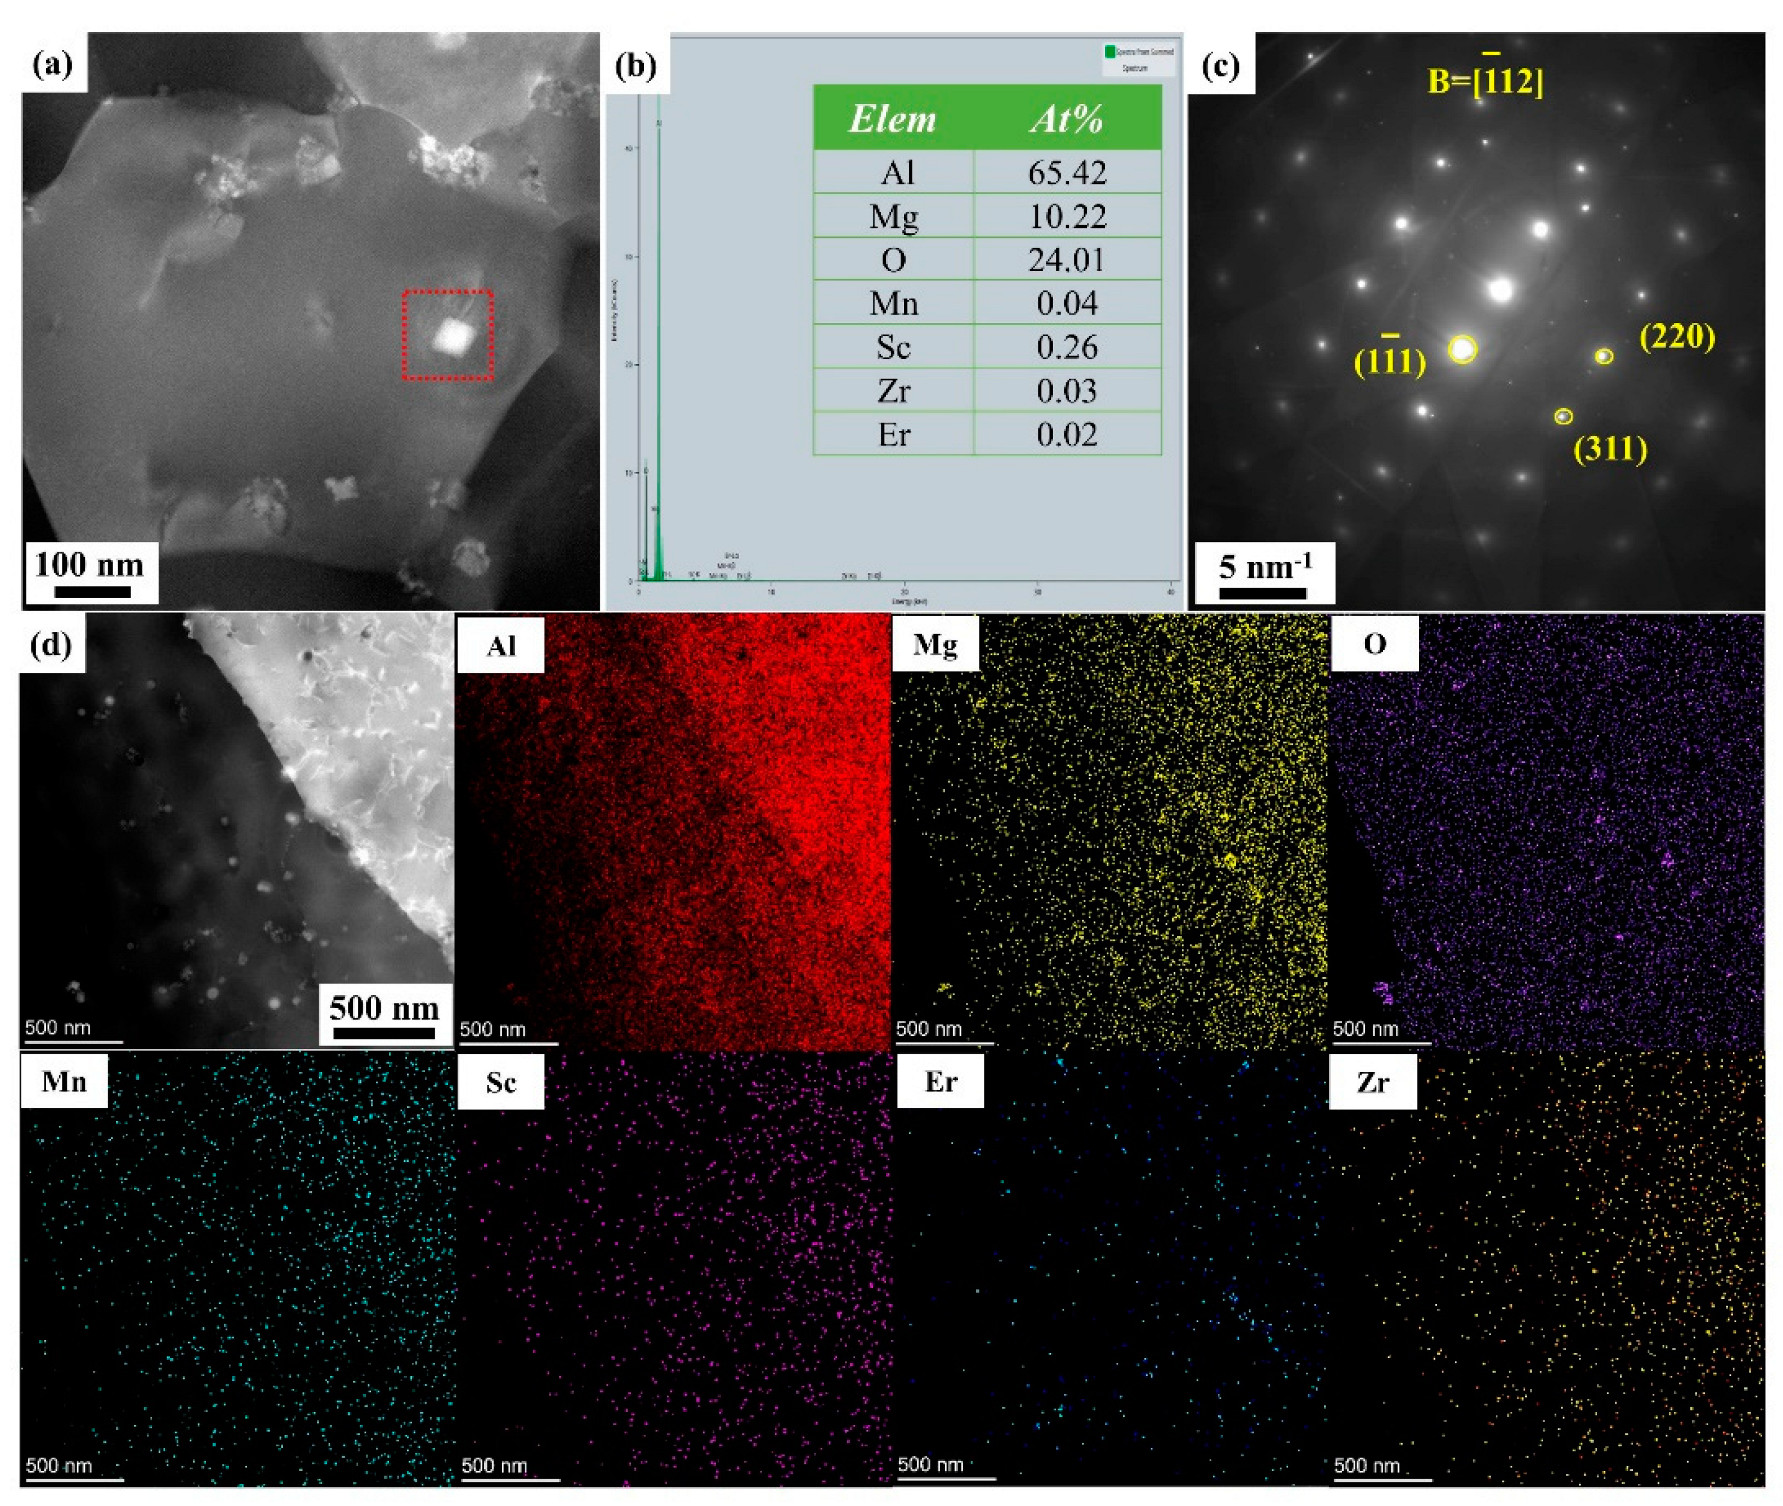
3.2. Microstructure
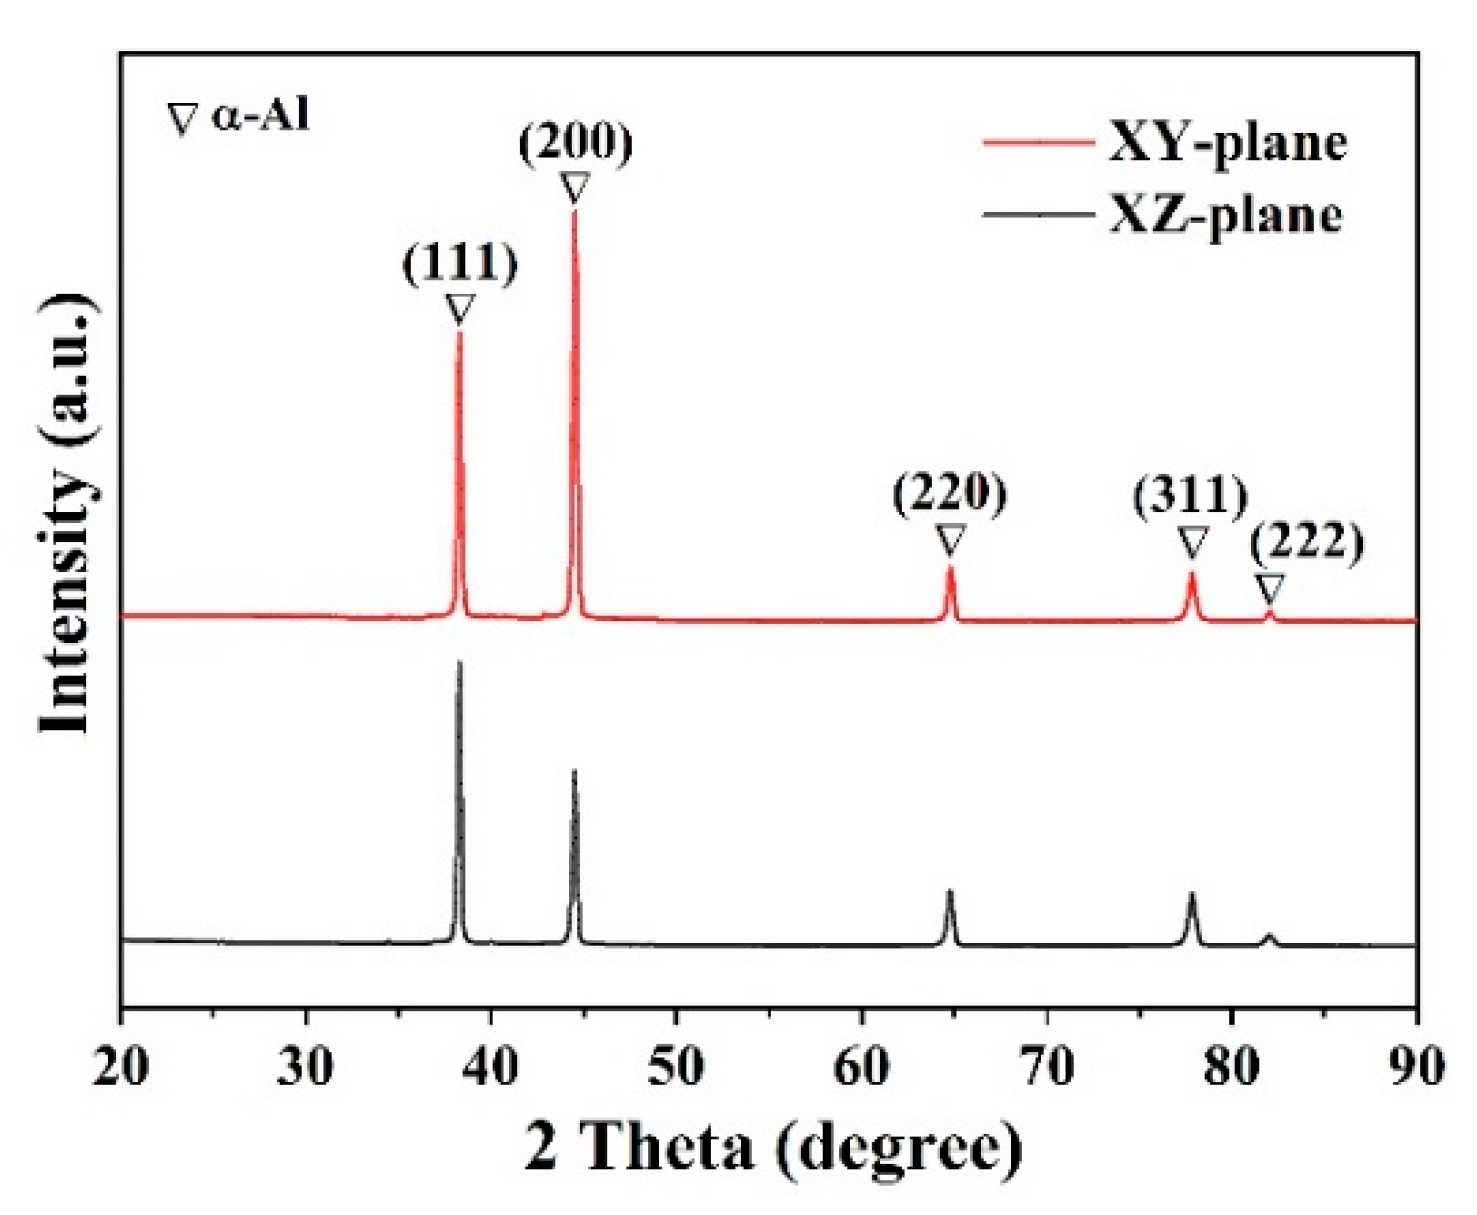
3.3. Phase Characterization
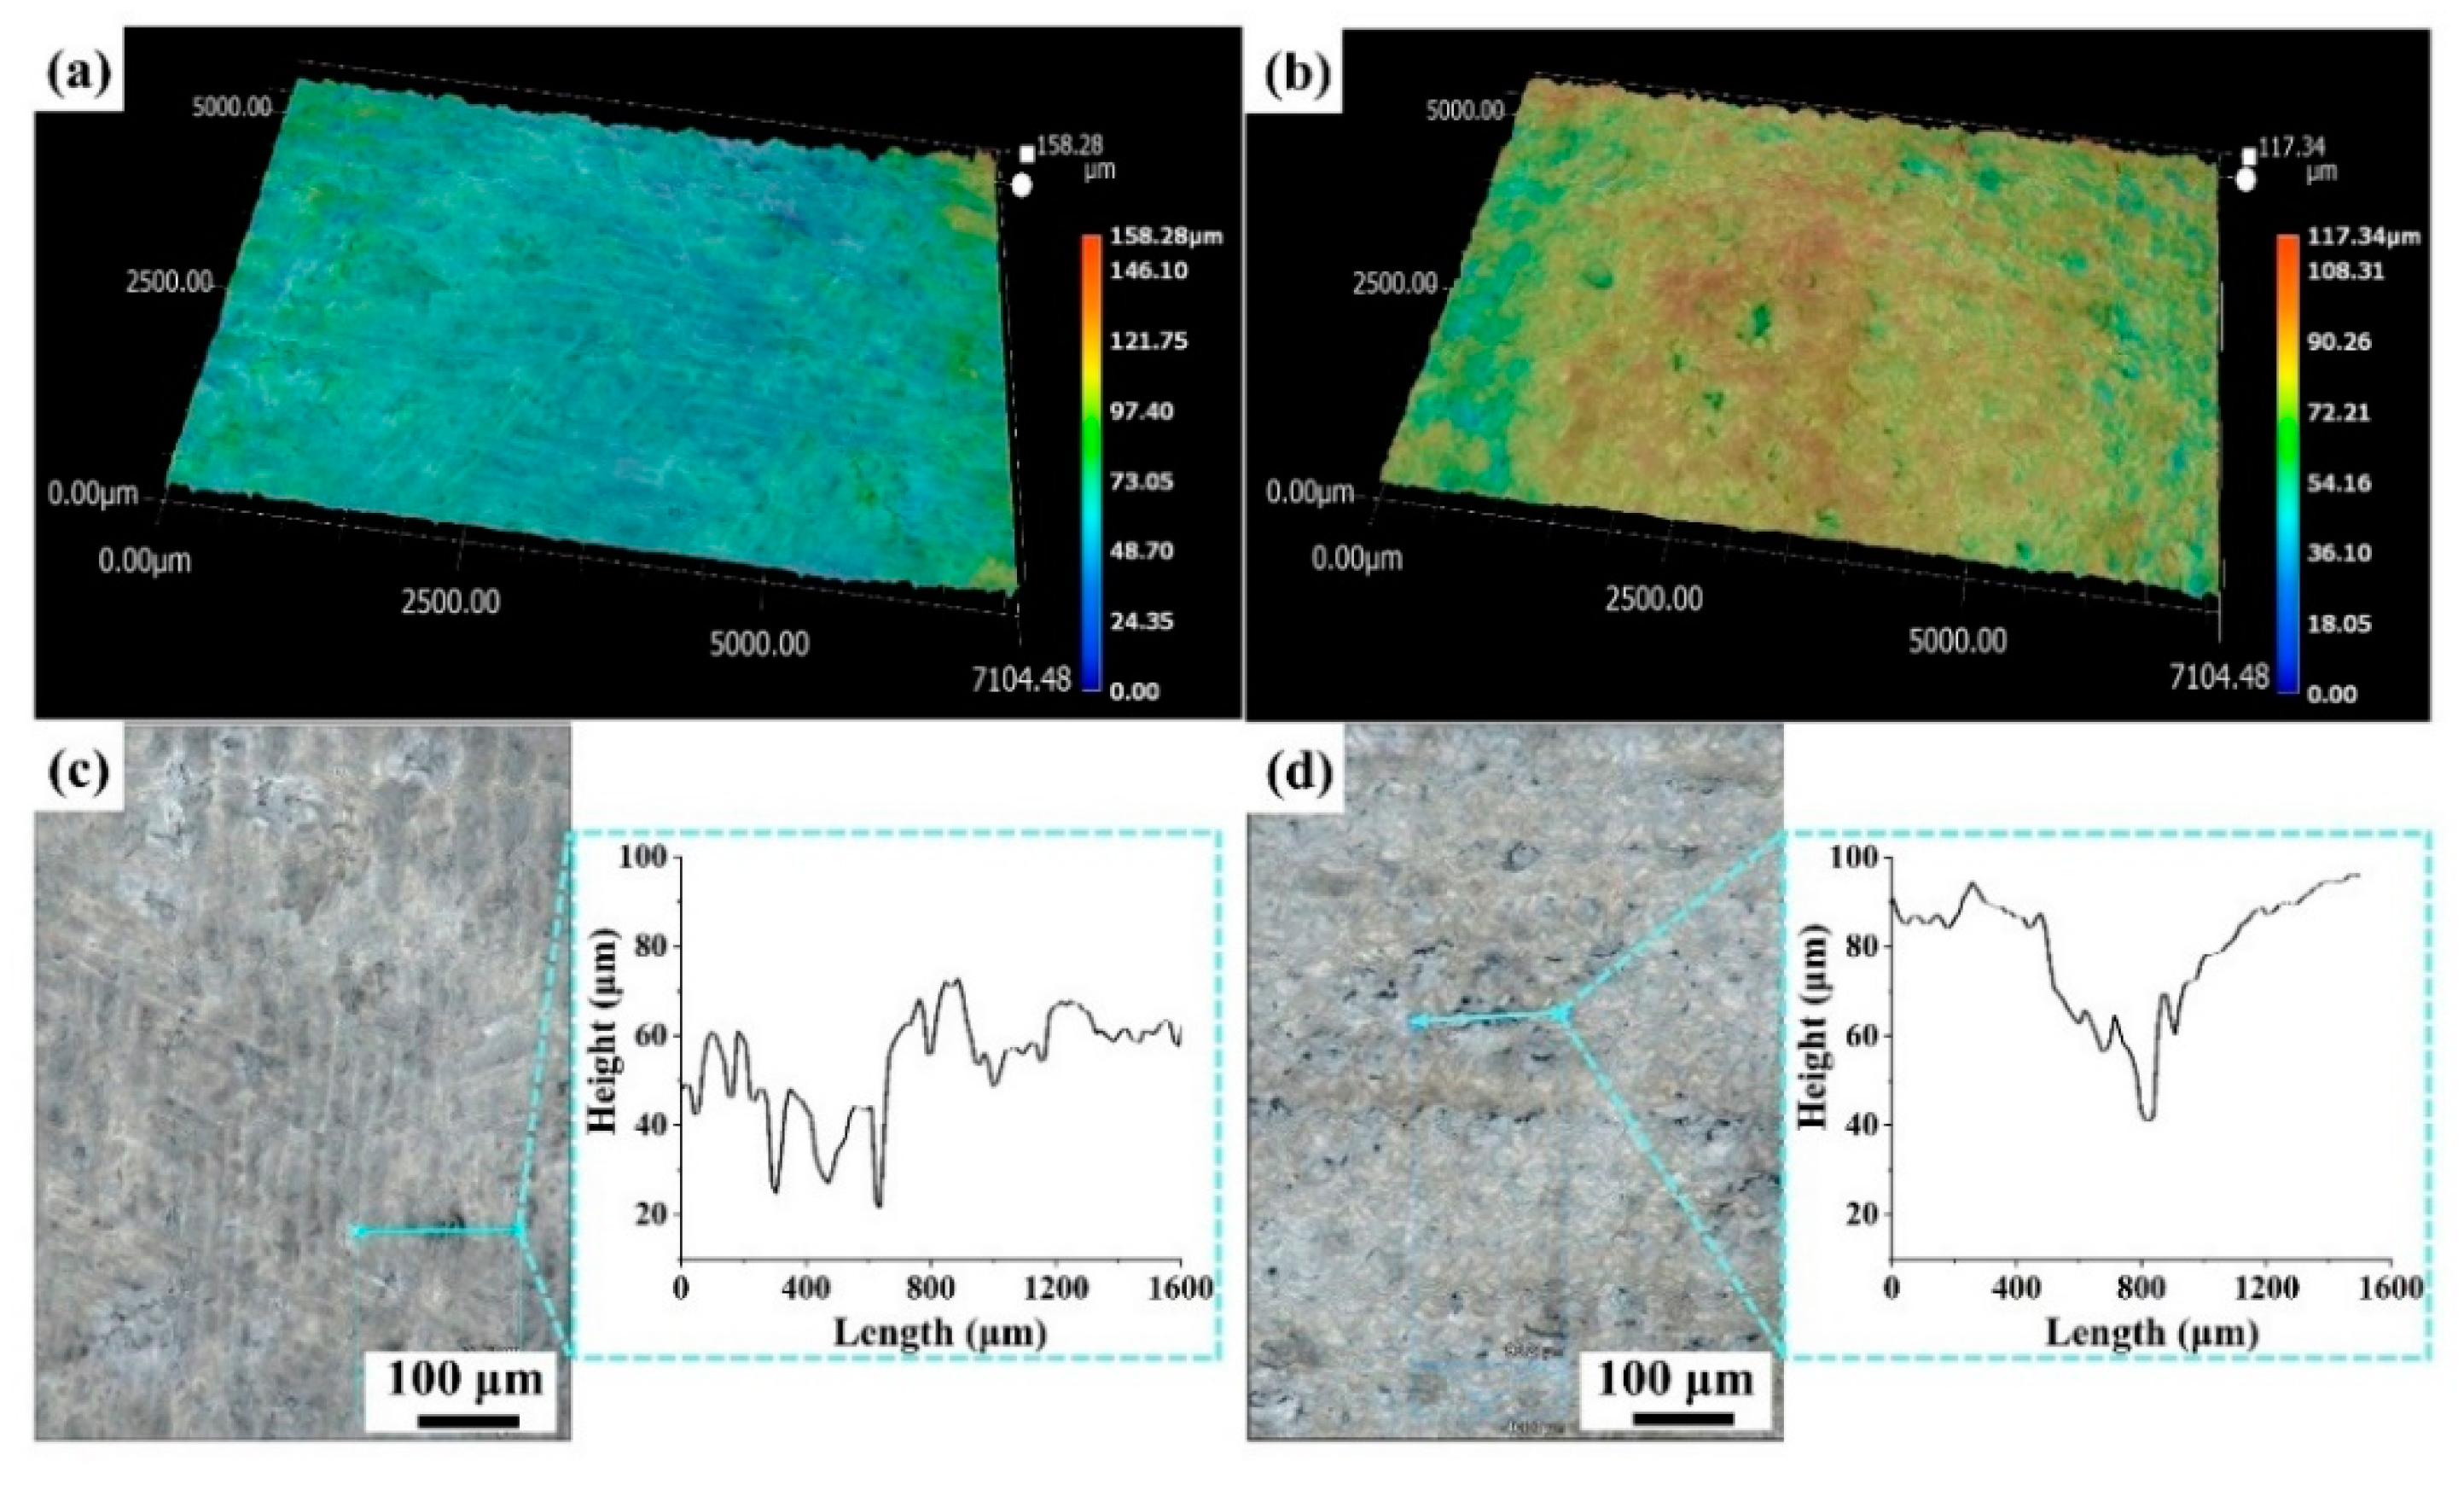
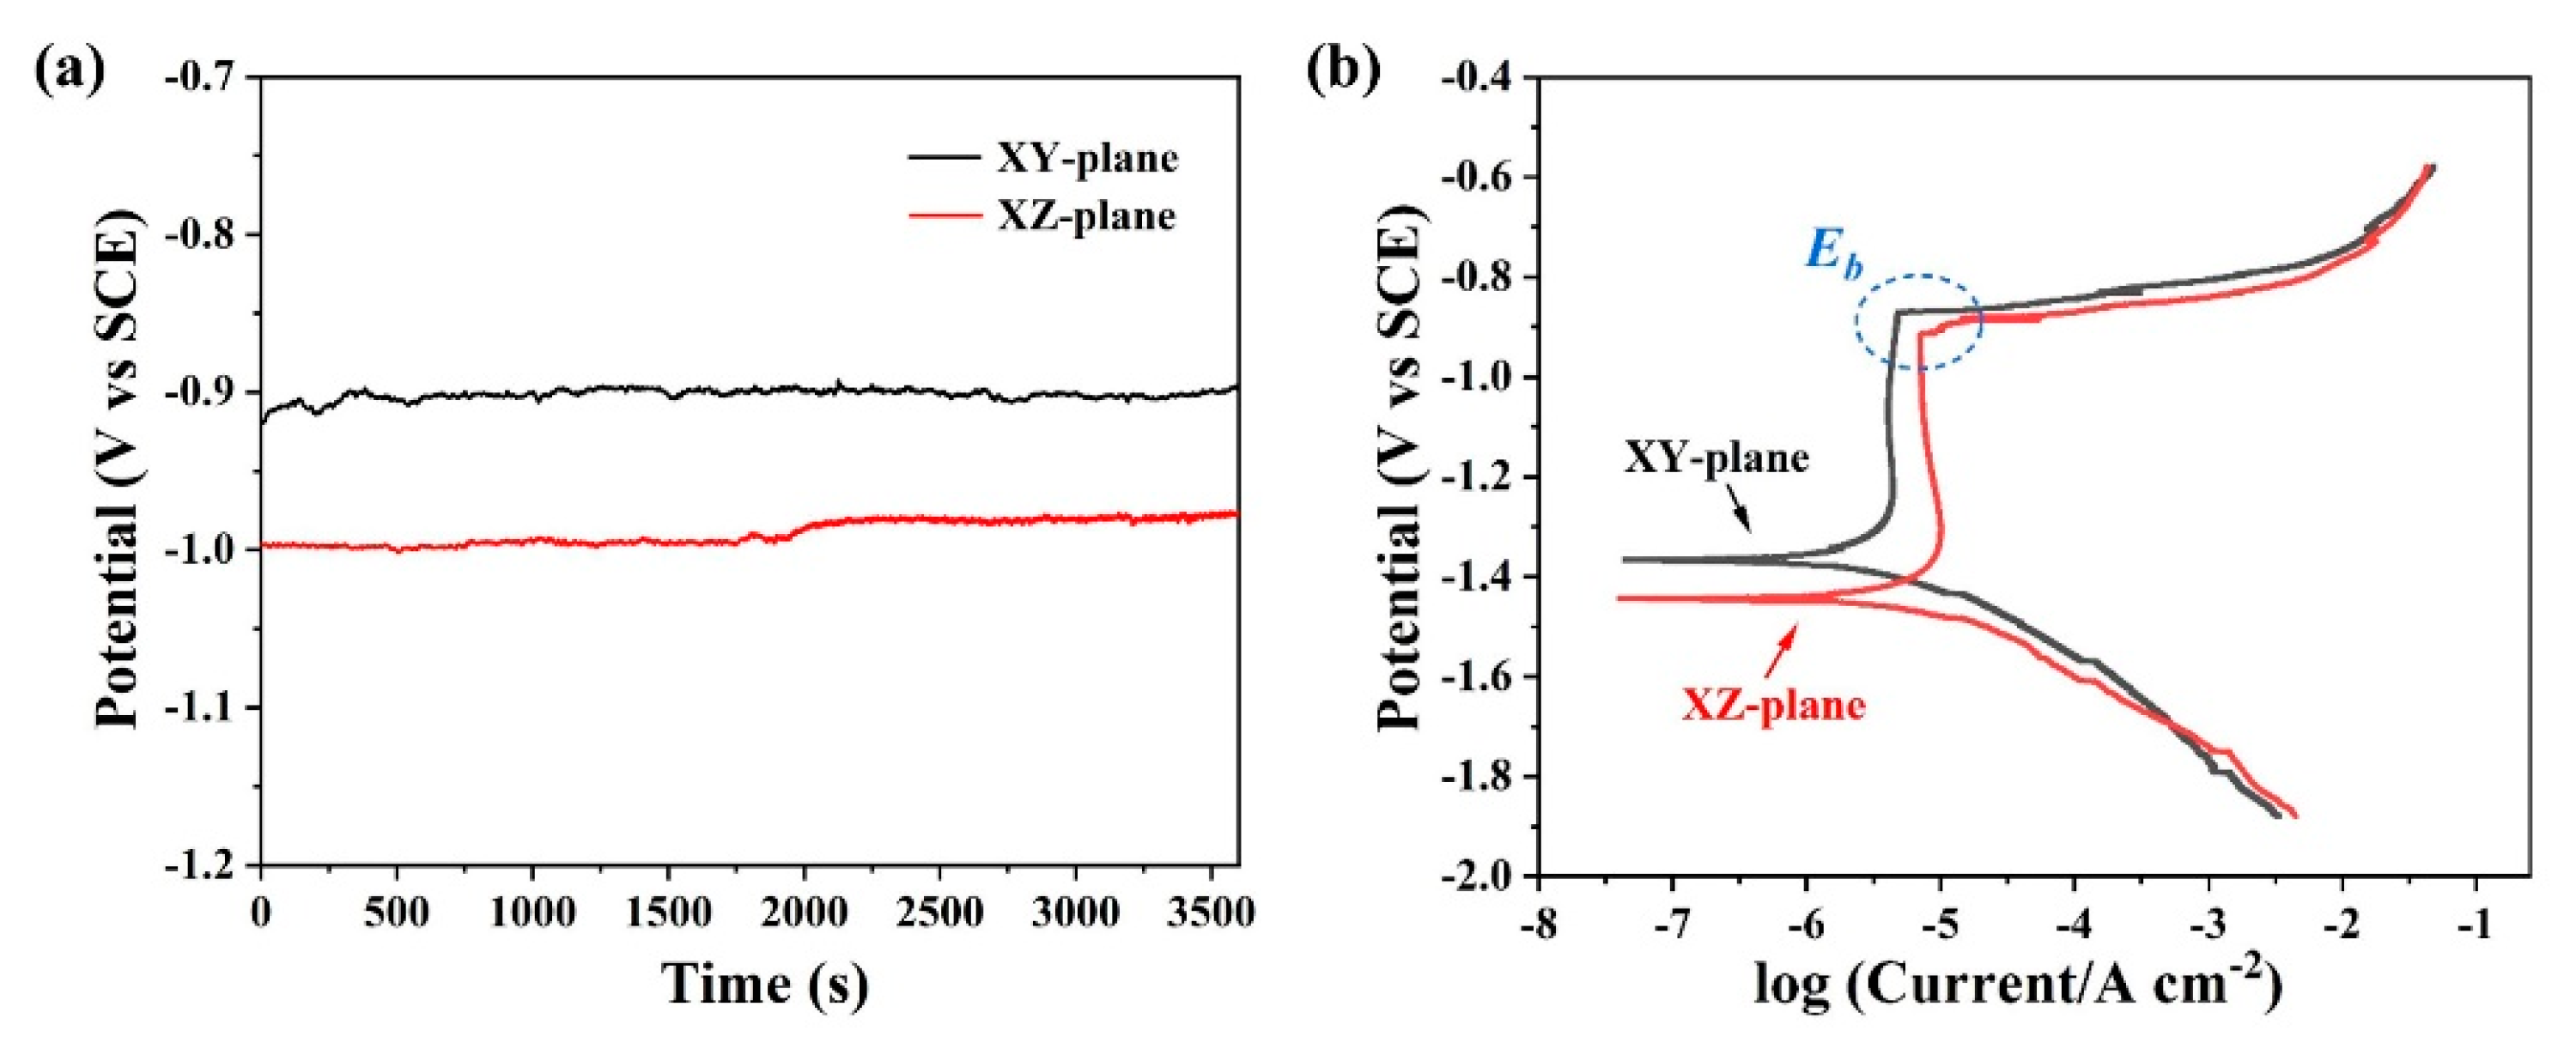
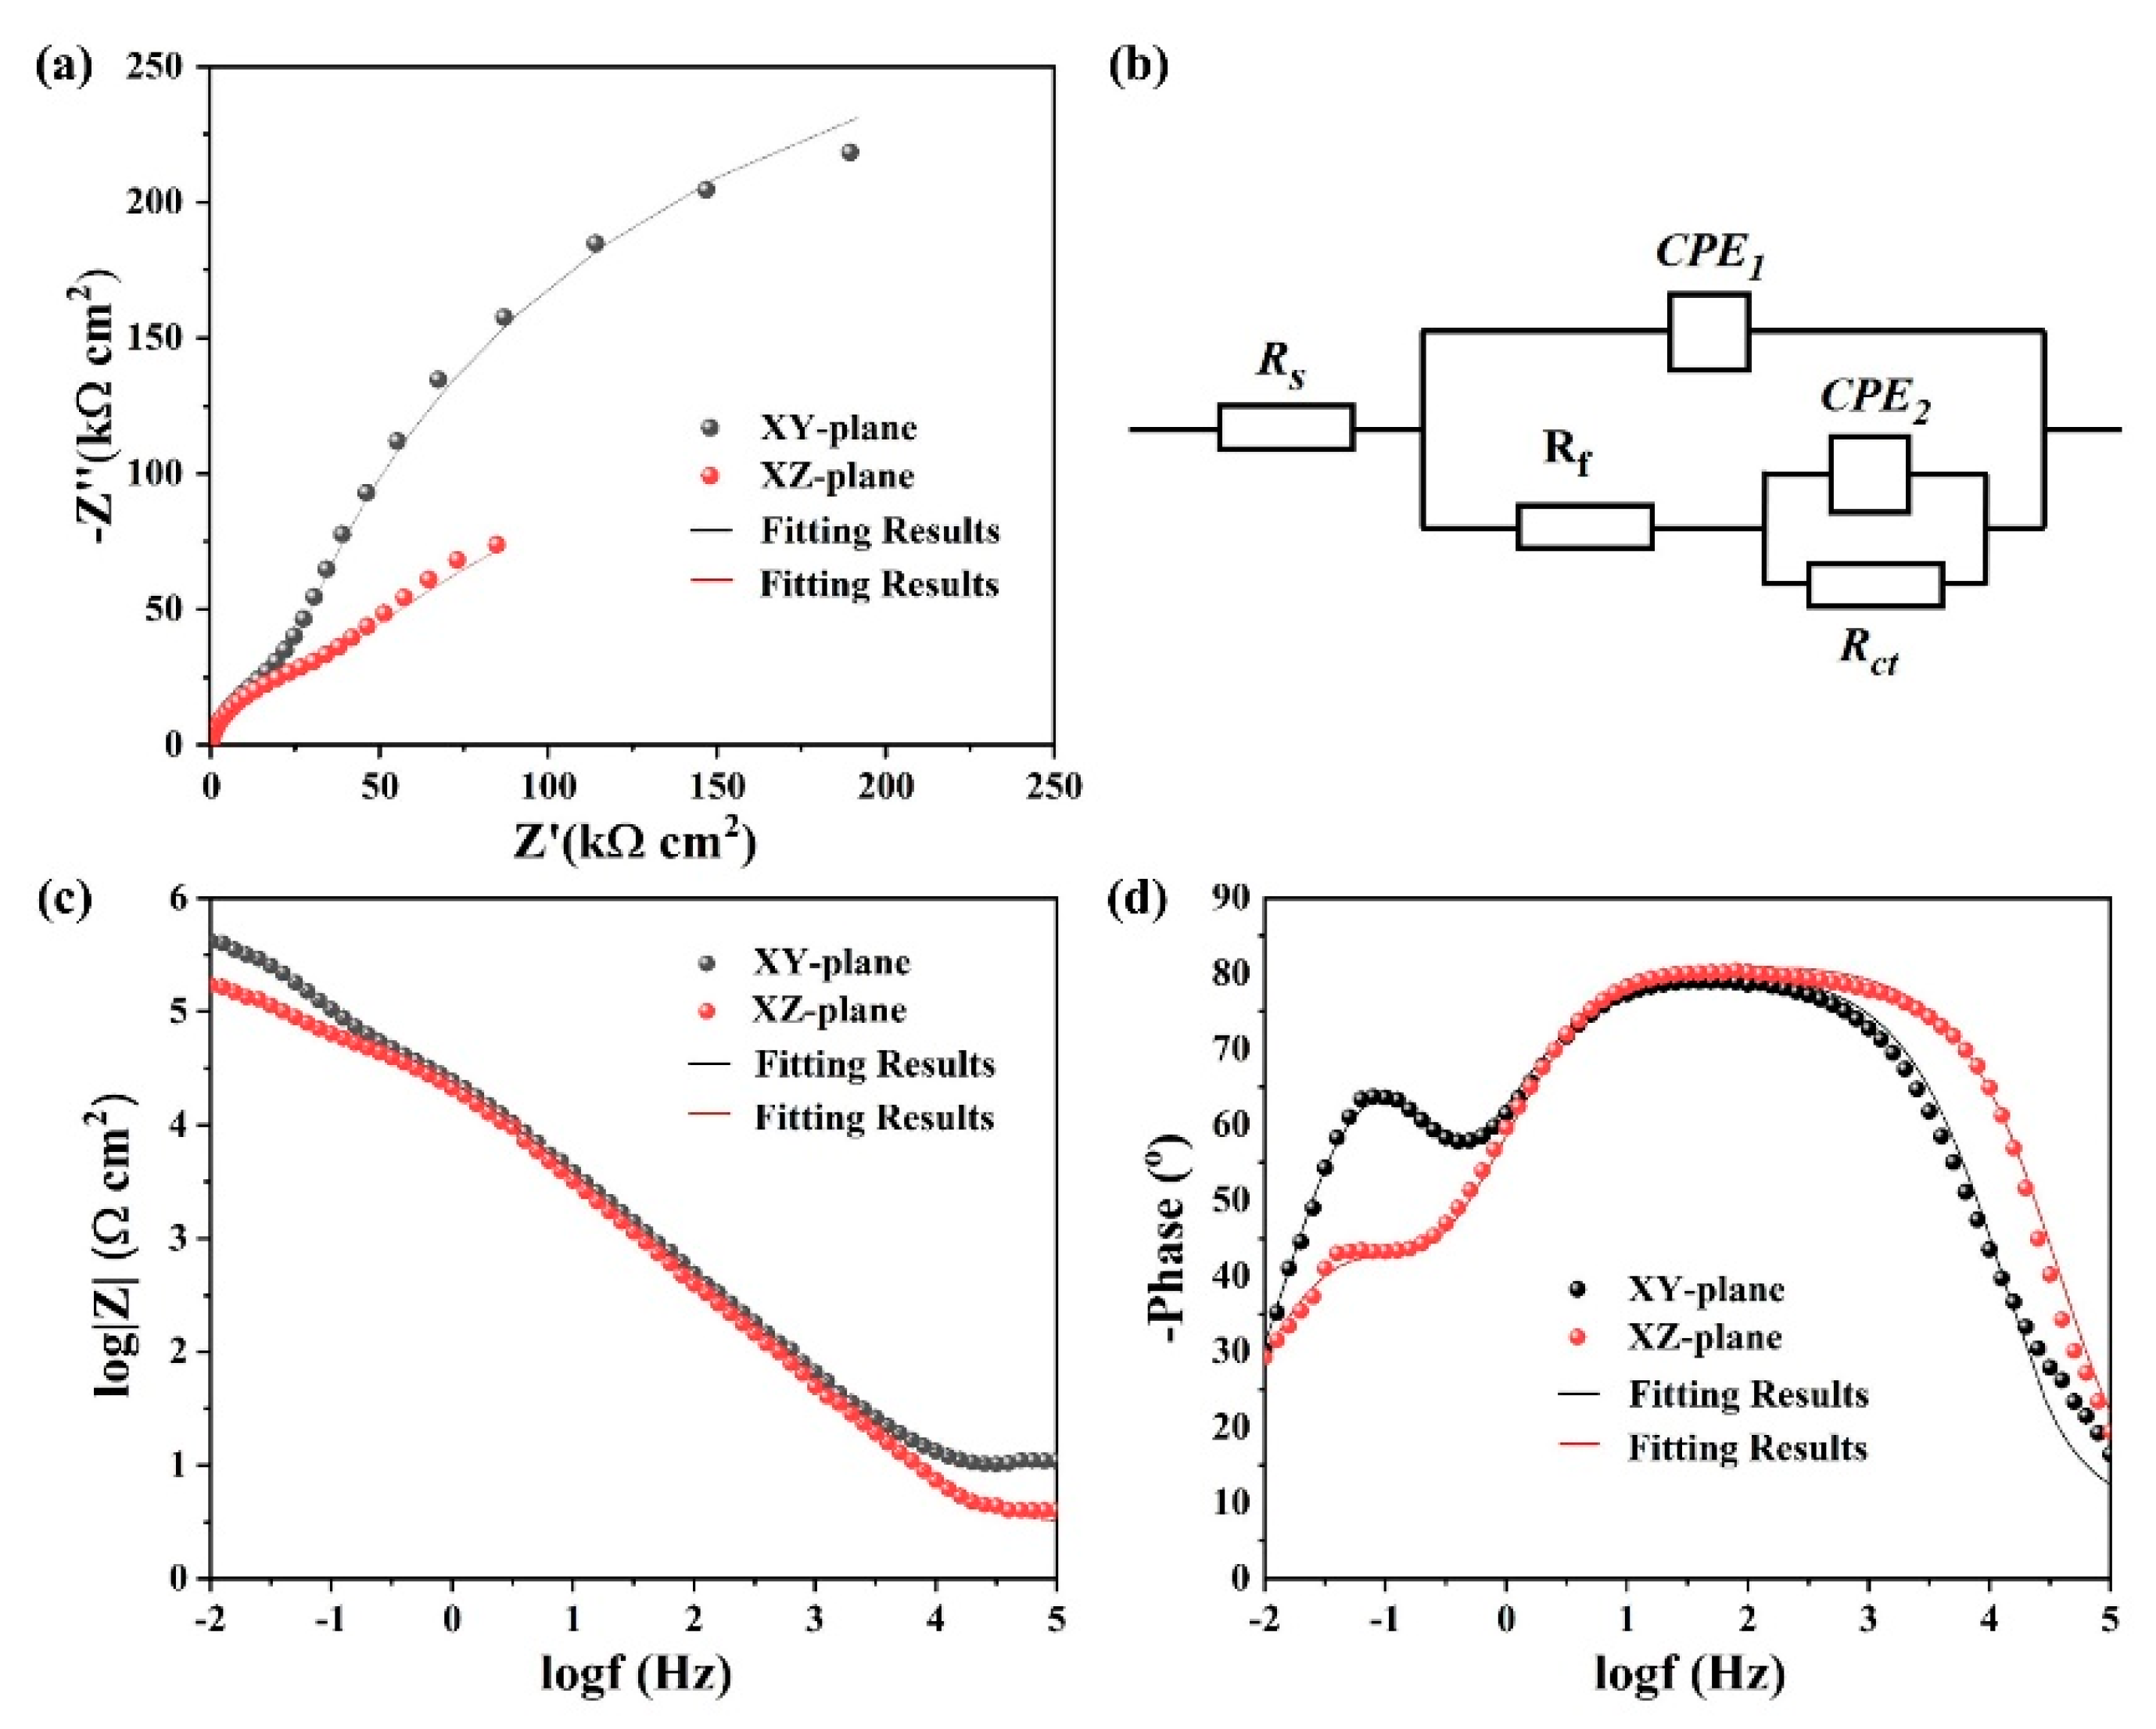
3.4. Corrosion Behavior
4. Discussion
5. Conclusions
Author Contributions
Funding
Institutional Review Board Statement
Informed Consent Statement
Data Availability Statement
Acknowledgments
Conflicts of Interest
References
- Xiong, H.Q.; Su, L.H.; Kong, C.; Yu, H.L. Development of High Performance of Al Alloys via Cryo-Forming: A Review. Adv. Eng. Mater. 2021, 23, 2001533. [Google Scholar] [CrossRef]
- Sercombe, T.B.; Schaffer, G.B. Rapid Manufacturing of Aluminum Components. Science 2003, 301, 1225–1227. [Google Scholar] [CrossRef] [PubMed]
- Gibson, I.; Rosen, D.W.; Stucker, B. Additive Manufacturing Technologies, 1st ed.; Springer: Heidelberg, Germany; Dordrecht, The Netherlands; London, UK, 2010; pp. 1–5. [Google Scholar]
- DebRoy, T.; Wei, H.L.; Zuback, J.S.; Mukherjee, T.; Elmer, J.W.; Milewski, J.O.; Beese, A.M.; Wilson-Heid, A.; De, A.; Zhang, W. Additive manufacturing of metallic components—Process, structure and properties. Prog. Mater. Sci. 2018, 92, 112–224. [Google Scholar]
- Zhang, P.; Liu, J.L.; Gao, Y.R.; Liu, Z.H.; Mai, Q.Q. Effect of heat treatment process on the micro machinability of 7075 aluminum alloy. Vacuum 2023, 207, 111574. [Google Scholar] [CrossRef]
- Bremen, S.; Meiners, W.; Diatlov, A. Selective Laser Melting. Laser Technol. J. 2012, 9, 33–38. [Google Scholar] [CrossRef]
- Aboulkhair, N.T.; Simonelli, M.; Parry, L.; Ashcroft, I.; Tuck, C.; Hague, R. 3D printing of Aluminium alloys: Additive Manufacturing of Aluminium alloys using selective laser melting. Prog. Mater. Sci. 2019, 106, 100578. [Google Scholar] [CrossRef]
- Zhang, J.L.; Song, B.; Wei, Q.S.; Bourell, D.; Shi, Y.S. A review of selective laser melting of aluminum alloys: Processing, microstructure, property and developing trends. J. Mater. Sci. Technol. 2019, 35, 270–284. [Google Scholar] [CrossRef]
- Herzog, D.; Seyda, V.; Wycisk, E.; Emmelmann, C. Additive manufacturing of metals. Acta Mater. 2016, 117, 371–392. [Google Scholar] [CrossRef]
- Aboulkhair, N.T.; Maskery, I.; Tuck, C.; Ashcroft, I.; Everitt, N.M. The microstructure and mechanical properties of selectively laser melted AlSi10Mg: The effect of a conventional T6-like heat treatment. Mater. Sci. Eng. A 2016, 667, 139–146. [Google Scholar] [CrossRef]
- Prashanth, K.G.; Scudino, S.; Klauss, H.J.; Surreddi, K.B.; Löber, L.; Wang, Z.; Chaubey, A.K.; Kühn, U.; Eckert, J. Microstructure and mechanical properties of Al-12Si produced by selective laser melting: Effect of heat treatment. Mater. Sci. Eng. A 2014, 590, 153–160. [Google Scholar] [CrossRef]
- Zhang, P.; Liu, Z.H.; Liu, J.L.; Yu, J.; Mai, Q.Q.; Yue, X.J. Effect of aging plus cryogenic treatment on the machinability of 7075 aluminum alloy. Vacuum 2023, 208, 111692. [Google Scholar] [CrossRef]
- Martin, J.H.; Yahata, B.D.; Hundley, J.M.; Mayer, J.A.; Schaedler, T.A.; Pollock, T.M. 3D printing of high-strength aluminium alloys. Nature 2017, 549, 365–369. [Google Scholar] [CrossRef] [PubMed]
- Spierings, A.B.; Dawson, K.; Heeling, T.; Uggowitzer, P.J.; Schäublin, R.; Palm, F.; Wegener, K. Microstructural features of Sc- and Zr-modified Al-Mg alloys processed by selective laser melting. Mater. Des. 2017, 115, 52–63. [Google Scholar] [CrossRef]
- Jia, Q.P.; Rometsch, P.; Kürnsteiner, P.; Chao, Q.; Huang, A.; Weyland, M.; Bourgeois, L.; Wu, X.H. Selective laser melting of a high strength Al-Mn-Sc alloy: Alloy design and strengthening mechanisms. Acta Mater. 2019, 171, 108–118. [Google Scholar] [CrossRef]
- Zhu, Z.G.; Ng, F.L.; Seet, H.L.; Lu, W.J.; Liebscher, C.H.; Rao, Z.Y.; Raabe, D.; Nai, S.M.L. Superior mechanical properties of a selective-laser-melted AlZnMgCuScZr alloy enabled by a tunable hierarchical microstructure and dual-nanoprecipitation. Mater. Today 2022, 52, 90–100. [Google Scholar] [CrossRef]
- Wang, Z.H.; Lin, X.; Kang, N.; Hu, Y.L.; Chen, J.; Huang, W.D. Strength-ductility synergy of selective laser melted Al-Mg-Sc-Zr alloy with a heterogeneous grain structure. Addit. Manuf. 2020, 34, 101260. [Google Scholar] [CrossRef]
- Knipling, K.E.; Dunand, D.C.; Seidman, D.N. Criteria for developing castable, creep-resistant aluminum-based alloys—A review. Int. J. Mater. Res. 2006, 97, 246–265. [Google Scholar] [CrossRef]
- Wen, S.P.; Xing, Z.B.; Huang, H.; Li, B.L.; Wang, W.; Nie, Z.R. The effect of erbium on the microstructure and mechanical properties of Al-Mg-Mn-Zr alloy. Mater. Sci. Eng. A 2009, 516, 42–49. [Google Scholar] [CrossRef]
- Guo, Y.W.; Wei, W.; Shi, W.; Zhou, X.R.; Wen, S.P.; Wu, X.L.; Gao, K.Y.; Zhang, D.Y.; Qi, P.; Huang, H.; et al. Microstructure and mechanical properties of Al-Mg-Mn-Er-Zr alloys fabricated by laser powder bed fusion. Mater. Des. 2022, 222, 111064. [Google Scholar] [CrossRef]
- Cabrera-Correa, L.; González-Rovira, L.; López-Castro, J.D.; Botana, F.J. Pitting and intergranular corrosion of Scalmalloy® aluminium alloy additively manufactured by Selective Laser Melting (SLM). Corros. Sci. 2022, 201, 110273. [Google Scholar] [CrossRef]
- Spierings, A.B.; Dawson, K.; Kern, K.; Palm, F.; Wegener, K. SLM-processed Sc- and Zr- modified Al-Mg alloy: Mechanical properties and microstructural effects of heat treatment. Mater. Sci. Eng. A 2017, 701, 264–273. [Google Scholar] [CrossRef]
- Gu, D.D.; Zhang, H.; Dai, D.H.; Ma, C.L.; Zhang, H.M.; Li, Y.X.; Li, S.H. Anisotropic corrosion behavior of Sc and Zr modified Al-Mg alloy produced by selective laser melting. Corros. Sci. 2020, 170, 108657. [Google Scholar] [CrossRef]
- Spierings, A.B.; Schneider, M.; Eggenberger, R. Comparison of density measurement techniques for additive manufactured metallic parts. Rapid Prototyp. J. 2011, 17, 380–386. [Google Scholar] [CrossRef]
- Maskery, I.; Aboulkhair, N.T.; Corfield, M.R.; Tuck, C.; Clare, A.T.; Leach, R.K.; Wildman, R.D.; Ashcroft, I.A.; Hague, R.J.M. Quantification and characterisation of porosity in selectively laser melted Al-Si10-Mg using X-ray computed tomography. Mater. Charact. 2016, 111, 193–204. [Google Scholar] [CrossRef]
- Weingarten, C.; Buchbinder, D.; Pirch, N.; Meiners, W.; Wissenbach, K.; Poprawe, R. Formation and reduction of hydrogen porosity during selective laser melting of AlSi10Mg. J. Mater. Process. Technol. 2015, 221, 112–120. [Google Scholar] [CrossRef]
- Croteau, J.R.; Griffiths, S.; Rossell, M.D.; Leinenbach, C.; Kenel, C.; Jansen, V.; Seidman, D.N.; Dunand, D.C. Microstructure and mechanical properties of Al-Mg-Zr alloys processed by selective laser melting. Acta Mater. 2018, 153, 35–44. [Google Scholar] [CrossRef]
- Chen, Y.H.; Mao, Y.Q.; Lu, W.W.; He, P. Investigation of welding crack in micro laser welded NiTiNb shape memory alloy and Ti6Al4V alloy dissimilar metals joints. Opt. Laser Technol. 2017, 91, 197–202. [Google Scholar]
- Booth-Morrison, C.; Dunand, D.C.; Seidman, D.N. Coarsening resistance at 400 °C of precipitation-strengthened Al-Zr-Sc-Er alloys. Acta Mater. 2011, 59, 7029–7042. [Google Scholar] [CrossRef]
- Zhang, C.M.; Xie, P.; Jiang, Y.; Zhan, S.; Ming, W.Q.; Chen, J.H.; Song, K.X.; Zhang, H. Double-shelled L12 nano-structures in quaternary Al-Er-Sc-Zr alloys: Origin and critical significance. Acta Metall. Sin. (Engl. Lett.) 2021, 34, 1277–1284. [Google Scholar] [CrossRef]
- Ma, R.L.; Peng, C.Q.; Cai, Z.Y.; Wang, R.C.; Zhou, Z.H.; Li, X.G.; Cao, X.Y. Enhanced strength of the selective laser melted Al-Mg-Sc-Zr alloy by cold rolling. Mater. Sci. Eng. A 2020, 775, 138975. [Google Scholar] [CrossRef]
- Wang, Y.; Li, H.T.; Fan, Z.Y. Oxidation of aluminium alloy melts and inoculation by oxide particles. Trans. Indian Inst. Met. 2012, 65, 653–661. [Google Scholar] [CrossRef]
- Szklarska-Smialowska, Z. Pitting corrosion of aluminum. Corros. Sci. 1999, 41, 1743–1767. [Google Scholar] [CrossRef]
- Zhang, H.; Gu, D.D.; Dai, D.H.; Ma, C.L.; Li, Y.X.; Cao, M.Z.; Li, S.H. Influence of heat treatment on corrosion behavior of rare earth element Sc modified Al-Mg alloy processed by selective laser melting. Appl. Surf. Sci. 2020, 509, 145330. [Google Scholar] [CrossRef]
- Li, C.; Pan, Q.; Shi, Y.; Wang, Y.; Li, B. Influence of aging temperature on corrosion behavior of Al-Zn-Mg-Sc-Zr alloy. Mater. Des. 2014, 55, 551–559. [Google Scholar] [CrossRef]
- Zhang, H.; Gu, D.D.; Dai, D.H.; Ma, C.L.; Li, Y.X.; Peng, R.L.; Li, S.H.; Liu, G.; Yang, B.Q. Influence of scanning strategy and parameter on microstructural feature, residual stress and performance of Sc and Zr modified Al-Mg alloy produced by selective laser melting. Mater. Sci. Eng. A 2020, 788, 139593. [Google Scholar] [CrossRef]
- Yang, Y.; Chen, Y.; Zhang, J.X.; Gu, X.H.; Qin, P.; Dai, N.W.; Li, X.P.; Kruth, J.P.; Zhang, L.C. Improved corrosion behavior of ultrafine-grained eutectic Al-12Si alloy produced by selective laser melting. Mater. Des. 2018, 146, 239–248. [Google Scholar] [CrossRef]
- Revilla, R.I.; Wouters, B.; Andreatta, F.; Lanzutti, A.; Fedrizzi, L.; Graeve, I.D. EIS comparative study and critical Equivalent Electrical Circuit (EEC) analysis of the native oxide layer of additive manufactured and wrought 316L stainless steel. Corros. Sci. 2020, 167, 108480. [Google Scholar] [CrossRef]
- Hirschorn, B.; Orazem, M.E.; Tribollet, B.; Vivier, V.; Frateur, I.; Musiani, M. Determination of effective capacitance and film thickness from constant-phase-element parameters. Electrochim. Acta 2010, 55, 6218–6227. [Google Scholar] [CrossRef]
- Zhang, H.M.; Gu, D.D.; Xi, L.X.; Zhang, H.; Xia, M.J.; Ma, C.L. Anisotropic corrosion resistance of TiC reinforced Ni-based composites fabricated by selective laser melting. J. Mater. Sci. Technol. 2019, 35, 1128–1136. [Google Scholar] [CrossRef]
- Cavanaugh, M.K.; Birbilis, N.; Buchheit, R.G.; Bovard, F. Investigating localized corrosion susceptibility arising from Sc containing intermetallic Al3Sc in high strength Al-alloys. Scripta Mater. 2007, 56, 995–998. [Google Scholar] [CrossRef]
- Wloka, J.; Virtanen, S. Influence of scandium on the pitting behaviour of Al-Zn-Mg-Cu alloys. Scripta Mater. 2007, 55, 6666–6672. [Google Scholar] [CrossRef]
- Tan, L.; Allen, T.R. Effect of thermomechanical treatment on the corrosion of AA5083. Corros. Sci. 2010, 52, 548–554. [Google Scholar] [CrossRef]
- Zhang, Z.Q.; Sun, J.E.; Xia, J.Y.; Wu, J.S.; Chen, J.S.; Chen, Z.B.; Zhang, B.C.; Li, Z.Q.; Li, X.G.; Zhang, B.W. Anisotropic response in corrosion behavior of laser powder bed fusion Al-Mn-Mg-Sc-Zr alloy. Corros Sci. 2022, 208, 110634. [Google Scholar] [CrossRef]
- Ralston, K.D.; Birbilis, N.; Davies, C.H.J. Revealing the relationship between grain size and corrosion rate of metals. Scripta Mater. 2010, 63, 1201–1204. [Google Scholar] [CrossRef]
- Zhong, H.L.; Li, S.C.; Zhang, Z.Q.; Li, D.H.; Deng, H.L.; Chen, J.Q.; Qi, L.; Ojo, O.A. Precipitation behavior, mechanical properties, and corrosion resistance of rare earth-modified Al-Zn-Mg-Cu alloys. Mater. Today Commun. 2022, 31, 103732. [Google Scholar] [CrossRef]
- Krawiec, H.; Szklarz, Z. Combining the electrochemical microcell technique and the electron backscatter diffraction method to study the electrochemical behaviour of polycrystalline aluminium in sodium chloride solution. Electrochim. Acta. 2016, 203, 426–438. [Google Scholar] [CrossRef]
- Schochlin, J.; Bohnen, K.P.; Ho, K.M. Structure and dynamics at the Al(111)-surface. Surf. Sci. 1995, 324, 113–121. [Google Scholar] [CrossRef]


| Samples | - | Icorr (μA·cm−2) | Rp (Ω·cm2) | Ecorr (mV) | Eb (mV) |
|---|---|---|---|---|---|
| XY plane | Average | 2.512 | 2.999 × 10⁴ | −1354.83 | −883.31 |
| Std-Dev | 0.837 | 2.759 × 10³ | 21.72 | 9.46 | |
| XZ plane | Average | 4.681 | 1.972 × 10⁴ | −1455.47 | −928.45 |
| Std-Dev | 1.110 | 2.974 × 10³ | 9.66 | 27.33 |
| Samples | - | Rs (Ω·cm2) | Rf (kΩ·cm2) | CPE1 (F·cm−2) | n1 | Rct (kΩ·cm2) | CPE2 (F·cm−2) | n2 |
|---|---|---|---|---|---|---|---|---|
| XY plane | Average | 8.89 | 67.22 | 6.67 × 10⁻⁶ | 0.88 | 476.63 | 1.08 × 10⁻⁵ | 0.97 |
| Std-Dev | 0.25 | 3.52 | 7.80 × 10⁻⁸ | 0.01 | 18.50 | 3.65 × 10⁻⁷ | 0.02 | |
| XZ plane | Average | 2.88 | 51.78 | 7.55 × 10⁻⁶ | 0.89 | 253.23 | 2.92 × 10⁻⁵ | 0.76 |
| Std-Dev | 0.34 | 1.57 | 2.24 × 10⁻⁷ | 0.01 | 20.58 | 1.04 × 10⁻⁶ | 0.02 |
Disclaimer/Publisher’s Note: The statements, opinions and data contained in all publications are solely those of the individual author(s) and contributor(s) and not of MDPI and/or the editor(s). MDPI and/or the editor(s) disclaim responsibility for any injury to people or property resulting from any ideas, methods, instructions or products referred to in the content. |
© 2023 by the authors. Licensee MDPI, Basel, Switzerland. This article is an open access article distributed under the terms and conditions of the Creative Commons Attribution (CC BY) license (https://creativecommons.org/licenses/by/4.0/).
Share and Cite
Shi, J.; Hu, Q.; Zhao, X.; Liu, J.; Zhou, J.; Xu, W.; Chen, Y. Densification, Microstructure and Anisotropic Corrosion Behavior of Al-Mg-Mn-Sc-Er-Zr Alloy Processed by Selective Laser Melting. Coatings 2023, 13, 337. https://doi.org/10.3390/coatings13020337
Shi J, Hu Q, Zhao X, Liu J, Zhou J, Xu W, Chen Y. Densification, Microstructure and Anisotropic Corrosion Behavior of Al-Mg-Mn-Sc-Er-Zr Alloy Processed by Selective Laser Melting. Coatings. 2023; 13(2):337. https://doi.org/10.3390/coatings13020337
Chicago/Turabian StyleShi, Jinglin, Qiang Hu, Xinming Zhao, Jiahao Liu, Jiacheng Zhou, Weichen Xu, and Yaolong Chen. 2023. "Densification, Microstructure and Anisotropic Corrosion Behavior of Al-Mg-Mn-Sc-Er-Zr Alloy Processed by Selective Laser Melting" Coatings 13, no. 2: 337. https://doi.org/10.3390/coatings13020337