1. Introduction
Cellulose is the most abundant biopolymer on earth. Wood, herbaceous plants, algae and even bacteria can be sources of cellulose. Microfibrillated cellulose (MFC) is extracted from lignocellulosic biomass with chemical, enzymatic and/or mechanical defibrillation processes, and can be used as a filler for making composites. Cellulose composites with either thermoplastic or thermosetting polymer matrices are usually produced through thermal processes that are both time and energy intensive [
1]. For increasing the sustainability of biobased materials, the use of environmentally friendly processes is preferable. Photoinduced curing is a green technology that combines low energy requirements and high reaction rates at room temperature, no need for solvents and low volatile organic compounds (VOC) emissions, and facile spatial and temporal control [
2,
3]. Free radical photopolymerization of multifunctional (meth)acrylic monomers is the most widely used photoinduced curing process both for common applications (e.g., adhesives and coating industry) and for advanced technologies (microelectronics and optoelectronics, holographic data storage, microlithography and nanolithography, etc.). However, it has the important drawback of being inhibited by oxygen; thus, requiring strategies for minimizing its presence, such as inert atmospheres or oxygen scavengers [
4]. Cationic photopolymerization, mostly used to cure epoxy-based precursors, offers some distinct advantages compared to the free radical photopolymerization of (meth)acrylates, namely it is insensitive to oxygen inhibition, the monomers have low volatility and low toxicity, and the polymerization proceeds also after ceasing the illumination [
5]. However, the strong acid resulting from the cationic photoinitiation step was found to undergo an undesired side reaction with MFC, hindering the advancement of the reaction and decreasing the thermal resistance of the cellulosic fibers [
6,
7].
The present work aims to investigate the properties, and particularly the barrier against water vapor, of photocured composites prepared in the form of self-standing films combining acrylic resins and MFC. Interfacial interactions are known to play an important role in polymer composites and nanocomposites; even when the morphologies and dispersion states of the composites are similar, different interfacial interactions strongly influence the physical and functional properties [
8]. As the surface of cellulose is polar and hydrophilic, cellulose fibers are more easily combined with polar and hydrophilic monomers or polymers. While water-soluble monomers could directly be mixed with the aqueous nanocellulose suspension and were successfully used in combination with nanocellulose to obtain photocured hydrogels [
9,
10,
11] and membranes [
12], the poor compatibility with nonpolar, hydrophobic solvents and polymer matrices may lead to aggregation of the microfibrils during the fabrication of composites. Different strategies have been developed to overcome this challenge, including, e.g., surface modification of the cellulose fibrils, solvent-assisted mixing processes, preform impregnation, emulsification, or 3D printing. A recent review gives a very good overview of photocured composites with nanocellulose prepared through different procedures [
13]. Particularly, a solvent-assisted preform impregnation process [
14,
15] was proposed to fabricate composite films based on thermally or photo curable nonpolar precursors. Although the use of solvent in the impregnation step lessens one of the advantages of photopolymerization, i.e., being a solventless process, this allowed the preparation of composites containing high weight fractions of MFC, avoiding aggregation of the filler. In this way, acrylate and methacrylate monomers were photopolymerized inside an ethanol-swollen bacterial cellulose nanofiber network, obtaining collagen-like materials [
16], and photocured cardanol methacrylate-based composites containing up to 45 wt.% of MFC were obtained by impregnation of preforms where water was exchanged with acetone [
17]. Alternatively, dried preforms were impregnated with photocurable resins under reduced pressures (0.01–0.02 MPa) for 24 h, obtaining cellulose contents of up to 70 wt.% [
18,
19].
In this work, to understand the effect of the polarity of the matrix on the properties of composites prepared through the solvent-assisted preform impregnation process, poly(ethylene glycol) diacrylate (PEGDA) was selected as a hydrophilic matrix and soybean oil epoxidized acrylate (SOEA) as a hydrophobic matrix. The effect of the type of matrix and of the preparation process conditions on the morphology, physical properties and water vapor permeability of the composites was studied.
2. Materials and Methods
2.1. Materials
Poly(ethylene glycol) diacrylate with Mn = 250 g/mol (PEGDA), soybean oil epoxidized acrylate (SOEA), and acetone (≥99.5%), were supplied by Sigma-Aldrich S.r.l. (Milano, Italy). The chemical structures of the monomers are depicted in
Figure 1. The radical photoinitiator (PI) was 2-hydroxy-2-methylpropiophenone (Darocur 1173, BASF, Ludwigshafen, Germany), a Norrish Type I photoinitiator that, when irradiated with UV light, undergoes homolytic cleavage yielding two carbon-centered radicals.
Wood-derived microfibrillated cellulose (MFC) Exilva F 01-V, in the form of a 10% paste (10 wt.% solid in water), was kindly donated by Borregaard (Sarpsborg, Norway). According to the characterization performed by Berglund and coworkers [
20,
21], it consists of an entangled network of fibrils having widths ranging from 20 nm to 1 μm, and lengths of approximately 5 to 40 μm, with a small fraction of micrometer-sized fibrils with a lower aspect-ratio.
2.2. Preparation of the Photocurable Resins and Composites
The photocurable resins were prepared by adding the radical photoinitiator (PI) at a 3 wt.% concentration into PEGDA or SOEA and mixing for 5 min over a magnetic stirrer (AREX Hot Plate Stirrer, VELP Scientifica, Usmate (MB), Italy). To prepare the composite films, a MFC suspension with a solid content of 0.75 wt.% was prepared from the 10 wt.% MFC paste by dispersing it in deionized water using a high shear homogenizer (Ultraturrax T10, IKA®-Werke GmbH & Co. KG, Staufen, Germany) at about 20k rpm, for 5 min. The MFC suspension was filtered using a Büchner funnel connected to vacuum and fitted with a 47 mm diameter Durapore® membrane filter (hydrophilic PVDF, 0.65 µm pore size by Merck Millipore, Darmstadt, Germany). After filtration, the wet preforms of MFC formed on the filter were transferred to an acetone bath. The exchange of water with acetone was performed over 24 h, during which the solvent was refreshed twice. For the impregnation of the preforms, the photocurable resins were diluted with acetone to obtain solutions containing either 15 wt.% or 7 wt.% of resin. The impregnation was carried out for 3 h, placing the preforms in a bath containing the selected photocurable resin solution, in the dark to prevent any reaction. Finally, the impregnated preforms were removed from the bath, and the solvent was evaporated at room temperature under vacuum for about 10 min, obtaining the uncured composites, which were stored at −10 °C in the dark until further use.
As a reference for the permeability measurements, a sheet of MFC was prepared by casting the diluted MFC solution followed by the evaporation of water.
2.3. Photoinduced Curing of the Composites
The composites, in the form of self-standing films, were cured by exposure to UV light, using a 5000-EC UV flood lamp system (Dymax Corporation, Torrington, CT, USA) equipped with a medium intensity mercury bulb (320–390 nm). The UV intensity was checked by means of a UV Power Puck II radiometer (EIT, LLC., Leesburg, VA, USA) and was fixed at 101 ± 1 mW/cm−2 UVA + 84 ± 1 mW/cm−2 UVV by tuning the distance between the specimen and the light source. As the photoinduced polymerization of acrylates via a radical mechanism is inhibited by oxygen, the curing was performed under inert atmosphere. To this aim, the specimens were placed in a chamber with a quartz window fitted inside the lamp system and connected with a nitrogen flow. The irradiation was carried out by turning the sample upside down at given intervals to have homogeneous irradiation on the two sides.
2.4. Characterization Methods
The morphological observation of the surface of the composites was performed with a ZEISS SUPRA 40 Field Emission Scanning Electron Microscope (FESEM) equipped with a Gemini column (Carl Zeiss S.p.A., Milano, Italy), with an acceleration voltage of 3kV. Prior to imaging, the samples were coated with platinum to prevent charging.
The weight fractions of resin and MFC in the composites were estimated gravimetrically, from the actual weight and concentration of the MFC suspension used for preparing each preform, and the weight of the composite measured after solvent evaporation.
In order to follow the advancement of the curing reaction, the composites were analyzed after given irradiation times by Fourier transform infrared (FTIR) spectroscopy in attenuated total reflectance (ATR) mode with a Nicolet iS50 spectrometer (Thermo Fisher Scientific Inc., Waltham, MA, USA) fitted with an ATR-Smart Orbit accessory with a diamond crystal. The spectra were taken in the 525–4000 cm−1 range, with 32 scans per spectrum and a resolution of 4 cm−1.
The conversion of double bonds was calculated from FTIR spectra using Equation (1):
where
AR is the absorbance of a reference peak (i.e., a peak that is not supposed to change during the curing reaction), and
A is the absorbance corresponding to the monitored functional group.
AR was taken as the area of the peak in the 1780–1680 cm
−1 region corresponding to the C=O bonds, and A was estimated as the area of the peak centered at 809 cm
−1, characteristic of the C=CH
2 twisting vibration in the acrylate group.
Differential scanning calorimetry (DSC) was performed with a DSC 204 F1 Phoenix® instrument (NETZSCH-Gerätebau GmbH Italia, Verona, Italy) under N2 flux, with a heating-cooling-heating cycle between −60 and 150 °C with a heating/cooling rate of 20 °C/min.
The thermogravimetric analysis was performed with a TG 209 F1 Libra® thermo-microbalance (NETZSCH-Gerätebau GmbH Italia, Verona, Italy), under N2 flux from 30 to 800 °C at 20 °C/min.
Tensile tests were performed at room temperature on samples having width of 8 mm and initial length between clamps (gauge length) of 25 mm, using an INSTRON 3366 electromechanical universal testing system (UTS) equipped with a 10kN load cell (ITW Test and Measurement Italia S.r.l., Instron CEAST Division, Pianezza (TO), Italy). A constant cross-head displacement rate of 5 mm/min was applied while stress (calculated from the machine-recorded force and the initial cross-section of the specimens) and strain (the relative displacement based on initial gauge length) were measured. The Young’s modulus E was calculated as the slope of the initial linear part of stress–strain curves. Three specimens were tested for each type of composite.
For the water vapor permeability measurements, the composite specimens were inserted into an aluminum surface reducer with an exposed area of 2.01 cm
2. The thickness of the specimens was measured using a micrometer, averaging three measurements per sample. The water vapor permeability was assessed with a MultiPerm permeability analyzer (ExtraSolution produced by PermTech, PermTech S.r.l., Pieve Fosciana (LU), Italy), which measures and records the instantaneous water vapor transmission rate (WVTR), i.e., the flux of water vapor transported per unit of time through the surface of the tested film, having the units [g/(m² · 24h)]. The permeability values were directly calculated by the instrument’s software (MultiPerm-ExtraSolution
©) from the WVTR, the water vapor partial pressure gradient across the test specimen at the given relative humidity (Δ
P) and the thickness (
t) of the samples using Equation (2); the units of permeability were [(g · mm)/(m² · 24h · mmHg)] and were omitted in the text for better readability.
The upper limit for the measuring range of the instrument, when using the surface reducer, is WVTR = 2000; thus, the upper permeability value that can be measured depends on the relative humidity (RH) and on the thickness of the specimen. The composites were analyzed at T = 38 °C and RH ranging from 10% to 90%, and at each condition, the WVTR was considered to have reached a steady state when its instantaneous value did not differ more than 0.5% from its average value over more than 100 measurement points.
3. Results
As duly described in the experimental section, wet preforms of MFC were prepared on a filter and transferred to an acetone bath to exchange water with acetone. They were impregnated with the photocurable resins diluted with acetone. After solvent evaporation, the resulting composites were cured under UV light and flexible self-standing films were obtained. The naming codes used throughout the discussion to identify the composites, the concentration of the monomers in the acetone solution used to impregnate the preforms, the resulting compositions (expressed as final weight percent of dry MFC in the composite: MFC wt.%) and thicknesses of the composites are summarized in
Table 1.
Depending on the impregnating solution, either 15 wt.% or 7 wt.% of resin in acetone, the composites obtained have different filler contents and are labelled with the final letter L and H, respectively, to indicate low and high cellulose weight fraction. As expected, there was no significant difference between the compositions obtained by varying the monomer when the same concentration was used for the impregnation of the preforms. With both monomers, when the concentration of the impregnating solution was reduced (samples H), the final weight fraction of the MFC in the composites was higher, as may be expected. At the same time, the thickness of the films decreased. The compositions of the SOEA based composites obtained for each given concentration of the impregnating solution showed a somewhat higher variability than for PEGDA-based composites.
Images of the cured composite films are shown in
Figure 2. For both PEGDA and SOEA, the composites with the lower MFC wt.% were relatively transparent, although slightly hazy due to diffusive effects of the texture formed by the MFC at the surface. Those with the higher MFC wt.% instead were opaque. This was deemed to be the result of a higher porosity for the composites impregnated using the less concentrated monomer solutions. A possible explanation is that when the solvent evaporates rapidly, the tridimensional structure formed by the microfibrils in the preform does not have the time to adapt and fill the remaining voids; thus, a larger amount of evaporated solvent leads to higher porosity.
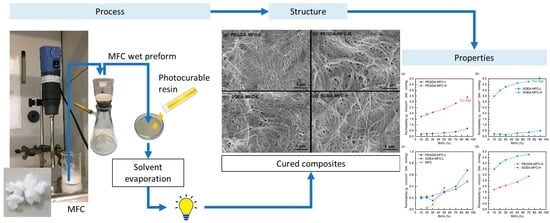
FESEM images of the surfaces of the composites (
Figure 3) show the structure of the microfibril network, and the impregnating polymer. Clearly, the composites impregnated with the less concentrated solutions, which have a higher MFC content, show a structure with large pores at the surface. On the other hand, the composites impregnated with the more concentrated resin solutions show more compact structures. It also appears that the microfibrils form a tighter network in the PEGDA-MFC-L composite than in the SOEA-MFC-L composite.
The FTIR spectra of the composites before and after the given irradiation intervals (of 5 to 15 s each) are shown in
Figure 4. The total irradiation time was 60 s per side for PEGDA-based composites and 120 s per side for SOEA-based composites.
A broad stretching band appeared in the 3500–3000 cm
−1 region corresponding to O–H stretching vibrations, due to the hydroxyl groups present in the chemical structures of both cellulose and SOEA. Characteristic vibrations of alkyl chains were found in the 3100–2800 cm
−1 region, where two intense peaks at 2924 and 2854 cm
−1 correspond to methylene asymmetric and symmetric C–H stretching, with the shoulders at 2954 and 2870 cm
−1 assigned to methyl symmetric and asymmetric C–H stretching [
22,
23].
The acrylate groups of the PEGDA and SOEA monomers were identified in the uncured composites by the following characteristic features: a double peak at 1636 and 1618 cm−1, corresponding to the C=C stretching vibration, a peak at 809 cm−1 characteristic of the C=CH2 twisting vibration, and the stretching vibration of the C=O bond close to the unsaturation appearing as a peak centered at 1722 cm−1. The stretching vibration of the C=O bonds in the glycerol unit of SOEA, which do not have neighboring unsaturation, gave rise to a peak at 1740 cm−1, overlapping with the peak at 1722 cm−1. A weak and broad peak centered at 1639 cm−1, overlapping with the C=C stretching vibrations, was assigned to water bound to the cellulose fibrils. In the fingerprint region, intense bands in the 1150-1030 cm−1 range were attributed to the C–O stretching of the pyranose ring skeletal vibration, and the peak at 896 cm−1 to the β-glycosidic bond vibration in the cellulose fibrils.
With increasing irradiation times, the intensities of the peaks at 1636, 1618, and 809 cm−1, corresponding to the C=C bond vibrations decreased, as the photoinduced curing proceeded through the cleavage of the double bonds. The peaks corresponding to the C=O bond in the acrylate group broadened and shifted to higher wavenumbers as the neighboring unsaturation disappeared.
For each type of composite, the conversion α of the acrylic double bonds at different irradiation times was calculated using Equation (1) and is plotted versus irradiation time in
Figure 5. The crosslinking reaction was faster and reached higher conversion for PEGDA-MFC composites than for SOEA-MFC composites, and as for the former, a conversion α > 0.80 was reached in less than 15 s, while for the latter it took more than 30 s. In all cases, a plateau for the conversion was obtained within the irradiation times investigated, ranging from 60 to 120 s per side of the composites.
Although MFC absorbs light at wavelengths below 600 nm, and its absorbance increases with decreasing wavelength, particularly below 400 nm, as shown in
Figure S1, its concentration in the composite films was found to not affect the photocuring reaction rate and/or final conversion. For composites having the same matrix, no significant differences in the curing rate or final conversion with respect to the MFC content could be detected.
DSC analyses were performed to characterize the composites. The thermograms obtained for SOEA-MFC-L and PEGDA-MFC-L are reported as examples in
Figure 6. In the first heating cycle, all the composites show a broad peak centered around 95–100 °C, corresponding to the evaporation of residual solvent. In the second heating cycle, the glass transition regions of both matrices were very broad; nevertheless, the glass transition temperatures (T
g), taken at the inflection points of the glass transition steps, were identified at about 25 and 88 °C for SOEA- and PEGDA-based composites, respectively.
The results of the TGA analyses of the photocured composites are shown in
Figure 7. For composites having a PEGDA matrix, two distinct weight losses were evidenced: in the DTG curve, two resolved peaks centered at 368 and 430 °C could be identified, corresponding to the decomposition of MFC and PEGDA, respectively. For the composites with a SOEA matrix instead, the decomposition of the matrix and of MFC happened at close temperatures, not allowing the resolution of the two decomposition steps: only one peak centered at 380 °C appeared, and, in the SOEA-MFC-L composites, a shoulder is more clearly visible on the right side of the peak, attributed to decomposition of the matrix. In both cases, at low temperature a small weight loss corresponding to the evaporation of residual solvent, as also evidenced by DSC, was detected, which was larger for PEGDA-based composites. Finally, PEGDA-based composites had a slightly larger residue (about 7%) than SOEA-based composites (4%–5%).
The results of the tensile test performed on the composite films (
Table 2) evidenced that the tensile moduli and strengths of the composites were about 1–2 GPa and 20–27 MPa, respectively, and thus, were comparable with those of biobased polymers currently used, e.g., in packaging applications, such as polylactic acid or polybutylene succinate [
24]. Stress-strain curves representative of the mechanical behavior of each type of composite are given in
Figure S2.
Unexpectedly, by increasing the MFC amount, the mechanical properties are not strongly enhanced. This is probably because the effect of the MFC concentration is counterbalanced by the porosity generated when a high filler content is used. Comparing the two matrices, it can be noted that the modulus of the composites with PEGDA is higher, seemingly due to the higher affinity between the polar matrix and cellulose. SOEA-based composites with higher MFC content thus show the lowest modulus.
The water vapor permeability of the photocured composites as a function of relative humidity is reported in
Figure 8. The plots 8a and 8b show the effect of the MFC content on the barrier properties of PEGDA and SOEA composites, respectively. With both matrices, the composites with the higher content of MFC had considerably higher permeability (
P), which may be due to higher porosity of the systems, as previously discussed. For PEGDA composites at lower MFC content,
P increased exponentially by increasing RH until 90%. At higher MFC content, the permeability at 90% RH resulted above the measuring range of the instrument. This is explained considering that there are strong interactions between the penetrant and the polymer; therefore, permeability, diffusivity and/or solubility vary with the concentration of the penetrant. For SOEA composites, the effect of RH on the permeability depends on the MFC content: at lower MFC concentration, there is a marked increase of
P when humidity increases. The permeability at 70% RH shows a 120% increase with respect to the value at 10% RH. At a higher MFC concentration, the influence of RH on the barrier properties is less, as permeability ranges from 3.5 to 4.7 by varying RH from 10% to 70%, and thus only showing a 30% increase. Permeability values at 50% and 90% RH are also compared with those of cellulose fibrils films and composites, as well as polymers in
Table S1 [
25,
26,
27,
28,
29,
30,
31]. The values obtained in this work are in the same range as for other composites with similar amounts of cellulosic fibrils.
It is even more interesting to compare the barrier properties of composites characterized by the same MFC content but different matrix (
Figure 8c,d). First, the water vapor permeabilities (
P) of the composites with the lower content of MFC showed comparable values at RH < 70% with both matrices, while above that RH value, the water vapor permeability of the PEGDA-MFC-L composite increased more than that of the SOEA-MFC-L composite, owing to the higher hydrophilicity of the matrix.
Figure 8c also shows, as a reference, the permeability of films made by pure MFC, as the values are in the same range as the composites with the lower MFC content under investigation. When RH is low, composites have lower barrier characteristics than a cellulosic film, even in the presence of a hydrophobic matrix. This indicates that MFC can stop water vapor via hydrogen bonds between the fibrils, thanks to the formation of a tight network. By increasing the RH, the permeant dissolves in a higher amount, and water can act as a plasticizer, disrupting the hydrogen bonds between the fibrils; thus, MFC films become more permeable than composites.
Surprisingly, when the MFC content is higher, the barrier properties of PEGDA composites are better than those of SOEA composites. For the tested RH values until RH = 50%, comparing the permeability values of the SOEA-MFC-H composites to that of the PEGDA-MFC-H composites, the ratio was about 2:1. These observations suggest that, as the polarity of the matrix appears not to be the main parameter affecting barrier properties, it is reasonable to assume that there is a key influence of the matrix-filler interface. In fact, as a higher amount of the MFC in the composites results in a larger matrix-filler interfacial area, the better affinity between the hydrophilic PEGDA and MFC may result in a better wetting of the fibers by the polymer matrix, and thus, leading to a lower water vapor permeability for PEGDA-MFC-H than for SOEA-MFC-H composites, despite a higher hydrophilicity of the matrix. However, above RH = 70%, the ratio between the permeability of the SOEA-MFC-H and that of the SOEA-MFC-H composites decreased from 2:1 to about 1.6:1. As stated previously, when there are strong interactions between the penetrant and the hydrophilic materials, permeability and diffusivity vary with water content. Thus, at a higher relative humidity, the hydrophilicity of PEGDA with respect to SOEA starts influencing permeability, despite the strength of the interfaces.


 ,
, 


