Article

Titanium–Platinum Thin Films as a Tool for the Electrooxidation of Cyanide

by
Aušra Valiūnienė
1,2,*,
Povilas Virbickas
1,
Inga Gabriunaite
1,
Zana Margarian
3,
Ramūnas Levinas
1,
Dagne Janarauskiene
1 and
Gintaras Valincius
3
1
Institute of Chemistry, Faculty of Chemistry and Geosciences, Vilnius University, Naugarduko Str. 24, LT-03225 Vilnius, Lithuania
2
State Research Institute Center for Physical Sciences and Technology, Sauletekio Ave. 3, LT-10257 Vilnius, Lithuania
3
Institute of Biochemistry, Life Sciences Center, Vilnius University, Sauletekio 7, LT-10257 Vilnius, Lithuania
*
Author to whom correspondence should be addressed.
Coatings 2023, 13(11), 1821; https://doi.org/10.3390/coatings13111821
Submission received: 3 September 2023 / Revised: 17 October 2023 / Accepted: 20 October 2023 / Published: 24 October 2023

Abstract

:
This paper presents a detailed study of a titanium–platinum thin film-based electrode preparation and its practical application in the electrooxidation of cyanides to help protect our environment. The novel electrochemical deposition process of Pt on nearly atomically smooth magnetron-sputtered Ti film has been used to prepare a highly effective glass|Ti|Pt composite electrode with high catalytic activity for the electrooxidation of cyanide ions. The composite electrode exhibits over a 90% electrical current efficiency in the cyanide electrooxidation process and can be used for the decontamination of highly concentrated KCN solutions (up to 0.1 M) without any chemical additives. A high current efficiency (70%) of Pt thin film deposition on a glass|Ti electrode was achieved using a potentiostatic double-pulse method. Fast Fourier transform electrochemical impedance spectroscopy revealed the oxidation kinetics for cyanide ions at the electrode. The glass|Ti electrode was prepared using the magnetron sputtering technique, which allows us to fabricate electrodes of any shape suitable for any electrochemical cell or electroplating bath. Meanwhile, electrochemical deposition of Pt on the glass|Ti electrode is an efficient and environmentally friendly method, since various salts of Pt and/or Pt-containing wastes can be used for electrodeposition instead of pure Pt, which is more expensive.

Graphical Abstract

1. Introduction

Cyanides are widely used in the mining industry, particularly in the refining of noble metals from ores, where they form water-soluble metal–cyanide complexes. This type of leaching is very efficient [1], as it allows refining of low-grade ores. However, in order to extract most of the metal from the lower quality ore, larger amounts of cyanide must be used [2]. This causes ecological problems as cyanide ions are harmful and toxic to all animals and nature [3]. New Zealand, where gold mining contributes significantly to the local economy, suggested new exposure limits of cyanide, based on an 8 h workday, as 1 mg m−3 at a workplace [4]. The decision was based on The Scientific Committee on Occupational Exposure Limits review [5] and German Research Foundation statement [6] that evaluated cyanide effects on thyroid and neurological damage. Cyanide can also be found in drinking water, potentially affecting people every day, which is why the United States Environmental Protection Agency has set 0.2 mg L−1 limit of cyanide in drinking water [7].
The most common way of treating cyanide wastewater is to store it in large dams, where it can be slowly oxidized by atmospheric oxygen [8]. However, storing cyanide in large quantities becomes a major risk and legal liability in the case of accidental spills, which has happened over the years [9,10]. Instead of the usual, slow degradation by atmospheric oxygen, some suggest that electrochemical oxidation could provide a clean, safe way to oxidize cyanides [11,12]. Electrochemical treatment methods are considered ecologically friendly because they avoid producing secondary pollutants [11,13,14]. Investigators are focused on identifying anode materials that ensure high corrosion resistance and electrochemical activity in parallel to chemical and physical stability. Table 1 provides a comparison of the different methods used to treat cyanide.
In general, anodes for the electrooxidation of organics are divided into “non-active” anodes (such as boron-doped diamond (BDD) or SnO2-Sb [24]) and “active” anodes (such as transition metals and their oxides [20,21]). “Non-active” anodes are used for the indirect electrooxidation of cyanide, generating hydroxyl radicals and other oxidizing species that oxidize CN ions at high potentials while inhibiting the oxygen evolution reaction (OER) [25]. “Active” anodes may be considered less efficient for direct electrooxidation because of their high activity towards competing OER. However, it has been shown that “active” anodes can be used for both direct and indirect electrooxidation of cyanide via intermediate hydroxyl radicals [20]. The generally accepted mechanism in the scientific community for the electrooxidation of cyanide is [26,27]:
C N + 2 O H C N O + H 2 O + 2 e
Previous efforts have used platinum, stainless steel, graphite, lead, etc., anodes [20,21,28,29,30,31,32,33,34,35,36] for the electrooxidation of cyanide. Platinum, with current efficiencies up to 80%, is one of the most efficient electrode materials [20,21]. However, Pt is an expensive metal and with the amount of cyanide waste that exists, we need to find cheaper alternatives. It was suggested that a titanium plate electrode electrochemically coated with a thin layer of Pt could achieve an almost complete oxidation of CN (from 0.1 M to 0.16 mM), so platinized Ti electrodes could be used instead of Pt plate electrodes [18,19,20,21,37]. Electrochemical Pt deposition on conductive surfaces seems to be a promising and environmentally friendly technique, as it can be performed using various Pt salts and/or Pt-containing wastes instead of pure Pt, which is expensive [38]. However, the current efficiencies obtained with platinized Ti electrodes (approx. 40%) are lower than those obtained with metallurgic Pt electrodes (approx. 80%) [20,21]. Therefore, a critical question remains as to how to produce electrodes with equal or better efficiency for cyanide oxidation.
Effective electrooxidation of cyanide has been achieved by coating a Ti plate with various metal oxides [20,39,40]. However, the preparation of these electrodes is quite complicated because thin film deposition relies on the synthesis of nanoparticles. Such synthesis requires expensive reagents, special equipment, and high temperatures (up to 400 °C), which are not always practical [39,40].
The main objective of our work was to design the technology for the rapid and effective electrooxidation of high concentration (0.1 M) potassium cyanide solutions. Using thin, nearly atomically smooth film titanium electrodes sputtered on glass slides as substrates, we propose a novel, electrodeposition double-pulse process yielding electrocatalytically active microparticle-structured Pt films (hereafter referred to as glass|Ti|Pt electrodes), which show high activity for the electrooxidation of cyanides. These glass|Ti|Pt electrodes, which achieve a 91% electrical efficiency in the cyanide electrooxidation process, eliminate the use of expensive and environmentally hazardous chemical reagents for cyanide waste decontamination.
The surface morphology of both Ti and Pt coatings was characterized by the atomic force microscopy (AFM), scanning electron microscopy (SEM), and spectroscopic ellipsometry. Cyclic voltammetry and fast Fourier transform electrochemical impedance spectroscopy (FFT-EIS) were used to determine the electrochemical behavior of both the Pt electrodeposition and cyanide electrooxidation processes.

2. Experimental

2.1. Preparation of Ti-Covered Glass Electrode (Glass|Ti)

A glass microscope slide (25 mm × 45 mm) (Thermo Fisher Scientific, Waltham, MA, USA) was used as a substrate for the deposition of Ti film. Before coating, the glass slide was cleaned by rinsing it with sulfuric acid (96%, ROTH, Karlsruhe, Germany) and deionized water (R ≥ 18 MΩ·cm), then it was incubated in a Nochromix 1 solution (Sigma-Aldrich, Munich, Germany) for 30 min and rinsed again with deionized water. After the cleaning processes, the glass slide was dried in a stream of nitrogen gas (99.99%, Elme Messer Gaas, Vilnius, Lithuania) (Figure 1A). A titanium film of approx. 30 nm thickness (Figure 1B) was deposited on the cleaned microscopic glass slides using a PVD 75 thermal evaporation deposition platform (Kurt J. Lesker Company, Jefferson Hills, PA, USA). Before depositing Ti, the sputtering chamber was evacuated down to <9.40 × 10⁻⁶ Pa, the residual pressure, and then filled with ultrahigh purity argon gas (99.999%, Elme Messer Gaas, Lithuania) to a sputtering pressure of 8 × 10⁻¹ Pa. Direct current sputtering of Ti was conducted under conditions of a constant cathodic power (100 W) and the rate of magnetron sputtering was 0.1 Å s−1.

2.2. Preparation of Pt-Coated Glass|Ti Electrode (Glass|Ti|Pt)

The glass|Ti|Pt electrode was prepared by forming a thin layer of Pt on a glass|Ti electrode using a potentiostatic double-pulse method (Figure 1C,D). The first potential pulse (E1) was 1 s at −1.5 V (vs. Ag|AgCl, KClsat) and the second potential pulse (E2) was 836 s at −0.6 V (vs. Ag|AgCl, KClsat), corresponding to a current density of approx. −2.0 mA cm−2. The electroplating solution contained 19.3 mM of H2PtCl6·6H2O (99.9%, Alfa Aesar, Karlsruhe, Germany) and 2.5 M of HCl (p.a., ROTH, Karlsruhe, Germany). A detailed explanation of Pt electrodeposition on a glass|Ti electrode follows in the “Results and discussion” part of this study (Section 3.2).

2.3. Atomic Force Microscopy, Scanning Electron Microscopy, and Spectroscopic Ellipsometry Measurements of the Glass|Ti and Glass|Ti|Pt Electrodes

Surface topography images of the glass|Ti and glass|Ti|Pt electrodes were obtained using atomic force microscopy (AFM) (“Catalyst” instrument, Bruker, Billerica, MA, USA). During AFM measurements in air, a PeakForce Tapping® mode with a conventional silicon Scan Asyst Air AFM tip (resonance frequency 70 kHz, spring constant 0.4 N m−1) was applied. Obtained AFM images were processed using NanoScope Analysis v1.40r1 software.
Surface morphology was investigated using a TM 3000 scanning electron microscope (SEM, Hitachi, Tokyo, Japan). The cross-sectional structure of the films was observed using a SU-70 FE-SEM (Hitachi, Tokyo, Japan) at an operating voltage of 5 kV.
Spectroscopic ellipsometry measurements were conducted using a spectral ellipsometer from J.A. Woollam (Lincoln, NE, USA) which operates in the range of 200 nm to 1000 nm. Regression analysis of the collected data was performed using Complete EASE software 4.05 from J.A.Woollam. The angle of incident light was 70°, which is close to Brewsters angle.

2.4. Electrochemical Investigations of Glass|Ti and Glass|Ti|Pt Electrodes

Linear sweep voltammetry, cyclic voltammetry, chronoamperometry, and fast Fourier transform electrochemical impedance spectroscopy (FFT-EIS) measurements were performed with a three-electrode cell consisting of the working glass|Ti or glass|Ti|Pt electrode, Pt wire (99.99%) as a counter electrode, and Ag|AgCl, KClsat as a reference electrode.
A μAUTOLAB potentiostat/galvanostat from ECO-Chemie (Utrecht, The Netherlands) was used to perform cyclic voltammetry-, linear sweep voltammetry-, and chronoamperometry-based measurements.
All electrochemical measurements were carried out in the handmade Teflon cell where the working electrode was connected to an electrolyte solution via a circular hall (radius 0.5 cm) in a wall of the Teflon cell (Figure 1C,E). This handmade cell enabled us to ensure a consistent geometric surface area of 0.785 cm2 at the interface-working electrode–electrolyte solution during all the experiments.
FFT-EIS measurements were performed with an FFT impedance spectrometer EIS-128/16 constructed by prof. G. Popkirov (University of Kiel, Kiel, Germany) [41]. The impedance spectra were recorded in potentiostatic mode and the range of alternating current frequencies varied from 1.5 Hz to 10 kHz. Data analysis software “Zview 2” was used to create the model representing the elements of a selected equivalent circuit.

2.5. Electrooxidation of Cyanide by Using the Glass|Ti|Pt Electrode

The electrochemical oxidation of a 0.1 M KCN (99.8%, Sigma-Aldrich, Munich, Germany) solution was carried out by using a power supply “EL 561R Power Supply” (Aim & Thurlby Thandar Instruments, Huntingdon, UK). All experiments reported in this study were performed in a base solution of 0.1 M KCN at pH 11 without any chemical additives in order to avoid competing reactions that might occur at the electrode and possibly interfere with the results. The 0.1 M KCN solution can be considered as highly concentrated and characterized as an electrolyte because the conductance of this solution reaches 12.6 mS cm−1. The glass|Ti|Pt electrode (0.785 cm2) was used as an anode and a stainless steel plate was used as a cathode (Figure 1E).
To evaluate the efficiency of the cyanide electrooxidation current, the concentration of cyanide ions in the samples of electrolysis solution was measured after 2 and 4 h (from the beginning of the electrolysis) via a potentiometry method with a silver electrode [20,21]. The efficiency of the cyanide electrooxidation current was calculated using Equation (2):
η = ( c 0 c ) · V · n · F i · t · 100 %
here, c0 is the initial concentration of CN (0.1 M); c is the concentration (M) of CN in the electrolysis solution, measured after time t; V is the volume of electrolysis solution (2.5·10−2 L); n is the number of electrons transferred in the reaction (n = 2) (Equation (1)); F is the Faraday constant (96,485 C mol−1); i is the current (2.0 × 10⁻² A); and t is the time from the beginning of electrolysis (s).
The catalytic performance of the glass|Ti|Pt electrode was evaluated by calculating the energy consumption (EC) values according to Equation (3) [30]:
E C = Δ E · Q Δ [ C N ] · V
here, Δ E is the potential difference between the working and auxiliary electrodes (2.5 V), Q is the charge passed during electrolysis (C), Δ [ C N ] is the change in cyanide concentration (g L−1), and V is the volume of electrolysis solution (2.5 × 10⁻² L).

3. Results and Discussion

3.1. Atomic Force Microscopy, Scanning Electron Microscopy, and Spectroscopic Ellipsometry Measurements of the Glass|Ti Electrode

During the investigation and comparison of different techniques for the electrodeposition of metals, one should consider the influence of substrate surface roughness, as it can affect the morphology of formed coatings [42]. In order to eliminate the influence of the substrate surface roughness on the properties of the electrochemically formed Pt thin film, a glass slide coated with a magnetron-sputtered Ti layer (glass|Ti) was used as a substrate for the electrochemical deposition of Pt.
Since the morphology of the substrate strongly influences Pt deposition efficiency, the AFM and SEM investigation of the glass|Ti electrode was carried out before electrodeposition of the Pt layer. Figure 2 shows the AFM and SEM images of the magnetron-sputtered titanium surface, showing that the amplitude of the Ti surface height varies by only about 1 nm (Figure 2A–C) and the calculated values of Ra (surface roughness) and RMS (root mean square) are equal to 0.84 ± 0.2 nm and 0.94 ± 0.03 nm, respectively. SEM images of the top view (Figure 2D) and cross-sectional view (Figure 2E) of the glass|Ti electrode show that the surface of the sputtered Ti layer can be considered very smooth. Taking into account this finding, we can assume that the electrocatalytic activity of the further developed galvanically platinized electrode will depend only on the properties of the Pt thin film, but not on the roughness of the Ti surface.
The surface of Ti oxidizes spontaneously and forms a native oxide layer (TiO2) [43,44,45,46]. The presence of a TiO2 layer in platinum-covered Ti electrodes (Ti|Pt) can affect the electrochemical properties (e.g., shape of cyclic voltammograms) of an electrode [37], but it does not seem to effect the catalytic activity of the electrode in the oxidation of organic compounds (e.g., glycerol) [37]. Nevertheless, in order to elucidate the effect of TiO2 on our subsequent experiments, the thickness of the TiO2 layer on the glass|Ti electrode was evaluated using a spectroscopic ellipsometry method (Figure 3) 24 h after magnetron sputtering of Ti onto the glass slide. For processing the ellipsometric data of the glass|Ti electrode (Figure 3) we applied a three-layered optical model consisting of (i) a glass substrate, characterized as a BK-7 glass slide, (ii) an intermedium Ti layer, characterized by a B-spline model using Ti as the starting material, and (iii) a top layer of TiO2, characterized by a Cauchy model [47]. Values for the optical constants representing each layer of the model were obtained from the Complete EASE software database. The Ti and TiO2 layers were 23.9 nm and 2.7 nm thick, respectively, with a mean square error of 1.274 ± 0.001 nm. The thickness of the TiO2 layer on our glass|Ti electrode (2.7 nm) is in line with the published thickness values of spontaneously formed TiO2 layers on thin Ti metal coatings reported in the literature (2.4–2.9 nm) [45,46].
One may expect that the thickness of a TiO2 layer may change over time. A glass slide covered with magnetron-sputtered Ti was kept at ambient conditions for 3 weeks and was again examined by means of spectroscopic ellipsometry (Figure 3). Ellipsometric curves obtained by investigating one-day and 3-week-old glass|Ti electrodes were similar (Figure 3); thus, it can be presumed that the layer of TiO2, which grows on the surface of Ti during the first 24 h, has a constant thickness of ≈2.7 nm that changes little over 3 weeks. The results of spectroscopic ellipsometry indicate that the surface of the glass|Ti electrode is stable and is not affected by exposure to air over time. This is very important for the subsequent Pt deposition and the formation of the glass|Ti electrodes with reproducible electrochemical properties.

3.2. Electrodeposition of Pt Layer on the Glass|Ti Electrode

When the potentiostatic double-pulse method is applied for metal deposition, two potential pulses are applied to the working electrode—(i) an initial short pulse (E1) of high cathodic overpotential that enhances the formation of nuclei and (ii) a much longer second pulse (E2) of lower cathodic overpotential that enhances the growth of already existing nuclei [48,49]. In order to select the E1 and E2 values for Pt deposition for the potentiostatic double-pulse method, the glass|Ti electrode was investigated via linear sweep voltammetry (Figure 4) in the Pt deposition solution (H2PtCl6·6H2O (19.3 mM) + HCl (2.5 M)). The voltammetric data indicated that the reduction in the H2PtCl6 complex begins at approx. 0.2 V (Figure 4). However, electrochemical deposition of Pt from the hexachloroplatinate ([Pt(Cl)6]4−) solution is described as a sequential process that can proceed by at least three (I, II, and III) alternative reaction mechanisms [50,51] (Equations (4)–(8)):
(I)
Reduction of [ Pt Cl 6 ] 2 (Equation (4)), followed by reduction of [ P t C l 4 ] 2 (Equation (5)):
[ P t C l 6 ] 2 + 2 e [ P t C l 4 ] 2 + 2 C l
[ P t C l 4 ] 2 + 2 e P t 0 + 4 C l
(II)
Reduction of [ P t C l 6 ] 2 (Equation (4)), followed by disproportionation of formed [ P t C l 4 ] 2 (Equation (6)):
2 [ P t C l 4 ] 2 P t 0 + [ P t C l 6 ] 2 + 2 C l
(III)
Formation of H 2 gas (Equation (7)), followed by a reaction between H 2 and [ P t C l 6 ] 2 (Equation (8)):
2 H + + 2 e H 2
[ P t C l 6 ] 2 + 2 H 2 P t 0 + 6 C l + 4 H +
G. Lu and G. Zangari [52] point out that the reduction peaks of [Pt(Cl)6]2−, [Pt(Cl)4]2−, and H+ species have different values, and these peaks are not well defined in voltammograms when Pt is deposited from the chloride-containing [Pt(Cl)6]4− solution. Therefore, it is complicated to choose an appropriate potential value for the effective platinization of a glass|Ti electrode from the voltammetric data (Figure 4). Previous investigations [18,19,20,21,29] suggest that by using hexachloroplatinate electrolytes, high-quality Pt coatings can be deposited galvanostatically over a wide range of cathodic current densities (from −1.5 mA cm−2 to −35 mA cm−2).
We propose the double-pulse method for the deposition of a Pt layer on the glass|Ti electrode. The first potential pulse (E1) was chosen to be 1 s. Such short, high polarization pulse induces a large number of Pt nucleation sites and must be performed quickly [48,49]. A second potential pulse (E2) is used to increase the size of the Pt microparticles formed during the nucleation phase [48,49]. In our case, the potential of −0.6 V (vs. Ag|AgCl, KClsat), corresponding to an electrode current of approximately −2.0 mA (Figure 4), was chosen as the potential for microparticle growth (E2), while the short polarization pulse at −1.5 V was chosen as the potential (E1) to induce nucleation of Pt on the glass|Ti substrate. Under these conditions, a Pt layer with a theoretical thickness of 500 nm was deposited on the electrode, while our previous research [19,21] showed that a Ti electrode coated with a Pt layer thicker than 400 nm is an effective anode for the electrochemical oxidation of cyanide ions.
According to Faraday’s first law, the theoretical thickness of a Pt layer formed on a glass|Ti electrode is proportional to the electric charge (Q) transferred to the electrode. It was calculated (Equation (9)) that an electric charge of 1.67 coulombs (C) is needed for electrodeposition of a 500 nm thick layer of Pt on a glass|Ti electrode with a 0.785 cm2 geometric area. Chronoamperometric investigation (Figure 4, inset) indicated that 836 s is required to grow a Pt layer of 500 nm, which was calculated as theoretical thickness, when a −0.6 V (vs. Ag|AgCl, KClsat) potential is applied to the glass|Ti electrode; therefore, 836 s was chosen as it was theoretically calculated to be the most optimal duration for a second pulse.
Q = d F n S ρ P t M P t
here, Q is the electric charge passed through the working electrode (C), d is the thickness of the Pt layer (5 × 10⁻⁷ m), ρ P t is the density of Pt (2.145 × 10⁴ kg m−3), M P t is the atomic mass of Pt (0.195 kg mol−1), F is the Faraday constant (96,485 C mol−1), n is the number of electrons transferred in the reaction (n = 4) (Equations (3)–(7)), and S is the geometric area of the glass|Ti electrode (7.85 × 10⁻⁵ m2).
AFM studies confirmed (Figure 5) that the surface of magnetron-sputtered Ti is covered with Pt deposits consisting of uniformly distributed Pt microparticles forming a thin layer with an RMS roughness of 332 ± 36 nm and an Ra of 311 ± 20 nm.
The roughness of the magnetron-sputtered Ti substrate (Figure 2), on which the Pt layer was deposited, is extremely smooth (RMS = 0.94 ± 0.03 nm) and does not contribute to the roughness parameters of the Pt. Therefore, the AFM-measured RMS can be used as a quantitative evaluation of the thickness of the electrodeposited Pt layer [53]. In our experiments, the RMS (332 ± 36 nm) was estimated to be slightly lower than the theoretically calculated Pt layer thickness according to Faraday’s law (500 nm). Therefore, the current efficiency of the Pt electrodeposition was estimated to be 70%. This result is in agreement with the SEM data (Figure 5D,E). As can be seen from Figure 5D, the surface of the glass|Ti|Pt electrode is covered with well-defined Pt microparticles with diameters ranging from 0.6 μm to 3.5 μm. The cross-sectional view in Figure 5E shows that the height of the Pt microparticles is about 600 nm. As expected, it is considerably higher than the RMS because part of the coated surface is filled with voids separating the microparticles, as shown by the SEM (Figure 5D).
The obtained high yield of Pf deposition confirms the efficiency of our approach to apply the potentiostatic double-pulse method for Pt electrodeposition. The use of a very smooth Ti surface (Figure 2) as a substrate in combination with a pulsed regime under potentiostatic control resulted in a very efficient (up to 70%) Pt deposition process, which is highly superior to classical Pt deposition protocols utilizing under galvanostatic control, which efficiency does not exceed 15%–20% in chloroplatinic acid-based electrolytes [29]. In summary, it can be concluded that electrocatalytically active (vide infra) Pt coatings on almost atomically smooth magnetron-sputtered Ti films can be achieved via the potentiostatic double-pulse method.

3.3. Cyclic Voltammetry and FFT-EIS Investigations of the Glass|Ti|Pt Electrode

Electrocatalytic activity of the glass|Ti|Pt electrode towards cyanide oxidation was tested via cyclic voltammetry in the 0.1 M KCN solution (Figure 6, curve a) in the anodic potential range (from 0 V to 2.5 V vs. Ag|AgCl, KClsat). In comparison to the control experiments with a non-platinized glass|Ti electrode (Figure 6, curve b), the anodic current of the glass|Ti|Pt electrode reached approximately 10–80 times higher values (depending on the applied potential), indicating a high catalytic activity of the Pt layer for the electrochemical oxidation of cyanide.
FFT-EIS investigations were performed in a potentiostatic mode within a potential interval where the current yield of water electrolysis is negligible and the current yield of cyanide oxidation is dominant. The influence of water electrolysis on the oxidation of cyanide was considered negligible because of two reasons—(i) the FFT-EIS data were obtained almost immediately after the start of the perturbation voltage, avoiding any surface concentration depletion resulting from the registration of FFT-EIS spectra in the chosen frequency range (1.5 Hz–9.5 kHz) since it takes only 0.69 s; and (ii) in agreement with the cyclic voltammetry data (Figure 6), the cyanide oxidation current starts to increase rapidly at the potentials >0.8 V. However, the rate of water electrolysis starts to increase around 1.7 V, while the formation of oxygen bubbles on the glass|Ti|Pt electrode was observed at potentials higher than 1.7 V vs. Ag|AgCl, KClsat. Thus, an FFT-EIS-based investigation of the cyanide electrooxidation on the glass|Ti|Pt electrode was carried out by avoiding any unwanted influence by water electrolysis in the potential range from 0.8 V to 1.7 V vs. Ag|AgCl, KClsat. The obtained impedance spectra are displayed as Nyquist diagrams (Real impedance, Z′ vs. Imaginary impedance, Z″) in Figure 7.
Figure 7 shows that the FFT electrochemical impedance of the investigated system decreases as higher potential is applied to the glass|Ti|Pt electrode. To determine the cause of this potential-related decrement in electrochemical impedance, the FFT-EIS data were analyzed by applying an equivalent circuit model (Figure 7, inset) consisting of uncompensated solution resistance R0; a constant phase element CPE that represents capacitance of the electric double layer (EDL) that which forms at the electrode–solution interface; and a parallel resistance Rct that represents the charge transfer at the interface Pt layer—electrolyte. The values of equivalent circuit elements are shown at Table 2. The accuracy of these values was verified with a Chi Square Goodness of Fit Test (Equation (10)), which evaluates how close the experimental values (Equation (10), symbol “Oi”) fit the values from the model (Equation (10), symbol “Ei”) [54,55]. The best fit is observed when the value of the Chi Square Goodness of Fit Coefficient (Equation (10), symbol “χ2”) is near zero. It was found that the values of the equivalent circuit elements fit the experimental data well (χ2 = 4.4 × 10⁻⁵ ± 1.4 × 10⁻⁵) (Table 2).
χ 2 = ( O i E i ) 2 E i
As seen in Table 2, the values of charge transfer resistance (Rct) decrease as higher potential is applied to the glass|Ti|Pt electrode during FFT-EIS investigations. This decrement of Rct indicates that the rate of electron transfer through the interface of the Pt layer—electrolyte increases as higher potential is applied to the glass|Ti|Pt electrode. Since Rct depends on the potential applied to the electrode, the rate of cyanide electrooxidation can be expressed by the modified Tafel plot [20,56,57,58], which predicts a logarithmic dependence of the charge transfer resistance ( R c t 1 ) on the polarization value of the glass|Ti|Pt electrode (ΔE) (Figure 8). Although the kinetics of the electrochemical reactions is usually analyzed using the conventional Tafel plot (logarithmic dependence of the current density on the electrode polarization, lni vs. ΔE), the modified Tafel plot (ln R c t 1 vs. ΔE) allows the charge transfer process to be distinguished from other factors (e.g., capacitance current, conductivity of the catalyst) that influence the measured current [20,56,57,58]. Therefore, it is considered that the modified Tafel plot is more reliable for the characterization of electrocatalysts [20,56,57,58]. In addition, the analysis of the EIS data using the modified Tafel plot has already been presented in a previous study [20] to determine the mechanism of cyanide oxidation on the platinized Ti plate electrode.
After plotting ln(Rct)−1 against ΔE (Figure 8), linear dependency was observed in two distinct ranges of polarization: from 0.8 V to 1.1 V vs. Ag|AgCl, KClsat (Figure 8, “A” range) and from 1.2 V to 1.7 V vs. Ag|AgCl, KClsat (Figure 8, “B” range). A sudden change in the slope of ln(Rct)−1 vs. ΔE (Figure 8) plot in the “A” and “B” ranges clearly shows that there is a change in the kinetics of cyanide electrooxidation on the glass|Ti|Pt electrode potentials between 1.1 V and 1.2 V vs. Ag|AgCl, KClsat. These transformations are also visible in FFT-EIS Nyquist plots (Figure 7) which undergo significant changes in shape in the potential range from 1.1 V to 1.2 V. Calculated from the slopes of the modified Tafel plot (Figure 8), the anodic charge transfer coefficient has a value of 0.25 and 0.08 in the “A” and “B” ranges, respectively. This indicates that the rate of cyanide oxidation is more dependent on the polarization of the glass|Ti|Pt electrode at lower potentials (“A” range). Meanwhile, the values of the exchange current (i0) for the “A” and “B” ranges, calculated using Equation (11) [59], were equal to 0.02 nA and 73.04 nA, respectively. In addition, it is important to emphasize that the values of the anodic charge transfer coefficient and the exchange current, i0, calculated using the conventional Tafel plot (lni vs. ΔE) should be different from the corresponding values obtained using the modified Tafel plot (Figure 8) because the oxidation current measured amperometrically depends not only on Rct but also on other factors, e.g., the conductivity of the electrode, the capacitance current, etc. [20,56,57,58].
i 0 = R T R c t n F
here R is the gas constant (8.314 J K−1 mol−1), T   i s   t h e temperature (298 K), R c t is the charge transfer resistance at 0 V polarization (578 MΩ for “A” range, 176 kΩ for “B” range), calculated from the slopes in the Tafel plot (Figure 8), n is the number of electrons transferred in the reaction (n = 2) (Equation (1)), and F is the Faraday constant (96,485 C mol−1).
Since the catalytic activity of Pt towards the oxidation of cyanide relates to the presence of oxidized Pt forms (e.g., Pt(OH)2, PtO2, PtO3) [12,14], the change in kinetics of cyanide oxidation in the range between 1.1 V and 1.2 V vs. Ag|AgCl, KClsat should be caused by changes in the surface properties of the glass|Ti|Pt electrode. The Pourbaix diagram of Pt obtained in the aqueous solution [60,61] shows that the surface Pt exists in PtO2 at potentials from 0.2 V to 1.1 V (vs. Ag|AgCl, KClsat) at pH 11, while the application of potentials higher than 1.1 V (vs. Ag|AgCl, KClsat) results in the formation of PtO3 [60,61]. Although the presence of cyanide ions during the study of the glass|Ti|Pt electrode could affect the shape of the Pourbaix diagram, the potential-dependent transition between PtO2 and PtO3 could explain a sudden change in the slope between 1.1 V and 1.2 V potentials (Figure 8).
If higher amounts of oxidized Pt forms (Pt(OH)2, PtO2, PtO3) are produced on the surface of the glass|Ti|Pt electrode, then higher catalytic activity for cyanide electrooxidations can be achieved [12,14]. A higher coverage of the Pt layer with oxidized Pt forms could also explain the high exchange current calculated in the “B” range of the polarization (73.04 nA), indicating a high catalytic activity of the glass|Ti|Pt electrode [62].

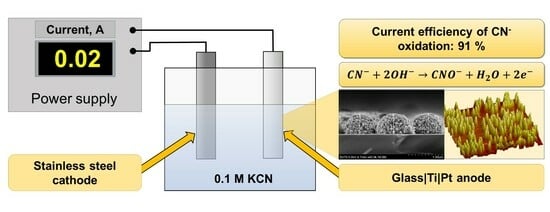
3.4. Application of the Glass|Ti|Pt Electrode for the Electrochemical Oxidation of Cyanide

Since both cyclic voltammetry-based and FFT-EIS-based studies (Figure 6 and Figure 7) indicated good electrocatalytic properties of the platinized electrode (glass|Ti|Pt), further experiments were carried out to investigate the electrochemical oxidation of cyanide on this type of electrode. The glass|Ti|Pt electrode was used as the anode for the galvanostatic oxidation of a 0.1 M KCN solution by applying a current density of 25.5 mA cm−2. After passing a 144 C and 288 C electric charge, the efficiencies of the cyanide oxidation current reached 91% and 69%, respectively (Figure 9). In addition, the current efficiency decreased to 30% when 576 C was passed through the electrode. This decrease in the efficiency of the cyanide oxidation current may be caused by the dissolution of active sites of Pt from the surface of the glass|Ti|Pt electrode due to oxidation reactions that inevitably occur at high anodic potentials [63]. Moreover, cyanide ions could increase the rate of Pt dissolution itself as CN is used for Pt leaching [64]. Dissolution of Pt from the surface of the glass|Ti|Pt electrode may result in the exposure of Ti to the KCN solution, causing dissolution of the Ti layer [21]. As a result, under conditions of continuous anodic polarization, the catalytic activity of the glass|Ti|Pt electrode for cyanide electrooxidation is significantly reduced. The decrease in the efficiency of the cyanide oxidation current may also be caused by poisoning of the glass|Ti|Pt electrode with the side products that may be formed during cyanide electrolysis e.g., polymeric cyanogen [12,32]. Pt or Pt-coated electrodes can be poisoned by the intermediate or side-products of chemical reactions when utilized in the electrochemical oxidation of organic compounds [65,66,67], e.g., Pt electrodes can also be poisoned by CO during the oxidation of methanol [65] or by acetone during the oxidation of 2-propanol [66,67].
The catalytic performance of the glass|Ti|Pt electrode was evaluated by calculating the energy consumption values (Equation (3)) [30], which can be related to the current efficiency. The current efficiencies of cyanide oxidation after passing 144 C and 288 C (91% and 69%, respectively) corresponded to an energy consumption of 5.17 kWh kg−1 and 7.5 kWh kg−1, respectively.
Table 3 shows that the glass|Ti|Pt electrode presented in this research achieves the highest current efficiency of 91%. Also, the calculated energy consumption value (5.15 kWh kg−1) of the glass|Ti|Pt electrode is lower than other electrocatalysts found in the literature (30–70 kWh m−3 or 70–393 kWh kg−1) [24,30,32,39,68]. In addition, the previously reported comparative study with a plain Pt electrode [10] showed that the current efficiency of cyanide electrooxidation reached 84% during the first hour of electrolysis, i.e., after passing a 144 C electric charge through the solution, but after passing 288 C electric charge, the current efficiency decreased to 59% (Table 3). In this research, we show that the higher current efficiencies of 91% and 69% can be observed until 288 C have passed through the glass|Ti|Pt electrode. Even when 576 C was passed through the electrode, the current efficiency decreased by less than 30%. Although other examples of Pt-based electrodes for cyanide utilization have been reported in [22,23,28,34,35,36], the results of these studies are not included in Table 3 because the initial cyanide concentrations used in these reports were different from the current study, and the conditions of the electrolysis were also different. However, the anodes described by other authors [21,24,39] showed current efficiencies ranging from 3% to 40%, indicating that the glass|Ti|Pt electrode is more efficient. In particular, the glass|Ti|Pt electrode with a very thin layer (about 350 nm) of Pt can be used for effective oxidation of cyanide despite the possibility of some degradation of the Pt layer. The ability to use such a thin layer of Pt for cyanide waste treatment could help reduce the cost of waste treatment and allow efficient use of natural Pt resources.

4. Conclusions

In this study, a Pt thin film was deposited via a double-pulse potentiostatic method onto a glass slide coated with a layer of magnetron-sputtered Ti. Chronoamperometric studies together with AFM and SEM measurements showed that the Pt deposits, consisting of uniformly distributed Pt microparticles with diameters ranging from 0.6 μm to 3.5 μm, were deposited on the glass|Ti electrode. The height of the Pt particles was about 600 nm, while the current efficiency of the Pt electrodeposition reached 70%.
The glass|Ti|Pt electrode obtained in this way was used for the galvanostatic oxidation of a 0.1 M KCN solution in the absence of any chemical additives. The electrode showed an energy consumption of 5.7 kWh kg−1 and a current efficiency of 91% after passing 144 C of electric charge.
The FFT-EIS data of the glass|Ti|Pt electrode in 0.1 M KCN solution showed that the charge transfer resistance decreases with increasing anodic polarization of the glass|Ti|Pt electrode; thus, the rate of electron transfer through the interface of Pt thin film—electrolyte increases as higher potential is applied to the glass|Ti|Pt electrode. The rate of cyanide electrooxidation expressed by the modified Tafel plot showed a linear dependence in two different polarization ranges, clearly indicating the change in the kinetics of cyanide oxidation that may be caused by the anodic potential-influenced changes in the surface properties of the glass|Ti|Pt electrode.
In conclusion, electrocatalytically active Pt microparticle coatings on almost atomically smooth magnetron-sputtered Ti films, obtained via the potentiostatic double-pulse method, can be used as effective anodes for the degradation of cyanide solutions, which accumulate as toxic waste not only in chemical industries but also in small chemical laboratories.
The future scope of the study will focus on the processes that influence the slow deactivation of the electrocatalytic Pt coating. Understanding the mechanism of this process would allow us to slow down the degradation of the electrocatalytically active surface and to develop robust electrochemical anodes for the efficient removal of toxic cyanide species from wastewater.

Author Contributions

A.V.: Conceptualization, Validation, Formal analysis, Writing—review and editing, and Supervision.; P.V.: Methodology, Formal analysis, Writing—original draft, and Visualization.; I.G.: Methodology, Investigation, Formal analysis, and Writing—original draft.; Z.M.: Investigation, Formal analysis, and Writing—original draft; R.L.: Investigation and Visualization.; D.J.: Investigation, Methodology, and Formal analysis; G.V.: Methodology, Formal analysis, and Writing—review and editing. All authors have read and agreed to the published version of the manuscript.

Funding

This research received no external funding.

Institutional Review Board Statement

Not applicable.

Informed Consent Statement

Not applicable.

Data Availability Statement

The data presented in this study are available on request from the corresponding author.

Acknowledgments

The authors thank Ieva Plikusiene at the Institute of Chemistry, Vilnius University, for spectroscopic ellipsometry measurements performed in the current study.

Conflicts of Interest

The authors declare that the research was conducted in the absence of any commercial or financial relationships that could be constructed as a potential conflict of interest.

References

  1. Botz, M.M. Overview of Cyanide Treatment Methods. Min. Environ. Manag. 2001, 28–30. [Google Scholar]
  2. Gail, E.; Gos, S.; Kulzer, R.; Lorösch, J.; Rubo, A.; Sauer, M.; Kellens, R.; Reddy, J.; Steier, N.; Hasenpusch, W. Cyano Compounds, Inorganic. Ullmann’s Encycl. Ind. Chem. 2011, 1, 686–688. [Google Scholar] [CrossRef]
  3. Hamel, J. A Review of Acute Cyanide Poisoning with a Treatment Update. Crit. Care Nurse 2011, 31, 72–82. [Google Scholar] [CrossRef] [PubMed]
  4. Workplace Exposure Standard (WES) Review. Hydrogen Cyanide. WorkSafe New Zealand (Mahi Haumaru Aotearoa). 2021. Available online: https://www.worksafe.govt.nz/topic-and-industry/monitoring/workplace-exposure-standards-and-biological-exposure-indices/all-substances/view/hydrogen-cyanide (accessed on 19 October 2023).
  5. Recommendation from the Scientific Committee on Occupational Exposure Limits for Cyanide. 2010. Available online: https://www.ser.nl/api/Mfiles/DownloadFirstDocument?Id=13b586ef-b2ab-4c05-87d5-b5fe1f0f40e9 (accessed on 19 October 2023).
  6. Deutsche Forschungsgemeinschaft, Commission for the Investigation of Health Hazards of Chemical Compounds in the Work Area. Hydrogen Cyanide, Potassium Cyanide and Sodium Cyanide [MAK Value Documentation, 2003]. MAK-Collect. Occup. Health Saf. 2012, 19, 190–210. [Google Scholar] [CrossRef]
  7. Dash, R.R.; Balomajumder, C.; Kumar, A. Treatment of Metal Cyanide Bearing Wastewater by Simultaneous Adsorption and Biodegradation (SAB). J. Hazard. Mater. 2008, 152, 387–396. [Google Scholar] [CrossRef]
  8. Marsden, J.; House, I. The Chemistry of Gold Extraction, 2nd ed.; Society for Mining, Metallurgy, and Exploration: Englewood, CO, USA, 2006; ISBN 978 0 87335 240 6. [Google Scholar]
  9. Eisler, R.; Wiemeyer, S.N. Cyanide Hazards to Plants and Animals from Gold Mining and Related Water Issues. Rev. Environ. Contam. Toxicol. 2004, 183, 21–54. [Google Scholar] [CrossRef]
  10. Kanthak, J. The Baia Mare Gold Mine Cyanide Spill: Causes, Impacts and Liability—ReliefWeb. Available online: https://reliefweb.int/report/hungary/baia-mare-gold-mine-cyanide-spill-causes-impacts-and-liability (accessed on 6 January 2022).
  11. Ho, S.P.; Wang, Y.Y.; Wan, C.C. Electrolytic Decomposition of Cyanide Effluent with an Electrochemical Reactor Packed with Stainless Steel Fiber. Water Res. 1990, 24, 1317–1321. [Google Scholar] [CrossRef]
  12. Sawyer, D.T.; Day, R.J. Electrochemical Oxidation of Cyanide Ion at Platinum Electrodes. J. Electroanal. Chem. 1963, 5, 195–203. [Google Scholar] [CrossRef]
  13. Rajeshwar, K.; Ibanez, J.G. Environmental Electrochemistry: Fundamentals and Applications in Pollution Abatement. J. Am. Chem. Soc. 1997, 120, 776. [Google Scholar]
  14. Tamura, H.; Arikado, T.; Yoneyama, H.; Matsuda, Y. Anodic Oxidation of Potassium Cyanide on Platinum Electrode. Electrochim. Acta 1974, 19, 273–277. [Google Scholar] [CrossRef]
  15. Dong, K.; Xie, F.; Wang, W.; Chang, Y.; Lu, D.; Gu, X.; Chen, C. The Detoxification and Utilization of Cyanide Tailings: A Critical Review. J. Clean. Prod. 2021, 302, 126946. [Google Scholar] [CrossRef]
  16. Tran, Q.B.; Lohitnavy, M.; Phenrat, T. Assessing Potential Hydrogen Cyanide Exposure from Cyanide-Contaminated Mine Tailing Management Practices in Thailand’s Gold Mining. J. Environ. Manag. 2019, 249, 109357. [Google Scholar] [CrossRef] [PubMed]
  17. Alvillo-Rivera, A.; Garrido-Hoyos, S.; Buitrón, G.; Thangarasu-Sarasvathi, P.; Rosano-Ortega, G. Biological Treatment for the Degradation of Cyanide: A Review. J. Mater. Res. Technol. 2021, 12, 1418–1433. [Google Scholar] [CrossRef]
  18. Valiūnienė, A.; Margarian, Ž.; Plaušinaitienė, V.; Laukžemis, V.; Rekertaitė, A.I. Electrodeposition and Characterization of Pt Coatings on Ti for Electrooxidation of Cyanide. Chemija 2015, 26, 238–243. [Google Scholar]
  19. Valiuniene, A.; Antanavičius, V.; Margarian, Ž.; Matulaitiene, I.; Valinčius, G. Electrochemical Oxidation of Cyanide Using Platinized Ti Electrodes. Mater. Sci. 2013, 19, 385–389. [Google Scholar] [CrossRef]
  20. Valiūnienė, A.; Margarian, Ž.; Valiūnas, R. Electrooxidation of Cyanide Ion on a Platinized Ti Electrode. React. Kinet. Mech. Catal. 2015, 115, 449–461. [Google Scholar] [CrossRef]
  21. Valiūnienė, A.; Baltrūnas, G.; Keršulytė, V.; Margarian, Ž.; Valinčius, G. The Degradation of Cyanide by Anodic Electrooxidation Using Different Anode Materials. Process Saf. Environ. Prot. 2013, 91, 269–274. [Google Scholar] [CrossRef]
  22. Szpyrkowicz, L.; Kaul, S.N.; Molga, E.; DeFaveri, M. Comparison of the Performance of a Reactor Equipped with a Ti/Pt and an SS Anode for Simultaneous Cyanide Removal and Copper Recovery. Electrochim. Acta 2000, 46, 381–387. [Google Scholar] [CrossRef]
  23. Szpyrkowicz, L.; Zilio-Grandi, F.; Kaul, S.N.; Polcaro, A.M. Copper Electrodeposition and Oxidation of Complex Cyanide from Wastewater in an Electrochemical Reactor with a Ti/Pt Anode. Ind. Eng. Chem. Res. 2000, 39, 2132–2139. [Google Scholar] [CrossRef]
  24. Cañizares, P.; Díaz, M.; Domíguez, J.A.; Lobato, J.; Rodrigo, M.A. Electrochemical Treatment of Diluted Cyanide Aqueous Wastes. J. Chem. Technol. Biotechnol. 2005, 80, 565–573. [Google Scholar] [CrossRef]
  25. Oztekin, Y.; Ramanaviciene, A.; Yazicigil, Z.; Solak, A.O.; Ramanavicius, A. Direct Electron Transfer from Glucose Oxidase Immobilized on Polyphenanthroline-Modified Glassy Carbon Electrode. Biosens. Bioelectron. 2011, 26, 2541–2546. [Google Scholar] [CrossRef]
  26. Öğütveren, Ü.B.; Törü, E.; Koparal, S. Removal of Cyanide by Anodic Oxidation for Wastewater Treatment. Water Res. 1999, 33, 1851–1856. [Google Scholar] [CrossRef]
  27. Hofseth, C.S.; Chapman, T.W. Electrochemical Destruction of Dilute Cyanide by Copper-Catalyzed Oxidation in a Flow-Through Porous Electrode. J. Electrochem. Soc. 1999, 146, 199–207. [Google Scholar] [CrossRef]
  28. Lei, S.; Song, Y. Comparative Study on Electrochemical Treatment of Cyanide Wastewater. Front. Chem. 2021, 9, 153. [Google Scholar] [CrossRef]
  29. Rao, C.R.K.; Trivedi, D.C. Chemical and Electrochemical Depositions of Platinum Group Metals and Their Applications. Coord. Chem. Rev. 2005, 249, 613–631. [Google Scholar] [CrossRef]
  30. Dobrosz-Gómez, I.; Gómez García, M.Á.; Gaviria, G.H.; GilPavas, E. Mineralization of Cyanide Originating from Gold Leaching Effluent Using Electro-Oxidation: Multi-Objective Optimization and Kinetic Study. J. Appl. Electrochem. 2020, 50, 217–230. [Google Scholar] [CrossRef]
  31. Singh, H.; Mishra, B.K. Degradation of Cyanide, Aniline and Phenol in Pre-Treated Coke Oven Wastewater by Peroxide Assisted Electro-Oxidation Process. Water Sci. Technol. 2018, 78, 2214–2227. [Google Scholar] [CrossRef]
  32. Bhadrinarayana, N.S.; Basha, C.A.; Anantharaman, N. Electrochemical Oxidation of Cyanide and Simultaneous Cathodic Removal of Cadmium Present in the Plating Rinse Water. Ind. Eng. Chem. Res. 2007, 46, 6417–6424. [Google Scholar] [CrossRef]
  33. Arikado, T.; Iwakura, C.; Yoneyama, H.; Tamura, H. Anodic Oxidation of Potassium Cyanide on the Graphite Electrode. Electrochim. Acta 1976, 21, 1021–1027. [Google Scholar] [CrossRef]
  34. Wang, H.; Gao, C.; Li, X.; Liu, C.Y.; Yu, T.; Li, Y.; Liu, L.; Wang, H. Electroreduction Recovery of Gold, Platinum and Palladium and Electrooxidation Removal of Cyanide Using a Bioelectrochemical System. Bioresour. Technol. Rep. 2022, 18, 101007. [Google Scholar] [CrossRef]
  35. Ken, D.S.; Sinha, A. Dimensionally Stable Anode (Ti/RuO2) Mediated Electro-Oxidation and Multi-Response Optimization Study for Remediation of Coke-Oven Wastewater. J. Environ. Chem. Eng. 2021, 9, 105025. [Google Scholar] [CrossRef]
  36. Chen, Y.; Song, Y.; Chen, Y.; Zhang, X.; Lan, X. Comparative Experimental Study on the Harmless Treatment of Cyanide Tailings through Slurry Electrolysis. Sep. Purif. Technol. 2020, 251, 117314. [Google Scholar] [CrossRef]
  37. Hossein, M.G.; Sajjadi, S.A.S.; Momeni, M.M. Electrodeposition of Platinum Metal on Titanium and Anodised Titanium from P Salt: Application to Electro-Oxidation of Glycerol. Surf. Eng. 2007, 23, 419–424. [Google Scholar] [CrossRef]
  38. Sharma, R.; Gyergyek, S.; Andersen, S.M. Environmentally and Industrially Friendly Recycling of Platinum Nanoparticles Through Electrochemical Dissolution–Electrodeposition in Acid-Free/Dilute Acidic Electrolytes. ChemSusChem 2018, 11, 3742–3750. [Google Scholar] [CrossRef] [PubMed]
  39. Pérez, T.; López, R.L.; Nava, J.L.; Lázaro, I.; Velasco, G.; Cruz, R.; Rodríguez, I. Electrochemical Oxidation of Cyanide on 3D Ti–RuO2 Anode Using a Filter-Press Electrolyzer. Chemosphere 2017, 177, 136. [Google Scholar] [CrossRef] [PubMed]
  40. Berenguer, R.; Quijada, C.; La Rosa-Toro, A.; Morallón, E. Electro-Oxidation of Cyanide on Active and Non-Active Anodes: Designing the Electrocatalytic Response of Cobalt Spinels. Sep. Purif. Technol. 2019, 208, 42–50. [Google Scholar] [CrossRef]
  41. Popkirov, G.S.; Schindler, R.N. A New Impedance Spectrometer for the Investigation of Electrochemical Systems. Rev. Sci. Instrum. 1992, 63, 5366–5372. [Google Scholar] [CrossRef]
  42. Grosfils, P.; Lutsko, J.F. Impact of Surface Roughness on Crystal Nucleation. Crystals 2021, 11, 4. [Google Scholar] [CrossRef]
  43. Wang, G.; Li, J.; Lv, K.; Zhang, W.; Ding, X.; Yang, G.; Liu, X.; Jiang, X. Surface Thermal Oxidation on Titanium Implants to Enhance Osteogenic Activity and in Vivo Osseointegration. Sci. Rep. 2016, 6, 31769. [Google Scholar] [CrossRef]
  44. Sul, Y.-T.; Johansson, C.B.; Jeong, Y.; Albrektsson, T. The Electrochemical Oxide Growth Behaviour on Titanium in Acid and Alkaline Electrolytes. Med. Eng. Phys. 2001, 23, 329–346. [Google Scholar] [CrossRef]
  45. Lendel, V.V.; Lomakina, O.V.; Mel’nychenko, L.Y.; Shaykevich, I.A. Optical Properties of Thin Films of Titanium with Transient Layers on Them. Semicond. Phys. Quantum Electron. Optoelectron. 2010, 13, 231–234. [Google Scholar] [CrossRef]
  46. Matveev, V.A.; Pleshanov, N.K.; Bulkin, A.P.; Syromyatnikov, V.G. The Study of the Oxidation of Thin Ti Films by Neutron Reflectometry. J. Phys. Conf. Ser. 2012, 340, 012086. [Google Scholar] [CrossRef]
  47. Fujiwara, A.H. Spectroscopic Ellipsometry: Principles and Applications; John Wiley and Sons: London, UK, 2007; ISBN 0470016086. [Google Scholar]
  48. Duarte, M.M.E.; Pilla, A.S.; Sieben, J.M.; Mayer, C.E. Platinum Particles Electrodeposition on Carbon Substrates. Electrochem. Commun. 2006, 8, 159–164. [Google Scholar] [CrossRef]
  49. Choi, K.H.; Kim, H.S.; Lee, T.H. Electrode Fabrication for Proton Exchange Membrane Fuel Cells by Pulse Electrodeposition. J. Power Sources 1998, 75, 230–235. [Google Scholar] [CrossRef]
  50. Kowal, A.; Doblhofer, K.; Krause, S.; Weinberg, G. Mechanism of Cathodic PtCl62- Reduction to Platinum Clusters on Electrodes Coated with Polyvinylpyridinium Films. J. Appl. Electrochem. 1987, 17, 1246–1253. [Google Scholar] [CrossRef]
  51. Alpuche-Aviles, M.A.; Farina, F.; Ercolano, G.; Subedi, P.; Cavaliere, S.; Jones, D.J.; Rozière, J. Electrodeposition of Two-Dimensional Pt Nanostructures on Highly Oriented Pyrolytic Graphite (HOPG): The Effect of Evolved Hydrogen and Chloride Ions. Nanomaterials 2018, 8, 668. [Google Scholar] [CrossRef] [PubMed]
  52. Lu, G.; Zangari, G. Electrodeposition of Platinum on Highly Oriented Pyrolytic Graphite. Part I:  Electrochemical Characterization. J. Phys. Chem. B 2005, 109, 7998–8007. [Google Scholar] [CrossRef]
  53. Beaulieu, L.Y.; Rutenberg, A.D.; Dahn, J.R. Measuring Thickness Changes in Thin Films Due to Chemical Reaction by Monitoring the Surface Roughness with in Situ Atomic Force Microscopy. Microsc. Microanal. 2002, 8, 422–428. [Google Scholar] [CrossRef]
  54. Website of the Department of Statistics and Data Science of Yale University, Chi-Square Goodness of Fit Test. Available online: http://www.stat.yale.edu/Courses/1997-98/101/chigf.htm (accessed on 6 January 2022).
  55. Virbickas, P.; Valiūnienė, A.; Baryševa, D.; Popkirov, G.; Ramanavičius, A. Determination of Cyanide Concentration by Chronoamperometry, Cyclic Voltammetry and Fast Fourier Transform Electrochemical Impedance Spectroscopy. J. Electroanal. Chem. 2021, 895, 115449. [Google Scholar] [CrossRef]
  56. Park, K.; Chang, B.Y.; Hwang, S. Correlation between Tafel Analysis and Electrochemical Impedance Spectroscopy by Prediction of Amperometric Response from EIS. ACS Omega 2019, 4, 19307–19313. [Google Scholar] [CrossRef]
  57. Vrubel, H.; Moehl, T.; Grätzel, M.; Hu, X. Revealing and Accelerating Slow Electron Transport in Amorphous Molybdenum Sulphide Particles for Hydrogen Evolution Reaction. Chem. Commun. 2013, 49, 8985–8987. [Google Scholar] [CrossRef]
  58. Wang, X.; Kolen’Ko, Y.V.; Bao, X.Q.; Kovnir, K.; Liu, L. One-Step Synthesis of Self-Supported Nickel Phosphide Nanosheet Array Cathodes for Efficient Electrocatalytic Hydrogen Generation. Angew. Chem. Int. Ed. Engl. 2015, 54, 8188–8192. [Google Scholar] [CrossRef]
  59. Swamy, T.; Chiang, Y.-M. Electrochemical Charge Transfer Reaction Kinetics at the Silicon-Liquid Electrolyte Interface. J. Electrochem. Soc. 2015, 162, A7129–A7134. [Google Scholar] [CrossRef]
  60. Goeke, R.S.; Datye, A.K.; Atanassov, P.; St-Pierre, J. Model Electrode Structures for Studies of Electrocatalyst Degradation. ECS Trans. 2010, 33, 361–368. [Google Scholar] [CrossRef]
  61. Pourbaix, M.J.N. Atlas of Electrochemical Equilibria in Aqueous Solutions, 2nd ed.; National Association of Corrosion Engineers: Houston, TX, USA, 1974; ISBN 0915567989. [Google Scholar]
  62. Barbir, F. Chapter Three—Fuel Cell Electrochemistry. In PEM Fuel Cells, 2nd ed.; Barbir, F., Ed.; Academic Press: Boston, MA, USA, 2013; pp. 33–72. ISBN 978-0-12-387710-9. [Google Scholar]
  63. Mom, R.; Frevel, L.; Velasco-Vélez, J.J.; Plodinec, M.; Knop-Gericke, A.; Schlögl, R. The Oxidation of Platinum under Wet Conditions Observed by Electrochemical X-Ray Photoelectron Spectroscopy. J. Am. Chem. Soc. 2019, 141, 6537–6544. [Google Scholar] [CrossRef]
  64. Sibrell, P.L.; Atkinson, G.B.; Gary, B.; Walters, L.A.; Larry, A. Cyanide Leaching Chemistry of Platinum-Group Metals. Rep. Investig. (United States. Bur. Mines) 1994, 9507. [Google Scholar]
  65. Cherstiouk, O.V.; Simonov, P.A.; Savinova, E.R. Model Approach to Evaluate Particle Size Effects in Electrocatalysis: Preparation and Properties of Pt Nanoparticles Supported on GC and HOPG. Electrochim. Acta 2003, 48, 3851–3860. [Google Scholar] [CrossRef]
  66. Liu, Y.; Zeng, Y.; Liu, R.; Wu, H.; Wang, G.; Cao, D. Poisoning of Acetone to Pt and Au Electrodes for Electrooxidation of 2-Propanol in Alkaline Medium. Electrochim. Acta 2012, 76, 174–178. [Google Scholar] [CrossRef]
  67. Burke, L.D.; O’Leary, W.A. A Study of Isopropanol Oxidation at Platinised Platinum Electrodes in Acid Solution. Proc. R. Ir. Acad. B 1989, 89B, 389–398. [Google Scholar]
  68. Zayas, T.; Picazo, M.; Salgado, L. Removal of Organic Matter from Paper Mill Effluent by Electrochemical Oxidation. J. Water Resour. Prot. 2011, 3, 32–40. [Google Scholar] [CrossRef]
Figure 1. Schematic representation of the glass|Ti|Pt electrode preparation and its application in the electrooxidation of cyanide. (A) cleaned glass microscope slide; (B) thin film Ti-sputtered glass slide (the glass|Ti electrode); (C) three electrode-based handmade Teflon cell for the preparation of the glass|Ti|Pt electrode; (D) the glass|Ti|Pt electrode, the dark circle on the electrode is the area exposed to the Pt deposition solution; and (E) two electrode-based electrochemical cell for the electrooxidation of cyanide.
Coatings 13 01821 g001
Figure 2. AFM and SEM investigation of the glass|Ti electrode. Top view of AFM image (A), 3D view of AFM image (B), and cross-section profile (C) of the surface of the glass|Ti electrode. SEM images of the top view (D) and cross-sectional view (E) of the glass|Ti electrode. The thickness of the sputtered Ti film is 30 nm.
Coatings 13 01821 g002
Figure 3. The data from the spectroscopic ellipsometry study of the glass|Ti electrode: solid green and red curves—after 24 h; solid yellow and blue curves—after 3 weeks. Dashed lines—curves simulated by the three-layered model.
Coatings 13 01821 g003
Figure 4. Polarization curve of the glass|Ti electrode in Pt deposition solution (H2PtCl6·6H2O (19.3 mM) + HCl (2.5 M)). Potential was scanned at a rate of 50 mV s−1. Inset—chronoamperometric investigation of the glass|Ti electrode in the same solution at constant potential of −0.6 V vs. Ag|Ag|KClsat.
Coatings 13 01821 g004
Figure 5. AFM and SEM investigation of the glass|Ti|Pt electrode. Top view AFM image (A), 3D view AFM image (B), and cross-section profile (C) of the surface of the glass|Ti|Pt electrode. SEM images of the top view (D) and cross-sectional view (E) of the glass|Ti|Pt electrode.
Coatings 13 01821 g005
Figure 6. (A) cyclic voltammetry curves of the glass|Ti|Pt electrode (curve a) and the glass|Ti electrode (curve b) registered in 0.1 M KCN solution. (B) zoomed cyclic voltammogram of the glass|Ti electrode (curve b) registered in 0.1 M KCN solution. Potential was scanned at a rate of 50 mV s−1.
Coatings 13 01821 g006
Figure 7. FFT-EIS of the glass|Ti|Pt electrode in 0.1 M KCN solution registered under constant potential values varying in the range from 0.8 to 1.7 V vs. Ag|AgCl, KClsat. Symbols represent experimental data, solid lines—fit lines obtained by fitting experimental data to the equivalent circuit model. Inset—the equivalent circuit model used to fit the FFT-EIS data, representing the charge transfer through the interface Pt layer—electrolyte. R0 is uncompensated solution resistance; Rct is charge transfer resistance; CPE is constant phase element.
Coatings 13 01821 g007
Figure 8. Dependence of the charge transfer resistance (obtained from the FFT-EIS data shown in Figure 7) on the polarization of the glass|Ti|Pt electrode.
Coatings 13 01821 g008
Figure 9. The dependence of cyanide oxidation current efficiency (η, %) on electric charge (Q, C) passed through the glass|Ti|Pt electrode in 0.1 M KCN solution.
Coatings 13 01821 g009
Table 1. A comparison of the methods for the treatment of cyanide.
Method for the Treatment of
Cyanide Effluent
AdvantagesDisadvantages
Natural degradation (natural oxidation, decomposition by sunlight, volatilization) [8,15,16].Not applicable.Sensitive to many factors as sunlight, pH, temperature. Relatively slow process. A risk of accidental spill of cyanides. Unpredictable results. Limited effectiveness. Absence of control.
Chemical methods (alkaline chlorination, oxidation via hydrogen peroxide) [15,17].Low risk of accidental spill of cyanides. Possibility to control processes.Require chemical regents and sludge disposal to be used, toxic by-products (e.g., ammonia) might be formed.
Electrochemical oxidation-based methods [18,19,20,21,22,23].Low risk of accidental spill of cyanide or toxic sludge, possibility to collect heavy metals during cyanide oxidation.Fast inactivation of conventional electrodes. Some electrode materials are very expensive and difficult to manufacture.
Biological disposal [15,17].Low risk of formation of toxic by-products.Relatively slow process, depending on the environmental conditions (e.g., temperature). A risk of accidental spill of cyanides.
Table 2. Values of the electrochemical characteristics obtained by fitting FFT-EIS data (Figure 7) to equivalent circuit model presented in the inset of Figure 7.
E, VR0, ΩCPE, μFnRct, Ω χ 2 R2
0.8482.828.190.90248,7201.7 × 10−50.9998
0.9507.028.880.9084,7001.4 × 10−50.9998
1502.028.570.9023,7363.3 × 10−50.9996
1.1504.125.580.9114,4542.0 × 10−50.9998
1.2522.423.390.9252581.9 × 10−50.9998
1.3537.820.940.9333243.7 × 10−50.9995
1.4528.418.560.9425443.3 × 10−50.9996
1.5522.917.360.9420424.4 × 10−50.9993
1.6530.916.290.9414302.9 × 10−50.9996
1.7554.715.340.9311223.5 × 10−50.9996
Table 3. Comparison of the glass|Ti|Pt electrode to other electrocatalysts used for electrooxidation of 0.1 M KCN solution.
ElectrodeQ1, Cη1, %Q2, Cη2, %
Glass|Ti|Pt1449128869
Pt metal [21]1448428859
Ti-Pt (500 nm) [21]1443928842
Ti-Pt (600 nm) [21]1442128839
Ti-Pt (800 nm) [21]1443828820
Ti-Pt (1000 nm) [21]1443728840
Ti-Pt (600 nm) [20]1444428851
Stainless steel [21]1443428831
Disclaimer/Publisher’s Note: The statements, opinions and data contained in all publications are solely those of the individual author(s) and contributor(s) and not of MDPI and/or the editor(s). MDPI and/or the editor(s) disclaim responsibility for any injury to people or property resulting from any ideas, methods, instructions or products referred to in the content.

