Next Article in Journal
Tribo-Catalytic Degradation of Methyl Orange Solutions Enhanced by Silicon Single Crystals
Previous Article in Journal
Crosstalk Reduction in High-Density Radio Frequency Printed Circuit Boards: Leveraging FR4 Coating Layers
Previous Article in Special Issue
Water Resistance of Super Adhesive Emulsified Asphalt Based on Dynamic Water Scouring
 
 
Correction published on 23 January 2024, see Coatings 2024, 14(2), 153.
Article

Study on the Rapid Degradation Performance of Salix/Wheat Straw Fiber Degradable Film

1
College of Material Science and Art Design, Inner Mongolia Agricultural University, Hohhot 010010, China
2
Inner Mongolia Key Laboratory for Sandy Shrubs Fibrosis and Energy Development and Utilization, Hohhot 010018, China
*
Author to whom correspondence should be addressed.
Coatings 2023, 13(10), 1803; https://doi.org/10.3390/coatings13101803
Submission received: 12 September 2023 / Revised: 14 October 2023 / Accepted: 18 October 2023 / Published: 20 October 2023 / Corrected: 23 January 2024
(This article belongs to the Special Issue Polymer Films/Membranes: Structure, Properties, and Applications)

Abstract

:
The preparation of biodegradable mulch film to replace non-degradable mulch film is of great significance for reducing the harm of non-degradable agricultural mulch film to the environment. However, there are few studies on the degradation performance and degradation mechanisms of degradable cellulose mulch. Therefore, the wet papermaking process was adopted in this work. Salix fiber and wheat straw fiber were used as raw materials. A Salix/wheat straw fiber degradable film was prepared by adding cationic polyacrylamide, alkyl ketene dimer, and paraffin emulsion. The degradation process of cellulose film was studied using a UV degradation test and an acid-base degradation test system. The results showed that after 40 days of UV degradation, the degradation rate of Salix/wheat straw fiber degradable film could reach 6.66%. The tensile strength could still maintain 2.878 KN/m. The results of the brightness change index ( Δ L) and color overall change index ( Δ E ) showed that the surface of the Salix/wheat straw fiber degradable film had been successfully partially degraded. After 4 days of alkaline degradation, the degradation rate could reach 11.89%. After 4 days of acid degradation, the degradation rate could reach 14.64%. At the same time, the specific degradation process of Salix/wheat straw fiber degradable film was further studied by infrared spectroscopy and scanning electron microscopy. This work provides a new method for the study of agricultural degradable cellulose mulch, which is of great significance for the future development of agricultural mulch.

1. Introduction

In recent years, commercial plastic films have become increasingly widely used in agriculture. Plastic film pollution can already cover about 20 million hectares of land globally each year [1,2,3]. However, cleaning up and disposing of this non-biodegradable plastic film was time-consuming and costly. So farmers buried the plastic film directly in the soil [4,5]. A large amount of residual plastic film would not only destroy the integrity of soil structure, change the pH value of soil, reduce soil fertility, and further harm the structure of microbial communities in the soil [6,7]. Plant growth was severely disrupted, and crop development was seriously hampered.
Plastic residues on farmland are therefore a major problem that needs to be addressed urgently. Currently, natural polymer-degradable films are being researched as a major aspect of this study. The main research is based on degradable resins such as poly (butyleneadipate-co-terephthalate) (PBAT) [8], polylactic acid (PLA) [9], polypropylene carbonate (PPC) [10], and polyhydroxyalkanoates (PHAs) [11]. Using them as raw materials for biodegradable mulch films Meanwhile, the degradation properties and degradation process of plastic films have been extensively studied [12,13,14,15,16,17]. However, uncontrolled degradation cycles occur in most degradable polymer coverings, and the high price of their raw materials is also a major issue in the current research thus proving that natural fibers are the best choice for promoting eco-friendliness and reducing environmental pollution [18,19]. The new biodegradable paper mulch film was slightly inferior to the traditional plastic mulch film in terms of mechanical properties and hydrophobic properties. And the ability to preserve heat and retain moisture was insufficient. It was superior to the traditional mulch film in terms of aging resistance and soil oxygen content. It also outperformed conventional mulch in terms of its ability to hold and store water during the mid-crop and growing periods [20]. People pay less attention to cellulose-based film-covering materials. The paper-based film is often affected by rainfall in the process of covering and general use. When it encounters water, its performance will decline, and its degradation performance in the water environment is insufficient [21,22].
At present, researchers use natural renewable fibers to produce high-quality biodegradable paper mulch and study its degradability. However, their degradation was mainly studied in soil burial tests. There have been fewer studies on photodegradation and acid-alkaline degradation. For example, Lang et al. [23] found that their modified fiber films were degradable after about 50 days of soil cover. Li et al. [24] studied an environmentally friendly cotton stalk fiber biodegradable paper film soil landfill after 75 d; the experimental degradation rate was 64%. Ming et al. [25] verified that plant fiber-based degradable films are degradable with the rice growth cycle, demonstrating excellent tensile and degradation properties. However, the film in this study is used to cover the surface of vegetation and is inevitably exposed to sunlight and sprayed by rain during its use. Therefore, it is necessary to investigate the degradation mechanisms of cellulose-base films under photodegradation and acid/alkaline degradation. And it is further explored whether the degradation cycle of cellulose-base film is controllable.
Western China is rich in Salix resources with strong mechanical properties and aging resistance. China is also a large producer of crop straw. Every year, many researchers use straw to manufacture better and more excellent composite materials [10,26,27,28,29]. Straw is also commonly used to cultivate the soil [30]. Therefore, there are no side effects on the soil when the film is degraded. In order to explore the degradation mechanism of cellulose film, this paper used Salix fiber and wheat straw fiber as raw materials. We used the Box–Behnken design test to prepare a biodegradable mulch film with a controllable degradation cycle by using cationic polyacrylamide, alkyl ketene dimer, and paraffin emulsion as independent variables. The Salix/wheat straw fiber degradable film prepared in this study had good tensile strength and hydrophobicity. It exhibited obvious degradation patterns under UV degradation and hydrolysis degradation conditions, which provided a broad application prospect for the subsequent study of cellulose base film degradation.

2. Preparation and Characterization of Materials

2.1. Materials

Wheat Straw from Langfang, Hebei Province, China. Salix comes from Ordos City, Inner Mongolia, China. Sodium hydroxide solid was procured from Xinbute Chemical Co., Ltd., Tianjin, China. Cationic polyacrylamide (CPAM) was procured from Zongbang Environmental Protection Science and Henan Technology Co., Ltd., Zhengzhou, China. Alkyl ketene dimer (AKD) was procured from Dongguan Plastic Factory, Guangdong Province. Paraffin Emulsion (CAS) was procured from Qihong Investment Holding Co., Ltd., Shanghai, China. Distilled water was used throughout the tests.

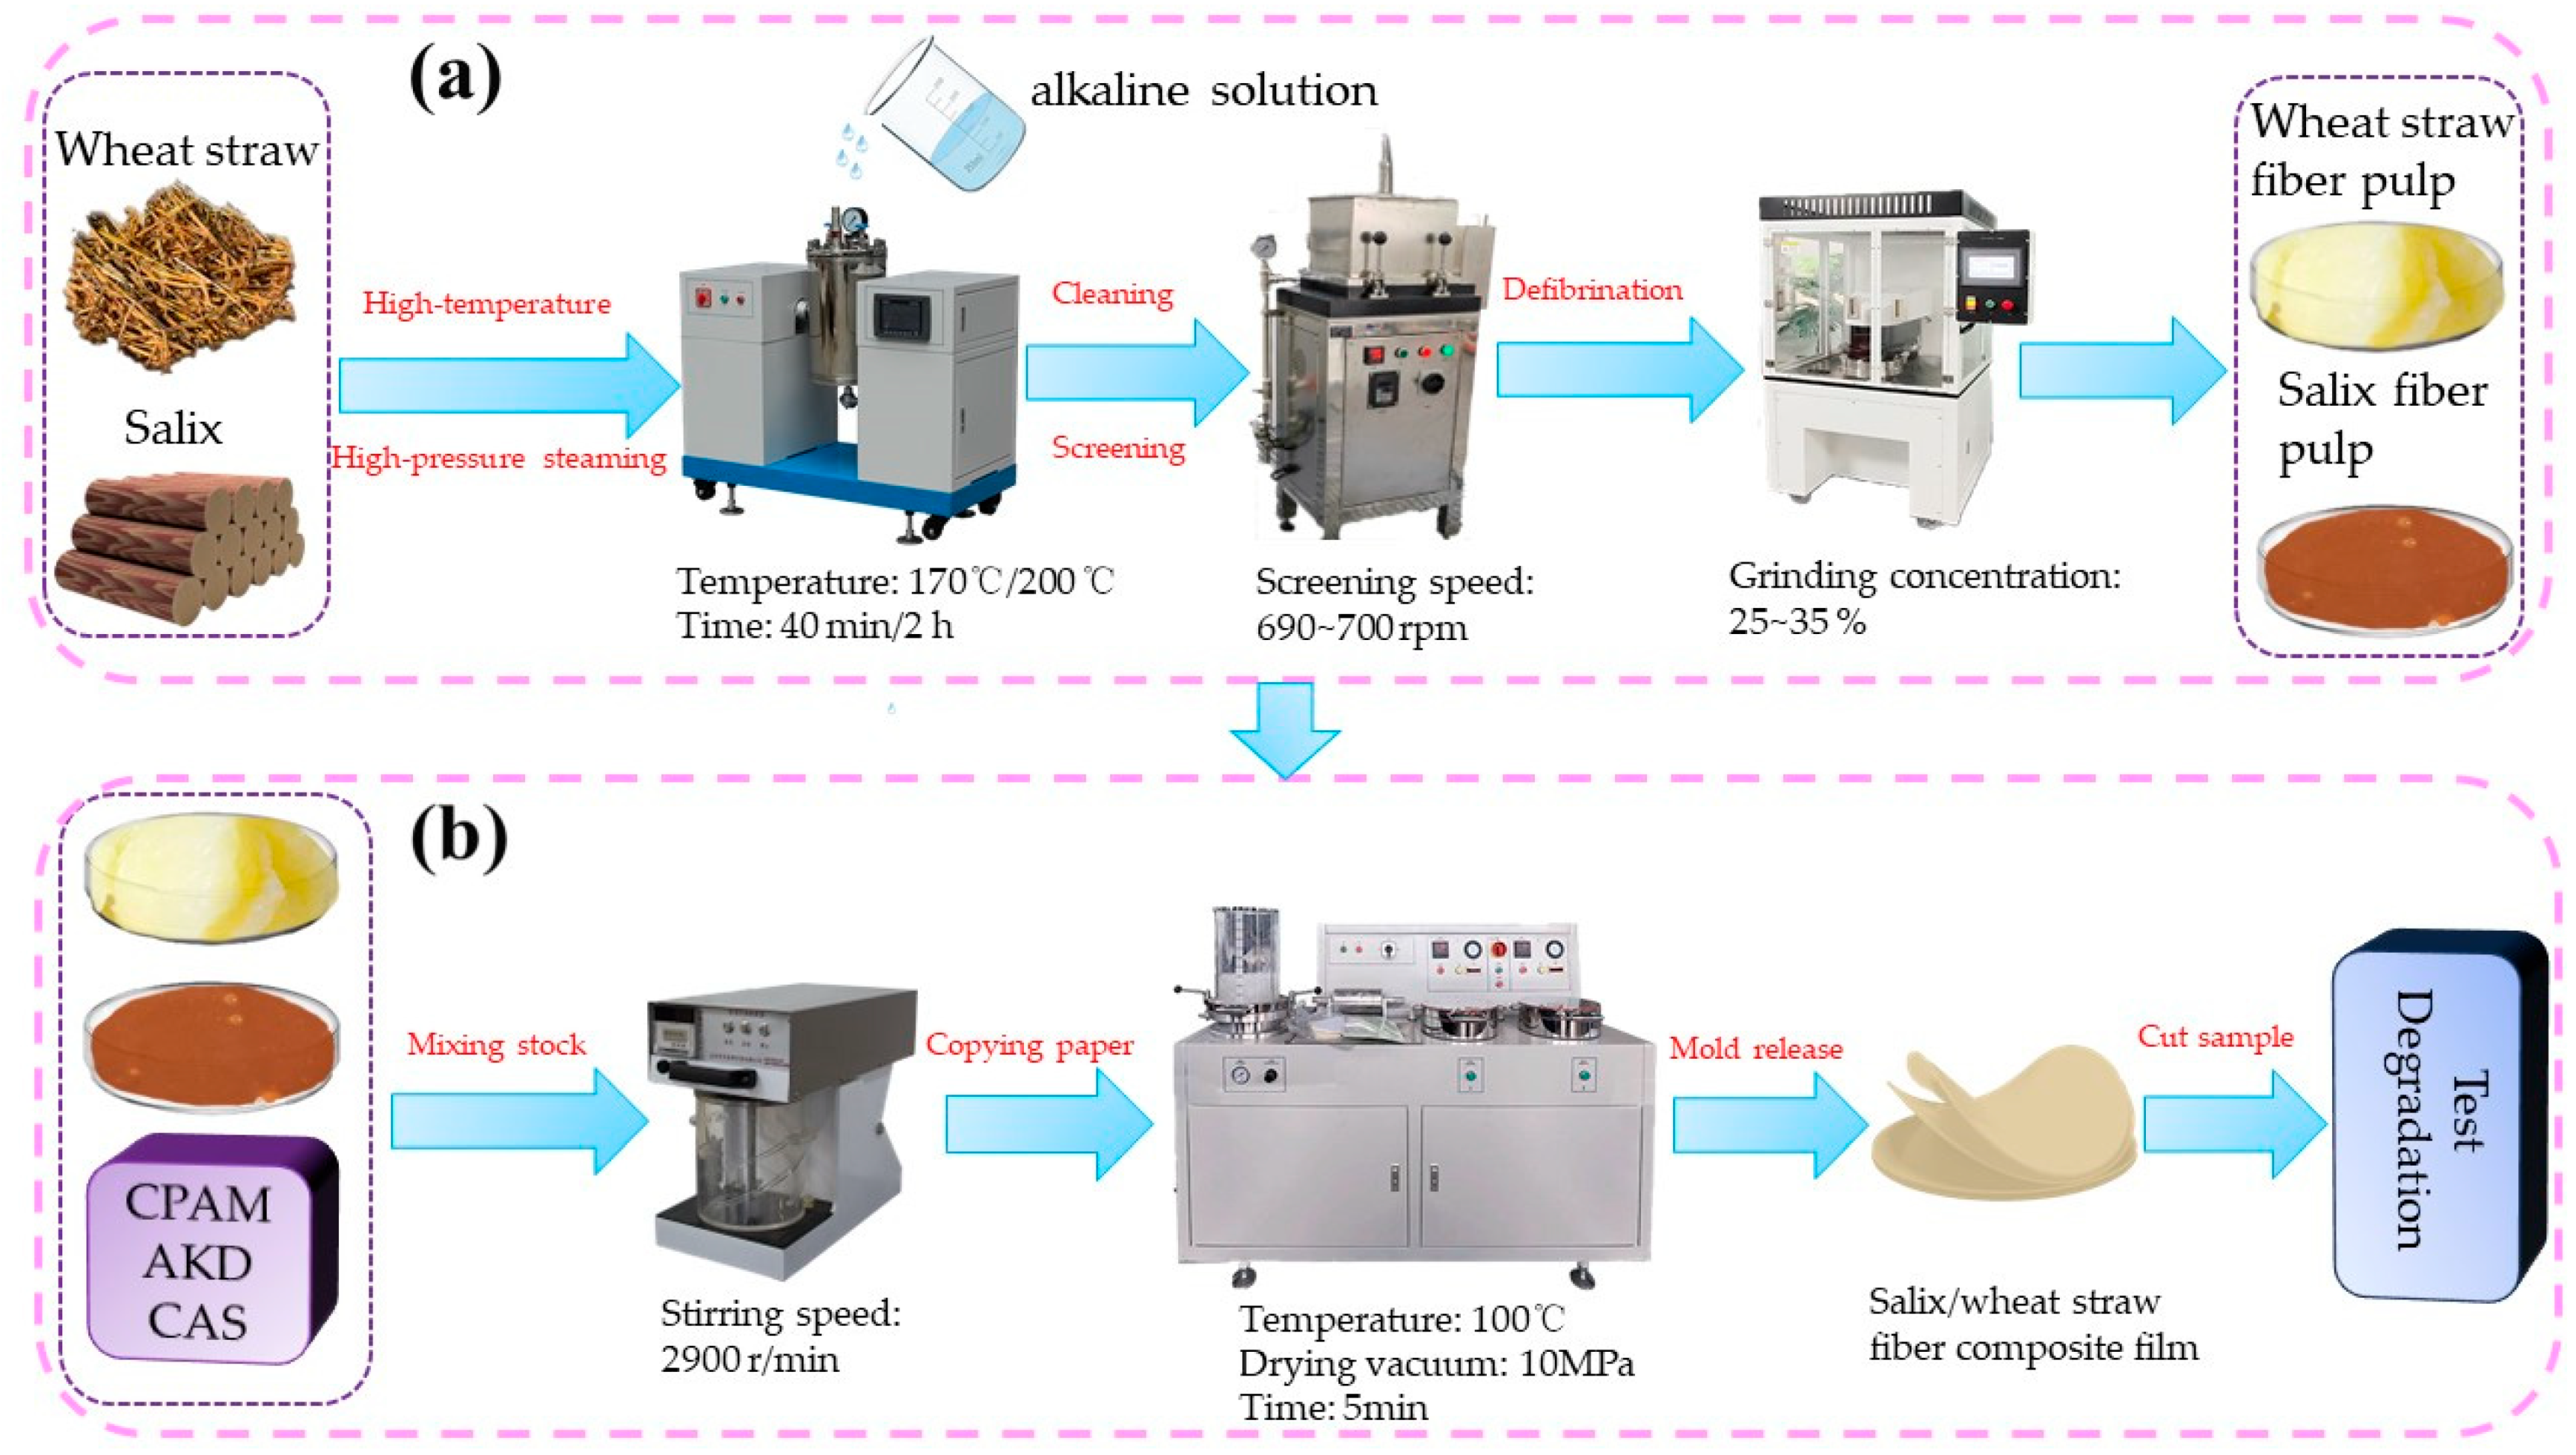
2.2. Preparation of Salix/Wheat Straw Fiber Degradable Film

It can be seen from Figure 1a that Salix was cooked in a high-pressure cooking pot at 200 °C for 2 h and wheat straw was cooked in a high-pressure cooking pot at 170 °C for 40 min. Salix fiber pulp and wheat straw pulp were obtained after sieve pulp cleaning and defibrination. The dry tensile strength of the composite wheat straw film was found to be the highest when the beating degree of Salix was 40 °SR, the beating degree of wheat straw was 50 °SR, and the ratio of Salix fiber to wheat straw fiber was 7:3. From Figure 1b, Salix fiber pulp and wheat straw pulp were mixed proportionally to obtain mixed pulp. On this basis, different concentrations of cationic polyacrylamide (CPAM), alkyl ketene dimer (AKD), and paraffin emulsion (CAS) were added to the composite fiber pulp. The dissociation of fiber pulp and copying to wet paper and the Salix/wheat straw fiber degradable film are obtained by vacuum drying at 100 for 5 min. The degradability was then investigated. In this experiment, cationic polyacrylamide, alkyl ketene dimer, and paraffin emulsion content were used as experimental factors. The three-factor, three-level Box–Behnken central group and experimental design method were used [31]. The factor levels were coded as shown in Table 1, and the experimental design program was established using Design-Expert (Vesion13) software in Table 2.

2.3. Testing and Characterization

2.3.1. The UV Degradation Tests

The weathering test chamber (Q8/UV3, Guangdong Hongzhan Technology Co., Ltd., Dongguan, China) was used to select the composite sample with a size of 60 mm × 35 mm. The weight of the sample was weighed and recorded. According to the GB-T35795-2017 standard [32], 8 h of drying and 4 h of condensation were used as a cycle. The irradiance during drying was 0.87 W/m2, and the temperature was 50 °C. Turn off the light source when condensation occurs at a temperature of 50 °C. The first group of samples was taken out on the 5th day and then sampled every 7 days. A total of six samples were taken for the performance test.

2.3.2. Acid and Alkali Degradation Tests

The composite material samples with a size of 30 mm × 10 mm were selected, weighed, and recorded in groups. The samples of each group were placed in a hydrochloric acid solution with a pH = 1 and a NaOH solution with a pH = 11, respectively. The temperature was maintained at about 25 °C, and the samples were completely immersed in the solution under the test conditions during the test. A group of samples was taken at 24 h, 48 h, 72 h, and 96 h for corresponding performance tests.

2.3.3. Degradable Film Quality Loss Rate Tests and Water Absorption Tests

The film samples were weighed with a ten-thousandth analytical balance to obtain Ma. After each hydrolysis and degradation, the samples were gently rinsed with distilled water to neutralize. All the water on the surface was dried with filter paper and weighed within 1 min to obtain Mb. The samples were vacuum dried at 120 °C for 6 h until the weight remained unchanged, and the mass of the samples was weighed as Mc. The tensile strength of the composites was tested by a micromechanical testing machine (5948, Instron Corporation, Boston, MA, USA).
Formula for calculating the film quality loss rate ( W m ):
W m = M a M b M a × 100 %
Formula for calculating the film water absorption ( W w ):
W w = M b M c M c × 100 %
where M a is initial mass before film degradation, M b is wet weight of the film after degradation, M c is mass of the film after x days of degradation and drying.

2.3.4. Degradable Film Tensile Strength Tests

The sample size was 20 mm × 5 mm. The initial spacing was fixed at 50 mm, and the loading speed was 20 mm/min. Each group of samples was subjected to three tests, and the average value was taken as the final result.

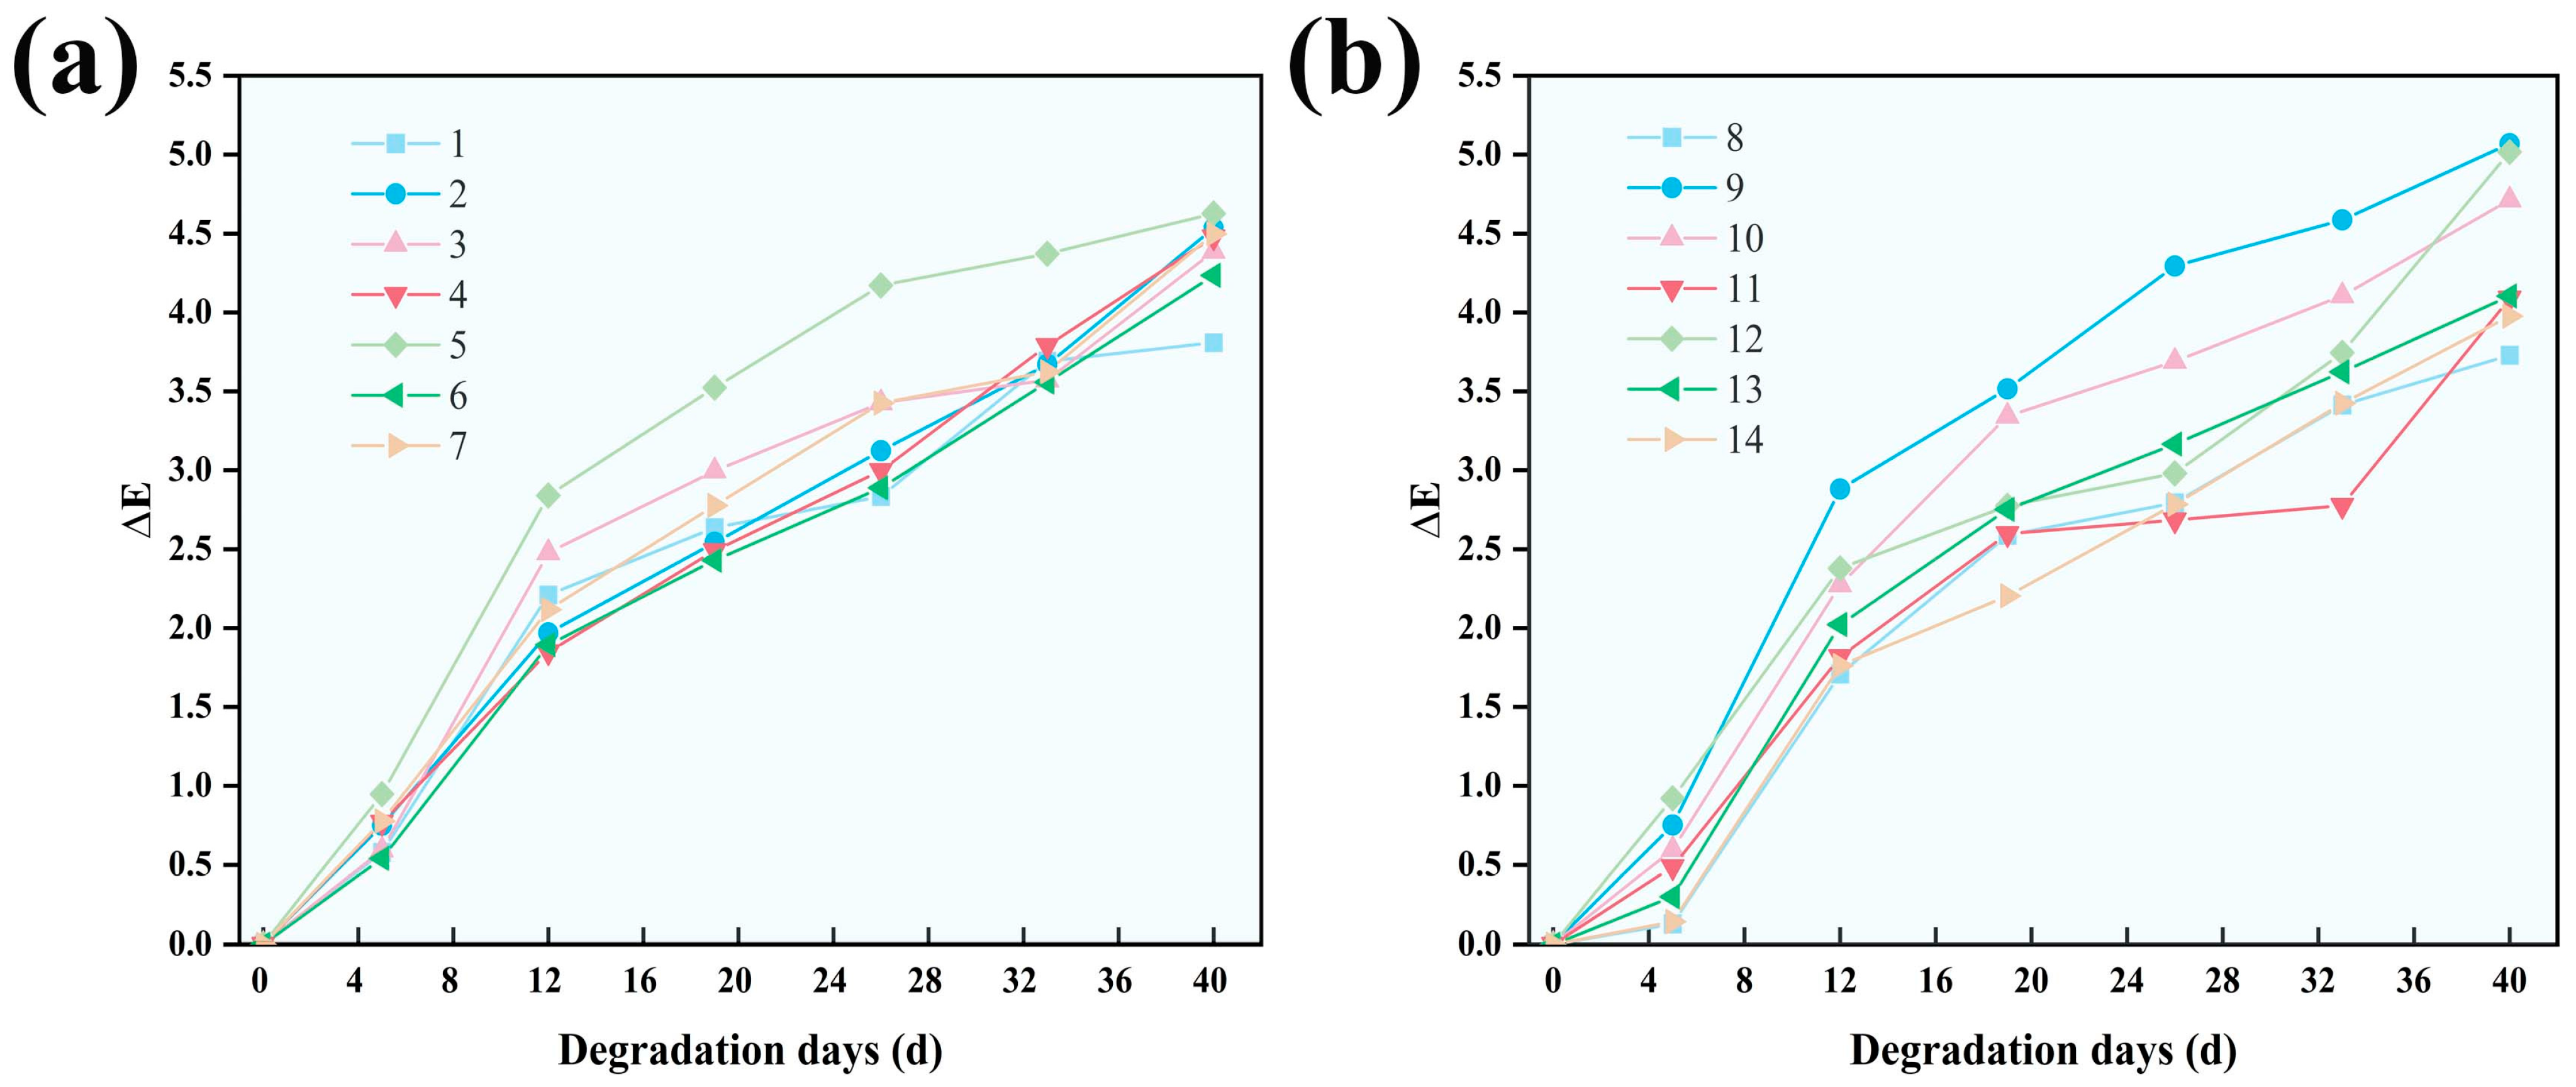
2.3.5. Degradable Film Color Tests

The color parameters of the film before and after degradation were measured using a colorimeter (WR, Weifu Optoelectronic Technology Co., Ltd., Shenzhen, China), including the brightness index, red–green index, and yellow–blue index. The apparent color difference of fiber film before and after degradation was evaluated by Δ L and Δ E .
Δ E = Δ L 2 + Δ a 2 + Δ b 2 1 2
Δ L = L L 0
Δ a = a a 0
Δ b = b b 0
where L 0 is the initial film brightness value, L is the degraded film brightness value, a 0 is the initial red and green axis chromaticity index of the film, a is the color index of the yellow and blue axis of degraded films, b 0 is the initial film yellow and blue axis chromaticity indices, b is the color index of the yellow and blue axis of degraded films.

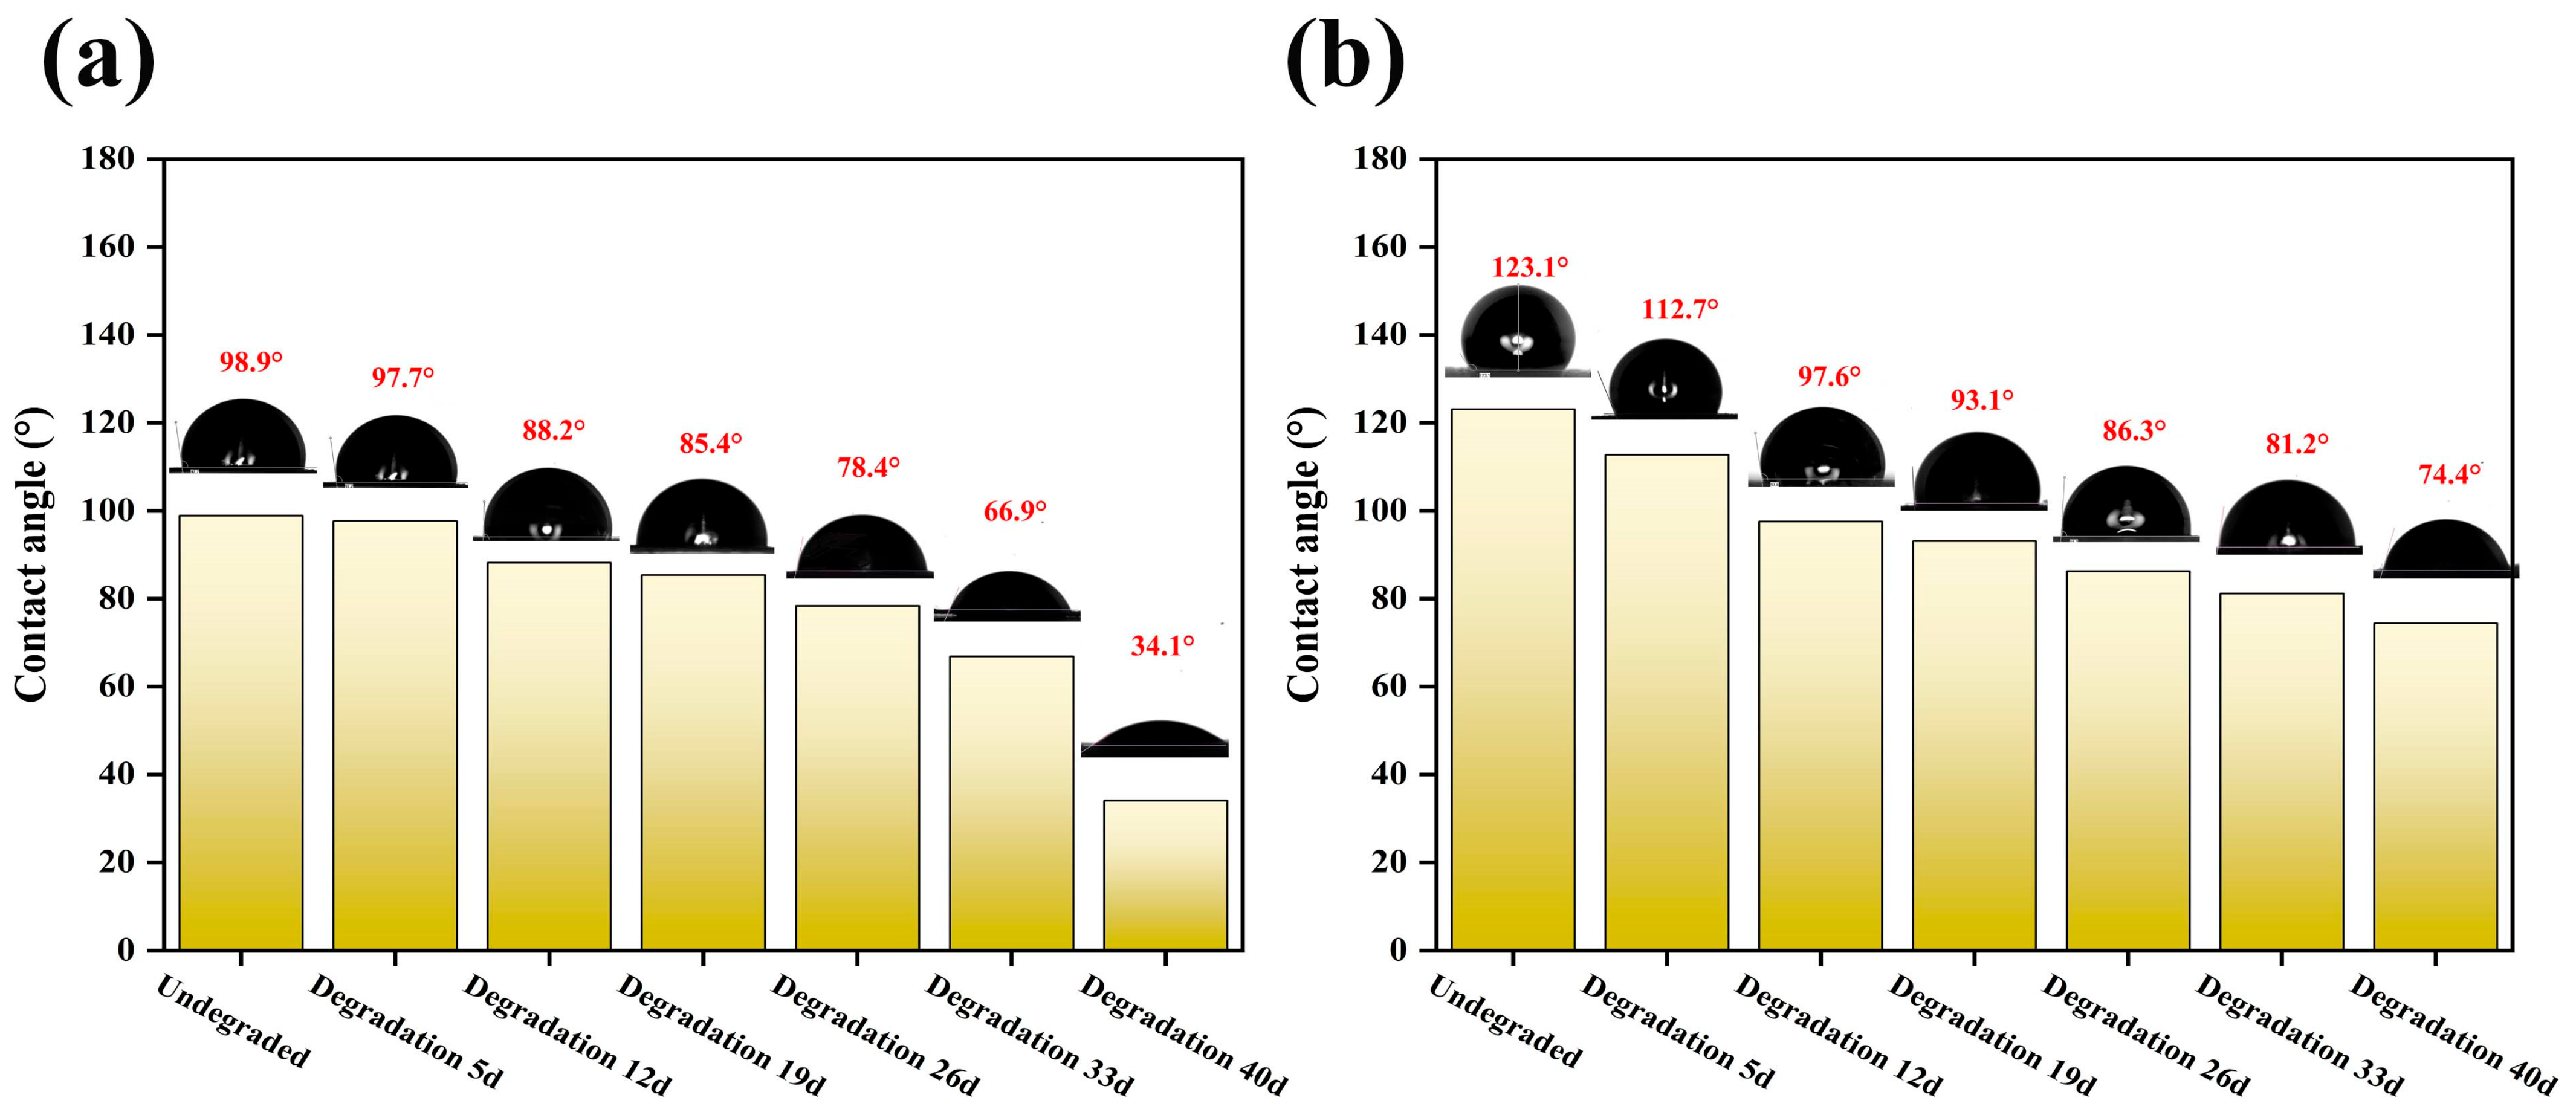
2.3.6. Degradable Film Contact Angle Tests

The contact angle meter (JY-PHa, Youte Instrument Manufacturing Co., Ltd., Chengde, China) was used to characterize hydrophobicity. A precision syringe was used to deposit 5 microliters of distilled water droplets on the surface of the film. A CCD camera was used to measure the contact angle. The angle between the tangent and the baseline at the droplet boundary was automatically determined. Each group of samples was measured 10 times, and the results were averaged.

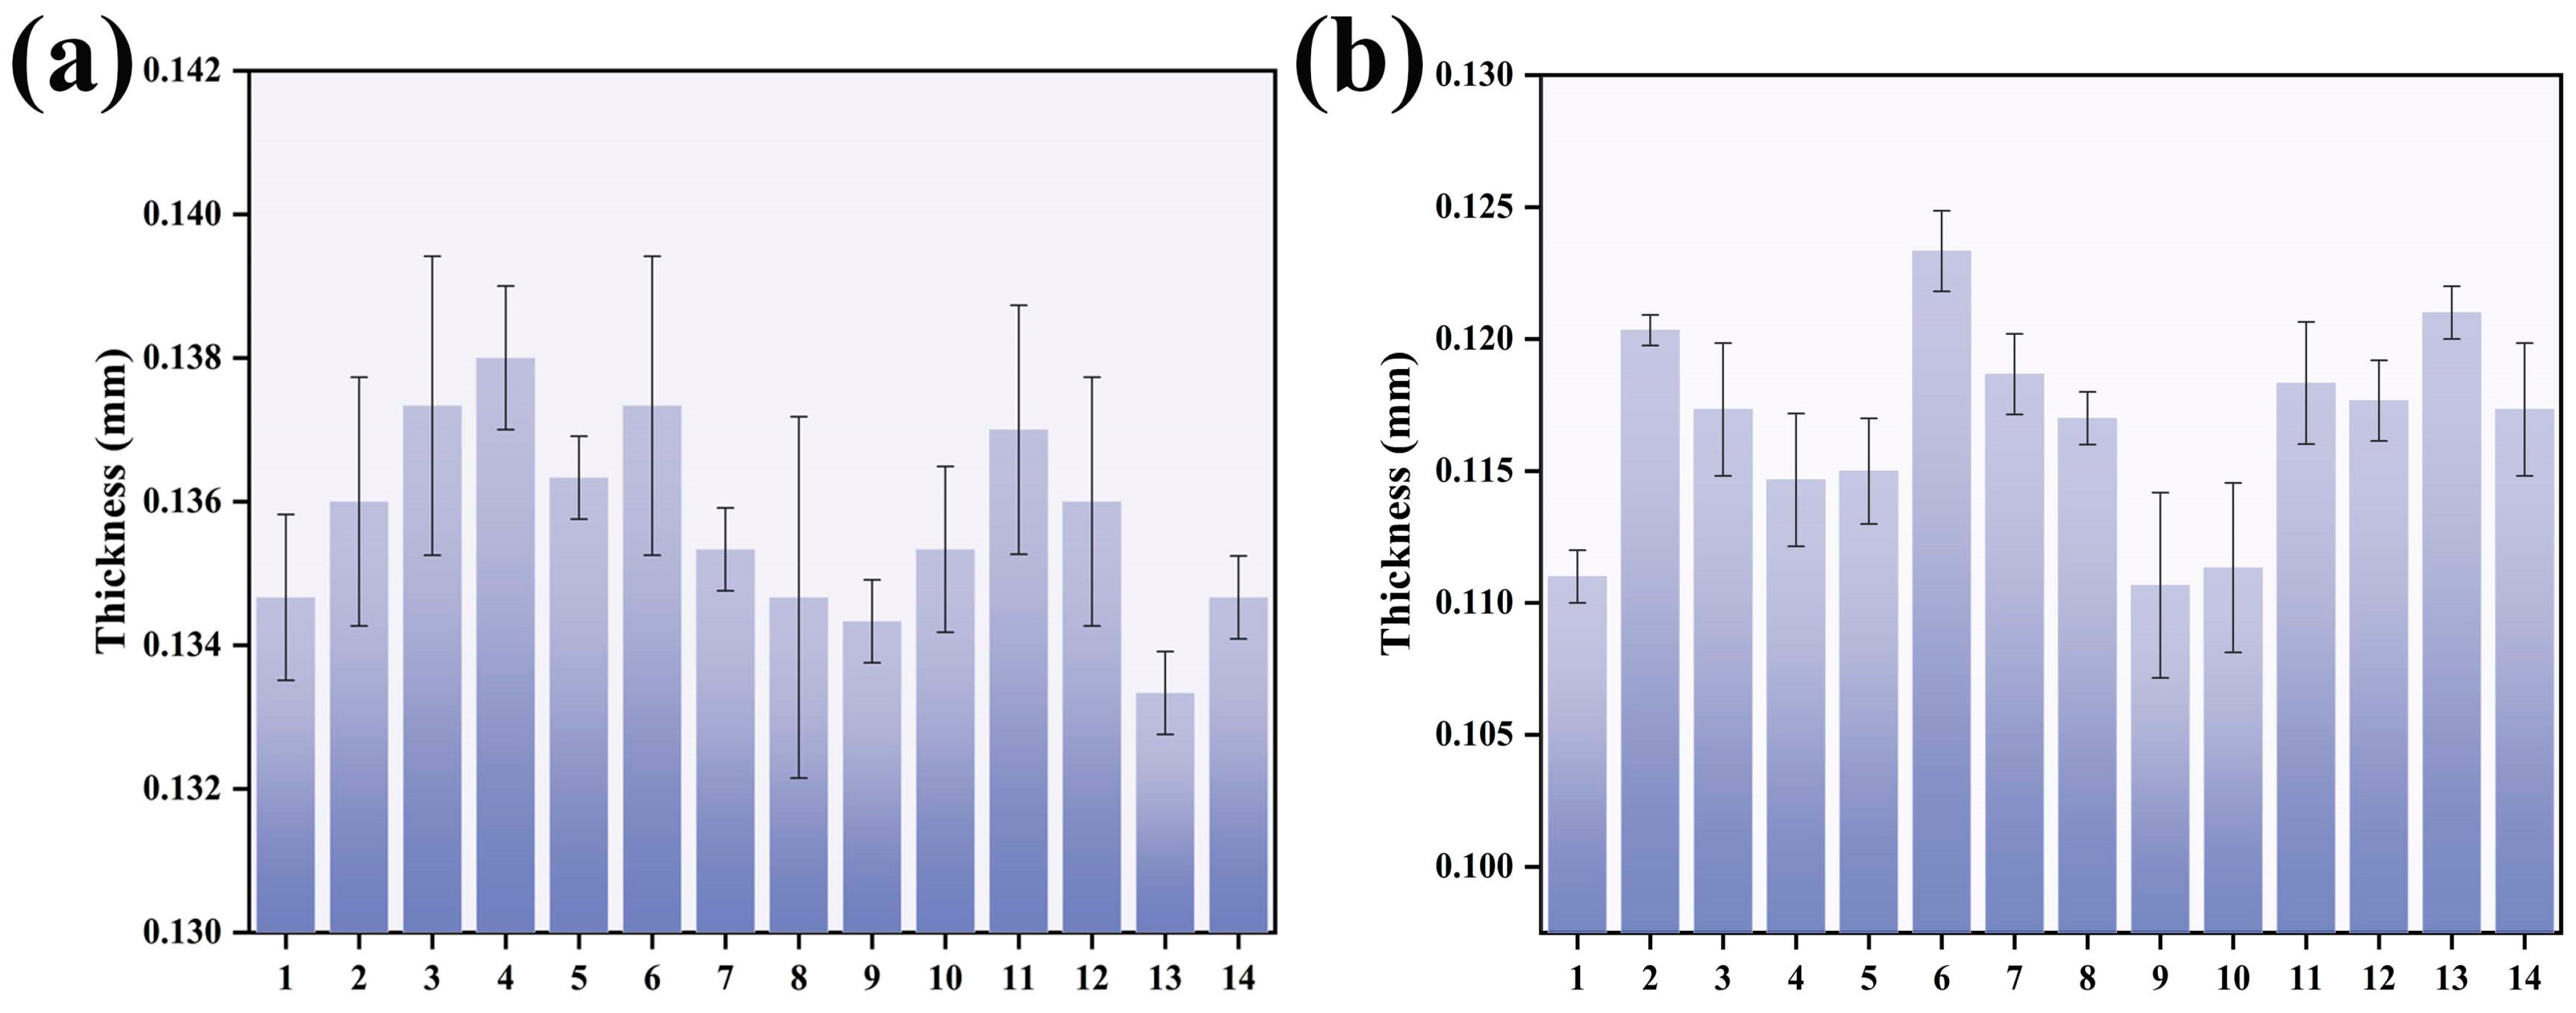
2.3.7. Degradable Film Thickness Tests

The hydrophobicity was characterized using a digital micrometer thickness gauge (Henan Bontec Measurement Co., Ltd., Zhengzhou, China). Each group of samples was measured three times, and the average value was taken.

2.3.8. Field Emission Scanning Electron Microscope (SEM)

The surface morphology and microstructure of Salix/wheat straw fiber degradable film were observed by scanning electron microscopy (S4800, Feina Scientific Instrument Co., Ltd., Shanghai, China) at an acceleration voltage of 10 kV.

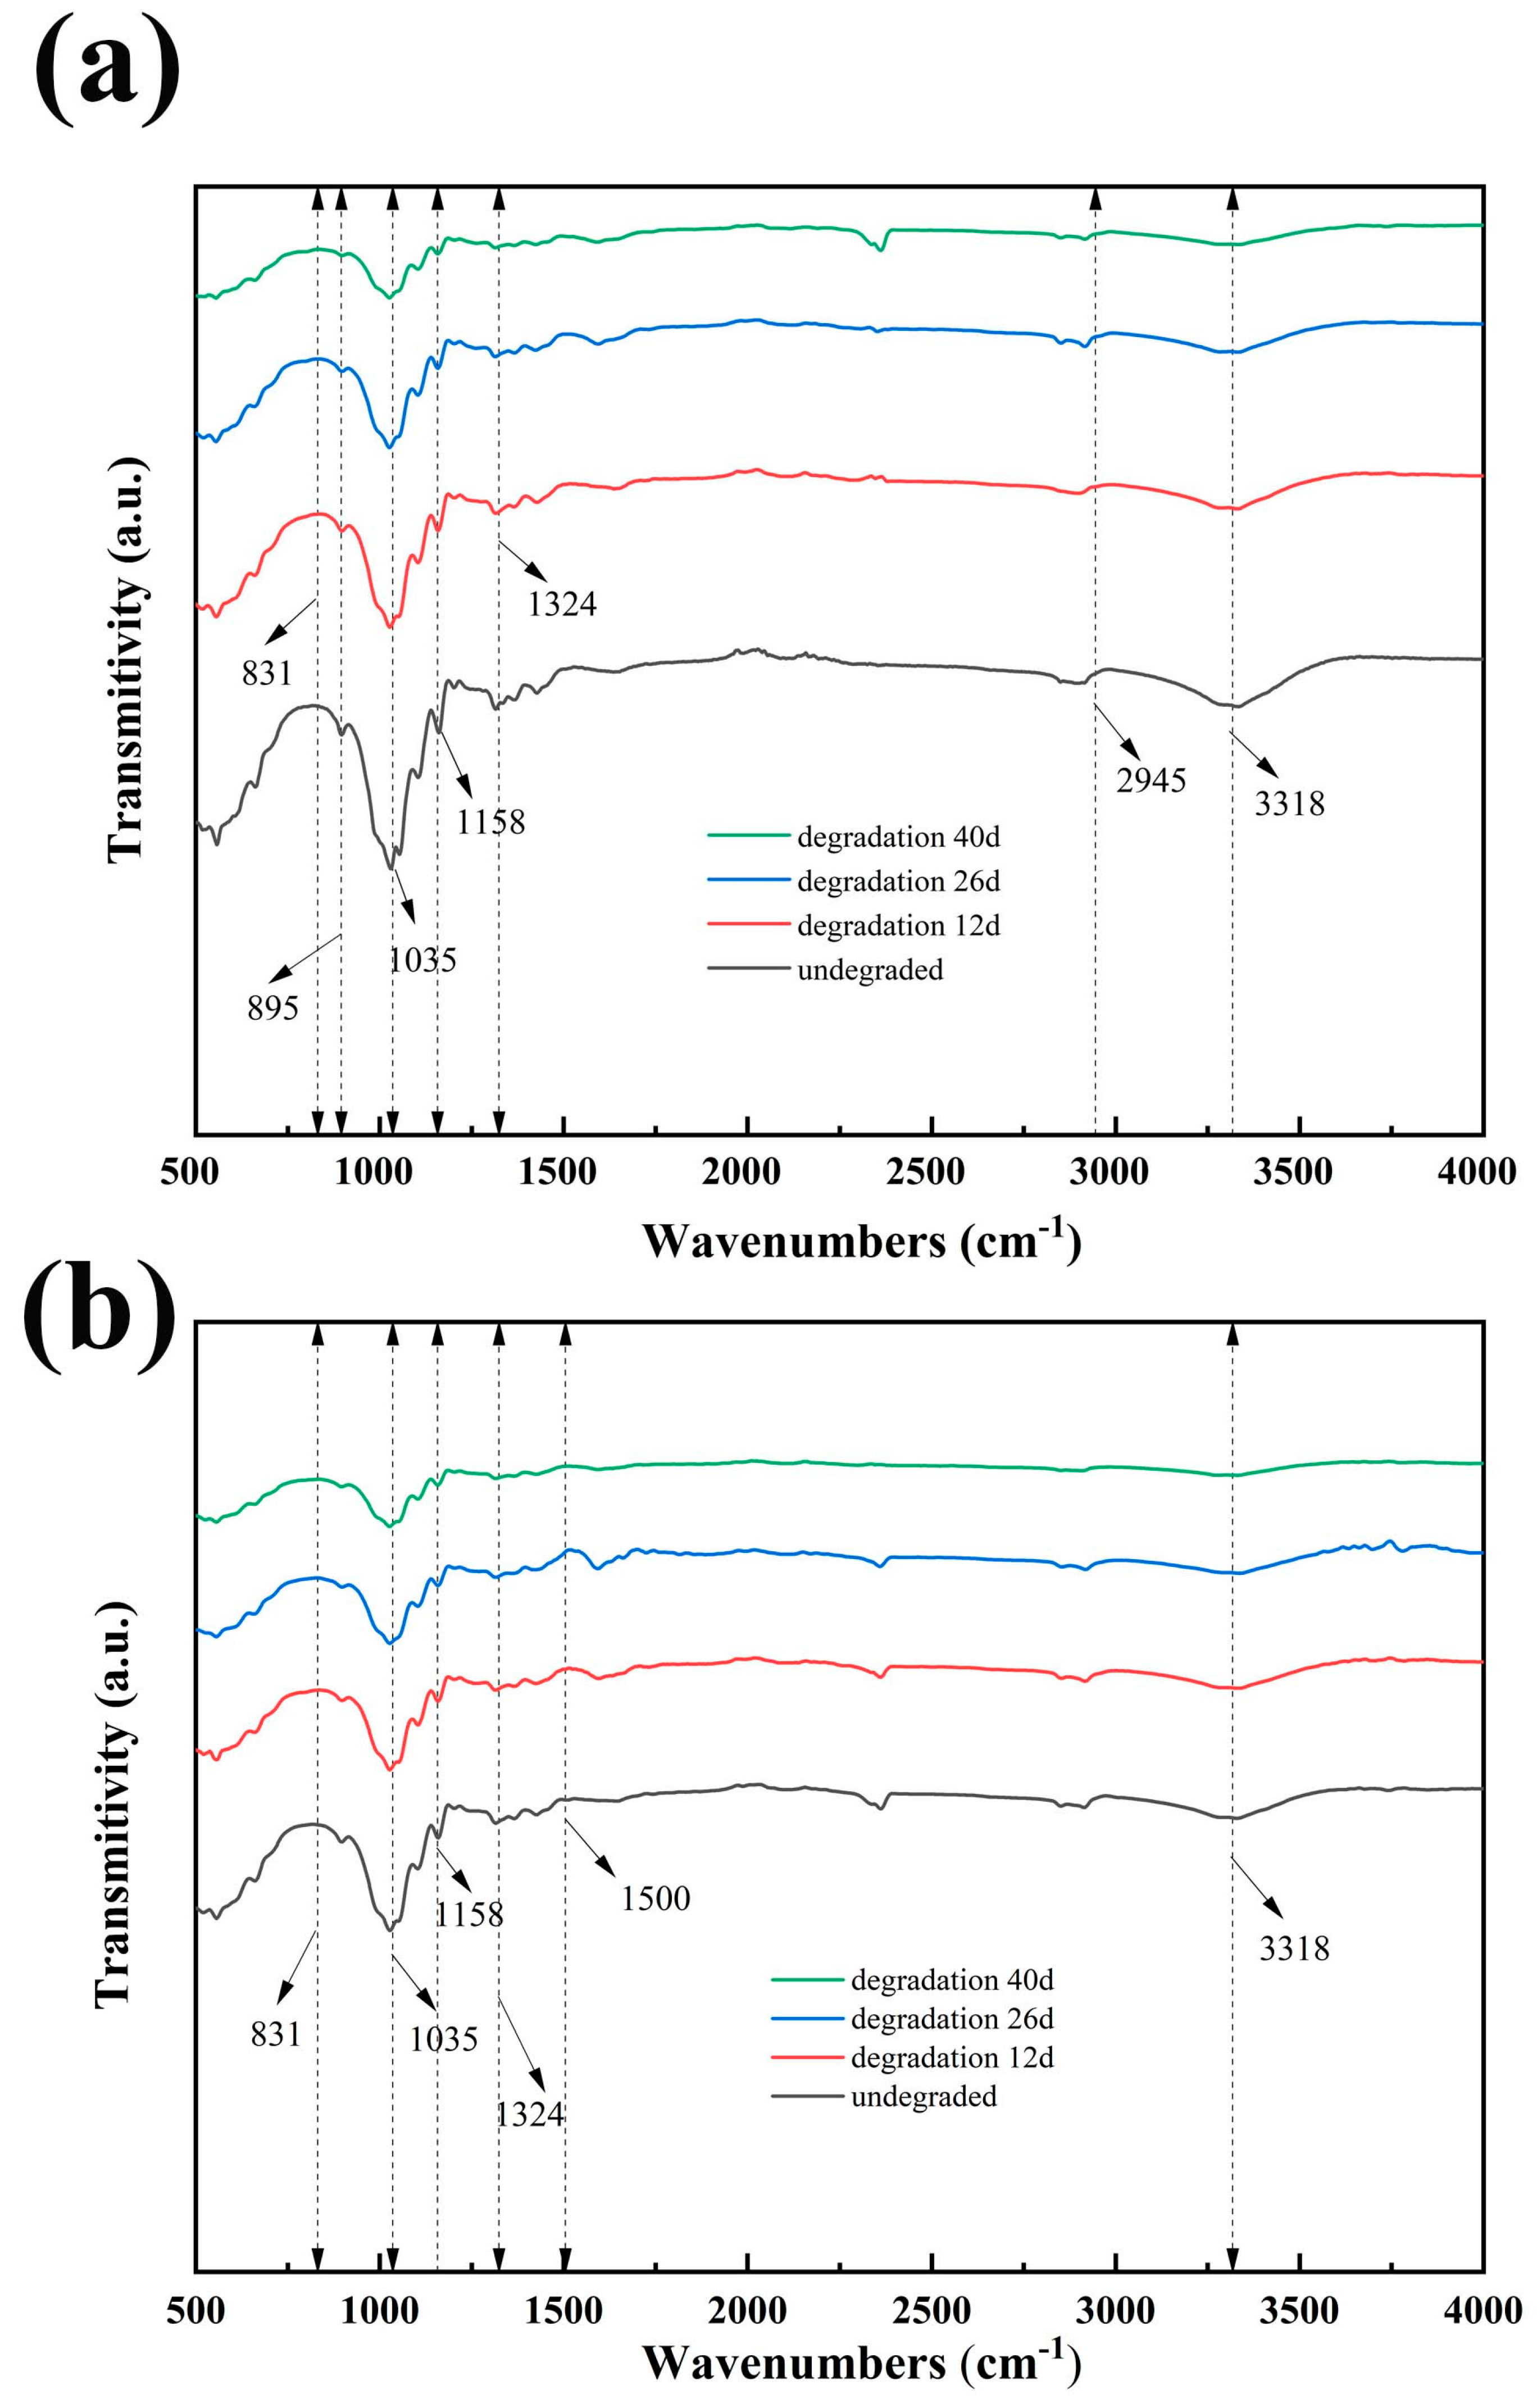
2.3.9. Fourier Transform Infrared Spectroscopy (FT-IR)

Fourier transform infrared spectroscopy FTIR tests (INVENIOS, Optik Gmbh Ltd., Saarbrücken, Germany) were used to analyze the wavelength of functional group changes under the condition of a wave number of 4000–500 cm−1 and a resolution of 2.0 cm−1.

3. Results and Discussion

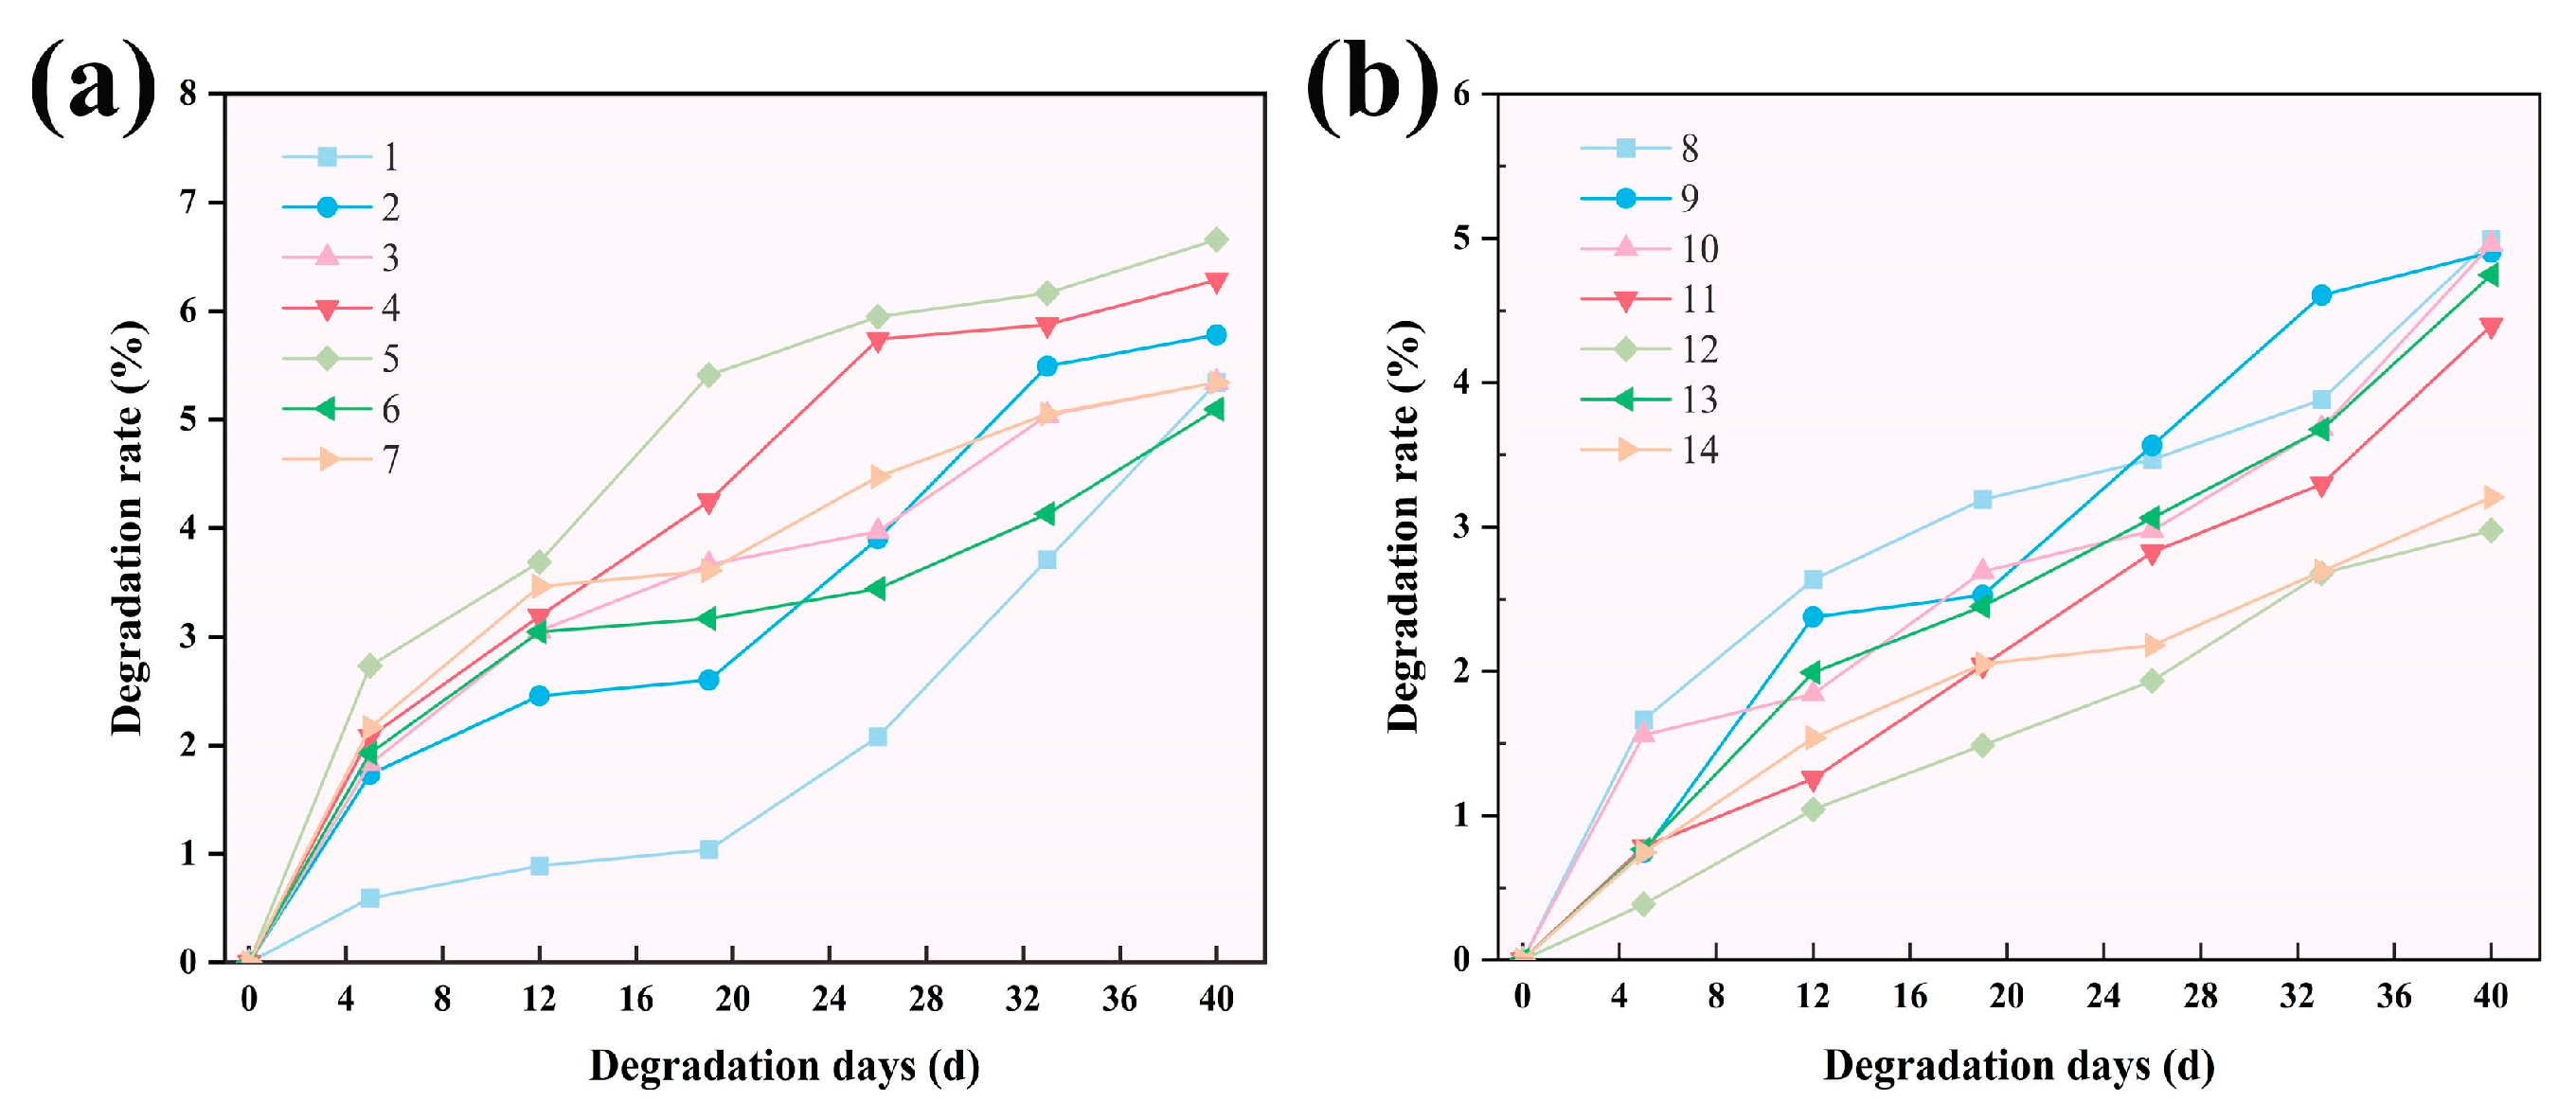
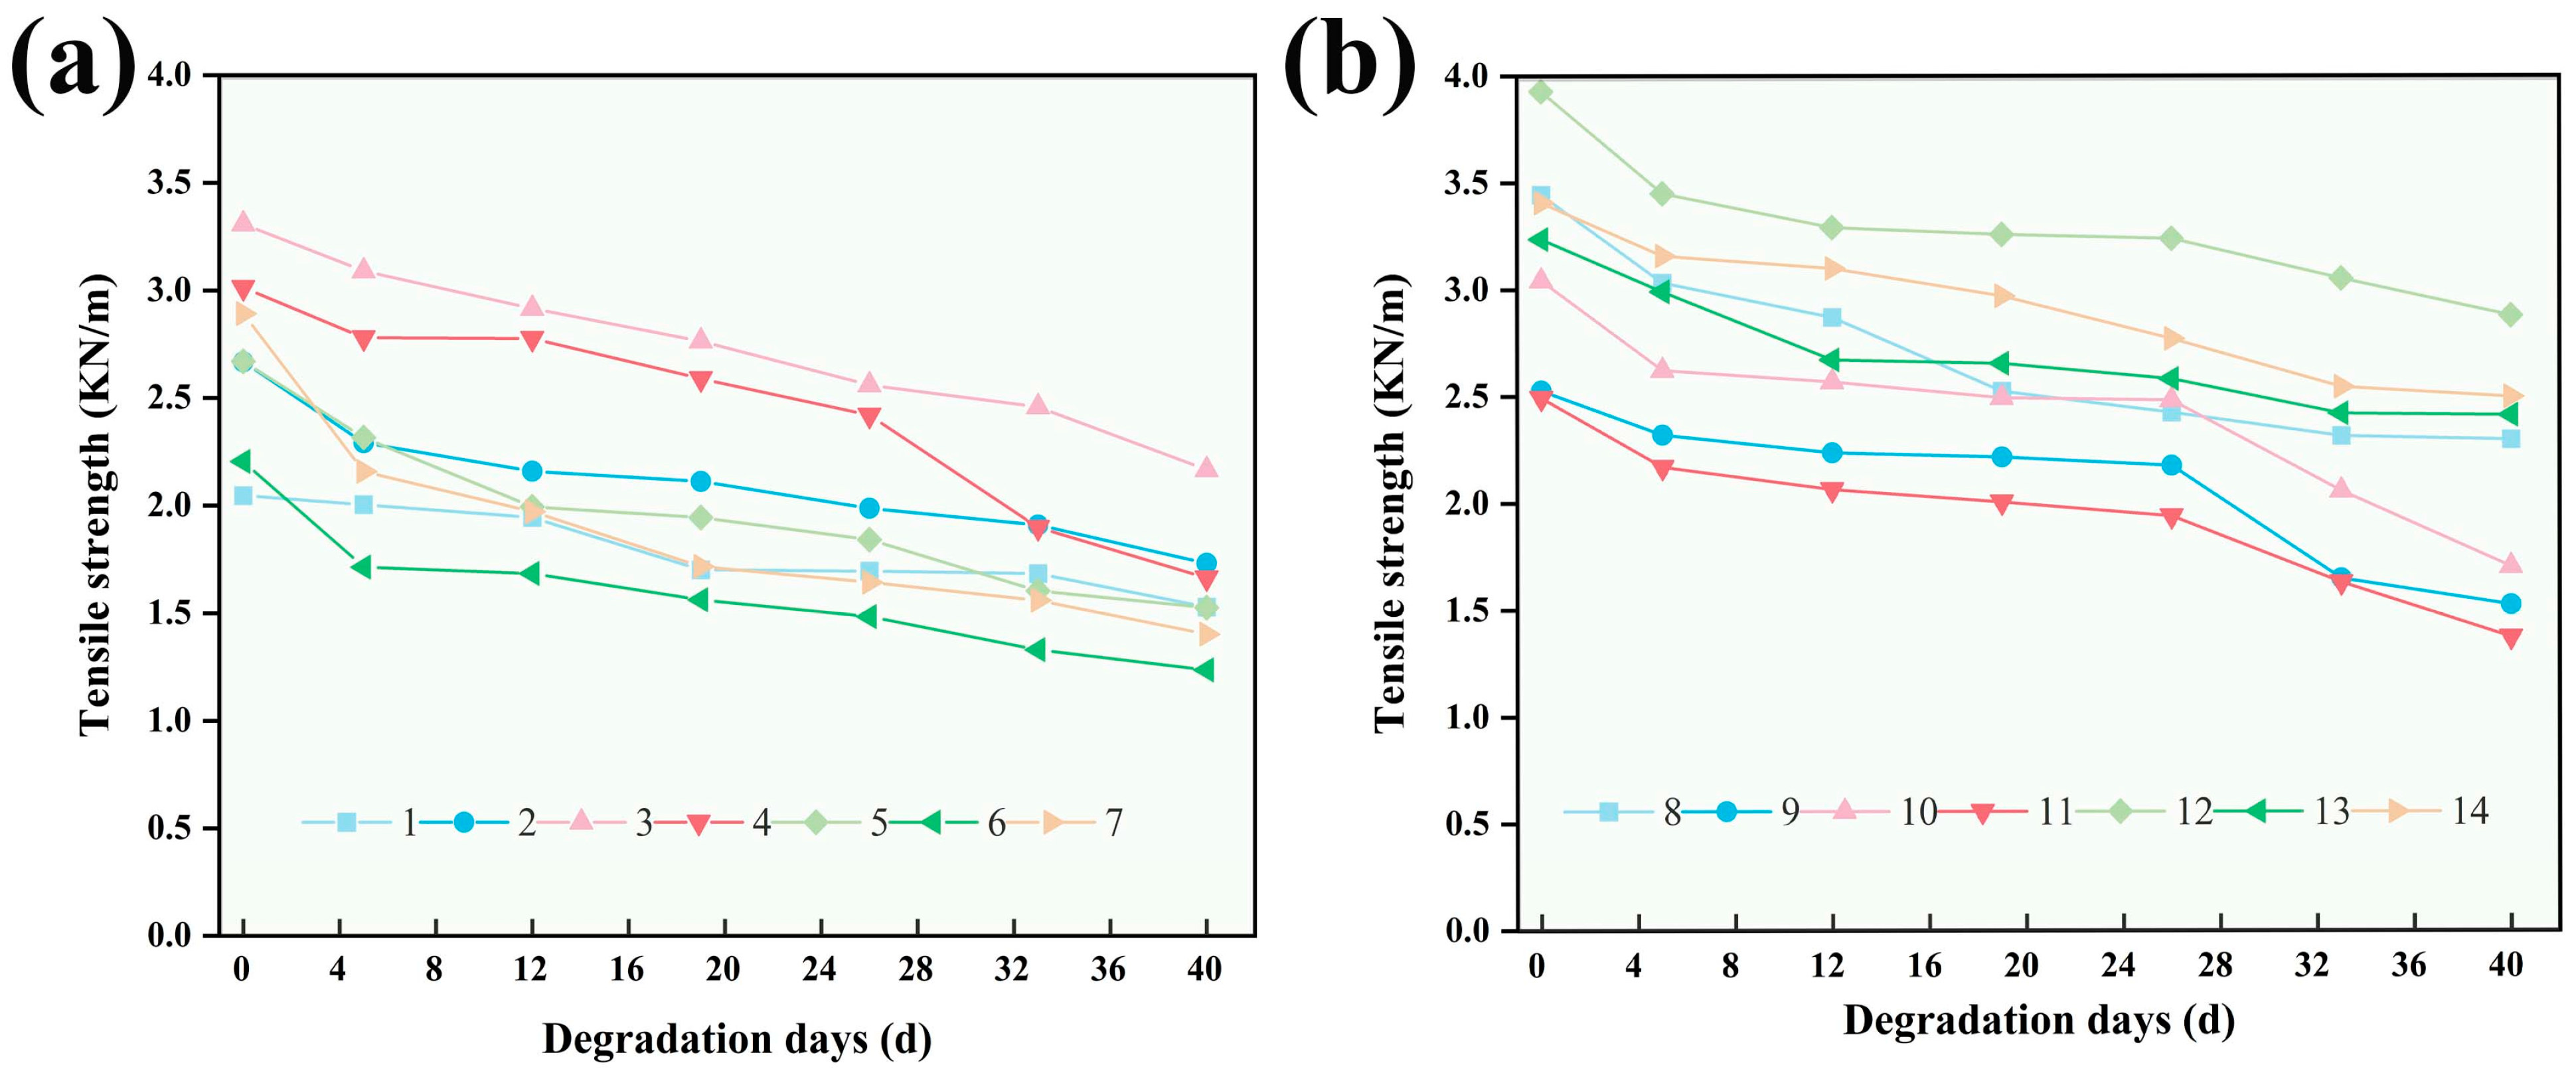
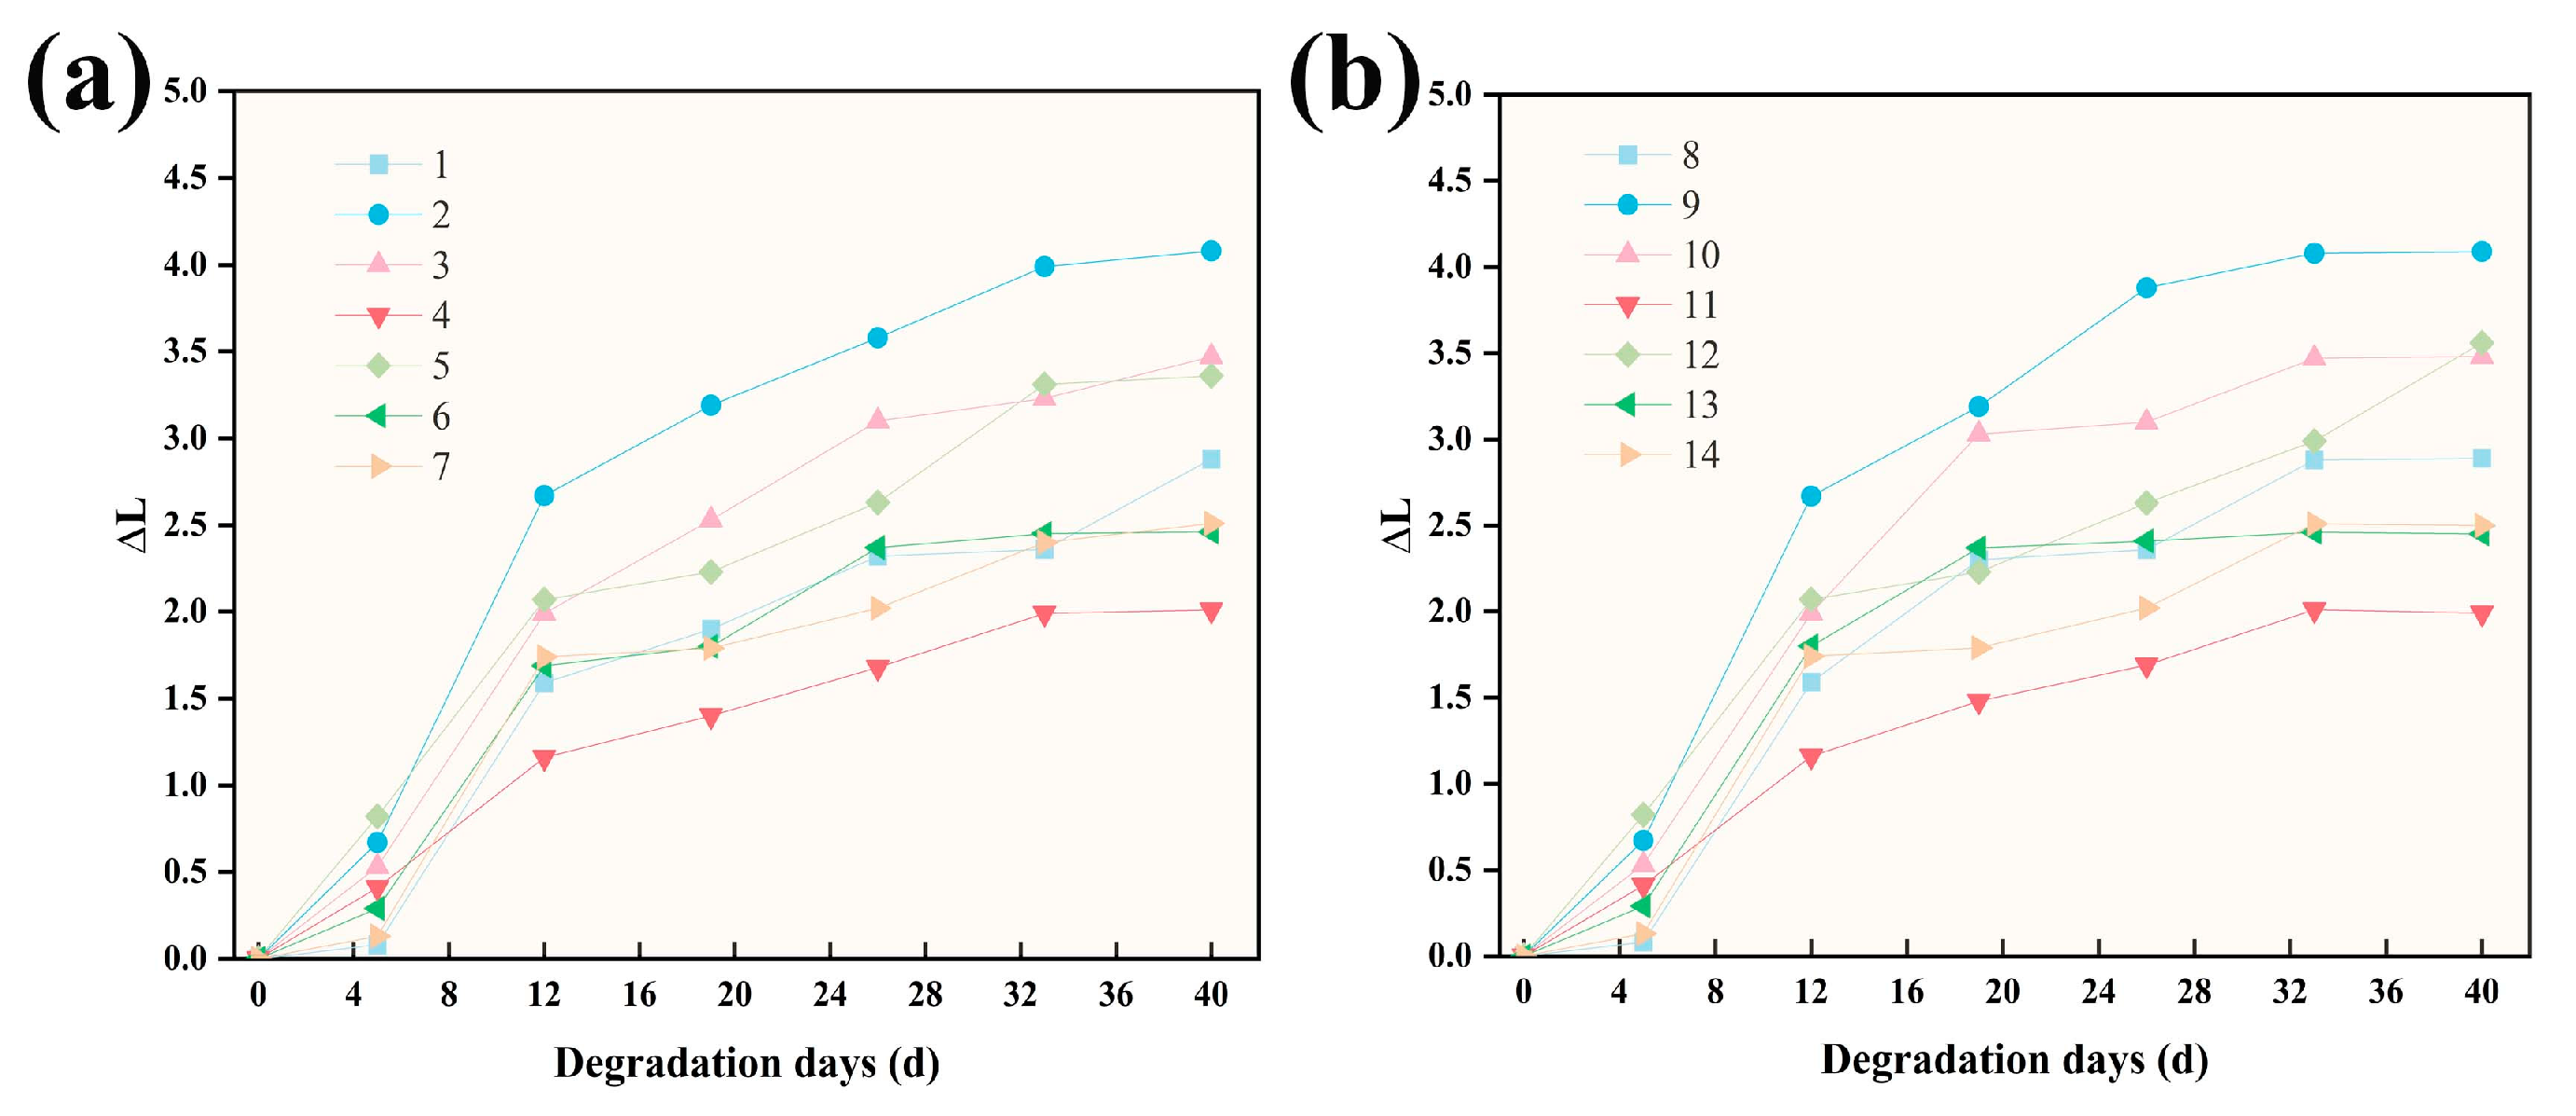
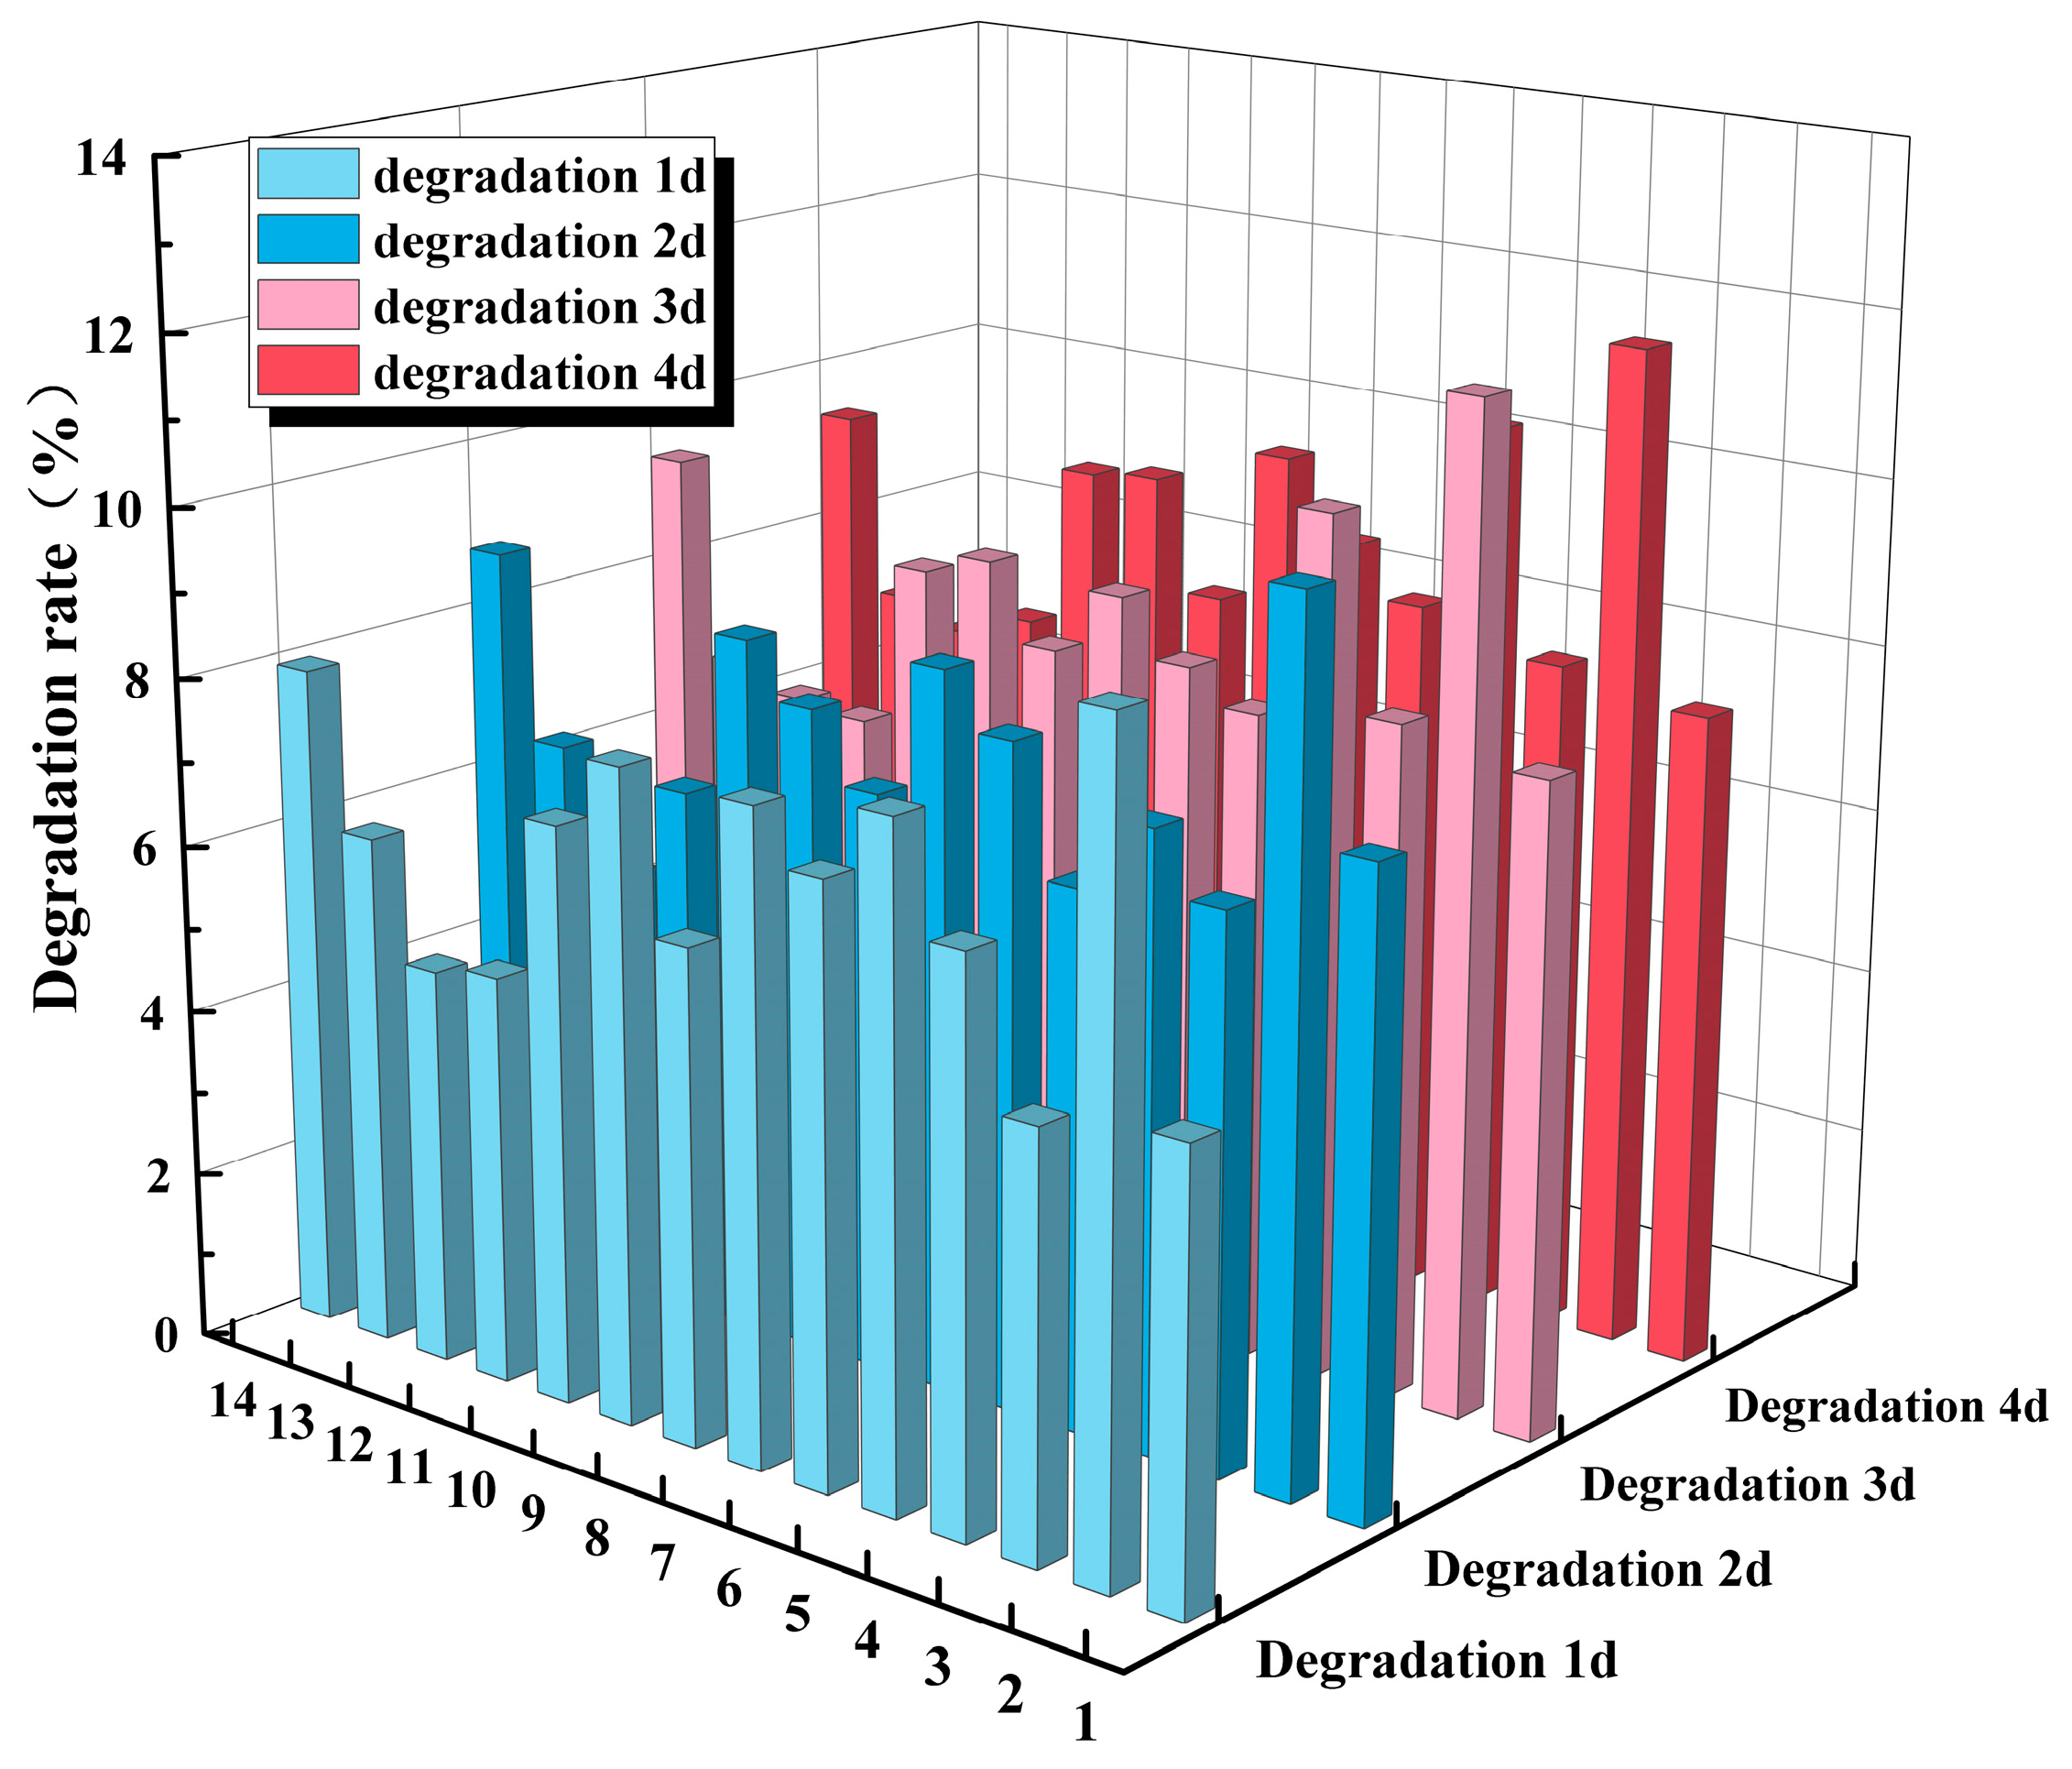
3.1. Film Performance Analysis for Photo Degradation

Figure 2 shows the changes in the degradation rate of the films in the UV aging chamber for each test group during the 40 d (day) test. Different experimental groups had different degradation rates and degrees of degradation. Mulch was degraded over a period of 40 d, with degradation rates ranging from 2.9% to 6.6%. The highest degradation rate of 6.66% was recorded in test group 5 at 40 d of degradation. Test group 12 had the lowest degradation rate of 2.97%. During the initial degradation stage, the degradation rate of the films was significantly elevated in most of the experimental groups. In the middle and late stages of degradation, the fibrous mulch films degraded slowly due to the wrapping of some of the residual lignin by Salix fibers and wheat straw fibers. The lignin maintains a strong chemical bonding linkage with the cellulose and hemicellulose [33].
It can be seen from Figure 3 that there are differences in the tensile strength of different experimental groups. However, the overall trend was decreasing, which was consistent with the pattern of the degradation rate of the film. In the initial stage of degradation, the tensile strength of the film decreased rapidly; in the middle stage of degradation, the tensile strength of the film decreased slowly; and in the late stage of degradation, the tensile strength of the film decreased rapidly. At 40 d, the tensile strength of the fiber film was the lowest in test group 6, which was 1.236 KN/m. The highest was in test group 12, which was 2.878 KN/m. It was shown that different concentrations of dry-strength agents and sizing agent ratios affected the tensile strength of Salix/wheat straw fiber films. This is due to the binding between the sizing component and the fiber in the sizing system. Classification into stable strong bonding and unstable weak bonding [34]. Therefore, different mass fractions of sizing agent added resulted in different tensile strengths. The fibers were degraded under light, resulting in oxidized cellulose and strongly reduced organic matter. The presence of oxygen accelerated the rate of direct photodegradation Macroscopically, the tensile strength of the film was reduced. This showed that the composite film will not cause soil pollution and meet the requirements of ecological environment protection.
The changes in Δ L of fiber film during the 40 d experiment for each experimental group are shown in Figure 4. It can be seen from Figure 3 that in the process of photodegradation. With the prolongation of degradation time, the Δ L value of 12 groups of composite fiber films increased. After 40 days of degradation, the Δ L value of test group 12 was 3.56, and it is gradually increasing. The Δ L value of test group 5 was 3.36, and it had gradually stabilized. The Δ L value changed the most in the test group 9 within 40 days of degradation, and the Δ L value was 4.09. The Δ L value of group 2 at 40 d was 4.08, which was not significantly different from that of group 9 (p > 0.005). Δ L value was an index to measure the change in brightness during the aging process. The larger the positive value, the brighter the color of the material. It shows that the more serious it is fading [35]. During the whole photodegradation process, the Δ L value was always increasing. On the 36th day, some fiber films began to flatten. With the increase in degradation time, the color of the fiber film changed little after fading to a certain extent. The change in color of the fiber film surface was related to the degree of degradation when compared to Figure 2.
The change of Δ E in each test group during the 40 d test is shown in Figure 5. With the prolongation of degradation time, the Δ E value of 12 groups of composite fiber films increased. After 40 days of degradation, the Δ E values of the 12 groups of films were between 3.0 and 6.0. It belonged to the perceptible range of human vision, which indicated that Salix fiber composite wheat straw mulch would have an obvious color change during photodegradation. The Δ E value was an index to measure the overall color change of composite materials before and after aging. The higher the Δ E value, the more pronounced the color fading of the material.
The film can be affected by natural conditions during its use such as rain and humidity. Thus, the surface layer of the mulch can collect a large amount of water. The contact angle reflects the effect of water immersion on the service life of the film [36]. For this purpose, the change in contact angle of Salix/wheat straw fiber composite films with increasing degradation time was investigated. The contact angles of the films of different test groups decreased to different degrees with the increase in degradation time. After 40 days of degradation, the contact angle of test group 5 decreased from 98.9 to 34.1 (Figure 6a), and the contact angle decreased by 65.5%. The contact angle of test group 12 decreased from 123.1 to 74.4 (Figure 6b), and the contact angle decreased by 39.6%. As the photodegradation time increases, the film surface tension decreases, the wettability increases, and the contact angle decreases. It was demonstrated that changes in the content of wet strength and sizing agent affect the change in the contact angle of the film. With increasing photodegradation time, C–C, C–O, and C–H bonds in fiber films undergo fracture hydroxyl groups that are gradually increased. Film affinity for water is reduced, and the surface tension of the film decreases. The wettability of the films increases, and the contact angle decreases [37].
Figure 7a shows the thickness of the film when it is not degraded. Thickness is maintained at 0.134–0.137 mm. Figure 7b shows the thickness of the film after 40 d of degradation. Thickness is maintained at 0.111–0.123 mm. As can be seen from the figure, after 40 d of degradation, the thickness of all 14 groups of films decreased. However, no clear pattern of degradation was observed. This shows that photodegradation degrades the cellulose in the film, which in turn changes the film thickness. But there is no significant relationship between film thickness and degradation rate.

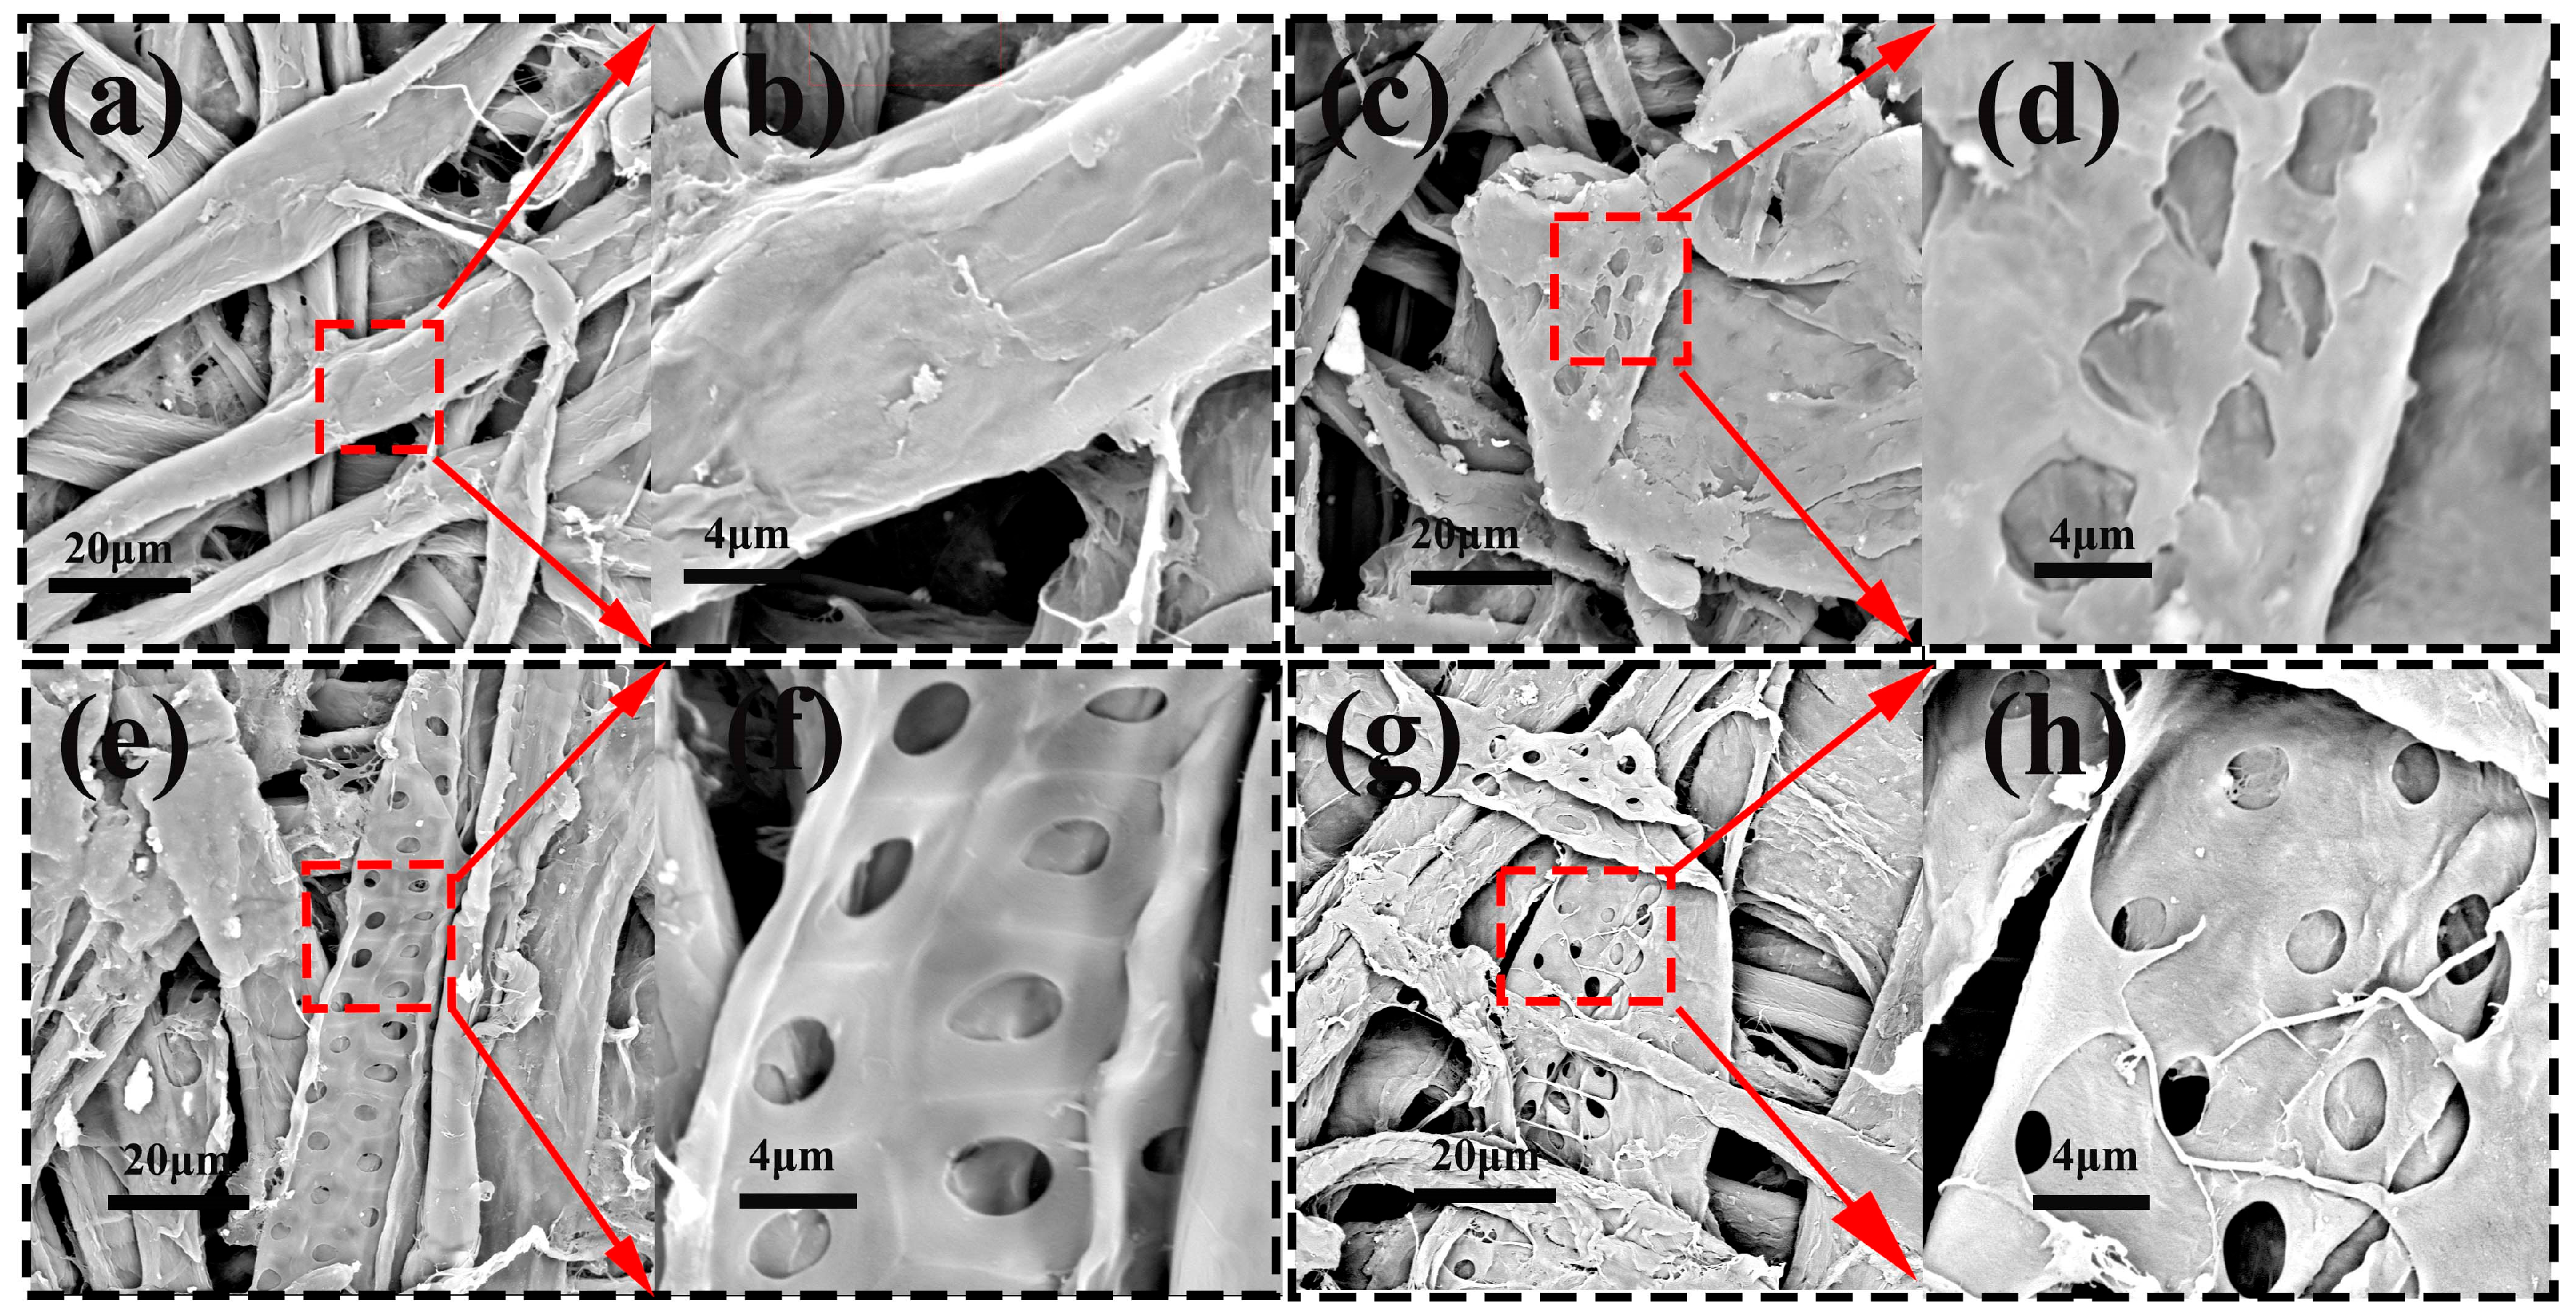
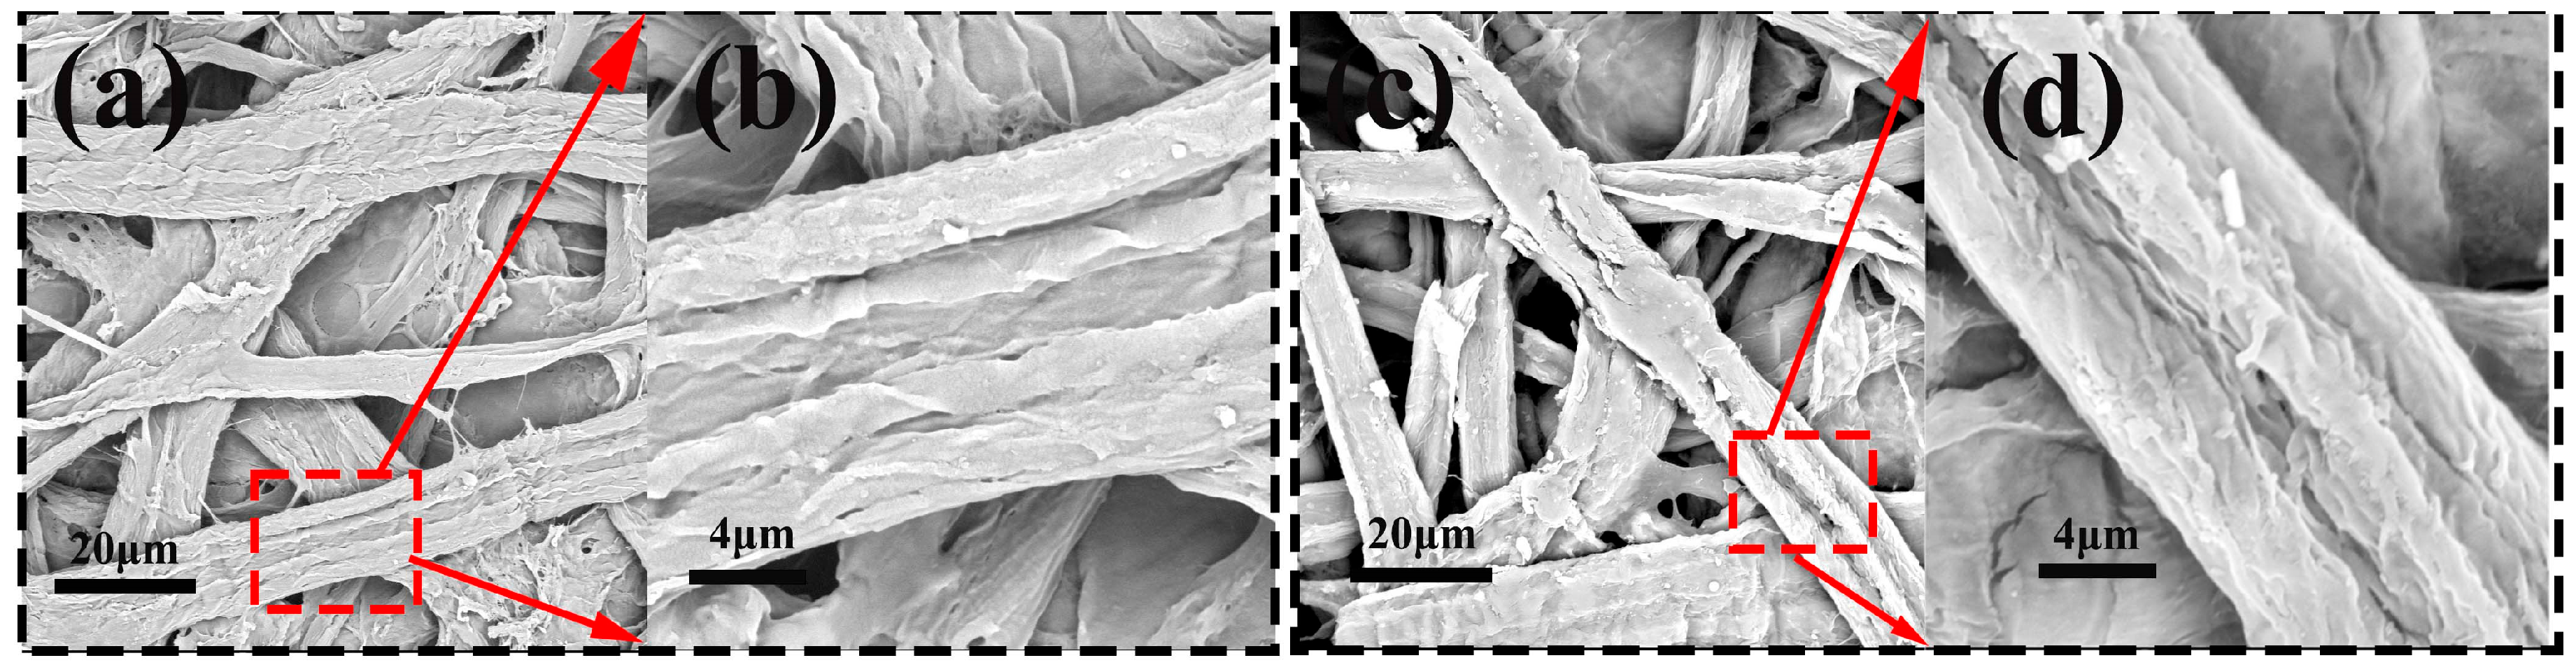
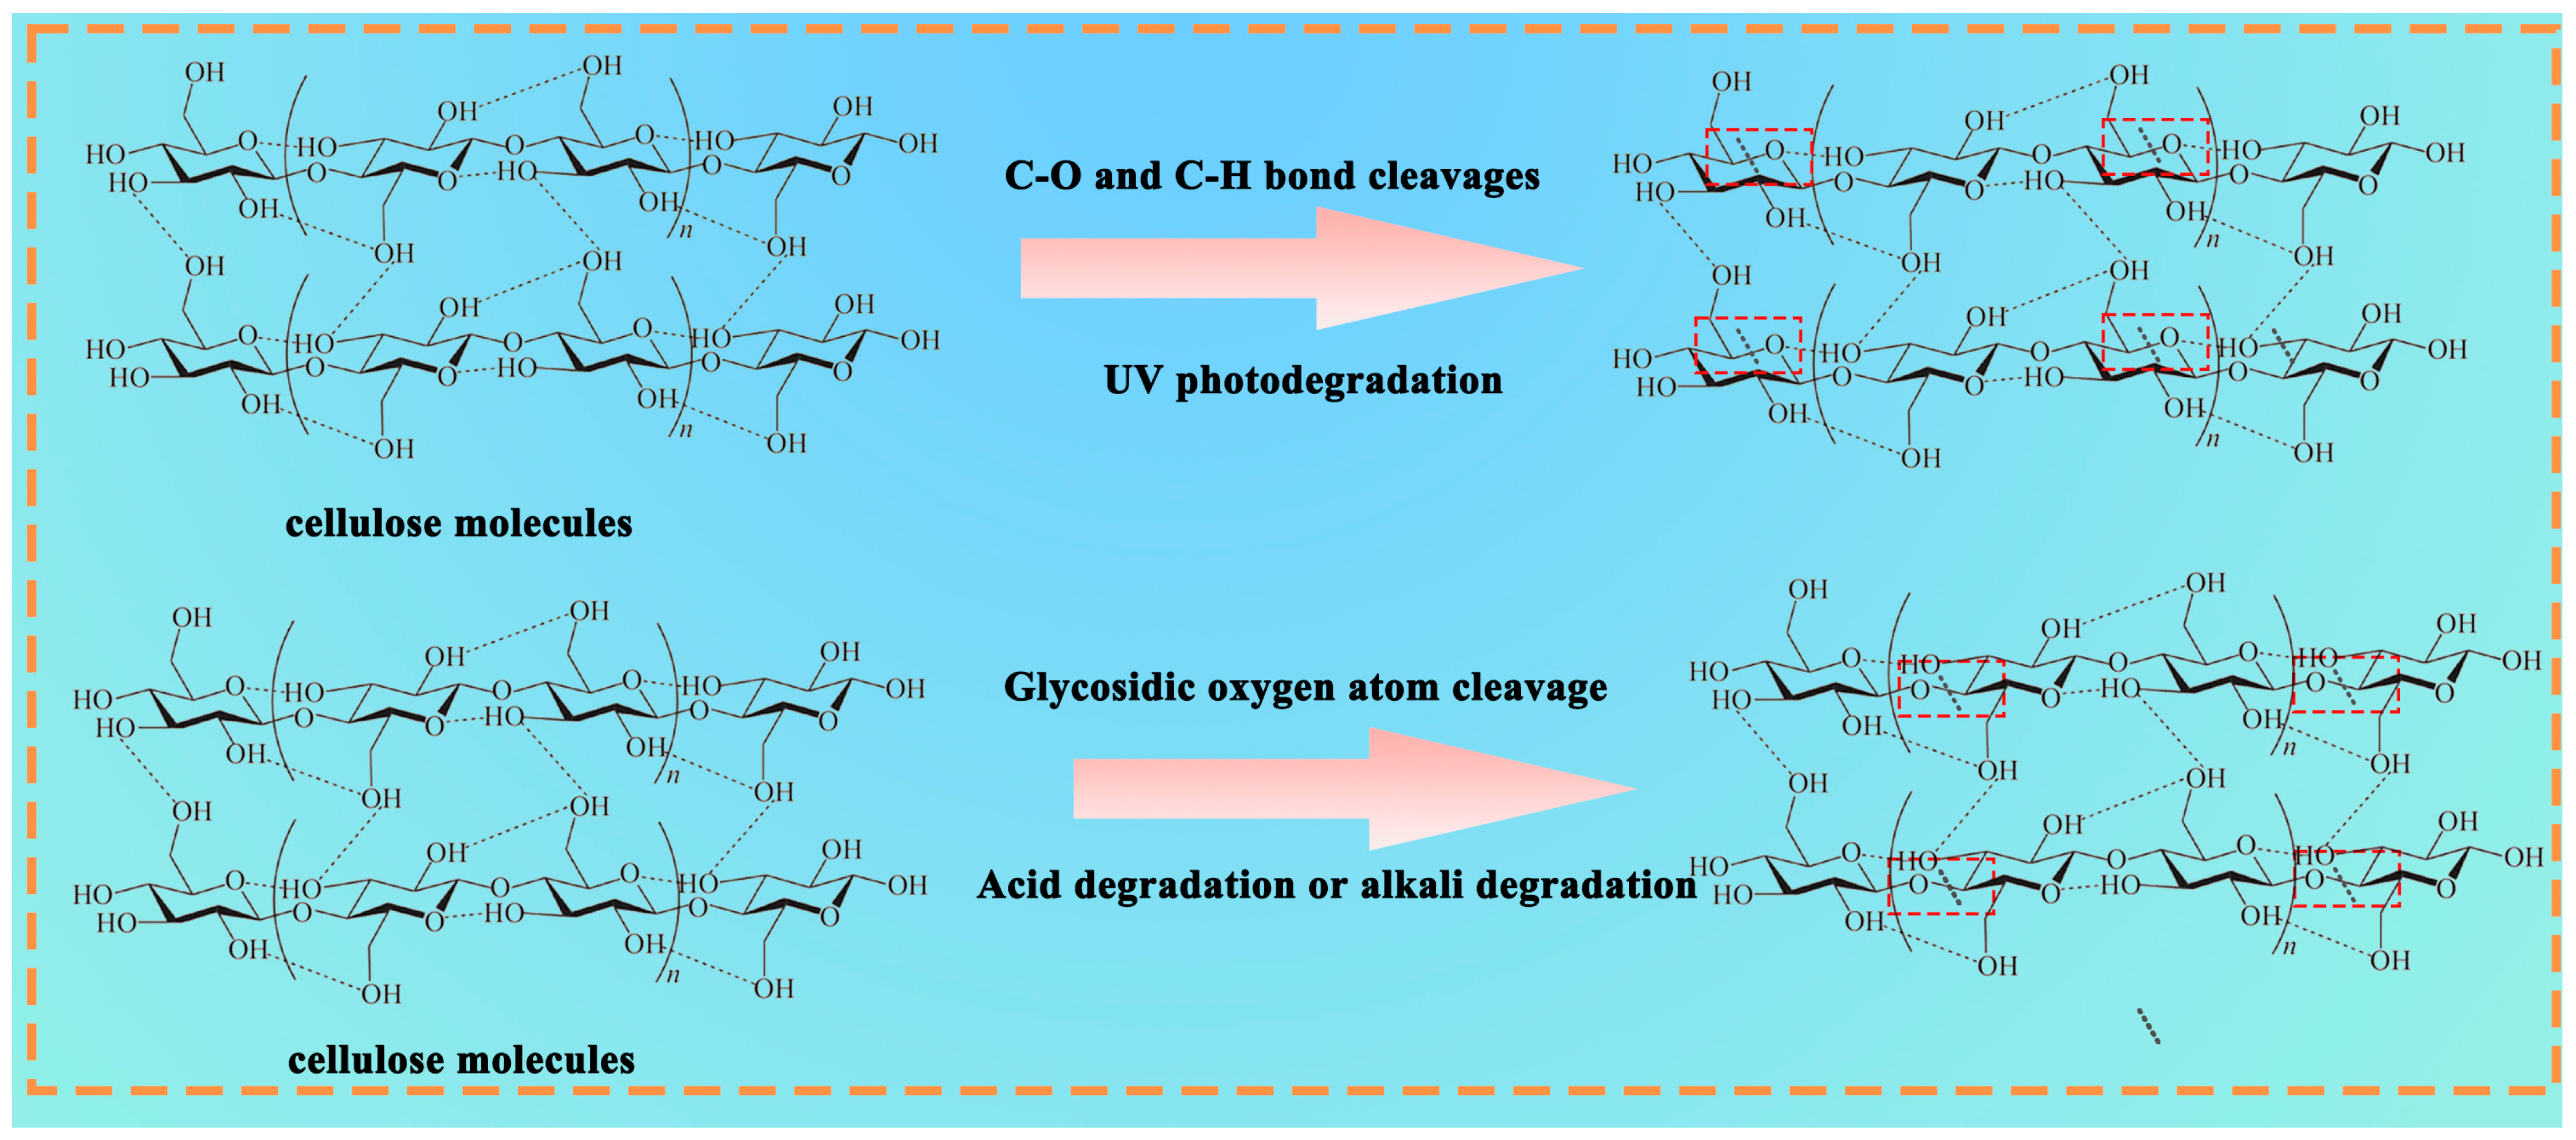
3.2. Microstructure and Morphology of Photo Degradation

The changes in the characteristic peaks of the infrared spectrum are due to the chemical interactions that occur between the substances in the mixture. It can characterize the degradation of the film by the change in functional groups [38]. As can be seen in Figure 8, it was observed that there was no significant change in the type and location of the peaks before and after the degradation of the films. However, with longer degradation times, the characteristic absorption peaks of degraded films show a trend of decreasing intensity and broadening peak shape. The absorption peak of Salix/wheat straw fiber composite film is mainly at 895 cm−1 (–CH bending vibration), 1035 cm−1 (C–O stretching vibration), 1158 cm−1 (C–O–C anti-symmetric stretching vibration), 2931–2854 cm−1 (C–H stretching vibration), and the typical band at 3430–3410 cm−1 (O–H stretching vibration). Approximately 1429 cm−1 (CH2 symmetry bending) and peaks near 1324 cm−1 are phenol groups in cellulose [39,40,41,42] explains that the main component of the film is cellulose. With the increase in degradation time, the intensity of the characteristic peaks of the films gradually changed degradation of the toughness of the films when they are exposed to light for a long time. The main chain in the molecular structure is broken, and the relative intensity of the absorption peaks of the C–H and C–O bonds decreases with time. The degradation of the toughness of the membranes is due to a decrease in the breakage of C–O bonds eventually lead to film degradation. Sunlight could degrade cellulose substances to produce oxidized cellulose and strong organic matter. Figure 8a is the infrared spectrum of the different degradation times of the test group film 5, and Figure 8b is the infrared spectrum of the different degradation times of the test group film 12. The characteristic absorption peak of the test group 5 was stronger, and the peak shape was sharper than that of the test group 12 when it was not degraded. At 40 days of degradation, the infrared spectra of the two groups of fiber films tended to be consistent. It was further proven that the degradation rate of test group 5 was much higher than that of test group 12.
The surface of the Salix composite wheat straw fiber film was examined by SEM, and the images revealed the obvious differences in the surface morphology of the inner film in different degradation cycles. Figure 9 shows the SEM images of different degradation cycles in test group 5. The film of test group 5 showed a smooth and dense surface when it was not degraded (Figure 9a,b). The overall shape of the fiber was clear, and the fiber was obviously exposed. The surface of the Salix fiber composite straw film was uniformly coated with a dry-strength agent and a sizing agent. At the same time, a dense layer structure could be observed. This indicated a strong interaction between the modifier and the fibers. After 12 days of degradation, small pores of different shapes began to appear on the surface of the fiber film, and the pore range was not large and only appeared on a small part of the fiber (Figure 9c,d). It was seen that UV light could provide enough energy to cause fiber breakage [43]. With the increase in ultraviolet irradiation time, after 26 days of degradation, a single fiber was covered with uniform pores, and the pores were smoother than before (Figure 9e,f). After 40 d of degradation, the fibers showed large ruptures, and broken pores of varying sizes began to appear in the dense layer (Figure 9g,h). The effect of UV radiation on fiber films was seen through changes in the surface morphology of the films [44].
Figure 10 shows the SEM images of different degradation cycles for test group 12, which was the group of tests with the lowest degradation rate. (Figure 10a,b) illustrates the surface topography of test group 12 when it was not degraded. The film surface was smoother and tighter compared to test group 5. After 12 d of degradation, a smaller number of tiny pores appeared on the surface of the fibers (Figure 10c,d). After 26 d of degradation, more fine pores appeared on the fiber surface. Nevertheless, the size of the fine pores did not change significantly (Figure 10e,f). After 40 days of degradation, a large area of pores appeared on the surface of the fiber (Figure 10g,h). At this time, the microscopic surface morphology was similar to that of experimental group 5 after 12 days of degradation.

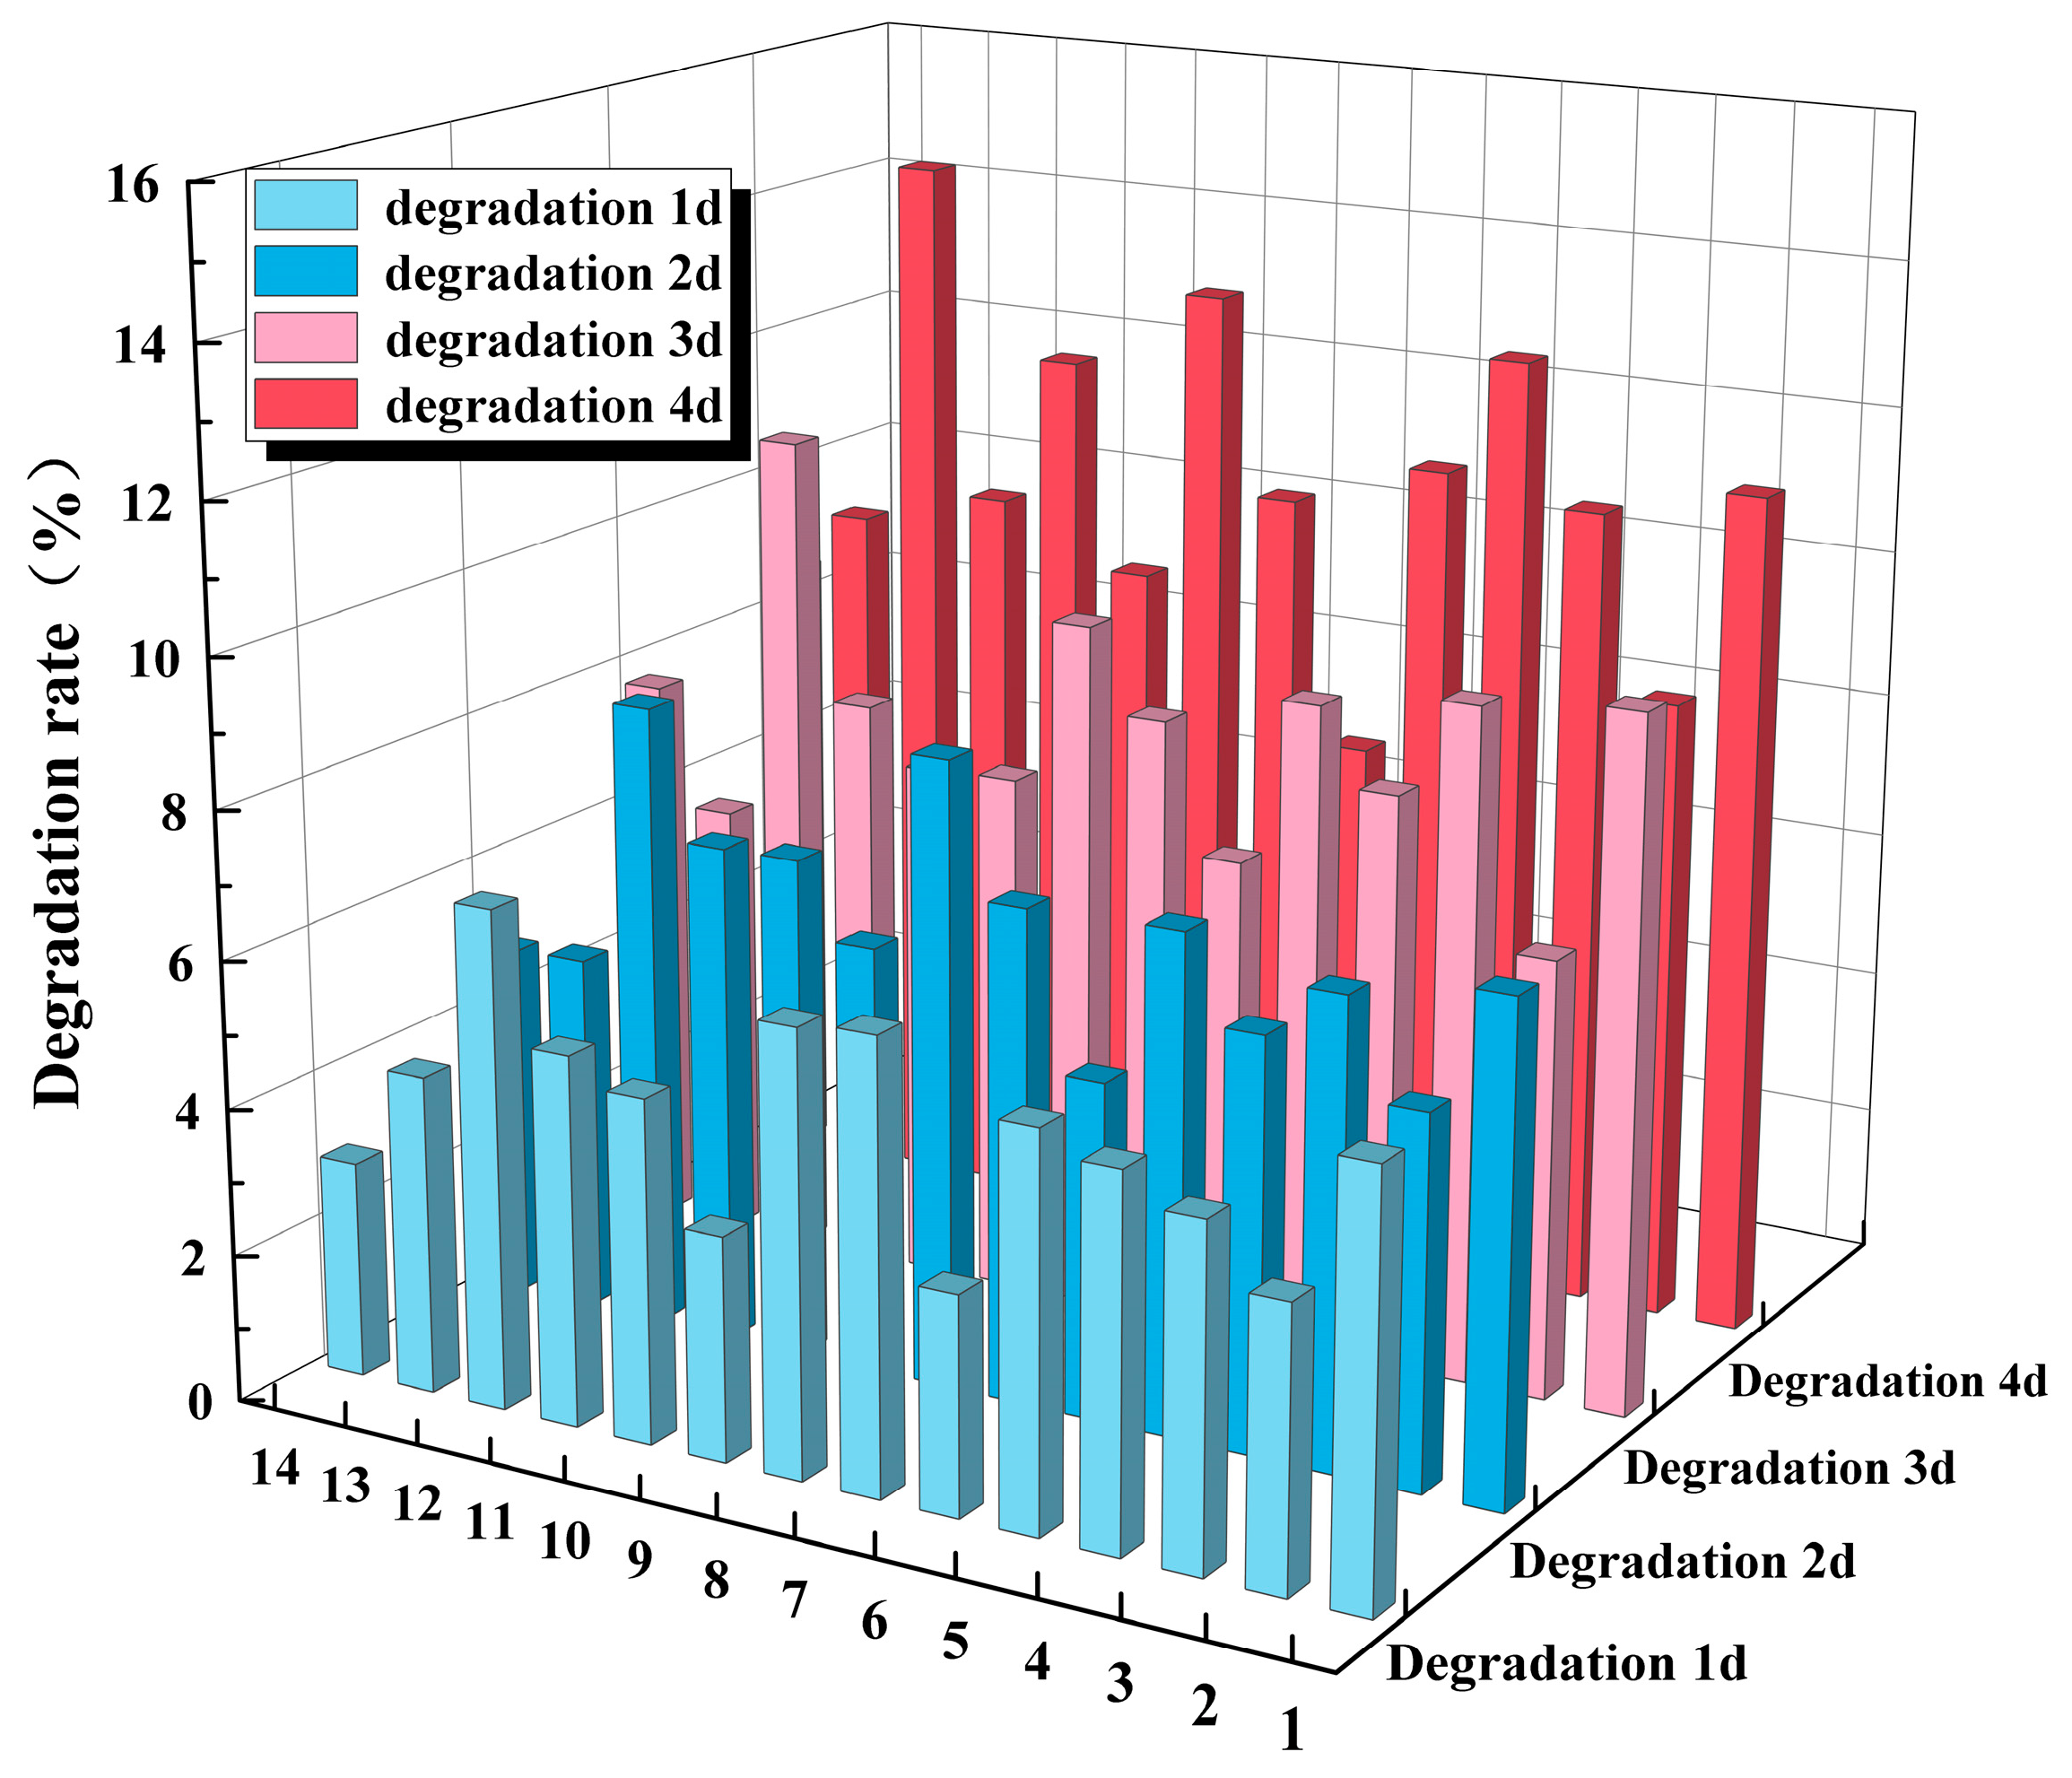
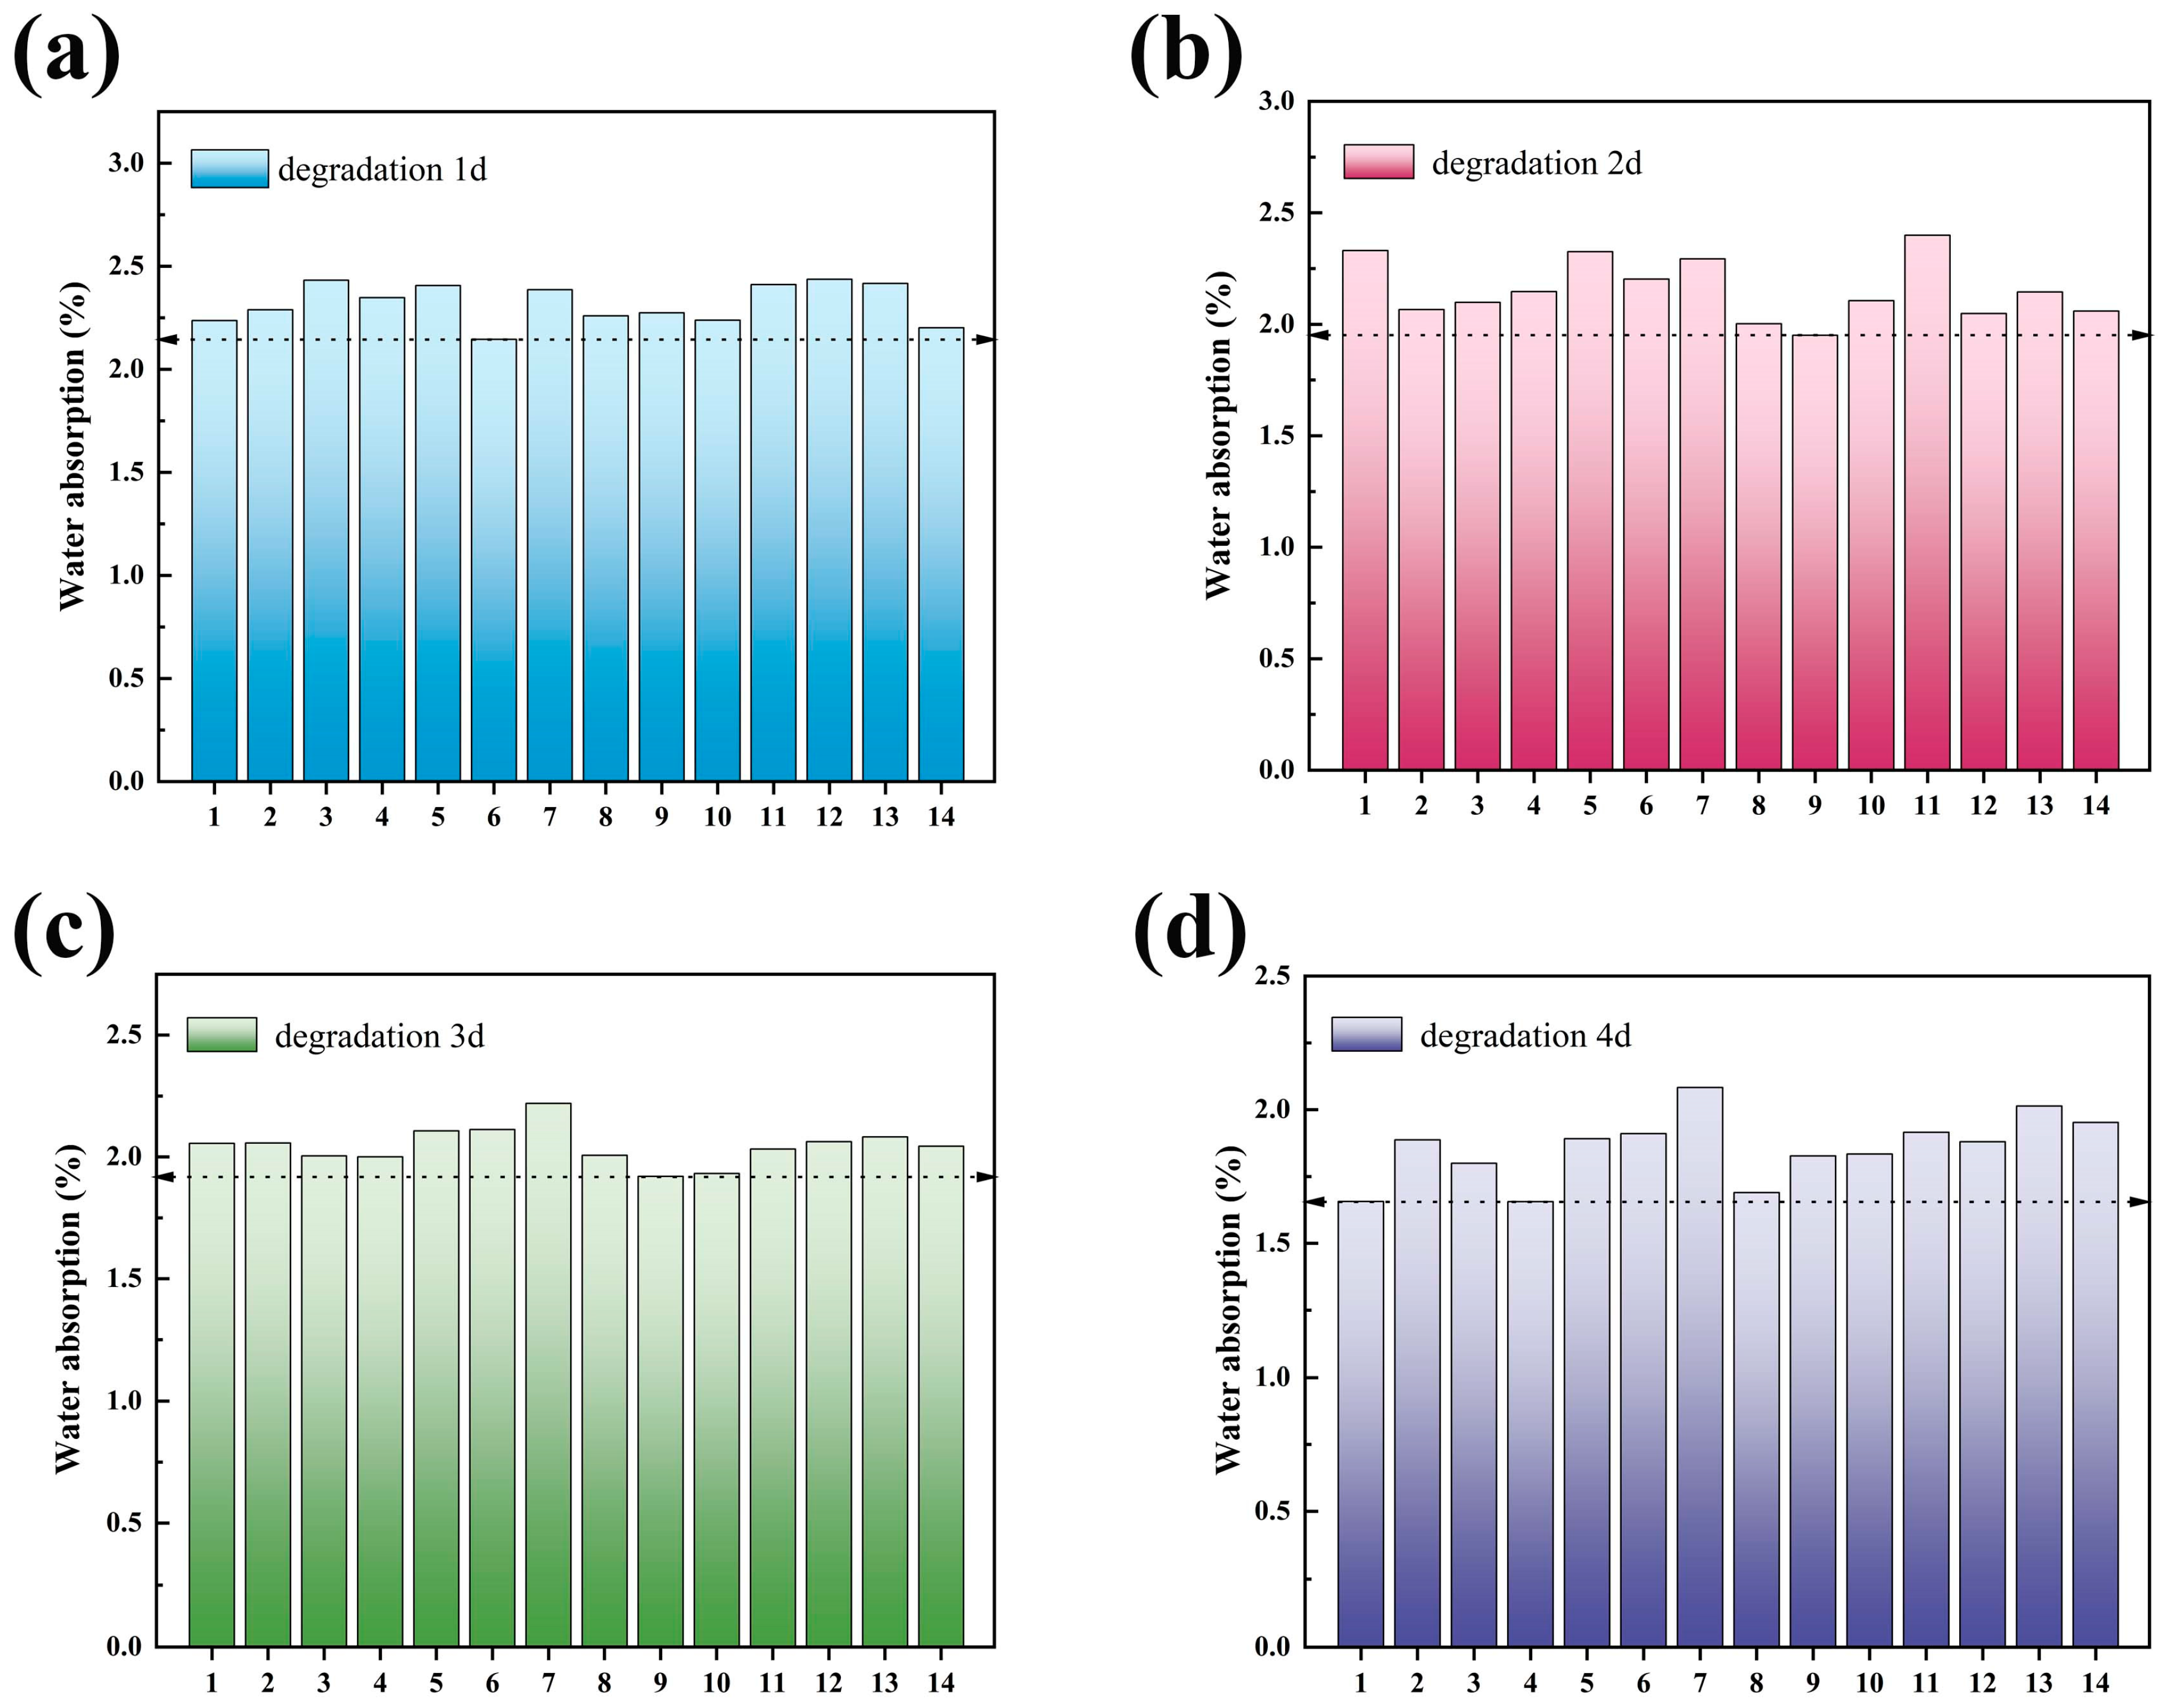
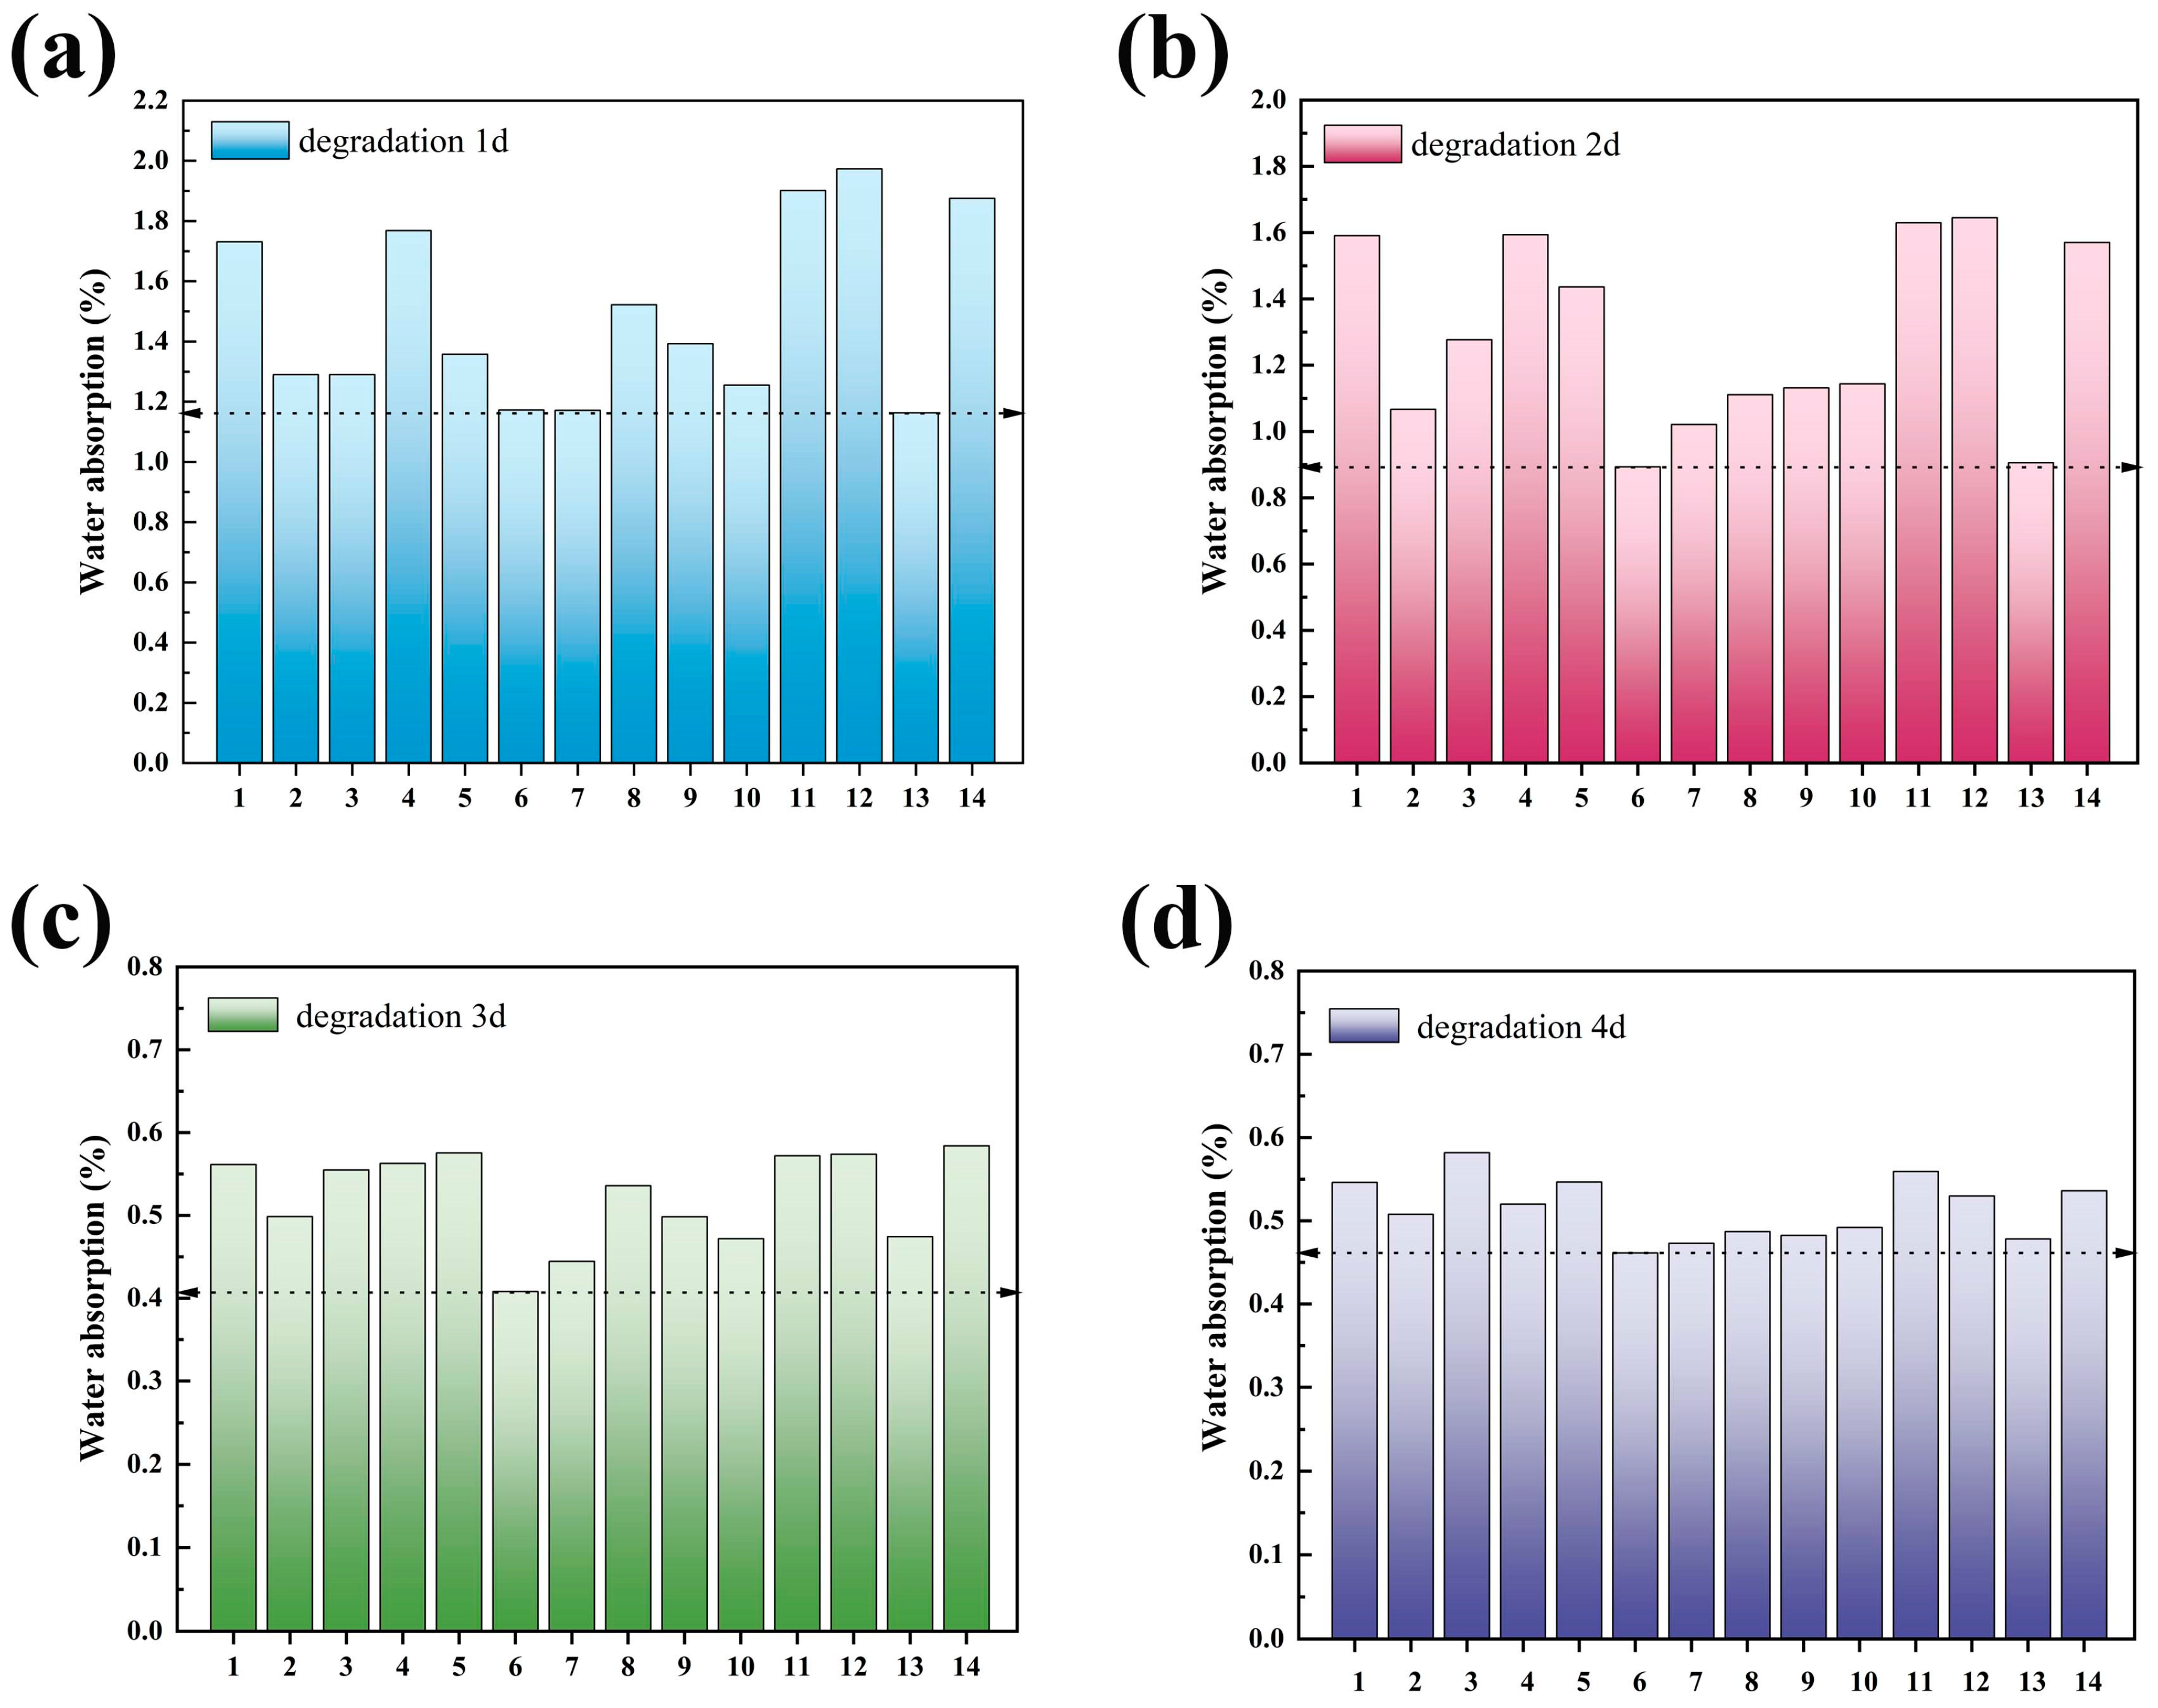
3.3. Analysis of Film Performance for Alkaline and Acid Degradation

As can be seen from Figure 11, with the increase in time, the degradation of 14 groups of test group films in alkali solution increased little. At the 4th d, the degradation of the composite film began to slow down, and the degradation rate with the 3rd d was basically unchanged. The degradation rate of the 14 test group films ranged from 4.7% to 9.7% at the 1st d of degradation. After 4 d of degradation, the degradation rate of the 14 fiber films ranged from 6.8% to 11.9%. During alkali degradation, the fastest degradation was found in test group 2, with the degradation rate remaining the highest, reaching 9.65% at the 1st d and 11.89% at the 4th d. The slowest degradation was found in test group 12, with the degradation rate remaining the lowest, reaching 4.74% at 1 d and 6.90% at 4 d. Under the high-temperature conditions in the pulping process, most of the lignin had been removed and the cellulose had undergone alkaline hydrolysis [45,46]. Thus, the cellulose film was degraded by placing it in an alkaline solution, with little change in degradation with increasing time. The ratio of dry strength and sizing agents affected the degradation of fibrous films in alkaline solutions. The degradation of cellulose by alkaline solutions was also hindered to some extent.
From Figure 12, it can be seen that the degradation rate of the 14 test group films in acid solution increased with the increase in time. The degradation rate of the 14 test group films ranged from 2.9% to 6.8% at the 1st d of degradation and from 7.2% to 14.7% at the 4th d of degradation, which significantly increased the degradation rate. The slowest degradation was observed in test group 6, which increased from 2.97% to 7.26%, and the fastest degradation was observed in test group 12, which increased from 6.7% to 14.6%. The β-1,4-glycosidic bond in cellulose macromolecules is an acetal bond, which is particularly sensitive to acid. Acid attacks the glycosidic bond in the amorphous region of cellulose fibers, breaks the glycosidic bond [47], and thus causes a large mass loss.
It is shown in Figure 13 that the films of the test groups did not change significantly in the first 3 d of degradation. The water absorption rate of the films of each group in an alkaline solution was maintained at about 2%. The water absorption rate of the 4th d of degradation began to decrease and still basically remained above 1.65%. It was proved that the ratio of dry strength agent and sizing agent basically does not affect its water absorption in alkaline solutions. The hydrophilic group in the fiber film adsorbed the water molecules on the surface of the polar group through cation coordination or hydrogen bonding. Thus, there was a certain degree of water absorption. With the degradation of the fiber film in an alkaline solution, the hydroxyl group in the fiber was gradually reduced [48], so water absorption was gradually reduced.
Figure 14 shows the change in water absorption rate of each test group of film in an acid solution with a pH = 1. Although the water absorption rate of each test group of the film with different ratios was different in the 1st d of degradation, the water absorption rate of each test group of the film was gradually the same in the 4th d of degradation, which was around 0.5%. It would be seen that different ratios in acid solutions would affect the degradation rate of composite film. The degradation rate of the composite film in the acid solutions gradually converged with time. The water absorption capacity of cellulose films changed after acid hydrolysis. The water absorption rate of cellulose decreased significantly at the beginning of hydrolysis. The reason may be that the amorphous region was hydrolyzed at the beginning of hydrolysis, and the crystallinity increased [49].

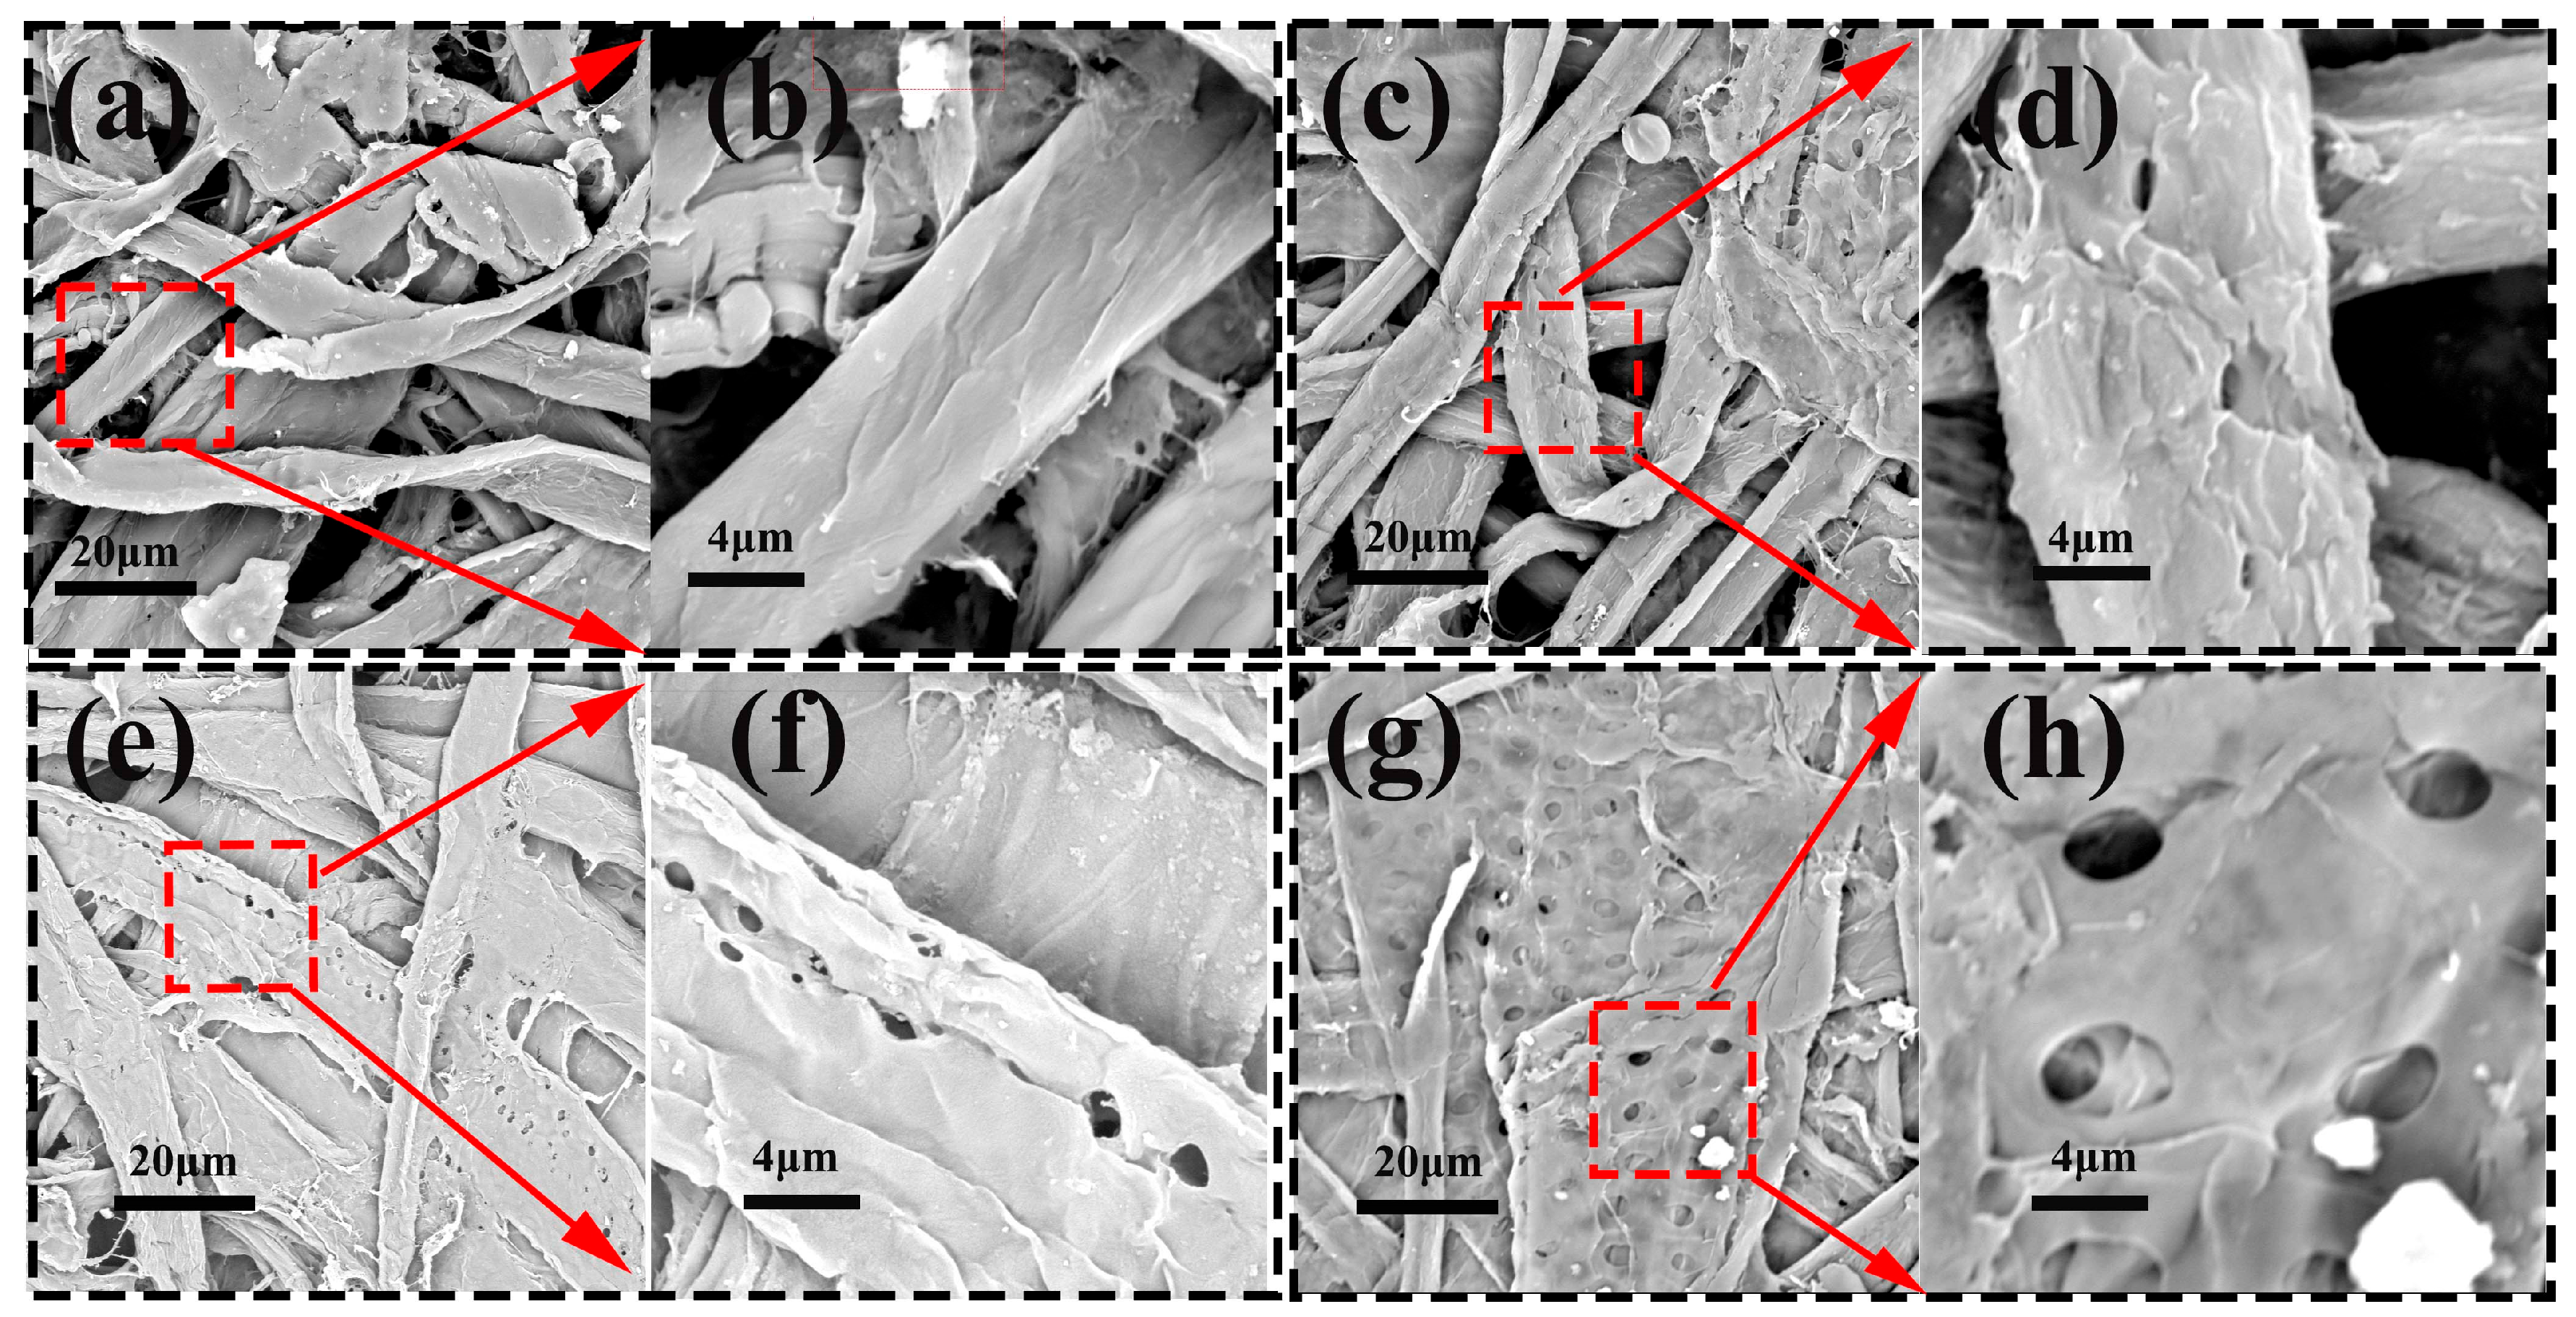
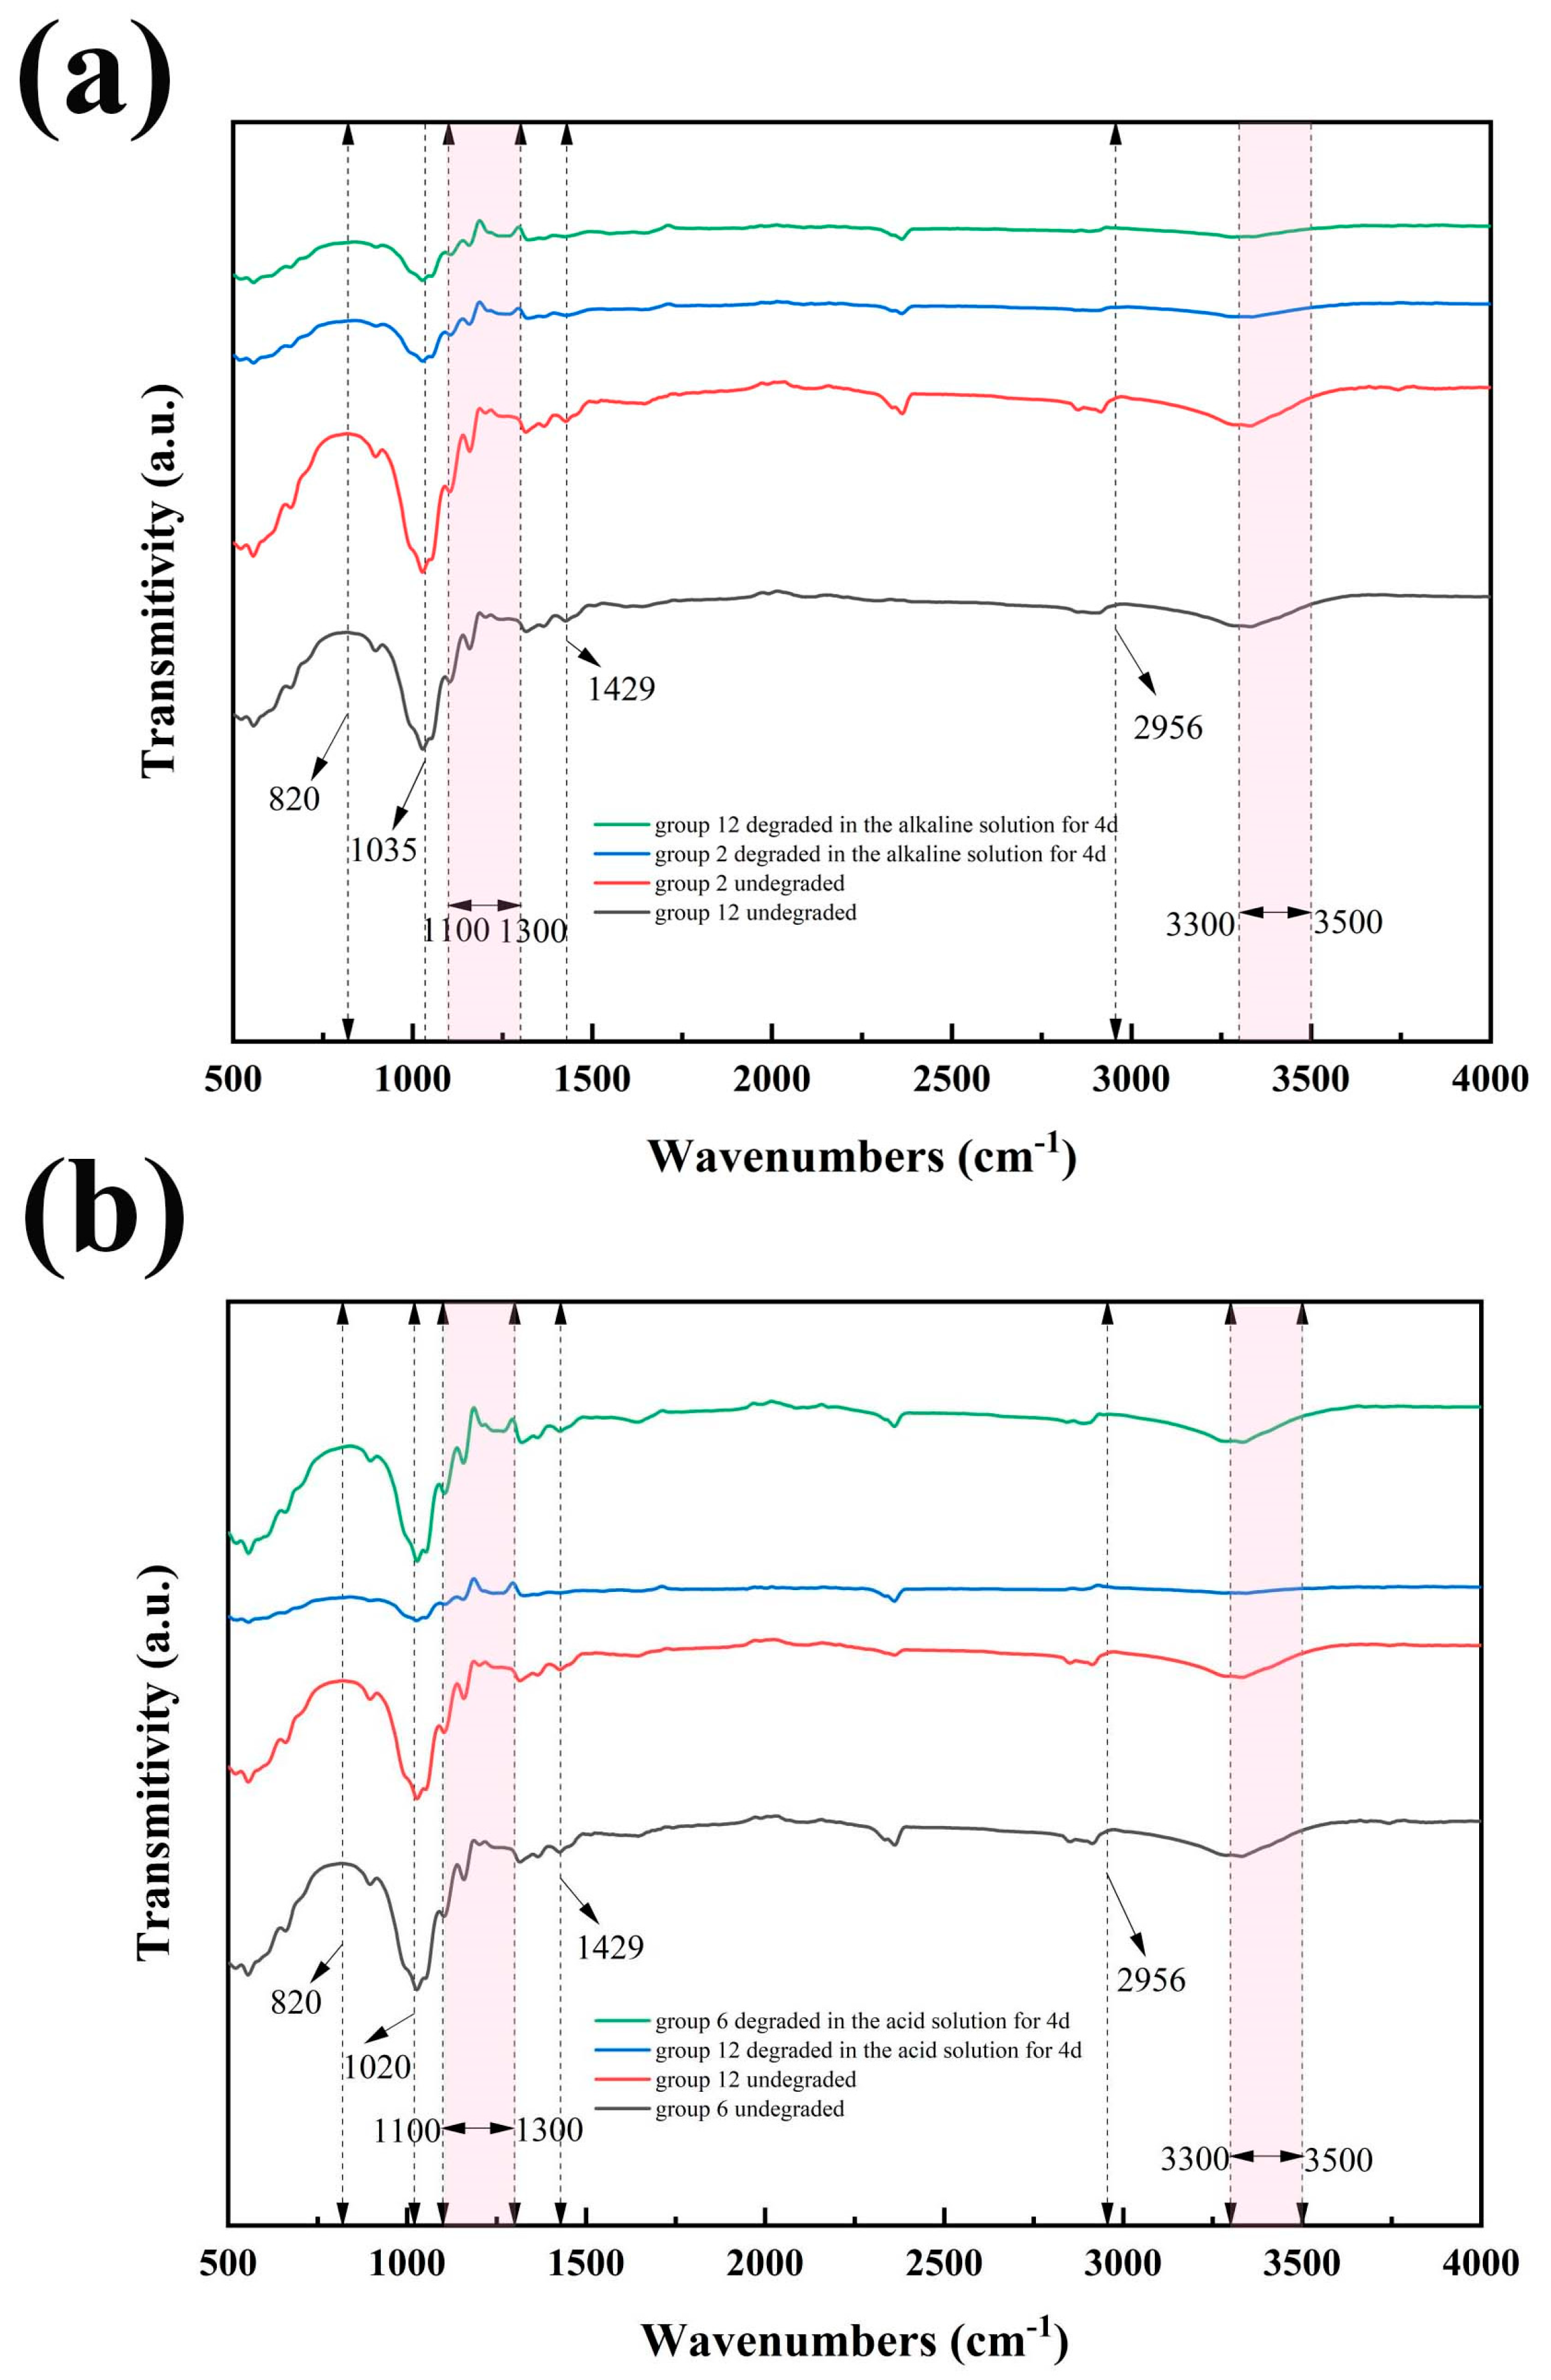
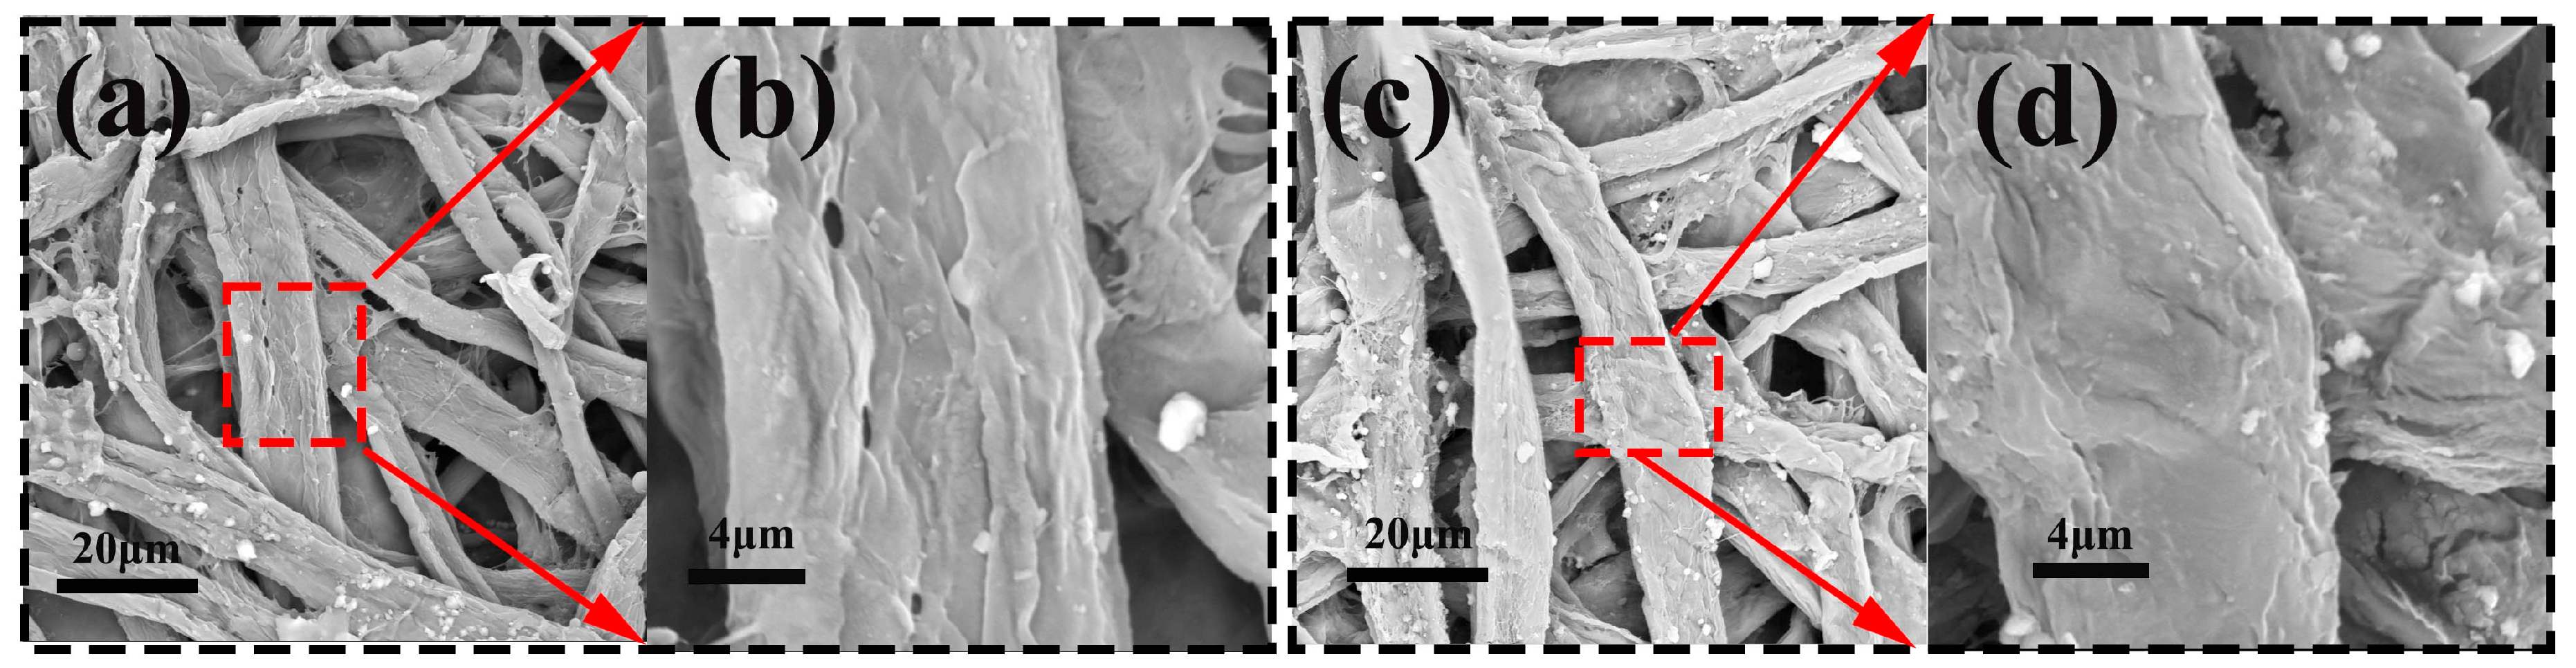
3.4. Microstructure and Morphology of Alkaline and Acid Degradation

Figure 15a shows the un-degraded infrared spectra of test groups 2 (the fastest-degraded film in the alkaline solution) and 12 (the slowest-degraded film in the alkaline solution) and the infrared spectra of the test groups soaked in alkaline solution for 4 days. As revealed in Figure 15a, the intensity of the absorption peaks of the two did not change much when they were not degraded. The C–O stretching vibration peak [50,51] peak intensity at 1035 cm−1 was higher in test group 12 than in test group 2. After 4 d of degradation, the characteristic absorption peaks of the two groups of test films showed a trend of gradually weakening intensity and broadening peak shape. The peak intensity of the two groups of characteristic peaks was gradually consistent. This indicates that alkali hydrolysis occurs in a peeling reaction, where the cellulose has reducing terminal groups that fall off one by one to gradually degrade the cellulose macromolecule. The cellulose glycosidic bond oxygen atom is protonated to form a carbon-oxygen ion, leading to bond breakage. The undegraded IR spectra of test groups 6 (the slowest degraded film in acid solution) and 12 (the fastest degraded film in alkaline solution) and the IR spectra of immersion in acid and alkaline solutions for 4 d are shown in Figure 15b. According to Figure 15b, there was no obvious change in the infrared characteristic peaks of test group 6 and test group 12 when they were not degraded. After 4 d of degradation in the acid solution, the characteristic peaks of test group 6 remained essentially unchanged. It demonstrated that the acid resistance of test group 6 was better. The characteristic absorption peaks of test group 12 showed a gradual decrease in intensity and a gradual broadening of peak shape. C–H bending vibrational peak near 820 cm−1, C–O stretching vibrational peak at 1100–1300 cm−1 and CH2 bending vibrational peak at 1429 cm−1. The peaks near 1500–1212 cm−1 are C–O stretching vibration peaks [52,53], the peaks near 2956 cm−1 are methyl C–H bond stretching vibration peaks, and –OH stretching vibration peaks at 3500–3300 cm−1 [54]. Breakage of glycosidic bonds and carbon-carbon bonds between carbon atoms in the cellulose molecular chain causes degradation of cellulose. Dry strength and sizing agent dosages somewhat hinder acid attacks on cellulose.
As can be seen from Figure 16, after soaking the fiber film in the alkaline solution for 4 d, white, fine particles appeared on the surface of the film as residual alkali. The film surface was not flat, and obvious cracks appeared. After immersing test group 2 in an alkali solution for 4 d, obvious pores appeared on the surface of the fiber (Figure 16a,b). Figure 16b is an enlarged, clear view of Figure 16a, indicating that the fiber film was gradually degraded in the alkali solution. Test group 12 showed the slowest degradation in the alkali solution. The large cracks on the fiber surface and larger fiber diameters (Figure 16c,d) were attributed to the swelling phenomenon of the amorphous part of the cellulose [55].
From Figure 17, it can be seen that the fiber films were immersed in the acid solution for 4 d. The overall shape of the fibers was clear. The fibers were obviously exposed, and the surface was uneven. It can be seen from the figure that although the surfaces of the two test groups showed more obvious uneven cracks (Figure 17a–d), the surface of test group 12 had deeper and longer cracks, and there was almost no bonding between the fibers. Figure c had more single fibers. The fibers were more resistant to alkali and weak to acid, and soaking in the acid solution caused large cracks in the fibers.
The three degradation mechanisms for the degradation of Salix/wheat straw fiber mulch are shown in Figure 18. The degradation of Salix/wheat straw fiber mulch is mainly the degradation process of cellulose. After the Salix/wheat straw fiber mulching film absorbed enough light energy from ultraviolet radiation, the C–C bond and C–H bond in the cellulose were broken, so that the Salix/wheat straw fiber mulching film was gradually degraded by ultraviolet light. The mechanism of alkaline hydrolysis is the same as that of acidic hydrolysis. In alkaline solution or alkaline solution, the peeling reaction of cellulose occurs, which protonates the oxygen atom of cellulose glycoside and forms carbon cation, resulting in bond breakage, so that the Salix/wheat straw fiber mulch is gradually degraded by acid or alkali.

4. Conclusions

In this work, a Salix/wheat straw fiber degradable film was prepared by Box–Behnken Design. The degradation behavior of the films was systematically investigated under accelerated aging degradation. Under ultraviolet light irradiation, with the increase of degradation time, the tensile strength of the film gradually decreased, the degradation rate gradually increased, the contact angle gradually decreased, and the Δ L and Δ E values gradually increased. Among them, the degradation rate of test group 5 was the highest, reaching 6.66%. The degradation rate of group 12 was the lowest, reaching 2.97%. The results showed that the degradation rate and degree of degradation of Salix/wheat straw fiber composite degradable films could be controlled by adjusting the composition of the dry strengthening agent and sizing agent. This is essential for use as a mulch film for long-term cultivation. In addition, in the process of alkali and acid degradation, the degradation rate of Salix/wheat straw fiber composite film is higher in the acid solution > the alkaline solution. The water absorption of Salix/fiber composite film: The alkaline solution > the acid solution demonstrate a certain degree of resistance to acids and alkalis in the course of use. The chemical structure and surface morphology during the degradation process were characterized by FTIR and SEM. The microscopic changes of the Salix/wheat straw fiber composite degradable film during degradation were further proven. It is proven that the fiber composite film can enrich the application of agricultural waste such as Salix and wheat straw and promote the application of agricultural waste biodegradable film in agricultural production.

Author Contributions

Y.L.: designed this study, performed experiments, analyzed the data, and wrote the manuscript. Q.Z.: methodology and experimentation. B.W.: methodology and experimentation. Z.L.: methodology and experimentation. X.W.: conceptualization, methodology, resources, revised manuscript. All authors have read and agreed to the published version of the manuscript.

Funding

This work was supported by the Natural Science Foundation of the Inner Mongolia Autonomous Region (2021MS03057) and the National Natural Science Foundation of China (21767022).

Institutional Review Board Statement

Not applicable.

Informed Consent Statement

Not applicable.

Data Availability Statement

The data used to support the findings of this study are available from the corresponding author upon request.

Acknowledgments

The authors acknowledge the Natural Science Foundation of Inner Mongolia Autonomous Region (2021MS03057) and the National Natural Science Foundation of China (21767022).

Conflicts of Interest

The authors declare no conflict of interest.

References

  1. Francioni, M.; Kishimoto-Mo, A.W.; Tsuboi, S.; Hoshino, Y.T. Evaluation of the mulch films biodegradation in soil: A methodological review. Ital. J. Agron. 2022, 17, 1125–4718. [Google Scholar] [CrossRef]
  2. Steinmetz, Z.; Wollmann, C.; Schaefer, M.; Buchmann, C.; David, J.; Tröger, J.; Muñoz, K.; Frör, O.; Schaumann, G.E. Plastic mulching in agriculture. Trading short-term agronomic benefits for long-term soil degradation? Sci. Total Environ. 2016, 550, 690–705. [Google Scholar] [CrossRef] [PubMed]
  3. Huang, Y.; Liu, Q.; Jia, W.Q.; Yan, C.; Wang, J. Agricultural plastic mulching as a source of microplastics in the terrestrial environment. Environ. Pollut. 2020, 260, 114096. [Google Scholar] [CrossRef] [PubMed]
  4. Tan, Z.J.; Yi, Y.J.; Wang, H.Y.; Zhou, W.L.; Yang, Y.R.; Wang, C.Y. Physical and degradable properties of mulching films prepared from natural fibers and biodegradable polymers. Appl. Sci. 2016, 6, 147. [Google Scholar] [CrossRef]
  5. Liu, E.K.; He, W.Q.; Yan, C.R. ‘White revolution’ to ‘white pollution’—Agricultural plastic film mulch in China. Environ. Res. Lett. 2014, 9, 091001. [Google Scholar] [CrossRef]
  6. Wan, Y.; Wu, C.X.; Xue, Q.; Hui, X.M.N. Effects of plastic contamination on water evaporation and desiccation cracking in soil. Sci. Total Environ. 2019, 654, 576–582. [Google Scholar] [CrossRef]
  7. Kim, H.M.; Lee, D.K.; Long, N.P.; Kwon, S.W.; Park, J.H. Uptake of nanopolystyrene particles induces distinct metabolic profiles and toxic effects in Caenorhabditis elegans. Environ. Pollut. 2019, 246, 578–586. [Google Scholar] [CrossRef]
  8. Weng, Y.X.; Jin, Y.J.; Meng, Q.Y.; Wang, L.; Zhang, M.; Wang, Y.Z. Biodegradation behavior of poly (butylene adipate-co-terephthalate) (PBAT), poly (lactic acid) (PLA), and their blend under soil conditions. Polym. Test. 2013, 32, 918–926. [Google Scholar] [CrossRef]
  9. Gao, X.H.; Xie, D.; Yang, C. Effects of a PLA/PBAT biodegradable film mulch as a replacement of polyethylene film and their residues on crop and soil environment. Agric. Water Manag. 2021, 255, 107053. [Google Scholar] [CrossRef]
  10. Pan, H.W.; Hao, Y.P.; Zhao, Y.; Lang, X.Z.; Zhang, Y.; Wang, Z.; Zhang, H.L.; Dong, L.S. Improved mechanical properties, barrier properties and degradation behavior of poly (butylenes adipate-co-terephthalate)/poly (propylene carbonate) films. Korean J. Chem. Eng. 2017, 34, 1294–1304. [Google Scholar] [CrossRef]
  11. Shrivastav, A.; Mishra, S.K.; Pancha, I.; Jain, D.; Bhattacharya, S.; Patel, S.; Mishra, S. Biodegradability studies of polyhydroxyalkanoate (PHA) film produced by a marine bacteria using Jatropha biodiesel byproduct as a substrate. World J. Microbiol. Biotechnol. 2011, 27, 1531–1541. [Google Scholar] [CrossRef]
  12. Numata, K.; Abe, H.; Iwata, T. Biodegradability of poly (hydroxyalkanoate) materials. Materials 2009, 2, 1104–1126. [Google Scholar] [CrossRef]
  13. Dar, S.U.; Wu, Z.Z.; Zhang, L.Y.; Yu, P.R.; Qin, Y.H.; Shen, Y.Z.; Zou, Y.F.; Poh, L.; Eichen, Y.; Achmon, Y. On the quest for novel bio-degradable plastics for agricultural field mulching. Front. Bioeng. Biotechnol. 2022, 10, 922974. [Google Scholar] [CrossRef]
  14. Mansoor, Z.; Tchuenbou-Magaia, F.; Kowalczuk, M.; Adamus, G.; Manning, G.; Parati, M.; Radecka, L.; Khan, H. Polymers use as mulch films in agriculture-a review of history, problems and current trends. Polymers 2022, 14, 5062. [Google Scholar] [CrossRef]
  15. Wang, J.H.; Tian, Y.; Zhou, B. Degradation and stabilization of poly (butylene adipate-co-terephthalate)/polyhydroxyalkanoate biodegradable mulch films under different aging tests. J. Polym. Environ. 2022, 30, 1366–1379. [Google Scholar] [CrossRef]
  16. Akhir, M.M.; Zubir, S.A.; Mariatti, J. Effect of different starch contents on physical, morphological, mechanical, barrier, and biodegradation properties of tapioca starch and poly (butylene adipate-co-terephthalate) blend film. Polym. Adv. Technol. 2022, 34, 717–730. [Google Scholar] [CrossRef]
  17. Liu, X.; Chen, C.J.; Sun, X.X.; Wang, X.H. Multicriteria optimization of a novel degradable nonwoven mulch fabricated from recycled natural fibers using CV-TOPSIS technique. Text. Res. J. 2022, 92, 2784–2791. [Google Scholar] [CrossRef]
  18. Kopitar, D.; Marasovi, P.; Jugov, N.; Schwarz, L. Biodegradable nonwoven geotextile and films—A review. Polymers 2022, 14, 2272. [Google Scholar] [CrossRef]
  19. Dentzman, K.E.; Goldberger, J.R. Organic standards, farmers’ perceptions, and the contested case of biodegradable plastic mulch in the United States. J. Rural Stud. 2020, 73, 203–213. [Google Scholar] [CrossRef]
  20. Zhao, Y.; Zhang, F.; Li, L.; Yang, X.J.; Zhang, F.W.; Zhao, W.Y.; He, Q. Substitution Experiment of Biodegradable Paper Mulching Film and White Plastic Mulching Film in Hexi Oasis Irrigation Area. Coatings 2022, 12, 1225. [Google Scholar] [CrossRef]
  21. Liu, B.; Guan, T.H.; Wu, G.; Fu, Y.; Weng, Y.X. Biodegradation behavior of degradable mulch with poly (butylene adipate-co-terephthalate) (PBAT) and poly (butylene succinate) (PBS) in simulation marine environment. Polymers 2022, 14, 1515. [Google Scholar] [CrossRef]
  22. Li, A.L.; Jia, Y.Y.; Zhang, F.Y.; Zhao, Y.M.; Zhang, F.W. The effects of zinc oxide/silicon dioxide composite coating on surface wettability and the mechanical properties of paper mulching film. Coatings 2022, 12, 555. [Google Scholar] [CrossRef]
  23. Lang, Q.; Liu, C.H.; Zhu, X.X.; Zhang, C.; Zhang, S.M.; Li, L.H.; Liu, S.; Chen, H.T. Fabrication and characterization of degradable crop-straw-fiber composite film using in situ polymerization with melamine-urea-formaldehyde prepolymer for agricultural film mulching. Materials 2022, 15, 5170. [Google Scholar] [CrossRef] [PubMed]
  24. Li, H.; Zhao, C.; Han, W.; Jiang, Y.F.; Wang, S. Preparation and research of environment-friendly degradable paper mulching film of cotton stalk fiber. IOP Conf. Ser. Earth Environ. Sci. 2018, 199, 042052. [Google Scholar] [CrossRef]
  25. Ming, X.; Chen, H. Experiment on cultivation performance of plant fiber-based degradable film in paddy field. Appl. Sci. 2020, 10, 495. [Google Scholar] [CrossRef]
  26. Hasan, K.M.F.; Horváth, P.G.; Bak, M.; Le, D.H.A.; Mucsi, Z.M.; Alpar, T. Rice straw and energy reed fibers reinforced phenol formaldehyde resin polymeric biocomposites. Cellulose 2021, 28, 7859–7875. [Google Scholar] [CrossRef]
  27. Lubos, K.; Ivan, K.; Roman, R. New Challenges in wood and wood-based materials. Polymers 2021, 13, 2538. [Google Scholar]
  28. Zhang, Y.; Ju, D.M.; Xing, Z.L.; Zong, H.; Li, L.H.; Chen, H.T.; Liu, S.; Li, R.; Zhang, S.M. Optimization of wheat straw pretreatment process parameters for straw mulch mat. Bioresources 2021, 16, 3827–3839. [Google Scholar] [CrossRef]
  29. Xu, L.; Zheng, Z.Y.; Lou, Z.C.; Jiang, X.Z.; Wang, M.; Chen, G.; Chen, J.W.; Yan, N. Preparation of ultrafine wheat straws with co-milling and its incorporation for biodegradable mulch film production with enhanced performanc. Chem. Eng. J. 2023, 470, 143978. [Google Scholar] [CrossRef]
  30. Tufail, T.; Saeed, F.; Afzaal, M.; Ain, H.B.U.; Gilani, S.A.; Hussain, M.; Anium, F.M. Wheat straw: A natural remedy against different maladies. Food Sci. Nutr. 2021, 9, 2335–2344. [Google Scholar] [CrossRef]
  31. Yang, C.; Huang, Y.Z.; Long, B.B.; Gao, X.H. Effects of biodegradable and polyethylene film mulches and their residues on soil bacterial communities. Environ. Sci. Pollut. Res. 2022, 29, 89698–89711. [Google Scholar] [CrossRef]
  32. GB/T 35795-2017; Biodegradable Mulching Film for Agricultural Uses. Standardization Administration of the P.R.C.: Beijing, China, 2019.
  33. Ma, J. Local Chemical Dissolution Mechanism of Hot Water Pretreated Poplar Hemicelluloses. Ph.D. Thesis, Beijing Forestry University, Beijing, China, 2015. [Google Scholar]
  34. Gess, J.M.; Lund, R.C. Strong-bond/weak-bond theory of sizing. Tappi J. 1991, 74, 111. [Google Scholar]
  35. Zuo, J.D. Calculation of the tableware on the basis of the calculation of labelled surface color system. Timber Ind. 1985, 40, 19–20. [Google Scholar]
  36. Chen, L.; Qiang, T.; Chen, X.; Ren, W.; Zhang, H. Fabrication and evaluation of biodegradable multi-cross-linked mulch film based on waste gelatin. Chem. Eng. J. 2021, 419, 129639. [Google Scholar] [CrossRef]
  37. Xi, Y.; Sun, Y.; Li, W.; Li, W.; Li, Z. Facile fabrication of polysiloxane micro/nanostructure with controllable morphology and super-hydrophobicity. Polymer 2021, 213, 123317. [Google Scholar] [CrossRef]
  38. Nigam, S.; Das, A.K.; Patidar, M.K. Valorization of Parthenium hysterophorus weed for cellulose extraction and its application for bioplastic preparation. J. Environ. Chem. Eng. 2021, 9, 105424. [Google Scholar] [CrossRef]
  39. Wang, K.; Sun, X.Y.; Long, B.B.; Li, F.Y.; Yang, C.; Chen, J.J.; Ma, C.P.; Xie, D.; Wei, Y. Green production of biodegradable mulch films for effective weed control. ACS Omega 2021, 6, 32327–32333. [Google Scholar] [CrossRef]
  40. Bu, L.; Tang, Y.; Gao, Y.; Jian, H.; Jiang, J. Comparative characterization of milled wood lignin from furfural residues and corncob. Chem. Eng. J. 2011, 175, 176–184. [Google Scholar] [CrossRef]
  41. Luo, Y.; Zhao, Z.; Jiang, B.; Wei, M.; Zhang, Z.; Zeng, L.; Clark, J.H.; Fan, J. An integrated process for the valorization of corn stover promoted by NaCl in a GVL/H2O system. Green Chem. 2022, 24, 1515–1526. [Google Scholar] [CrossRef]
  42. Song, Y.; Xu, Y.; Li, D.; Chen, S.; Xu, F. Sustainable and superhydrophobic lignocellulose-based transparent films with efficient light management and self-cleaning. ACS Appl. Mater. Interfaces 2021, 13, 49340–49347. [Google Scholar] [CrossRef]
  43. Feldman, D. Polymer weathering: Photo-oxidation. J. Polym. Environ. 2002, 10, 163–173. [Google Scholar] [CrossRef]
  44. Sari, N.H.; Suteja; Ilyas, R.A.; Syafri, E.; Indran, S. Characterization of the density and mechanical properties of corn husk fiber reinforced polyester composites after exposure to ultraviolet light. Funct. Compos. Struct. 2021, 3, 034001. [Google Scholar] [CrossRef]
  45. Glaus, M.A.; Van Loon, L.R. Degradation of cellulose under alkaline conditions: New insights from a 12 years degradation study. Environ. Sci. Technol. 2008, 42, 2906–2911. [Google Scholar] [CrossRef] [PubMed]
  46. Spirk, S.; Pääkkönen, T.; Viljanen, M.; Svedström, K.; Pitkänen, L.; Awais, M.; Kontturi, E. Visualizing degradation of cellulose nanofibers by acid hydrolysis. Biomacromolecules 2021, 22, 1399–1405. [Google Scholar]
  47. Knill, C.J.; Kennedy, J.F. Degradation of cellulose under alkaline conditions. Carbohydr. Polym. 2003, 51, 281–300. [Google Scholar] [CrossRef]
  48. Mozdyniewicz, D.J.; Nieminen, K.; Sixta, H. Alkaline steeping of dissolving pulp. Part I: Cellulose degradation kinetics. Cellulose 2013, 20, 1437–1451. [Google Scholar] [CrossRef]
  49. Chang, Y.H.; Lin, C.L.; Hsu, Y.H.; Lin, J.H. Medium effect on acid degradation of cotton and wood celluloses. Ind. Crops Prod. 2021, 167, 113540. [Google Scholar] [CrossRef]
  50. Ruggero, F.; Carretti, E.; Gori, R.; Lotti, T.; Lubello, C. Monitoring of degradation of starch-based biopolymer film under different composting conditions, using TGA, FTIR and SEM analysis. Chemosphere 2020, 246, 125770. [Google Scholar] [CrossRef]
  51. Isak, I.; Patel, M.; Riddell, M.; West, M.; Bowers, T.; Wijeyekoon, S.; Lloyd, J. Quantification of polyhydroxyalkanoates in mixed and pure cultures biomass by Fourier transform infrared spectroscopy: Comparison of different approaches. Lett. Appl. Microbiol. 2016, 63, 139–146. [Google Scholar] [CrossRef]
  52. Qi, R.; Jones, D.L.; Liu, Q.Y.; Liu, Q. Field test on the biodegradation of poly (butylene adipate-co-terephthalate) based mulch films in soil. Polym. Test. 2021, 93, 107009. [Google Scholar] [CrossRef]
  53. Copinet, A.; Bertrand, C.; Govindin, S.; Coma, V.; Couturier, Y. Effects of ultraviolet light (315 nm), temperature and relative humidity on the degradation of polylactic acid plastic films. Chemosphere 2004, 55, 763–773. [Google Scholar] [CrossRef] [PubMed]
  54. Pitter, P. Determination of biological degradability of organic compounds. Chem. Listy 1971, 65, 897. [Google Scholar]
  55. Oudiani, A.E.; Chaabouni, Y.; Msahli, S.; Sakli, F. Crystal transition from cellulose I to cellulose II in NaOH treated Agave americana L. fiber. Carbohydr. Polym. 2011, 86, 1221–1229. [Google Scholar] [CrossRef]
Figure 1. (a) The preparation process of Salix fiber pulp and wheat straw fiber pulp; (b) The forming process of Salix/wheat straw fiber degradable film.
Coatings 13 01803 g001
Figure 2. (a) Photodegradation rates for groups 1–7; (b) Photodegradation rates for groups 8–14.
Coatings 13 01803 g002
Figure 3. (a) Trends in tensile strength of groups 1–7; (b) Trends in tensile strength of groups 8–14.
Coatings 13 01803 g003
Figure 4. (a) Trends in Δ L of groups 1–7; (b) Trends in Δ L of groups 8–14.
Coatings 13 01803 g004
Figure 5. (a) Trends in Δ E of groups 1–7; (b) Trends in Δ E of groups 8–14.
Coatings 13 01803 g005
Figure 6. (a) Trends in contact angle for group 5; (b) Trends in contact angle for group 12.
Coatings 13 01803 g006
Figure 7. (a) Thickness of fiber-degradable films when not degraded; (b) Thickness of fiber-degradable films after 40 d of degradation.
Coatings 13 01803 g007
Figure 8. (a) Infrared spectra of test group 5; (b) Infrared spectra of test group 12.
Coatings 13 01803 g008
Figure 9. SEM images of different degradation periods in group 5 (a) undegraded image at 3000 times magnification (b) undegraded image at 12,500 times magnification (c) degraded 12 d image at 3000 times magnification (d) degraded 12 d image at 12,500 times magnification (e) degraded 26 d image at 3000 times magnification (f) degraded 26 d image at 12,500 times magnification (g) degraded 40 d image at 3000 times magnification (h) degraded 40 d image at 12,500 times magnification.
Coatings 13 01803 g009
Figure 10. SEM images of different degradation periods in group 12 (a) undegraded image at 3000 times magnification (b) undegraded image at 12,500 times magnification (c) degraded 12 d image at 3000 times magnification (d) degraded 12 d image at 12,500 times magnification (e) degraded 26 d image at 3000 times magnification (f) degraded 26 d image at 12,500 times magnification (g) degraded 40 d image at 3000 times magnification (h) degraded 40 d image at 12,500 times magnification.
Coatings 13 01803 g010
Figure 11. Degradation rate of group 14 films in alkaline solutions.
Coatings 13 01803 g011
Figure 12. Degradation rate of group 14 films in acid solutions.
Coatings 13 01803 g012
Figure 13. Changes in water absorption at different degradation times of group 14 films in alkaline solutions (a) degradation 1 d, (b) degradation 2 d, (c) degradation 3 d, and (d) degradation 4 d.
Coatings 13 01803 g013
Figure 14. Changes in water absorption at different degradation times of group 14 films in acid solutions (a) degradation 1 d, (b) degradation 2 d, (c) degradation 3 d, and (d) degradation 4 d.
Coatings 13 01803 g014
Figure 15. (a) Infrared spectra of test group films in alkaline solutions, (b) Infrared spectra of the films of the test group in acid solutions.
Coatings 13 01803 g015
Figure 16. SEM images of the film after 4 d immersion in alkaline solutions (a) The fastest degrading group 2 film is magnified 3000 times, (b) The fastest degrading group 2 film is magnified 12,500 times, (c) The slowest degrading group 12 film is magnified 3000 times; and, (d) The slowest degrading group 12 film is magnified 12,500 times.
Coatings 13 01803 g016
Figure 17. SEM images of the film after 4 d of immersion in acid solutions (a) The slowest degrading group 6 film is magnified 3000 times, (b) The slowest degrading group 6 film is magnified 12,500 times, (c) The fastest degrading group 12 film is magnified 3000 times; and (d) The fastest degrading group 12 film is magnified 12,500 times.
Coatings 13 01803 g017
Figure 18. The degradation mechanism of Salix/wheat straw fiber degradable film.
Coatings 13 01803 g018
Table 1. Experimental factors and coding levels (%).
NumberCationic Polyacrylamide (CPAM)Alkyl Ketene Dimer (AKD)Wax Emulsion (CAS)
−10.20.42
011.56
11.82.610
Table 2. Film trial design options (%).
NumberCationic Polyacrylamide (CPAM)Alkyl Ketene Dimer (AKD)Wax Emulsion (CAS)
11.81.510
21.82.66
311.56
41.80.46
512.610
60.22.66
70.21.510
81.81.52
911.56
1012.52
1110.410
1210.42
130.21.52
140.20.46
Disclaimer/Publisher’s Note: The statements, opinions and data contained in all publications are solely those of the individual author(s) and contributor(s) and not of MDPI and/or the editor(s). MDPI and/or the editor(s) disclaim responsibility for any injury to people or property resulting from any ideas, methods, instructions or products referred to in the content.

