.jpg)

Preparation of Conductive and Corrosion Resistant Phosphate Conversion Coating on AZ91D Magnesium Alloy
Abstract
:1. Introduction
2. Materials and Methods
2.1. Sample Preparation
2.2. Surface Characterization
2.3. Electrical Contact Resistance (ECR) Measurement
2.4. Corrosion Tests
3. Results and Discussion
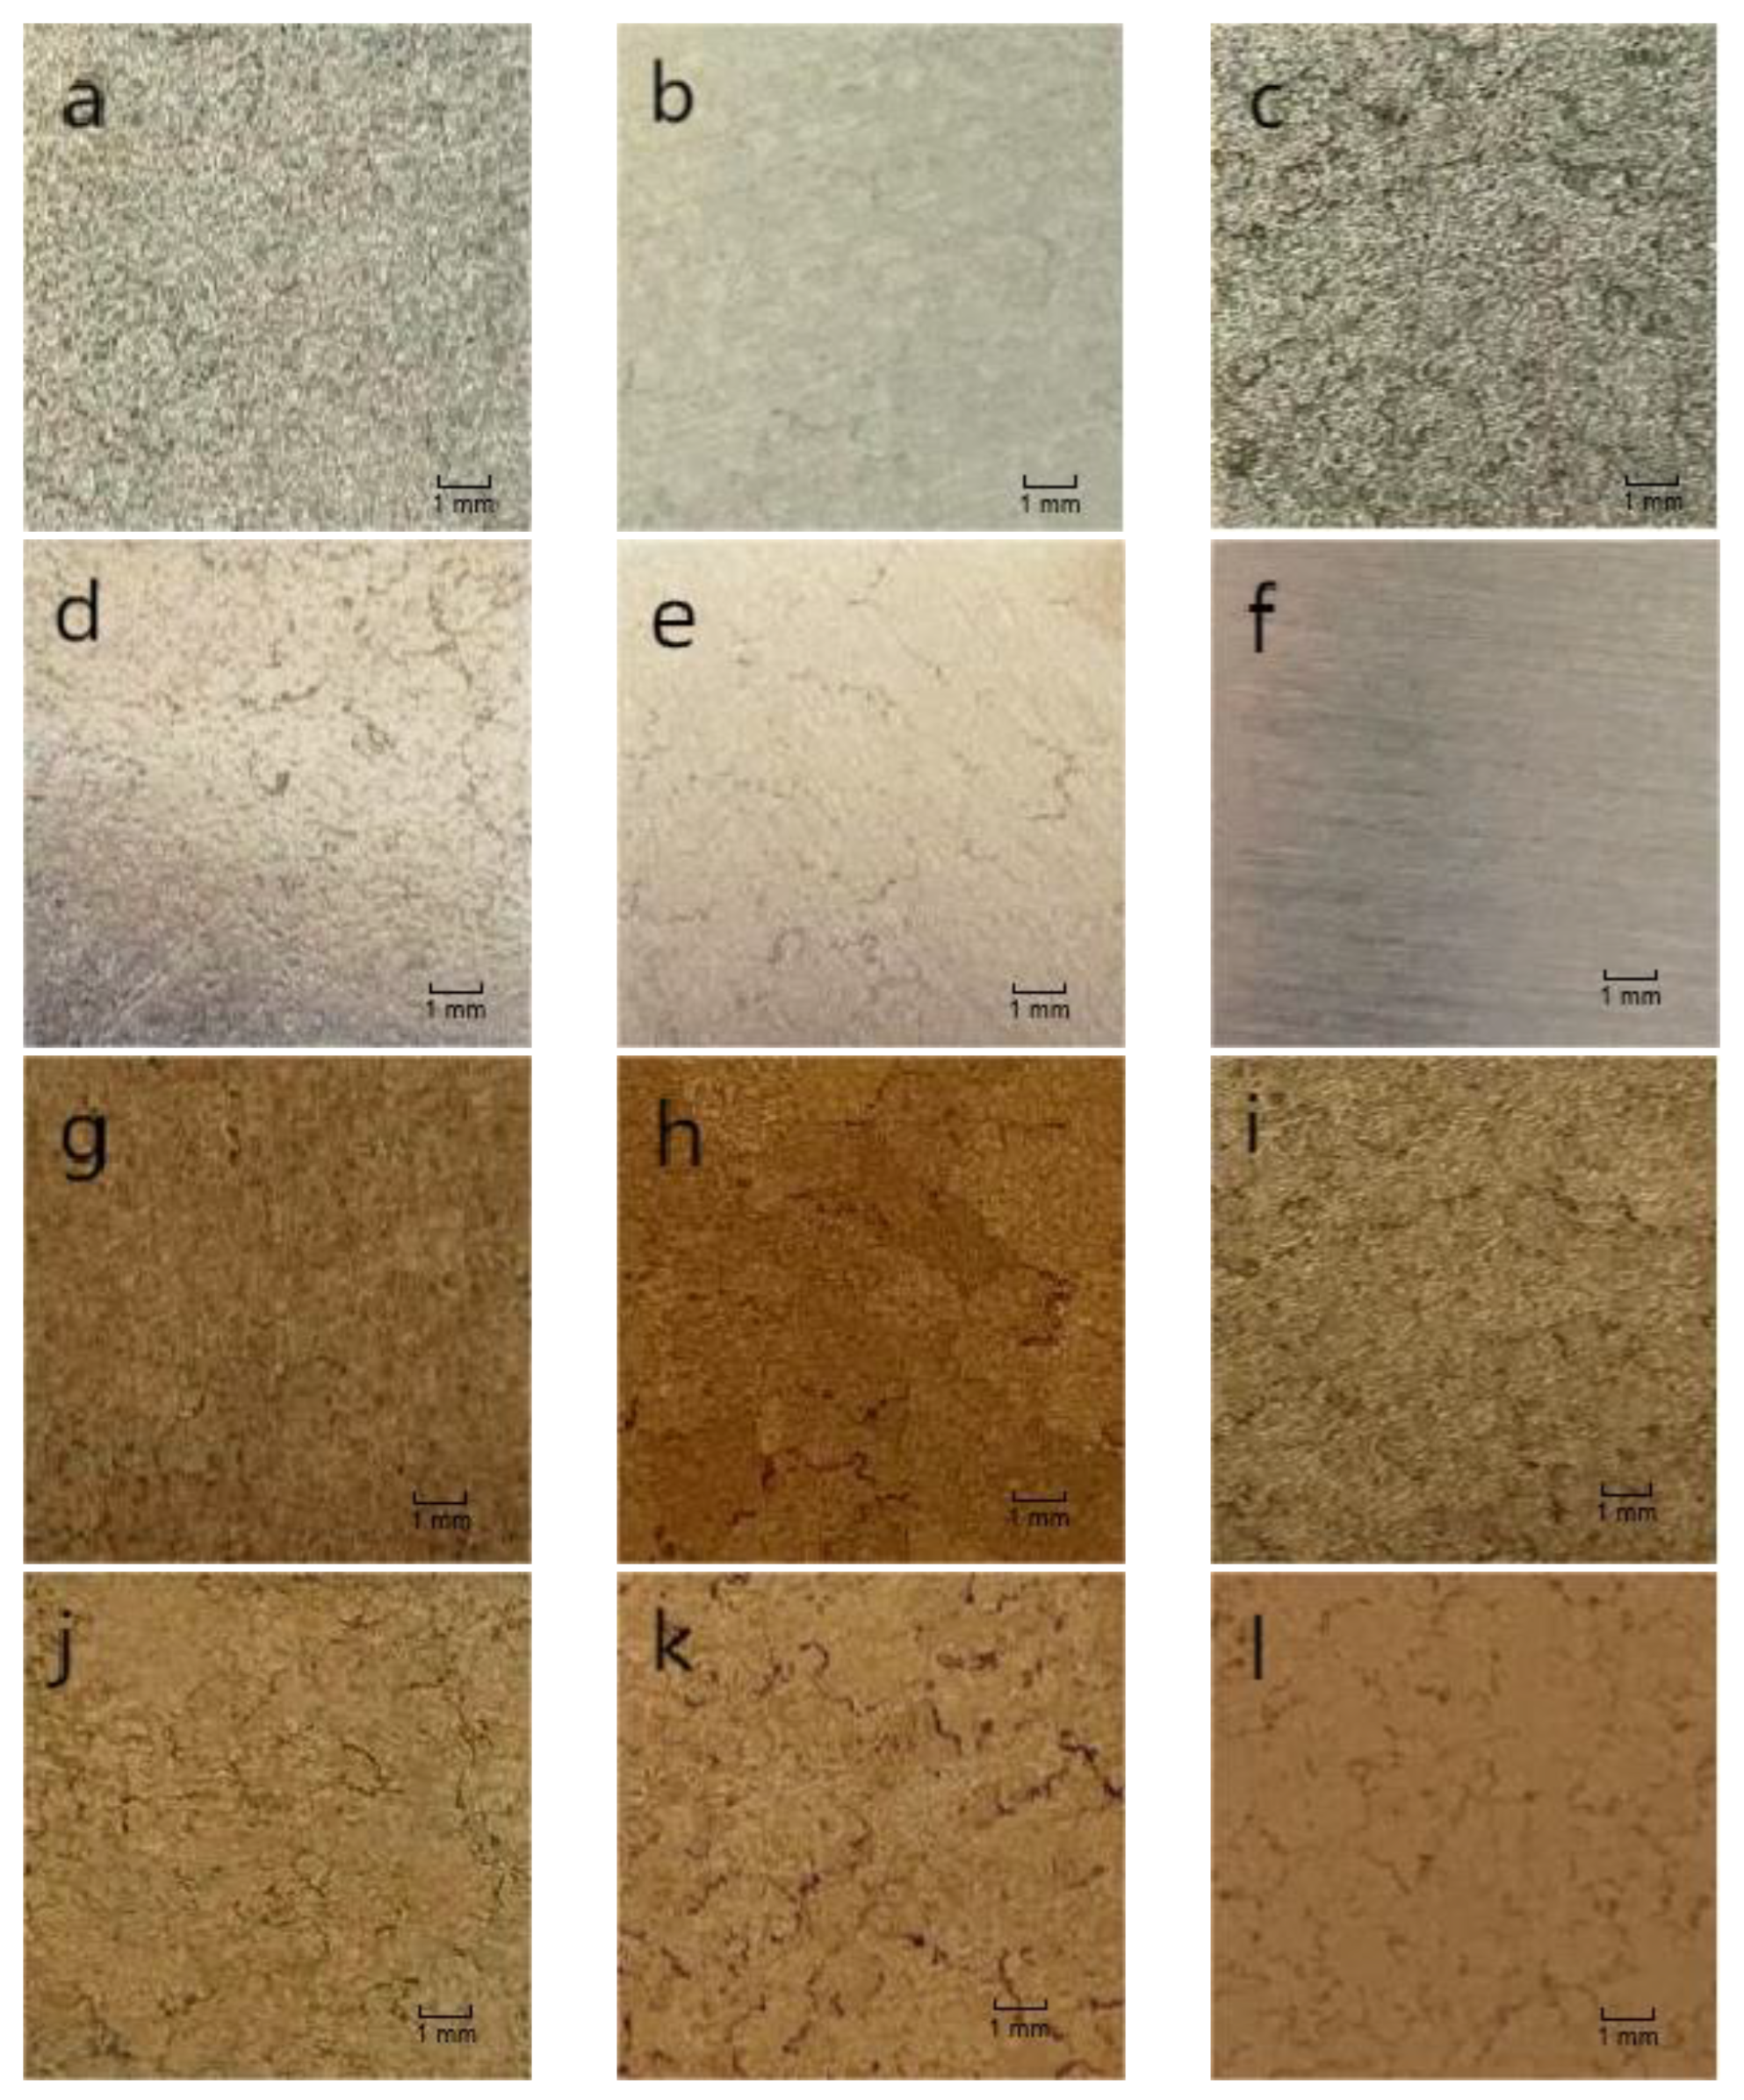
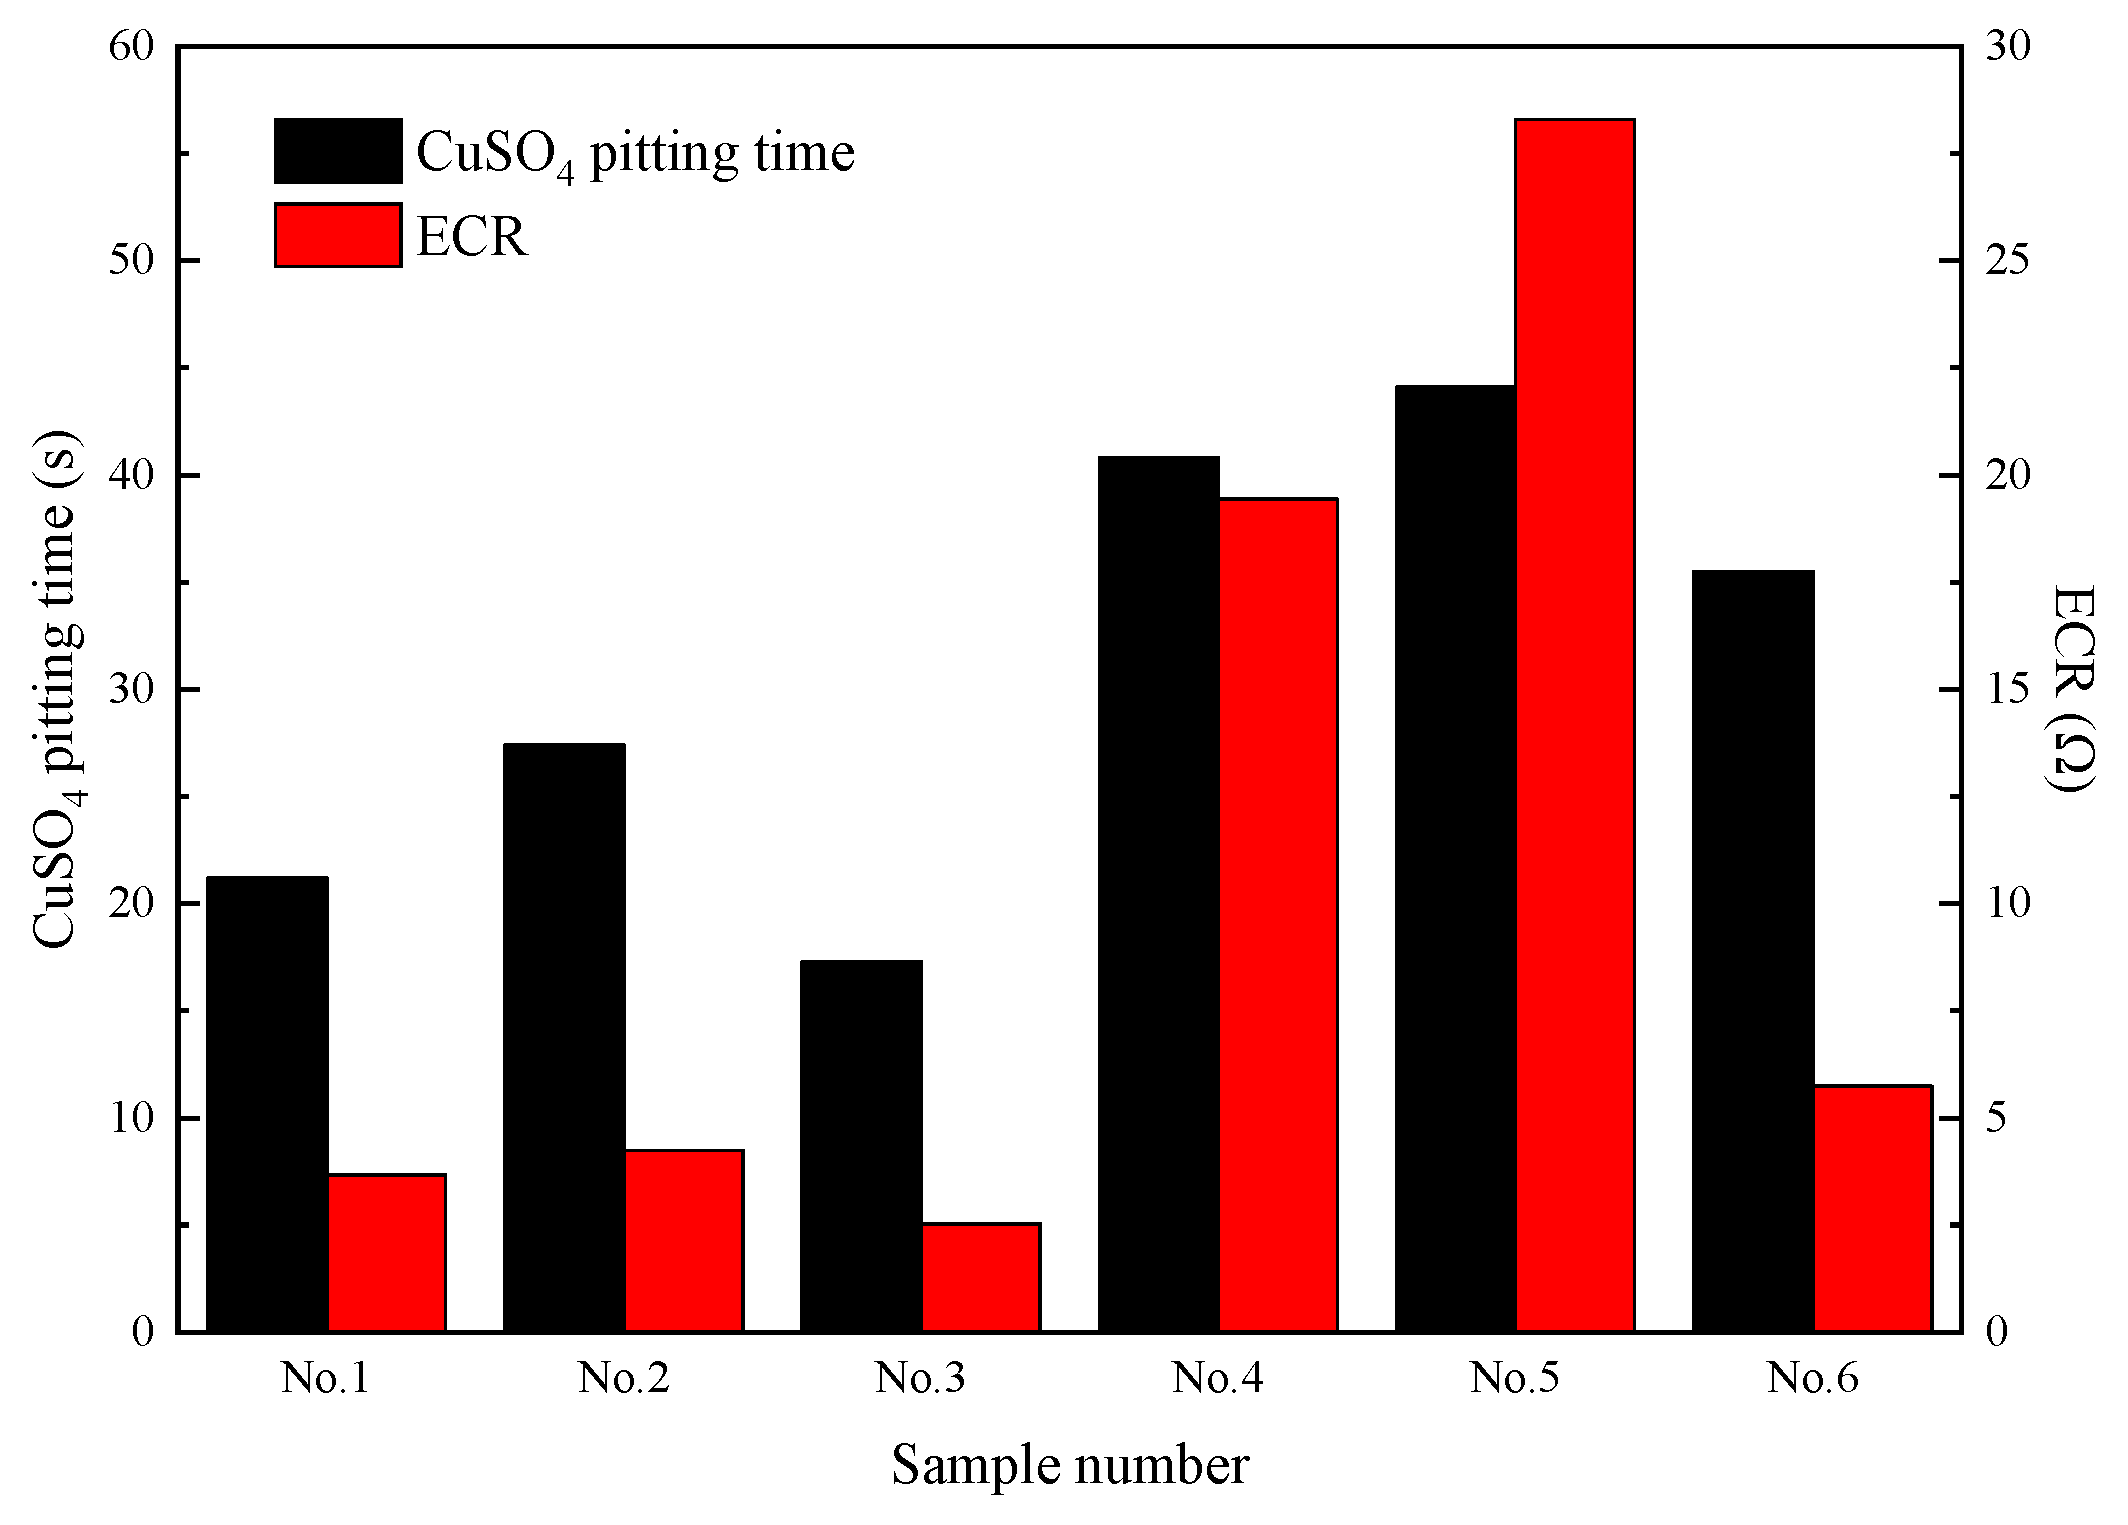
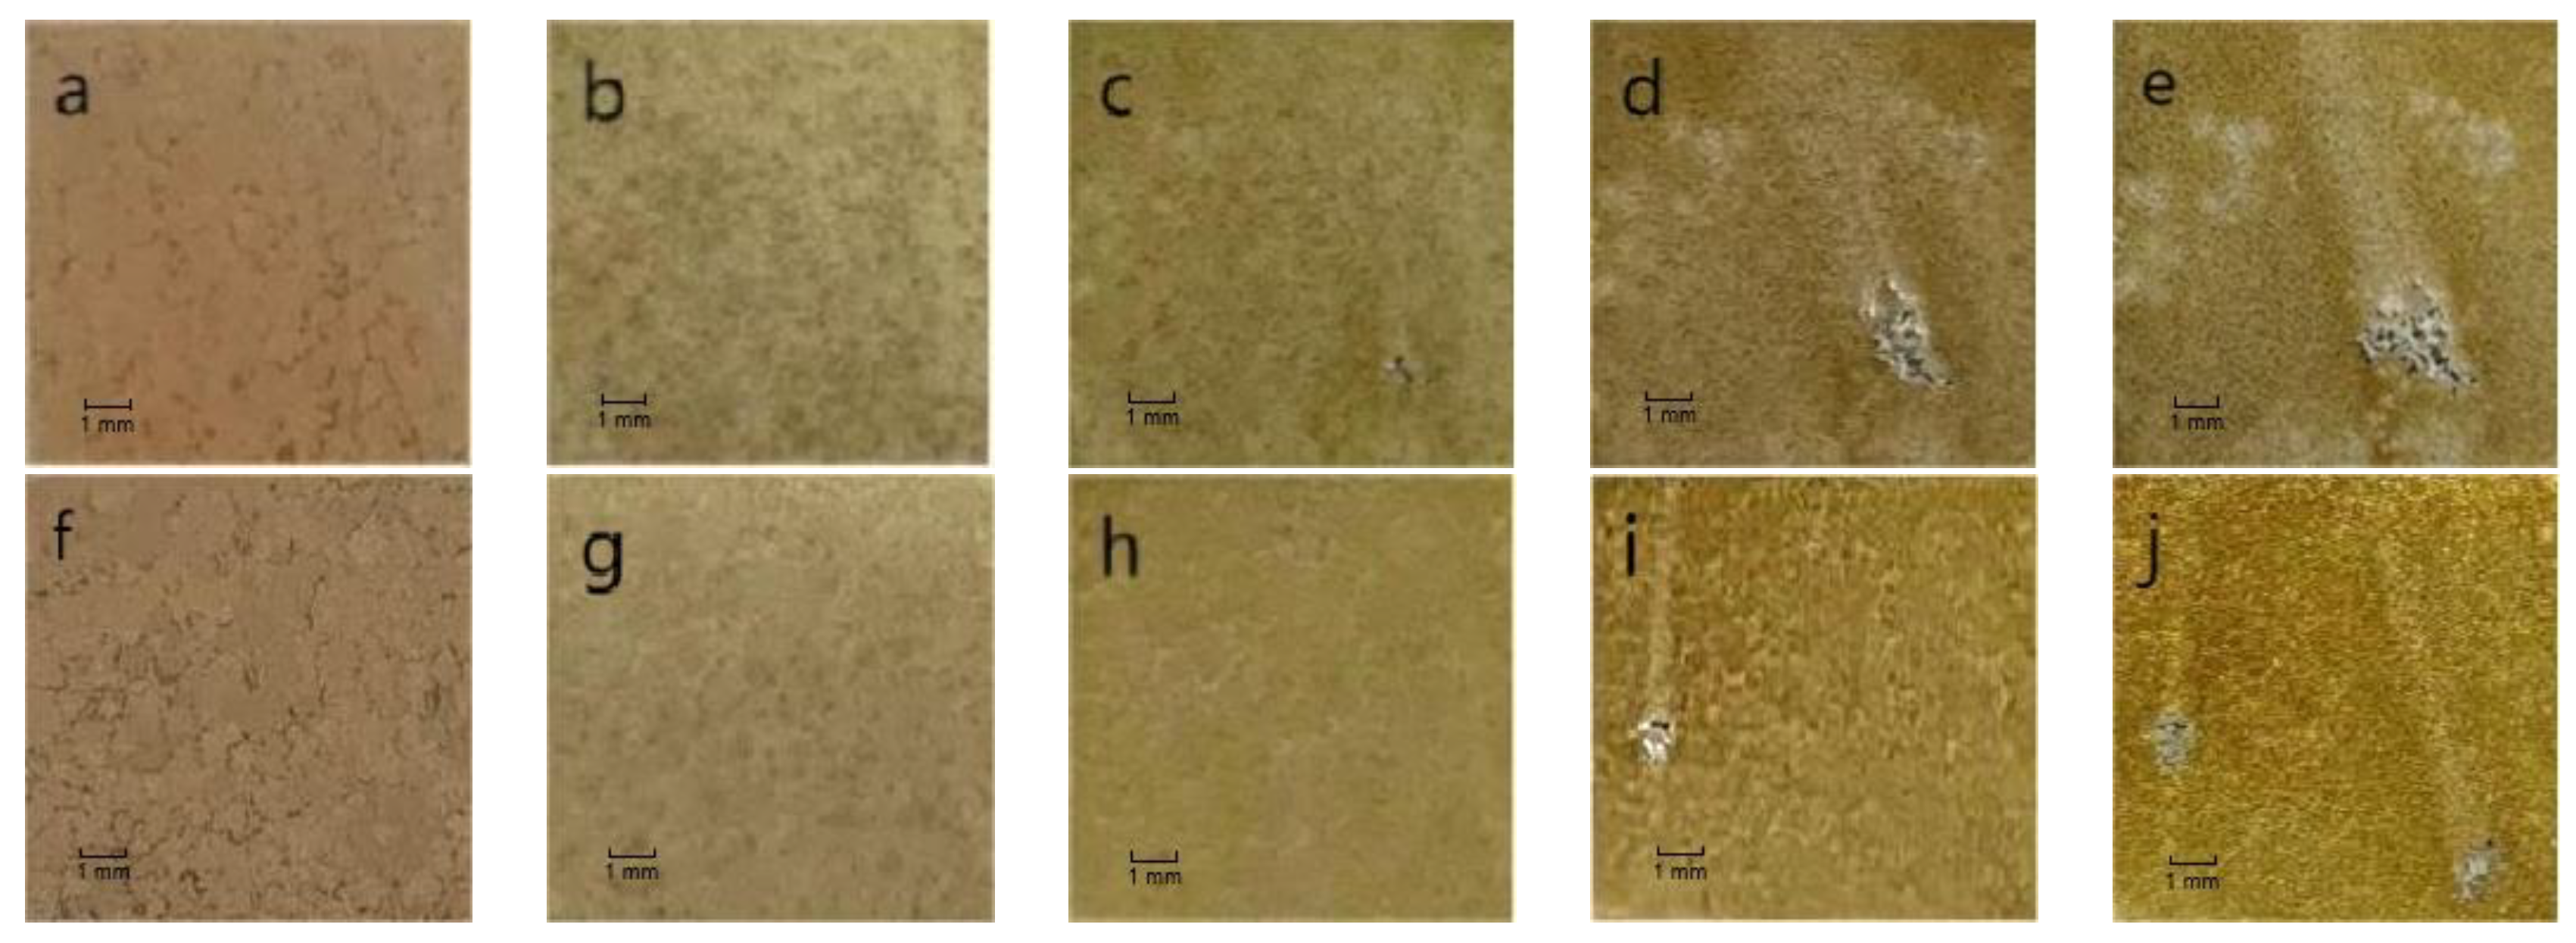
3.1. Effect of Pretreatment
3.2. Effect of Strong Oxidant
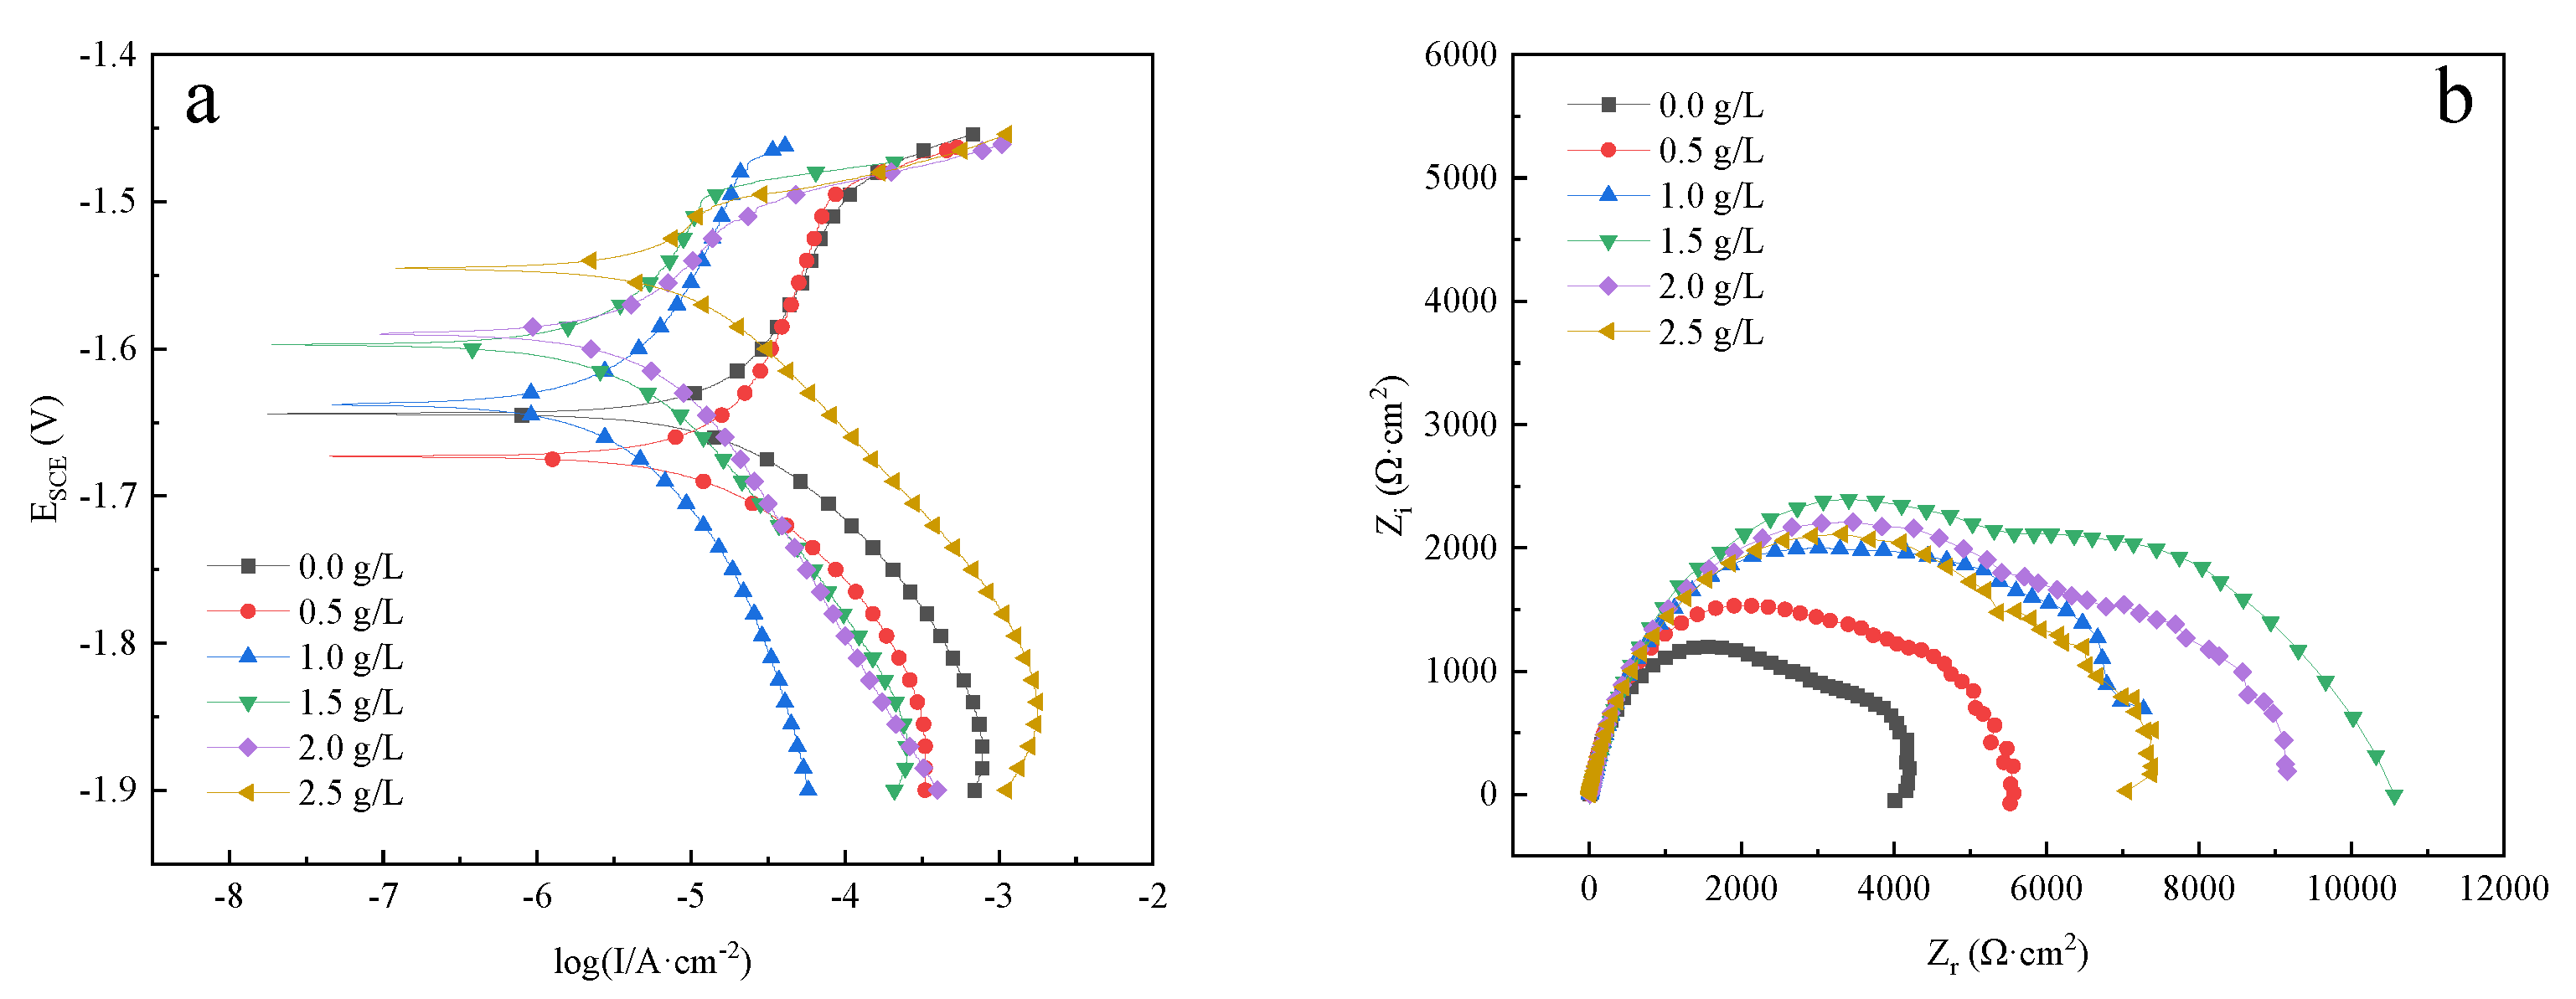
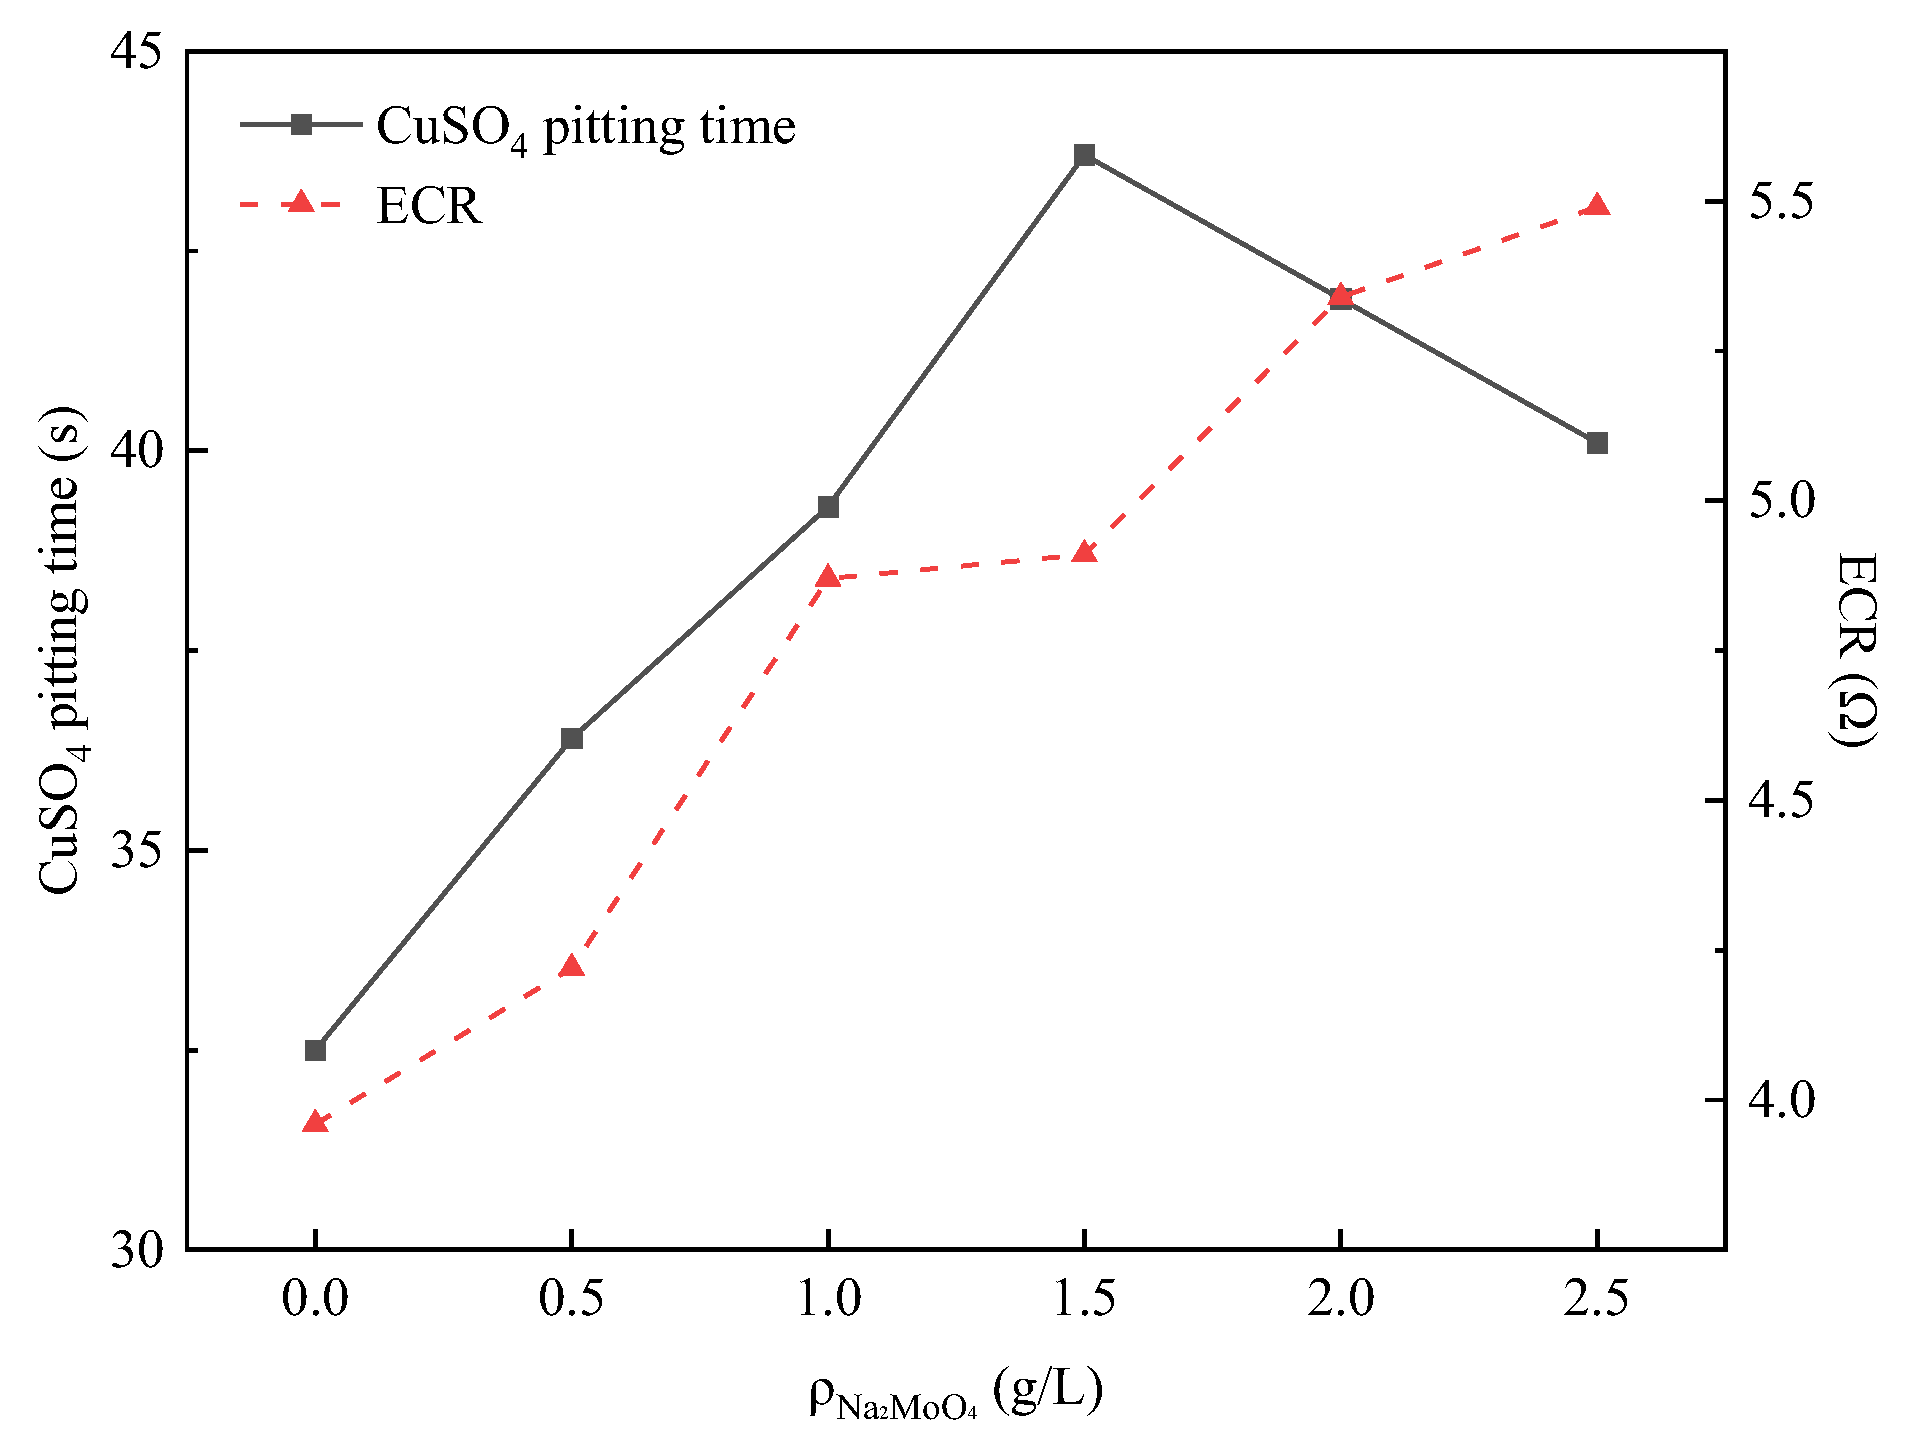
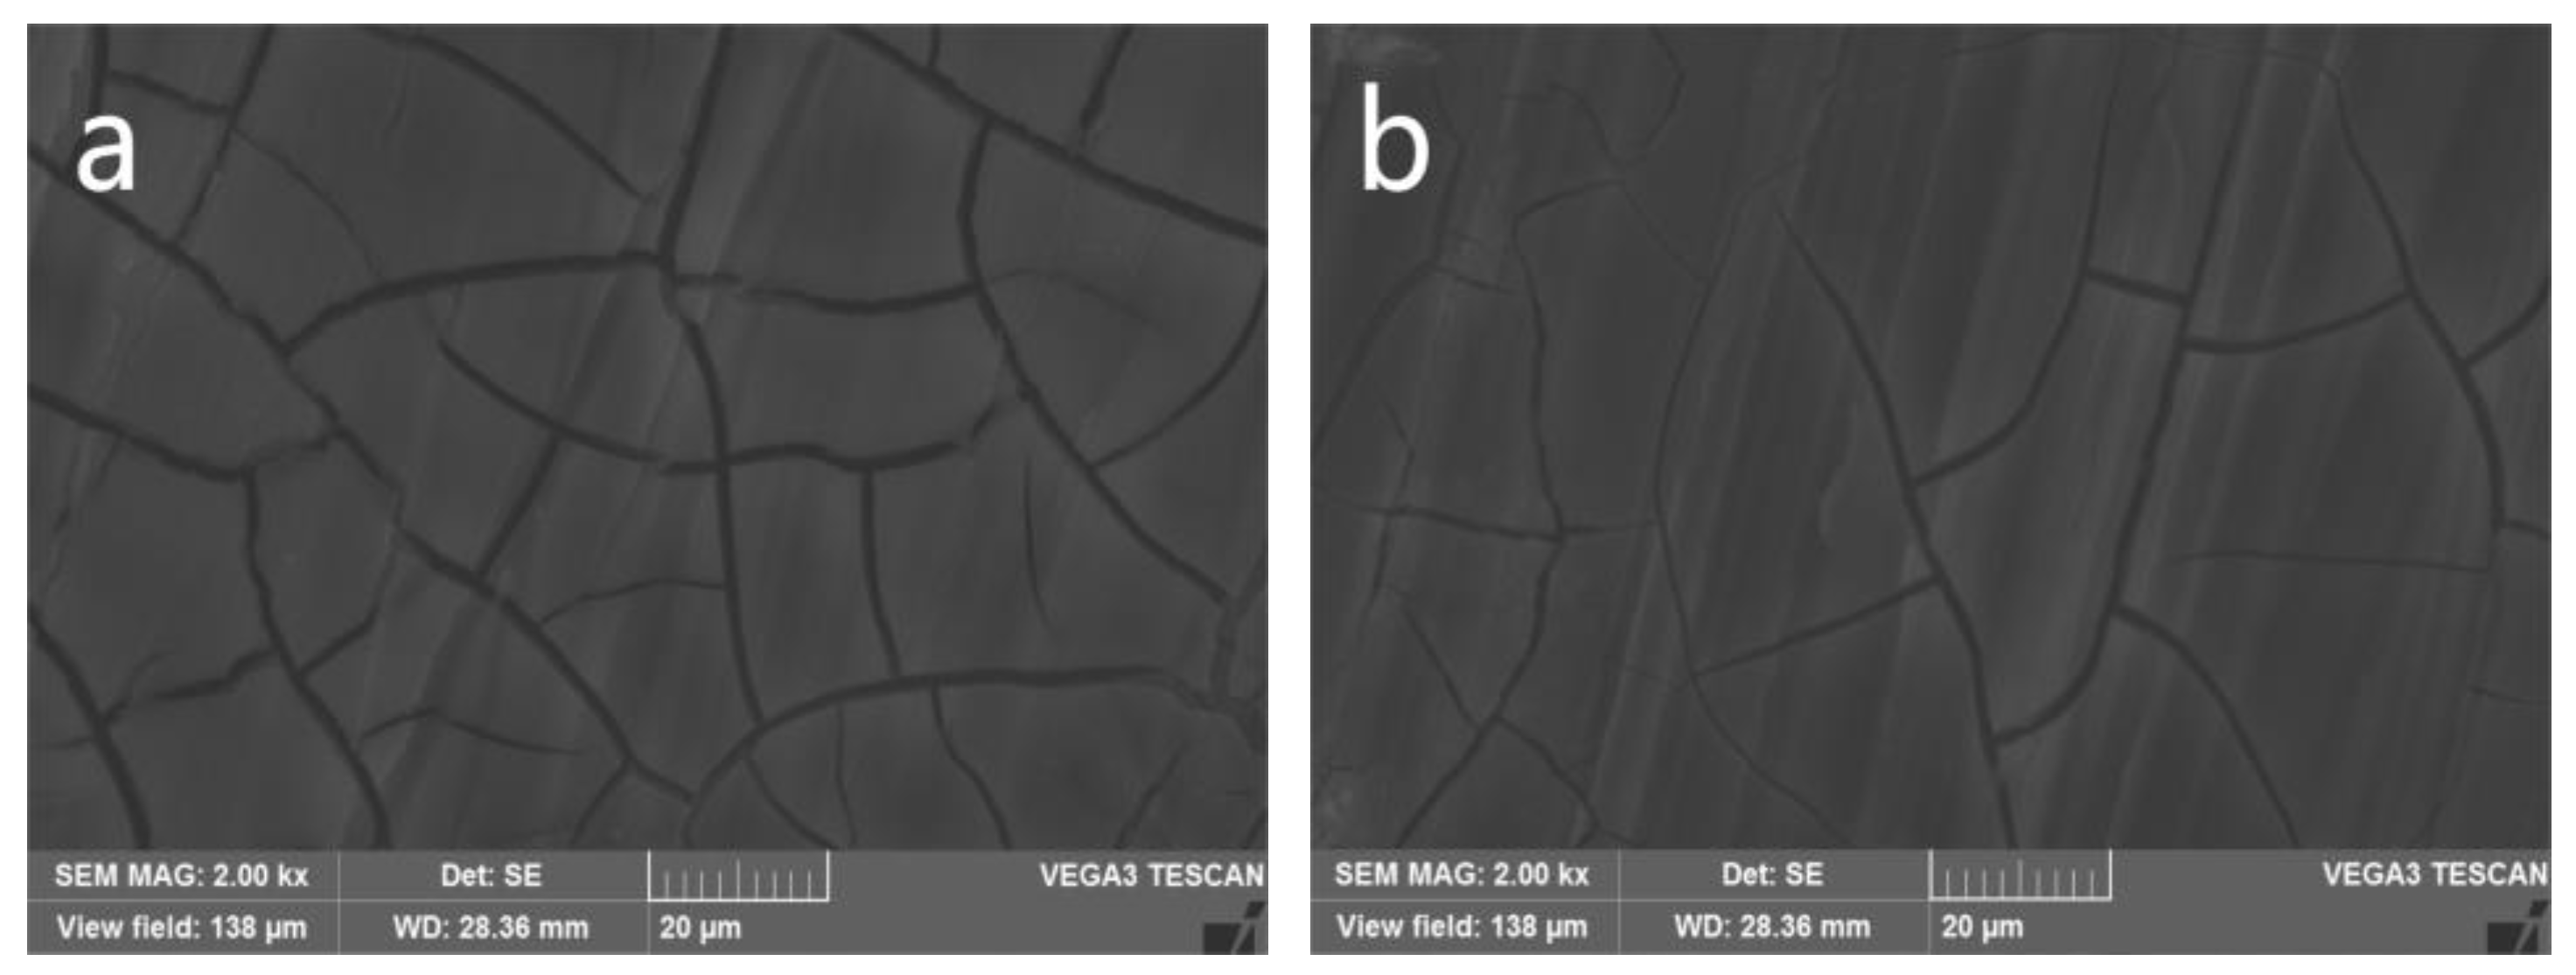
3.3. Effect of Additive
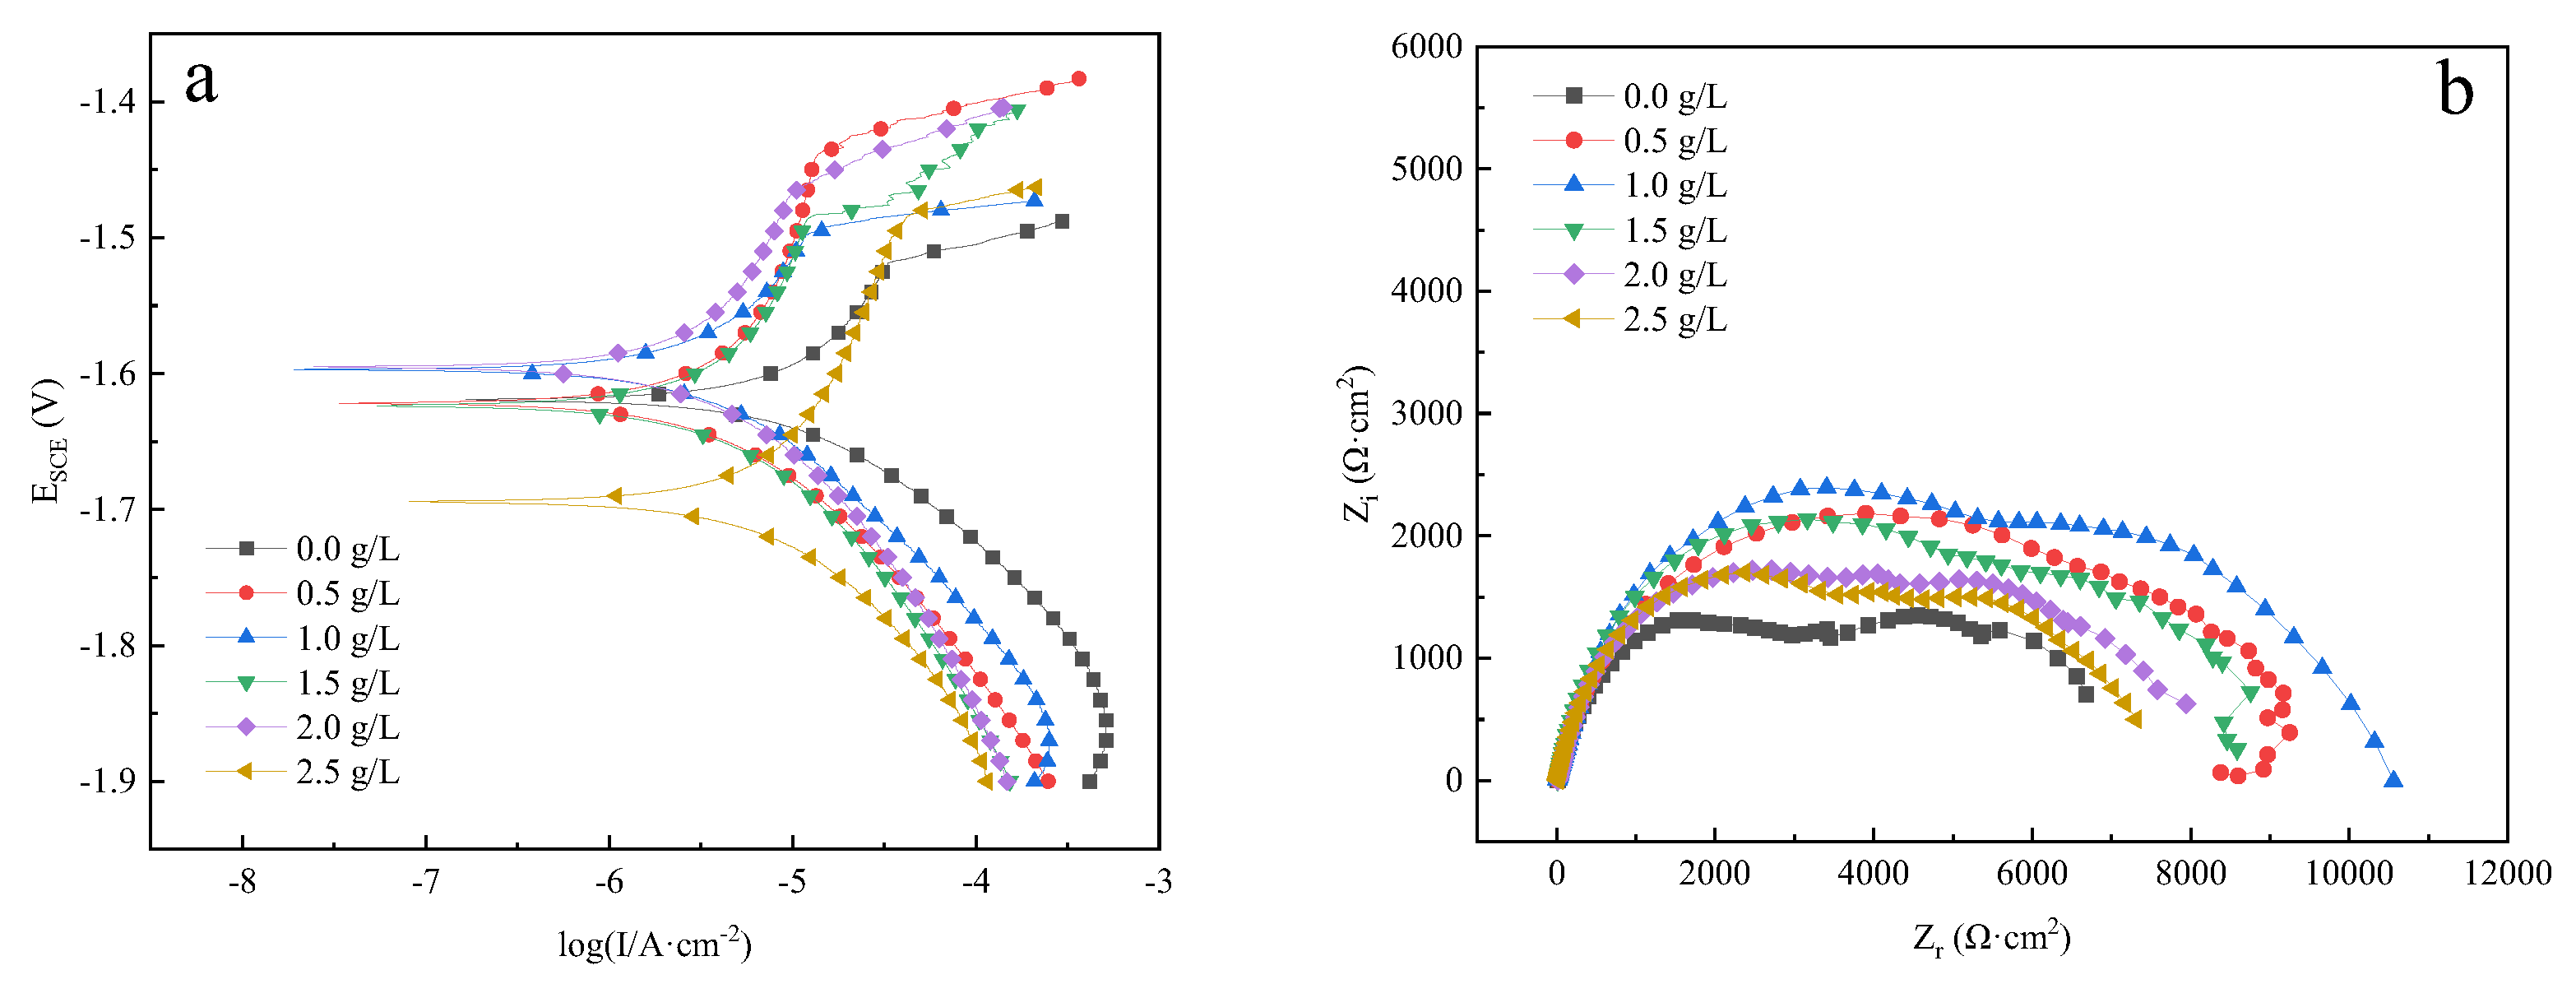
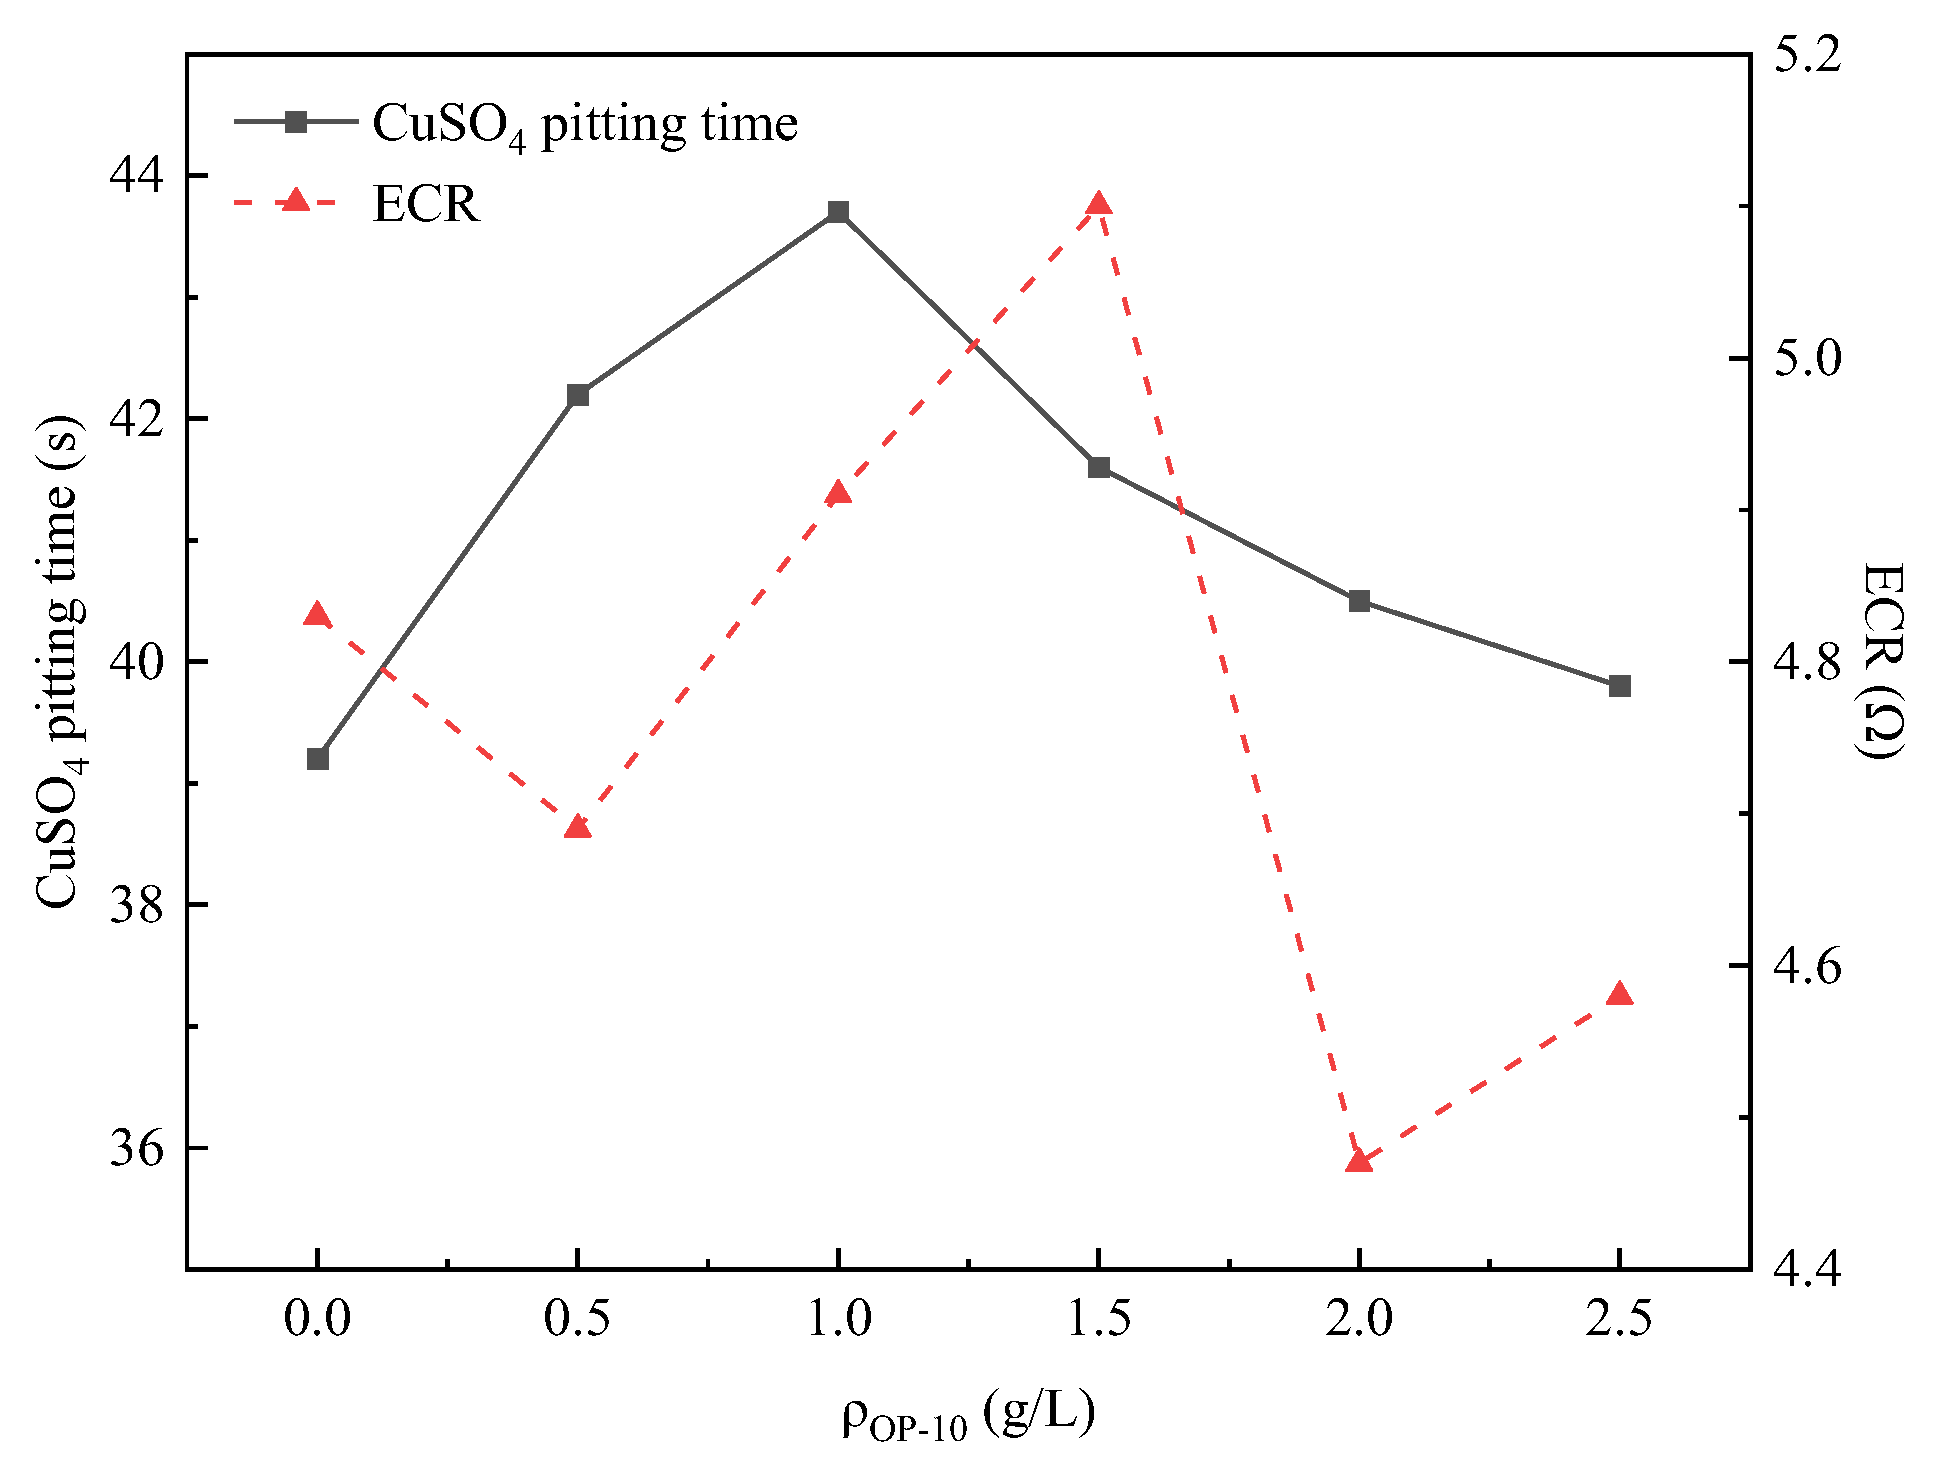
3.4. Effect of Surface-Active Agent
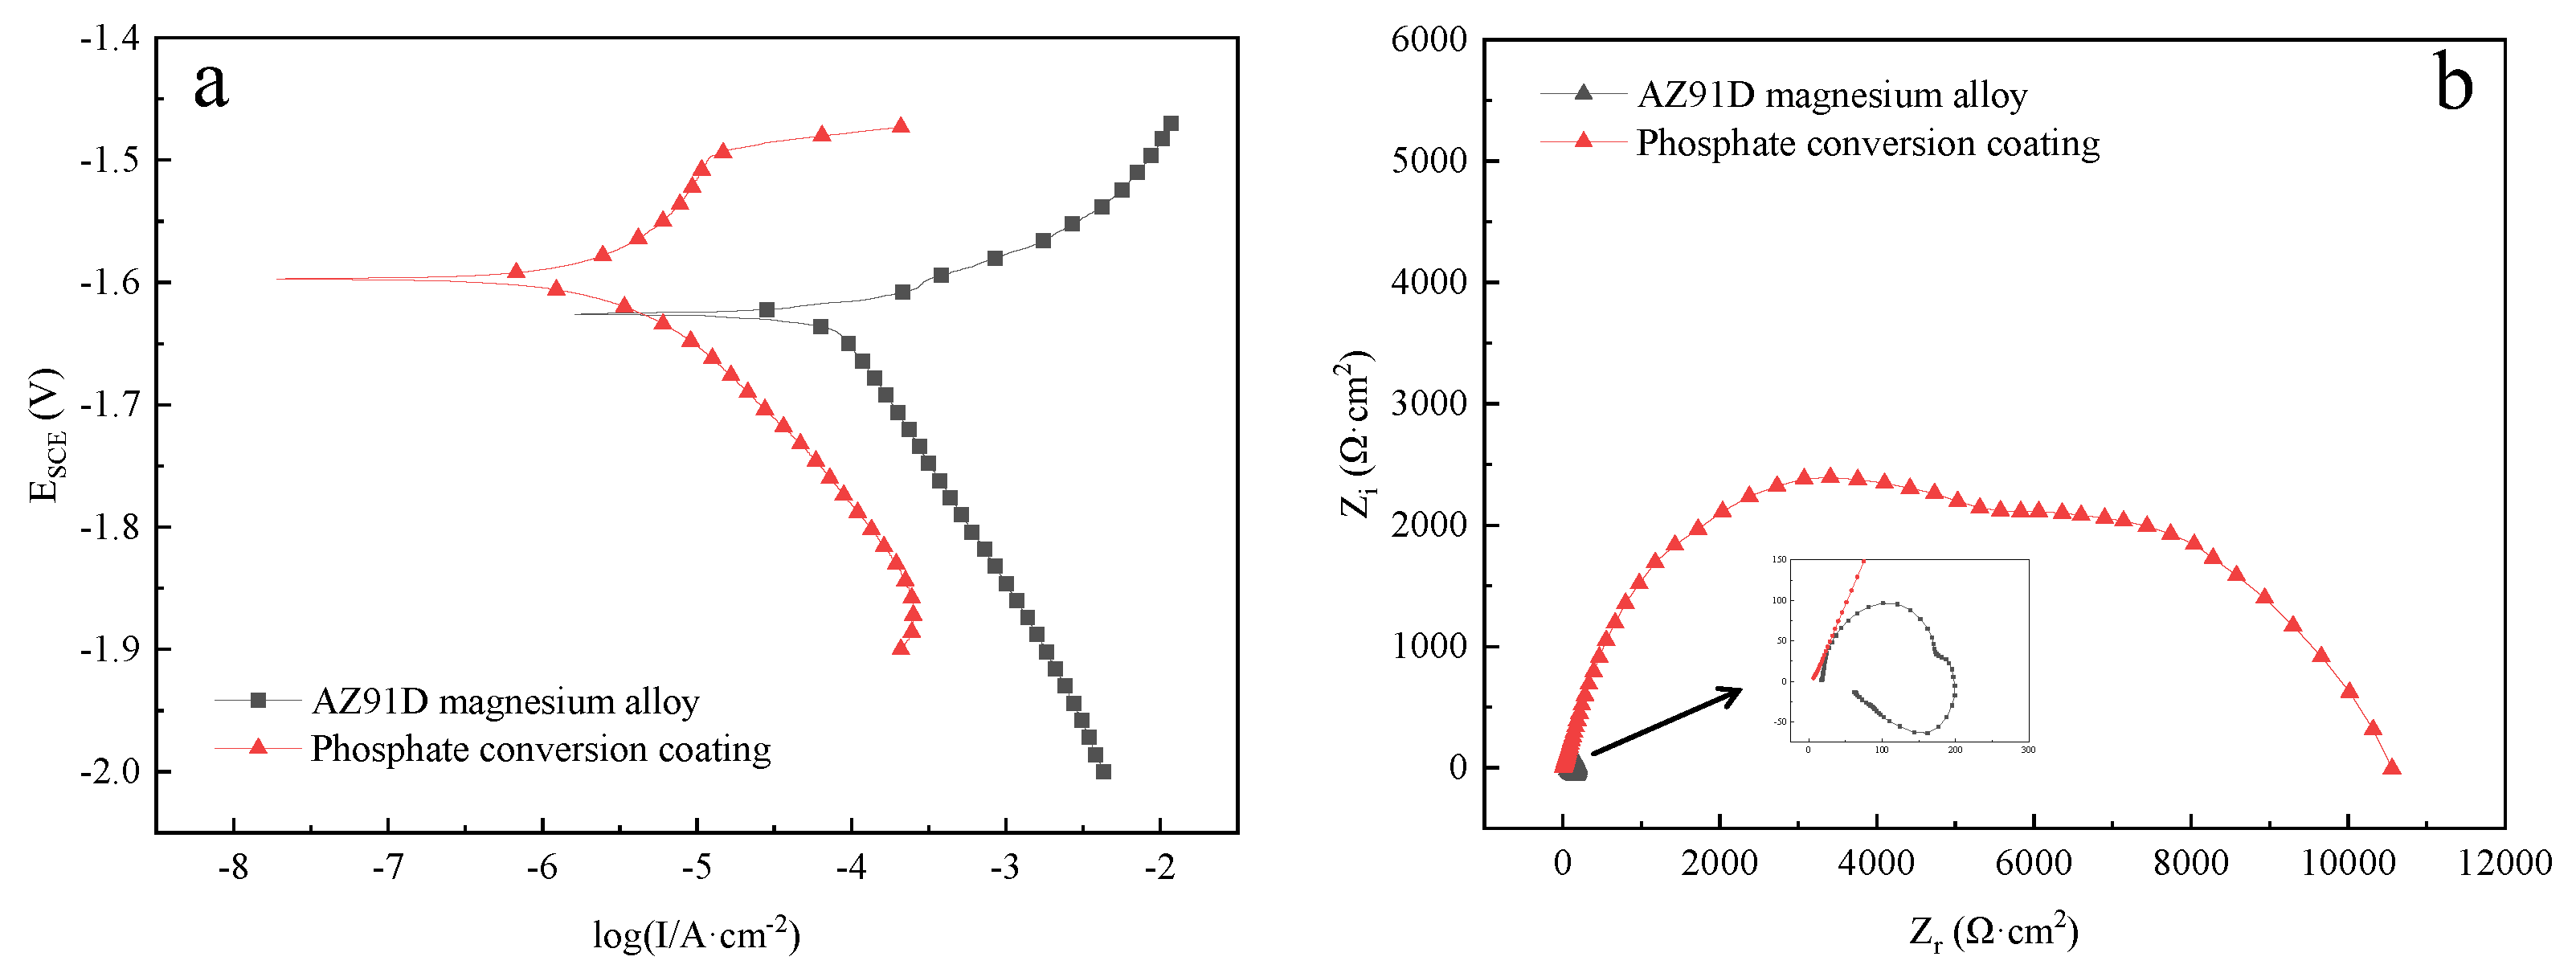
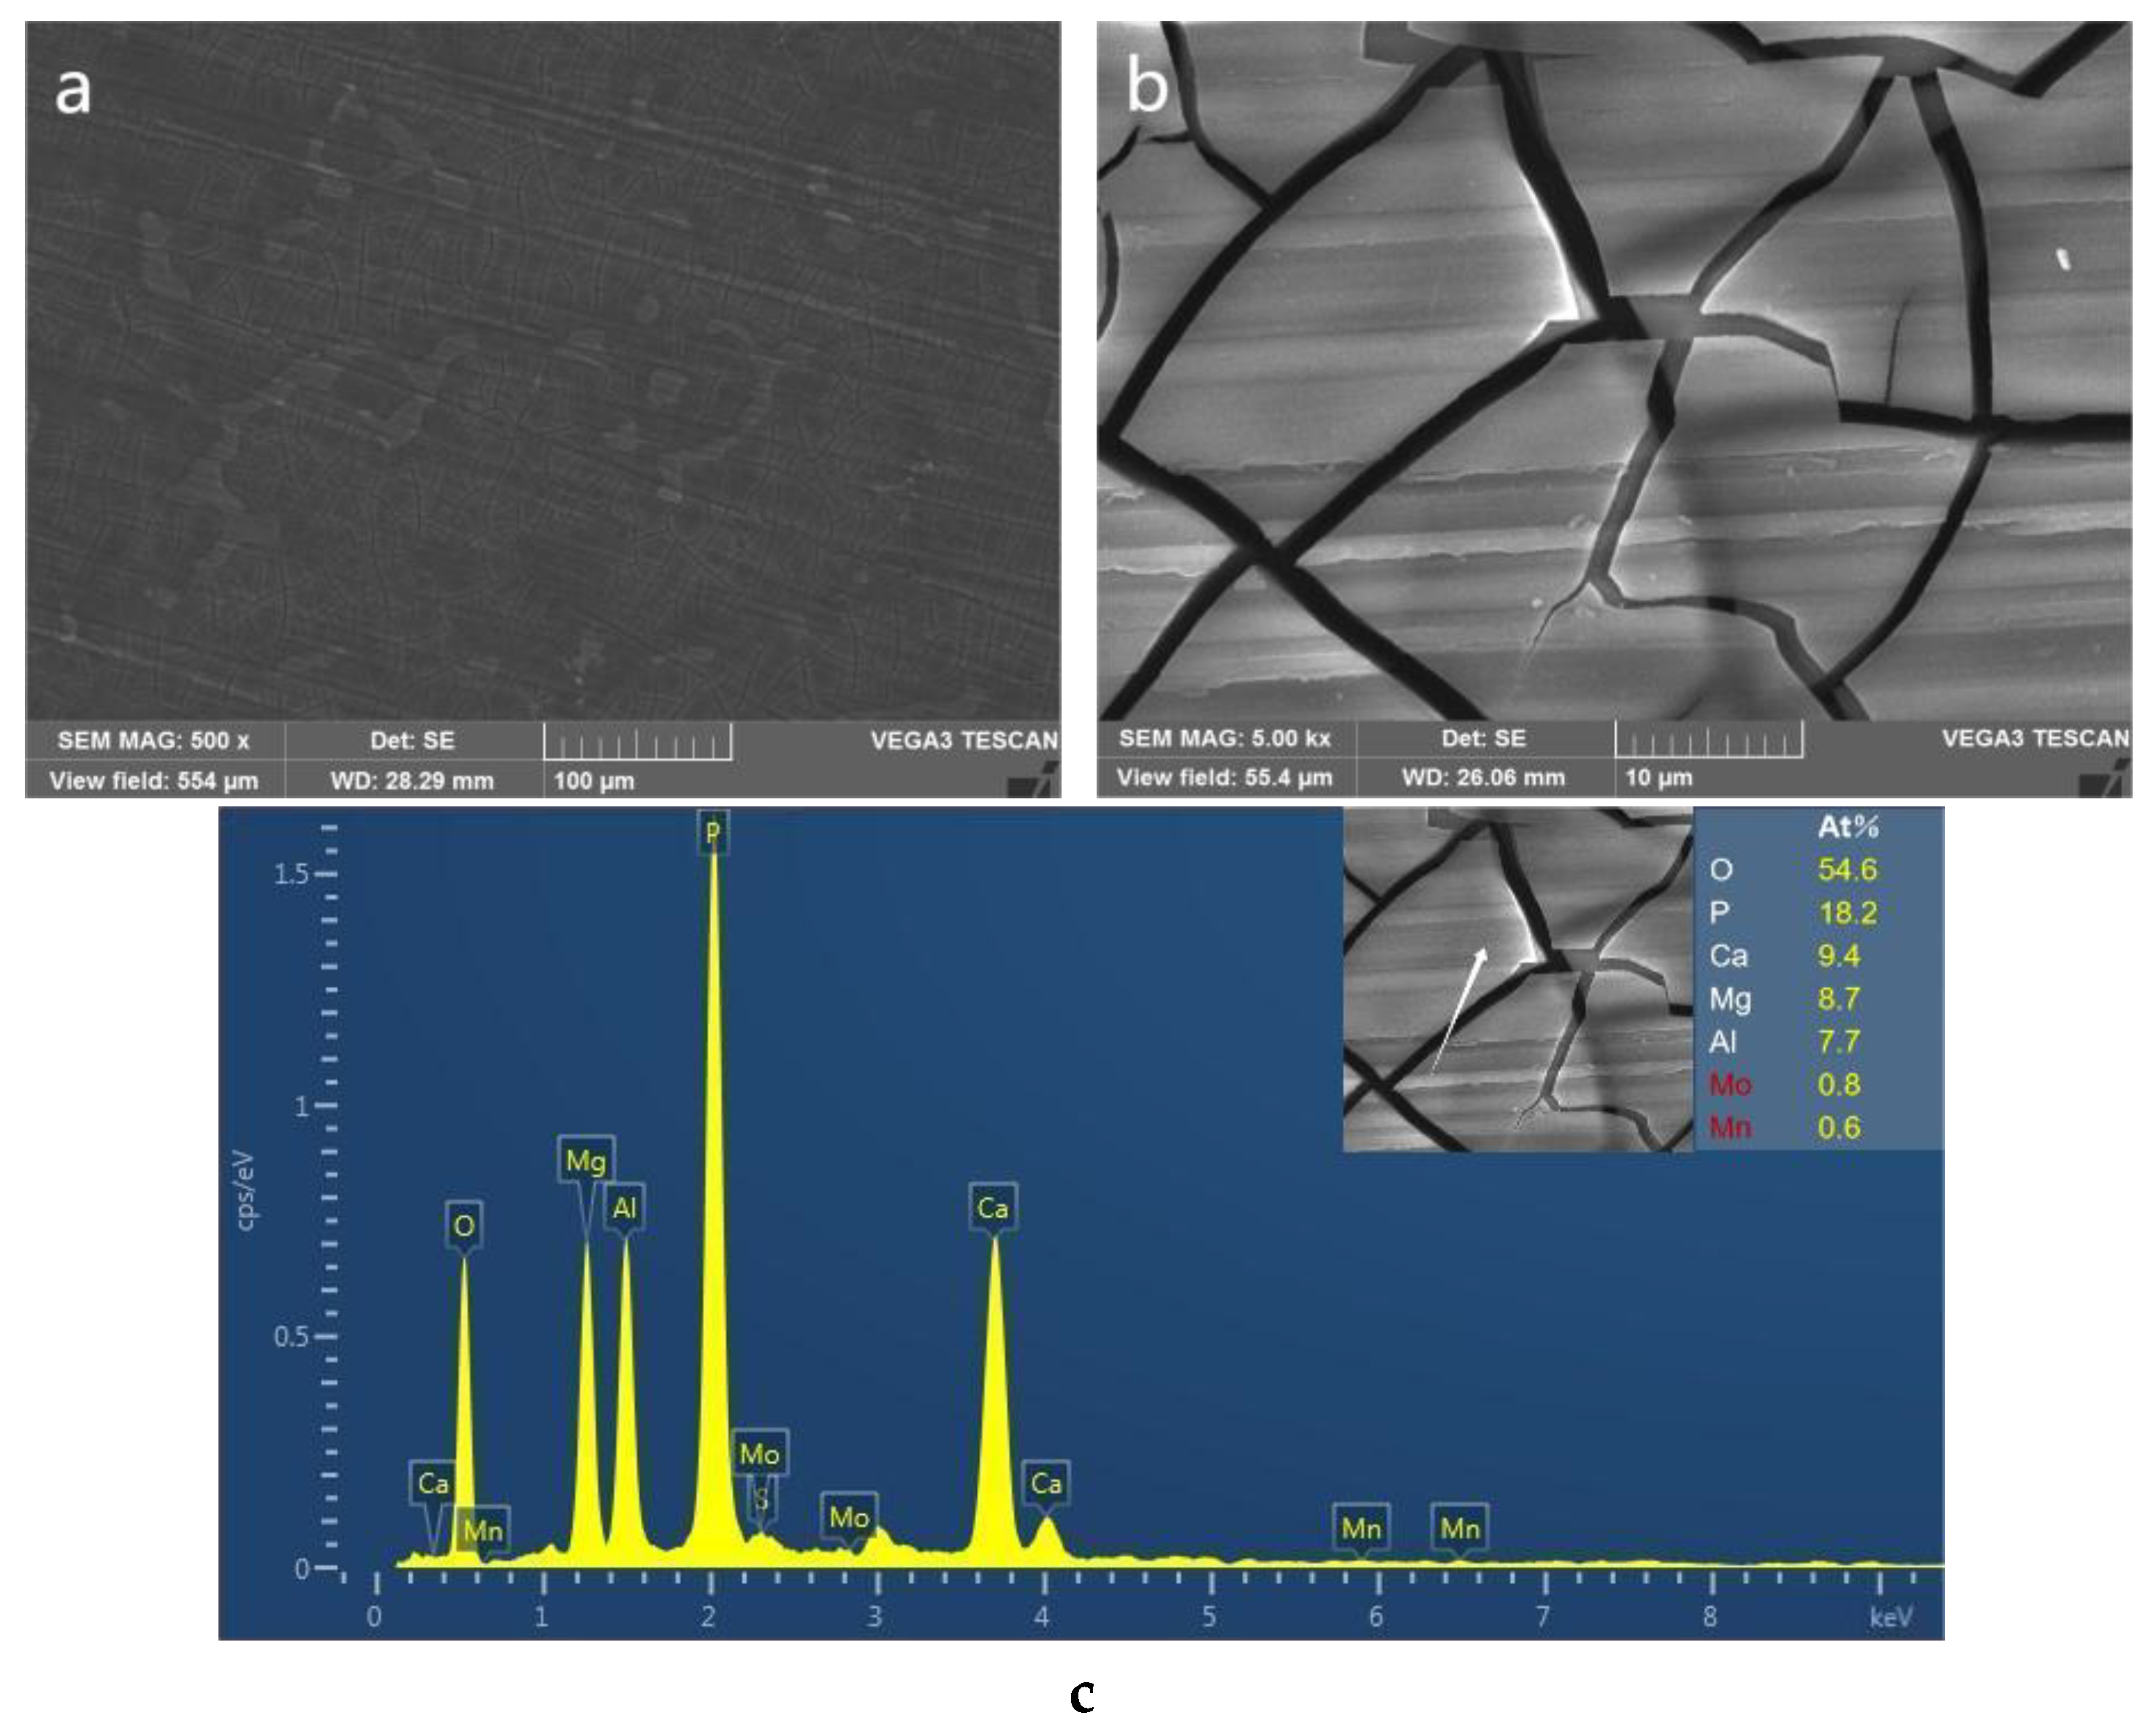
3.5. Performance Tests Results of PCC
4. Conclusions
Author Contributions
Funding
Data Availability Statement
Conflicts of Interest
References
- Song, J.F.; She, J.; Chen, D.L. Latest research advances on magnesium and magnesium alloys worldwide. J. Magnes. Alloys 2020, 8, 1–41. [Google Scholar] [CrossRef]
- Luthringer, B.J.; Feyerabend, F.R.R.; Willumeit, M. Magnesium-based implants: A mini-review. Magnes. Res. 2014, 24, 142–154. [Google Scholar] [CrossRef] [PubMed]
- Li, N.; Zheng, Y. Novel magnesium alloys developed for biomedical application: A review. J. Mater. Sci. Technol. 2013, 29, 489–502. [Google Scholar] [CrossRef]
- Risky, U.P.; Hasan, B.; Akbar, T.P. Level of Activity Changes Increases the Fatigue Life of the Porous Magnesium Scaffold, as Observed in Dynamic Immersion Tests, over Time. Sustainability 2023, 15, 823. [Google Scholar]
- Huang, G.; Zhang, L.; Song, B. Cold stamping for AZ31B magnesiumalloy sheet of cell phone house. Trans. Nonferrous Met. Soc. China 2010, 20, s608. [Google Scholar] [CrossRef]
- Xu, T.C.; Yang, Y.; Peng, X.D. Overview of advancement and development trend on magnesium alloy. J. Magnes. Alloys 2019, 7, 536–544. [Google Scholar] [CrossRef]
- Zheng, Y.; Ma, Y.L.; Zang, L.B. Microstructure, corrosion behavior, and surface mechanical properties of Fe oxide coatings on biomedical ZK60 Mg alloy. Mater. Corros. 2019, 70, 2292–2302. [Google Scholar] [CrossRef]
- Li, N.; Yan, H.; Wu, Q. Fabrication of carbon nanotubes and rare earth Pr reinforced AZ91 composites by powder metallurgy. Chin. J. Mech. Eng. 2021, 34, 26. [Google Scholar] [CrossRef]
- Zheng, Y.; Zhang, L.B.; Bi, Y.Z. Corrosion behavior of Fe/Zr composite coating on ZK60 Mg alloy by ion implantation and deposition. Coatings 2018, 8, 261. [Google Scholar] [CrossRef]
- Yang, Y.; Xiong, X.M.; Chen, J. Research advances in magnesium and magnesium alloys worldwide in 2020. J. Magnes. Alloys 2021, 9, 705–747. [Google Scholar] [CrossRef]
- Gray, J.E.; Luan, B. Protective coatings on magnesium and its alloys—A critical review. J. Alloys Compd. 2002, 336, 88–113. [Google Scholar] [CrossRef]
- Pardo, A.; Merino, M.C.; Casajus, P. Corrosion behavior of Mg-Al alloys with Al-11Si thermal spray coatings. Mater. Corros. 2009, 60, 939–948. [Google Scholar] [CrossRef]
- Yang, Q.H.; Chen, Z.; Xiong, Z.P. Research on the corrosion resistance of magnesium alloy anodizing films enhanced by SDBS. Plat. Finish. 2017, 39, 5. [Google Scholar]
- Zhao, X.X.; Ma, Y.G.; Sun, N.A. Research Progress of Micro-arc Oxidation Process for Magnesium Alloy. Foundry Technol. 2013, 34, 45. [Google Scholar]
- Chen, X.B.; Yang, H.Y.; Abbott, T.B. Corrosion-resistant electrochemical plating on magnesium alloys: A state-of-the-art review. Corrosion 2012, 68, 518–535. [Google Scholar] [CrossRef]
- Hu, R.Y.; Chen, M. Effect of pretreatment on electroless nickel plating on AZ91D magnesium alloy. Plat. Finish. 2017, 39, 35. [Google Scholar]
- Chen, X.B.; Birbilis, N.; Abbott, T.B. Effect of [Ca2+] and [PO34−] levels on the formation of calcium phosphateconversion coatings on die-cast magnesium alloy AZ91D. Corros. Sci. 2012, 55, 226. [Google Scholar] [CrossRef]
- Cheng, I.C.; Fu, E.G.; Liu, L.D. Effect of fluorine anions on anodizing behavior of AZ91 magnesium alloy in alkaline solutions. J. Electrochem. Soc. 2008, 155, C219–C225. [Google Scholar] [CrossRef]
- Liu, B.; Zhang, X.; Xiao, G.Y. Phosphate chemical conversion coatings on metallic substrates for biomedical application: A review. Mat. Sci. Eng. C 2015, 47, 97–104. [Google Scholar] [CrossRef]
- Hung, S.M.; Lin, H.H.; Chen, W. Corrosion resistance and electrical contact resistance of a thin permanganate conversion coating on dual-phase LZ91 Mg-Li alloy. J. Mater. Res. Technol. 2021, 11, 1953–1968. [Google Scholar] [CrossRef]
- Chen, X.B.; Birbilis, N.T.; Abbott, B. Review of corrosion-resistant conversion coatings for magnesium and its alloys. Corrosion 2011, 67, 35001. [Google Scholar] [CrossRef]
- Jian, S.Y.; Chu, Y.R.; Lin, C.S. Permanganate conversion coating on AZ31 magnesium alloys with enhanced corrosion resistance. Corros. Sci. 2015, 93, 301–309. [Google Scholar] [CrossRef]
- Duan, G.Q.; Yang, L.X.; Liao, S.J. Designing for the chemical conversion coating with high corrosion resistance and low electrical contact resistance on AZ91D magnesium alloy. Corros. Sci. 2018, 135, 197–206. [Google Scholar] [CrossRef]
- Zhou, P.; Yang, L.X.; Hou, Y.J. Grain refinement promotes the formation of phosphate conversion coating on Mg alloy AZ91D with high corrosion resistance and low electrical contact resistance. Corros. Commun. 2021, 1, 47–57. [Google Scholar] [CrossRef]
- Zeng, R.C.; Zhang, F.; Lan, Z.D. Corrosion resistance of calcium-modified zinc phosphate conversion coatings on magnesium-aluminium alloys. Corros. Sci. 2014, 88, 452. [Google Scholar] [CrossRef]
- Chen, B.X. The Research of Chemical Conversioncoating with High Corrosion Resistance and Lowelectrical Contact Resistance on AZ91D Magnesium Alloy Resisting Hot and Humid Environment; Harbin Engineering University: Harbin, China, 2018. [Google Scholar]
- Li, A.H. Research on Surface Modification of Mg Alloy for Electro-Conductivity and Corrosion Protection; South China University of Technology: Guangzhou, China, 2014. [Google Scholar]
- Ismail, N.N.; Zuhailawati, H.; Abdalla, K. Effect of strontium pretreatment on zinc phosphate coating deposition on magnesium alloy. Mater. Today 2019, 17, 694–699. [Google Scholar] [CrossRef]
- Duan, G.Q. Investigation of the Conversion Coating with High Corrosion Resistance and Low Electrical Contact Resistance on Magnesium Alloy; University of Science and Technology of China: Hefei, China, 2019. [Google Scholar]
- Zhou, W.; Shan, D.; Han, E.H. Structure and formation mechanism of phosphate conversion coating on die-cast AZ91D magnesium alloy. Corros. Sci. 2008, 50, 329. [Google Scholar] [CrossRef]
- Chen, X.B.; Zhou, X.; Abbott, T.B. Double-layered manganese phosphate conversion coating on magnesium alloy AZ91D: Insights into coating formation, growth and corrosion resistance. Surf. Coat. Technol. 2013, 217, 147–155. [Google Scholar] [CrossRef]
- Yun, X.; Zhou, Q.Y.; Xiong, J.P. The study of a phosphate conversion coating on magnesium alloy AZ91D: I. Formation, morphology and composition. Int. J. Electrochem. Sci. 2015, 10, 8454. [Google Scholar]
- Meng, X.L.; Liang, J.L.; Yi, L. Influence of sodium molybdate on corrosion resistance of phosphating film on AZ31B magnesium alloy. Plat. Finish. 2022, 44, 1. [Google Scholar]
- Li, J.Z.; Guo, R.G.; Tang, C.B. Modification of OP-10 for corrosion resistance of vanadate conversion coating on Mg alloy. Mater. Protec. 2017, 50, 52. [Google Scholar]
- Zhang, C.Y.; Zhang, J.S.; Zhang, Y. Comparison of calcium phosphate coatings on AZ31 and fluoride-treated AZ31 alloy prepared by hydrothermal method and their electrochemical corrosion behaviour. Mater. Chem. Phys. 2018, 220, 395–401. [Google Scholar] [CrossRef]


| Element | Al | Zn | Mn | Si | Cu | Ni | Fe | Mg |
|---|---|---|---|---|---|---|---|---|
| Content | 9.1 | 0.84 | 0.23 | 0.01 | 0.02 | 0.0021 | 0.005 | Margin |
| Sample Number | Formula and Operating Condition | |
|---|---|---|
| No. 1 | Na3PO4·12H2O 10 g/L NaOH 50 g/L 70 °C, 10 min | 3 wt.% H2SO4 25 °C, 10 s |
| No. 2 | 3 wt.% HNO3 25 °C, 10 s | |
| No. 3 | 5 wt.% HCl 25 °C, 10 s | |
| No. 4 | 30 wt.% H3PO4 25 °C, 30 s | |
| No. 5 | H3PO4 20 g/L Na3PO4·12H2O 12 g/L 25 °C, 30 s | |
| No. 6 | Sonication cleanout in acetone for 5 min | |
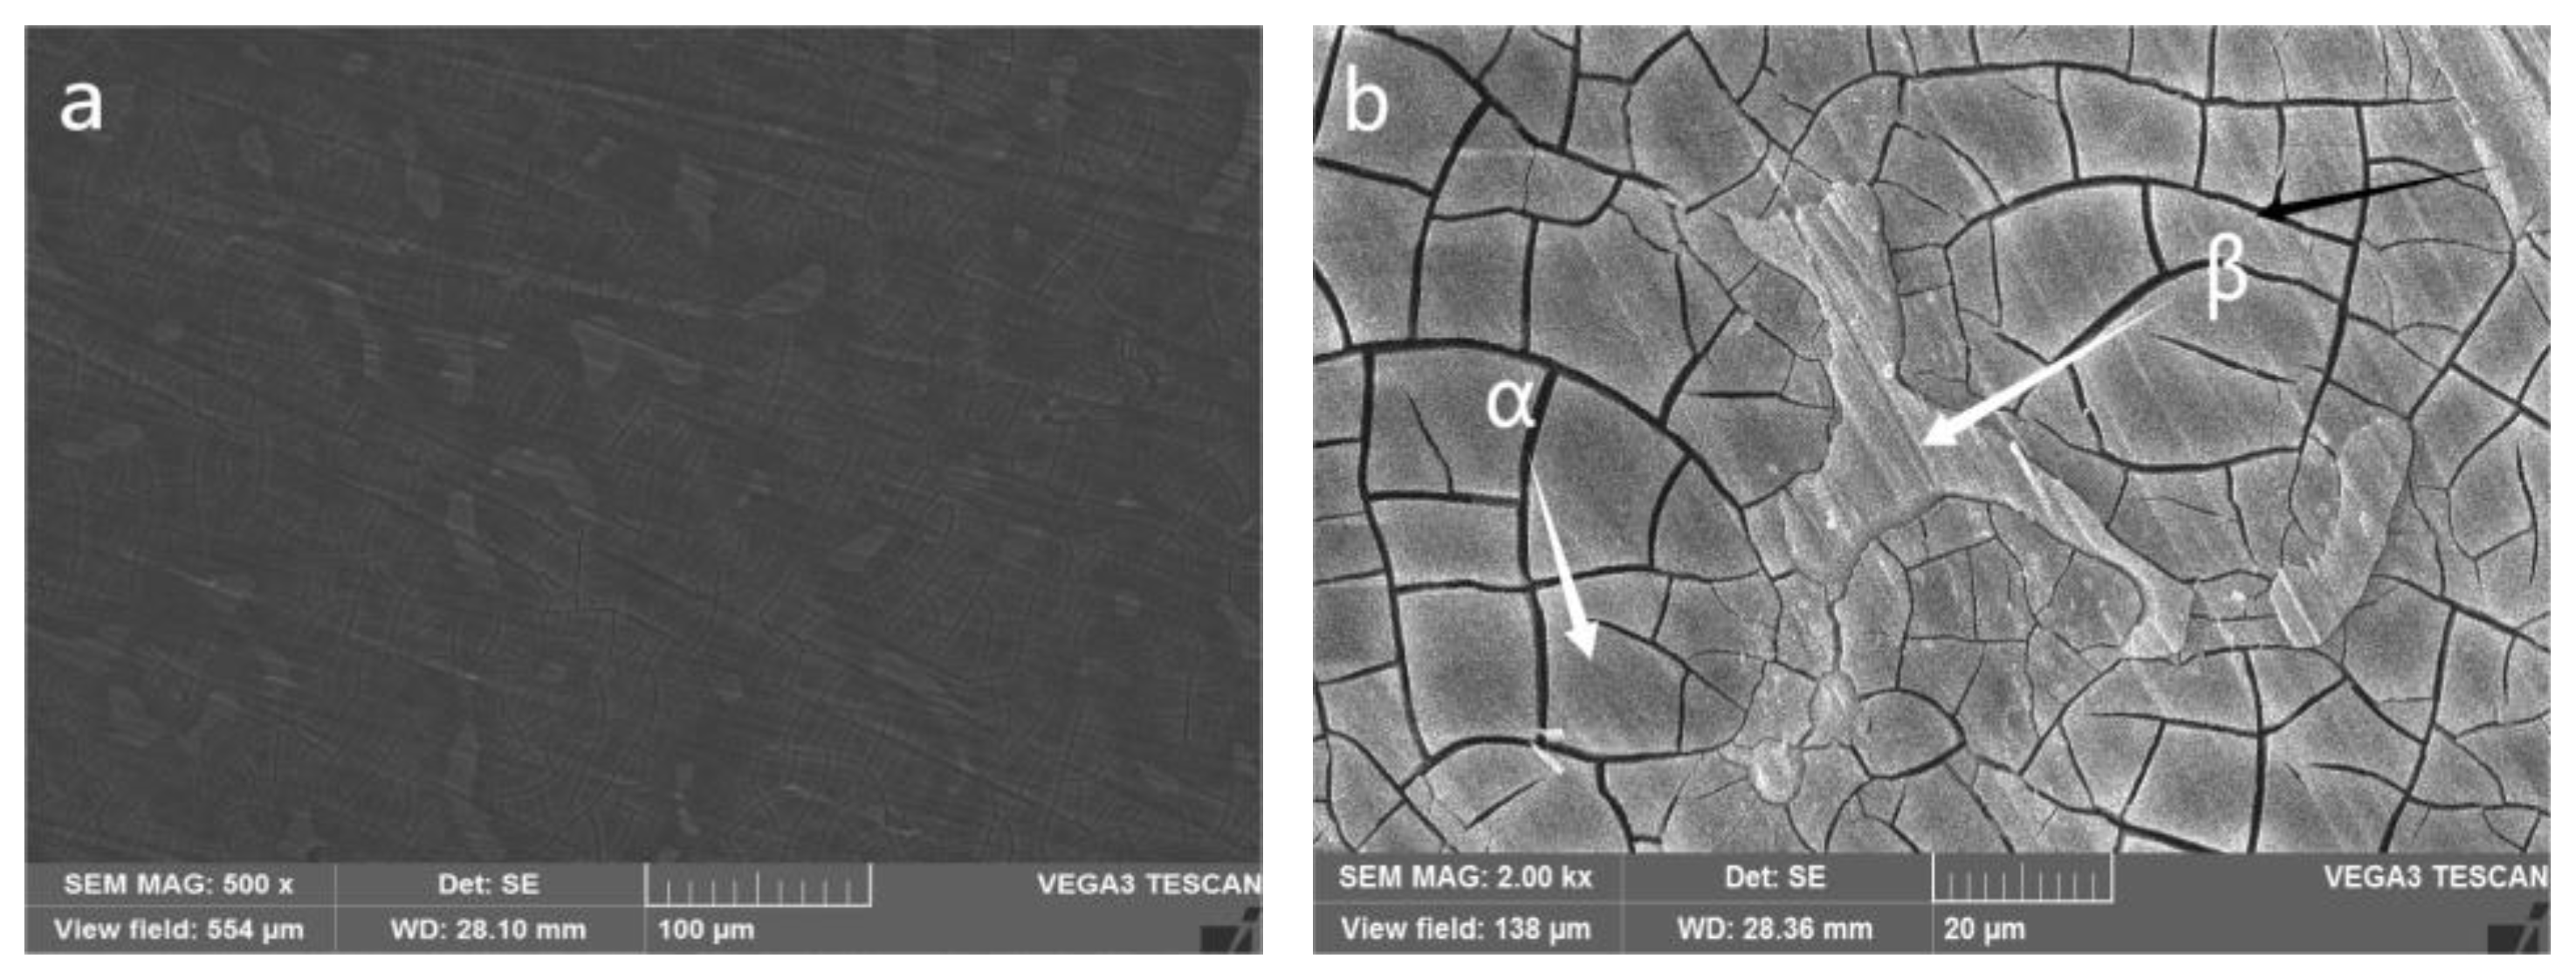
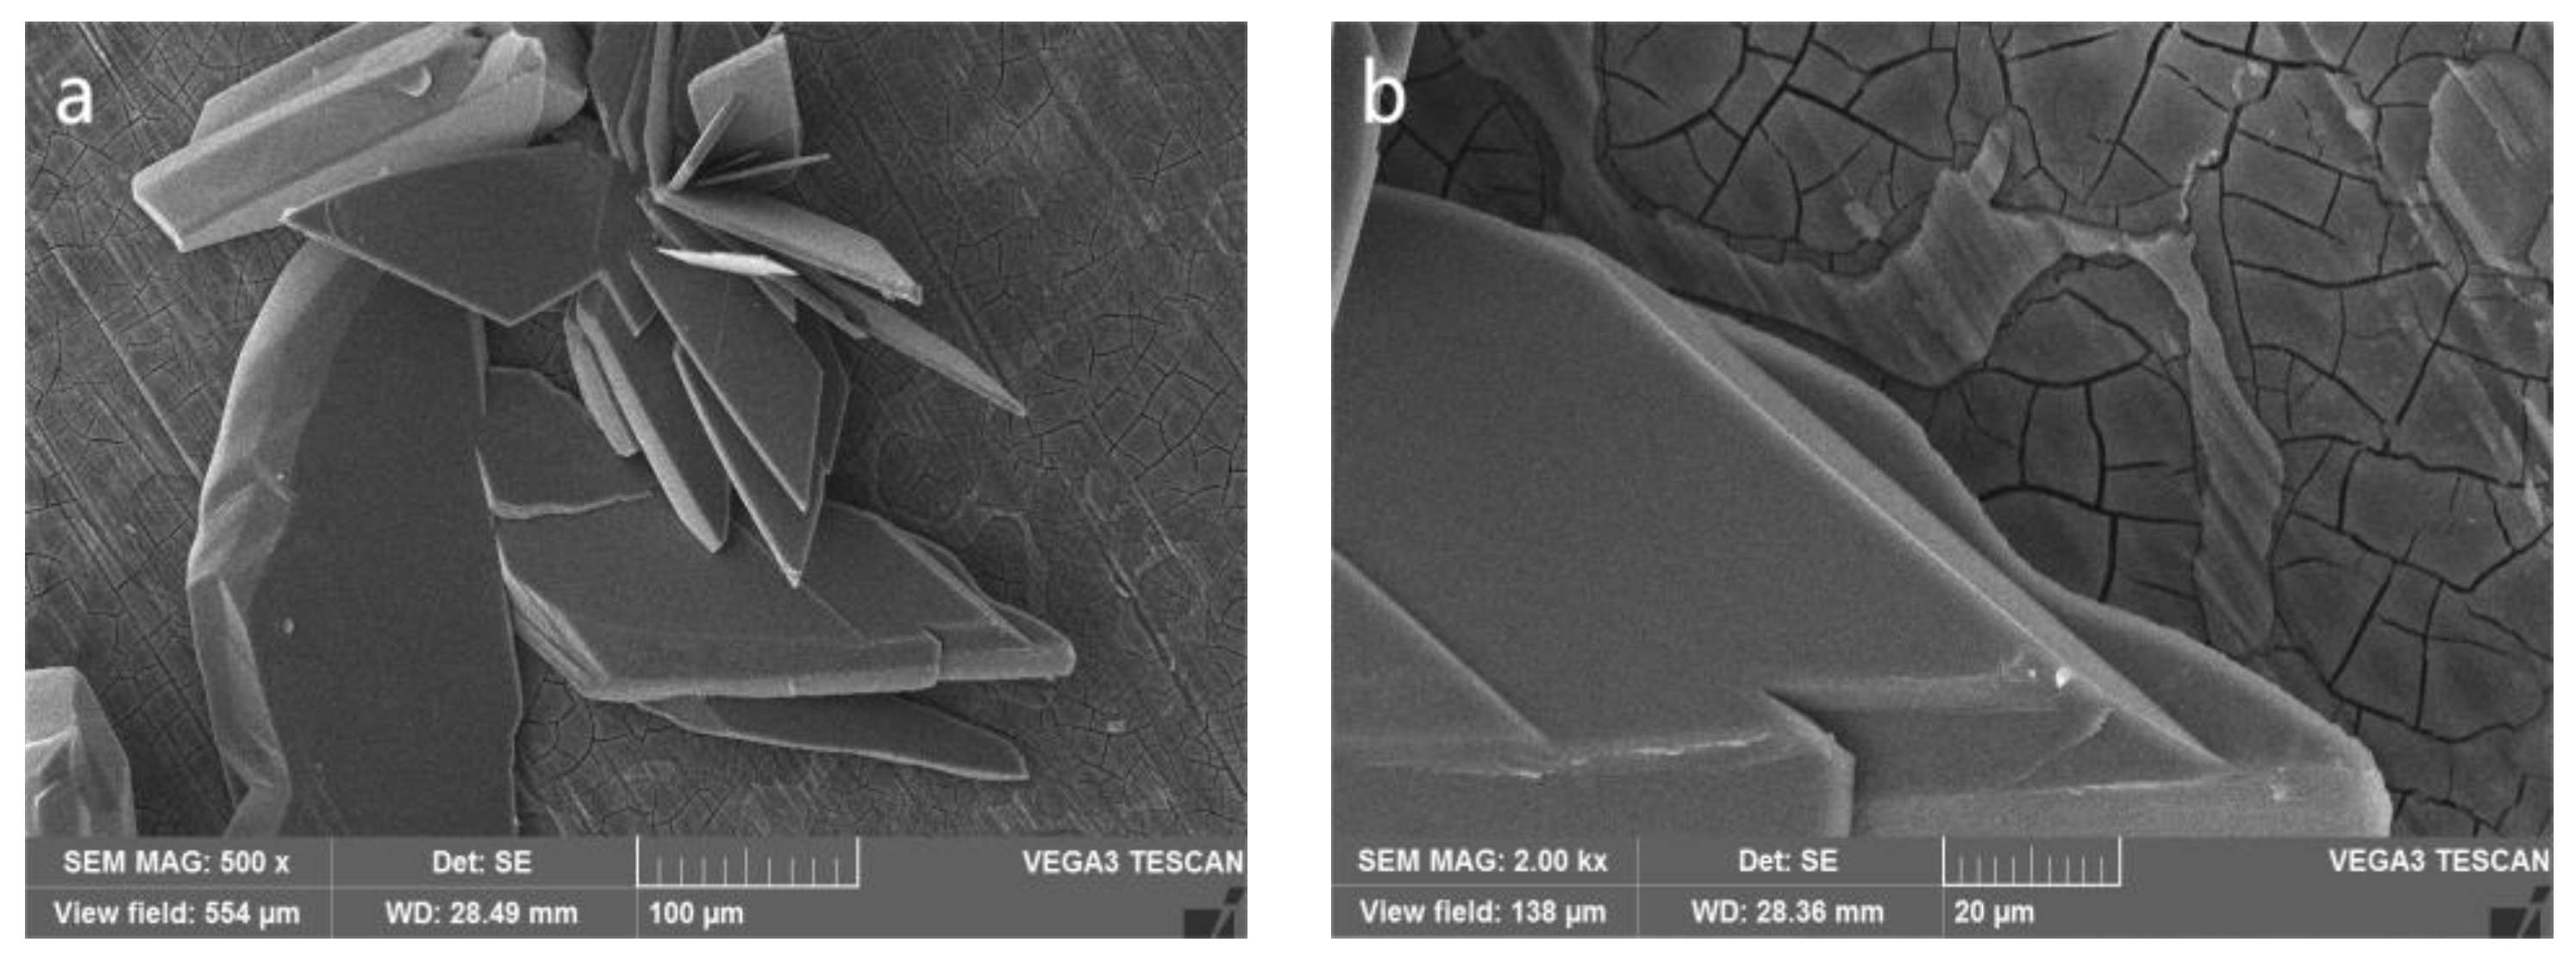
| Atom (%) | Mg | Al | Ca | Mn | Mo | P | O |
|---|---|---|---|---|---|---|---|
| α phase | 11.6 | 4.0 | 6.1 | 2.6 | 0.5 | 14.5 | 60.6 |
| β phase | 51.38 | 39.24 | — | 0.35 | — | — | 9.03 |
| Atom (%) | Mg | Al | Ca | Mo | P | O |
|---|---|---|---|---|---|---|
| PCC | 2.41 | 0.38 | 12.66 | 0.1 | 16.72 | 67.81 |
| Crystal | 0.42 | — | 21.77 | — | 12.86 | 64.95 |
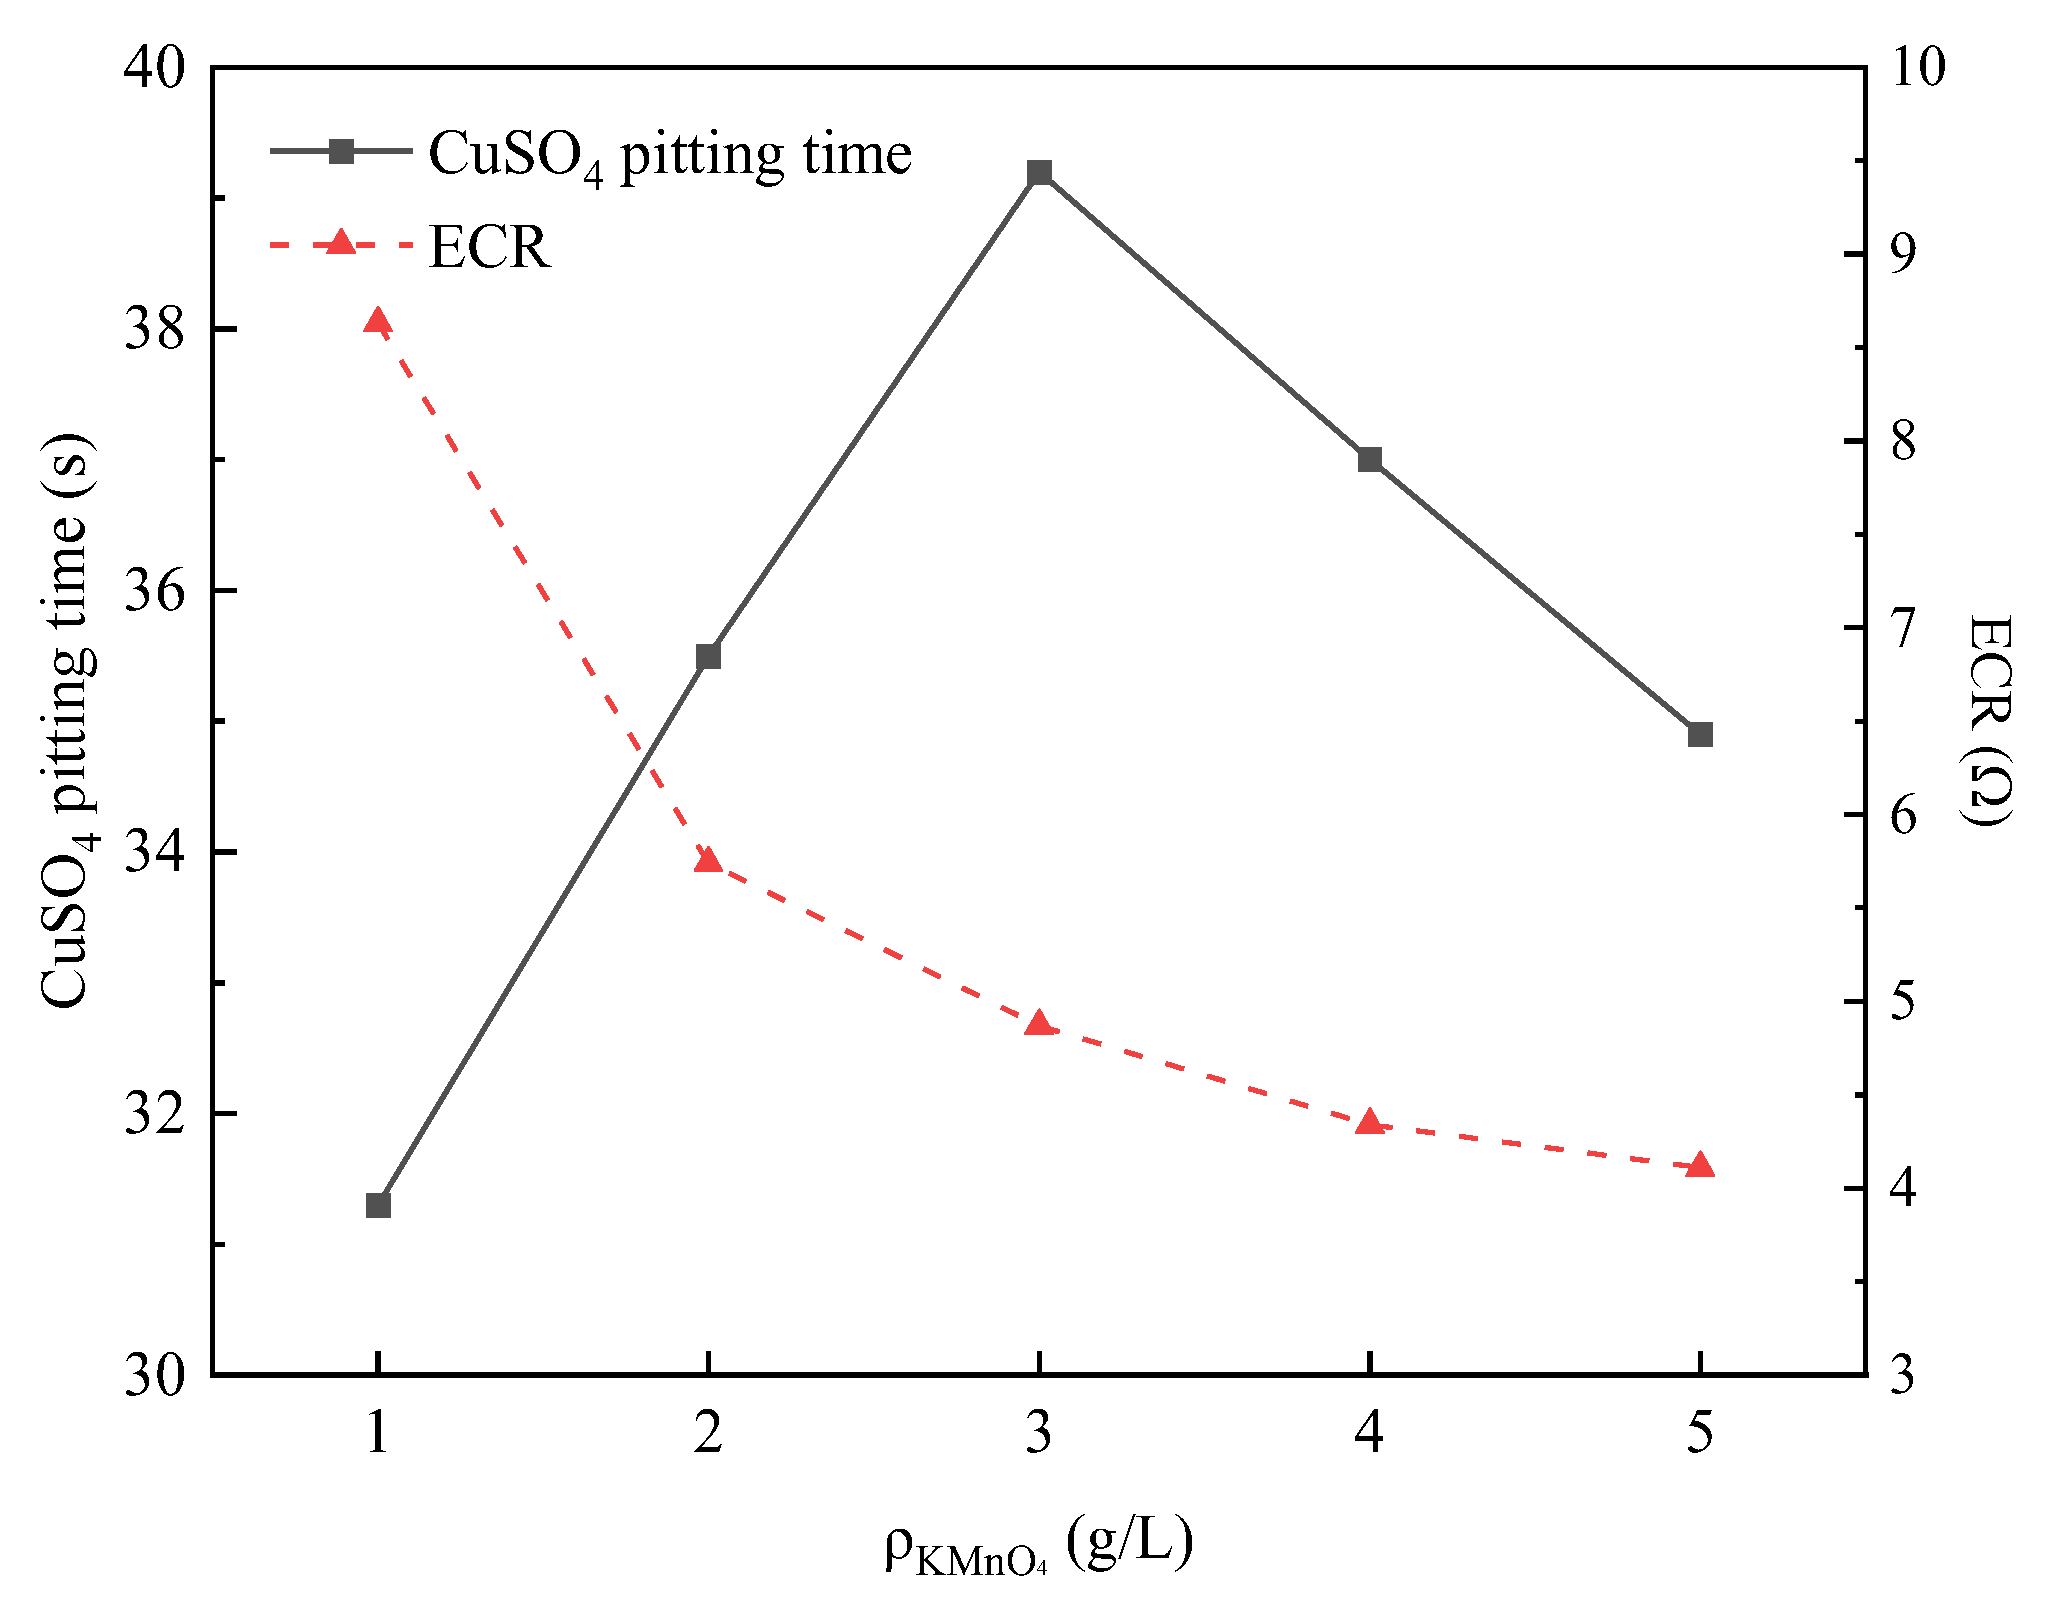
| Composition of Phosphating Bath | ECR (Ω) |
|---|---|
| Without KMnO4 | — |
| With KMnO4 | 5.74 |
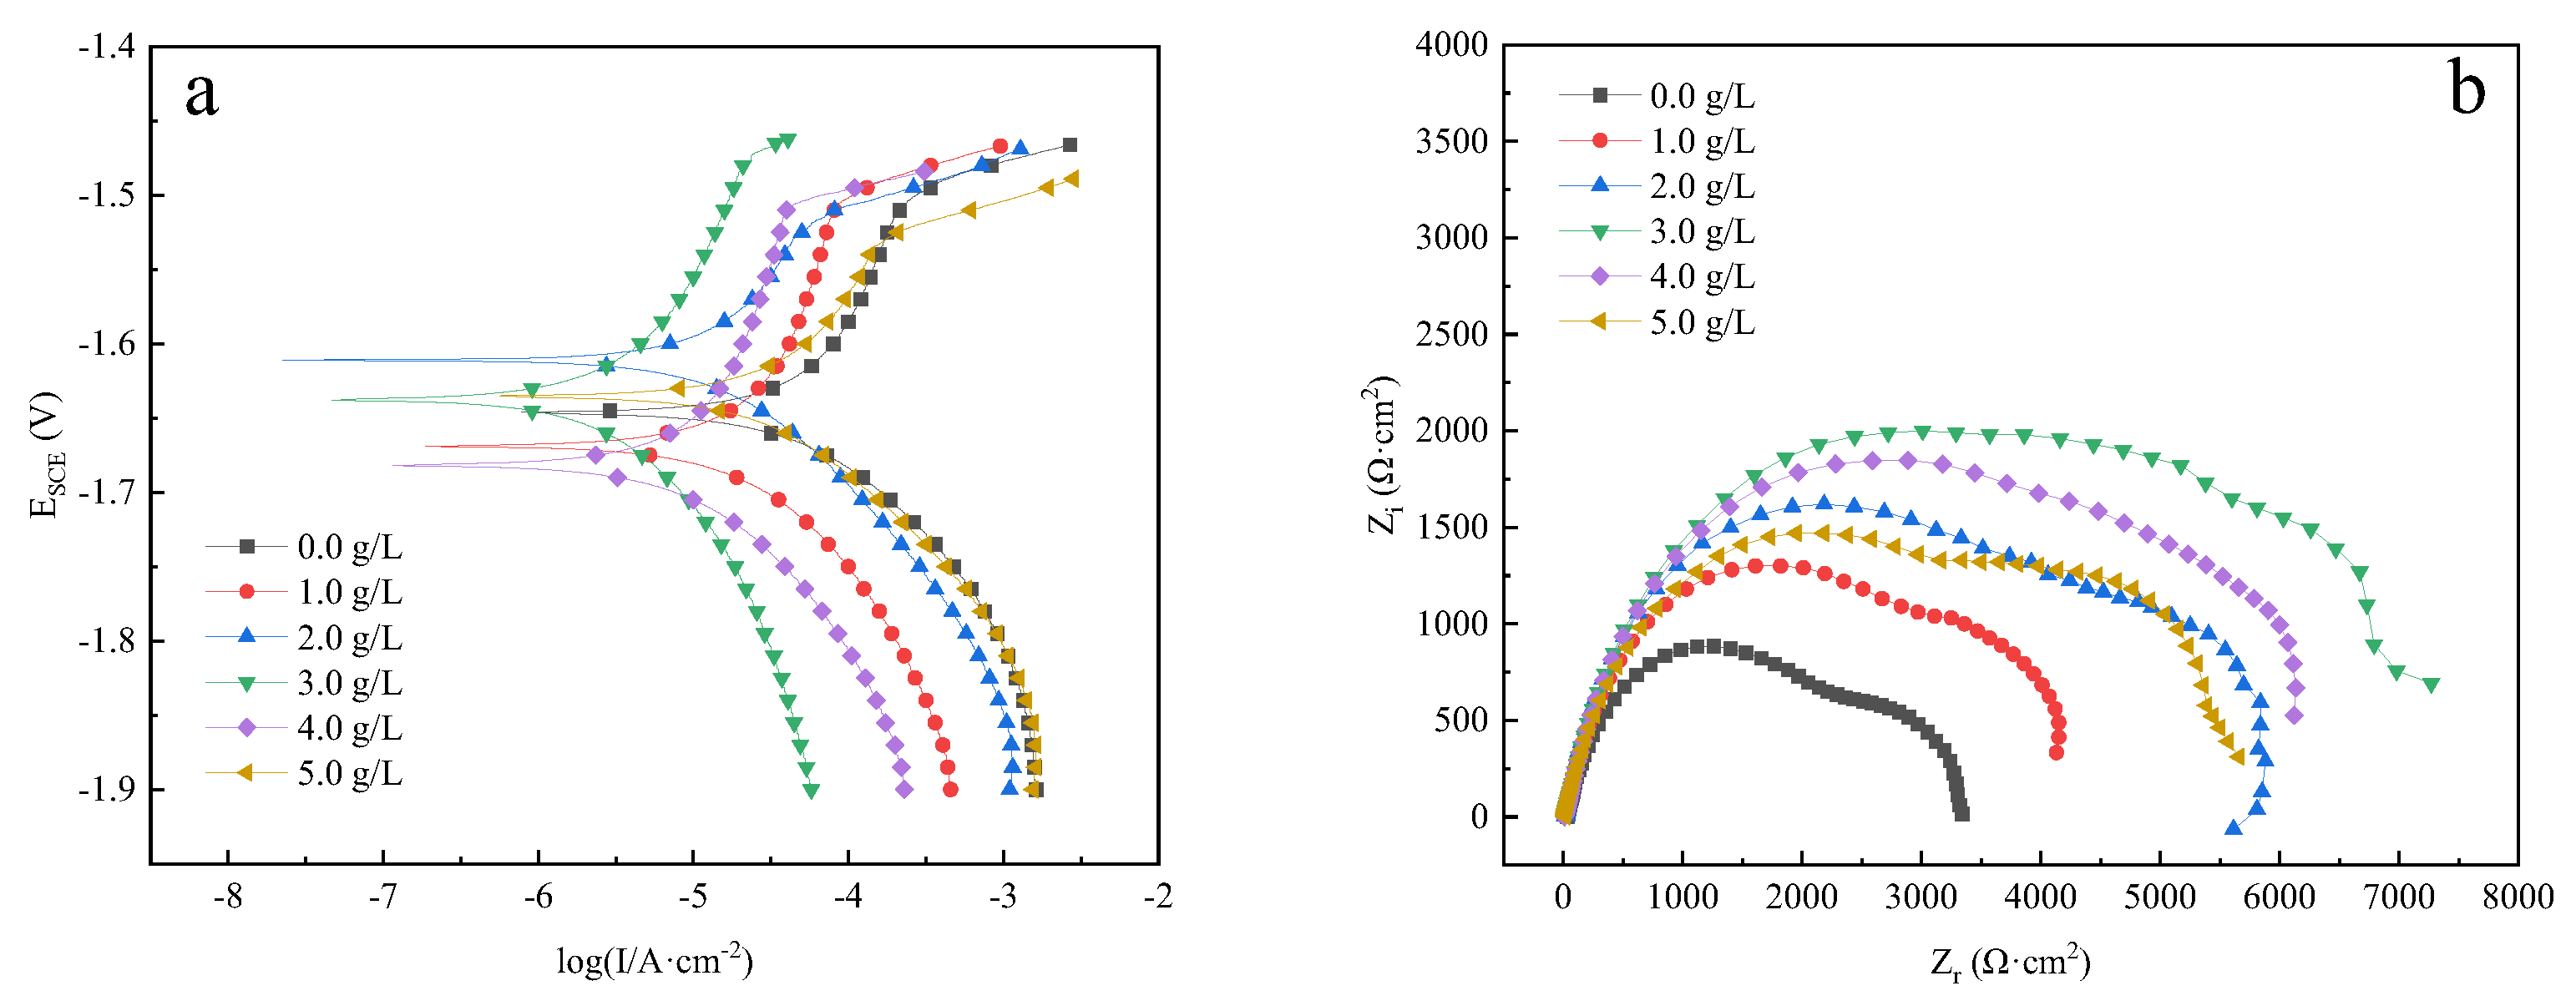
| Content of KMnO4 (g/L) | Ecorr (V) | icorr (A/cm2) |
|---|---|---|
| 0.0 | −1.646 | 5.27 × 10⁻⁵ |
| 1.0 | −1.669 | 3.61 × 10⁻⁵ |
| 2.0 | −1.611 | 2.04 × 10⁻⁵ |
| 3.0 | −1.638 | 9.62 × 10⁻⁶ |
| 4.0 | −1.682 | 1.39 × 10⁻⁵ |
| 5.0 | −1.635 | 2.86 × 10⁻⁵ |
| Content of KMnO4 (g/L) | 0.0 | 1.0 | 2.0 | 3.0 | 4.0 | 5.0 |
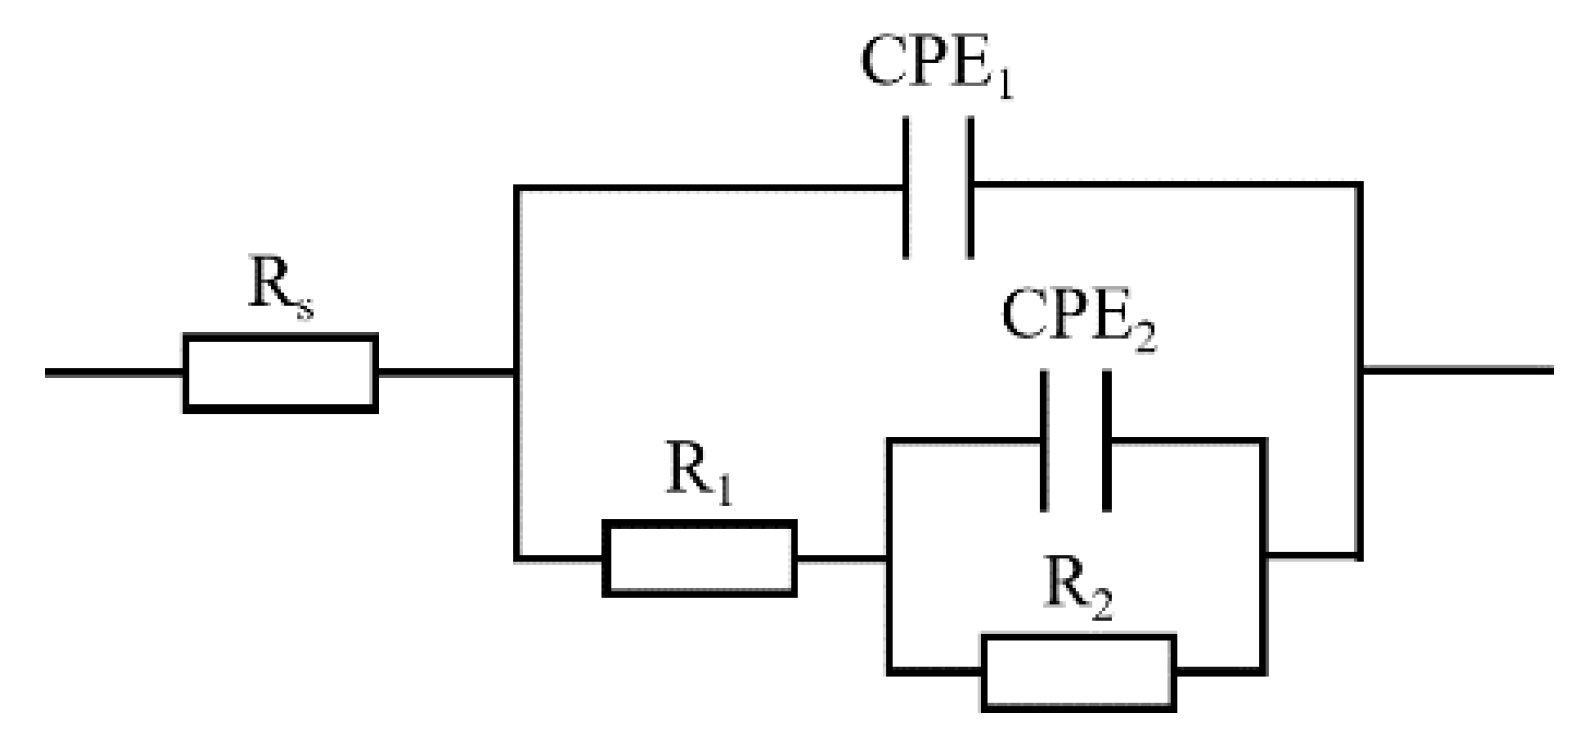
|---|---|---|---|---|---|---|
| Rs (Ω·cm2) | 30.95 | 8.779 | 15.96 | 8.011 | 8.965 | 10.64 |
| CPE1/(μS·s−n·cm−2) | 2.697 × 10⁻⁵ | 1.484 × 10⁻⁵ | 1.215 × 10⁻⁵ | 1.362 × 10⁻⁵ | 1.375 × 10⁻⁵ | 1.458 × 10⁻⁵ |
| n1 | 0.8091 | 0.7914 | 0.8403 | 0.7817 | 0.7867 | 0.7759 |
| R1 (Ω·cm2) | 2486 | 3744 | 4478 | 5956 | 5798 | 4335 |
| CPE2 (μS·s−n·cm−2) | 9.589 × 10⁻⁴ | 5.534 × 10⁻⁴ | 3.411 × 10⁻⁴ | 2.598 × 10⁻⁴ | 6.991 × 10⁻⁴ | 3.071 × 10⁻⁴ |
| n2 | 0.9244 | 0.8021 | 0.8947 | 0.8736 | 0.7641 | 0.8768 |
| R2 (Ω·cm2) | 780 | 675 | 1404 | 1357 | 568 | 1378 |
| R1 + R2 (Ω·cm2) | 3266 | 4419 | 5882 | 7313 | 6357 | 5713 |
| Content of Na2MoO4 (g/L) | Ecorr (V) | icorr (A/cm2) |
|---|---|---|
| 0.0 | −1.644 | 2.02 × 10⁻⁵ |
| 0.5 | −1.673 | 1.87 × 10⁻⁵ |
| 1.0 | −1.638 | 9.62 × 10⁻⁶ |
| 1.5 | −1.597 | 3.74 × 10⁻⁶ |
| 2.0 | −1.590 | 7.53 × 10⁻⁶ |
| 2.5 | −1.545 | 1.02 × 10⁻⁵ |
| Content of Na2MoO4 (g/L) | 0.0 | 0.5 | 1.0 | 1.5 | 2.0 | 2.5 |
|---|---|---|---|---|---|---|
| Rs (Ω·cm2) | 11.34 | 10.72 | 8.011 | 9.342 | 12.73 | 12.1 |
| CPE1 (μS·s−n·cm−2) | 1.665 × 10⁻⁵ | 1.481 × 10⁻⁵ | 1.362 × 10⁻⁵ | 1.575 × 10⁻⁵ | 1.79 × 10⁻⁵ | 1.859 × 10⁻⁵ |
| n1 | 0.8395 | 0.827 | 0.7817 | 0.7392 | 0.8423 | 0.8357 |
| R1 (Ω·cm2) | 3226 | 4289 | 5956 | 7841 | 6638 | 6165 |
| CPE2 (μS·s−n·cm−2) | 4.725 × 10⁻⁴ | 3.455 × 10⁻⁴ | 2.598 × 10⁻⁴ | 3.636 × 10⁻⁴ | 6.126 × 10⁻⁴ | 8.546 × 10⁻⁴ |
| n2 | 0.9179 | 0.8701 | 0.8736 | 0.8127 | 0.8335 | 0.8314 |
| R2 (Ω·cm2) | 979 | 1187 | 1357 | 2278 | 2166 | 962 |
| R1 + R2 (Ω·cm2) | 4205 | 5476 | 7313 | 10,119 | 8804 | 7127 |
| Content of OP-10 (g/L) | Ecorr (V) | icorr (A/cm2) |
|---|---|---|
| 0.0 | −1.619 | 1.35 × 10⁻⁵ |
| 0.5 | −1.622 | 7.52 × 10⁻⁶ |
| 1.0 | −1.597 | 3.74 × 10⁻⁶ |
| 1.5 | −1.624 | 8.19 × 10⁻⁶ |
| 2.0 | −1.595 | 9.45 × 10⁻⁶ |
| 2.5 | −1.694 | 1.01 × 10⁻⁵ |
| Content of OP-10 (g/L) | 0.0 | 0.5 | 1.0 | 1.5 | 2.0 | 2.5 |
|---|---|---|---|---|---|---|
| Rs (Ω·cm2) | 10.72 | 14.48 | 9.342 | 11.26 | 10.99 | 12.07 |
| CPE1 (μS·s−n·cm−2) | 1.484 × 10⁻⁵ | 1.748 × 10⁻⁵ | 1.575 × 10⁻⁵ | 1.867 × 10⁻⁵ | 1.611 × 10⁻⁵ | 1.305 × 10⁻⁵ |
| n1 | 0.7677 | 0.8481 | 0.7392 | 0.838 | 0.7655 | 0.7925 |
| R1 (Ω·cm2) | 3944 | 7468 | 7841 | 6126 | 5268 | 4957 |
| CPE2 (μS·s−n·cm−2) | 3.181 × 10⁻⁴ | 6.223 × 10⁻⁴ | 3.636 × 10⁻⁴ | 4.685 × 10⁻⁴ | 3.538 × 10⁻⁴ | 2.905 × 10⁻⁴ |
| n2 | 0.8529 | 0.7445 | 0.8127 | 0.8662 | 0.8763 | 0.8331 |
| R2 (Ω·cm2) | 2804 | 1347 | 2278 | 2292 | 2522 | 2261 |
| R1 + R2 (Ω·cm2) | 6748 | 8815 | 10,119 | 8418 | 7790 | 7218 |
| Sample | Ecorr (V) | icorr (A/cm2) |
|---|---|---|
| Phosphate conversion coating | −1.597 | 3.74 × 10⁻⁶ |
| AZ91D magnesium alloy | −1.626 | 7.84 × 10⁻⁵ |
Disclaimer/Publisher’s Note: The statements, opinions and data contained in all publications are solely those of the individual author(s) and contributor(s) and not of MDPI and/or the editor(s). MDPI and/or the editor(s) disclaim responsibility for any injury to people or property resulting from any ideas, methods, instructions or products referred to in the content. |
© 2023 by the authors. Licensee MDPI, Basel, Switzerland. This article is an open access article distributed under the terms and conditions of the Creative Commons Attribution (CC BY) license (https://creativecommons.org/licenses/by/4.0/).
Share and Cite
Zhang, S.; Xu, Y.; Liu, L.; Lei, Q.; Dong, J.; Zhang, T. Preparation of Conductive and Corrosion Resistant Phosphate Conversion Coating on AZ91D Magnesium Alloy. Coatings 2023, 13, 1706. https://doi.org/10.3390/coatings13101706
Zhang S, Xu Y, Liu L, Lei Q, Dong J, Zhang T. Preparation of Conductive and Corrosion Resistant Phosphate Conversion Coating on AZ91D Magnesium Alloy. Coatings. 2023; 13(10):1706. https://doi.org/10.3390/coatings13101706
Chicago/Turabian StyleZhang, Shudi, Yuheng Xu, Linkun Liu, Quanda Lei, Jialin Dong, and Tao Zhang. 2023. "Preparation of Conductive and Corrosion Resistant Phosphate Conversion Coating on AZ91D Magnesium Alloy" Coatings 13, no. 10: 1706. https://doi.org/10.3390/coatings13101706