Article

Study on Diffusion Kinetics and Law of Chromium on the Surface of Low-Carbon Steel

1
Department of Materials Engineering, Hebei Vocational University of Industry and Technology, Shijiazhuang 050091, China
2
Collaborative Innovation Center of Steel Technology, University of Science and Technology Beijing, Beijing 100089, China
3
Tangshan Iron Steel Group Co., Ltd., Tangshan 063000, China
4
Key Laboratory of Ministry of Education for Modern Metallurgy Technology, College of Metallurgy and Energy, North China University of Science and Technology, Tangshan 063009, China
*
Author to whom correspondence should be addressed.
Coatings 2023, 13(1), 98; https://doi.org/10.3390/coatings13010098
Submission received: 18 November 2022 / Revised: 23 December 2022 / Accepted: 30 December 2022 / Published: 5 January 2023

Abstract

:
Cr/low-carbon steel surface composites were prepared by aqueous solution co-deposition and high-temperature solid-state diffusion technology, and the macro rule of the solid-state diffusion of chromium on the surface of low-carbon steel was analyzed. The molecular dynamics (MD) method was used to simulate and calculate the diffusion process of the Cr/Fe interface, and the macro and micro diffusion mechanisms were analyzed. The results show that the diffusion of the chromium in iron is the combined action of the temperature, crystal structure and lattice distortion, and the diffusion coefficients of chromium in α-Fe and γ-Fe have little difference. The vacancy diffusion mechanism of the first adjacent transition is the main diffusion mode. In practice, chromium atoms diffuse along the grain boundaries of the low-carbon steel matrix and provide pinning at the grain boundaries to prevent grain growth. The simulation law is in good agreement with the experimental law. The variation law of the average diffusion coefficient of chromium atoms with temperature is obtained. The diffusion rate of chromium in the bcc crystal structure is obviously higher than that in the fcc crystal structure. In the same crystal structure, the diffusion coefficient of chromium increases with the increase in temperature. However, in the lattice transition temperature region, the diffusion coefficient of chromium gradually decreases with the increase in temperature until the end of the transformation.

1. Introduction

Low-carbon steel is widely used in engineering equipment, building components, containers, boxes, furnaces and agricultural machinery because of its low cost, good welding performance and mechanical performance. However, the low corrosion resistance, wear resistance and high temperature strength limit its application in various fields. It is reported that the scrap metal equipment and materials caused by corrosion account for 20%~40% of the steel annual output around the world each year [1,2]. In practical application, corrosion and wear mostly occur on the surfaces of materials [3]. Therefore, the question of how to improve the surface corrosion resistance and wear resistance of low-carbon steel remains an important research topic for steel workers.
Chromium has been widely used in metallurgy, refractory and chemical industries because of its hard quality, wear resistance, high temperature resistance and corrosion resistance. Many scholars have prepared metallurgically bonded metal surface composites on the surface of steel by means of chromization [4,5]. While maintaining the excellent properties of low-carbon steel such as high toughness, weldability and impact resistance, the corrosion resistance and wear resistance of the material are improved. Shixian Zhang et al. [6] prepared a Cr coating on low-carbon steel by electrochemical deposition in a NaCl–KCl–NaF-Cr2O3 molten salt system. The results of the AC impedance method show that the corrosion resistance of the Cr-coated low-carbon steel is much higher than that of low-carbon steel. Hang Yin et al. [7] prepared NiCrMo-WC coatings with different WC content on the surface of Q235 substrate by plasma cladding technology. The result shows that the highest average hardness of the 20 WC coating is around 3.25 times that of the Q235 substrate, and the corrosion rate of the 15 WC coating is only 3.7% of that of Q235 steel. Kexing Guo et al. [8] prepared a new type of high-chromium cast iron by surface chromizing. The result shows that the surface hardness of HCCI increases from 64.53 ± 0.50 HRC to 66.58 ± 0.50 HRC. However, few researchers have conducted in-depth research on the macro and micro diffusion laws and mechanisms of chromium on the surface of low-carbon steel. Understanding the macro and micro diffusion laws and mechanisms of chromium on the surface of low-carbon steel can help to control the diffusion rate, optimize the microstructure, reduce the blindness of the preparation process and provide a basis for subsequent material performance improvement. Therefore, this study intends to study these laws and mechanisms.
Solid-state diffusion has an important relationship with the process of material performance optimization, surface alloying, casting homogenization, cold deformation metal recovery and recrystallization. However, it is difficult to explain the microscopic diffusion mechanism through experimental methods. Simulation of the solid-state diffusion mechanism by molecular dynamics (MD) can reduce the workload and have important guiding significance for the actual process. Huirong Li et al. [9] analyzed the diffusion behavior of Cu in Fe at different temperatures by MD simulation. The results show that when the temperature is in the phase transition zone, the main restrictive link for the diffusion of Cu in Fe is the phase transition process of Fe; additionally, when the temperature is higher, the main restrictive link for the diffusion of Cu in Fe is the activity of the atom. Ole Martin Løvvik et al. [10] calculated the diffusivity of Zn in Zn3.6Sb3, Zn3.8Sb3 and Zn3.4Sb3 based on density functional theory, and confirmed that the rapid diffusion of Zn can lead to Zn precipitates and subsequently nanovoids. Hailong Yao et al. [11] investigated the collision processes of solid-state nano-sized ceramic particles by MD simulation. The simulation results demonstrate that the bonding formation of nano-sized TiO2 particles can be attributed to the atomic displacement and lattice distortion in the localized impact region of particle boundaries. Zhaopeng Hao et al. [12] simulated the cutting process of a nickel-based superalloy cut by silicon carbide with the MD method. The results show that the main diffusion mechanism of Ni, Cr and Fe atoms in cutting tools is grain boundary (GB) diffusion. Sabrina Sicolo et al. [13] calculated the diffusion coefficients and the activation barrier for diffusion by creating a structural model that accurately accounts for the partial occupancies and by performing molecular dynamics simulations. The results show that Li4PS4I is in fact a superionic conductor, with much higher conductivity than reported so far.
In this study, chromium/low-carbon steel surface composites were prepared by aqueous solution co-deposition and high-temperature solid diffusion technology, and the macro rule of chromium diffusion in low-carbon steel was studied. The diffusion process of the Cr/Fe interface was simulated by LAMMPS molecular dynamics software, and the macro diffusion law and micro diffusion mechanism under the condition of an infinite one-dimensional diffusion model were analyzed. It provides theoretical and practical data support for the preparation of chromium/low-carbon steel surface composites.

2. Experiment and Modeling

In this study, a Cr/low-carbon steel diffusion couple was prepared by electrodepositing a certain thickness of chromium on the cathode surface of low-carbon steel in an aqueous solution. Then, the chromium/low-carbon steel surface composite was prepared by high-temperature solid diffusion to cause chromium to diffuse to the interior of the low-carbon steel matrix. At the same time, the ideal semi-infinite Cr/Fe diffusion coupling model was simulated by LAMMPS software in the same solid state as the experiment.

2.1. Experiment

2.1.1. Preparation of Cr/Low-Carbon Steel Diffusion Couple

The composition of electrodeposited experimental reagents in aqueous solutions is shown in Table 1. CrCl3 (Sinopharm Chemical Reagent Co., Ltd., Shanghai, China) is used as a chromium source, and sodium citrate is used as a complexing agent [14]. KBr (Sinopharm Chemical Reagent Co., Ltd., Shanghai, China) is used to inhibit the production of Cr6+ and increase the brightness of the coating, NH4Cl is used to prevent the production of chlorine, KCl (Sinopharm Chemical Reagent Co., Ltd., Shanghai, China) is used to improve the dispersion ability and reduce power consumption [15], and boric acid is used to stabilize the pH value of the electrolyte. Two groups of reagents were weighed. One group was composed of chromium chloride and sodium citrate; the other group was composed of ammonium chloride, potassium chloride, boric acid and potassium bromide. These two groups of reagents were, respectively, added to two beakers, and dissolved fully with 50 mL deionized water. After stirring evenly, the solution was kept still for 12 h, and then mixed into a beaker. Finally, hydrochloric acid was added to adjust the pH value to 2.5.
The low-carbon steel was selected as ISO HR2 (σs195) steel (Sinopharm Chemical Reagent Co., Ltd., Shanghai, China), and its composition was wC = 0.20%, wMn = 0.24%, wP = 0.03%, wS = 0.02%, wSi = 0.11% and wFe = 99.40%. Low-carbon steel sheets were used as the cathode, with dimensions of 20 mm × 20 mm × 3 mm. The low-carbon steel sheets were polished with grain sizes from 320 to 2000 mesh, respectively, washed with 5% NaOH solution by ultrasonic immersion to remove oil stains, washed with 5% dilute hydrochloric acid for 5 s to remove the oxide film and finally washed with absolute ethanol. A graphite plate (Sinopharm Chemical Reagent Co., Ltd., Shanghai, China) was used as the anode, with dimensions of 50 mm × 100 mm × 5 mm. The anode plate was polished with a grain size of 320 mesh, and washed with 5% dilute hydrochloric acid to remove the oxide.
A beaker with a rotor and electrolyte was placed into a constant-temperature water pot, and the deposition experiment was carried out after the electrolyte reached the specified temperature. The schematic diagram of the electrodeposition experiment is shown in Figure 1, and the experimental parameters are shown in Table 2.

2.1.2. High-Temperature Solid Diffusion

Three temperature points were selected in the body-centered cubic structure temperature range (973 K, 1073 K and 1173 K) and face-centered cubic structure temperature range (1273 K, 1323 K and 1373 K) for the 180 min high-temperature solid-state diffusion experiments separately. The annealing experimental apparatus is shown in Figure 2 (Derun (Shanghai) Electric Furnace Co., Ltd., Shanghai, China). The sample was placed at the cold end of the tubular furnace inlet. Before diffusion annealing, the tubular furnace was filled with argon and kept at 1 atmospheric pressure. Argon gas with a flow rate of 100 mL·min−1 was continuously introduced for atmosphere protection. When the furnace temperature reached the preset temperature, the sample was pushed to the constant-temperature belt of the furnace for insulation. After heat preservation, the sample was pushed to the cold end of the tubular furnace outlet and removed after cooling.

2.1.3. Analysis and Detection

The metallographic structure of a section of the sample was analyzed with an Axiovert 200 Mat Zeiss metallographic microscope (ZEISS, Jena, Germany). The surface, cross-sectional morphology and element distribution of the sample were detected using a Zeiss Ultra55 field emission scanning electron microscope (ZEISS, Jena, Germany), and the element compositions of the micro region were determined by its attached energy spectrometer. The phase composition of the cathode surface was detected with a D/MAX2500PC X-ray diffractometer (Rigaku, Tokyo, Japan). The content of chromium and nickel in the surface composites of low-carbon steel along the diffusion layer was detected with a GDA750 glow discharge spectrometer (SPECTRO Analytical Instruments GmbH, Kleve, Germany).

2.2. Modeling

The molecular dynamics simulation process was consistent with the experimental conditions. Different lattice constants will affect the interface matching, and different supercells need to be set to meet the interface lattice matching requirements of the two. It was assumed that the simulation model was an ideal semi-infinite Cr/Fe diffusion coupling model, and the high-temperature solid diffusion process was simulated at atmospheric pressure in the temperature range of body-centered cubic (<1185 K) and face-centered cubic (1185~1667 K), respectively. In the low-temperature region, the lattice constants of iron and chromium were 2.8664 Å and 2.8846 Å, respectively. The iron supercell was (15 × 15 × 15) and the chromium supercell was (15 × 15 × 15), so that the matching degree was consistent. The model assumed that the lower half was single-crystal iron, the upper half was single-crystal chromium, and the contact surface was an ideal (100) plane. There were 13,500 atoms in the final model, including 6750 chromium atoms and 6750 iron atoms, as shown in Figure 3a. In the high-temperature region, the lattice constants of iron and chromium were 3.591 Å and 2.8846 Å, respectively. The iron supercell was (12 × 12 × 12) and the chromium supercell was (15 × 15 × 15), so that the matching degree was consistent. The model assumed that the lower half was single-crystal iron, the upper half was single-crystal chromium, and the contact surface was an ideal (100) plane. There were 13,662 atoms in the final model, including 6750 chromium atoms and 6192 iron atoms, as shown in Figure 3c.
Gaussian random distribution was selected for the initial velocities of atoms in the model, and periodic boundary conditions were selected in the x, y and z axis directions. Five layers of atoms at the bottom of the iron and the top of the chromium were, respectively, fixed to meet the requirement of a semi-infinite width interface. The motion of iron and chromium atoms in the z axis direction was simulated. The simulation process selected the nose temperature control method and NPT ensemble. The potential function was the Fe-Cr-Ni improved EAM atomic potential function published by Zhou [16], which was also suitable for the simulation of ferrite and austenite and was confirmed to be in good agreement with the experimental data. The running time step was 2 femtoseconds (fs). The simulation process firstly was relaxed for 10 picoseconds (ps) at room temperature to allow the model to reach equilibrium, as shown in Figure 3b,d. Then, the relaxation model was kept at 973 K, 1073 K, 1173 K, 1273 K, 1323 K and 1373 K for 130 ps, respectively.

3. Results and Discussion

3.1. Experimental Study on Solid Diffusion Kinetics of Cr/Low-Carbon Steel

3.1.1. High-Temperature Solid Diffusion Sample

Figure 4 shows the surface scanning electron microscope photograph, energy spectrum and surface scanning results of the Cr/low-carbon steel diffusion couple obtained by electrodeposition. The coating on the substrate surface is evenly distributed. This is because a bidirectional pulse power supply is used in the electrodeposition process. The forward electrification process promotes the reduction reaction and deposition on the cathode, while the reverse electrification causes a small amount of dissolution of the cathode, reducing the concentration polarization of the solution near the cathode surface, which renders the cathode surface smooth. It can be seen that the substrate surface has been completely covered with a certain thickness of the chromium deposition layer dominated by the (110) crystal plane.
Figure 5 shows the section metallography of the Cr/low-carbon steel diffusion couple before and after 1073 K solid-state diffusion annealing for 180 min. It can be seen from Figure 5a that a deposition layer of approximately 30 μm thickness is attached to the surface of the low-carbon steel substrate, and has good corrosion resistance. After high-temperature solid-state diffusion annealing, the surface composite with a certain thickness of gradient layer is prepared, as shown in Figure 5b. The cross-section of the sample is basically divided into three parts: the outermost layer is the chromium layer with good corrosion resistance, the middle is the gradient layer after diffusion, and the inner is the low-carbon steel matrix. There are some small cracks in the sample deposit. This is because the process of electrodeposition of chromium from the aqueous solution is accompanied by a large degree of hydrogen evolution reaction [17], and the bubbles generated on the cathode surface are not discharged in time, resulting in a relatively loose chromium deposition layer. The loose structures are rearranged to form microcracks after high-temperature solid diffusion. The gradient layer gradually corrodes from the outside to the inside, indicating that chromium and low-carbon steel have mutual diffusion. The grain size near the matrix of the low-carbon steel is much smaller than that of the matrix. This may be because chromium carbide is formed by the rich carbon at the grain boundary and chromium is diffused along the grain boundary, which limits the grain growth during diffusion annealing.

3.1.2. Distribution of Elements after Solid Diffusion

The diffusion process of chromium atoms on the surface of low-carbon steel is non-uniform. In this study, the composition of different depths in a certain area of the sample surface was averaged by a glow discharge spectrometer to express the general rule of chromium diffusion on the low-carbon steel surface. Figure 6 shows the glow discharge spectrometry (GDOES) profiles of each element along the depth direction of the sample after high-temperature solid-state diffusion. It can be seen that the content of chromium decreases with the increase in depth, and the element content of Fe increases with the increase in depth. In the same holding time, the thickness of the diffusion layer increases with the increase in annealing temperature. This indicates that increasing the temperature can improve the diffusion and migration ability of chromium atoms.

3.1.3. Diffusion Law of Chromium on the Surface of Low-Carbon Steel

The diffusion process of the Cr/low-carbon steel diffusion couple conforms to the full infinite one-dimensional diffusion model. Therefore, Fick’s second law [18] and Den Broeder’s method [19] were used to calculate the diffusion coefficients of chromium at different volume concentrations on the surface of low-carbon steel at the same temperature. According to the element percentage content curve of chromium, nine groups of percentage content and corresponding depths were obtained by taking the highest point of chromium content as the zero point and taking points in the range of 10%–90% in steps of 10%. The fitting equation CCr = f(x) for chromium diffusion at different temperatures was obtained by converting the percentage content of chromium into the volume concentration and performing Boltzmann function fitting. According to D C B * = 1 2 t ( C B x ) x * [ ( 1 y C * ) x * ( C B * C B 1 ) d x + y C * x * + ( C B 2 C B * ) d x ] , Matlab software was used to calculate the mathematical expressions of ( C B / x ) x * , x * ( C C B * C B 1 ) d x and x * + ( C B 2 C C B * ) d x of the fitting equation of chromium atom diffusion on the surface of low-carbon steel at different temperatures. Finally, the diffusion coefficients of chromium atoms at different volume concentrations were calculated. Figure 7 shows the variation in the calculated diffusion coefficient of chromium atoms with the concentration at different temperatures. It can be seen from that the diffusion coefficient of chromium atoms increases with the increase in chromium content at the same temperature. Moreover, at the same concentration, the diffusion coefficient of chromium atoms increases first and then decreases in the range of 973–1173 K, and gradually increases in the range of 1173–1373 K.
The average diffusion coefficient of chromium is obtained by averaging the fitting curve of the diffusion coefficient in the range of the measured volume concentration, as shown in Table 3.

3.1.4. Diffusion Law of Chromium Atoms on the Surface of Low-Carbon Steel

Atoms are affected by many factors in the diffusion process, including the temperature, crystal defects, grain size, diffusion mode, crystal structure, solid solution type, concentration and properties of diffusion components, third element, etc. In the macro scope, concentration and temperature are the main influencing factors. At the same time, the allotropic transformation also has a greater impact on atomic diffusion. Figure 8 shows the fitting rule of the average diffusion coefficient of chromium atoms on the surface of low-carbon steel calculated at different temperatures. It is mainly divided into three stages. The first stage is the low-temperature region (<1000 K), and the average diffusion coefficient of chromium atoms increases with the increase in temperature. In this stage, the lattice structure of the low-carbon steel matrix is body-centered cubic, and it is relatively easy for chromium to diffuse on the low-carbon steel surface. The second stage is the crystal structure transition region (1000–1173 K), and the average diffusion coefficient of chromium atoms decreases with the increase in temperature. According to the iron-carbon phase diagram, the low-carbon steel with a carbon content of 0.10 wt.% begins to transform from ferrite to austenite at 1000 K, and it ends at approximately 1173 K. The appearance of austenite increases the difficulty of diffusion of chromium atoms and reduces the average diffusion coefficient. The third stage is the high-temperature region (>1173 K), and the average diffusion coefficient of chromium atoms also increases with the increase in temperature. In this stage, the lattice structure of the low-carbon steel matrix is face-centered cubic, and it is relatively difficult for chromium to diffuse on the low-carbon steel surface. However, the increase in temperature will increase the thermal activation energy of chromium atoms and increase the diffusion probability. Therefore, the average diffusion coefficient will gradually increase with the increase in temperature in the same crystal structure range.
The general variation rule of the chromium diffusion coefficient and temperature was obtained by data fitting. It can be used to calculate the change law of the chromium diffusion coefficient and temperature without considering the change in crystal structure. The Cr diffusion coefficients in ferroalloy calculated by K. Huang and B. Million et al. are in the same order of magnitude as our calculation results, which confirms the accuracy of our calculation results [20,21]. However, due to the different compositions of the materials studied, there are certain differences in the numerical values. In addition, K. Huang only calculated the diffusion coefficient in the bcc crystal structure, and B. Million et al. only calculated the diffusion coefficient in the fcc crystal structure. However, we have obtained the diffusion law of Cr on the surface of low-carbon steel in the whole crystal transition temperature range. This is more representative and applicable for the formulation of the optimal preparation process of chromium/low-carbon steel surface composites.
D Cr = 3.07 × 10 22 T 4 + 1.47 × 10 18 T 3 2.63 × 10 15 T 2 + 2.07 × 10 12 T 6.11 × 10 10

3.2. Molecular Dynamics Simulation of Cr/Fe Solid Diffusion

The experimental diffusion results of the chromium/low-carbon steel couple only express the macro diffusion rule of chromium on the surface of low-carbon steel, and they cannot explain the micro mechanism of chromium diffusion on the surface of low-carbon steel and the specific factors affecting the chromium diffusion. It needs further analysis and verification in combination with molecular dynamics simulation. Therefore, in the molecular dynamics simulation, we further studied the influence of lattice distortion and crystal structure transformation on the diffusion, the radial distribution function and the atomic diffusion path in the simulation process.

3.2.1. Basic Characteristics of Cr/Fe Solid Diffusion

Figure 9 shows the atomic model of iron-chromium solid diffusion after 130 ps heat preservation at different temperatures. Table 4 shows the diffusion statistics of chromium in iron at different temperatures. It can be seen that the number and depth of iron and chromium atom diffusion are greatly affected by the temperature and crystal structure. In the body-centered cubic structure temperature range, iron and chromium atoms have obvious interdiffusion, and the number and depth of interdiffusion atoms gradually increase with the increase in temperature. In the face-centered cubic structure temperature range, the interdiffusion is also obvious, but the system is more disordered.

3.2.2. Theoretical Diffusion Coefficient of Cr/Fe Solid Diffusion

The molecular dynamics of z axis data in the Fe/Cr system were screened layer by layer, and the simulated relationship between the atom concentration and diffusion depth at different temperatures is shown in Figure 10. It can be seen that interdiffusion occurs at the interface of the diffusion couple, and the thickness of the diffusion layer gradually increases with the increase in temperature in the α-Fe and γ-Fe temperature range, respectively. This indicates that more atoms participate in the diffusion process.
According to Einstein’s equation, the atomic diffusion coefficient can be calculated by the atomic mean square displacement (MSD) in the diffusion process [22]. In the interface diffusion simulation, the diffusion process of atoms in the direction perpendicular to the interface was investigated, so the dimension was chosen to be 1. Therefore, the diffusion coefficient of the atom is 1/2 of the slope of the MSD-t curve in the mean square displacement diagram. Table 5 shows the fitted straight line and diffusion coefficient of the mean square displacement graph at different temperatures.
Figure 11 shows the molecular dynamics simulation results of the mean square displacement and diffusion coefficient of chromium atoms at different temperatures. It can be seen that the simulation results coincide well with the experimental results. However, the α- Fe and γ- Fe coexisting phase does not exist in simulation process, so it is impossible to connect the two curves of the chromium diffusion coefficient.
On one hand, the diffusion coefficient of chromium increases with the increase in temperature in the temperature range of the body-centered cubic lattice and face-centered cubic lattice. However, the diffusion coefficient decreases rapidly near 1173 K. This is due to the transformation from a bcc lattice to an fcc lattice in the iron matrix. The chromium atoms need more energy to jump over the energy barrier and diffuse.
On the other hand, considering that the lattice constants of Cr, α-Fe, γ-Fe are different, it is inevitable that the established supercell model will have different matching degrees and form an incoherent interface. The atoms need to be rearranged in the system so as to minimize the energy. Figure 12 shows the model of a small system superlattice after complete relaxation. It can be seen that the bond length of γ-Fe-Cr varies from 2.139 to 2.889 Å, which is much larger than the α-Fe-Cr bond length of 2.501 to 2.871 Å. This indicates that the lattice distortion of the γ-Fe-Cr interface model system is larger. The higher free energy of the system is favorable for chromium atoms to jump over the potential barrier and form vacancies. This can promote the migration of chromium atoms and improve the diffusion coefficient. Therefore, the diffusion of the chromium in iron is the combined action of the temperature, crystal structure and lattice distortion, and the diffusion coefficients of chromium in α-Fe and γ-Fe have little difference.

3.2.3. Diffusion Mechanism of Chromium Atom

Figure 13 shows the radial distribution function at the Fe/Cr diffusion couple interface after 130 ps simulated diffusion. It can be seen that with the increase in temperature, the radial distribution function of atoms in the diffusion layer appears obviously flattened and broadened. The characteristics of short-range order and long-range disorder indicate that the structure of the diffusion layer presents a chaotic state during the diffusion bonding process, and the diffusion process of Fe and Cr shows the trend of amorphization in the α-Fe and γ-Fe regions. Since there is no concept of gaps and vacancies in the amorphous phase, the atomic diffusion mechanism can only be studied from the boundary region of the diffusion interface [23,24].
The simulation results of the Fe/Cr diffusion couples at 1073 K and 1273 K were selected to study the mechanism of atomic diffusion. The entirety of the simulation results have a total of three million steps, and the atomic coordinates are output every 5000 steps. In total, 600 coordinate data can be obtained. In the simulation results, the chromium atoms diffused into the iron were selected as the target for backtracking. The hopping mode and hopping frequency were counted, and the diffusion mechanism in the diffusion process was studied. Figure 14 shows the trajectories of chromium atoms determined after backtracking in the 1073 K and 1273 K simulation systems, respectively. It can be seen that the hopping range of chromium atoms is relatively wide, and the degree of hopping in single-crystal iron is greater in the α-Fe temperature range (1073 K). This is mainly because the density of the body-centered cubic lattice structure is low, and chromium atoms can relatively easily jump. Meanwhile, most of the trajectories of chromium atoms are only in single-crystal chromium in the γ-Fe temperature range (1373 K).
Table 6 shows the transition modes and frequencies of chromium atoms at different temperatures between 0 and 6 nanoseconds (ns). It can be seen that the vacancy diffusion mechanism of chromium atoms in iron is mainly the first-neighbor transition in the α-Fe and γ-Fe temperature range. The probability of the first-neighbor transition occurring in the γ-Fe temperature range is higher. When chromium atoms diffuse in an ideal Fe/Cr diffusion couple, there is no large energy fluctuation between the iron atoms in the system. Chromium atoms can only diffuse across the smallest energy barrier by the vacancy mechanism of the first-neighbor transition.

4. Conclusions

  • The Cr/low-carbon steel diffusion couple was successfully prepared by the hydro-electrodeposition method. The surface composite with a certain thickness of diffusion gradient layer was formed after high-temperature solid-state diffusion. Chromium atoms diffused along the grain boundaries of the low-carbon steel matrix and played a pinning role at the grain boundaries, preventing grain growth.
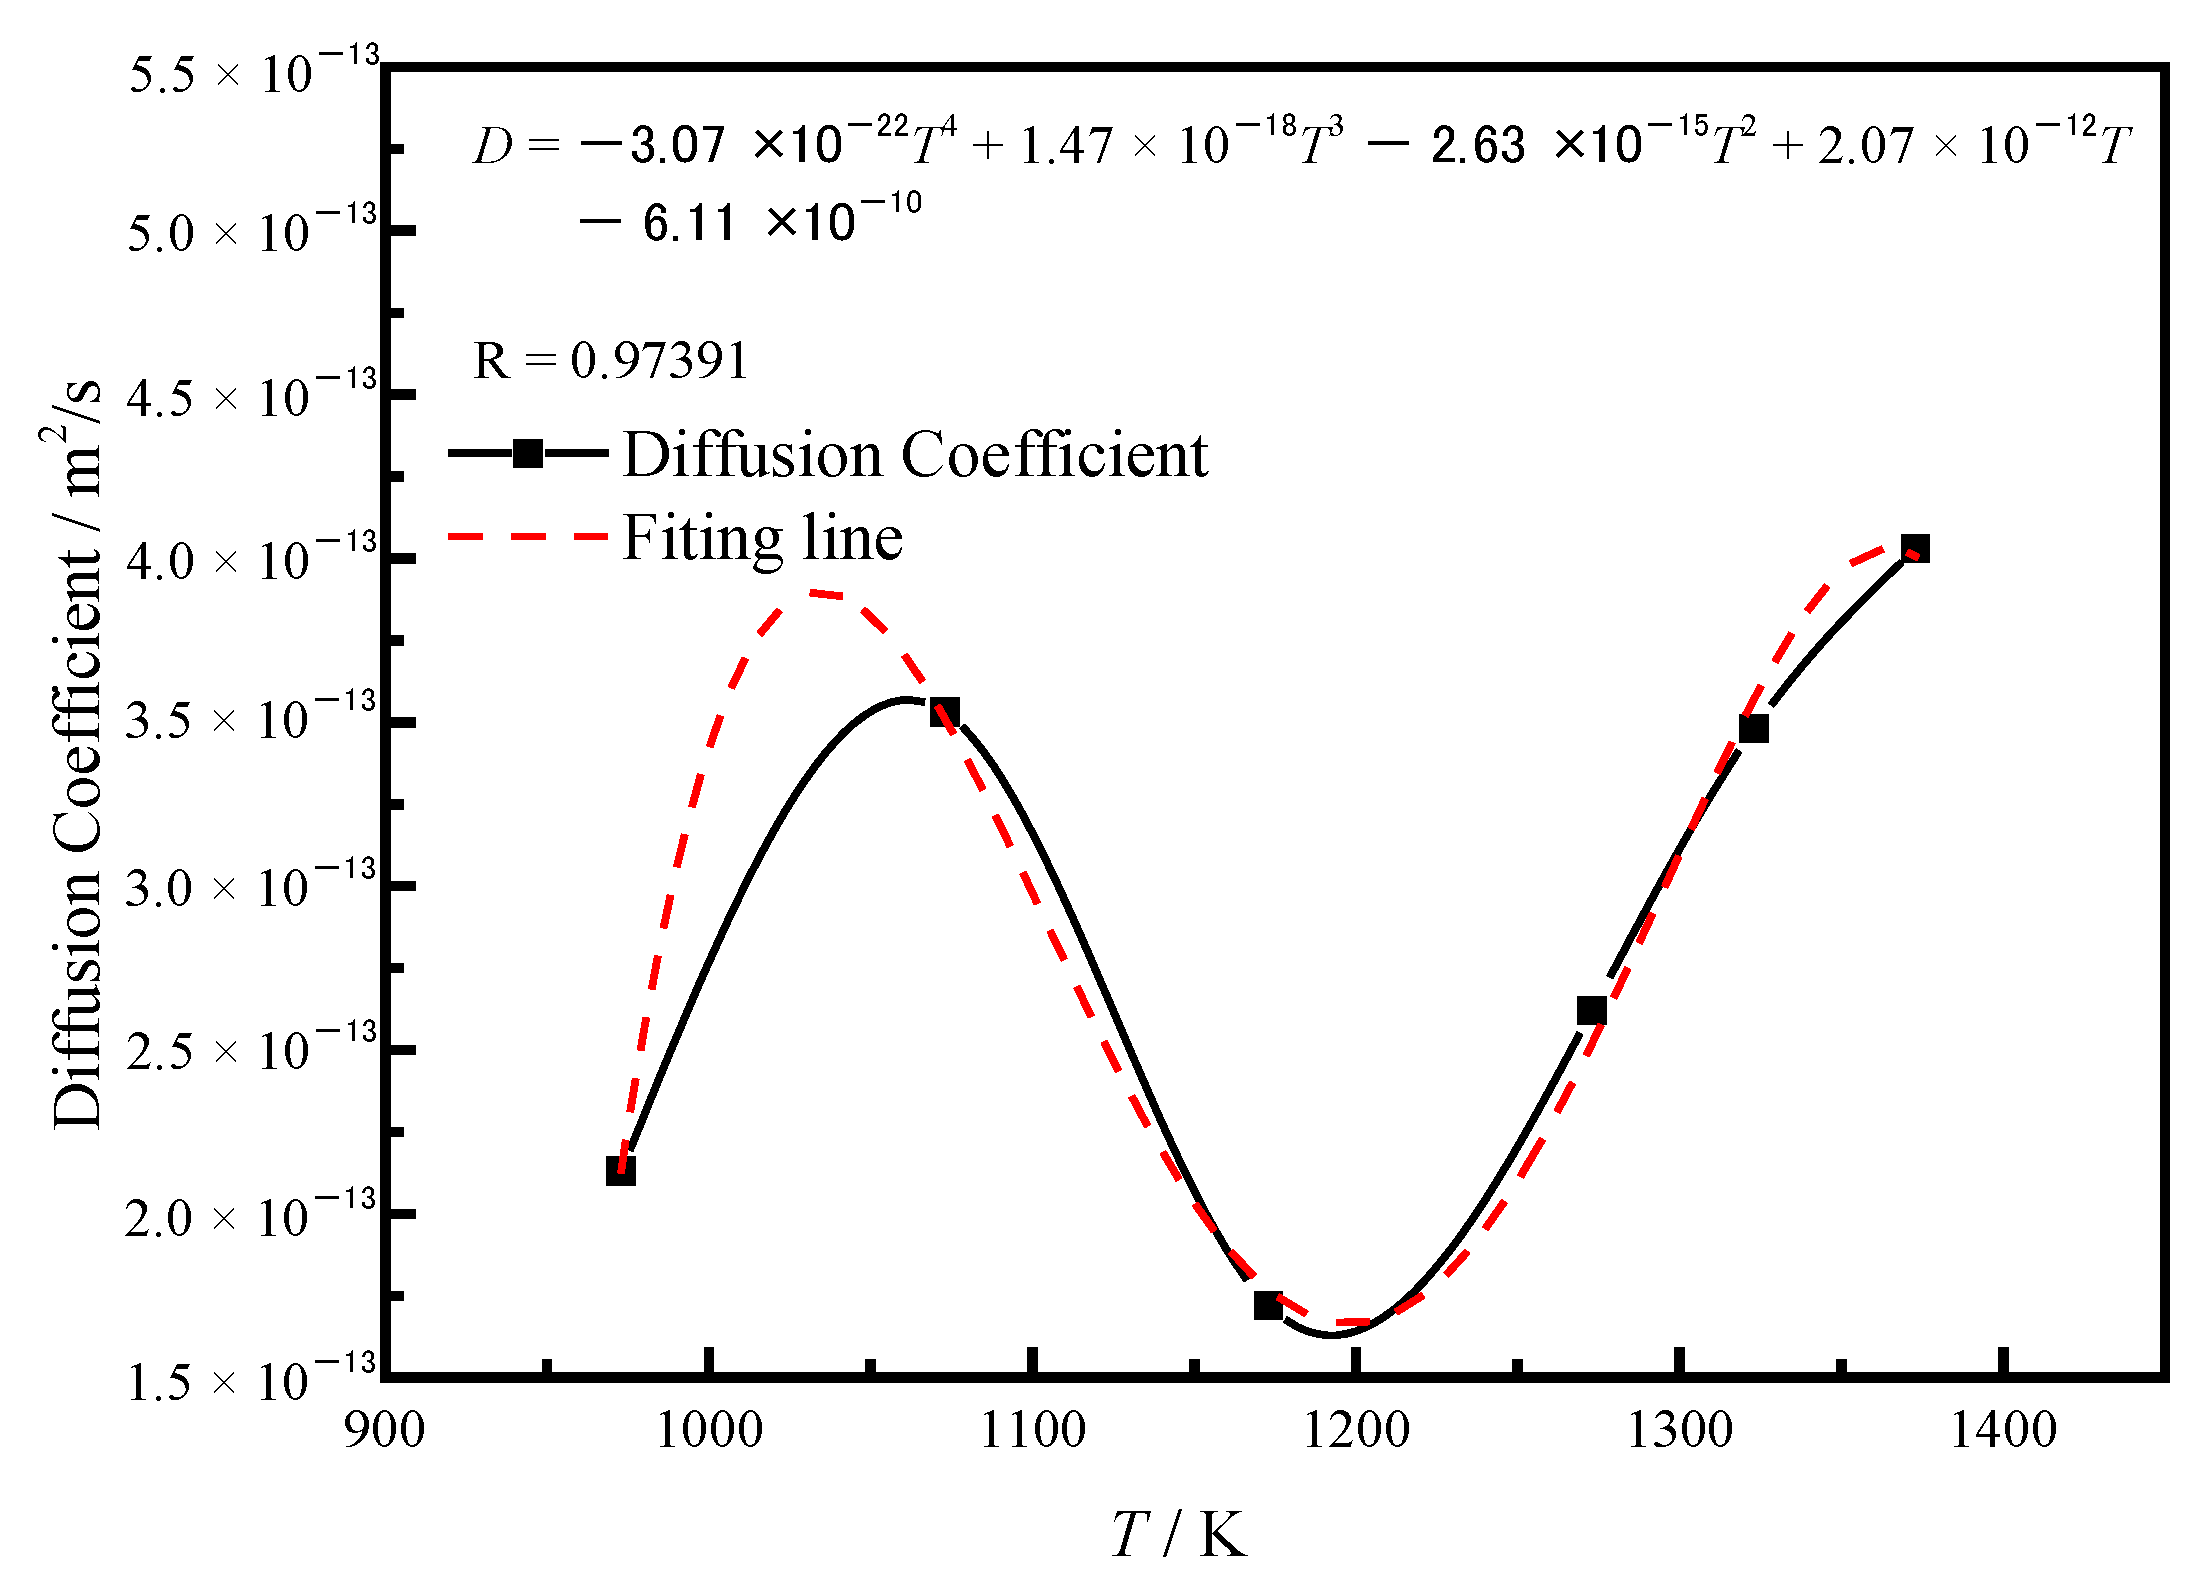
  • In the range of 973~1373 K, the crystal structure had a great influence on the diffusion of chromium. The diffusion rate of chromium in the body-centered cubic crystal structure was significantly higher than that in the face-centered cubic crystal structure. However, the diffusion coefficient of chromium increased gradually with the increase in temperature in the same crystal structure system. The general law between the average diffusion coefficient and the temperature of chromium atoms on the surface of low-carbon steel is DCr = –3.07 × 10⁻²²T4 + 1.47 × 10⁻¹⁸T3 − 2.63 × 10⁻¹⁵T2 + 2.07 × 10⁻¹²T − 6.11 × 10⁻¹⁰.
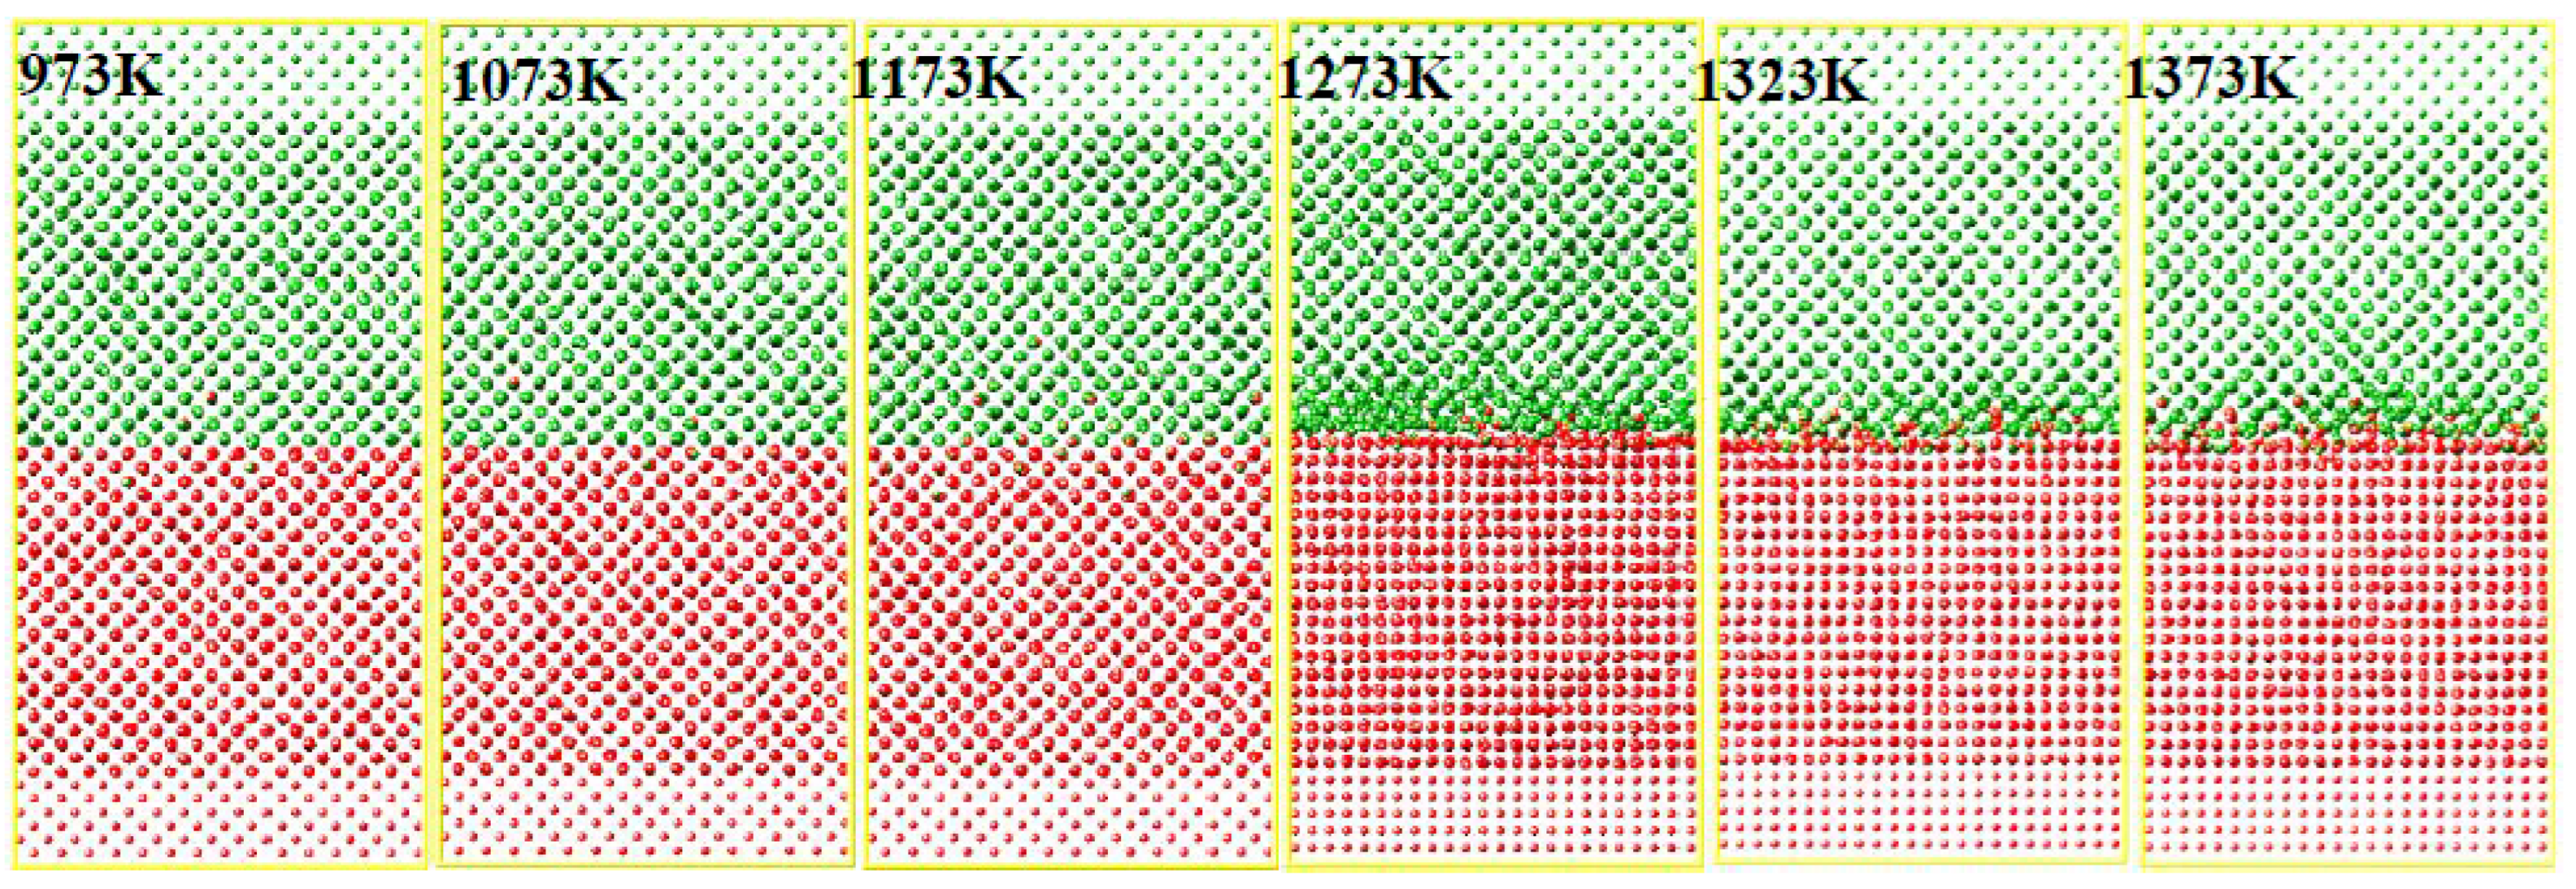
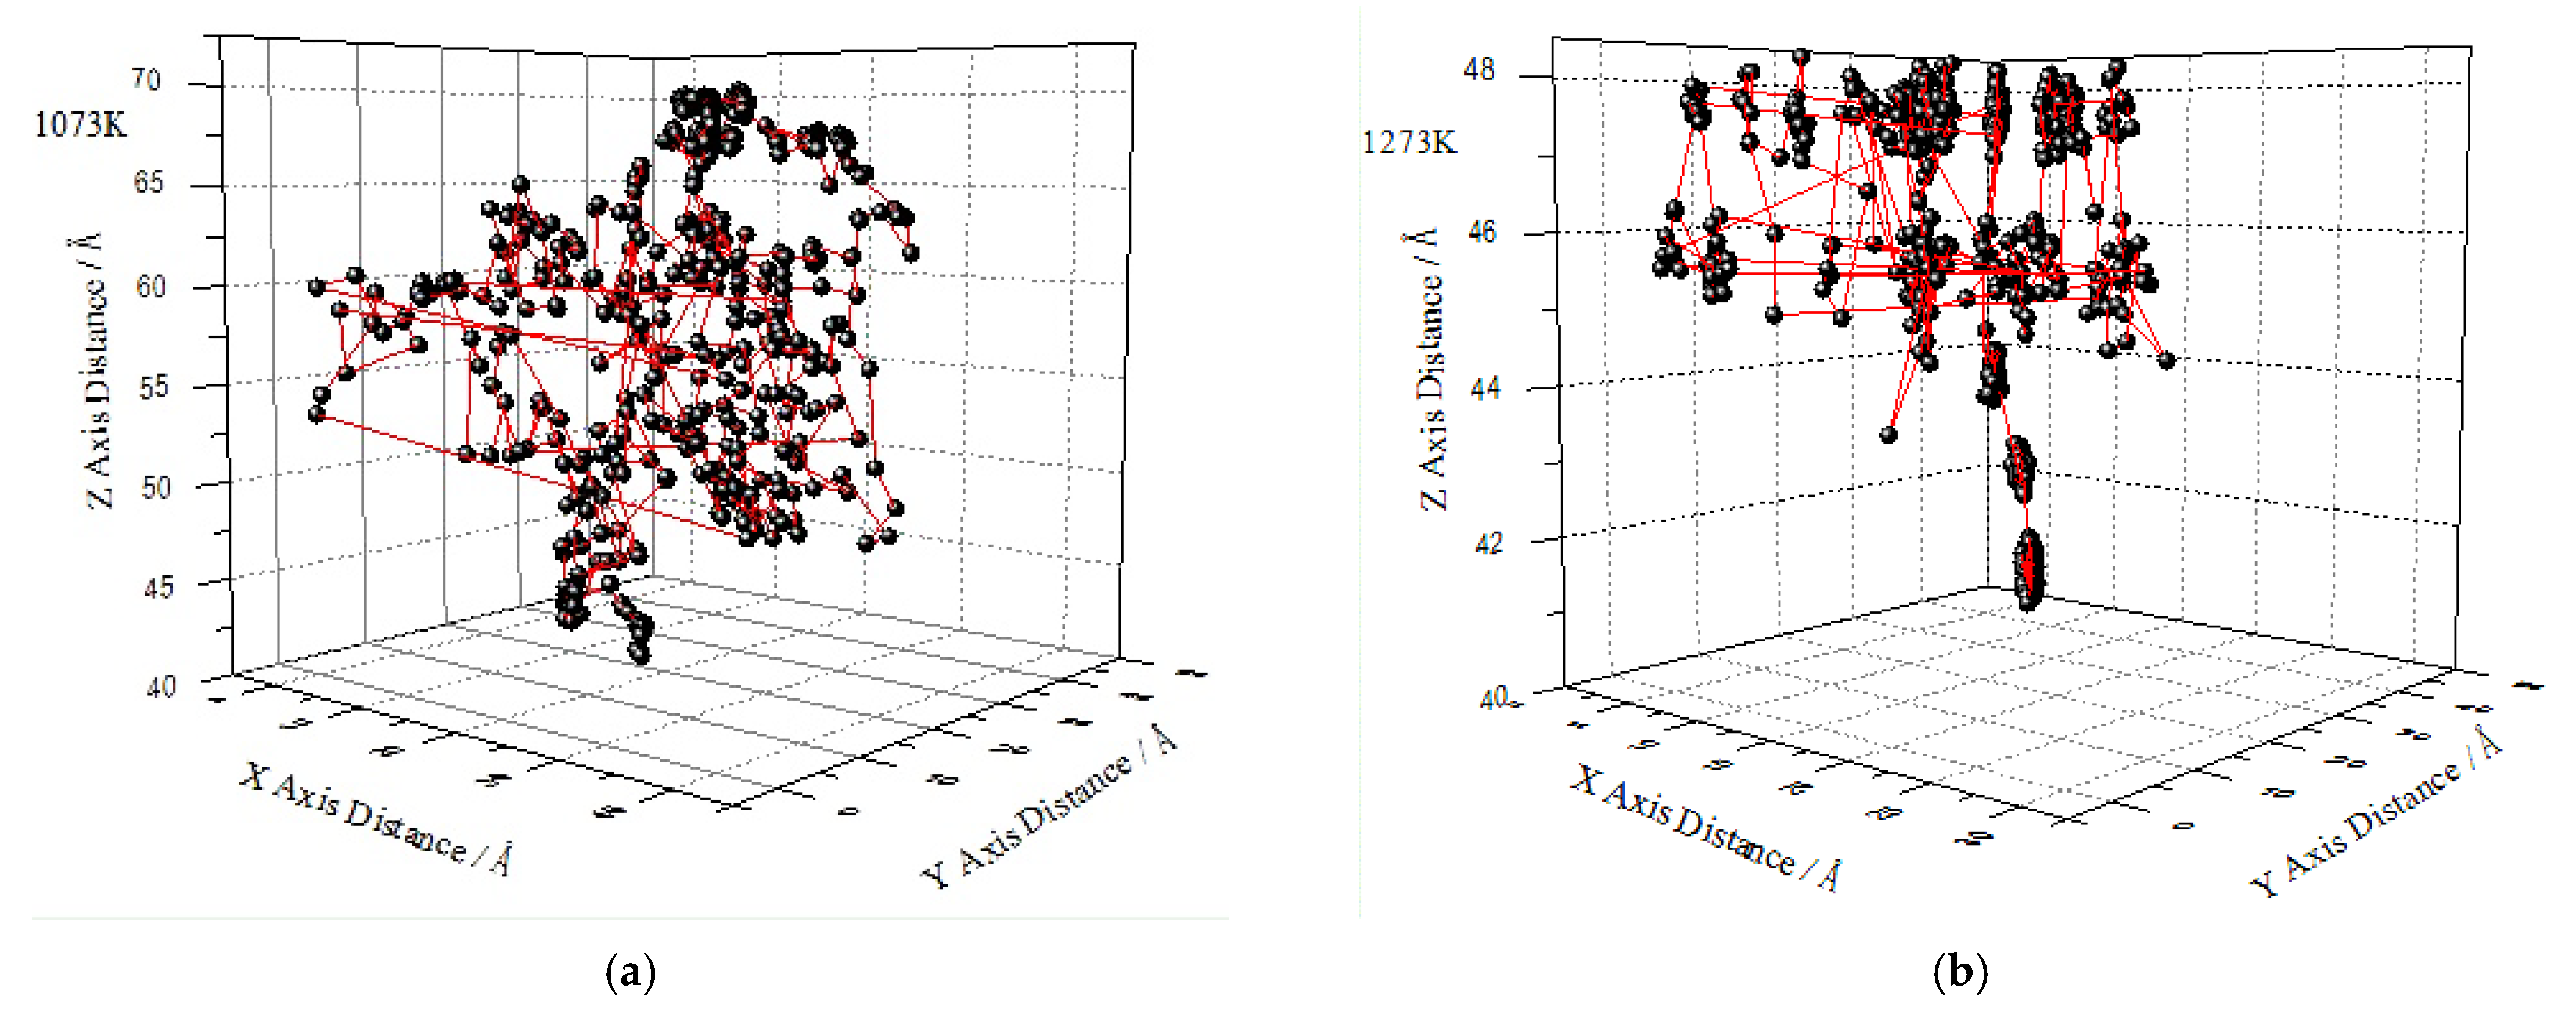
  • Under ideal conditions, the diffusion of chromium atoms on the surface of an iron substrate simulated by molecular dynamics was consistent with the experimental results. Due to the combined effect of the temperature, crystal structure transformation and lattice distortion, the diffusion coefficient of chromium in the α-Fe and γ-Fe temperature range was not significantly different. The vacancy diffusion mechanism of the first-nearest-neighbor transition was the main diffusion mechanism.

Author Contributions

Conceptualization, S.Z. and Y.L.; methodology, H.Z.(Haichao Zhang) and H.Z.(Hongbo Zhang); software, S.Z. and H.Z.; validation, H.Z. and X.Z.; investigation, S.Z. and X.Z.; writing—review and editing, S.Z. and Y.L.; funding acquisition, S.Z. and Y.L. All authors have read and agreed to the published version of the manuscript.

Funding

The investigated is financially supported by the National Natural Science Foundation of China (Project No. 51974129) and the Hebei Province “Three Three Three Talent Project” Funding Project (Project No. A202101030).

Institutional Review Board Statement

Exclude this statement.

Informed Consent Statement

Not applicable.

Data Availability Statement

Data sharing is not applicable to this article.

Conflicts of Interest

The authors declare no conflict of interest.

References

  1. Yang, H.Q.; Zhang, Q.; Li, Y.M.; Liu, G.; Huang, Y. Effects of Mechanical Stress and Cathodic Protection on the Performance of a Marine Organic Coating on Mild Steel. Mater. Chem. Phys. 2021, 261, 124233. [Google Scholar] [CrossRef]
  2. Vinodhini, S.P.; Xavier, J.R. Evaluation of Corrosion Protection Performance and Mechanical Properties of Epoxy-triazole/graphene Oxide Nanocomposite Coatings on Mild Steel. J. Mater. Sci. 2021, 56, 7094–7110. [Google Scholar] [CrossRef]
  3. Kim, K.; Lee, Y.; Jeong, J.H. Dropwise condensation induced on chromium ion implanted aluminum surface. Nucl. Eng. Technol. 2019, 51, 84–94. [Google Scholar] [CrossRef]
  4. Sallam, H.E.M.; El-Aziz, K.A.; El-Raouf, H.A.; Elbanna, E.M. Failure analysis and flexural behavior of high chromium white cast iron and AISI4140 Steel bimetal beams. Mater. Des. 2013, 52, 974–980. [Google Scholar] [CrossRef]
  5. Li, Y.G.; Gong, M.Y.; Wang, K.; Li, P.; Yang, X.; Tong, W.P. Diffusion behavior and mechanical properties of high chromium cast iron/low carbon steel bimetal. Mat. Sci. Eng. A-Struct. 2018, 718, 260–266. [Google Scholar] [CrossRef]
  6. Zhang, S.X.; Li, Y.G.; Wang, C.; Zhao, X.P. Preparation of a Cr coating on low-carbon steel by electrodeposition in a NaCl-KCl-NaF-Cr2O3 molten salt. Int. J. Electrochem. Sci. 2019, 14, 91–101. [Google Scholar] [CrossRef]
  7. Yin, H.; Song, W.; Liu, Q.; Zhu, G.; Zhang, J.; Yu, Y.; Yin, C. Effect of Different Contents of WC on Microstructure and Properties of NiCrMo Coatings Prepared by PTA. Coatings 2022, 12, 1574. [Google Scholar] [CrossRef]
  8. Guo, K.X.; Xia, P.J. Research Progress and Prospect of Wear Resistance of High Chromium Cast Iron. Foundry Technol. 2018, 39, 2138–2141. [Google Scholar]
  9. Li, H.; Ma, T.; He, Y.; Li, Y. Research on the Diffusion Behavior of Cu in Low-Carbon Steel under High Temperatures. Crystals 2022, 12, 207. [Google Scholar] [CrossRef]
  10. Løvvik, O.M.; Rauwel, P.; Prytz, Ø. Self-diffusion in Zn4Sb3 from first-principles molecular dynamics. Comp. Mater. Sci. 2011, 9, 2663–2665. [Google Scholar] [CrossRef]
  11. Yao, H.-L.; Yang, G.-J.; Li, C.-J. Molecular dynamics simulation and experimental verification for bonding formation of solid-state TiO2 nano-particles induced by high velocity collision. Ceram. Int. 2019, 4, 4700–4706. [Google Scholar] [CrossRef]
  12. Hao, Z.; Cui, R.; Fan, Y.; Lin, J. Diffusion mechanism of tools and simulation in nanoscale cutting the Ni–Fe–Cr series of Nickel-based superalloy. Int. J. Mech. Sci. 2019, 150, 625–636. [Google Scholar] [CrossRef]
  13. Sicolo, S.; Kalcher, C.; Sedlmaier, S.J.; Janek, J.; Albe, K. Diffusion mechanism in the superionic conductor Li4PS4I studied by first-principles calculations. Solid State Ionics 2018, 319, 83–91. [Google Scholar] [CrossRef]
  14. da Silva, G.; de Lima, R.; Santos, F.; de Menezes, F.; Morais, L.; da Silva Filho, L. Influence of the complexing agent sodium citrate on the chemical composition, surface morphology and corrosion resistance of Ni-Fe electrodeposits. Trans. IMF 2019, 97, 230–236. [Google Scholar] [CrossRef]
  15. Chang, J.; Chen, J.; Song, J.; Huang, A.; Liu, Y.F. Preparation and Properties of Electrodeposited Nanocrystalline Fe-Ni-Cr Coating. Corros. Sci. Prot. Technol. 2015, 27, 581–584. [Google Scholar]
  16. Zhou, X.W.; Foster, M.E.; Sills, R.B. An Fe-Ni-Cr embedded atom method potential for austenitic and ferritic systems. J. Comput. Chem. 2018, 39, 2420–2431. [Google Scholar] [CrossRef] [PubMed]
  17. Deng, S.H. Studies on Technology and Basic Mechanism of Pulse Plating Nanocrystalline Cr-Ni-Fe Alloy. Doctoral Thesis, Zhongnan University, Changsha, China, 2003. [Google Scholar]
  18. Dong, Y.; Wang, Y.; Zhang, F. Inorganic and Analytical Chemistry, 3rd ed.; Science Press: Beijing, China, 2011; pp. 59–60. [Google Scholar]
  19. Den, B.F. A general simplification and improvement of the Matano-boltzmann method in the determination of the interdiffusion coefficients in binary systems. Scr. Metall. 1969, 3, 321–325. [Google Scholar]
  20. Huang, K.; Park, Y.; Zhou, L.; Coffey, K.R.; Sohn, Y.H.; Sencer, B.; Kennedy, J. Effects of Cr and Ni on interdiffusion and reaction between U and Fe–Cr–Ni alloys. J. Nucl. Mater. 2014, 451, 372–378. [Google Scholar] [CrossRef]
  21. Million, B.; Rijzickov, J.A.; Vrestal, J. Diffusion in Fe-Ni-Cr Alloys with an F.C.C. Lattice. Mater. Sci. Eng. 1985, 72, 85–100. [Google Scholar] [CrossRef]
  22. Gao, Y.; Takahashi, M.; Cavallotti, C.; Raos, G. Molecular dynamics simulation of metallic impurity diffusion in liquid lead-bismuth eutectic (LBE). J. Nucl. Mater. 2018, 501, 253–260. [Google Scholar] [CrossRef]
  23. Xiong, Z.; Li, K.; Zhou, N.G. Molecular dynamics study of solid-liquid interface structure in Mg-Al alloy melt. J. At. Mol. Phys. 2019, 36, 123–128. [Google Scholar]
  24. Wu, J.Z. Molecular Dynamics Simulation of Diffusion for Ni-Zr and Ni-Al. Master’s Thesis, Guangxi University, Guangxi, China, 2019. [Google Scholar]
Figure 1. Schematic diagram of electrodeposition experimental equipment in aqueous solution.
Coatings 13 00098 g001
Figure 2. Diagram of diffusion annealing system. 1—High-purity Ar gas; 2—Argon purifier; 3—Flowmeter; 4—Control power supply; 5—Atmosphere tube furnace; 6—Water; 7—Vacuum pump.
Coatings 13 00098 g002
Figure 3. Fe-Cr interface and relaxation model (a,b) Fe is BCC lattice; (c,d) Fe is FCC lattice). (a,b) Body-centered cubic lattice of iron; (c,d) face-centered cubic lattice of iron.
Coatings 13 00098 g003
Figure 4. Surface detection results of chromium/low-carbon steel diffusion couple prepared by aqueous solution electrodeposition (150 mA·cm−2, 20 min, 303 K, pH = 2.5). (a) SEM image; (b) EDS image; (c) XRD image.
Coatings 13 00098 g004
Figure 5. Section metallography of chromium/low-carbon steel diffusion couple before and after solid-state diffusion annealing (4% nitric alcohol solution,20~25 s). (a) Before solid diffusion annealing; (b) after solid diffusion annealing.
Coatings 13 00098 g005
Figure 6. Distribution of elements in sample after diffusion at different temperatures.
Coatings 13 00098 g006aCoatings 13 00098 g006b
Figure 7. Relationship between diffusion coefficient of Cr and section depth and concentration after solid diffusion annealing at different temperatures.
Coatings 13 00098 g007
Figure 8. Average diffusion coefficient of Cr in low-carbon steel at different temperatures.
Coatings 13 00098 g008
Figure 9. Atomic model of iron-chromium solid diffusion after 130 ps heat preservation at different temperatures.
Coatings 13 00098 g009
Figure 10. The relationship between iron, chromium concentration and depth at different temperatures simulated by molecular dynamics.
Coatings 13 00098 g010
Figure 11. MSDs of chromium atom and the relationship between diffusion coefficient and temperature simulated by molecular dynamics. (a) MSD—Time; (b) Diffusion coefficient—Temperature.
Coatings 13 00098 g011
Figure 12. Atomic model of iron and chromium in small supercell system after relaxation. (a) Cr and α-Fe; (b) Cr and β-Fe.
Coatings 13 00098 g012
Figure 13. Radial distribution functions of different regions at different temperatures after simulation for 130 ps.
Coatings 13 00098 g013
Figure 14. Diffusion path of chromium atoms in simulation process at different temperatures. (a) 1073 K; (b) 1273 K.
Coatings 13 00098 g014
Table 1. Electrodeposition reagents of experiment in aqueous solution.
ChemicalsCrCl3C6H5Na3O7KClH3BO3KBrNH4Cl
purity/%≥99.5≥99.0≥99.5≥99.5≥99.5≥99.5
concentration/g·L−1904015301020
Table 2. Parameters of electrodeposition process in aqueous solution.
Bidirectional Pulse CurrentCurrent Density/mA·cm−2Temperature/KpH ValueTime/minStirring Speed/r·min−1
1000 ms,
iforward/ibackward = 6:1,
tforward/tbackward = 3:1
1503032.52020
Table 3. Average diffusion coefficients of Cr after 180 min solid diffusion at different temperatures.
Temperature/KFitting Curve DCr = f(C)RAverage Diffusion Coefficient/m2∙s−1
973D = 8.49 × 10⁻¹⁷ × C2 − 1.59 × 10⁻¹⁵ × C + 2.30 × 10−140.984712.13 × 10−13
1073D = 2.71 × 10⁻¹⁶ × C2 − 1.44 × 10⁻¹⁴ × C + 2.14 × 10−130.941053.53 × 10−13
1173D = 2.11 × 10⁻¹⁷ × C2 + 4.72 × 10⁻¹⁶ × C − 3.11 × 10−150.994321.73 × 10−13
1273D = 2.20 × 10⁻¹⁶ × C2 − 7.62 × 10⁻¹⁵ × C + 1.89 × 10−130.968032.62 × 10−13
1323D = 3.38 × 10⁻¹⁶ × C2 − 1.75×10⁻¹⁴ × C + 2.52 × 10−130.931333.48 × 10−13
1373D = 1.56 × 10⁻¹⁶ × C2 − 7.19×10⁻¹⁶ × C + 1.26 × 10−140.956764.03 × 10−13
Table 4. Diffusion statistics of chromium in iron at different temperatures.
973 K1073 K1173 K1273 K1323 K1373 K
Number of diffusion atomic layers456456
Number of diffusion atoms41113202138215337
Table 5. Mean square displacement and diffusion coefficient of chromium in iron at different temperatures.
Temperature/KFitting Straight Line of Mean Square Displacement/y = f(x)RDiffusion Coefficient
/m2∙s−1
973y = 2.62461 × 10⁻⁵x + 0.107920.984711.31 × 10−17
1073y = 6.69082 × 10⁻⁴x + 0.120540.985813.35 × 10−16
1173y = 0.00666x + 0.175340.991123.33 × 10−15
1273y = 0.00217x + 0.132660.95871.09 × 10−15
1323y = 0.00285x + 0.145940.973631.43 × 10−15
1373y = 0.00587x + 0.170410.982332.94 × 10−15
Table 6. Transition mode and frequency of chromium atoms in 0~6 ns.
Temperature/KTransition MechanismFrequencyPercentage/%
1073First-neighbor transition1878.26
Second-neighbor transition412.39
Gap transition14.35
1373First-neighbor transition1386.67
Second-neighbor transition213.33
Gap transition00
Disclaimer/Publisher’s Note: The statements, opinions and data contained in all publications are solely those of the individual author(s) and contributor(s) and not of MDPI and/or the editor(s). MDPI and/or the editor(s) disclaim responsibility for any injury to people or property resulting from any ideas, methods, instructions or products referred to in the content.

