Article

Revealing the Enhanced Passivation and Anti-Corrosion Performance of Surface-Nanocrystallization-Modified Cr-Alloyed Rebar via Electrochemical Testing and XPS Depth Analysis

1
College of Mechanics and Materials, Hohai University, Nanjing 211100, China
2
Jiangsu Maritime Institute, Nanjing 211199, China
3
School of Civil Engineering and Architecture, Nanchang Hangkong University, Nanchang 330063, China
4
School of Materials Science and Technology, Nanjing University of Science and Technology, Nanjing 210094, China
5
Zhejiang Harmony Photocatalysis Technology Co., Ltd., Shaoxing 312000, China
6
Suqian Research Institute of Hohai University, Suqian 223800, China
*
Authors to whom correspondence should be addressed.
Coatings 2023, 13(1), 192; https://doi.org/10.3390/coatings13010192
Submission received: 7 December 2022 / Revised: 6 January 2023 / Accepted: 12 January 2023 / Published: 15 January 2023
(This article belongs to the Topic Properties of the Corroding Interface)

Abstract

:
Surface nanocrystallization (SNC) modification can be used to realize the high-efficiency derusting of rusted Cr-alloyed rebar and obtain nanostructured grains on the surface of the rebar. The corrosion resistance performance of SNC rebar in a simulated Cl--containing concrete pore solution was evaluated on the basis of electrochemical experiments. Potentiodynamic polarization testing showed that the passivation current density of the SNC rebar was about 18% of that of the rusted rebar. The structural composition of the passivation film of the SNC rebar in a concrete environment was studied using a novel characterization method, namely XPS deep sputtering, which confirmed that it had higher concentrations of Cr/Fe oxide and hydroxide, and therefore exhibited an enhanced degree of oxidation. Moreover, scanning electron microscopy and transmission electron microscopy were employed to investigate the microstructural characteristics of the SNC rebar, which was characterized by nanostructured grains with grain sizes ranging from 250 nm to 300 nm and which contained massive high-energy crystal defects, thereby promoting the film-forming reaction of Cr/Fe elements. The results of XPS depth analysis and microstructure characterization demonstrated that the SNC rebar exhibited excellent passivation performance in the concrete environment. These findings offer a new perspective on enhancing the passivation performance and chloride resistance of alloyed rebar, and provide guidance on the implementation of SNC rebar in actual engineering applications.

1. Introduction

Rebar corrosion can be regarded as the most important factor causing durability deterioration and failure of reinforced-concrete structures (RCS) [1]. In most cases, rebar maintains a passivation state in highly alkaline concrete environments [2]. However, the carbonation of concrete during long exposure periods in air results in a significant decrease in pH value at the rebar/concrete interface, resulting in rebar corrosion [3,4]. Furthermore, chloride-induced rebar corrosion, as the main factor inducing structural failure, has been shown to be more serious than corrosion caused by concrete carbonization, which is quite a common phenomenon in reinforced-concrete marine structures [5,6].
Enhancing the corrosion resistance of rebar is a crucial way of hindering the corrosion process and the expansion of corrosion in the reinforcement, thereby improving concrete durability and prolonging the service life of RCS. It has recently been reported that the application of epoxy-coated rebars and galvanized rebars is able to inhibit the corrosion process in rebars [7,8]. Although the coating significantly impacts the improvement in corrosion resistance exhibited by the coated rebar, there are several practical problems, such as high cost and lack of weldability [9]. Alloying has become a popular method for producing different kinds of steel that exhibited high performance properties, like stainless steel and corrosion-resistant alloyed steel [10]. Although corrosion initiation time is prolonged in stainless steel, its application is limited due to its expensive production costs. Corrosion-resistant alloyed steel has become a promising candidate because of its anti-corrosion properties and economic efficiency. On the basis of carbon steel, various levels of corrosion-resistant alloyed rebars can be designed and produced through the addition of corrosion-resistant alloy elements, such as Cr, Ni and Mo [11,12,13,14,15], which not only greatly improve the corrosion resistance of the rebar, but meet the processing requirements, which include weldability and plastic deformation capacity. In our previous research, we produced a novel 00Cr10MoV alloyed corrosion-resistant rebar [10,16,17]. Compared to carbon steel rebar, it exhibits excellent passivation performance and chloride-induced corrosion resistance, which are likely to result in increased lifespan when used in concrete structures in harsh environments. It is widely known that there is a correlation between the corrosion resistance of alloyed rebar and its passivation performance. However, there have been fewer reports on the structural composition of passive films formed on the 00Cr10MoV alloyed rebar in concrete.
During the application process in practical engineering contexts, before the concrete is poured and formed, rebar may be stacked and exposed to the outdoor atmospheric environment for a long time, such that the rebar surface can easily be corroded by rainwater, forming a rust layer. Fortunately, pre-rusting can be employed to improve the corrosion resistance of rebar in concrete exposed to chloride-rich environments. Chemical derusting is a fast and effective method for removing rust layers off rebar, but it can lead to serious environmental problems [18]. Mechanical derusting methods, such as sand blasting and shot blasting, can also be used for the effective pretreatment of rust layers. However, rebar surfaces treated using such methods will have a high roughness, making them extremely sensitive to corrosive environments, thus making them susceptible to corrosion [19,20]. Surface nanocrystallization processing can be utilized to remove rust layers and form a nanocrystalline structure to refine the grain and influence the corrosion performance of the metal. Various surface nanocrystallization technologies have been applied to create nanostructured surface layers on alloyed steel. The techniques applied for the production of nanostructured surface layer can be classified into two categories. Direct methods involve surface mechanical attrition treatments, such as shot peening, sand blasting, etc., while indirect methods include pulsed high-energy density plasma and cavitation peening [21,22]. Among them, surface mechanical attrition treatments are an attractive method for synthesizing nanocrystalline surface layers due to the controllability of the cost of the coating, its simplicity, and its suitability for large-scale production. During the reciprocal scratching of the steel wheel, the removal of rust layers from the rebar surface and severe plastic deformation can be observed on the rebar surface structure, so high-speed rotation wire brushing has been recognized as a high-efficiency surface nanocrystallization technology. After the wire-brushing process, nanograins can be observed upon the surface nanocrystallization (SNC) of the rebar [23]. Some peculiarities in the microstructures of nanograins, such as the high volume fraction of grain boundaries, dislocations, and other high-energy crystal defects, provide nucleation sites for the generation of an oxide layer on the metal substrate [24]. Therefore, the nanocrystalline structure significantly influences the formation of a passive film on the rebar, contributing greatly to enhancing the passivation performance and chloride resistance of the rebar [25,26]. For alloyed steel rebar, alloy elements such as Cr participate in the formation of the passive film and determine the stability and anti-corrosion properties of the passive film. With the promotion of nanograins, the quality of the passive film is improved due to the increased degree of oxidation of corrosion-resistant alloy elements in the passive film. These phenomena and their scientific problems are quite worthy of study.
In this paper, SNC modification of the rusted 00Cr10MoV alloyed corrosion-resistant rebar was proposed via high-speed rotation wire-brushing processing in order to obtain rebar with a modified surface. Electrochemical testing demonstrated that the improved passivation performance and chloride resistance of the SNC-processed rebar could be ascribed to the special microstructural characteristics of the surface nanostructured grains. XPS depth analysis confirmed that the SNC modification improved the oxidation degree of the alloy elements in the passive film and enhanced the stability and corrosion resistance of the passive film.

2. Materials and Methods

2.1. SNC Processing of the Rebar

A schematic diagram illustrating the principle of the SNC modification process of a rusted 00Cr10MoV alloyed rebar sample via high-speed rotation wire-brushing is presented in Figure 1a. Table 1 gives the chemical composition of the Cr-alloyed rebar. A wire brush with a rotation speed of 1200 r·min−1 was used to repeatedly scrape the rebar surface, which was fixed on a workbench. At the same time, the mobile device conveyed the rebar sample at a speed of 2 mm·s−1. In order to achieve ideal SNC modification, the wire brushes were used to scrape the rebar surface several times, and after SNC processing, the rust layer had been removed from the rebar, resulting in severe plastic deformation of the rebar surface. To obtain a uniform SNC modification, it is necessary to adjust the position of the rebar sample on the workbench, ensuring that all surfaces of the rebar will be processed. Finally, the elimination of the original rust layer on the rebar sample was achieved, and the rebar surface displayed a bright metallic luster, as can be seen in Figure 1b.

2.2. Electrochemical Testing

The rebar samples used in the electrochemical test were cut into uniform lengths of 9 cm. One end of the rebar sample was connected with copper wire. Both ends of the rebar sample were sealed with epoxy resin except for the exposed steel bar 8 cm in length. To evaluate the electrochemical behavior and anti-corrosion properties of the SNC rebar, rusted rebar and original rebar with mill scale (referred to as scaled rebar) were used as comparative samples. Electrochemical experiments involving open circuit potential (OCP), electrochemical impedance spectrum (EIS) and potentiodynamic polarization (PDP) tests were performed on the rebar samples using a CHI660E electrochemical workstation (Chenhua, Shanghai, China) with a three-electrode electrolyte cell system. The EIS results for the rebars were fitted using ZSimpWin software (Version 3.60, Bruno Yeum, Ann Arbor, MI, USA). The passivation behavior and corrosion behavior of the rebar sample in the simulated concrete pore solutions (SCPS) with and without sodium chloride (NaCl) were systematically studied. Saturated calcium hydroxide solution (pH = 12.5) was selected as the basic SCPS, and 0.1 mol·L−1 NaCl was added to the SCPS during the corrosion period. The frequency range for the EIS test was 10 kHz–10 mHz, and the amplitude of sinusoidal potential signal was 5 mV. The PDP test was recorded from −250 mV with respect to open circuit potential and stopped when the current density of the rebar reached over 10 μ A·cm−2 at the scanning rate of 1 mV·s−1. Electrochemical tests were carried out five times in order to acquire reliable results.

2.3. Microstructure Characterization

Scanning electron microscopy (ZEISS Sigma 300, Carl Zeiss, Jena, Germany) was utilized to observe the cross-sectional microstructure of the rebar sample in three states. The samples used for scanning electron microscopy (SEM) were sprayed with gold to obtain good conductivity, thus creating high-quality images. The evolution of the surface grain morphology with the depth of the SNC rebar was characterized using cross-sectional focused ion beam (FIB) milling and imaging, which was conducted on an Auriga 45–66 crossbeam system produced by the Carl Zeiss Company, Jena, Germany. Initial rough FIB milling was conducted at 30 kV and 2 nA, and then, 600 pA was chosen to perform the final refined milling using the same voltage. An in-lens detector was used for grain morphology imaging, enhanced by the electronic channel contrast effect. The detailed microstructure characteristics of the nanostructured grains were determined using a transmission electron microscope (TEM, FEI Tecnai G2, Hillsboro, OR, USA).
A Bruker D8 X-ray diffractometer (Bruker, Billerica, MA, USA) was applied to study the phases of rebar sample using a Cu-Kα radiation source at a scanning rate of 8°·min−1 within the range of 10 ° –90 ° . Jade 6.0 was employed to determine the phase structure by comparing PDF cards. The oxide film and ionic valence of the SNC rebar and rebar matrix passivating in saturated calcium hydroxide solution were determined using an X-ray photoelectron spectrometer (XPS, ulvac-phi, Hagisono, Japan) by sputtering at different depths with a sputtering rate of 0.2 nm/s. XPS deep sputtering was carried out on rebar samples, employing Ar ion sputtering gun at a potential of 15 kV. Al-Ka ray was used as the X-ray source. Shirley-type background subtraction was selected to analyze XPS results using XPS Peak software (Version 4.1, Thermo Fisher Scientific, Waltham, MA, USA).

3. Results and Discussion

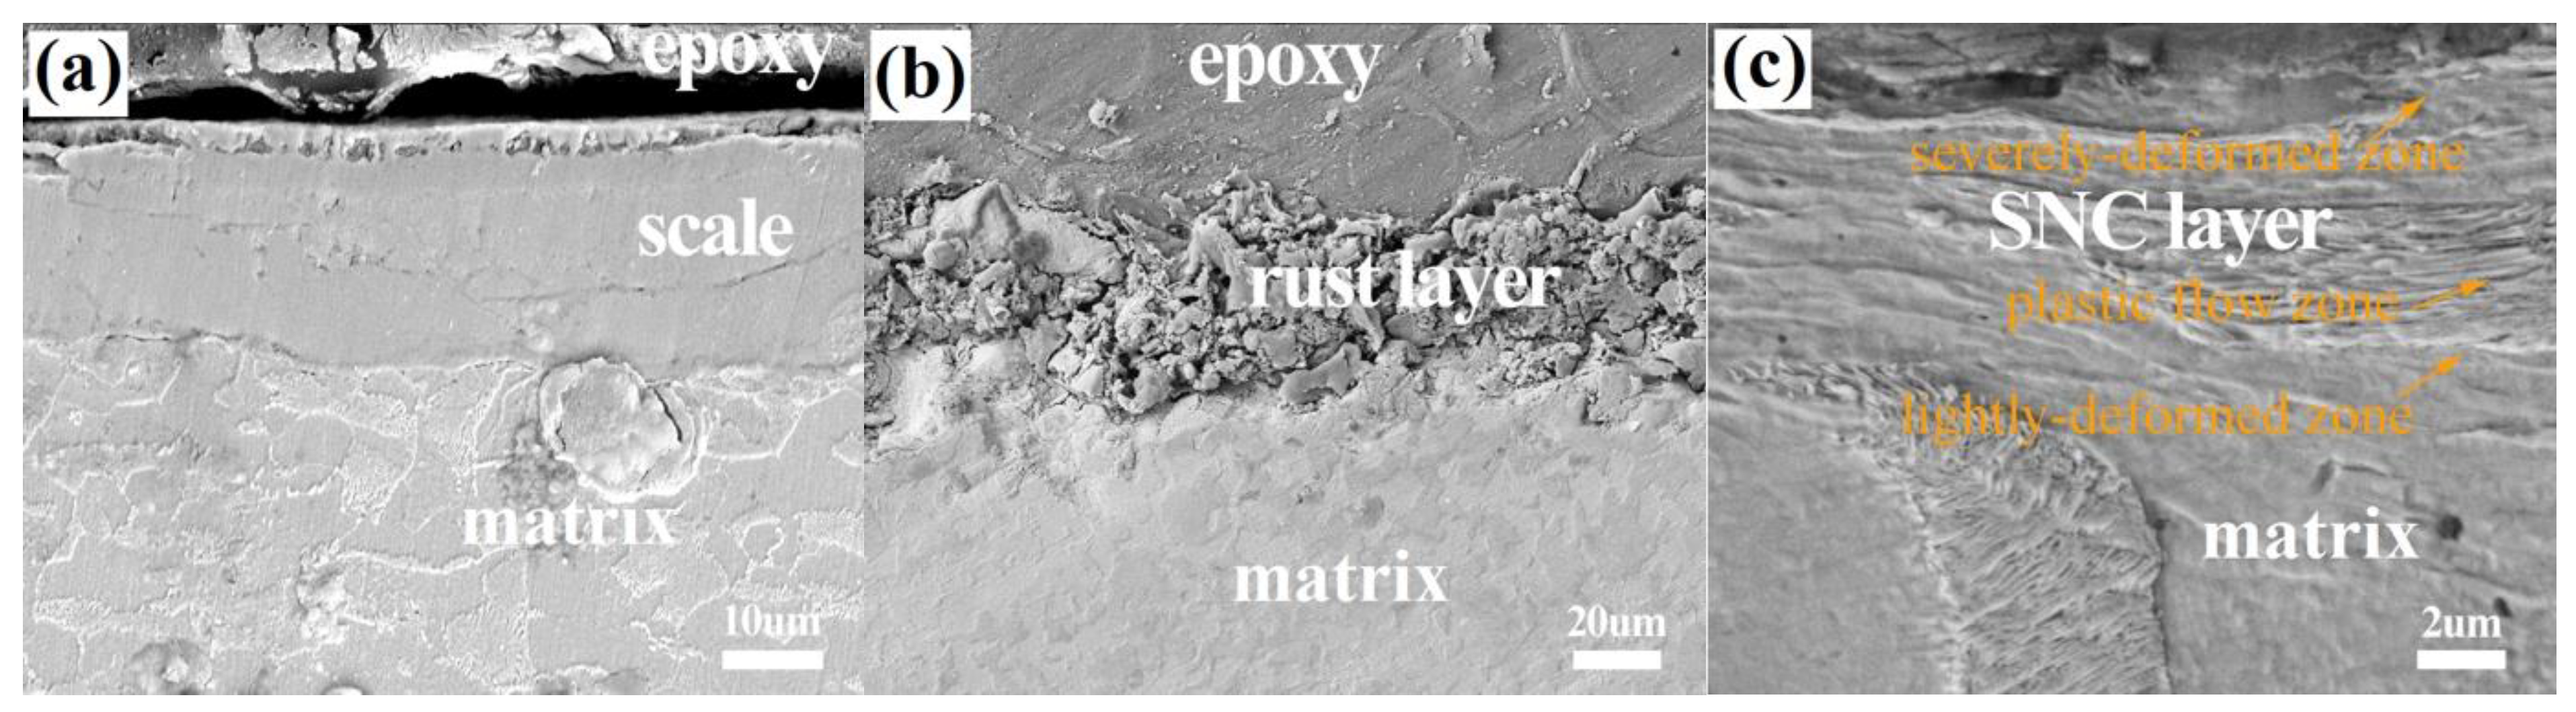
3.1. Microstructure of the Rebar

00Cr10MoV alloyed steel rebar, as a hot-rolled steel rebar, has a mill-scale layer, which has the feature of being relatively dense, with a thickness of 20 µm, as shown in Figure 2a. On closer examination, a certain number of microcracks can be observed on it. An SEM image depicting the microstructure of the rusted rebar is presented in Figure 2b, where the unevenness of the fluffy and porous rust layer can be observed, with a maximum thickness of 30 µm, and which is poorly combined with the rebar matrix. In Figure 2c, an SEM depicting the microstructure of the SNC rebar is presented, showing that the original rust layer has been removed completely. The modified surface microstructure exhibits an obvious large plastic deformation flow pattern. In addition, the deformed surface layer can be divided into a severely deformed zone, a plastic flow zone, and a lightly deformed zone, with thicknesses ranging from 8 µm to 10 µm.
The XRD patterns of the three kinds of rebar and the rebar matrix are presented in Figure 3. There are three main diffraction peaks belonging to the rebar matrix, which are related to the (110), (200), (211) diffraction planes, according to PDF#34-0396. The diffraction peak is observed at a 2 θ   value of 45.2°, corresponding to the (202) diffraction plane, according to PDF#50-1275. Considering the main alloy elements of the rebar, it can be concluded that the phase structure of the rebar matrix mainly consists of Fe-Cr solid solution with a body-centered cubic structure. For the rusted rebar, the peak at the 2 θ   value of 45.2° corresponds to Fe2O3 in the rust layer. In Figure 3, the diffraction peak at 2 θ   = 45.2° obtained for the scaled rebar can be inferred to correspond to Fe2O3 in the mill scale. The SNC rebar has the same diffraction peak as that in the rebar matrix, which does not show a diffraction peak at a 2 θ   value of 45.2°, indicating that the rust layer on the original surface has been completely removed.

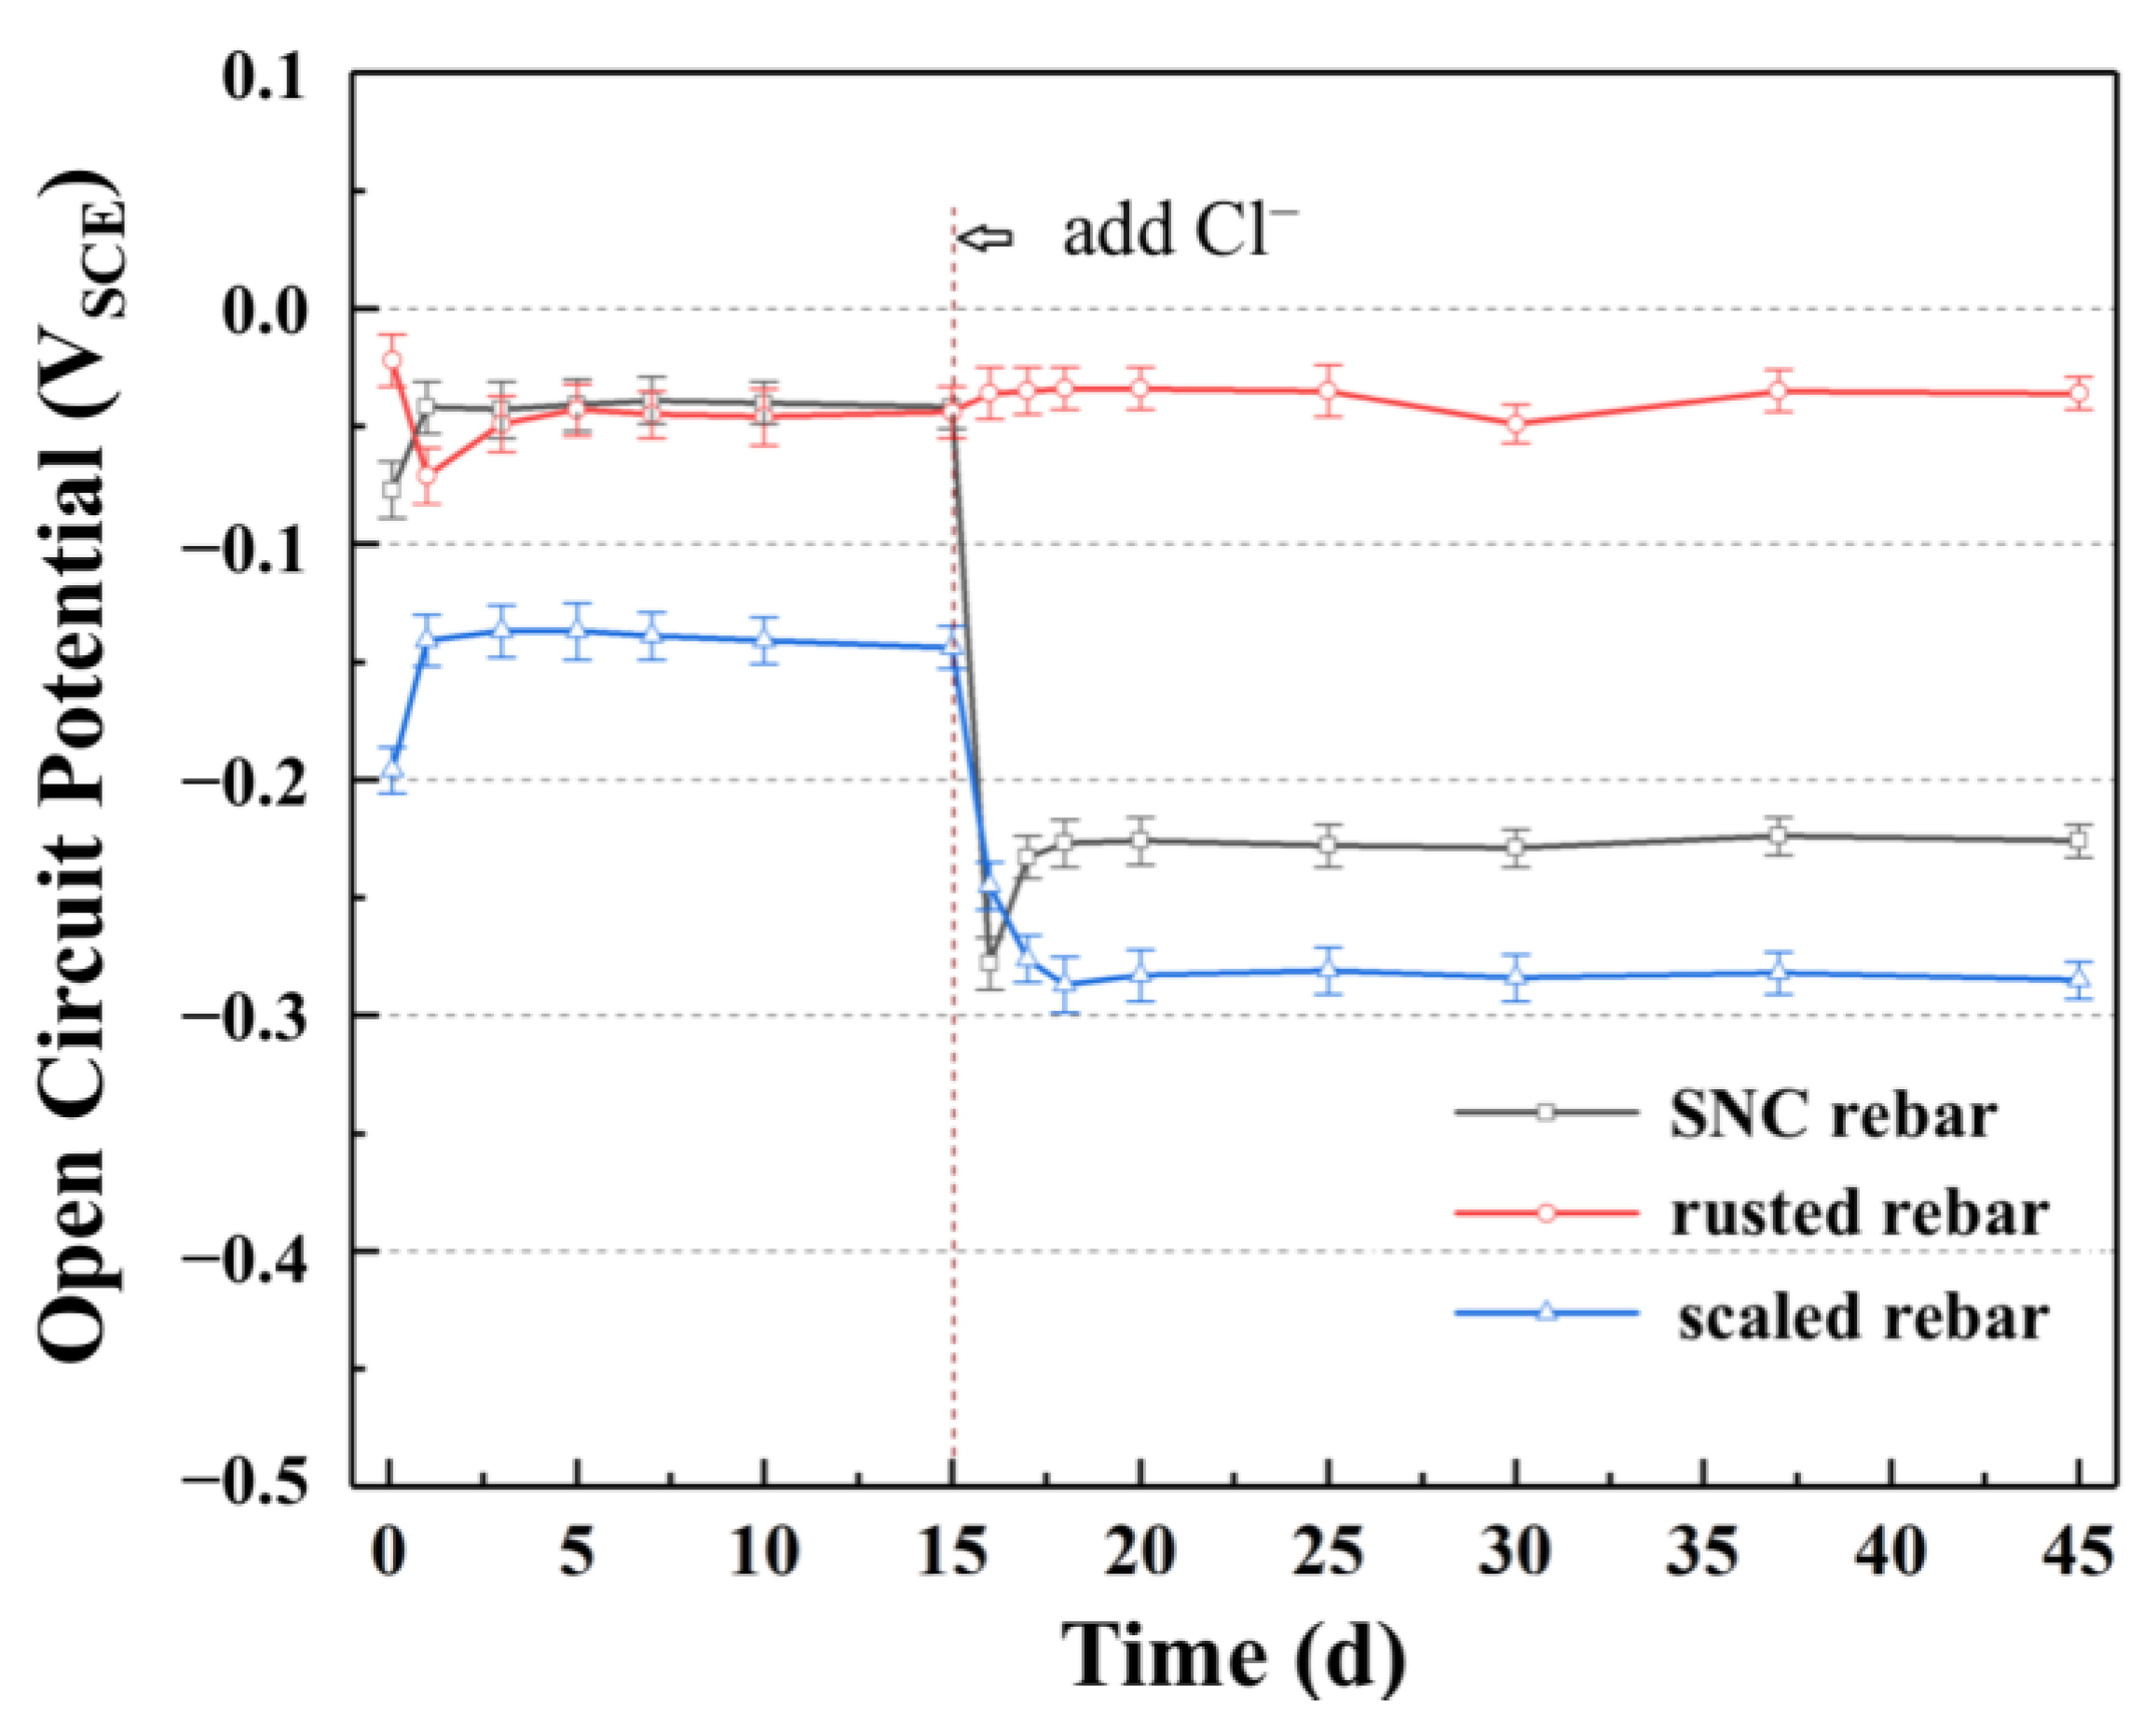
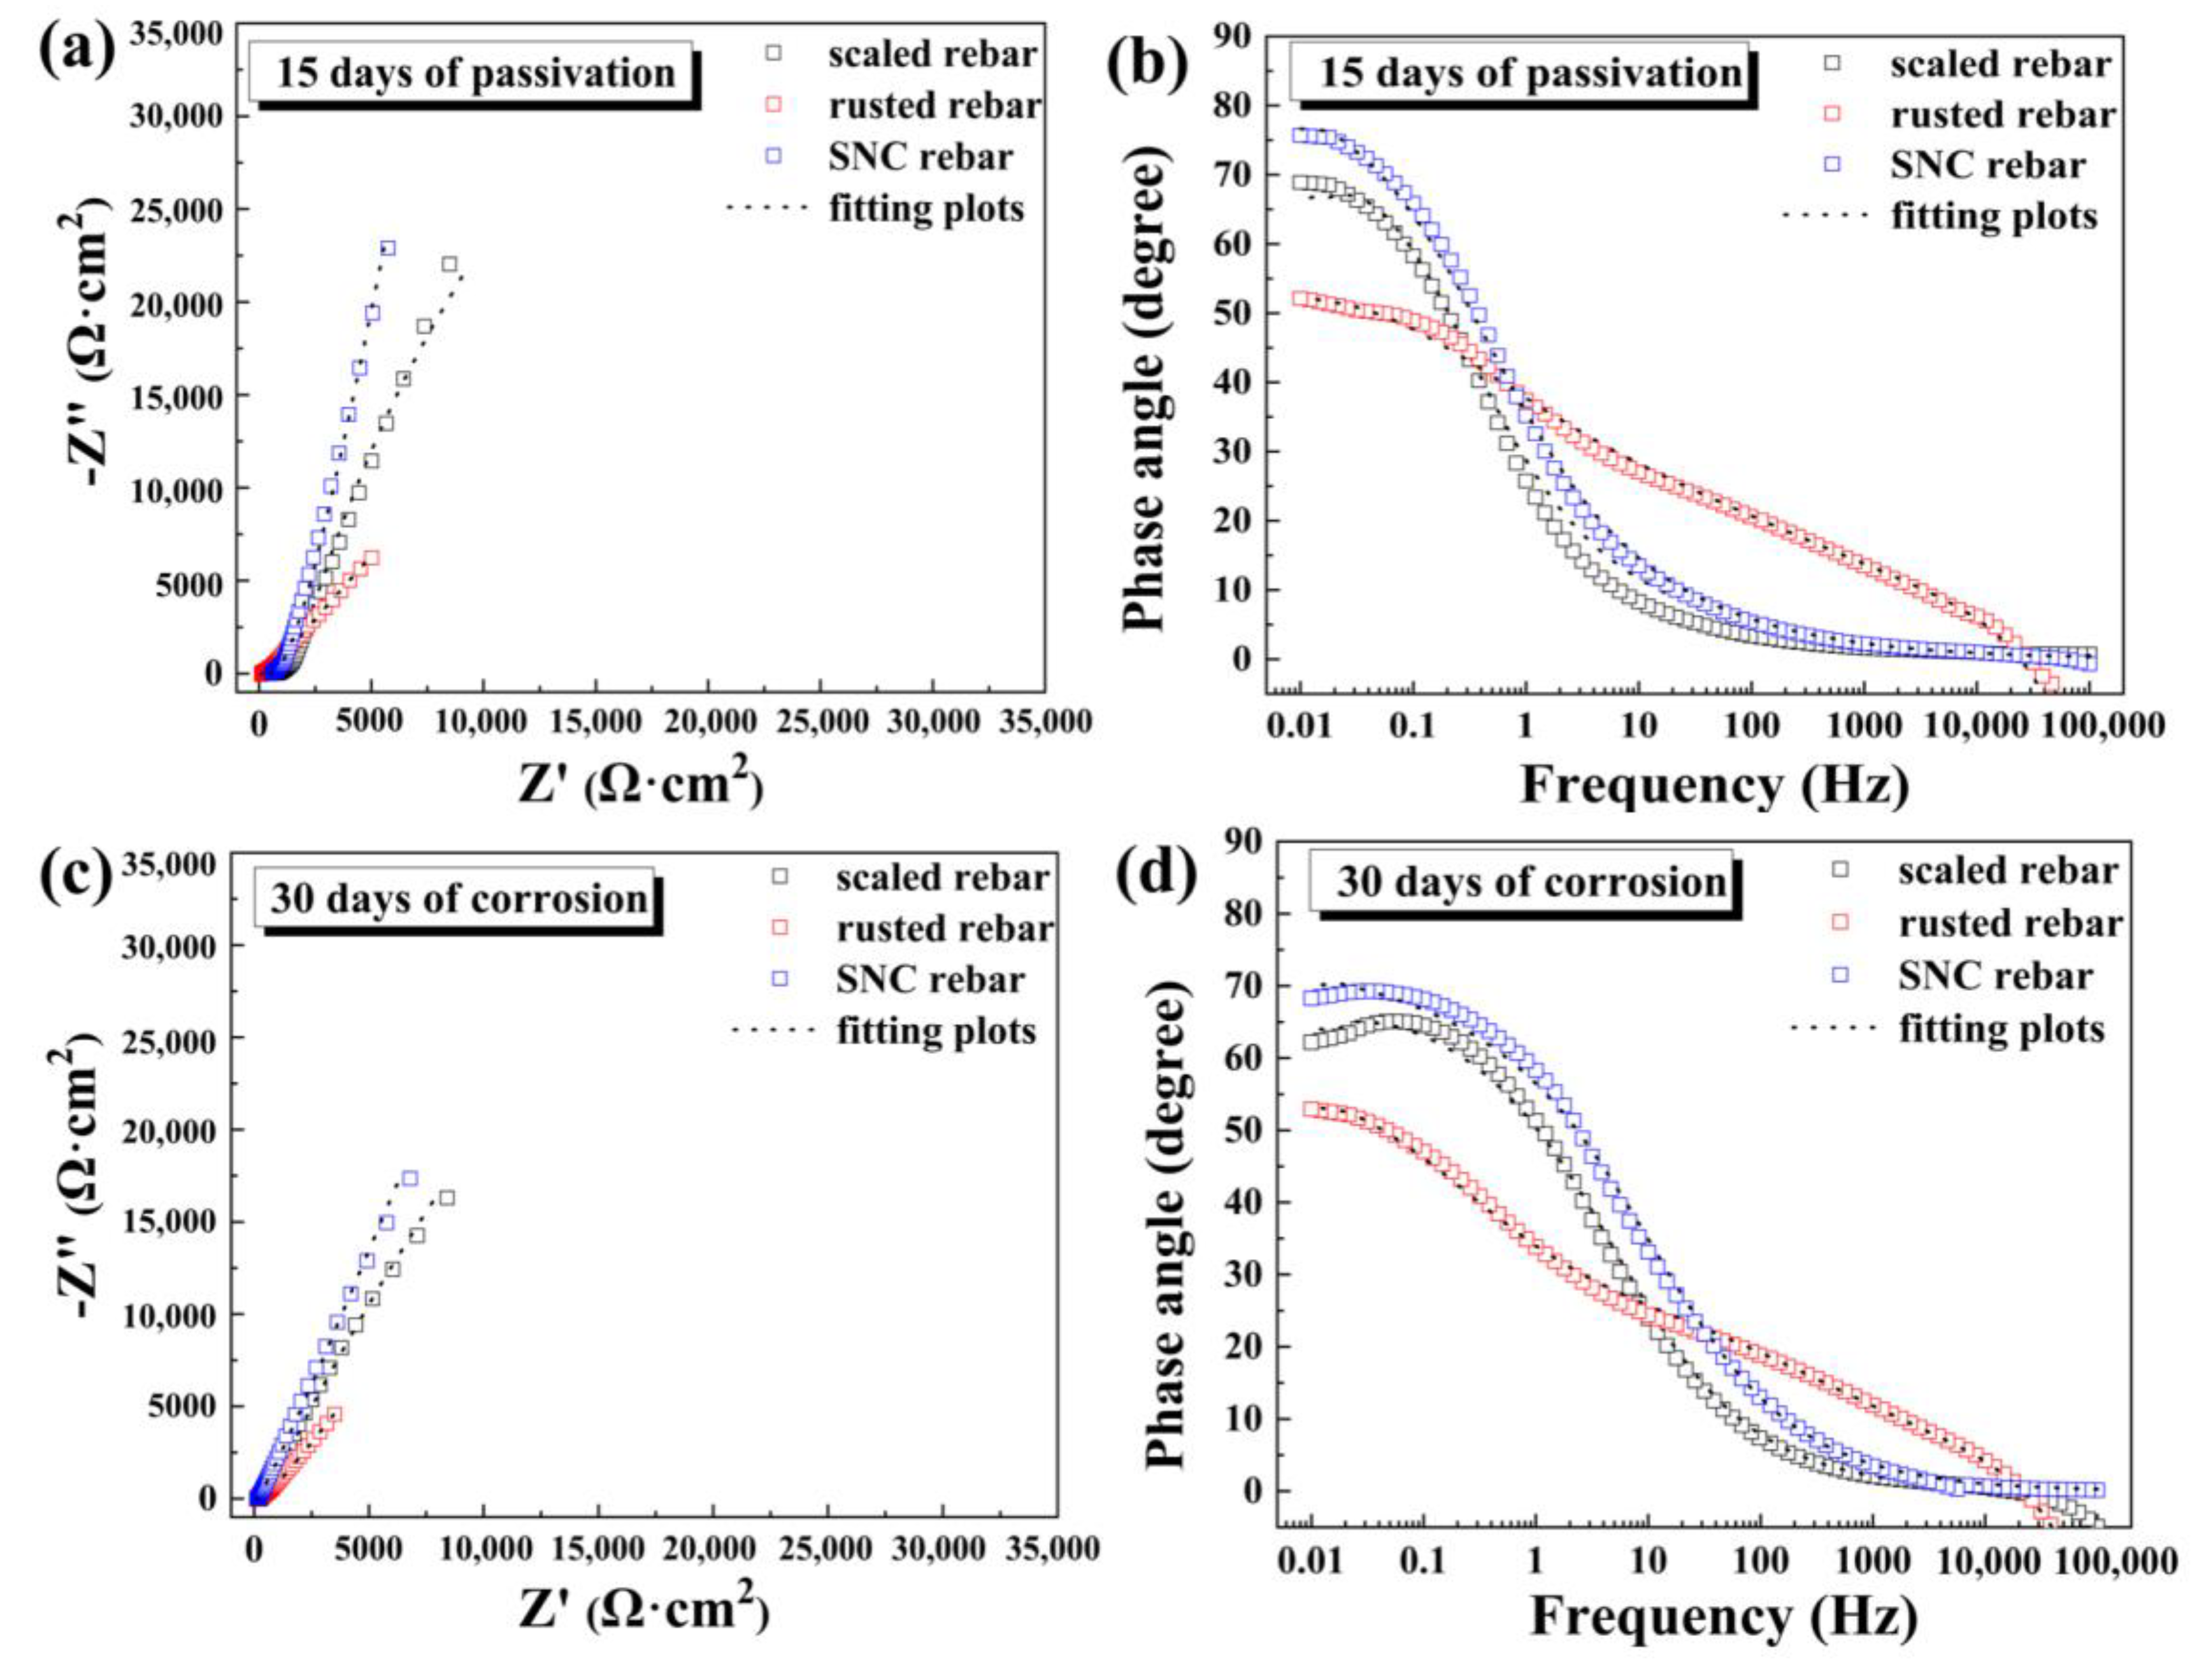
3.2. Electrochemical Behavior of Rebar Immersed in SCPS without and with Cl

The passivation performance and corrosion resistance of three surface states of Cr-alloyed rebar at two stages were studied. The first stage was the passivation period. The rebar samples were continuously exposed to chloride-free SCPS for 15 days to ensure that the optimum passivation state of the rebar was attained. OCP and EIS measurements of rebar samples were employed to evaluate the passivation performance and to reveal the evolution law of passivation. The second stage was the corrosion period after depassivation. To the SCPS, 0.1 mol·L−1 Cl was added after 15 days of continuous passivation, and the rebars were immersed in the Cl-containing SCPS for 30 days. The corrosion behaviors of the rebars were monitored on the basis of OCP and EIS tests. At the end of the immersion, the corrosion rates of the rebars were studied using the PDP test. The impact of rebar surface state on the passivation performance and corrosion resistance of 00Cr10MoV alloy rebar in a chloride environment was analyzed using the electrochemical experiments described above. With immersion times of up to 15 and 30 days, the OCP of the rebars in the SCPS with and without Cl is shown in Figure 4 as a function of time. After the first 15 days of the passivation stage, the SNC rebar had the same high OCP value as the rusted rebar, whereas the scaled rebar presented the lowest OCP value. The OCP values of the SNC rebar and the scaled rebar showed a significant increase on the first day of passivation and remained relatively stable for the remainder of the period. Additionally, with increasing immersion time, an increase in OCP value was noticed in the rusted rebar following a slight decrease. After that, it remained constant for the rest of the immersion period. A rapid decrease was witnessed in the OCP value of the SNC rebar and the scaled rebar just after adding the Cl to the SCPS. The OCP value of the SNC rebar increased dramatically, and then remained stable during long-term corrosion immersion. A noticeable decline was apparent in the OCP value of the scaled rebar, after which it stabilized at a lower level. As for the rusted rebar, the addition of chloride ions did not have a crucial impact on its OCP value, since it had the highest OCP value among the three kinds of rebar, although it exhibited slight fluctuation throughout the long period of immersion.
Generally speaking, the OCP value of the material is greatly affected by the surface state [27,28]. For the SNC rebar and the scaled rebar in chloride-free SCPS, the OCP value displayed growth at the beginning, before eventually remaining at that level as a result of the passive films formed on these two kinds of rebar. The difference in OCP value between these rebars is related to the quality of the passive film and the presence of mill scale. When chloride ions were added, a remarkable decline in the OCP value of the SNC rebar and the scaled rebar occurred due to the damage to the passive film. For the rest of the period, the OCP value of the scaled rebar remained constant, while a sharp rise was observed in the SNC rebar, confirming that the passive film on the SNC rebar demonstrates excellent self-repair and re-passivation performance in chloride corrosion environments. It can be observed that the rusted rebar demonstrated the highest OCP value in SCPS with or without Cl, despite minimal fluctuation. Various types of iron oxides present in the rust layer contribute to high OCP values, whereas the passivation of the rebar has little effect on OCP value.
EIS measurements have been widely applied to explore the corrosion behavior of alloys [29]. Therefore, the electrochemical properties and related parameters of the three kinds of rebar in SCPS were studied by means of EIS. The Nyquist and Bode plots for the three types of rebar during the passivation stage are displayed in Figure 5a,b. Generally speaking, the rising Nyquist plot presents a higher capacitive loop diameter and a better passivation behavior of the rebar [30]. After 15 days of passivation, the capacitive loop diameter of the SNC rebar is slightly greater than that of the scaled rebar, and significantly larger than that of the rusted rebar. In terms of Bode plots, the highest phase angle (HPA) plays a significant role in evaluating the corrosion resistance of materials [31,32]. Higher values of HPA demonstrate better corrosion resistance in materials. In addition, the HPA is also associated with the roughness of the material surface, meaning that a smooth surface is conducive to improving the HPA. In Figure 5b, after 15 days of passivation time, the HPA of different types of rebar are as follows: SNC rebar > scaled rebar > rusted rebar. The Nyquist and Bode plots of the three kinds of rebar immersed in SCPS with chloride ions for 30 days are shown in Figure 5c,d, respectively. With respect to the SNC rebar and the scaled rebar immersed in the corrosive solution, the capacitive arc diameter and the HPA exhibited a remarkable downward tendency compared to those immersed in SCPS without Cl. The comparative relationship between the three rebars did not change at the chloride corrosion stage, in contrast to that of the SCPS without Cl. Obviously, rusted rebar had the lowest capacitive arc diameter and phase angle, showing a similar trend at the passivation stage.
A two-time constant circuit Rs(QfRf)(QdlRct) was applied to fit the EIS results of the scaled rebar and the SNC rebar. Rs represents the solution resistance of the SCPS. Rf and Qf denote the resistance and capacitance of the passivation film formed on the rebar, respectively. Rct and Qdl are the charge-transfer resistance of the rebar and the double-layer capacitance of the interface between SCPS and rebar. Constant phase element (CPE) is replaced by pure double-layer capacitance (CCPE) due to the non-ideal rebar/solution interface [33]. Considering rusted rebar with negative impedance in the EIS plot, the inductive component was added to the equivalent electrical circuits (Rs(QfRf)(QdlRct)L) in order to elucidate the corrosion process of the rusted bar. The fitted electrochemical parameters related to three types of rebars during the passivation and chloride penetration stage are listed in Table 2. The Rct component directly characterizes the anti-corrosion perfomance of the tested samples. Higher Rct values represent improved corrosion resistance of rebar [34], meaning that the fitted Rct value can be applied to characterize the passivation of the rebars. During the passivation stage, the Rct value of SNC rebar reached 395.2 kΩ∙cm2, which is approximately 1.39 times greater than that of the rusted rebar and 312.6 kΩ·cm2 greater than that of the scaled rebar. After 30 days of corrosion, a decrease in the Rct value is witnessed in all kinds of rebar. In contrast with other types of rebar, the value obtained by the SNC rebar decreased to roughly 259.1 kΩ∙cm2, while it retained the highest Rct value. The Rct value of the SNC rebar was still approximately 1.4 times higher than that of the rusted bar. The SNC rebar’s Rct value was nearly 204.9 kΩ·cm2 higher than that of the scaled rebar. In view of the capacitive arc diameter, the HPA and Rct values of the SNC rebar, it presents the best passivation performance and chloride resistance among the three rebar types.
The potentiodynamic polarization curves of the rebar after exposure to chloride-contaminated SCPS for 30 days are shown in Figure 6. Typical corrosion performance, such as activation, passivation, and pitting, was noticed in the three kinds of rebar. The sharp increase in the activation zone for all rebars suggests strong anodic polarization, indicating that all of the different kinds of rebar remained in good anodic polarization after 30 days of corrosion. Table 3 summarizes the electrochemical corrosion parameters. Ecorr represents the thermo-dynamical corrosion tendencies of materials. A lower corrosion potential means a higher possibility of corrosion [35]. However, corrosion potential is positively associated with electrode and surface attachment. The Ecorr value of the rusted rebar was the highest (about −0.209 VSCE), and the SNC rebar possessed the second-highest Ecorr value, which reached −0.307 VSCE. The lowest Ecorr value was observed in the scaled rebar (at about −0.367 VSCE). Compared with the other two kinds of rebar, the Ecorr value of the rusted rebar was obviously higher due to its rust layer, demonstrating that the rebar surface structure and the rust layer represent factors influencing the electrode potential of rusted rebar. These phenomena were also displayed in the OCP evolution curves of rebars, which are provided in Figure 4. Pitting potential (Epit) can be applied to qualitatively assess the stability of passive film on rebars in a chloride-rich environment. Usually, the higher the pitting potential, the more stable the passive film on the rebar, suggesting better chloride resistance. As can be observed, as marked by arrows, the SNC rebar exhibits a higher Epit value (0.334 VSCE) than that of rusted rebar (0.214 VSCE). The corrosion states of materials can be obtained from the passivation current density (ip), indicating the corrosion kinetics of the rebar. Furthermore, the decline in ip value demonstrates the improvement in passivation capability, and thus the decrease in the corrosion rate of the rebar [36,37]. SNC rebar (around 0.469 μ A·cm−2) demonstrated 18.2% in ip value compared to rusted rebar (2.582 μ A·cm−2), while ip value of scaled rebar (0.761 μ A·cm−2) represented a 62% increase by comparison with that of SNC rebar. Apart from this, as highlighted by the PDP curves, the lowest passivation current density and the widest passivation potential range were observed in the SNC rebar, and therefore, it exhibits superior passivation performance and chloride resistance. Polarization resistance can also be quantitively evaluated on the basis of the corrosion tendency of the rebar samples. The SNC rebar was confirmed to possess excellent corrosion resistance due to its having the highest polarization resistance and the lowest corrosion rate. It can be observed that the corrosion rate of the rusted rebar was five times greater than that of the SNC rebar. The values of polarization resistance ( R p ) and corrosion rate ( υ ) were calculated according to Equations (1) and (2), respectively [38]:
R p = ( dE / di ) E corr
υ   = 3.27 × ( A ¯ z ) ·   i c o r r ρ
where A ¯ /Z is the electrochemical equivalent of rebar (Fe accounts for the largest amount in the rebar, and therefore the following can be considered: A ¯ (Fe) = 55.85 g/mol and z = 2);   i c o r r   is the current corrosion density of the rebar; and ρ represents the density of Fe (7.5 g/cm3).

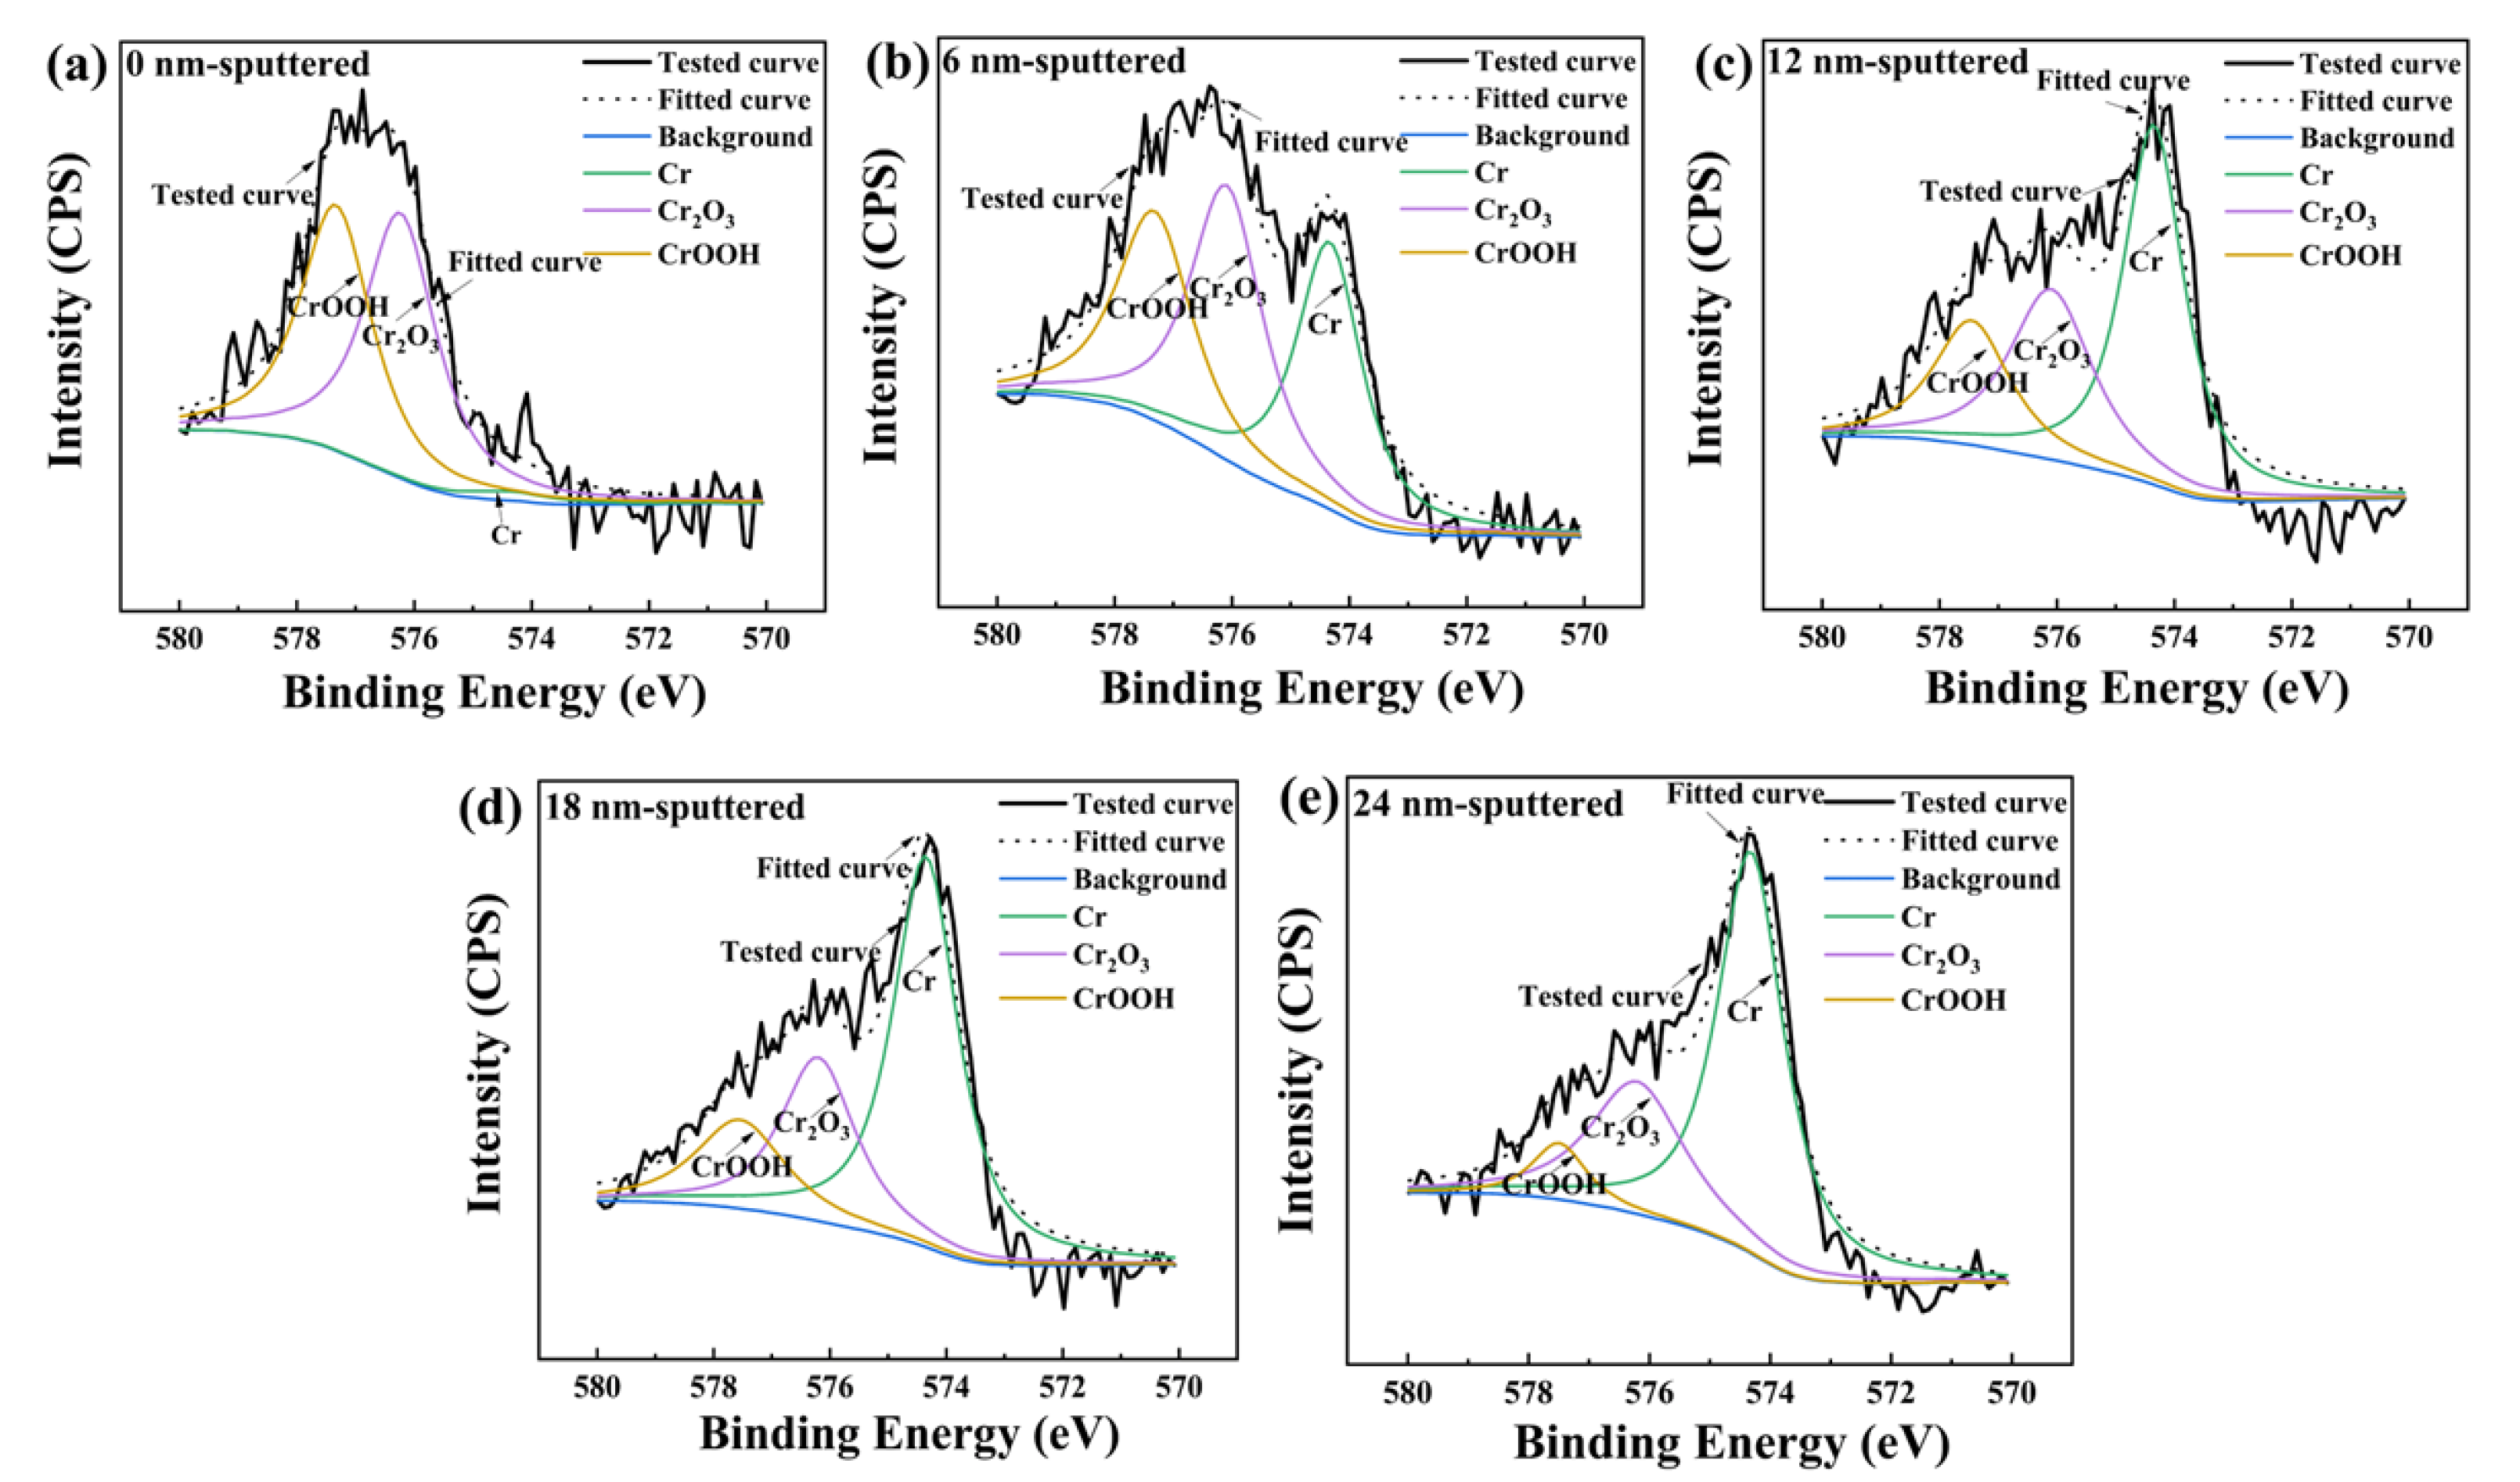
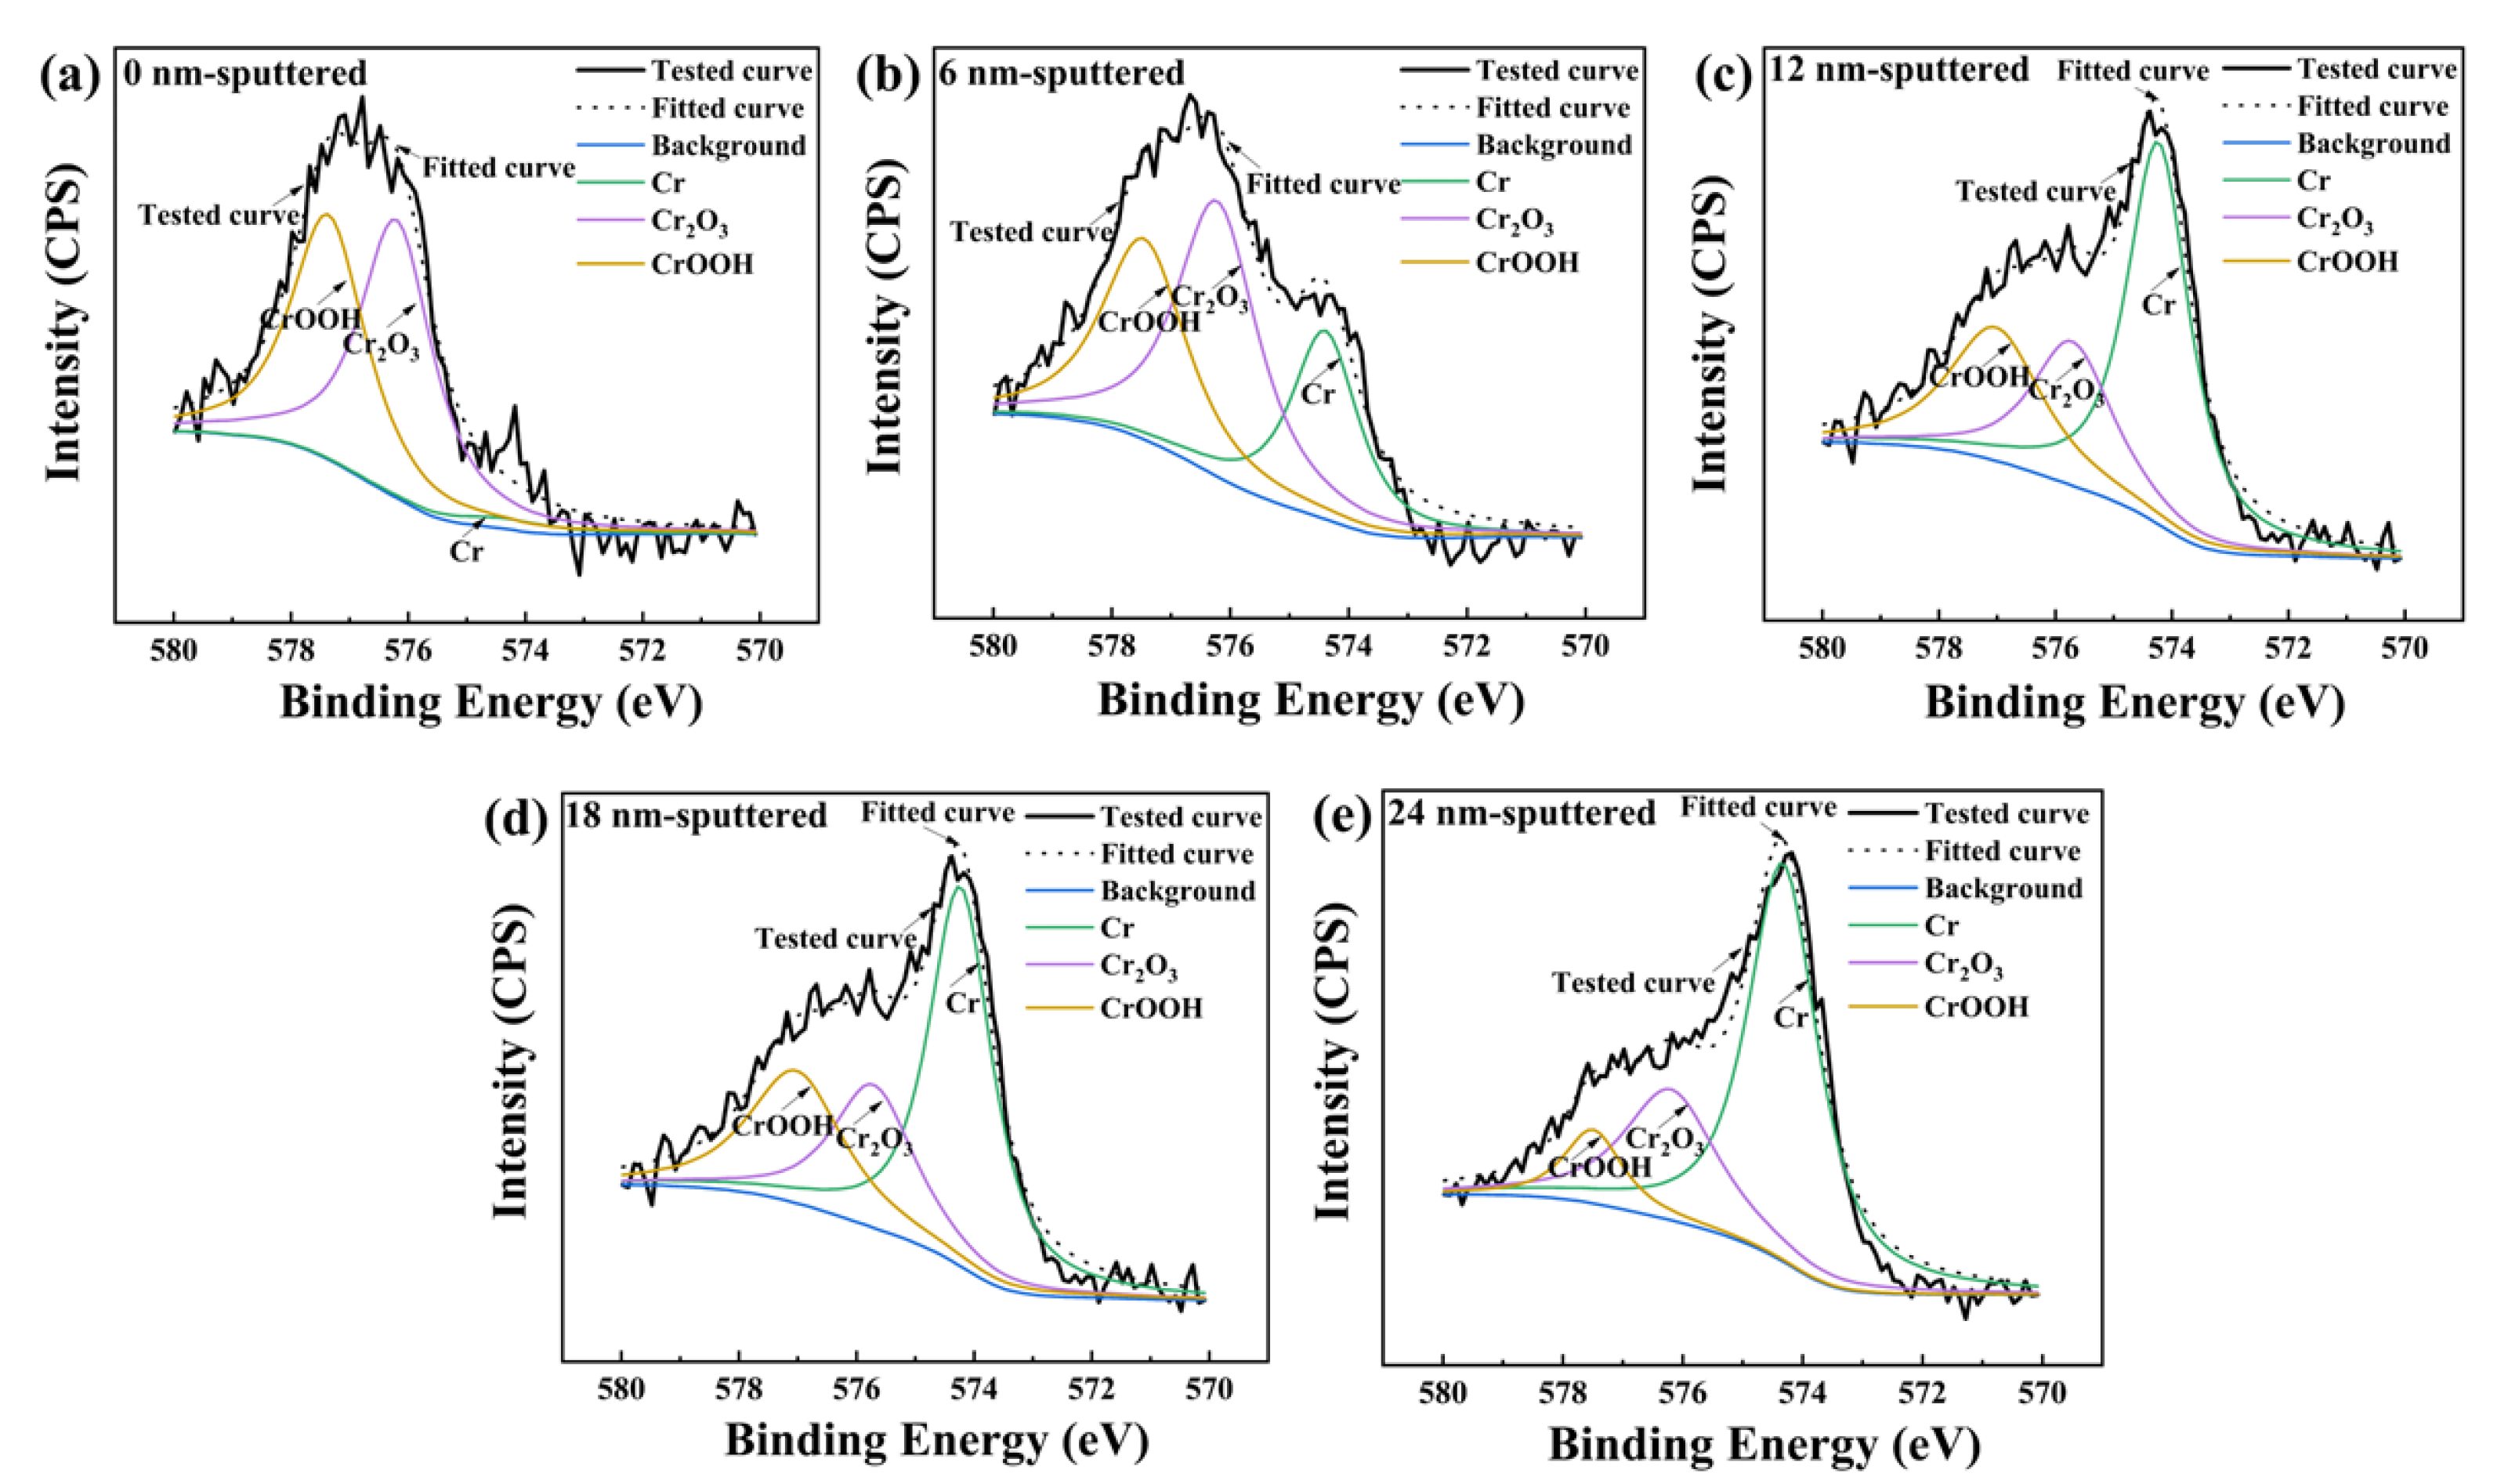
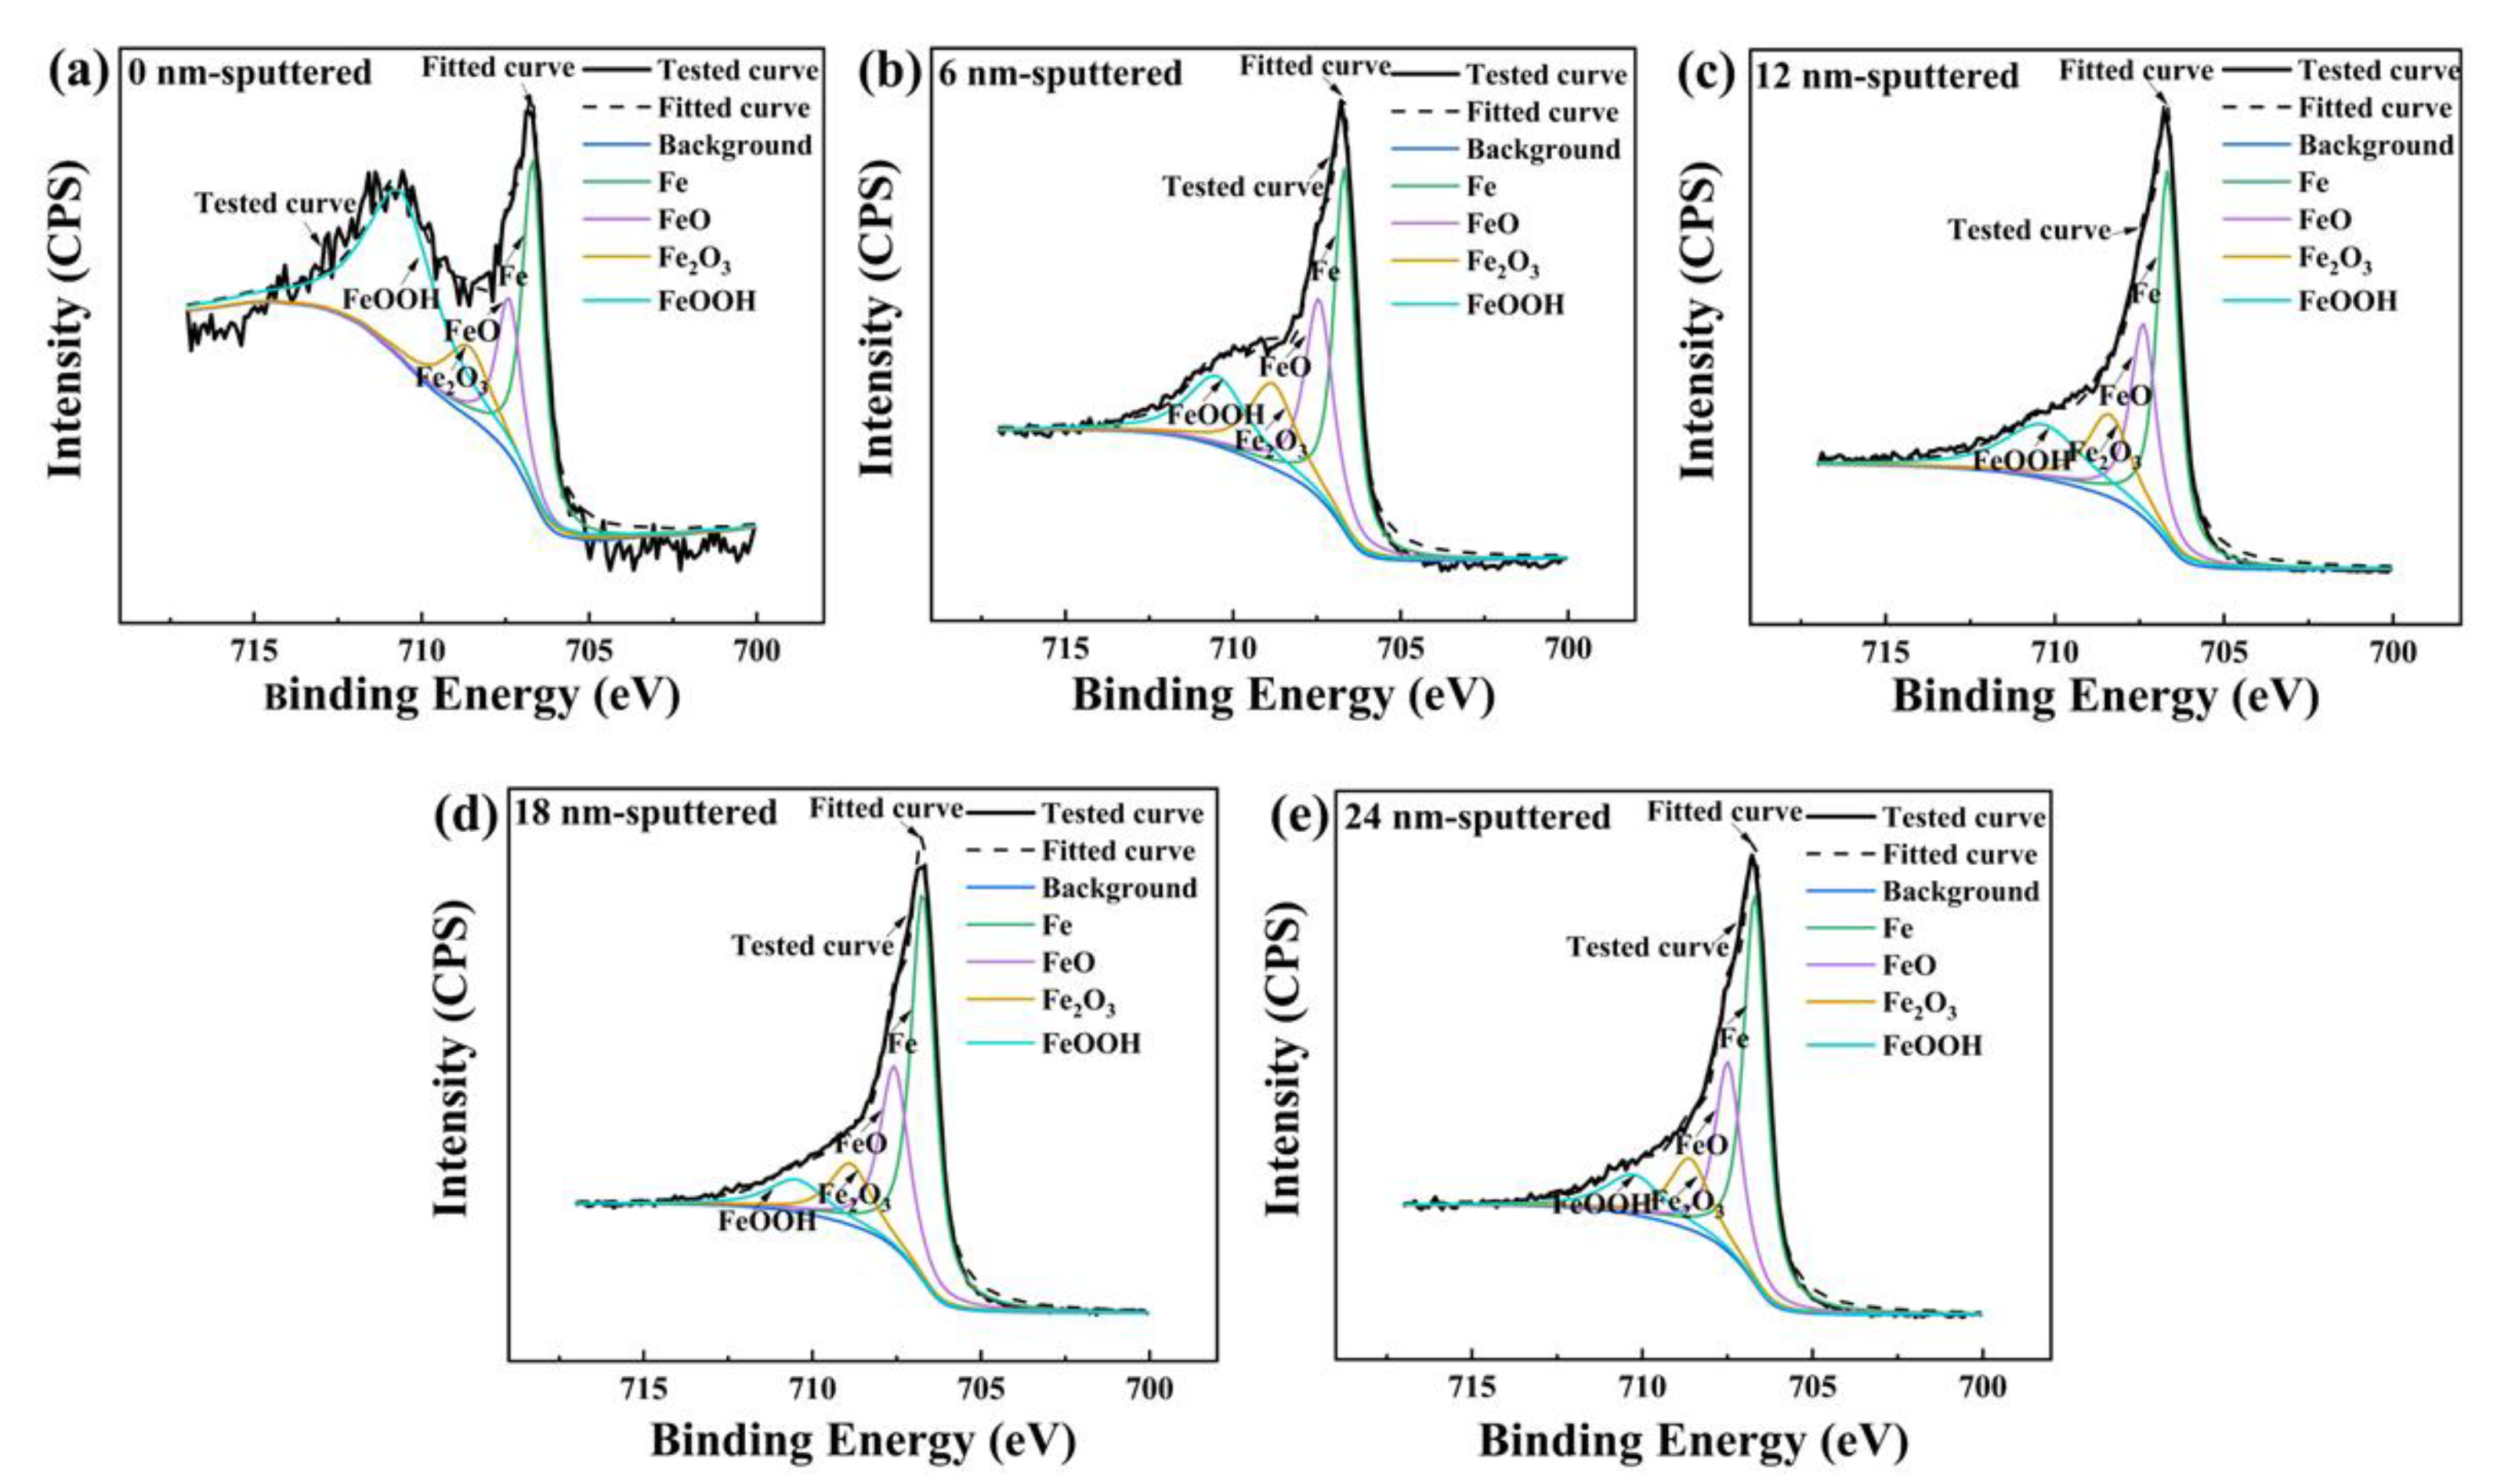
3.3. XPS Depth Analysis of the Passive Film of the SNC Rebar

XPS deep sputtering was used to determine the microstructure information of the passivation film of the SNC rebar sample and of rebar matrix after 15 days of immersion in SCPS without Cl, in order to investigate the passivation behavior and the anti-corrosion mechanism of the SNC rebar. Information related to ion valence and component of the passive film on those two kinds of samples was acquired at depths of 0 nm, 6 nm, 12 nm, 18 nm and 24 nm depth, respectively. The SNC rebar used for the XPS test was directly cut from the side surface and subsequently ground with sandpaper, followed by careful polishing. After that, the sample was ultrasonically cleaned in acetone to get rid of organic contaminants on the sample surface. The same procedure was applied to prepare the rebar matrix sample. On the basis of the chemical composition of the alloyed rebar, it can be predicted that Cr is the main corrosion-resistant alloy element, and will contribute to the formation of the passive film of the rebar. It is evident that Fe, as the main element, is not only in the rebar, but also on the passive film. Therefore, XPS depth analysis was performed in order to study the ionic valence and area ratio of Cr and Fe.
Considering the multiplet splitting of compounds due to the presence of atoms with unpaired electrons, Grosvenor et al. fitted different Fe oxides with multiplet structures, that is, using multiple peaks to represent a single Fe species [39]. Each oxidation state of Fe reacted with water vapor at 25 °C and 100 °C was also confirmed using multiplet peaks [40]. Biesinger et al. identified each of the chemical states in transition metals and compounds (Cr, Fe, Co and Ni) through multiplet peaks [41]. Admittedly, a great approach to interpreting the chemical states of some compounds is the use of multiplet structures. However, numerous researchers have applied single peaks to represent each species of the passive film on steel, clearly illustrating the peak associated with the particular species [30,42,43]. Therefore, in this study, the fitting of Cr 2p3/2 and Fe 2p3/2 peaks was carried out using a single peak to identify metals and compounds on the passive film. In order to obtain accurate fitting results, the XPS spectra were processed using XPS Peak software with unfixed peak positions. Based on references in the literature, the peak positions of metals, oxides and hydroxides were input into the software with the function of automatic peak-seeking in order to identify the peak position of each species within a given range [44,45,46,47].
Figure 7 and Figure 8 present the evolution of the XPS results of the Cr 2p3/2 spectra with respect to the passive film on the rebar matrix and the SNC rebar as a function of depth. The spectral fitting parameters are given in Table 4. The spectrum of Cr is separated into three sub-peaks. The peaks at 574.3 and 576.1–576.2 eV are assigned to Crmet and Cr2O3, respectively. The peak presented at 577.2–577.5 eV is associated with CrOOH [45,48,49]. Cr metal, Cr3+ oxide and hydroxide show a broad peak shape. Major components, such as CrOOH, Cr2O3 and Cr, appear in the passive film of the rebar. As for the surface of the passive film (0 nm), the peak intensities of Cr2O3 and CrOOH are much higher than that of Crmet. As shown in Table 4, the area ratio of CrOOH and Cr2O3 drops gradually, but that of Crmet increases moderately with increasing depth. The ratio of Croxide (CrOOH and Cr2O3) is significantly higher than that of Crmet at a sputtering depth of 0 nm, indicating that the Cr element in the surface passive film has undergone a high degree of oxidation. As sputtering depth increases, a constant decrease in the amount of Croxide and a continual increase in the ratio of Crmet are consistent with the pattern of peak intensity (Figure 7 and Figure 8). The passive film of the SNC rebar displays a higher ratio of Croxide than that of rebar matrix in a depth range of 0–24 nm, particularly in the outer layer.
Fe 2p3/2 spectra related to passive film on rebar matrix and SNC rebar as a function of depth are depicted in Figure 9 and Figure 10. Table 5 lists the spectral fitting parameters. Regarding the two kinds of samples, the Fe 2p3/2 spectra are split into four constituent peaks: Femet (706.7 eV), FeO (707.3–707.6 eV), Fe2O3 (708.2–708.8 eV), and FeOOH (709.9–710.7 eV) [50,51]. Fe metal and its oxidation states are present in the broadened peak shape, whereas the narrower FWHM is used to fit the single peak for Fe metal. On the outmost layer of the passivation film (0 nm), Fe oxide (FeO, Fe2O3 and FeOOH) display significantly higher peak intensities than Femet. With increasing sputtering depth in the passive film, the peak intensities of Fe oxide and Fe hydroxide decrease gradually, and the peak intensity of Femet increases continually. Compared with Femet, higher ratios of Feoxide can be observed on the outer layer of the formed passive film (0 nm), which contains Fe with a high degree of oxidation. With increasing sputtering depth, there is a remarkable opposite tendency in the percentage of Feoxide, which shows constant decreasing trends, and Femet, which grows continuously. A similar trend can be observed for peak intensity. It was found that the ratio of Feoxide of the SNC rebar is higher than that of the rebar matrix at the same sputtering depth.
Based on the XPS analysis of Cr 2p3/2 and Fe 2p3/2, Cr oxide, Cr hydroxide, Fe oxide and Fe hydroxide constituted the primary components comprising the passive film on the 00Cr10MoV rebar sample immersed in SCPS. The degree of oxidation of the passive film decreased with increasing sputtering depth. Obviously, major constituents of the passive film on the rebar surface like Cr and Fe showed a higher degree of oxidation. After SNC processing, the passivation film of the SNC rebar exhibited a larger proportion of Cr oxide and Fe oxide than that in the rebar matrix, indicating that the passive film exhibits an enhanced degree of oxidation and better passivation performance.

3.4. Surface Nanostructured Grains and Their Contribution to the Enhanced Passive Film on the Rebar

Several studies have reported that the passivation performance and chloride resistance of rebar are closely related to its surface conditions, such as a whether or not a rust layer has formed on the surface, surface roughness, and so on. In addition, the surface microstructure of the rebar also exerts a tremendous effect on the corrosion resistance of rebar. The macromorphology (Figure 1b) and microstructure (Figure 2) of the rebar illustrate that the rust layer was completely eliminated from the rebar surface after SNC modification. The surface microstructure of the rebar underwent severe plastic deformation, showing obvious plastic-processing waves. For further study of the surface microstructure of the SNC rebar, tiny specimens were cut from the SNC rebar surface using a focused ion beam (FIB). The detailed microstructure characteristics of the surface nanostructured grains were observed via SEM and TEM.
Figure 11 displays the SEM image of the SNC rebar surface with a typical gradient structure. The traces of vertical cutting on the rebar surface caused by the focused ion beam operating at high power may lead to poor-quality SEM images, although this has no influence on the observation of grain size and the microstructural characteristics of SNC rebar. The gradient microstructure contains three parts, where the outer part is the nanostructured grains (as shown in yellow arrow) with an average grain size of less than 1 μm, the middle part is a deformed grain layer in a grain size range of about 1–2 μm, and the inner part is the original microstructure of the rebar matrix, displaying equiaxed coarse grains (about 3 μm). The grains corresponding to the deformed grain layer are elongated and deformed, with the grain size being larger than that of the nanostructured grains. Additionally, it is noteworthy to point out that there is a smooth transition in gradient structure from the nanostructured grain layer, to the deformed grain layer, to the original grain, without an interface. Since the outer surface of the nanostructured grains is exposed to the environment, the passivation performance and corrosion resistance of the reinforcement steel in a chloride environment are closely associated with the nanostructured grains.
TEM was conducted to further investigate the detailed microstructural characteristics of the surface nanostructured grains, as depicted in Figure 12. The arrows in Figure 12a illustrate the grain size of nanostructured grains reaching approximately 250–300 nm, and high-density dislocation structures can be observed in the crystal. Figure 12b displays the nanostructured grain at high magnification. Intragranular dislocation can be clearly observed in the nanostructured grain, which can be attributed to severe strain. Intragranular dislocation enables nanostructured grain with plenty of internal energies. Nanostructured grain with dislocation tangles is regarded as a typical non-equilibrium microstructure. Nanocrystallization offers new prospects for changing the properties of metals, including the refined grain size and the surface conditions, which has a great influence on the corrosion performance of alloyed rebar. The positive effect of smaller grain size on corrosion resistance can probably be ascribed to the more rapid diffusion in finer grain, promoting the formation of passive film [52,53]. The microstructure of surface nanostructured grains with high-energy sites like grain boundaries and dislocation represent a preferred location for the oxidation reaction and nucleation of passive film, which has a significant effect on corrosion resistance [54]. The dislocations of the grain boundaries are considered to be active sites, where the passive film generally nucleates. The increasing number of active sites results in the growth of passive film at a higher rate [55]. Therefore, it is widely believed that high-energetic crystal defects like grain boundaries and dislocation structures promote the formation of passive films. In addition, crystal defects can also provide quick access for Cr and Fe to migrate from the rebar matrix to the rebar/environment interface, thus accelerating the formation of passive film. Therefore, the nanostructured grains on the SNC rebar surface exert a beneficial impact on the formation of passive film, not only in terms of promotion in element distribution but also in thermodynamics [56,57,58]. At the same time, it also provides more rapid channels for the diffusion of corrosion-resistant alloy elements like Cr during the film-forming process, causing the enrichment of Cr to have a great effect on the kinetics of passive film formation.
A schematic representation of the passive film formation on the SNC rebar and the rebar matrix is shown in Figure 13. The beneficial role played by surface nanostructured grains on the passive film formation and the improvement in the protective properties are explained by these schematic diagrams. Due to the positive influence of the special microstructure of nanostructured grains on the thermodynamics and kinetics of passive film formation, a faster and more intense film-forming reaction can be observed in the SNC rebar. Higher proportions of Cr/Fe oxides and Cr/Fe hydroxides appear in the passive film of the SNC rebar, suggesting enhanced passivation performance and chloride resistance.

4. Conclusions

Surface nanocrystallization of rusted 00Cr10MoV rebar was conducted by means of high-speed rotation wire brushing. Using electrochemical experimentation and XPS depth analysis, the significantly enhanced passivation performance and chloride resistance of SNC rebar were revealed. The results can be summarized as follows:
(1)
The results of electrochemical testing including EIS and PDP confirmed that the SNC rebar had the best passivation performance, and the fitted Rct value obtained during the EIS test was 1.39 times as much as that of the rusted rebar in the SCPS without Cl. Meanwhile, the SNC rebar had the best corrosion resistance to chloride ions in the Cl-containing SCPS, and its passivation current density was only about 18% of that of the rusted rebar.
(2)
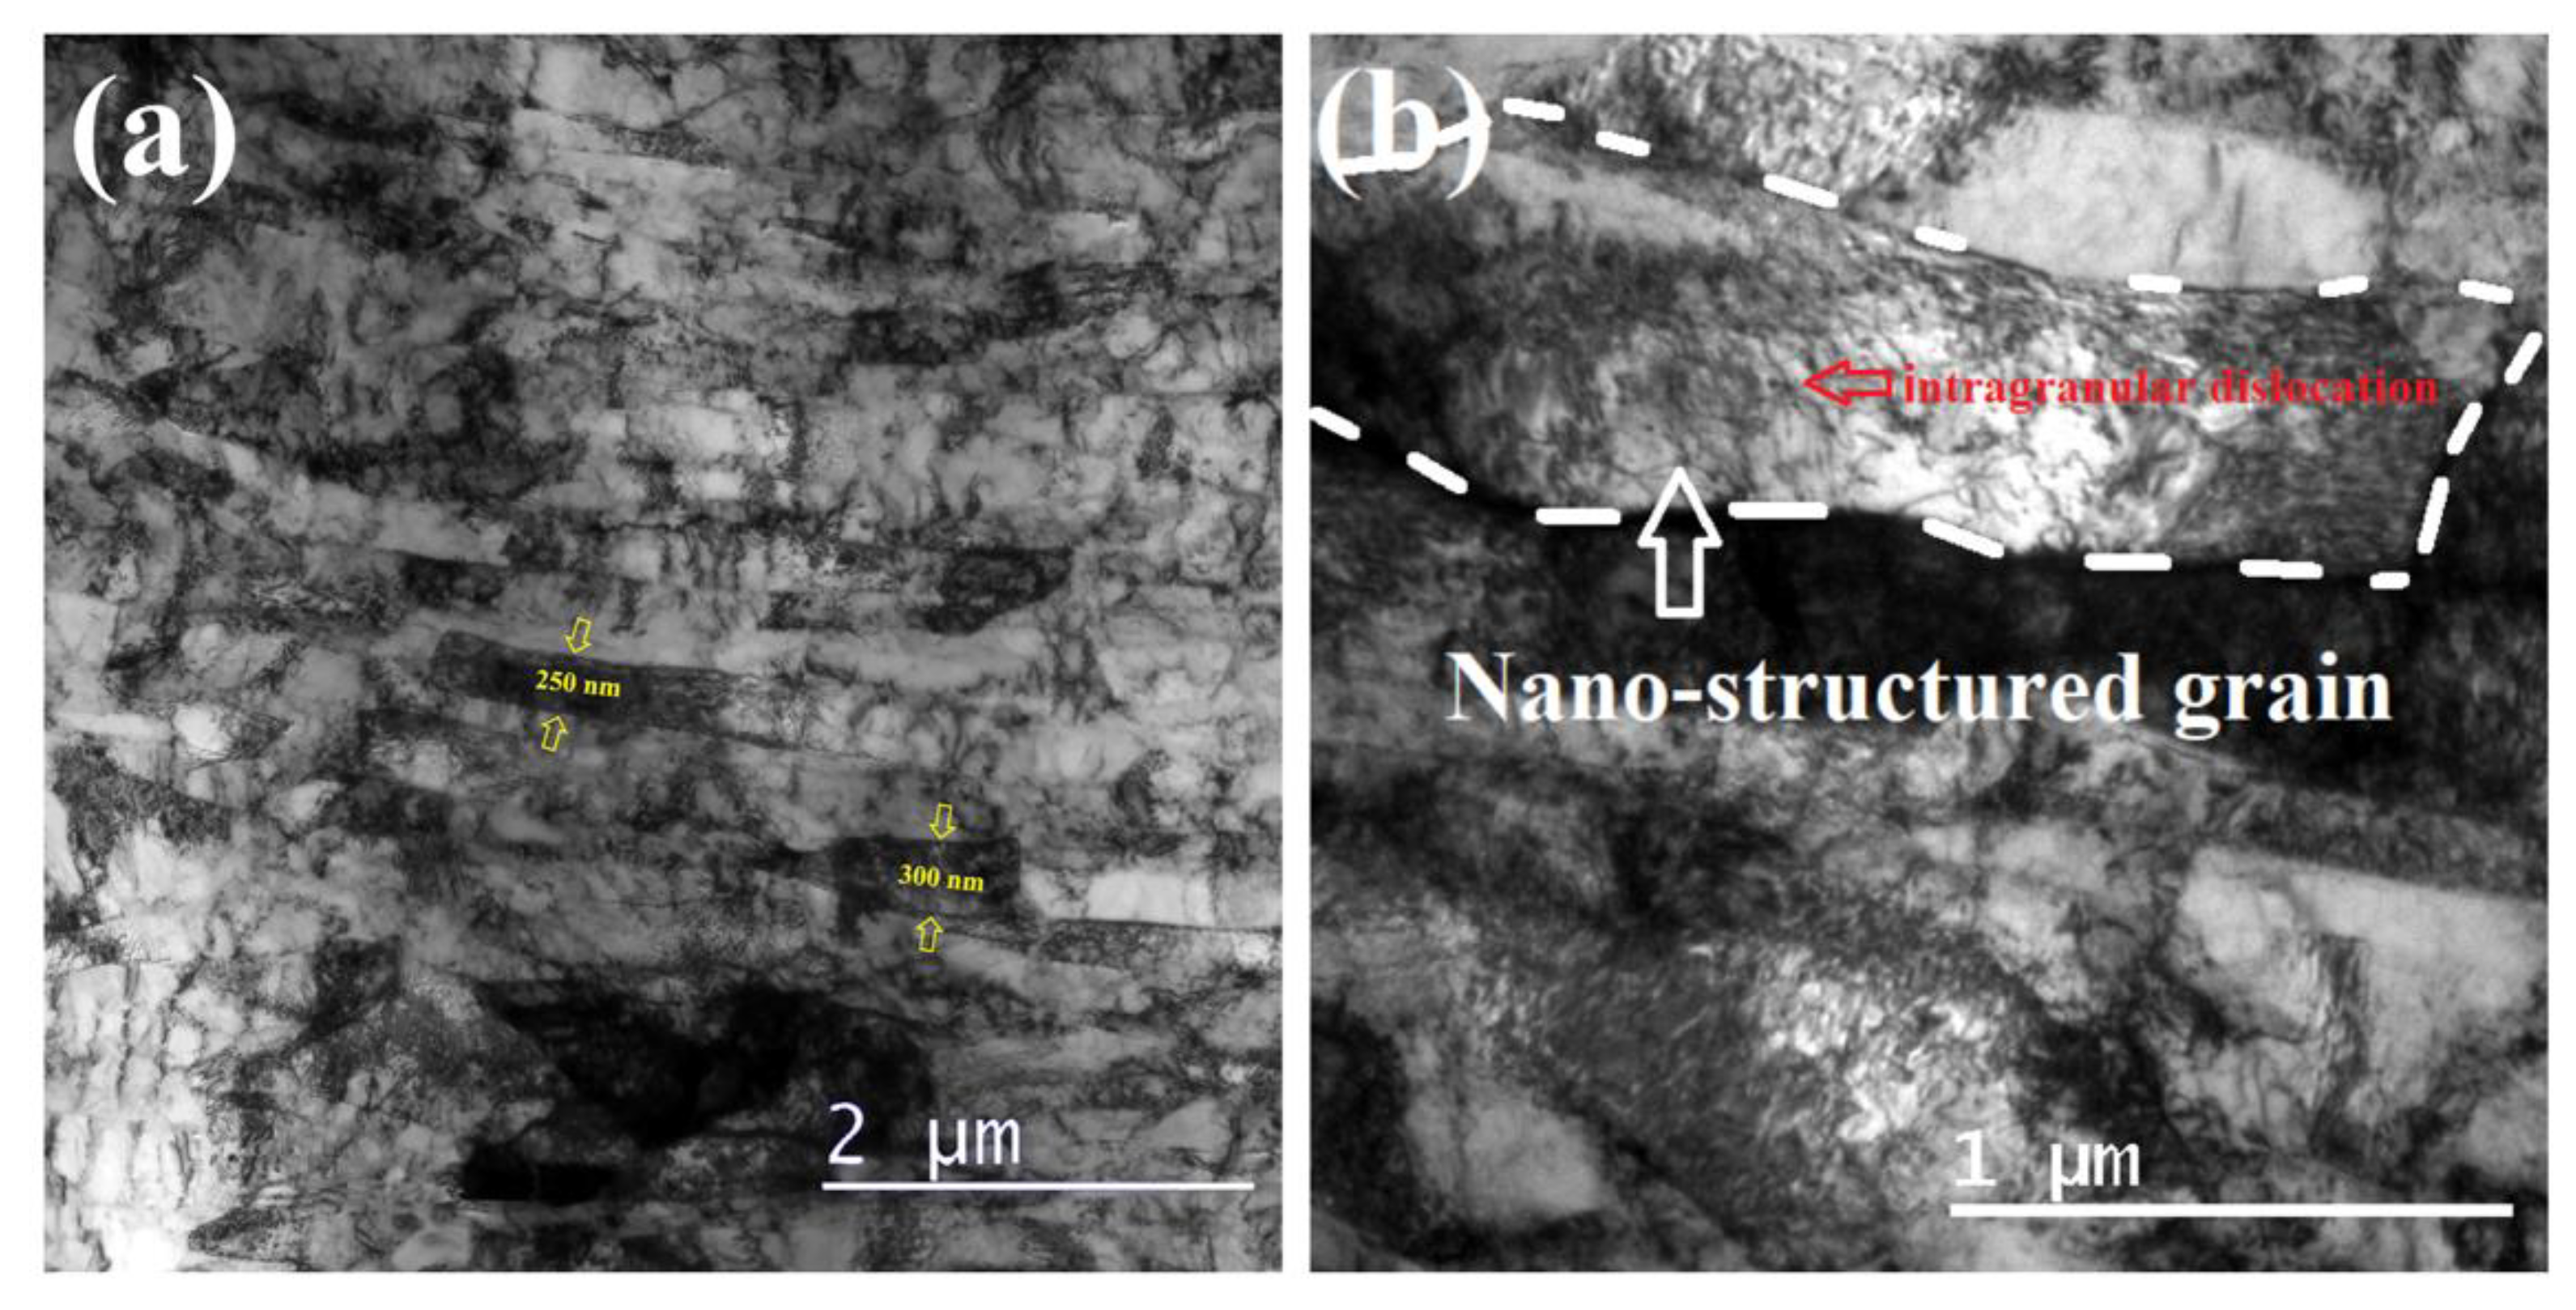
The excellent corrosion resistance of SNC rebar benefits from both the removal of surface rust layer and the strengthening effect of surface nanostructured grains on its passive film. Nanostructured grains with a grain size of about 250–300 nm contain numerous crystal defects, like grain boundaries and intergranular dislocation. The positive influence of high-energy crystal defects in nanostructured grains on the thermodynamics and kinetics of the passive film formation leads to a passive film with higher Cr/Fe oxide and hydroxide content formed on the SNC rebar surface, which enhances the passivation properties and chloride corrosion resistance of the passive film.

Author Contributions

Writing—original draft preparation, W.L.; funding acquisition, Q.W.; investigation, G.Z.; writing—review and editing, E.E.K.; methodology, Z.A.; conceptualization, F.Y.; visualization, N.L.; data curation, L.G.; formal analysis, B.G.; software, B.L.; resources, Y.C.; supervision and conceptualization, D.S. All authors have read and agreed to the published version of the manuscript.

Funding

This research was funded by Natural Science Foundation of China (Grant No. 51878246, 52278255 & 51908257), Six Talent Peaks Project in Jiangsu Province (Grant No. 2016-XCL-196), Science and Technology Support Program funded project of Suqian City (Grant No. Industrial H201817), Natural Science Foundation of Jiangxi Province (Grant No. 20202BAB214023), and Jiangsu Maritime Institute Science and Technology Innovation Fund (Grant No. KJCX-1808).

Institutional Review Board Statement

Not applicable.

Informed Consent Statement

Not applicable.

Data Availability Statement

Not applicable.

Conflicts of Interest

The authors declare no conflict of interest.

References

  1. Abosrra, L.; Ashour, A.F.; Youseffi, M. Corrosion of steel reinforcement in concrete of different compressive strengths. Constr. Build. Mater. 2011, 25, 3915–3925. [Google Scholar] [CrossRef]
  2. Al-Akhras, N.; Mashaqbeh, Y. Potential use of eucalyptus leaves as green corrosion inhibitor of steel reinforcement. J. Build. Eng. 2021, 35, 101848. [Google Scholar] [CrossRef]
  3. Xu, P.; Zhou, J.; Li, G.; Wang, P.; Chi, H. Corrosion inhibition efficiency of compound nitrite with D-sodium gluconate on carbon steel in simulated concrete pore solution. Constr. Build. Mater. 2021, 288, 123101. [Google Scholar] [CrossRef]
  4. Yang, H.; Li, W.; Liu, X.; Liu, A.; Hang, P.; Ding, R.; Li, T.; Zhang, Y.; Wang, W.; Xiong, C. Preparation of corrosion inhibitor loaded zeolites and corrosion resistance of carbon steel in simulated concrete pore solution. Constr. Build. Mater. 2019, 225, 90–98. [Google Scholar] [CrossRef]
  5. Alawi, A.; Mohammed, M.; Baghabra, A.; Saleh, T.A.; Mohammed, S. Efficiency of generic and proprietary inhibitors in mitigating corrosion of carbon steel in chloride-sulfate environments. Sci. Rep. 2018, 8, 11443. [Google Scholar]
  6. Liu, Y.; Song, Z.; Wang, W.; Jiang, L.; Zhang, Y.; Guo, M.; Song, F.; Xu, N. Effect of ginger extract as green inhibitor on chloride-induced corrosion of carbon steel in simulated concrete pore solutions. J. Clean. Prod. 2019, 214, 298–307. [Google Scholar] [CrossRef]
  7. Bellezze, T.; Malavolta, M.; Quaranta, A.; Ruffini, N.; Roventi, G. Corrosion behaviour in concrete of three differently galvanized steel bars. Cem. Concr. Compos. 2006, 28, 246–255. [Google Scholar] [CrossRef]
  8. Huang, Y.; Zhang, Y.; Li, X.; Ying, J. Bond of epoxy-coated steel bars to seawater sea sand recycled concrete. Structures 2021, 30, 866–876. [Google Scholar] [CrossRef]
  9. Raj, R.; Morozov, Y.; Calado, L.M.; Taryba, M.G.; Kahraman, R.; Shakoor, A.; Montemor, M.F. Inhibitor loaded calcium carbonate microparticles for corrosion protection of epoxy-coated carbon steel. Electrochim. Acta 2019, 319, 801–812. [Google Scholar]
  10. Song, D.; Hao, J.; Yang, F.; Chen, H.; Liang, N.; Wu, Y.; Zhang, J.; Ma, H.; Klu, E.E.; Gao, B.; et al. Corrosion behavior and mechanism of Cr–Mo alloyed steel: Role of ferrite/bainite duplex microstructure. J. Alloys Compd. 2019, 809, 151787. [Google Scholar] [CrossRef]
  11. Duarte, R.G.; Castela, A.S.; Neves, R.; Freire, L.; Montemor, M.F. Corrosion behavior of stainless steel rebars embedded in concrete: An electrochemical. impedance spectroscopy study. Electrochim. Acta 2014, 124, 218–224. [Google Scholar] [CrossRef]
  12. Feng, H.; Li, H.; Wu, X.; Jiang, Z.; Zhao, S.; Zhang, T.; Xu, D.; Zhang, S.; Zhu, H.; Zhang, B.; et al. Effect of nitrogen on corrosion behaviour of a novel high nitrogen medium-entropy alloy CrCoNiN manufactured by pressurized metallurgy. J. Mater. Sci. Technol. 2018, 34, 1781–1790. [Google Scholar] [CrossRef] [Green Version]
  13. Zhang, L.; Niu, D.; Wen, B.; Peng, G.; Sun, Z. Corrosion behavior of low alloy steel bars containing Cr and Al in coral concrete for ocean construction. Constr. Build. Mater. 2020, 258, 119564. [Google Scholar] [CrossRef]
  14. Jin, Z.; Xiong, C.; Zhao, T.; Du, Y.; Zhang, X.; Li, N.; Yu, Y.; Wang, P. Passivation and depassivation properties of Cr–Mo alloyed corrosion-resistant steel in simulated concrete pore solution. Cem. Concr. Compos. 2022, 126, 104375. [Google Scholar] [CrossRef]
  15. Zhang, S.; Liu, J.; Tang, M.; Zhang, X.; Wu, K. Role of rare earth elements on the improvement of corrosion resistance of micro-alloyed steels in 3.5 wt.% NaCl solution. J. Mater. Res. Technol. 2021, 11, 519–534. [Google Scholar] [CrossRef]
  16. Ai, Z.; Jiang, J.; Sun, W.; Jiang, X.; Yu, B.; Wang, K.; Zhang, Z.; Song, D.; Ma, H.; Zhang, J. Enhanced passivation of alloy corrosion-resistant steel Cr10Mo1 under carbonation—Passive film formation, the kinetics and mechanism analysis. Cem. Concr. Compos. 2018, 92, 178–187. [Google Scholar] [CrossRef]
  17. Liu, W.; Wang, Q.; Hao, J.; Zou, G.; Zhang, P.; Wang, G.; Ai, Z.; Chen, H.; Ma, H.; Song, D. Corrosion resistance and corrosion interface characteristics of Cr-alloyed rebar based on accelerated corrosion testing with impressed current. J. Mater. Res. Technol. 2023, 22, 2996–3009. [Google Scholar] [CrossRef]
  18. Zhang, L.; He, B.; Wang, S.; Wang, G.; Yuan, X. Ecofriendly ultrasonic rust removal: An empirical optimization based on response surface methodology. Coatings 2021, 11, 1127. [Google Scholar] [CrossRef]
  19. Pour-Ali, S.; Kiani-Rashid, A.R.; Babakhani, A.; Virtanen, S.; Allieta, M. Correlation between the surface coverage of severe shot peening and surface microstructural evolutions in AISI 321: A TEM, FE-SEM and GI-XRD study. Surf. Coat. Technol. 2018, 334, 461–470. [Google Scholar] [CrossRef]
  20. Rudawska, A.; Danczak, I.; Muller, M.; Valasek, P. The effect of sandblasting on surface properties for adhesion. Int. J. Adhes. Adhes. 2016, 70, 176–190. [Google Scholar] [CrossRef]
  21. Gupta, R.K.; Birbilis, N. The influence of nanocrystalline structure and processing route on corrosion of stainless steel: A review. Corros. Sci. 2015, 92, 1–15. [Google Scholar] [CrossRef]
  22. Morshed-Behbahani, K.; Zakerin, N. A review on the role of surface nanocrystallization in corrosion of stainless steel. J. Mater. Res. Technol. 2022, 19, 1120–1147. [Google Scholar] [CrossRef]
  23. Kitahara, H.; Yada, T.; Hashiguchi, F.; Tsushida, M.; Ando, S. Mg alloy sheets with a nanocrystalline surface layer fabricated by wire-brushing. Surf. Coat. Technol. 2014, 243, 28–33. [Google Scholar] [CrossRef]
  24. Pan, C.; Liu, L.; Li, Y.; Wang, S.; Wang, F. Passive film growth mechanism of nanocrystalline 304 stainless steel prepared by magnetron sputtering and deep rolling techniques. Electrochim. Acta. 2011, 56, 7740–7748. [Google Scholar] [CrossRef]
  25. Song, D.; Ma, A.; Sun, W.; Jiang, J.; Jiang, J.; Yang, D.; Guo, G. Improved corrosion resistance in simulated concrete pore solution of surface nanocrystallized rebar fabricated by wire-brushing. Corros. Sci. 2014, 82, 437–441. [Google Scholar] [CrossRef]
  26. Gui, Y.; Zheng, Z.J.; Gao, Y. The bi-layer structure and the higher compactness of a passive film on nanocrystalline 304 stainless steel. Thin Solid Films 2016, 599, 64–71. [Google Scholar] [CrossRef]
  27. Stefanoni, M.; Angst, U.; Elsener, B. Local electrochemistry of reinforcement steel—Distribution of open circuit and pitting potentials on steels with different surface condition. Corros. Sci. 2015, 98, 610–618. [Google Scholar] [CrossRef]
  28. Hussain, R.R.; Al-Negheimish, A.; Alhozaimy, A.; Singh, D.D.N. Corrosion characteristics of vanadium micro-alloyed steel reinforcement bars exposed in concrete environments and industrially polluted atmosphere. Cem. Concr. Compos. 2020, 113, 103728. [Google Scholar] [CrossRef]
  29. Wang, G.; Song, D.; Qiao, Y.; Cheng, J.; Liu, H.; Jiang, J.; Ma, A.; Ma, X. Developing super-hydrophobic and corrosion-resistant coating on magnesium-lithium alloy via one-step hydrothermal processing. J. Magnes. Alloys 2021, 107, 197–206. [Google Scholar] [CrossRef]
  30. Yuan, X.; Wang, X.; Cao, Y.; Yang, H. Natural passivation behavior and its influence on chloride-induced corrosion resistance of stainless steel in simulated concrete pore solution. J. Mater. Res. Technol. 2020, 9, 12378–12390. [Google Scholar] [CrossRef]
  31. Wang, M.; Shu, Q.; Shi, Y.; Teng, C.; Wang, J.; Jin, S.; Chen, S.; Qin, J.; Wang, D. Fabrication of hydrophobic AlCoCrFeNi high-entropy alloy and superior corrosion resistance to NTO aqueous solution. J. Alloys Compd. 2022, 915, 165394. [Google Scholar] [CrossRef]
  32. Zhang, F.; Li, X.; Deng, S.; Tang, M.; Du, G. Amphoteric surfactant of octadecyl dimethyl betaine as an efficient corrosion inhibitor for cold rolled steel in phosphoric acid solution. J. Alloys Compd. 2021, 15, 7050–7069. [Google Scholar] [CrossRef]
  33. Yang, J.; Wang, Z.; Qiao, Y.; Zheng, Y. Synergistic effects of deposits and sulfate reducing bacteria on the corrosion of carbon steel. Corros. Sci. 2022, 199, 110210. [Google Scholar] [CrossRef]
  34. Zuo, J.; Wu, B.; Luo, C.; Dong, B.; Xing, F. Preparation of MgAl layered double hydroxides intercalated with nitrite ions and corrosion protection of steel bars in simulated carbonated concrete pore solution. Corros. Sci. 2019, 152, 120–129. [Google Scholar] [CrossRef]
  35. Zheng, Z.; Long, J.; Guo, Y.; Li, H.; Zheng, K.; Qiao, Y. Corrosion and impact–abrasion–corrosion behaviors of quenching–tempering martensitic Fe–Cr alloy steels. J. Iron Steel Res. Int. 2022, 29, 1853–1863. [Google Scholar] [CrossRef]
  36. Jiang, S.; Jiang, L.; Wang, Z.; Jin, M.; Bai, S.; Song, S.; Yan, X. Deoxyribonucleic acid as an inhibitor for chloride-induced corrosion of reinforcing steel in simulated concrete pore solutions. Constr. Build. Mater. 2017, 150, 238–247. [Google Scholar] [CrossRef]
  37. Anitha, R.; Chitra, S.; Hemapriya, V.; Chung, I.M.; Kim, S.H.; Prabakaran, M. Implications of eco-addition inhibitor to mitigate corrosion in reinforced steel embedded in concrete. Constr. Build. Mater. 2019, 213, 246–256. [Google Scholar] [CrossRef]
  38. Burduhos-Nergis, D.P.; Vizureanu, P.; Sandu, A.V.; Bejinariu, C. Phosphate surface treatment for improving the corrosion resistance of the C45 carbon steel used in carabiners manufacturing. Materials 2020, 13, 3410. [Google Scholar] [CrossRef]
  39. Grosvenor, A.P.; Kobe, B.A.; Biesinger, M.C.; McIntyre, N.S. Investigation of multiplet splitting of Fe 2p XPS spectra and bonding in iron compounds. Surf. Interface Anal. 2004, 36, 1564–1574. [Google Scholar] [CrossRef]
  40. Grosvenor, A.P.; Kobe, B.A.; McIntyre, N.S. Studies of the oxidation of iron by water vapour using X-ray photoelectron. spectroscopy and QUASES™. Surf. Sci. 2004, 572, 217–227. [Google Scholar] [CrossRef]
  41. Biesinger, M.C.; Payne, B.P.; Grosvenor, A.P.; Lau, L.W.M.; Gerson, A.R.; Smart, R.S.C. Resolving surface chemical states in XPS analysis of first row transition metals, oxides and hydroxides: Cr, Mn, Fe, Co and Ni. Appl. Surf. Sci. 2011, 257, 2717–2730. [Google Scholar] [CrossRef]
  42. Feng, X.; Lu, X.; Zuo, Y.; Chen, D. The passive behaviour of 304 stainless steels in saturated calcium hydroxide solution under different deformation. Corros. Sci. 2014, 82, 347–355. [Google Scholar] [CrossRef]
  43. Luo, H.; Su, H.; Li, B.; Ying, G. Electrochemical and passive behaviour of tin alloyed ferritic stainless steel in concrete environment. Appl. Surf. Sci. 2018, 439, 232–239. [Google Scholar] [CrossRef]
  44. Ding, J.; Zhang, L.; Lu, M.; Wang, J.; Wen, Z.; Hao, W. The electrochemical behaviour of 316L austenitic stainless steel in Cl- containing environment under different H2S partial pressures. Appl. Surf. Sci. 2014, 289, 33–41. [Google Scholar] [CrossRef]
  45. Yang, S.; Li, C.; Chen, A.; Gan, B.; Gu, J. Microstructure and corrosion resistance of stainless steel manufactured by laser melting deposition. J. Manuf. Process. 2021, 65, 418–427. [Google Scholar] [CrossRef]
  46. Yilmaz, A.; Traka, K.; Pletincx, S.; Hauffman, T.; Sietsma, J.; Gonzalez-Garcia, Y. Effect of microstructural defects on passive layer properties of interstitial free (IF) ferritic steels in alkaline environment. Corros. Sci. 2021, 182, 109271. [Google Scholar] [CrossRef]
  47. Tian, Y.; Dong, C.; Wang, G.; Cheng, X.; Li, X. The effect of nickel on corrosion behaviour of high-strength low alloy steel rebar in simulated concrete pore solution. Constr. Build. Mater. 2020, 246, 118462. [Google Scholar] [CrossRef]
  48. Santamaria, M.; Di Franco, F.; Di Quarto, F.; Pisarek, M.; Zanna, S.; Marcus, P. Photoelectrochemical and XPS characterisation of oxide layers on 316L stainless steel grown in high-temperature water. J. Solid State Electrochem. 2015, 19, 3511–3519. [Google Scholar] [CrossRef]
  49. Qiao, Y.; Wang, X.; Yang, L.; Wang, X.; Chen, J.; Wang, Z.; Zhou, H.; Zou, J.; Wang, F. Effect of aging treatment on microstructure and corrosion behavior of a Fe-18Cr-15Mn-0.66N stainless steel. J. Mater. Sci. Technol. 2022, 107, 197–206. [Google Scholar] [CrossRef]
  50. Yang, X.; Yang, Y.; Sun, M.; Jia, J.; Cheng, X.; Pei, Z.; Li, Q.; Xu, D.; Xiao, K.; Li, X. A new understanding of the effect of Cr on the corrosion resistance evolution of weathering steel based on big data technology. J. Mater. Sci. Technol. 2022, 104, 67–80. [Google Scholar] [CrossRef]
  51. Cheng, H.; Luo, H.; Wang, X.; Pan, Z.; Jiang, Y.; Li, X. Electrochemical corrosion and passive behavior of a new high-nitrogen austenitic stainless steel in chloride environment. Mater. Chem. Phys. 2022, 292, 126837. [Google Scholar] [CrossRef]
  52. Afshari, V.; Dehghanian, C. Effects of grain size on the electrochemical corrosion behaviour of electrodeposited nanocrystalline Fe coatings in alkaline solution. Corros. Sci. 2009, 51, 1844–1849. [Google Scholar] [CrossRef]
  53. Xue, L.; Ding, Y.; Pradeep, K.G.; Case, R.; Castaneda, H.; Paredes, M. The grain size effect on corrosion property of Al2Cr5Cu5Fe53Ni35 high-entropy alloy in marine environment. Corros. Sci. 2022, 208, 110625. [Google Scholar] [CrossRef]
  54. Wang, P.; Ma, L.; Cheng, X.; Li, X. Influence of grain refinement on the corrosion behavior of metallic materials: A review. Int. J. Miner. Metall. Mater. 2021, 28, 1112–1126. [Google Scholar] [CrossRef]
  55. Li, T.; Liu, L.; Zhang, B.; Li, Y.; Yan, F.; Tao, N.; Wang, F. Passive behavior of a bulk nanostructured 316L austenitic stainless steel consisting of nanometer-sized grains with embedded nano-twin bundles. Corros. Sci. 2014, 85, 331–342. [Google Scholar] [CrossRef]
  56. Li, T.; Liu, L.; Zhang, B.; Li, Y.; Wang, X.; Wang, F. Direct observation of thin membrane passive film over the growing pit on sputtered nanocrystalline austenitic stainless steel film. Electrochem. Commun. 2015, 52, 80–84. [Google Scholar] [CrossRef]
  57. Wang, X.; Li, D. Mechanical and electrochemical behavior of nanocrystalline surface of 304 stainless steel. Electrochim. Acta 2002, 47, 3939–3947. [Google Scholar] [CrossRef]
  58. Liu, L.; Li, Y.; Wang, F. Electrochemical corrosion behavior of nanocrystalline materials—A review. J. Mater. Sci. Technol. 2010, 26, 1–14. [Google Scholar] [CrossRef]
Figure 1. Illustration of SNC processing of rusted rebar sample (a) and optical images of the rebar sample with different surface conditions (b).
Coatings 13 00192 g001
Figure 2. SEM microstructure of the rebar: (a) scaled rebar, (b) rusted rebar, and (c) SNC rebar.
Coatings 13 00192 g002
Figure 3. XRD patterns of rebar with different surface conditions.
Coatings 13 00192 g003
Figure 4. OCP evolution curves of the rebar tested during constant immersion in SCPS without/with chloride ions.
Coatings 13 00192 g004
Figure 5. EIS plots of the rebar tested during passivation and corrosion in the SCPS: (a,b) Nyquist and Bode diagrams of passivation; (c,d) Nyquist and Bode diagrams of corrosion.
Coatings 13 00192 g005
Figure 6. PDP curves of the rebar after immersion in the SCPS with chloride ions for 30 days.
Coatings 13 00192 g006
Figure 7. XPS depth analysis of Cr 2p3/2 at (a) 0 nm, (b) 6 nm, (c) 12 nm, (d) 18 nm, and (e) 24 nm in the passive film of the rebar matrix.
Coatings 13 00192 g007
Figure 8. XPS depth analysis of Cr 2p3/2 at (a) 0 nm, (b) 6 nm, (c) 12 nm, (d) 18 nm, and (e) 24 nm in the passive film of the SNC rebar.
Coatings 13 00192 g008
Figure 9. XPS depth analysis of Fe 2p3/2 at (a) 0 nm, (b) 6 nm, (c) 12 nm, (d) 18 nm, and (e) 24 nm of the passive film of the rebar matrix.
Coatings 13 00192 g009
Figure 10. XPS depth analysis of Fe 2p3/2 at (a) 0 nm, (b) 6 nm, (c) 12 nm, (d) 18 nm, and (e) 24 nm of the passive film of SNC rebar.
Coatings 13 00192 g010
Figure 11. SEM image of the gradient microstructure of the SNC rebar obtained by FIB cutting.
Coatings 13 00192 g011
Figure 12. TEM microstructure characteristics of the SNC rebar: (a) grain morphology; (b) intragranular microstructure characteristics.
Coatings 13 00192 g012
Figure 13. Schematic diagrams of the formation of passive films on SNC rebar and rebar matrix.
Coatings 13 00192 g013
Table 1. Chemical compositions of Cr-alloyed rebar.
Chemical CompositionCSiMnPSVCrMoFe
Measured (wt.%)0.020.491.490.010.010.0510.061.26Balance
Table 2. Fitted electrochemical parameters for rebars exposed to SCPS during passivation and corrosion.
SamplesRs
(Ω·cm2)
Rf
(kΩ·cm2)
Yf
(10−4Ω−1·
cm−2·sn)
nfRct
(kΩ·cm2)
Ydl
(10−4Ω−1·cm−2·sn)
ndlL
(10−5H)
Chi Square
( × 10−4)
Passivation stateScaled8.61.264.260.9082.67.430.56/15.12
Rusted7.60.918.790.91285.37.030.497.2928.27
SNC9.52.6653.680.94395.25.370.74/4.99
Corrosion stateScaled6.31.085.460.7854.210.140.47/8.69
Rusted9.70.6910.780.68184.513.540.346.8143.11
SNC5.92.14.60.85259.17.560.65/6.14
Table 3. Electrochemical parameters of PDP curves.
SamplesEcorr (VSCE)Epit (VSCE) i p   ( μ A   · cm 2 ) i corr   ( μ A   · cm 2 ) υ × 10 2   ( mm · a 2 ) R p × 10 2 ( Ω   · cm 2 )
rusted rebar−0.209 ±   0.011 0.214 ± 0.0072.582 ± 0.0452.511 ± 0.0583.060 ± 0.0685.473 ± 0.129
scaled rebar−0.367 ± 0.0120.296 ± 0.0090.761 ±   0.021 0.656 ± 0.0270.799 ± 0.034135.14 ± 5.810
SNC rebar−0.307 ± 0.0170.334 ± 0.0100.469 ± 0.0180.455 ± 0.0130.554 ± 0.016746.24 ± 21.70
Table 4. Cr 2p3/2 spectral fitting parameters: binding energy (eV), FWHM value (eV), and area ratio (%).
SampleSputtering Depth (nm)CrmetCr2O3CrOOH
PeakFWHMRatio PeakFWHMRatio PeakFWHMRatio
Substrate0574.32.117.21576.21.4150.82577.31.4541.97
6574.31.3433.05576.11.4837.50577.31.5229.45
12574.31.2448.11576.11.6931.05577.41.5520.84
18574.31.3355.88576.21.5326.92577.51.8017.19
24574.31.1363.28576.21.6829.54577.51.067.19
SNC0574.32.383.09576.21.4951.14577.41.5245.77
6574.31.3624.41576.21.6443.15577.51.6932.44
12574.31.3844.31576.11.7729.44577.21.9626.24
18574.31.4355.07576.21.8723.54577.31.4521.39
24574.31.4162.94576.21.8727.43577.51.529.63
Table 5. Fe 2p3/2 spectral fitting parameters: binding energy (eV), FWHM value (eV), and area ratio (%).
SampleSputtering Depth (nm)FemetFeOFe2O3FeOOH
PeakFWHMRatio PeakFWHMRatio PeakFWHMRatio PeakFWHMRatio
Substrate0706.70.7627.34707.40.8915.24708.61.6512.81710.62.4544.61
6706.70.7435.33707.41.0126.50708.81.6718.60710.52.1319.57
12706.70.7537.67707.40.9224.12708.41.5717.56710.32.8120.65
18706.70.8851.60707.61.0526.57708.91.4512.77710.51.969.06
24706.70.8046.58707.50.9326.20708.61.4215.09710.32.0312.13
SNC0706.70.6215.87707.40.789.48708.51.256.87710.73.4167.78
6706.60.7433.82707.30.8018.82708.21.6120.86710.02.0626.50
12706.70.7536.68707.40.9524.34708.41.6417.93710.12.2421.05
18706.70.7638.21707.30.9124.04708.21.4118.92709.92.0418.83
24706.70.7641.21707.40.8824.04708.31.3416.08709.91.9518.67
Disclaimer/Publisher’s Note: The statements, opinions and data contained in all publications are solely those of the individual author(s) and contributor(s) and not of MDPI and/or the editor(s). MDPI and/or the editor(s) disclaim responsibility for any injury to people or property resulting from any ideas, methods, instructions or products referred to in the content.

