Article

Corrosion Behavior of Selective Laser Melted Ti-6Al-4V in 0.1 mol/L NaOH Solution

1
Luoyang Ship Material Research Institute, Luoyang 471023, China
2
Key Lab. of Oral Diseases Research of Anhui Province, College & Hospital of Stomatology, Anhui Medical University, Hefei 230032, China
3
School of Materials Science and Engineering, Jiangsu University of Science and Technology, Zhenjiang 212003, China
4
Department of Chemistry, Western University, London, ON N6A 5B7, Canada
*
Authors to whom correspondence should be addressed.
Coatings 2023, 13(1), 150; https://doi.org/10.3390/coatings13010150
Submission received: 18 November 2022 / Revised: 9 December 2022 / Accepted: 21 December 2022 / Published: 11 January 2023
(This article belongs to the Topic Properties of the Corroding Interface)

Abstract

:
In this work, the corrosion behavior of a Ti-6Al-4V alloy prepared using selective laser melting (SLM) in a 0.1 mol/L NaOH solution was studied by means of corrosion electrochemical testing, X-ray diffraction analysis and X-ray photoelectron spectroscopy (XPS), and its corrosion process was compared with the commercially forged Ti-6Al-4V alloy. The results show that the corrosion resistance of the commercially forged Ti-6Al-4V alloy was higher than the SLMed Ti-6Al-4V alloy, which is closely correlated with the presence of more active spots on the alloy surface and more defects in the passive films.

1. Introduction

Additive manufacturing (AM) can precisely control the internal structure of components and their complex shape without geometric constraints [1]. Compared with traditional casting and forging processing methods, AM has several advantages, including no requirements for large forging instruments or dies, a fast fabrication speed, low cost, high integration and high flexibility [2,3,4], which can make AM capable of being widely used in biomedicine, aerospace and marine fields, especially when required to fabricate alloy parts with complex shapes.
The mechanical properties of materials prepared using AM are highly dependent on their chemical composition and heat treatment. Edwards et al. [5] found that the fatigue life and fatigue strength of Ti-6Al-4V prepared by selective laser melting (SLM) were 23% and ~20% lower, respectively, than those of traditionally forged Ti-6Al-4V. Zhang et al. [6] found that both the strength and toughness of the Co–Cr alloy fabricated by AM were improved compared with the traditional Co–Cr cast alloy due to the decrease in the thermal expansion coefficient. Lu et al. [7] prepared an Inconel 718 alloy by laser cladding amplification and found that its strength and elongation were greatly increased after proper heat treatment. All the studies mentioned above suggest that the application of proper heat treatment to these materials prepared using different AM processes can effectively optimize their strength, plasticity and toughness.
On the other hand, the corrosion performances of these materials made by AM also vary with materials, corrosive media and AM methods. In a phosphate buffer solution, the corrosion resistance of a Ti-6Al-4V alloy prepared by electron beam melting was higher than that of a forged Ti-6Al-4V alloy [8]. Tang et al. compared the corrosion behavior of a 718 alloy prepared by selective laser melting (SLMed 718) in a 3.5% NaCl solution to the rolled 718 alloy and found that the SLMed 718 alloy has a superior corrosion resistance as compared with the rolled 718 alloy. This can be attributed to the higher Cr2O3 content and lower donor/acceptor density in the passive film [9]. In a 6% FeCl3 solution, a 316L stainless steel prepared by SLM had a better corrosion resistance than an as-cast 316L alloy, although the corrosion pit was deeper [10]. This is closely correlated with the more rapid formation of a passive film on the SLMed 316L stainless steel. The presence of ultra-high subgrain boundaries in the SLMed 316L stainless steel increased the nucleation sites to form a passive film, and the microgalvanic coupling of a subgrain boundary with an internal subgrain also accelerated the corrosion, leading to the deposition of a thicker passive film on the surface [11]. It is consistent with the results in the previous study, indicating that the content of Cr2O3 in the passive film formed on the surface of the SLMed 316L stainless steel was twice that of the forged one in a simulated deep-sea environment (8 MPa, 5 °C) [12]. In a 10% sulfamic acid solution, the corrosion resistance of a Ti-6Al-4V alloy depended on the AM method, yielding that the SLMed Ti-6Al-4V alloy had the lowest corrosion rate than the ones prepared using spark plasma sintering and electron beam melting (EBM) [13].
Although the goals of these works above tried to utilize AM to fabricate components with complex shapes without sacrificing their mechanical and corrosion properties [1,2,3,4,5,6,7,8,9,10,11,12,13,14], their results are contradictory. Therefore, more studies are required to be conducted on the optimization of the AM method and characterization of the passive films formed [11,12]. Since the corrosion performance of a Ti-6Al-4V alloy in service relies on the composition, structure and property of the passive film formed on its surface and it can easily passivate in alkaline solutions (e.g., 0.1 M NaOH), the aim of this present work was to investigate the corrosion behavior of an SLMed Ti-6Al-4V in a 0.1 mol/L NaOH solution and to compare it with that of a commercially forged counterpart to find the proper AM method as well as the optimized AM parameters. The passive films formed on the surfaces of the SLMed and commercially forged Ti-6Al-4V alloys were characterized in detail to study how the SLM method changed the composition, structure and property of the passive film.

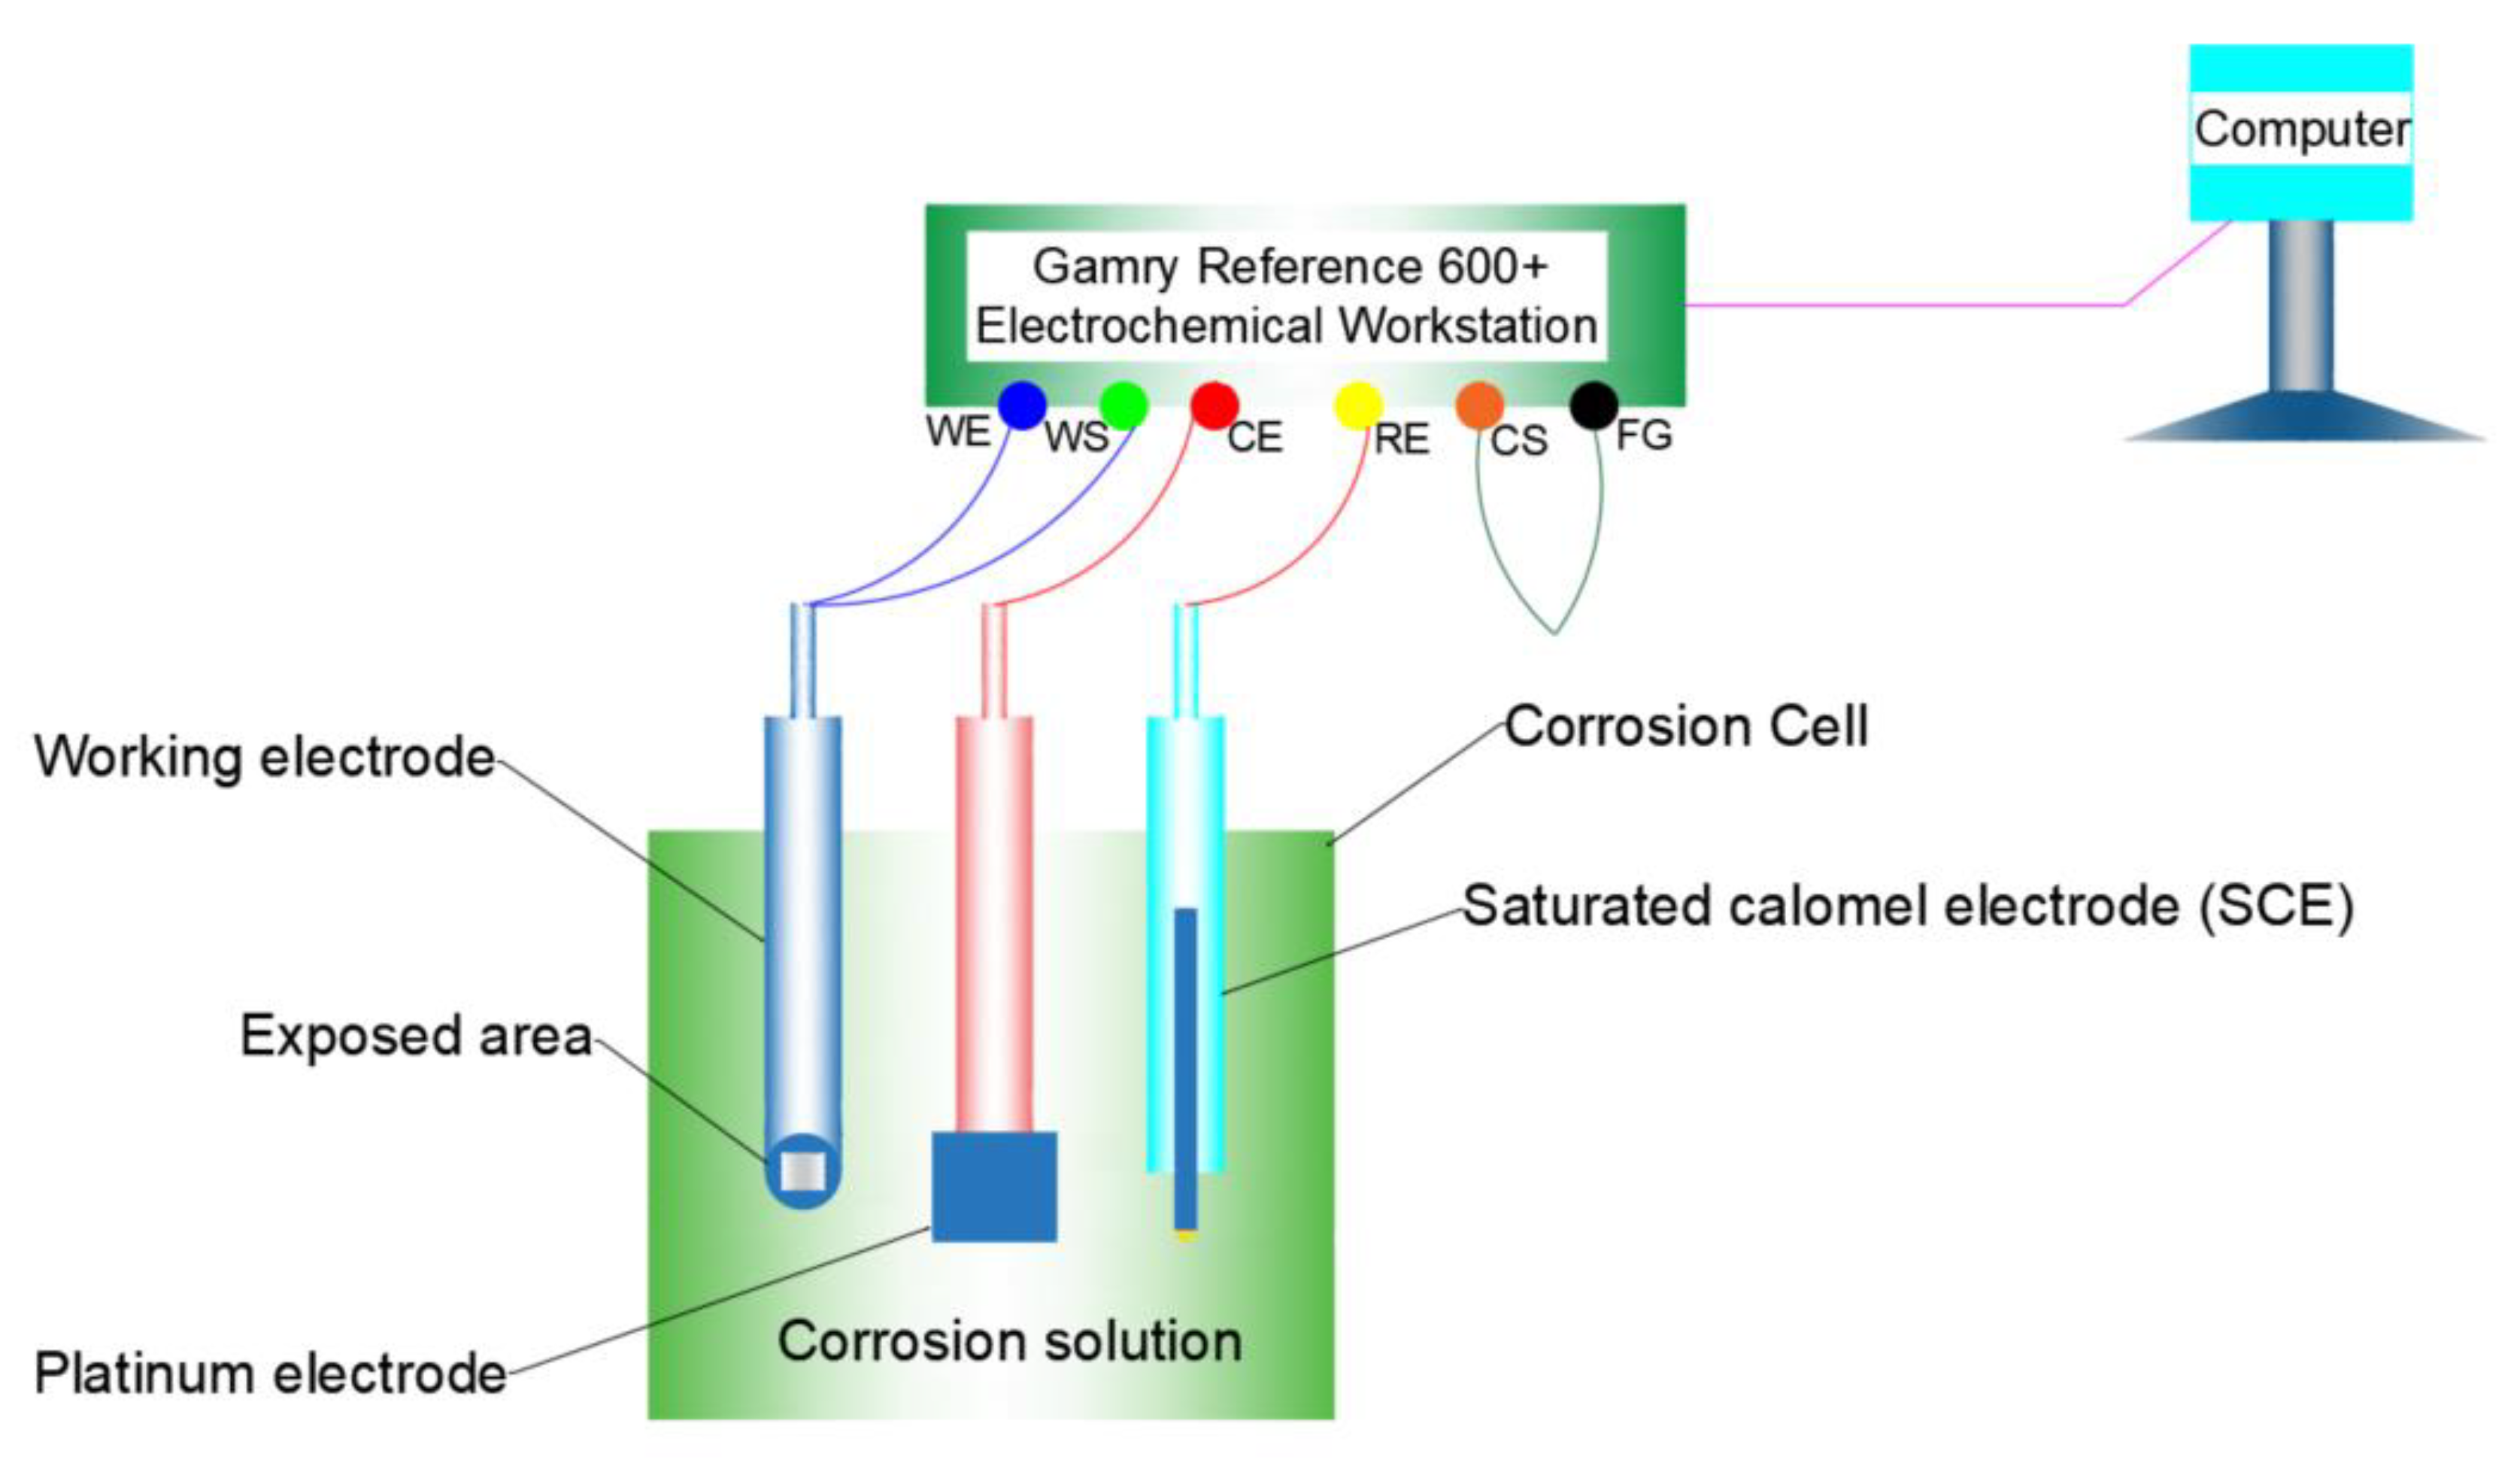
2. Experimental Details

The materials used in this work were commercially forged Ti-6Al-4V and SLMed Ti-6Al-4V alloys. The chemical compositions of the two Ti-6Al-4V alloys are shown in Table 1. The commercially forged Ti-6Al-4V was received in the form of a sheet at a thickness of 10 mm. The SLMed Ti-6Al-4V alloy was a round bar with a diameter of 14 mm.
The samples of the commercially forged Ti-6Al-4V alloy sheets were cut into coupons at dimensions of 10 mm × 5 mm × 2 mm, and their tested surfaces were perpendicular to the forging direction. The samples of the SLMed Ti-6Al-4V rod were cut into discs at a diameter of 14 mm and a thickness of 2 mm. After these specimens were sealed with epoxy resin, they were then ground using emery paper, mechanically polished using 1.5 μm grinding paste and dried using hot air. The exposed areas of the forged and SLMed Ti-6Al-4V alloy samples were 0.5 cm2 and 1.54 cm2, respectively. The samples were successively ground to 2000-grit emery paper, etched using Kroll reagent (3 mL HF, 9 mL HNO3 and 88 mL H2O) and then rinsed using distilled water and ethyl alcohol and dried using hot air.
Electrochemical measurements were carried out in a 1.5 L glass electrolytic cell using a traditional three-electrode system, in which a saturated calomel electrode (SCE) was used as the reference electrode, a platinum sheet with an area of 30 cm2 as the auxiliary electrode and the tested samples as the working electrode. The schematic diagram is shown in Figure 1. The solution used in this work is a 0.1 mol/L NaOH solution, which was prepared using analytically grade NaOH and distilled water. The temperature of the solution was controlled at 25 ± 0.5 °C. To ensure the reproducibility of the experimental results, all electrochemical tests were repeated at least three times.
The electrochemical tests were carried out by using a Gamry Reference 600+ electrochemical workstation (Gamry Instruments, Inc., Philadelphia, PA, USA). The samples were placed in a tested solution for 1 h at an open circuit potential to attain a steady state. Electrochemical impedance spectroscopy (EIS) measurements were conducted in a frequency range from 105 Hz to 10−2 Hz at a sinusoidal signal with an amplitude of 20 mV. The potentiodynamic polarization tests were scanned from 0.5 V below the open circuit potential (OCP) to 2 VSCE at a scanning speed of 0.5 mV/s. Prior to the Mott–Schottky test, the samples were immersed in a 0.1 mol/L NaOH solution at OCP for 1 h. The Mott–Schottky curve was then measured by scanning the potential from −0.5 VSCE to 2 VSCE at a scan rate of 20 mV/s at a frequency of 103 Hz. The local electrochemical impedance spectroscopy (LEIS) test was carried out using a scanning electrochemical workstation (Princeton VersaSCAN, AMETEK Advanced measurement technology, USA). The working electrode is the Ti-6Al-4V alloy, the calomel electrode was the reference electrode and the Pt plate was the counter electrode. The LEIS microprobe was a platinum double electrode that moves along two axes at a speed of 50 μm/s to adjust the working electrode surface to quantify the local potential gradient in the solution between the alloy surface and the probe, and then the iloc (the local alternating current density in the system) was connected. AC interference with a amplitude of 10 mV was applied to the working electrode with respect to an open circuit potential.
An X-ray diffractometer (XRD) was used to identify the phases present in these two Ti-6Al-4V alloys using a D/Max 2400 X-ray diffractometer (Rigaku Corporation, Tokyo, Japan) and Cu Kα radiation as the X-ray source. The scan rate was 6°/min. A Keyence VHX-700 (Keyence Co. Ltd., Osaka, Japan) was used to observe the optical microstructure. The preparation methods and the equipment used in the Electron Backscattered Diffraction (EBSD) test in this work were described in detail in the literature [15]. The samples used for the XPS test were soaked in a 0.1 mol/L NaOH solution for 3 h, then cleaned with ethanol and dried using hot air. XPS (ESCALAB 250Xi T, ThermoFisher Scientific, Waltham, MA, USA) was then performed to characterize the compositions of the passive films formed on the surfaces of these samples. Peak 4.1 software was used to fit the XPS data.

3. Results and Discussion

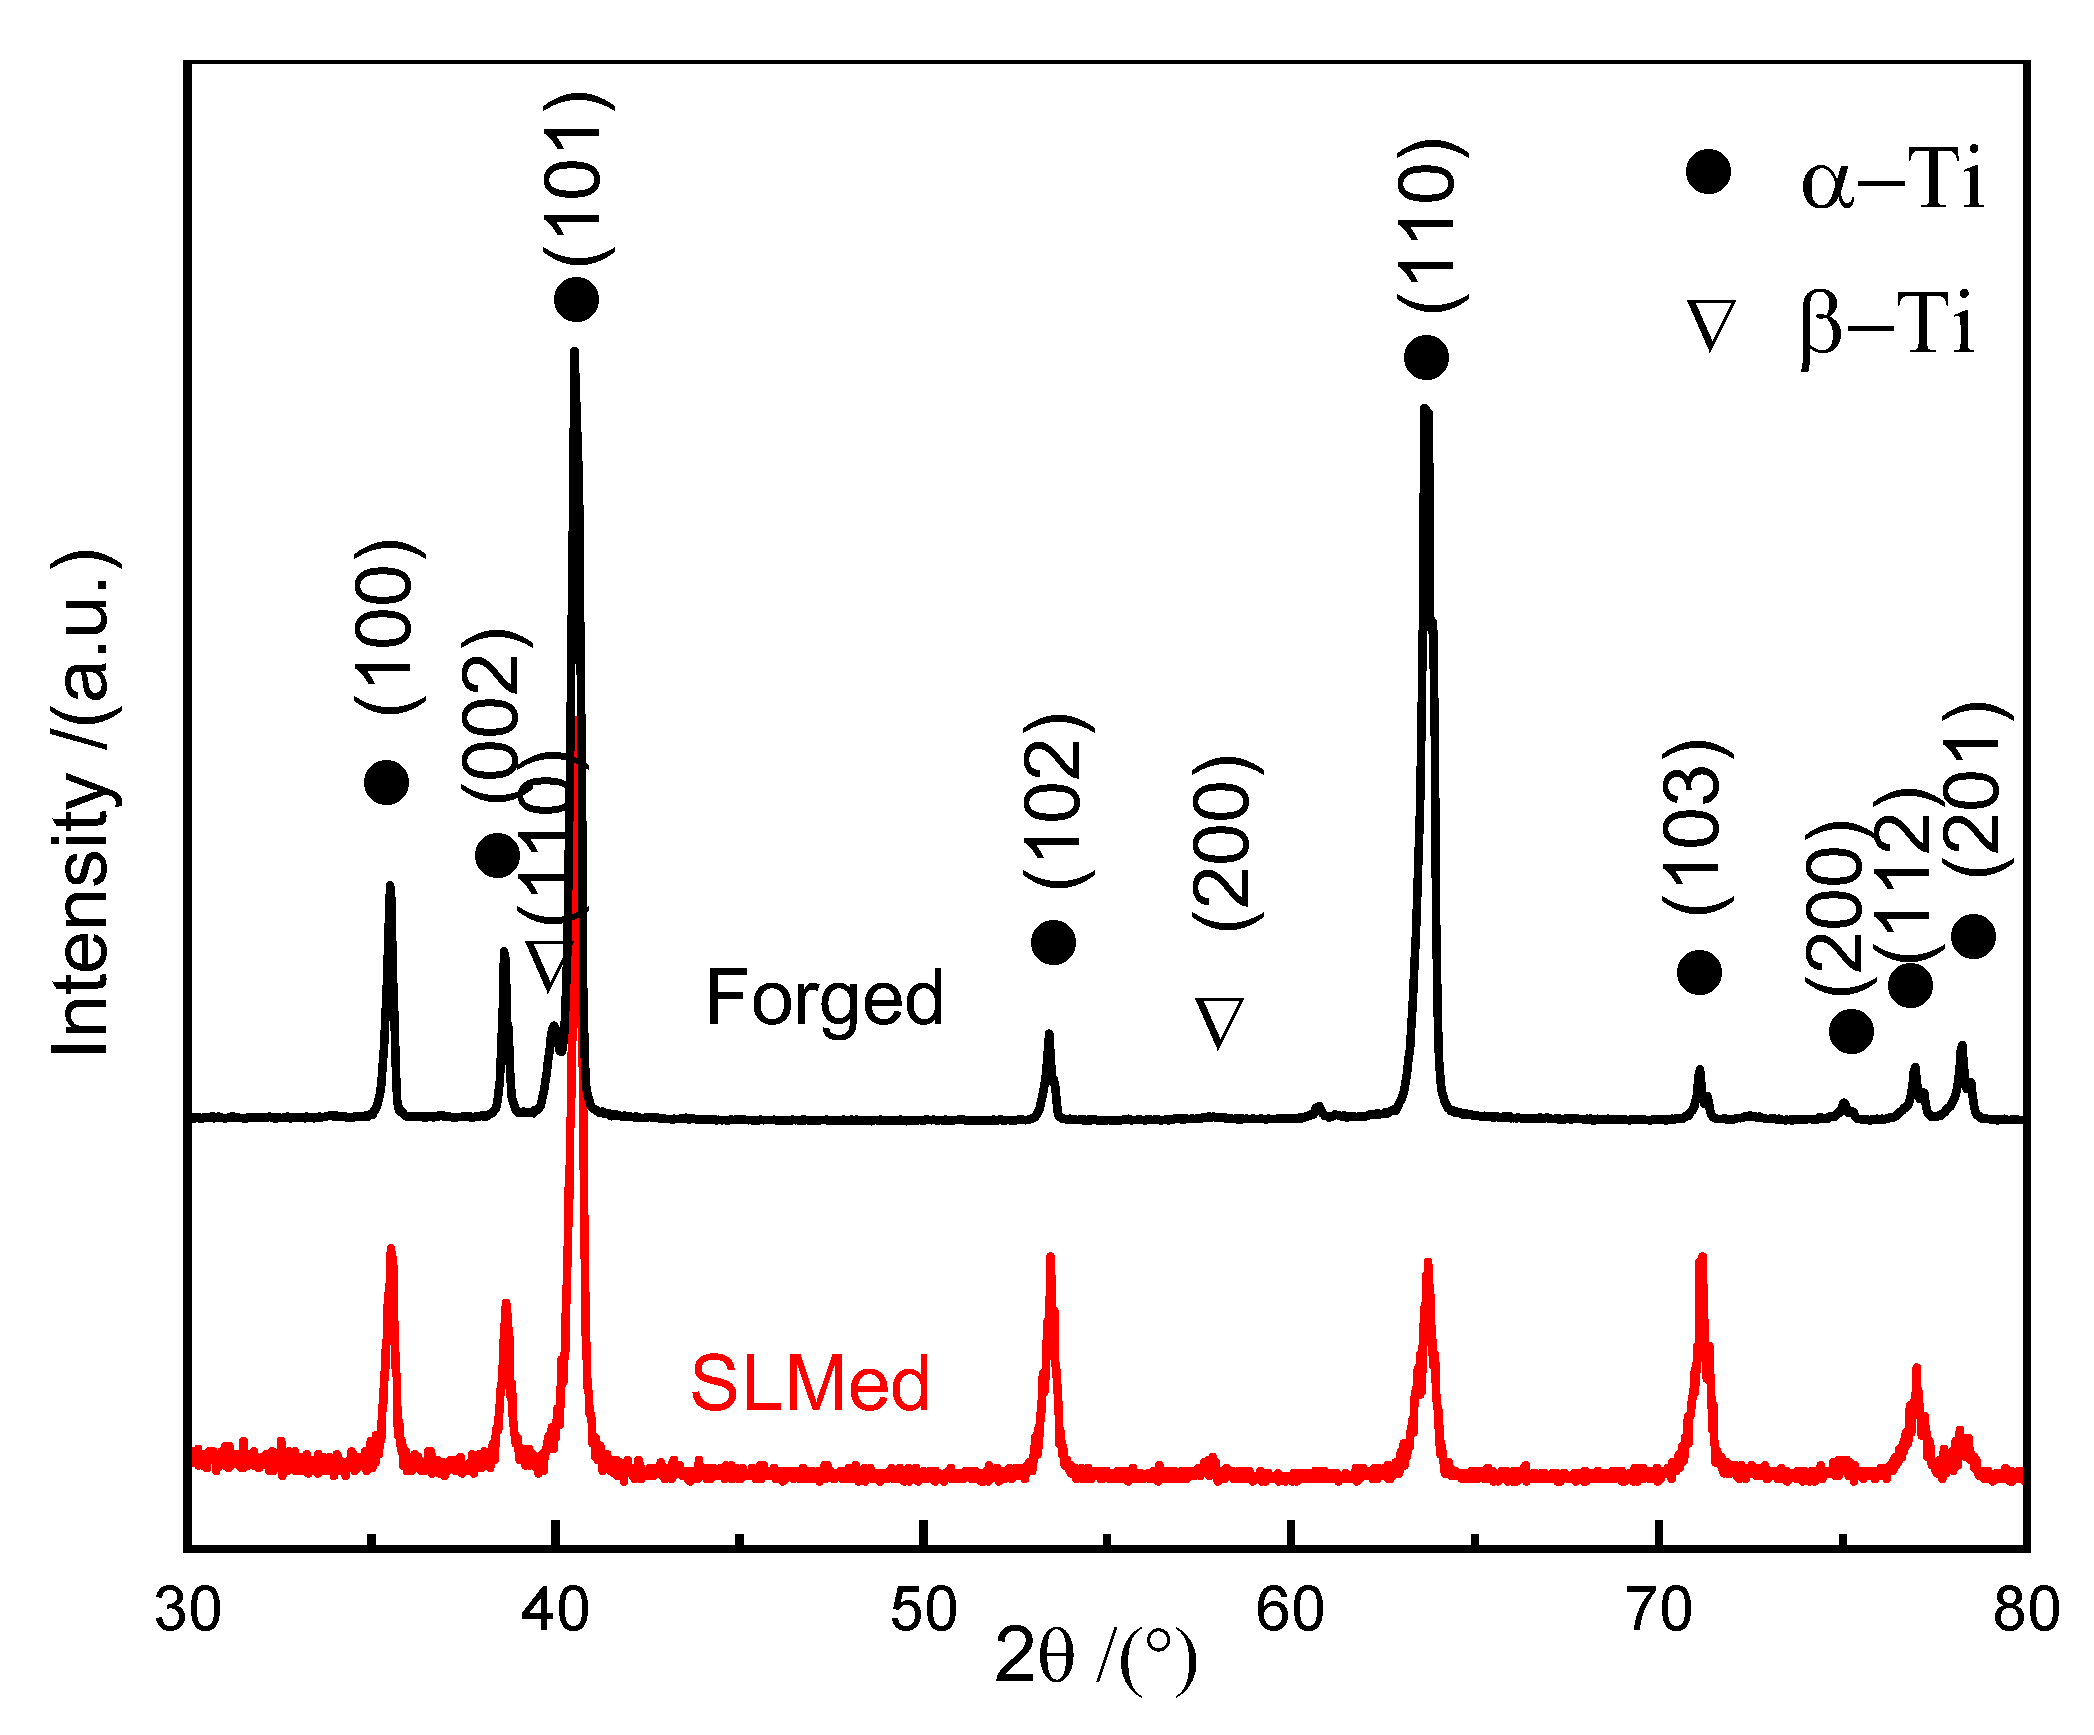
3.1. Microstructure Characterization

The XRD results of these two Ti-6Al-4V alloys are shown in Figure 2. It can be seen that both the two Ti-6Al-4V alloys were composed of α-Ti and β-Ti phases. However, it is noted that the α phase was the dominant phase in these two alloys with the presence of the weak diffraction peaks for the β-Ti phase. Compared to the commercially forged Ti-6Al-4V alloy, the (110) peak intensity of the β-Ti in the SLMed Ti-6Al-4V alloy decreased and the (200) peak of the β-Ti appeared, which is consistent with the results shown in the previous work [16].
The microstructure of the Ti-6Al-4V alloy is displayed in Figure 3. It can be clearly seen from Figure 3a that the microstructure is composed of a bright primary α phase (αp) and dark β transformed structure (βt). In addition, there are also αp phases dispersedly distributed within the βt phase. As seen in Figure 3b, a large amount of a lath secondary α phase (αs) is observed within the βt matrix.
Figure 4 presents the microstructure of the SLMed Ti-6Al-4V alloy, showing different microstructural features from the commercially forged one. A large amount of acicular α′ martensite as well as the presence of defects are evident in Figure 4a, and the formation of the α’ martensite was related to the rapid cooling rate. Figure 4b is the TEM microstructure of the SLMed Ti-6Al-4V alloy. It can be seen that a large amount of αp, αs and β phase is observed. The α′ lamellae contain a large number of dislocations introduced by the martensitic phase transformation. The β phase within the αp is all uniformly oriented, indicating that this orientation has the lowest growth energy and is suitable for transformation. Figure 4c shows the EBSD grains orientation distribution of the SLMed Ti-6Al-4V alloy. The microstructure of the SLMed Ti-6Al-4V alloy consists of long laths-like or acicular-like α′ lamella.

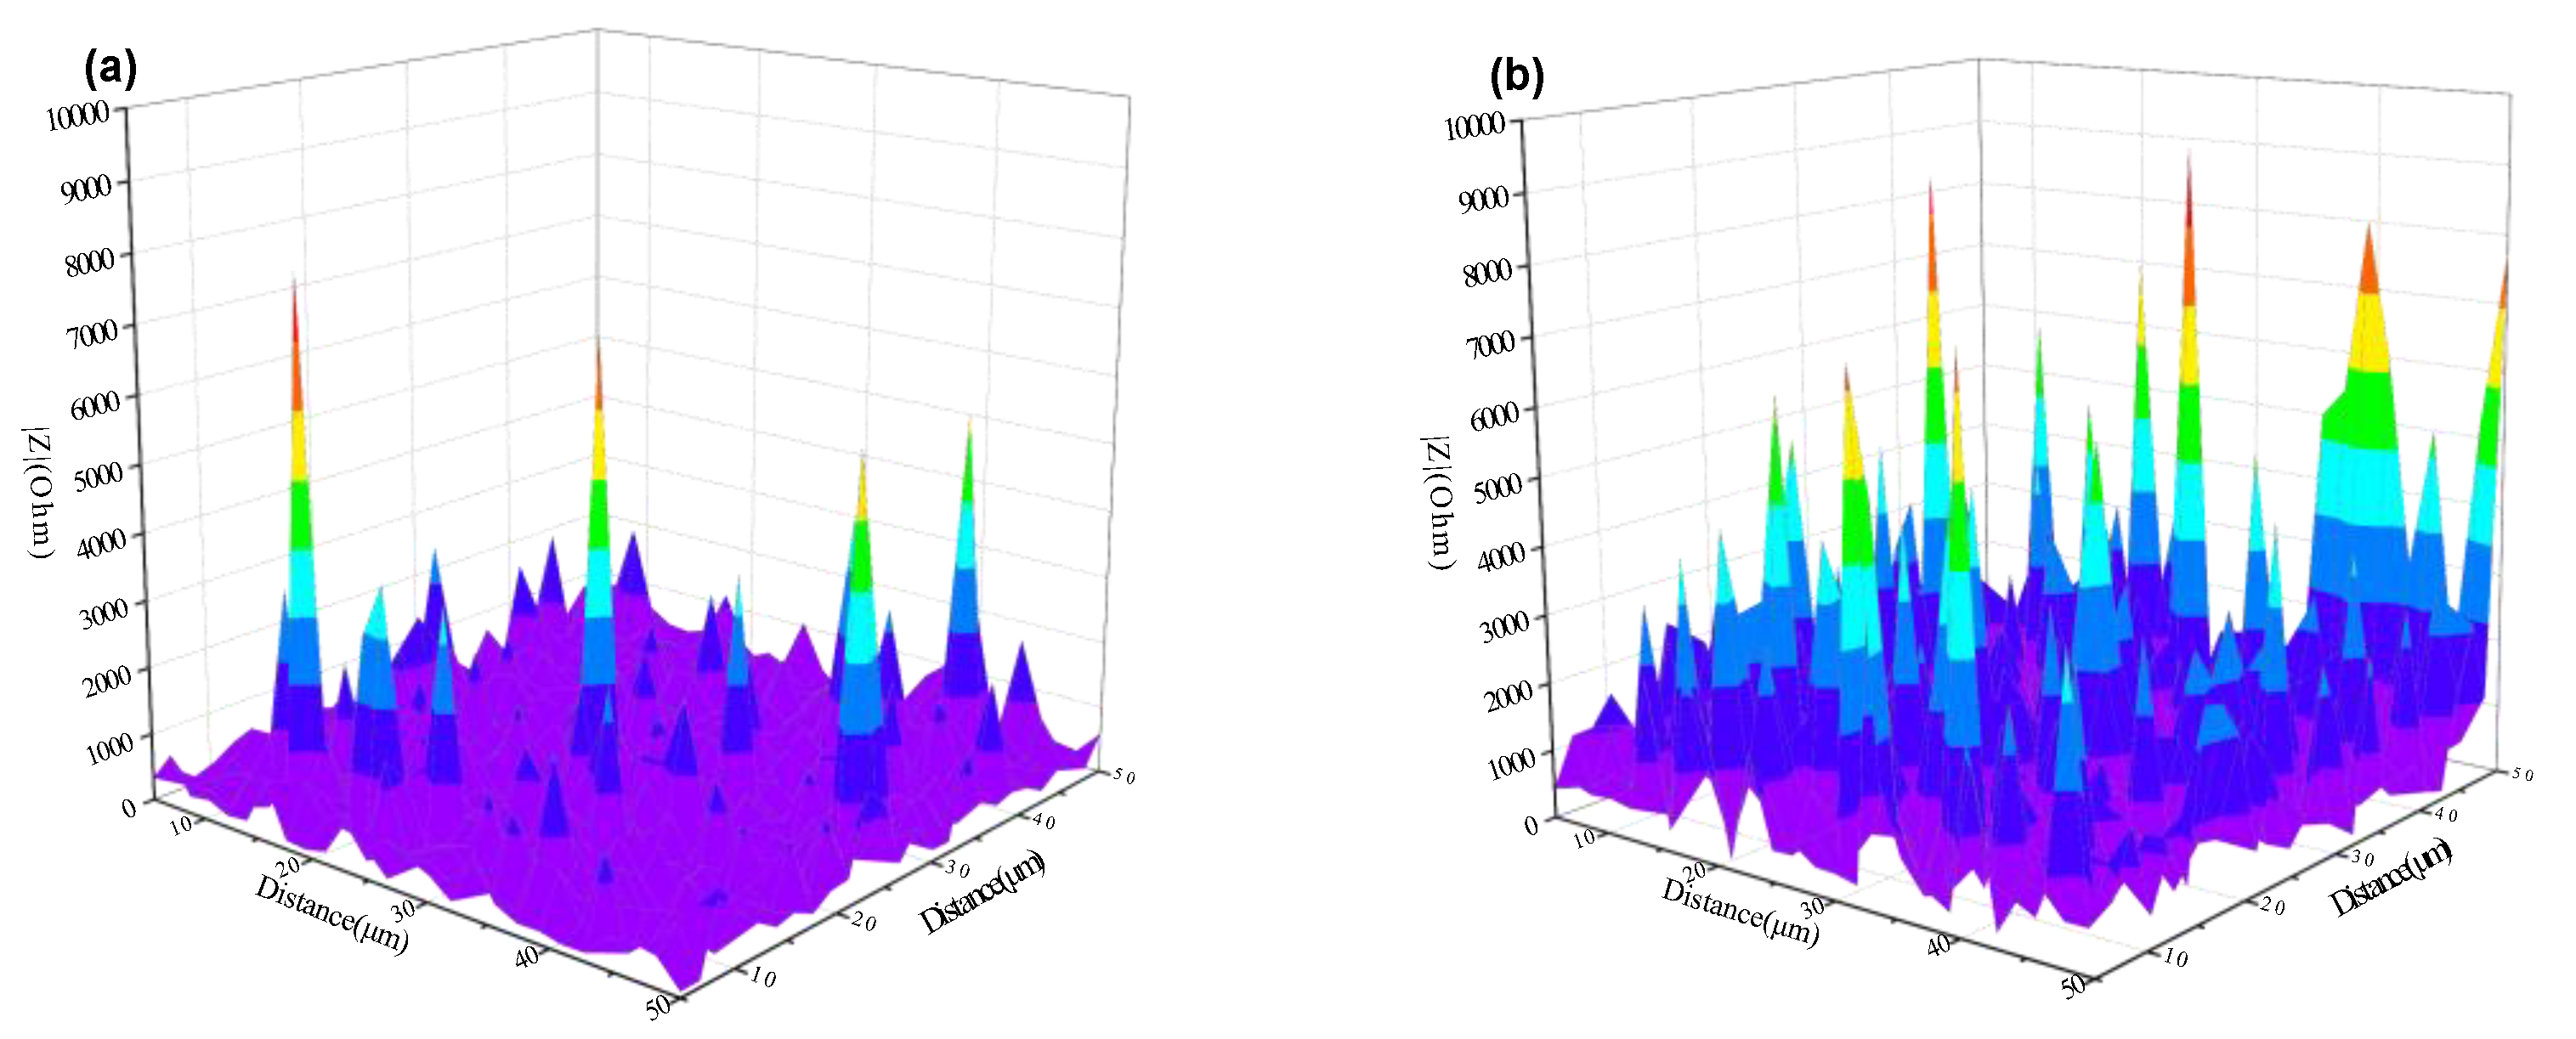
3.2. Electrochemical Corrosion Behavior

Figure 5 presents the EIS of these two tested Ti-6Al-4V alloys in a 0.1 mol/L NaOH solution. It can be seen from Figure 5a that the Nyquist plots of the two tested alloys showed the capacitive characteristics, which are the typical impedance spectra of passive materials such as stainless steel and titanium alloy in corrosive media [9,17]. Since the impedance spectra of the two tested alloys are of a similar shape, the corrosion behavior of the two alloys in the 0.1 mol/L NaOH solution was expected to be similar [18] and the passive films formed on the alloy surfaces were expected to provide good protection [19]. The radius of the capacitive arc for the commercially forged alloy was slightly larger than the SLMed alloy, suggesting a higher corrosion resistance. The Bode plots of the two tested alloys are shown in Figure 5b. It can be seen that the impedance expressed the characteristics of the CPE and was composed of one time constant. At the frequency limit of 10−2 Hz, the total impedance resistance, |Z|, of the commercially forged Ti-6Al-4V alloy was slightly larger than that of the SLMed Ti-6Al-4V alloy, indicating that the passive films formed on the surface of the commercially forged Ti-6Al-4V alloy had a better protective performance. The phase angle in the intermediate frequency region was close to –80°, which indicates that the stable passive films were formed on the surfaces of the two tested alloys in the 0.1 mol/L NaOH solution [20]. The equivalent circuit shown in Figure 6 was used to fit the electrochemical impedance spectra, in which Rs is the solution resistance, Rp is the polarization resistance of the passive films and the constant phase angle element (CPE) represents the capacitance of the passive films. Due to the dispersion effect caused by the non-planar interface and the inhomogeneity of the mass transfer process on the electrode surface, the CPE is usually used instead of the pure capacitance (C) to explain the corrosion process [21,22]. The impedance of the CPE (ZCPE) is expressed as Equation (1):
Z CPE = 1 Q ( j ω ) n
where j is the imaginary part a, ω is the angular frequency, ω = 2πf (f is frequency), n is the CPE index, which represents the degree of deviation from the pure capacitance (C) and Qdl represents the CPE constant. The fitting results of each element in the fitting circuit are shown in Table 2. The value of Rp for the commercially forged alloy was 7.36 × 10⁴ Ω·cm2, and the Rp of the SLMed alloy was 4.47 × 10⁴ Ω·cm2, suggesting that the passive film formed on the surface of the SLMed Ti-6Al-4V alloy has a lower protection ability and inferior corrosion resistance. This might be correlated with the formation of the sandwiched structure of the α and β phase in the SLMed Ti-6Al-4V alloy, which can easily establish the microgalvanic coupling corrosion.
The average thickness of the passive films formed on the two tested alloys can be calculated by Equations (2) and (3) [23,24]:
C eff = Q dl 1 / n R p ( 1 n ) / n
C eff = ε ε 0 A d ox
where Ceff is the equivalent capacitance of the passive film, ε is the dielectric constant, ε0 is the dielectric constant of vacuum (8.8542 × 10⁻¹⁴ F·cm−1), A is the sample area and dox is the thickness of the passive films. Since the passive film formed on the surface of the Ti-6Al-4V alloy is mainly composed of TiO2 and the dielectric constant of TiO2 is 65 [25,26], the calculated thickness of the passive films on the surface of the commercially forged and SLMedTi-6Al-4V alloy was about 15.2 nm and 16.5 nm, respectively, as shown in Table 2.
Figure 7 is the potentiodynamic polarization curves of these two tested Ti-6Al-4V alloys in the 0.1 mol/L NaOH solution. It can be seen that the corrosion behaviors of these two alloys are basically the same, showing a typical active–passivation behavior. In the passive region, the passive current density of the commercially forged Ti-6Al-4V alloy was lower than that of the SLMed Ti-6Al-4V alloy. The results of the corrosion potential (Ecorr), corrosion current density (icorr), passive potential interval (ΔEp) and passive current density (ipp) are listed in Table 3. These results showed that the corrosion potential and passive potential range of these two alloys were basically the same, but the corrosion current density of the SLMed Ti-6Al-4V alloy was 2.4 times that of the commercially forged counterpart, suggesting a lower corrosion resistance, which is consistent with the EIS results and the average film thickness calculation. When the potential was higher than −0.35 VSCE, these two alloys transferred from active dissolution to a passive state. In the passive region, the passive current density of these two alloys gradually decreased with the increase in the applied potential. Dai et al. [15] also found that the passive current density of the SLMed Ti-6Al-4V in a 3.5% NaCl solution was 2.16 times that of the commercial Gr. 5 alloy. The current density of the SLMed Ti-6Al-4V was 2.78 times that of the commercially forged alloy by taking the current density in the middle of the passive zone. When the potential was higher than 0.65 VSCE, the current densities of these two alloys increased again. Chiu et al. [27] also found that the Ti-6Al-4V alloy exhibited this phenomenon in simulated body fluid, and they attributed this to the occurrence of oxygen evolution on the alloy surface [28].
The published works [25,29] reported that the corrosion products of the titanium alloys in the activation zone were mainly Ti3+, and the reactions were as follows:
Ti + H 2 O Ti ( H 2 O ) ad
Ti ( H 2 O ) ad Ti ( OH ) ad + H +
Ti ( OH ) ad ( TiOH ) ad + e
Ti ( OH ) ad ( TiOH ) ad + + e
Ti ( OH ) ad ( TiOH ) 2 + + e
( TiOH ) 2 + + H + Ti 3 + + H 2 O
In the passive region, TiO2 is usually formed on the surface of the titanium alloy [25,30], and its formation process is below [29]:
( TiOH ) ad + Ti ( OH ) ad 2 + + e
H 2 O + ( TiOH ) ad Ti ( OH ) 2 ad 2 + + H + + e
H 2 O + ( TiOH ) ad Ti ( OH ) 2 2 + + H + + e
Ti ( OH ) 2 ad 2 + Ti ( OH ) 2 2 +
Ti ( OH ) 2 ad 2 + TiO 2 + 2 H +
It is clear that the microstructure and grain size of the Ti-6Al-4V alloy could influence the composition, semi-semiconductor properties and electrochemical properties of the passive film [8,31], thus affecting its corrosion resistance.

3.3. Mott–Schottky Curve

Since the passive film formed on the surface of the titanium alloy has semiconductor characteristics, there are different types of defects presented in the passive film, including interstitial ions and vacancies, which can determine the semiconductor type and conductivity [32,33]. The Mott–Schottky theory can be used to analyze the relationship between the space charge layer differential capacitance Csc and the potential E [34]. The relationship between the Csc and semiconductor properties of the passive film can be expressed by Equation (15) [32,35,36]:
1 C sc 2 = 2 ε ε 0 e N ( E E fb k T e )
in which ε is the dielectric constant of the passive film (mainly composed of TiO2) and is 65, ε0 is the vacuum dielectric constant (8.8542 × 10⁻¹⁴ F·cm−1), e is the electron charge (1.60 × 10⁻¹⁹ C), N is the carrier density of the passive film, k is the Boltzmann constant (1.38 × 10⁻²³ J·mol−1·K−1), T is the absolute temperature (K) and E and EFB are the potential of the electrode and the flat band potential, respectively.
Figure 8 shows the Mott–Schottky curves of the passive films formed on the surfaces of the two Ti-6Al-4V alloys after immersion in the 0.1 mol/L NaOH solution for 3 h. The slopes of these two curves shown in Figure 8 were positive in the measured potential range, indicating that the passive film formed was an n-type semiconductor [37,38,39]. Wu et al. [40] showed that the passive film formed on the surface of the Ti-6Al-4V alloy in artificial seawater was an n-type semiconductor, and its carrier (ND) was the oxygen vacancy and/or interstitial atoms [32,35]. In this work, the ND density was related to the formation rate of the oxygen vacancy at the metal/film interface and their annihilation rate at the film/electrolyte interface [40]. The higher the carrier density was, the more defects were present in the passive film and the more unstable the film was. Under this circumstance, it is easier to allow ions to penetrate the passive film, resulting in film thinning or defect formation in the passive film [20]. The value of ND can be calculated by Equation (16):
N D = 2 k ε ε 0 e
where k is the slope of the linear part of the Mott–Schottky curve. Since the composition and structure of the passive films varied with the alloys, the accurate value of ND cannot be obtained by calculation, but ND was inversely proportional to k. In Figure 8, the k value of the SLMed Ti-6Al-4V alloy was smaller, suggesting the higher ND value. This indicates that more defects in the surface passive film formed on the SLMed Ti-6Al-4V alloy, i.e., a lower corrosion resistance, which is consistent with the results of the polarization and EIS measurements.

3.4. XPS Characterization

The passive films formed on the surfaces of these two Ti-6Al-4V alloys in the 0.1 mol/L NaOH solution were studied using XPS. The XPS spectra of the passive films for the two alloys are shown in Figure 9. The passive films on the surfaces of the two alloys were composed of C 1s, Ti 2p, O 1s and V 2p peaks. The detailed XPS spectra of Ti 2p are shown in Figure 10. It can be inferred that the preparation process had no obvious effect on the passive films of these two alloys, and the peak of Ti was mainly composed of TiO2 and Ti2O3. There was only 0.61% metallic Ti (Ti0) on the surface of the commercially forged Ti-6Al-4V alloy, and the contents of TiO2 and Ti2O3 in the passive films of the two alloys were basically the same. This is consistent with the results of Kong et al., showing that there were no differences in the surface chemistry between the passive films formed on the surface of the SLMed and commercially forged 316L SS [11]. The corrosion resistance of the passive film on the titanium alloy is related to the fraction of TiO2 and Ti2O3. The higher the TiO2 content in the passive film is, the denser the passive film is and the superior the corrosion resistance is. It can be seen that the passive film of the commercially forged Ti-6Al-4V alloy had a better corrosion resistance than the SLMed Ti-6Al-4V alloy. In the 0.1 mol/L NaOH solution, although the passive film formed on the surface of the SLMed Ti-6Al-4V alloy was thicker than the commercially forged Ti-6Al-4V alloy, its corrosion resistance was inferior, which may be correlated with the higher defect concentration in the passive film.
Figure 11 is the LEIS of these two Ti-6Al-4V alloys in the 0.1 mol/L NaOH solution. It can be seen from Figure 9a,b that, although the matrix impedance value Z of the commercially forged samples was about 500 Ω·cm2 and that of the SLMed samples was about 1000 Ω·cm2, the peak events of the commercially forged samples was obviously much less than that of the SLMed samples. It indicates that the passive films formed on the surface of the commercially forged Ti-6Al-4V alloy behaved more uniformly, showing less active sites and a lower corrosion rate than the SLMed Ti-6Al-4V alloy. It is clear that the differences in the corrosion potentials of the α and β phase in the Ti-6Al-4V alloy drove the differences in the corrosion activities, and the unique sandwiched structure of the α and β phase in the SLMed Ti-6Al-4V alloy created more active corrosion events.

4. Conclusions

(1)
The electrochemical results showed that the corrosion resistance of the commercially forged Ti-6Al-4V was superior to that of the SLMed Ti-6Al-4V alloy in the 0.1 mol/L NaOH solution. The passive films on both alloys exhibited an n-type semiconductor, but the defect density in the passive film formed on the surface of the commercially forged alloy was lower.
(2)
The passive films formed on the surfaces of these two alloys were composed of TiO2 and Ti2O3, whose contents in the passive films were similar.
(3)
The passive films formed on the surface of the commercially forged Ti-6Al-4V alloy possessed lower defect contents, leading to more uniform electrochemical response and lower corrosion rates.

Author Contributions

Data curation, L.H. and Y.Q. (Yue Qin); Funding acquisition, Y.Q. (Yanxin Qiao); Investigation, J.H.; Methodology, J.H.; Writing—original draft, L.H. and Y.Q. (Yue Qin); Writing—review and editing, Y.Q. (Yanxin Qiao), S.Z. and J.C. All authors have read and agreed to the published version of the manuscript.

Funding

This research received no external funding.

Data Availability Statement

The data used to support the findings of this study are available from the corresponding author upon request.

Acknowledgments

This work was financially supported by the Grants for Scientific Research of BSKY (grant number XJ201918) from Anhui Medical University, 2021 Disciplinary Construction Project in School of Dentistry (No. 2021kqxkFY17), Anhui Medical University.

Conflicts of Interest

The authors declare no conflict of interest.

References

  1. Gorsse, S.; Hutchinson, C.; Goune, M.; Banerjee, R. Additive manufacturing of metals: A brief review of the characteristic microstructures and properties of steels, Ti-6Al-4V and high-entropy alloys. Sci. Technol. Adv. Mater. 2017, 18, 584–610. [Google Scholar] [CrossRef] [PubMed] [Green Version]
  2. Li, H.B.; Han, Y.; Feng, H.; Zhou, G.; Jiang, Z.H.; Cai, M.H.; Li, Y.Z.; Huang, M.X. Enhanced strength-ductility synergy via high dislocation density-induced strain hardening in nitrogen interstitial CrMnFeCoNi high-entropy alloy. J. Mater. Sci. Technol. 2023, 141, 184–192. [Google Scholar] [CrossRef]
  3. Guo, L.L.; Zhang, L.N.; Andersson, J.; Ojo, O. Additive manufacturing of 18% nickel maraging steels: Defect, structure and mechanical properties: A review. J. Mater. Sci. Technol. 2022, 120, 227–252. [Google Scholar] [CrossRef]
  4. Zhang, M.H.; Zhang, B.C.; Wen, Y.J.; Qu, X.H. Research progress on selective laser melting processing for nickel-based superalloy. Int. J. Min. Met. Mater. 2022, 29, 369–388. [Google Scholar] [CrossRef]
  5. Edwards, P.; Ramulu, M. Fatigue performance evaluation of selective laser melted Ti–6Al–4V. Mater. Sci. Eng A. 2014, 598, 327–337. [Google Scholar] [CrossRef]
  6. Zhang, D.Y.; Gao, Z.P.; Dong, D.D.; Liu, Z.; Zhou, Y. The comparision and study of performance for manufacturing dental Co-Cr Alloy’s teeth tank which made by 3D printing and traditional casting craft. Electron. Mould. 2015, 2015, 32–40. [Google Scholar]
  7. Lu, F.Y.; Wan, H.Y.; Ren, X.; Huang, L.M.; Liu, H.L.; Yi, X. Mechanical and microstructural characterization of additive manufactured Inconel 718 alloy by selective laser melting and laser metal deposition. J. Iron. Steel. Res. Int. 2022, 29, 1322–1333. [Google Scholar] [CrossRef]
  8. Bai, Y.; Gai, X.; Li, S.J.; Zhang, L.C.; Liu, Y.J.; Hao, Y.L.; Zhang, X.; Yang, R.; Gao, Y.B. Improved corrosion behaviour of electron beam melted Ti–6Al–4V alloy in phosphate buffered saline. Corros. Sci. 2017, 123, 289–296. [Google Scholar] [CrossRef]
  9. Tang, Y.B.; Shen, X.W.; Liu, Z.H.; Qiao, Y.X.; Yang, L.L.; Lu, D.H.; Zou, J.S.; Xu, J. Corrosion behaviors of selective laser melted inconel 718 alloy in NaOH solution. Acta Metall. Sinca. 2022, 58, 324–333. [Google Scholar]
  10. Wen, S.F.; Ji, X.T.; Zhou, Y.; Han, C.J.; Wei, Q.S.; Shi, Y.S. Corrosion behavior of the S136 mold steel fabricated by selective laser melting. Chin. J. Mech. Eng. 2018, 31, 108. [Google Scholar]
  11. Kong, D.C.; Dong, C.F.; Ni, X.; Zhang, L.; Luo, H.; Li, R.X.; Wang, L.; Man, C.; Li, X.G. The passivity of selective laser melted 316L stainless steel. Appl. Surf. Sci. 2020, 504, 144495. [Google Scholar] [CrossRef]
  12. Zhao, Y.; Xiong, H.; Li, X.P.; Qi, W.L.; Wang, J.D.; Hua, Y.; Zhang, T.; Wang, F.H. Improved corrosion performance of selective laser melted stainless steel 316L in deep sea environment. Corros. Commun. 2021, 2, 55–62. [Google Scholar] [CrossRef]
  13. Qiu, W.B.; Wei, Y.Q.; Chen, A.J.; Deng, H.; Zhou, L.J.; Zuo, H.Y.; Chen, L.Q.; Xia, Z.X.; Wang, H.; Tang, J. Corrosion behavior of additive manufactured Ti-6Al-4V in sulfamic acid cleaning solution. N. J. Chem. 2021, 45, 2967–2973. [Google Scholar] [CrossRef]
  14. Liu, E.J.; Huang, F.F.; Bao, F.H.; Xue, Y.P.; Wang, H.M.; Jin, Y. Microstructure and electrochemical corrosion behaviors of laser-cladded 2205 duplex stainless steel. Steel. Res. Int. 2020, 91, 1900456. [Google Scholar] [CrossRef]
  15. Xu, S.; Gao, F.Y.; Han, J.Y.; Xiong, S.F.; Duan, X.; Zha, F.L.; Yu, B.; Yang, L.L.; Qiao, Y.X.; Zheng, Z.B.; et al. Corrosion behaviors of Fe-22Cr-16Mn-0.55N high-nitrogen austenitic stainless steel in 3.5% NaCl solution. Coatings 2022, 12, 1769. [Google Scholar] [CrossRef]
  16. Dai, N.W.; Zhang, L.C.; Zhang, J.X.; Chen, Q.M.; Wu, M.L. Corrosion behavior of selective laser melted Ti-6Al-4V alloy in NaCl solution. Corros. Sci. 2016, 102, 484–489. [Google Scholar] [CrossRef]
  17. Wang, Z.; Zhou, Z.Q.; Zhang, L.; Hu, J.Y.; Zhang, Z.R.; Lu, M.X. Effect of pH on the electrochemical behaviour and passive film composition of 316L stainless steel. Acta Metall. Sin. 2018, 32, 585–598. [Google Scholar] [CrossRef] [Green Version]
  18. Wang, Y.; Li, M.Y.; Sun, L.L.; Bi, F.Q.; Zhang, X.Y. Microstructure and corrosion property of FeCrNiCo(Cu/Mn) high entropy alloys. Chin. J. Nonferrous Met. 2020, 30, 94–102. [Google Scholar]
  19. Zhao, B.Z.; Zhu, M.; Yuan, Y.F.; Yuan, Y.F.; Guo, S.Y.; Yin, S.M. Comparison of corrosion resistance of CoCrFeMnNi high entropy alloys with pipeline steels in an artificial alkaline soil solution. J. Chin. Soc. Corros. Prot. 2022, 42, 425–434. [Google Scholar]
  20. Jorcin, J.B.; Orazem, M.E.; Pébère, N.; Tribollet, B. CPE analysis by local electrochemical impedance spectroscopy. Electrochim. Acta 2006, 51, 1473–1479. [Google Scholar] [CrossRef]
  21. Wang, Z.B.; Hu, H.X.; Zheng, Y.G.; Ke, W.; Qiao, Y.X. Comparison of the corrosion behavior of pure titanium and its alloys in fluoride-containing sulfuric acid. Corros. Sci. 2016, 103, 50–65. [Google Scholar] [CrossRef]
  22. Hirschorn, B.; Orazem, M.E.; Tribollet, B.; Vivier, V.; Frateur, I.; Musiani, M. Determination of effective capacitance and film thickness from constant-phase-element parameters. Electrochim. Acta 2010, 55, 6218–6227. [Google Scholar] [CrossRef]
  23. Brug, G.J.; Eeden, A.L.G.; Sluyters-Rehbach, M.; Sluyters, J.H. The analysis of electrode impedances complicated by the presence of a constant phase element. J. Electroanal. Chem. 1984, 176, 275–295. [Google Scholar] [CrossRef]
  24. Su, B.X.; Luo, L.S.; Wang, B.B.; Su, Y.Q.; Wang, L.; Ritchie, R.O.; Guo, E.Y.; Li, T.; Yang, H.M.; Huang, H.G.; et al. Annealed microstructure dependent corrosion behavior of Ti-6Al-3Nb-2Zr-1Mo alloy. J. Mater. Sci. Technol. 2021, 62, 234–248. [Google Scholar] [CrossRef]
  25. Xie, L.F.; Zhou, W.L. Salt spray corrosion behavior and pitting resistance of Ti-15V-3Cr-3Al-3Sn alloy evaluated using XPS, SKPFM, and electrochemical technique. J. Solid. State. Electrochem. 2022, 26, 1585–1603. [Google Scholar]
  26. Chiu, T.M.; Mahmoudi, M.; Dai, W.; Elwany, A.; Liang, H.; Castaneda, H. Corrosion assessment of Ti-6Al-4V fabricated using laser powder-bed fusion additive manufacturing. Electrochem. Acta 2018, 279, 143–151. [Google Scholar]
  27. Utomo, W.B.; Donne, S.W. Electrochemical behaviour of titanium in H2SO4–MnSO4 electrolytes. Electrochem. Acta 2006, 51, 3338–3345. [Google Scholar]
  28. Zheng, Z.B.; Long, J.; Guo, Y.; Li, H.; Zheng, K.H.; Qiao, Y.X. Corrosion and impact–abrasion–corrosion behaviors of quenching–tempering martensitic Fe–Cr alloy steels. J. Iron Steel Res. Int. 2022, 29, 1853–1863. [Google Scholar]
  29. Cui, Z.Y.; Wang, L.W.; Zhong, M.Y.; Ge, F.; Gao, H.; Man, C.; Liu, C.; Wang, X. Electrochemical behavior and surface characteristics of pure titanium during corrosion in simulated desulfurized flue gas condensates. J. Electrochem. Soc. 2018, 165, C542–C561. [Google Scholar]
  30. Gai, X.; Bai, Y.; Li, J.; Li, S.; Hou, W.; Hao, Y.L.; Zhang, X.; Yang, R.; Misra, R.D.K. Electrochemical behaviour of passive film formed on the surface of Ti-6Al-4V alloys fabricated by electron beam melting. Corros. Sci. 2018, 145, 80–89. [Google Scholar] [CrossRef]
  31. Kong, D.C.; Dong, C.F.; Zhao, M.F.; Ni, X.Q.; Man, C.; Li, X.G. Effect of chloride concentration on passive film properties on copper. Corros. Eng. Sci. Technol. 2018, 53, 122–130. [Google Scholar] [CrossRef]
  32. Macdonald, D.D. The history of the Point Defect Model for the passive state: A brief review of film growth aspects. Electrochim. Acta 2010, 56, 1761–1772. [Google Scholar] [CrossRef]
  33. Wang, T.H.; Wang, J.; Bai, J.G.; Wang, S.J.; Che, C.; Han, P.D. Effect of boron on dissolution and repairing behavior of passive film on S31254 super-austenitic stainless steel immersed in H2SO4 solution. J. Iron Steel Res. Int. 2022, 29, 1012–1025. [Google Scholar] [CrossRef]
  34. Cui, Z.Y.; Chen, S.S.; Wang, L.W.; Man, C.; Liu, Z.Y.; Wu, J.S.; Wang, X.; Chen, S.G.; Li, X.G. Passivation behavior and surface chemistry of 2507 super duplex stainless steel in acidified artificial seawater containing thiosulfate. J. Electrochem. Soc. 2018, 164, C856–C868. [Google Scholar] [CrossRef]
  35. Feng, H.; Li, H.B.; Dai, J.; Han, Y.; Qu, J.D.; Jiang, Z.H.; Zhao, Y.; Zhang, T. Why CoCrFeMnNi HEA could not passivate in chloride solution?—A novel strategy to significantly improve corrosion resistance of CoCrFeMnNi HEA by N-alloying. Corros. Sci. 2022, 204, 110396. [Google Scholar] [CrossRef]
  36. Qiao, Y.X.; Wang, X.Y.; Yang, L.L.; Wang, X.J.; Chen, J.; Wang, Z.B.; Zhou, H.L.; Zou, J.S.; Wang, F.H. Effect of aging treatment on microstructure and corrosion behavior of a Fe–18Cr–15Mn–0.66N stainless steel. J. Mater. Sci. Technol. 2022, 107, 197–206. [Google Scholar] [CrossRef]
  37. Ha, H.Y.; Jang, H.J.; Kwon, H.S.; Kim, S.J. Effects of nitrogen on the passivity of Fe–20Cr alloy. Corros. Sci. 2009, 51, 48–53. [Google Scholar] [CrossRef]
  38. Li, N.; Li, Y.; Wang, S.G.; Wang, F.H. Electrochemical corrosion behavior of nanocrystallized bulk 304 stainless steel. Electrochim. Acta 2006, 52, 760–765. [Google Scholar] [CrossRef]
  39. Yang, J.; Wang, Z.B.; Qiao, Y.X.; Zheng, Y.G. Synergistic effects of deposits and sulfate reducing bacteria on the corrosion of carbon steel. Corros. Sci. 2022, 199, 110210. [Google Scholar] [CrossRef]
  40. Wu, W.; Liu, J.; Liu, Z.Y.; Cui, L.Y.; Du, C.W.; Li, X.G. Surface characterization of the commercially pure titanium after hydrogen charging and its electrochemical characteristics in artificial seawater. J. Electroanal. Chem. 2018, 822, 23–32. [Google Scholar] [CrossRef]
Figure 1. Schematic diagram of electrochemical test.
Coatings 13 00150 g001
Figure 2. X-ray diffraction (XRD) patterns of the tested Ti-6Al-4V alloys.
Coatings 13 00150 g002
Figure 3. (a) Optical microscopic and (b) SEM microstructure of forged Ti-6Al-4V alloy.
Coatings 13 00150 g003
Figure 4. (a) Optical microscopy, (b) TEM microstructure and (c) EBSD of SLMed Ti-6Al-4V alloy.
Coatings 13 00150 g004
Figure 5. Nyquist (a) and Bode (b) plots of forged and SLMed Ti-6Al-4V alloys in 0.1 mol/L NaOH solution.
Coatings 13 00150 g005
Figure 6. Electrical equal circuit for fitting EIS.
Coatings 13 00150 g006
Figure 7. Polarization curves of the two tested Ti-6Al-4V alloys in 0.1 mol/L NaOH solution.
Coatings 13 00150 g007
Figure 8. Mott–Schottky curves of the two tested Ti-6Al-4V alloys in 0.1 mol/L NaOH solution.
Coatings 13 00150 g008
Figure 9. XPS analysis of passivation films on two Ti-6Al-4V alloys.
Coatings 13 00150 g009
Figure 10. Detailed Ti spectra in passive films on the surface of (a) forged (b) SLMed Ti-6Al-4V alloys.
Coatings 13 00150 g010
Figure 11. LEIS of (a) forged and (b) SLMed Ti-6Al-4V alloys in 0.1 mol/L NaOH.
Coatings 13 00150 g011
Table 1. Chemical composition of the two tested Ti-6Al-4V alloys (wt.%).
AlloyAlVFeOTi
Forged5.984.030.330.08Bal.
SLMed6.023.97~0.06Bal.
Table 2. The fitted EIS data of the forged and SLMed Ti-6Al-4V alloys.
AlloyRs (Ω·cm2)Rp (Ω·cm2)Qdl−1·Sn·cm−2)nCeff/(F·cm−2)dox/(nm)
Forged20.987.36 × 1043.28 × 10−50.933.50 × 10−515.2
SLMed23.154.47 × 1044.65 × 10−50.924.96 × 10−516.5
Qdl-constant phase element (CPE) of passive film, n-exponent of Qdl.
Table 3. Tafel fitting results derived from the polarization curves.
Ecorr (VSCE)icorr (A/cm2)ΔEp (VSCE)ipp (A/cm2)
Forged−0.68 ± 0.01(9.33 ± 0.12) × 10−71.04 ± 0.02(1.63 ± 0.01) × 10−6
SLMed−0.67 ± 0.01(2.24 ± 0.08) × 10−60.99 ± 0.01(4.54 ± 0.02) × 10−6
Disclaimer/Publisher’s Note: The statements, opinions and data contained in all publications are solely those of the individual author(s) and contributor(s) and not of MDPI and/or the editor(s). MDPI and/or the editor(s) disclaim responsibility for any injury to people or property resulting from any ideas, methods, instructions or products referred to in the content.

