
Characterization and Boron Diffusion Kinetics on the Surface-Hardened Layers of Royalloy Steel

Abstract
:1. Introduction
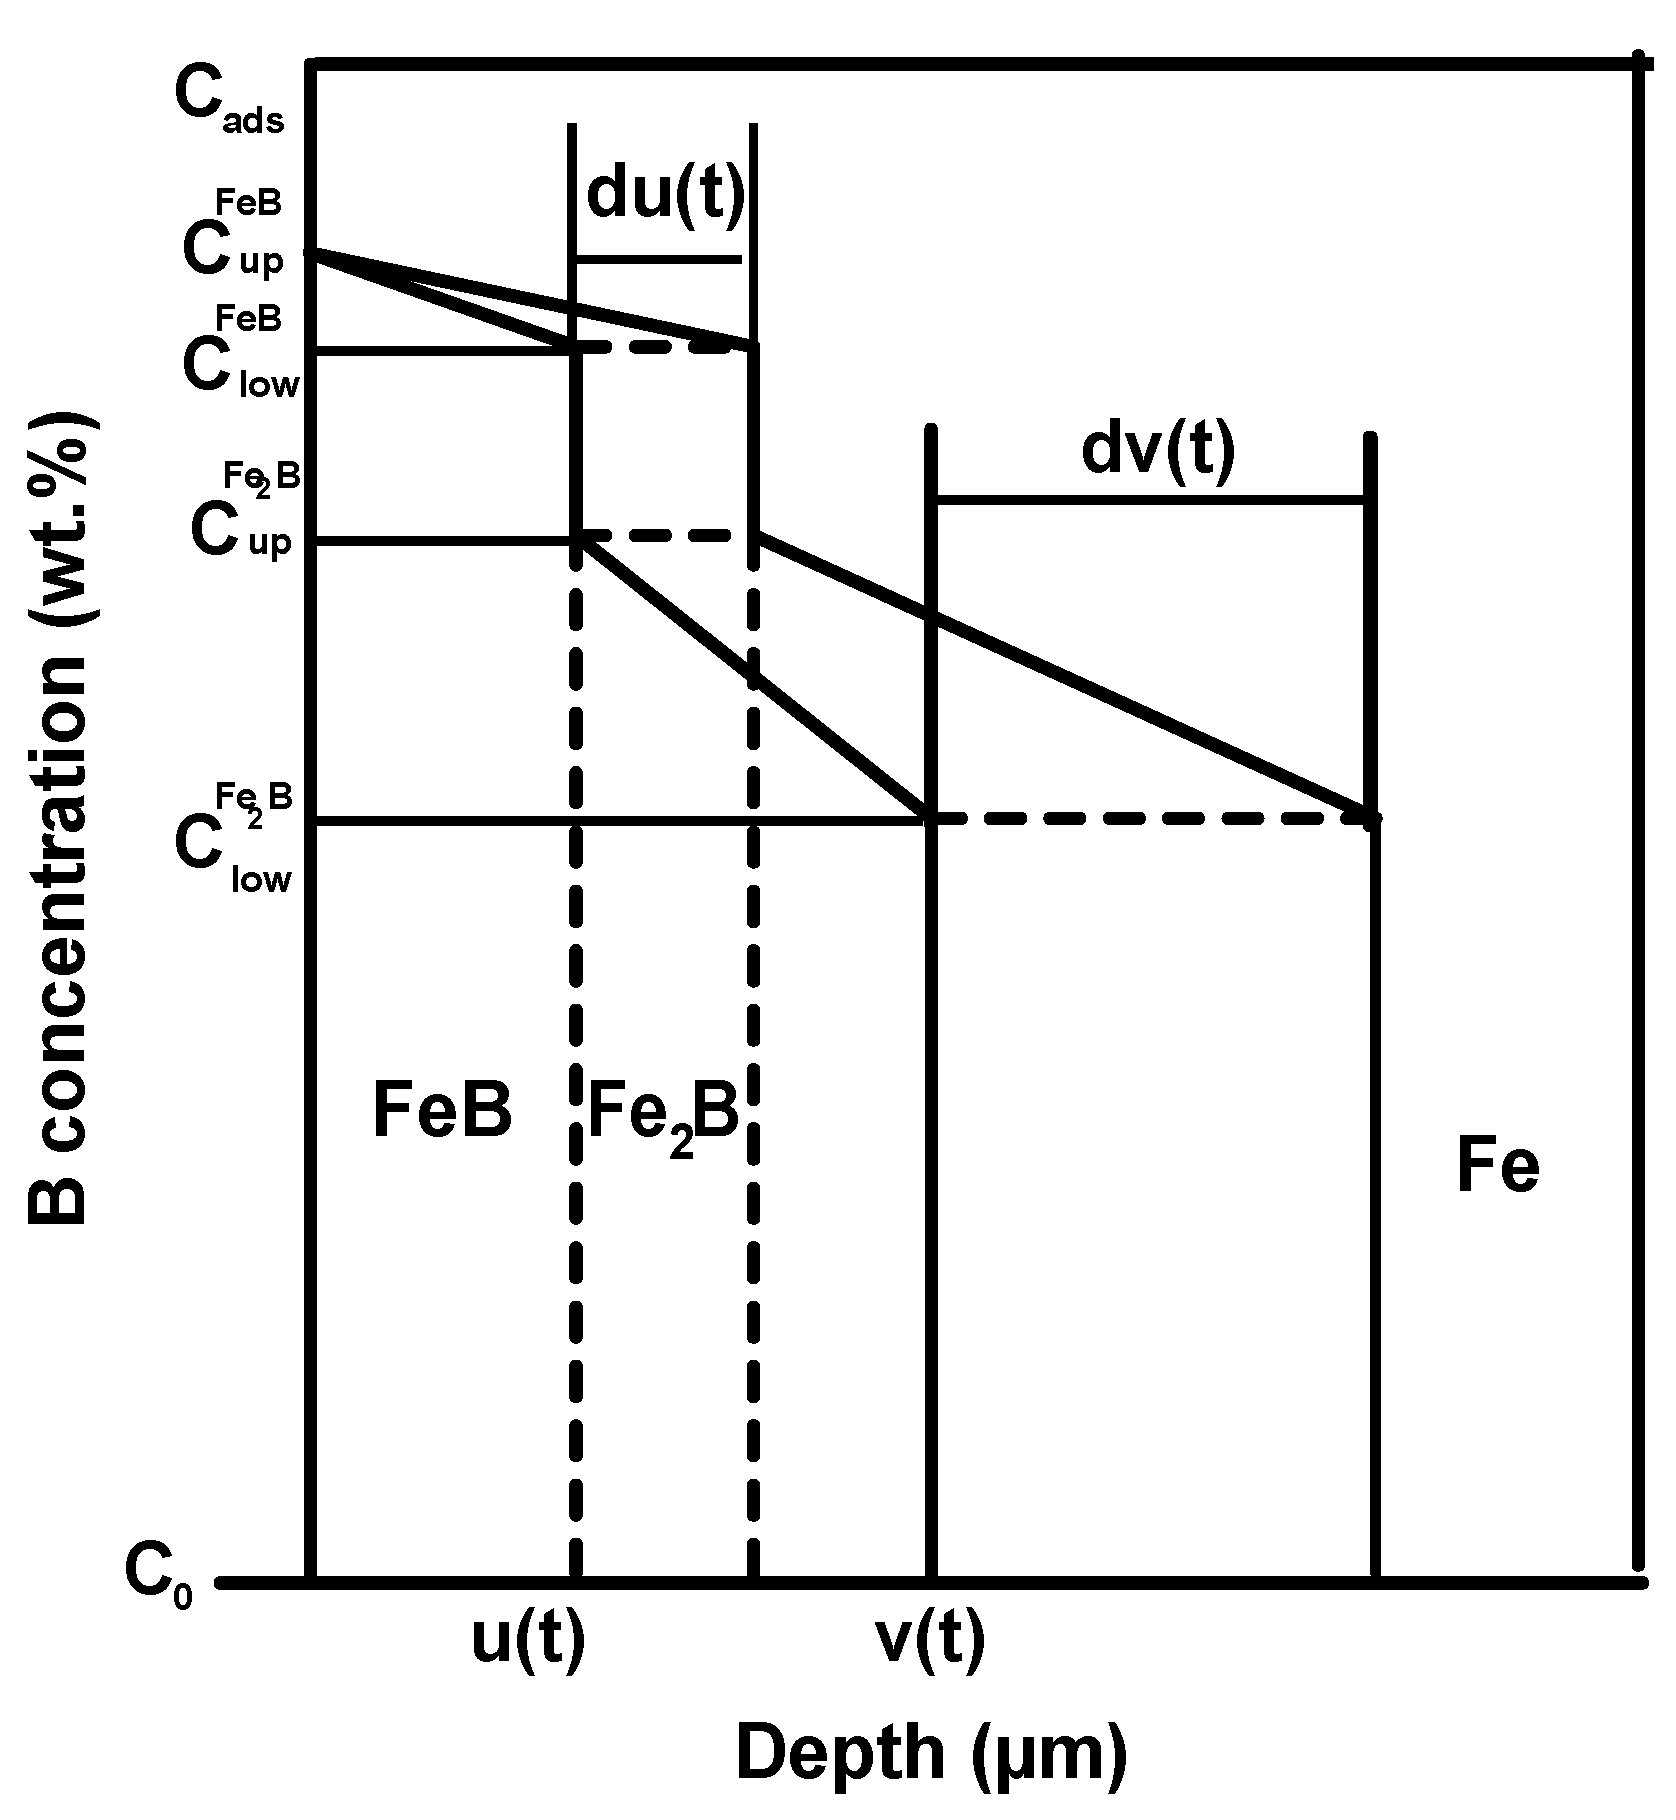
2. The Integral Diffusion Model
2.1. Mathematical Foundation of the Applied Kinetic Modelling
2.2. Derivation of Expressions of Boron Diffusion Coefficents in FeB and Fe2B
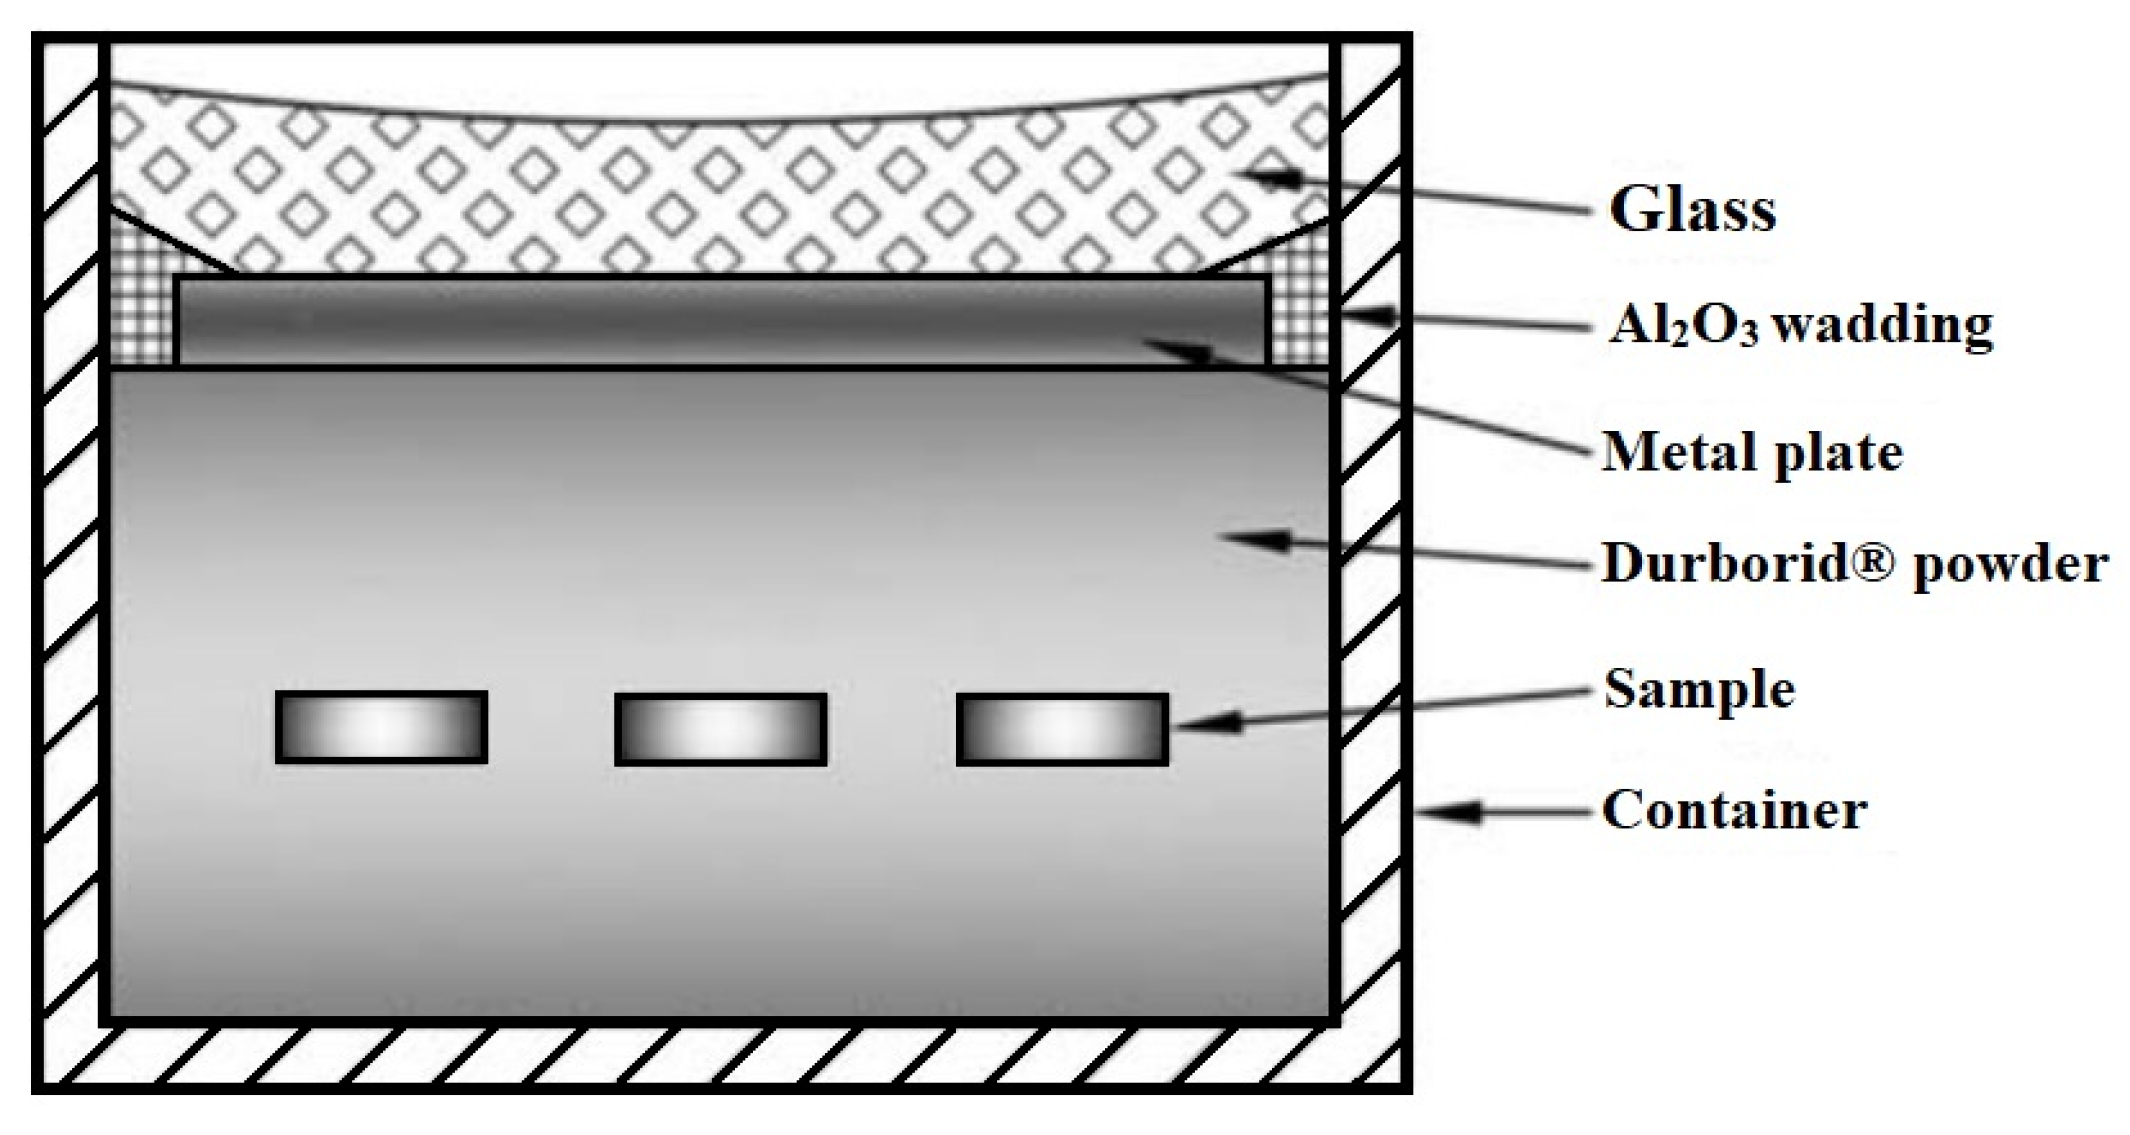
3. Material and Experimental Techniques
4. Results and Discussions
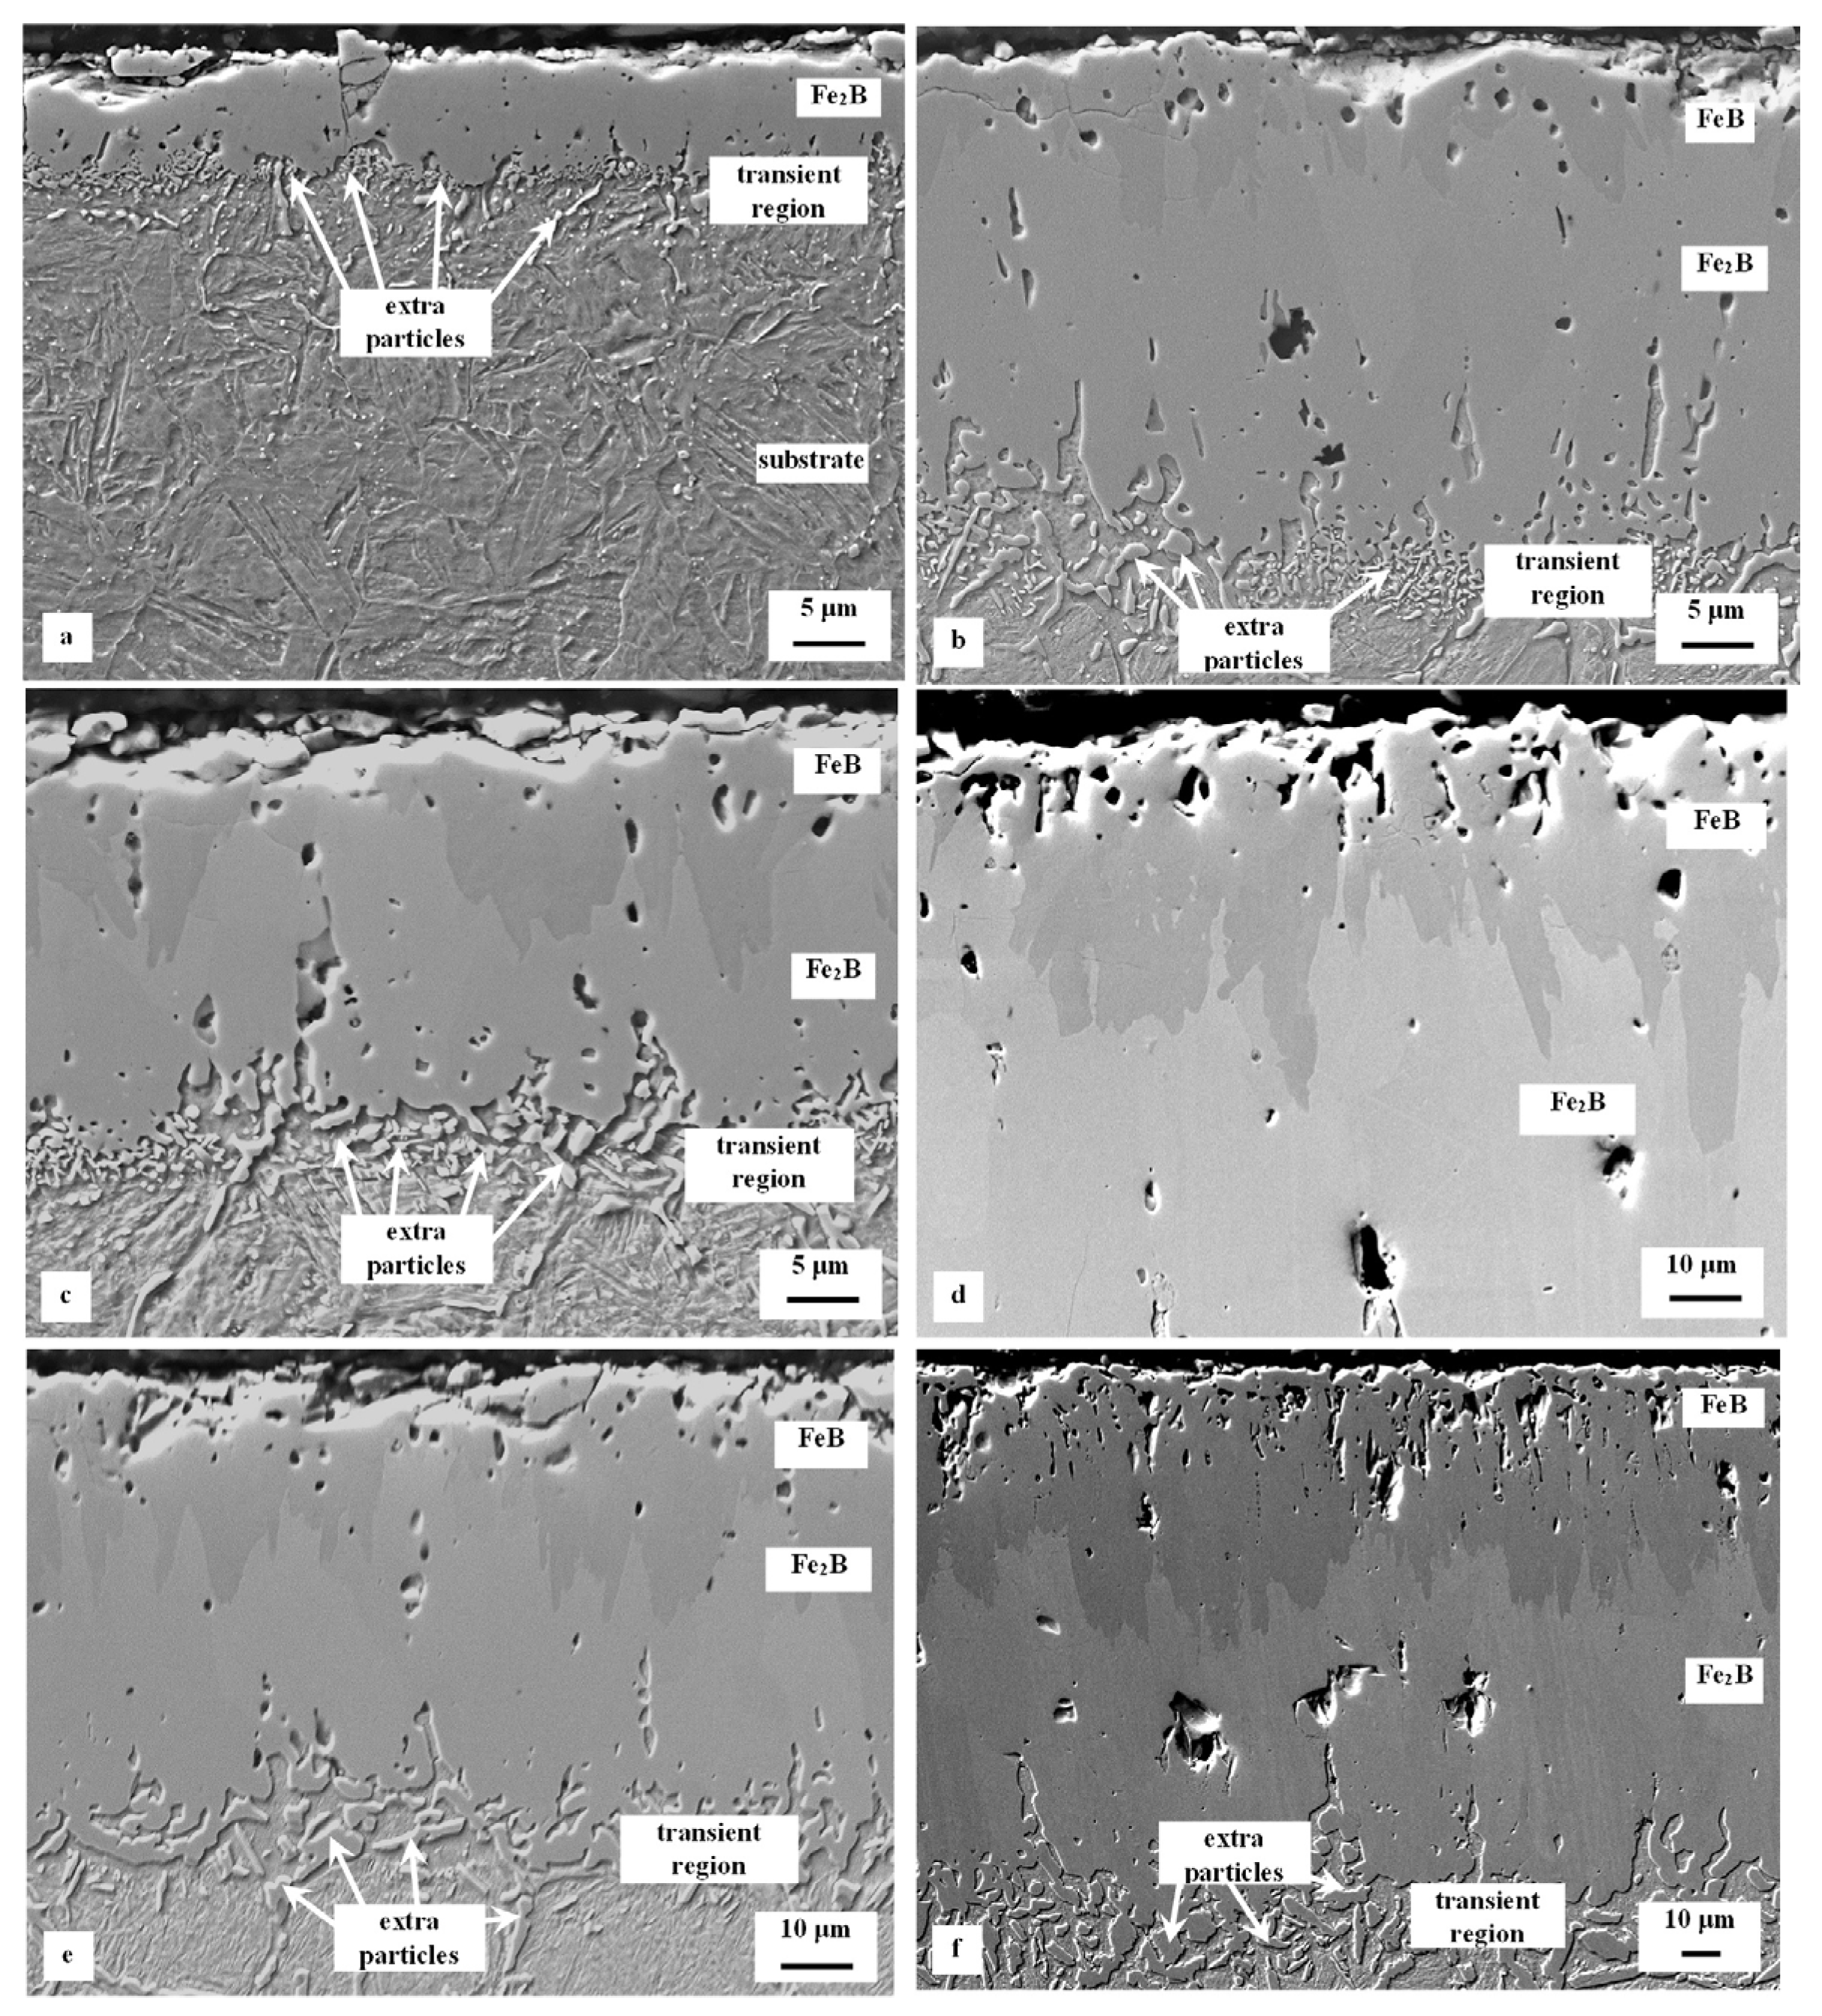
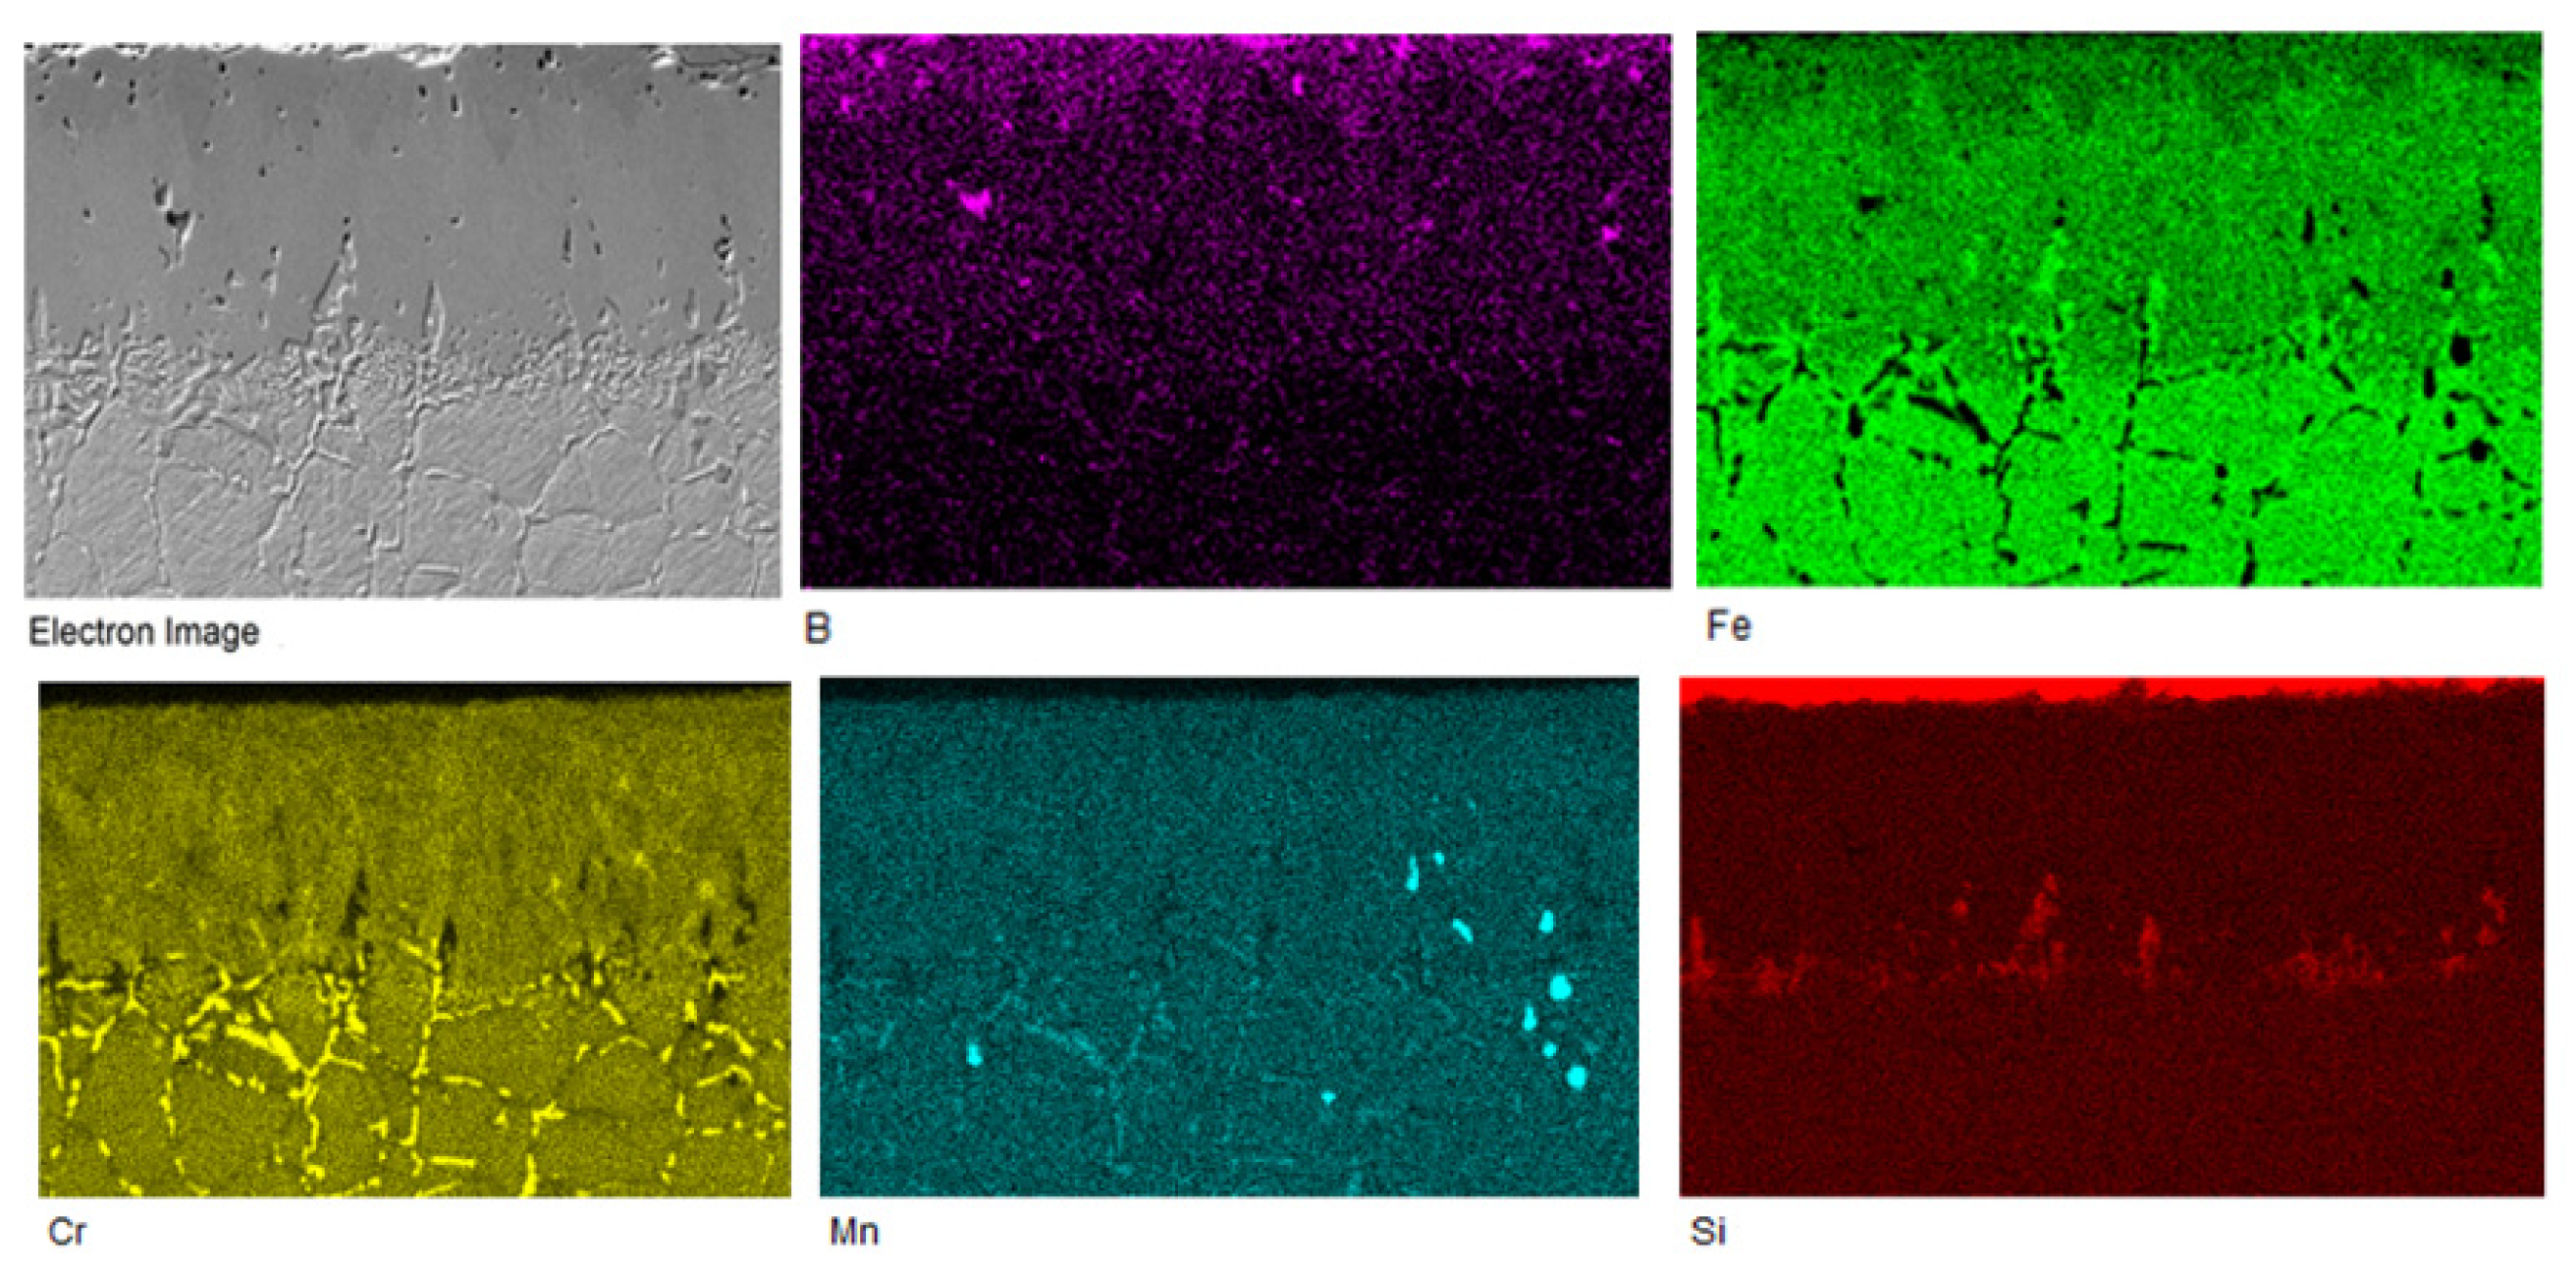
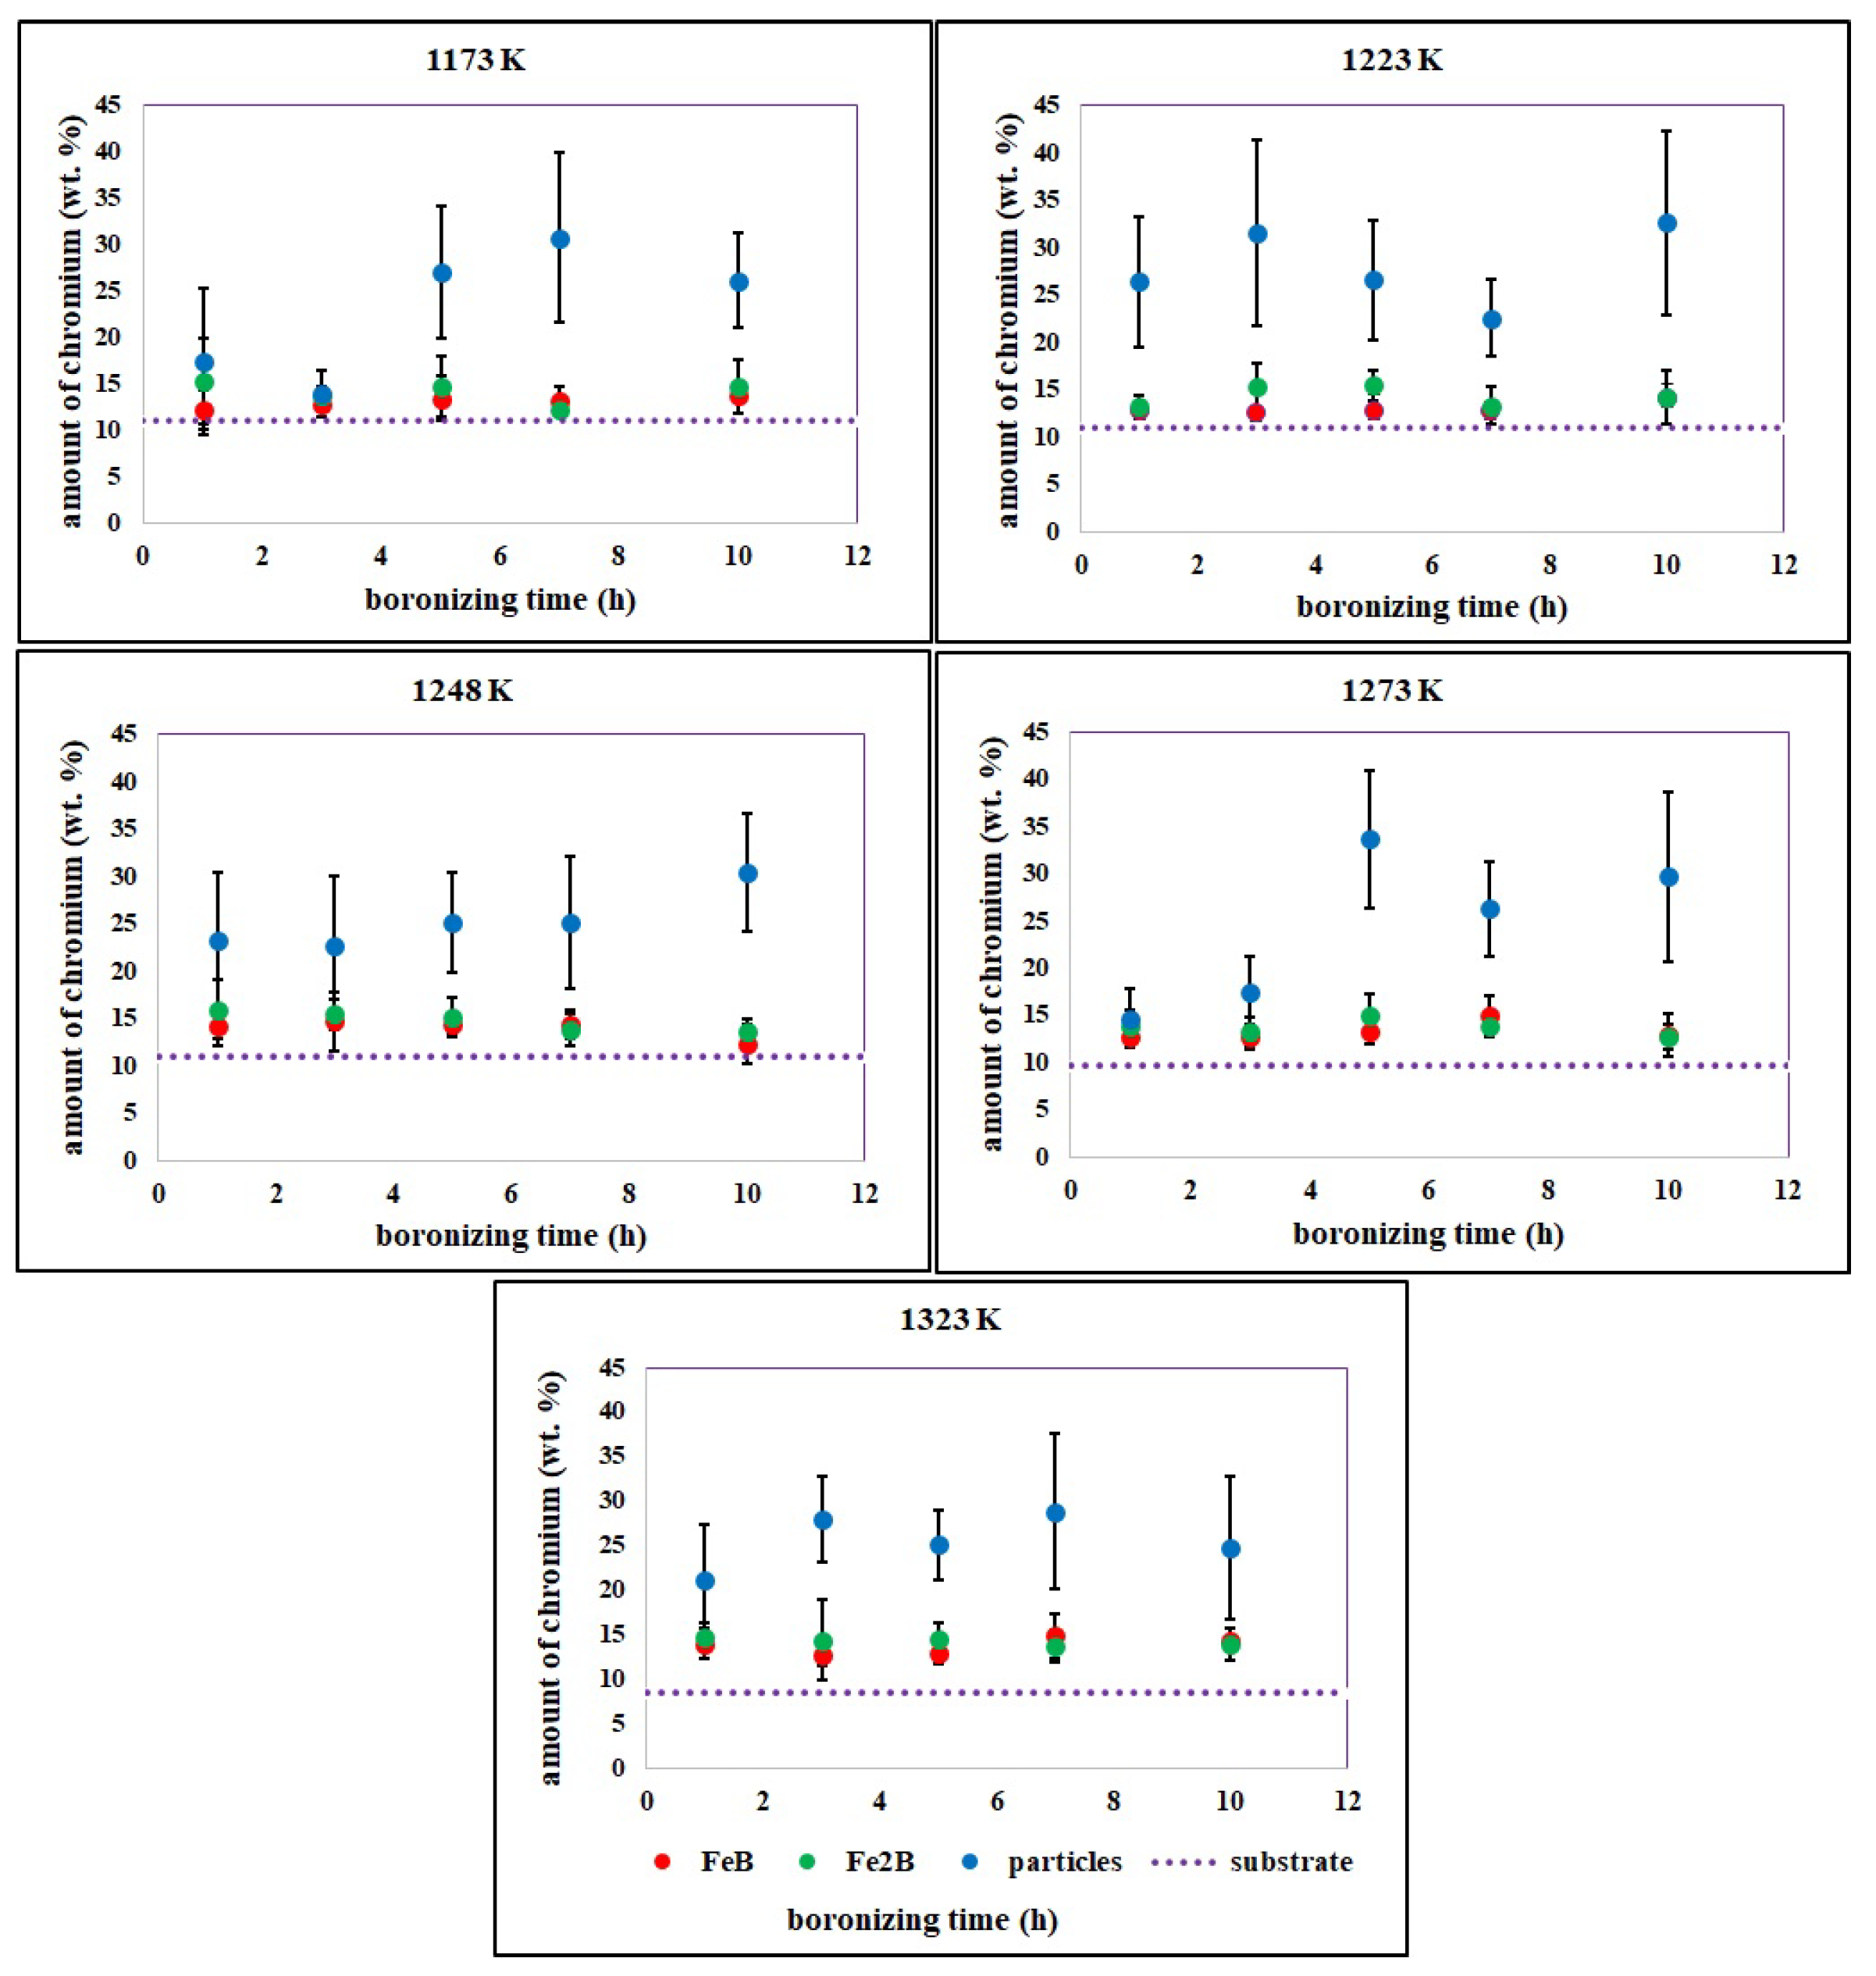
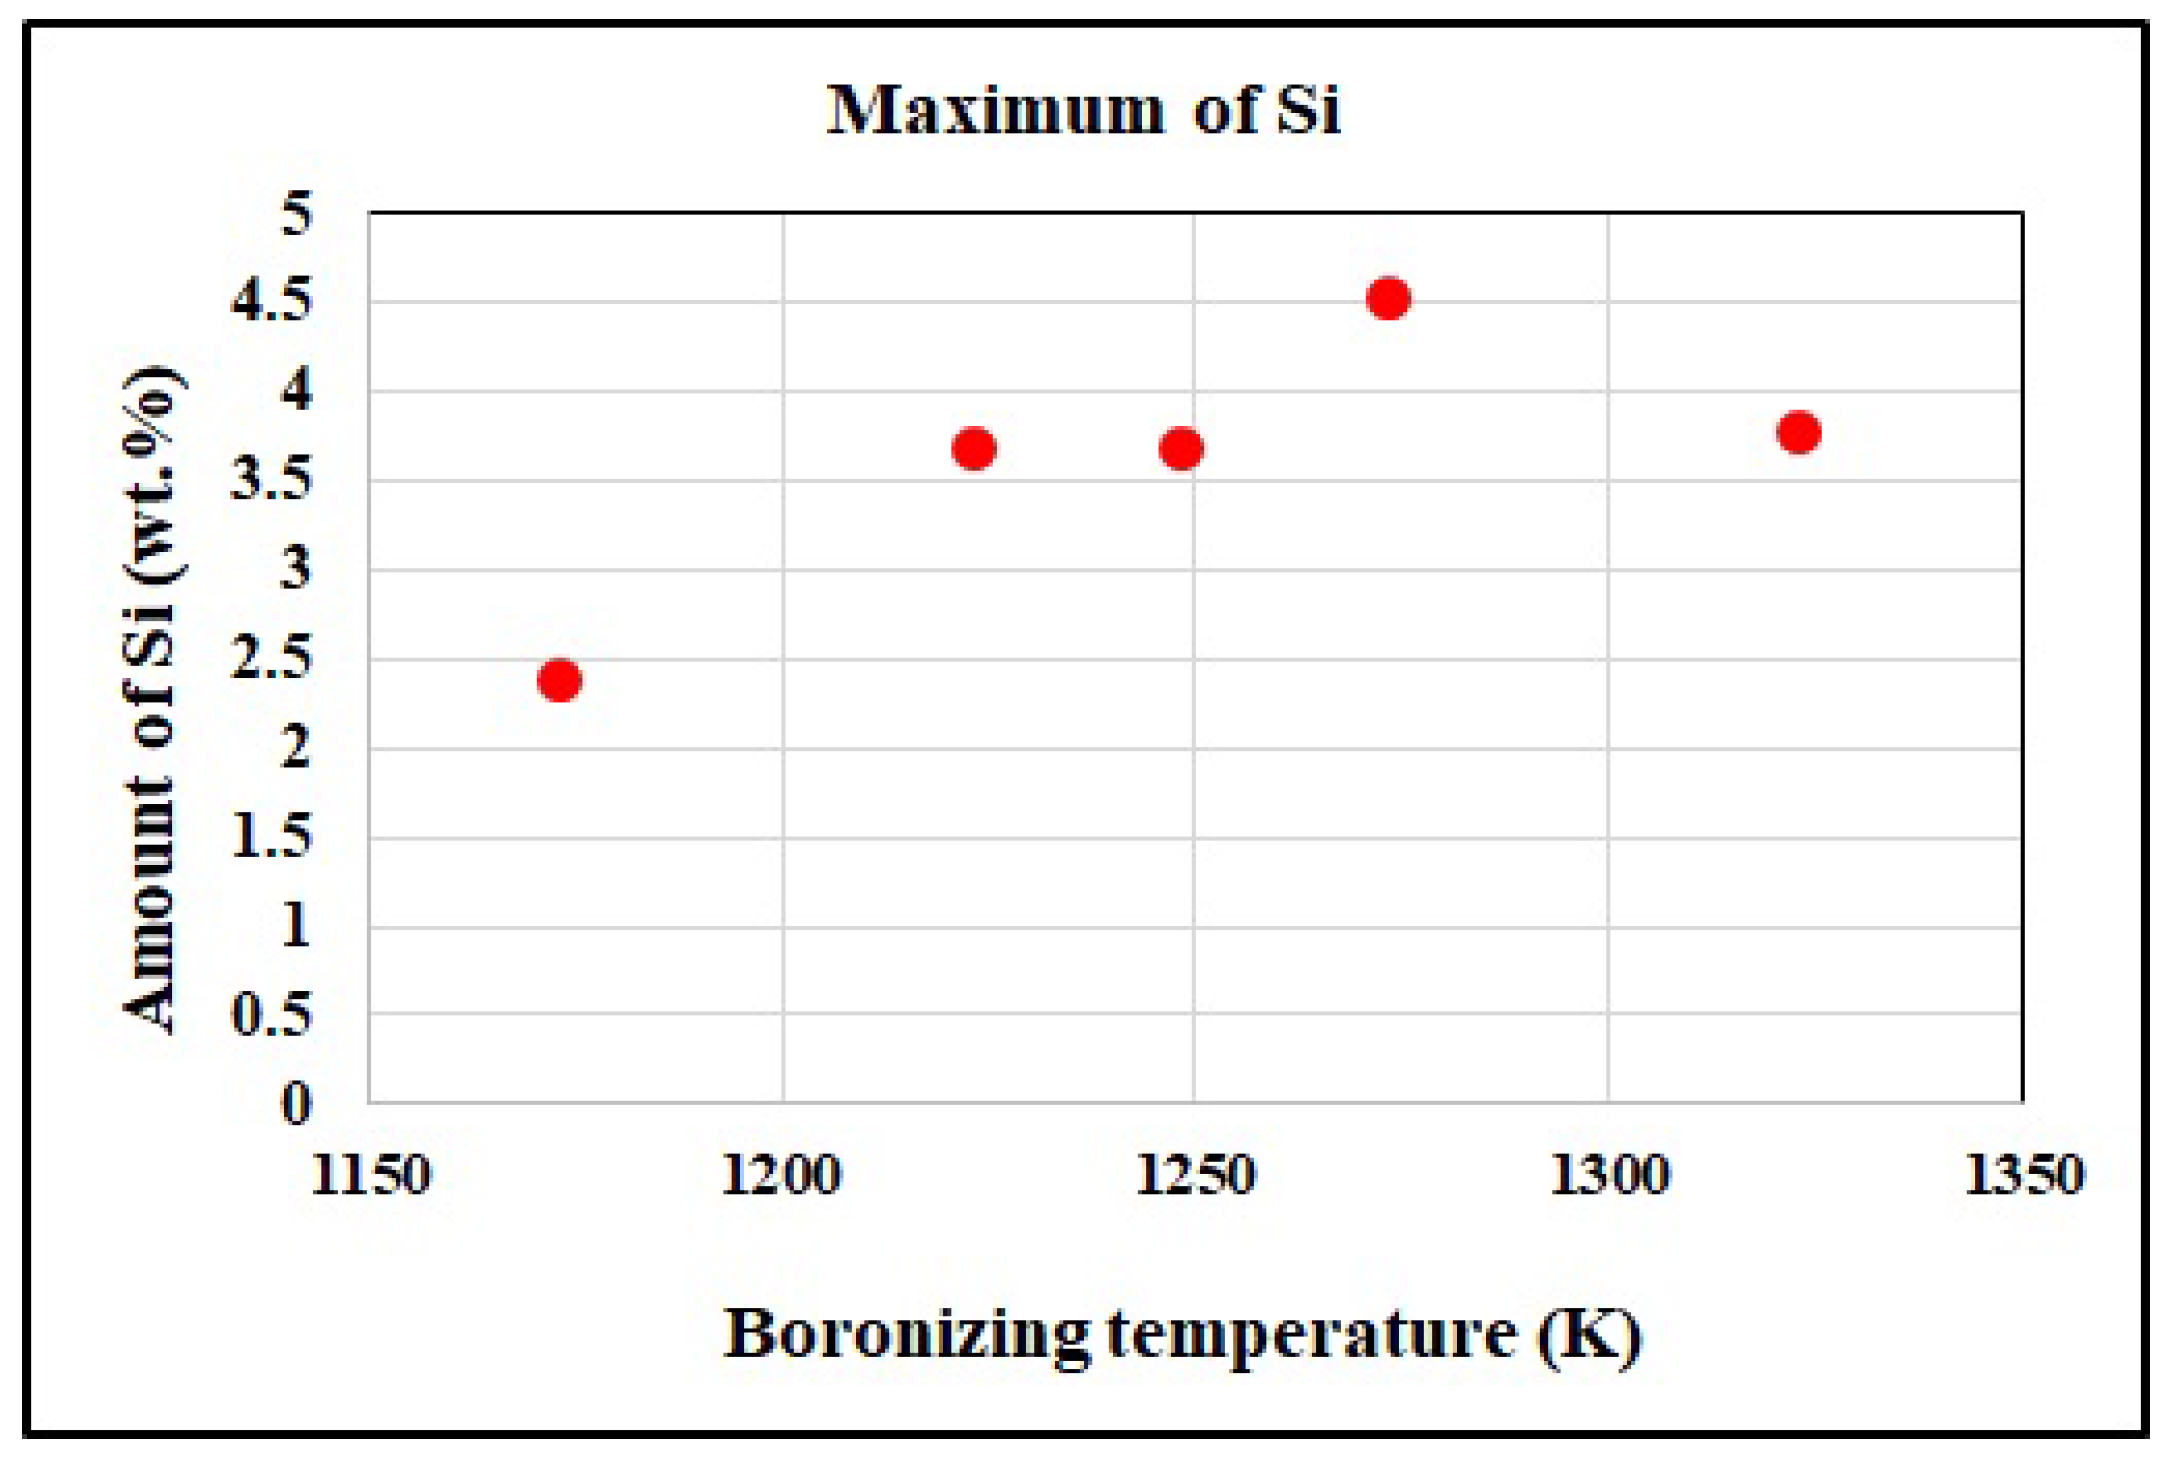
4.1. Microstructural Exmainations
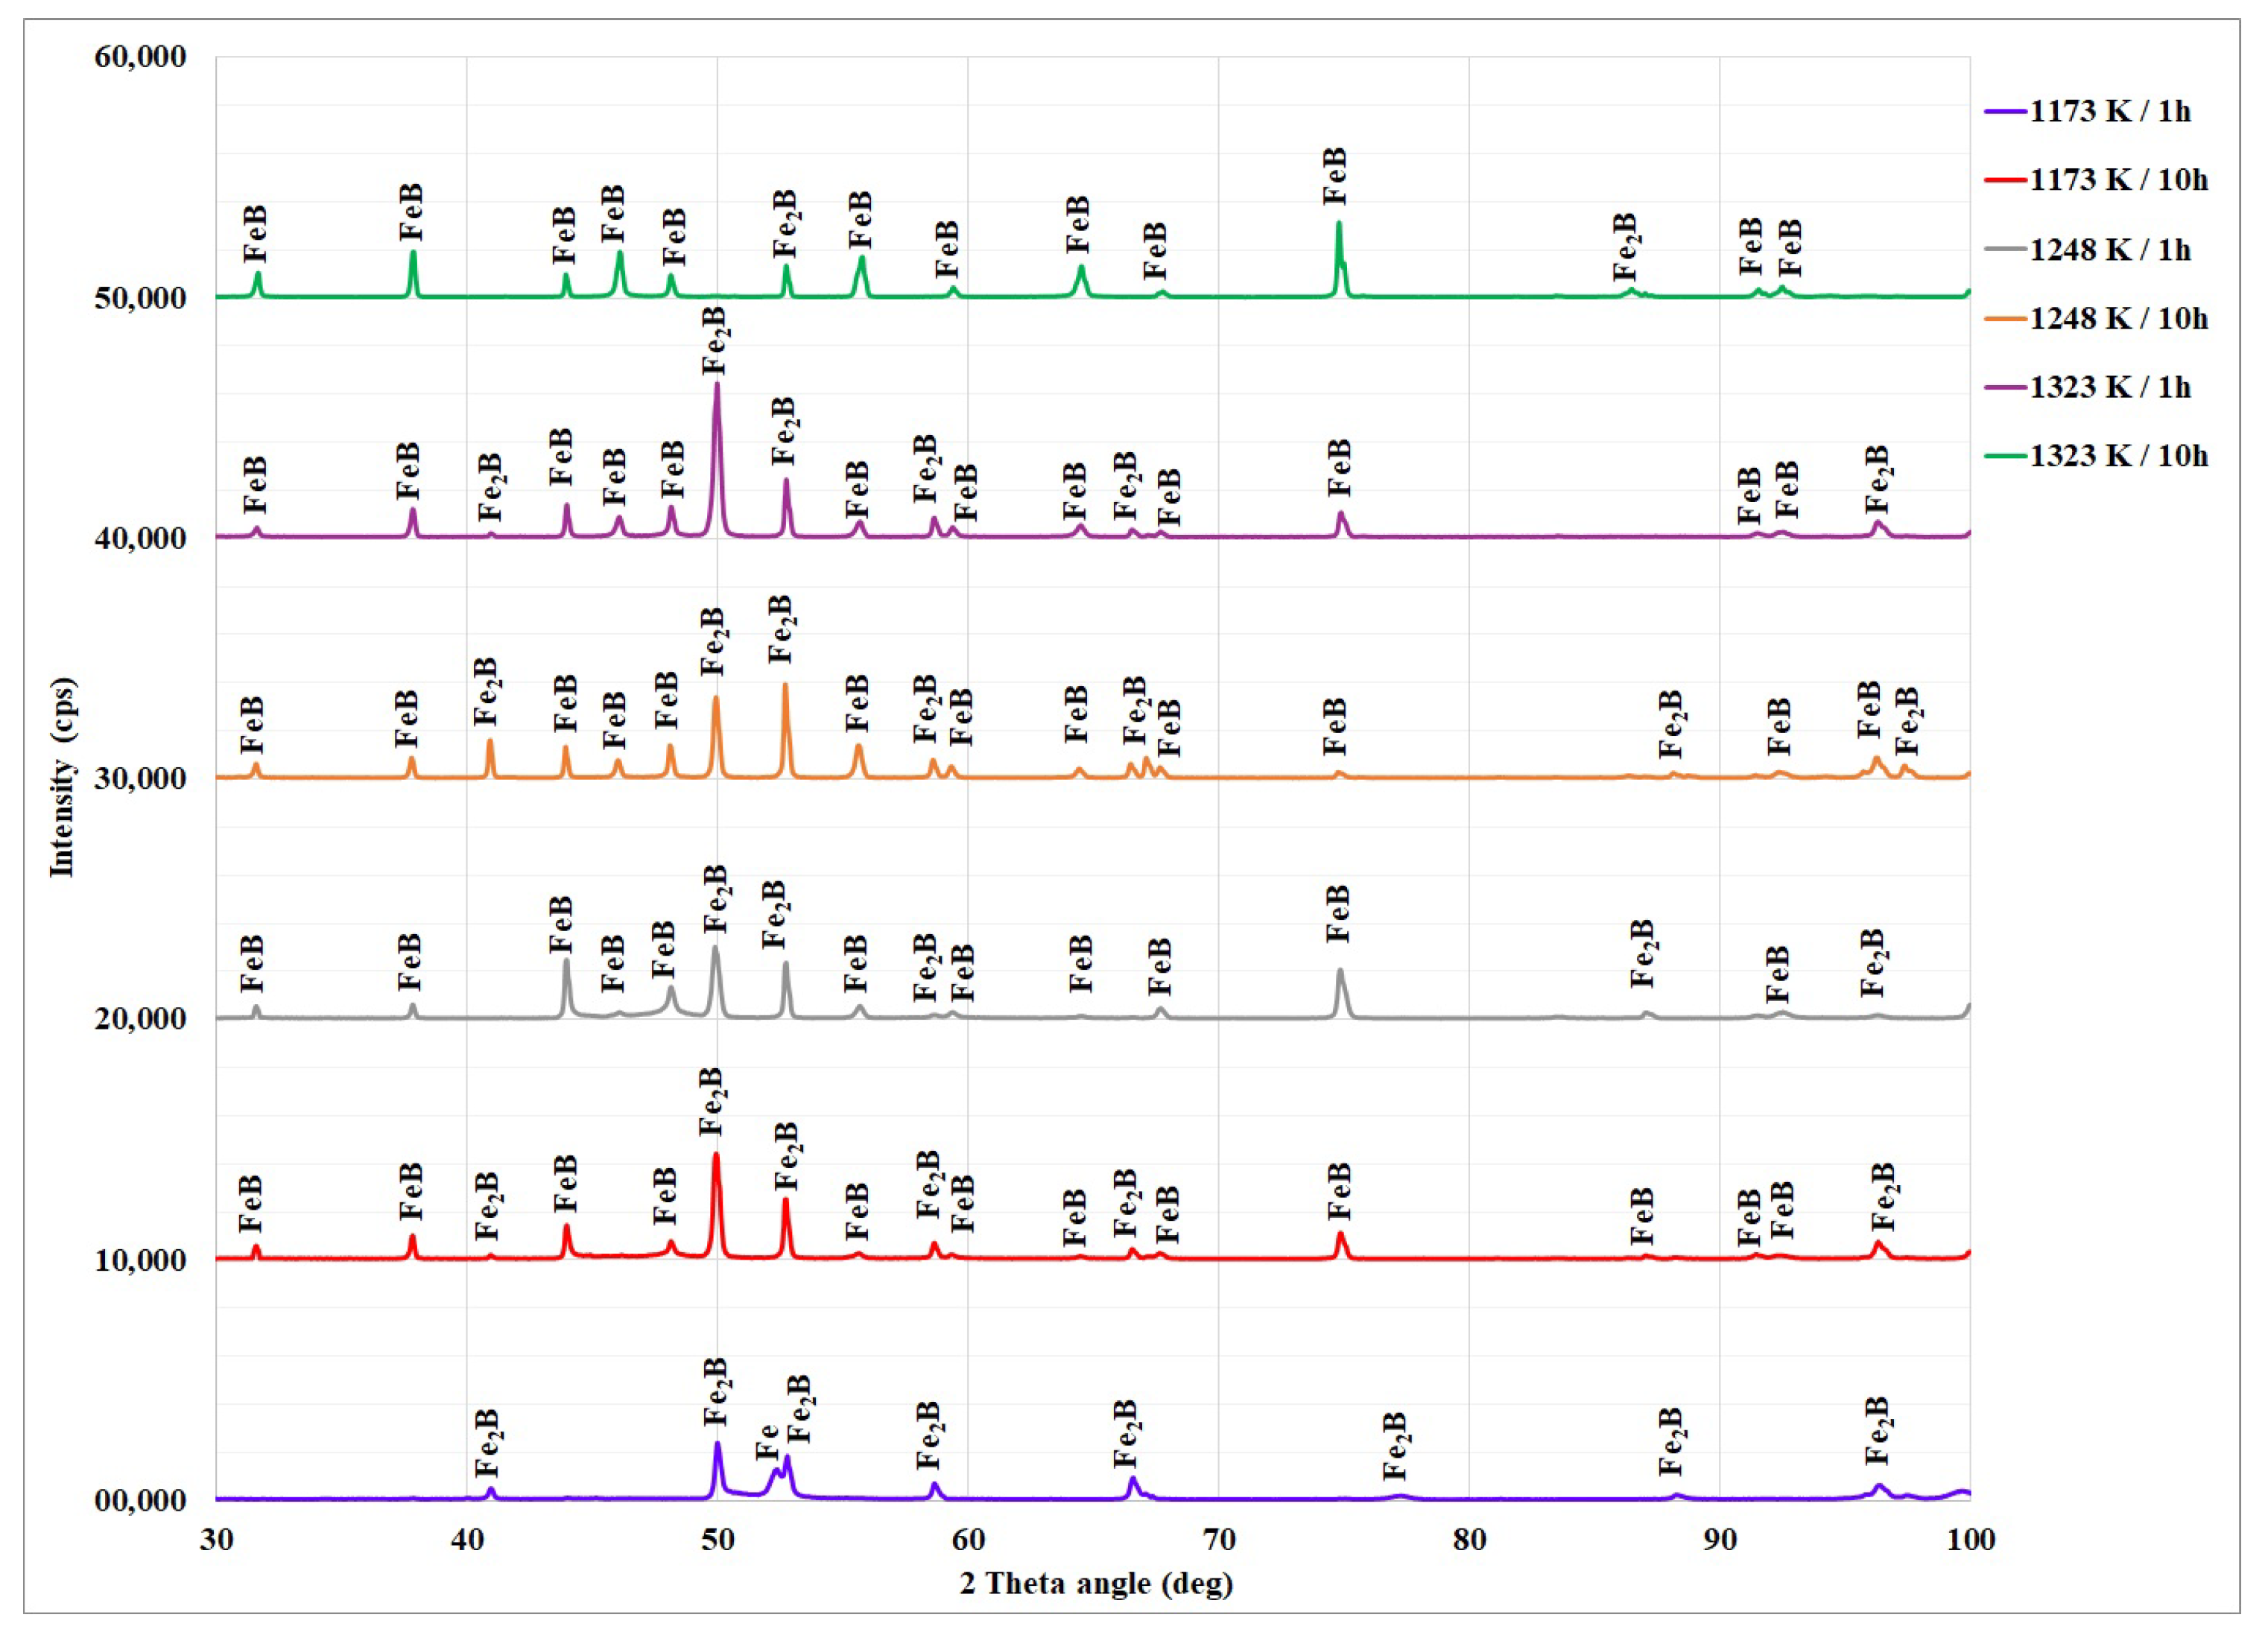
4.2. XRD Analysis
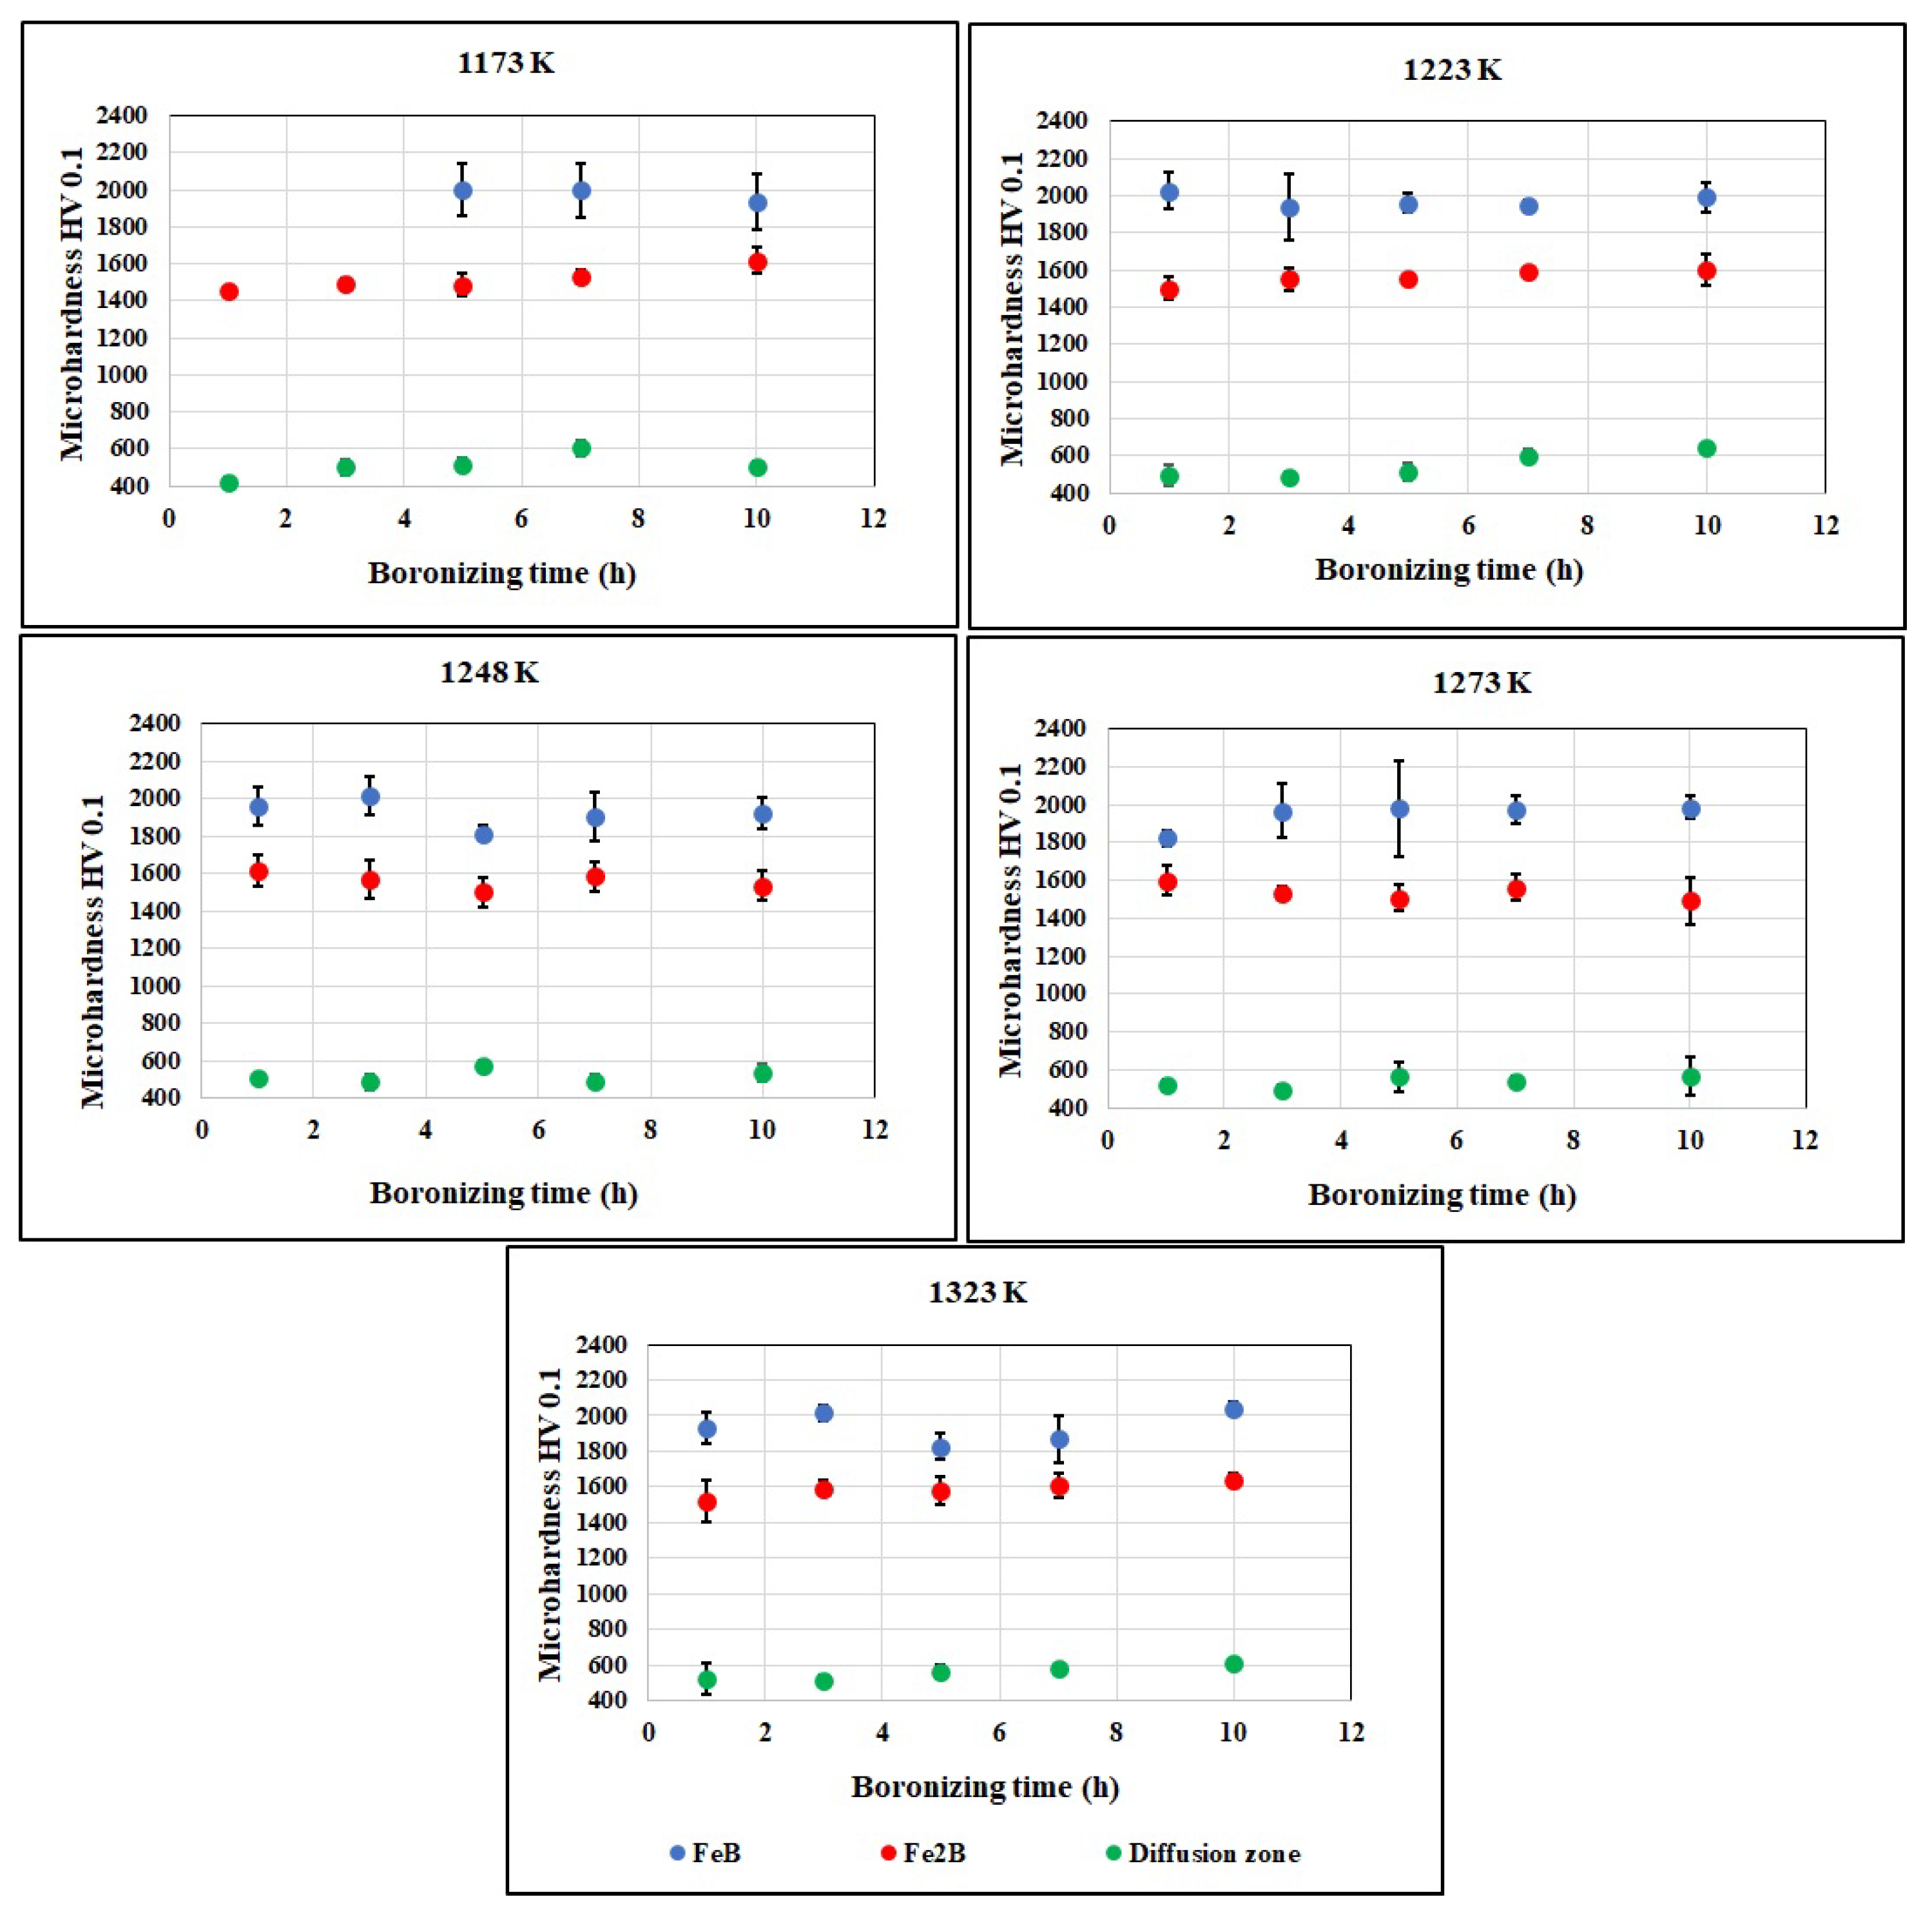
4.3. Microhardness Measurements
4.4. Kinetic Analysis with the Integral Method
5. Conclusions
Author Contributions
Funding
Institutional Review Board Statement
Informed Consent Statement
Data Availability Statement
Conflicts of Interest
References
- Keddam, M.; Kulka, M.; Makuch, N.; Pertek, A.; Małdziński, L. A kinetic model for estimating the boron activation energies in the FeB and Fe2B layers during the gas-boriding of Armco iron: Effect of boride incubation times. Appl. Surf. Sci. 2014, 298, 155–163. [Google Scholar] [CrossRef]
- Kulka, M.; Makuch, N.; Piasecki, A. Nanomechanical characterization and fracture toughness of FeB and Fe 2 B iron borides produced by gas boriding of Armco iron. Surf. Coat. Technol. 2017, 325, 515–532. [Google Scholar] [CrossRef]
- Pham, N.T.H.; Nguyen, L.N.P.; Tam, H.T.T.A. A study of SiC/Borax liquid boride layer on AISI H13 hot work tool steel. Int. J. Appl. Eng. Technol. 2021, 3, 23–28. [Google Scholar]
- García-León, R.A.; Martinez-Trinidad, J.; Campos-Silva, I.; Wong-Angel, W. Mechanical characterization of the AISI 316L alloy exposed to boriding process. Dyna 2020, 87, 34–41. [Google Scholar] [CrossRef]
- Ipek, M.; Efe, G.C.; Ozbek, I.; Zeytin, S.; Bindal, C. Investigation of Boronizing Kinetics of AISI 51100 Steel. J. Mater. Eng. Perform. 2012, 21, 733–738. [Google Scholar] [CrossRef]
- Gunes, I.; Ulker, S.; Taktak, S. Kinetics of plasma paste boronized AISI 8620 steel in borax paste mixtures. Prot. Met. Phys. Chem. Surf. 2013, 49, 567–573. [Google Scholar] [CrossRef]
- Jiang, Y.; Bao, Y.; Wang, M. Kinetic Analysis of Additive on Plasma Electrolytic Boriding. Coatings 2017, 7, 61. [Google Scholar] [CrossRef] [Green Version]
- Jurči, P.; Hudáková, M. Diffusion Boronizing of H11 Hot Work Tool Steel. J. Mater. Eng. Perform. 2011, 20, 1180–1187. [Google Scholar] [CrossRef]
- Kayali, Y.; Gunes, I.; Ulu, S. Diffussion kinetics of borided AISI 52100 and AISI 440C steels. Vacuum 2012, 86, 1428–1434. [Google Scholar] [CrossRef]
- Xie, F.; Cheng, J.; Wang, S. Effects and mechanisms of an alternating current field on pack boriding. Vacuum 2018, 148, 41–47. [Google Scholar] [CrossRef]
- Krukovich, M.G.; Prusakov, B.A.; Sizov, I.S. The Equilibrium Diagram of ‘Boron-Iron’ Binary System. In Plasticity of Boronized Layers; Springer: Cham, Switzerland, 2016; Volume 237, pp. 23–38. [Google Scholar]
- Keddam, M.; Hudáková, M.; Ptačinová, J.; Moravčík, R.; Gogola, P.; Gabalcová, Z.; Jurči, P. Characterization of boronized layers on Vanadis 6 tool steel. Surf. Eng. 2021, 37, 445–454. [Google Scholar] [CrossRef]
- Campos-Silva, I.; Flores-Jiménez, M.; Rodríguez-Castro, G.; Hernández-Sánchez, E.; Martínez-Trinidad, J.; Tadeo-Rosas, R. Improved fracture toughness of boride coating developed with a diffusion annealing process. Surf. Coat. Technol. 2013, 237, 429–439. [Google Scholar] [CrossRef]
- Dybkov, V.I. Boriding of High Chromium Steels. Curr. Phys. Chem. 2016, 6, 137–144. [Google Scholar] [CrossRef]
- Dybkov, V.I. Basics of Formation of Iron Boride Coatings. J. Miner. 2016, 2, 30–46. [Google Scholar]
- Dybkov, V.I.; Lengauer, W.; Barmak, K. Formation of Boride Layers at the Fe–10% Cr alloy–boron Interface. J. Alloy. Compd. 2005, 398, 113–122. [Google Scholar] [CrossRef]
- Sireli, G.K.; Bora, A.S.; Timur, S. Evaluating the mechanical behavior of electrochemically borided low-carbon steel. Surf. Coat. Technol. 2020, 381, 125177. [Google Scholar] [CrossRef]
- da Costa Aichholz, S.A.; Meruvia, M.S.; Júnior, P.C.S.; Torres, R.D. Tribocorrosion behavior of boronized AISI 4140 steel. Surf. Coat. Technol. 2018, 352, 265–272. [Google Scholar] [CrossRef]
- Ozbek, I.; Bindal, C. Mechanical properties of boronized AISI W4 steel. Surf. Coat. Technol. 2002, 154, 14–20. [Google Scholar] [CrossRef]
- Pereira, R.G.; Mariani, F.E.; Neto, A.L.; Totten, G.E.; Casteletti, L.C. Characterization of Layers Produced by Boriding and Boriding-PVD on AISI D2 Tool Steel. Mater. Perform. Charact. 2016, 5, 406–413. [Google Scholar] [CrossRef]
- Erdogan, M.; Gunes, I. Corrosion Behavior and Microstructure of Borided Tool Steel. Matéria 2015, 20, 523–529. [Google Scholar] [CrossRef] [Green Version]
- Oliveira, C.K.N.; Casteletti, L.C.; Lombardi Neto, A.; Totten, G.E.; Heck, S.C. Production and characterization of boride layers on AISI D2 tool steel. Vacuum 2010, 84, 792–796. [Google Scholar] [CrossRef]
- Christiansen, T.L.; Bottoli, F.; Dahl, K.V.; Gammeltoft-Hansen, N.B.; Laursen, M.B.; Somers, M.A.J. Hard Surface Layers by Pack Boriding and Gaseous Thermo-Reactive Deposition and Diffusion Treatments. Mater. Perform. Charact. 2017, 6, 475–491. [Google Scholar] [CrossRef]
- Ortiz-Domínguez, M.; Gómez-Vargas, O.A.; De Parga, G.A.; Torres-Santiago, G.; Velázquez-Mancilla, R.; Castellanos-Escamilla, V.A.; Mendoza-Camargo, J.; Trujillo-Sánchez, R. Modeling of the Growth Kinetics of Boride Layers in Powder-Pack Borided ASTM A36 Steel Based on Two Different Approaches. Adv. Mater. Sci. Eng. 2019, 2019, 5985617. [Google Scholar] [CrossRef] [Green Version]
- Kayali, Y.; Taktak, S. Characterization and Rockwell-C adhesion properties of chromium-based borided steels. J. Adhes. Sci. Technol. 2015, 29, 2065–2075. [Google Scholar] [CrossRef]
- Li, C.; Shen, B.; Li, G.; Yang, C. Effect of Boronizing Temperature and Time on Microstructure and Abrasion Wear Resistance of Cr12Mn2V2 High Chromium Cast Iron. Surf. Coat. Technol. 2008, 202, 5882–5886. [Google Scholar] [CrossRef]
- Campos, I.; Farah, M.; López, N.; Bermúdez, G.; Rodríguez, G.; VillaVelázquez, C. Evaluation of the tool life and fracture toughness of cutting tools boronized by the paste boriding process. Appl. Surf. Sci. 2008, 254, 2967–2974. [Google Scholar] [CrossRef]
- Uslu, I.; Comert, H.; Ipek, M.; Celebi, F.; Ozdemir, O.; Bindal, C. A comparison of borides formed on AISI 1040 and AISI P20 steels. Mater. Des. 2007, 28, 1819–1826. [Google Scholar] [CrossRef]
- Gunes, I.; Kanat, S. Diffusion kinetics and characterization of borided AISI D6 steel. Prot. Met. Phys. Chem. Surf. 2015, 51, 842–846. [Google Scholar] [CrossRef]
- Sen, S.; Sen, U.; Bindal, C. An approach to kinetic study of borided steels. Surf. Coat. Technol. 2005, 191, 274–285. [Google Scholar] [CrossRef]
- Keddam, M.; Kulka, M. Boriding kinetics of AISI D2 steel by using two different approaches. Met. Sci. Heat Treat. 2020, 61, 756–763. [Google Scholar] [CrossRef]
- Keddam, M.; Topuz, P. A kinetic approach for assessing boron diffusivities in iron boride layers formed on 34CrAlNi7 steel. J. Chem. Technol. Metall. 2022, 57, 824–833. [Google Scholar]
- Keddam, M.; Topuz, P.; Aydin, Ö. Simulation of boronizing kinetics of AISI 316 steel with an integral diffusion model. Mater. Test. 2021, 63, 906–912. [Google Scholar] [CrossRef]
- Keddam, M.; Hudáková, M.; Ptačinová, J.; Kusy, M.; Jurči, P. Modelling of the Boronizing Kinetics of Vanadis 6 Steel by the Integral Diffusion Model. Prot. Met. Phys. Chem. Surf. 2022, 58, 347–355. [Google Scholar] [CrossRef]
- Yu, L.; Chen, X.; Khor, K.; Sundararajan, G. FeB/Fe2B phase transformation during SPS pack-boriding: Boride layer growth kinetics. Acta Mater. 2005, 53, 2361–2368. [Google Scholar] [CrossRef]
- Abdellah, Z.N.; Chegroune, R.; Keddam, M.; Bouarour, B.; Haddour, L.; Elias, A. The Phase Stability in the Fe-B Binary System: Comparison between the Interstitial and Substitutional Models. Defect Diffus. Forum 2012, 322, 1–9. [Google Scholar] [CrossRef]
- Press, W.H.; Flannery, B.P.; Teukolsky, S.A.; Vetterling, W. Numerical Recipes in Pascal: The Art of Scientific Computing; Cambridge University Press: New York, NY, USA, 1989; Volume 781. [Google Scholar]
- Kunst, H.; Schaaber, O. Beobachtungen beim Oberflaechenborieren von Stahl. Haerterei Tech. Mitt. 1967, 22, 1–25. [Google Scholar]
- Boumaali, B.; Nait, A.Z.; Keddam, M. Characterization of bilayer (FeB/Fe2B) on AISI H13 work tool steel. Koroze Ochr. Mater. 2021, 65, 40–48. [Google Scholar] [CrossRef]
- Kulka, M. Current Trends in Boriding Techniques; Springer: Cham, Switzerland, 2019. [Google Scholar]
- Kayali, Y.; Talaş,, Ş; Yalçin, M.C.; Kul, M.; Yazar, M.; Kir, H. Diffusion Kinetics of Boronized ASP®2012 Tool Steel Produced by Powder Metallurgy. Prot. Met. Phys. Chem. Surf. 2022, 58, 1036–1043. [Google Scholar] [CrossRef]
- Keddam, M.; Jurči, P. Simulating the Growth of Dual-Phase Boride Layer on AISI M2 Steel by Two Kinetic Approaches. Coatings 2021, 11, 433. [Google Scholar] [CrossRef]
- Kayalı, Y.; Kara, R. Investigation of Wear Behavior and Diffusion Kinetic Values of Boronized Hardox-450 Steel. Prot. Met. Phys. Chem. Surf. 2021, 57, 1025–1033. [Google Scholar] [CrossRef]
- Türkmen, I.; Yalamaç, E.; Keddam, M. Investigation of tribological behaviour and diffusion model of Fe2B layer formed by the pack-boriding process on SAE 1020 steel. Surf. Coat. Technol. 2019, 377, 124888. [Google Scholar] [CrossRef]
- Arslan, M.; Karimzadehkhoei, M.; Sireli, G.K.; Coskun, O.K.; Sert, M.; Timur, S. Investigating Growth of Iron Borides with the Formation of Monolithic Fe2B Layer on AISI 304 Stainless Steel via Cathodic Reduction and Thermal Diffusion-Based Boriding. J. Mater. Eng. Perform. 2022, 31, 3274–3286. [Google Scholar] [CrossRef]
- Keddam, M.; Chegroune, R.; Kulka, M.; Makuch, N.; Panfil, D.; Siwak, P.; Taktak, S. Characterization, Tribological and Me-chanical Properties of Plasma Paste Borided AISI 316 Steel. Trans. Indian Inst. Met. 2017, 71, 79–90. [Google Scholar] [CrossRef]
- Campos-Silva, I.; Hernández-Ramirez, E.; Contreras-Hernández, A.; Rosales-Lopez, J.; Valdez-Zayas, E.; Mejía-Caballero, I.; Martínez-Trinidad, J. Pulsed-DC powder-pack boriding: Growth kinetics of boride layers on an AISI 316 L stainless steel and Inconel 718 superalloy. Surf. Coat. Technol. 2021, 421, 127404. [Google Scholar] [CrossRef]


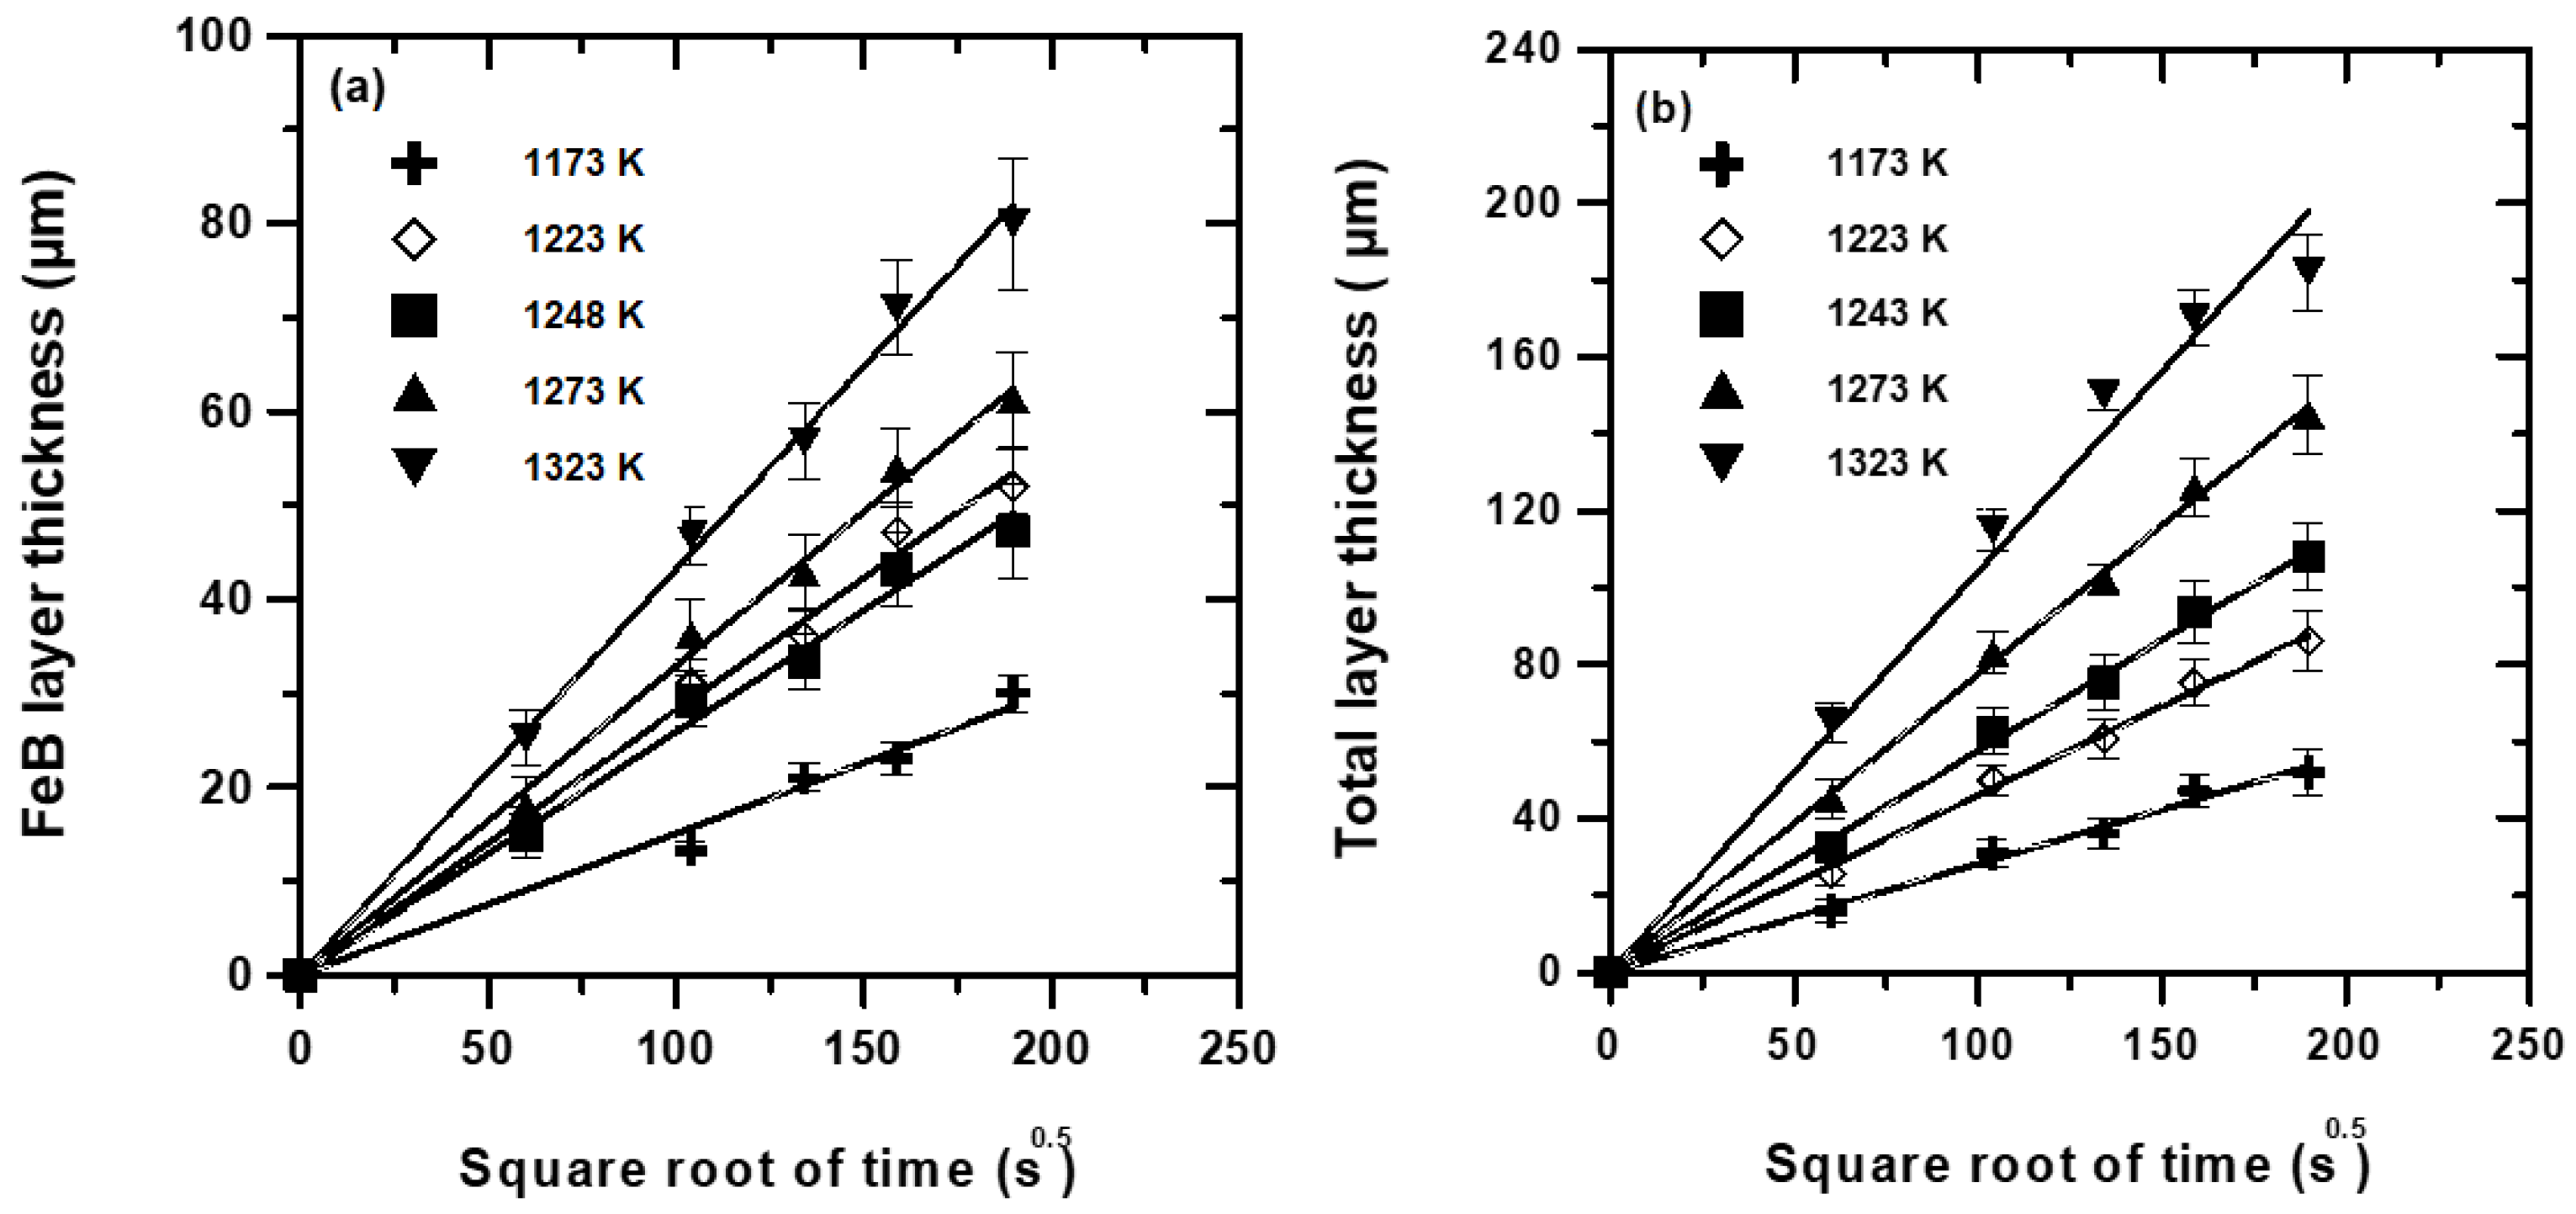
| T (K) | (μm s−0.5) | (μm s−0.5) |
|---|---|---|
| 1173 | 0.1506 | 0.2816 |
| 1223 | 0.2592 | 0.4609 |
| 1248 | 0.3282 | 0.5757 |
| 1273 | 0.4321 | 0.7748 |
| 1323 | 0.6219 | 1.0416 |
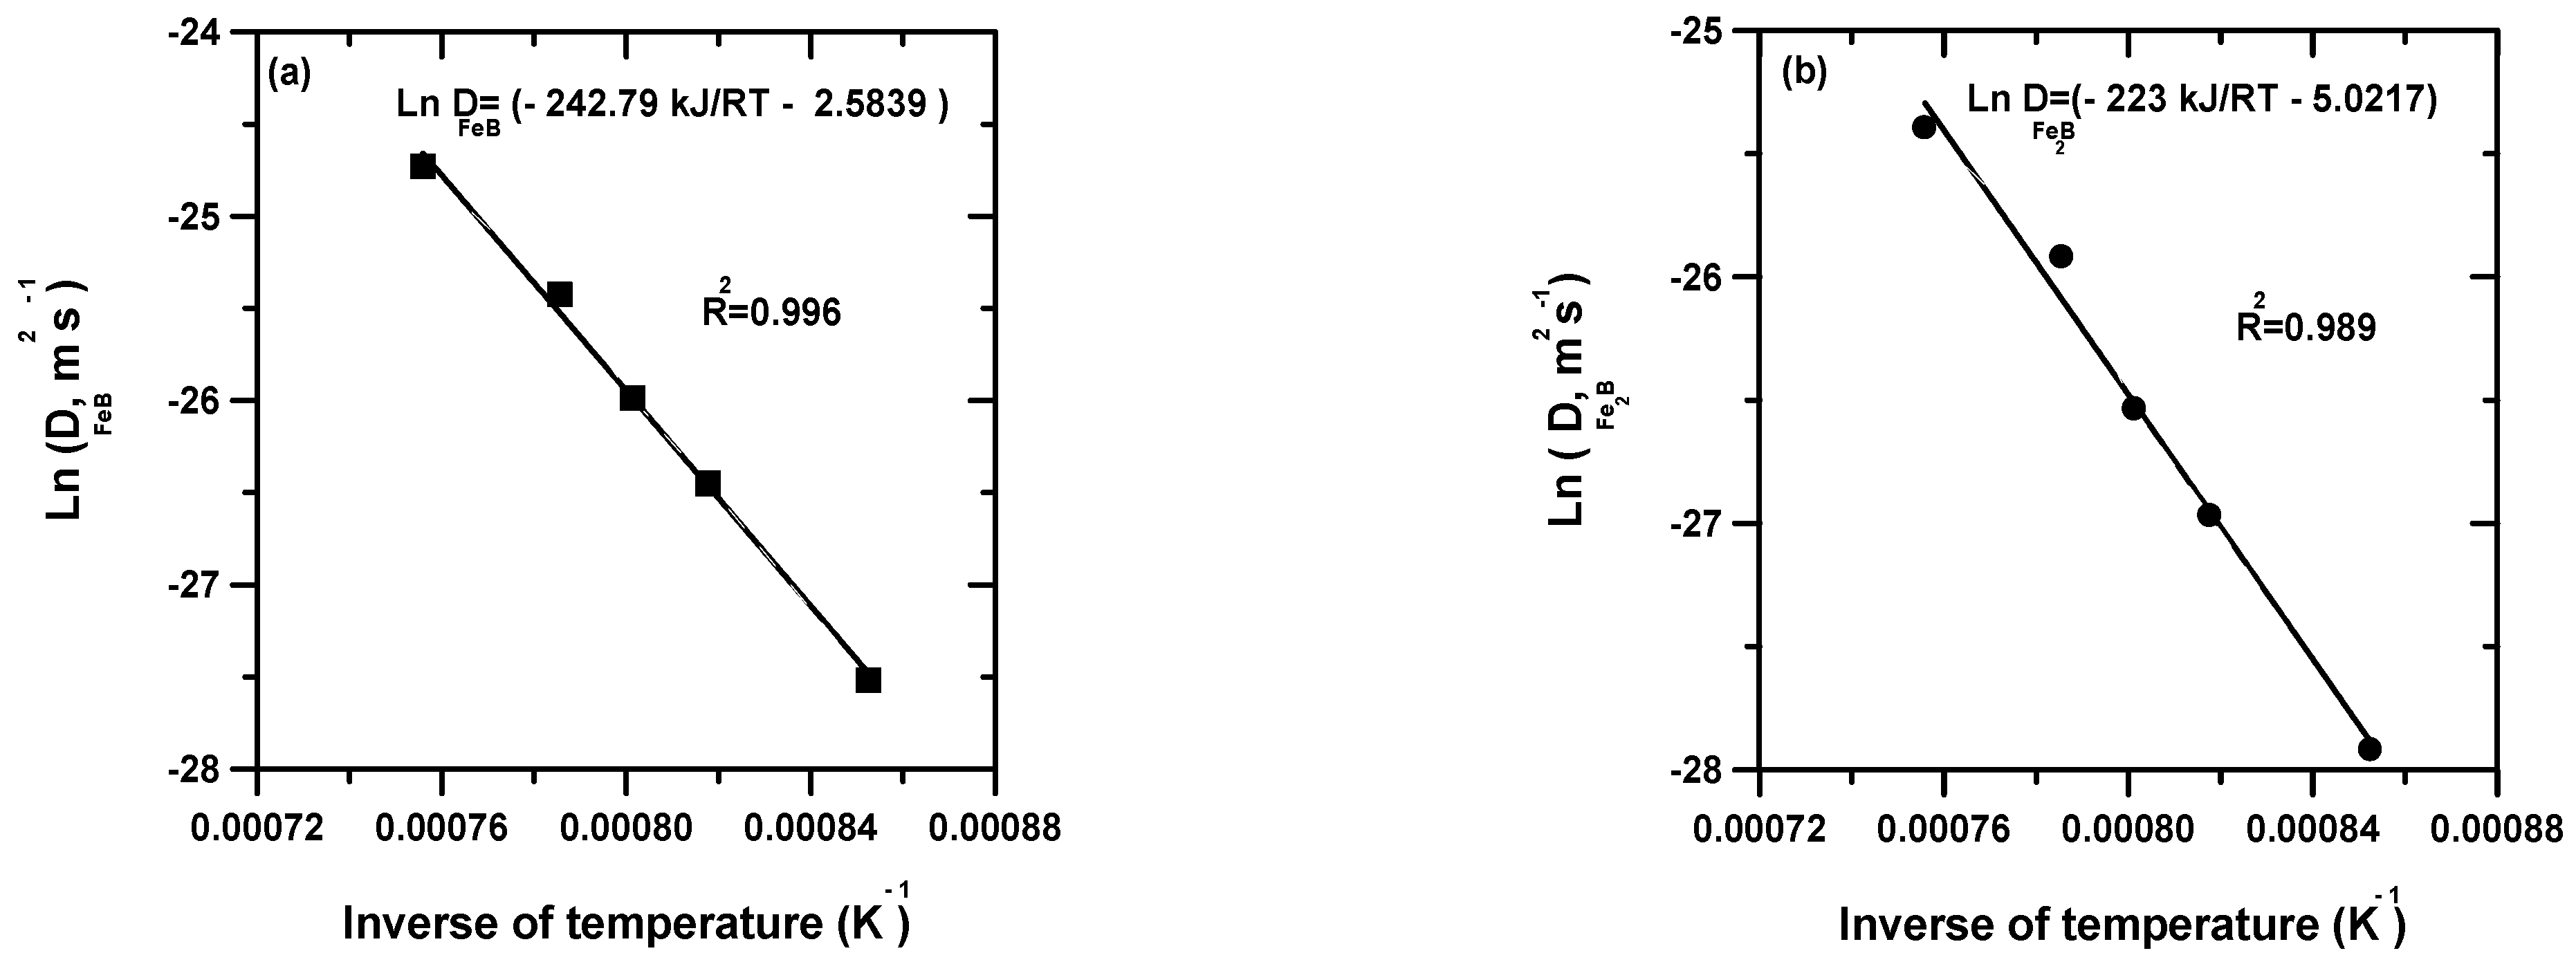
| T (K) | (m2s−1) | (m2s−1) | Parameter | Parameter |
|---|---|---|---|---|
| 1173 | 1.12 | 0.75 | 0.07093 | 0.1617 |
| 1223 | 3.29 | 1.94 | 0.07185 | 0.1653 |
| 1248 | 5.18 | 2.99 | 0.07207 | 0.1663 |
| 1273 | 9.08 | 5.54 | 0.07188 | 0.1646 |
| 1323 | 18.20 | 9.35 | 0.07288 | 0.1703 |
| Steel | Boronizing Method | Temperature Range (K) | Activation Energy (kJmol−1) | Computation Method | Refs. |
|---|---|---|---|---|---|
| AISI 316 | Powder | 1073–1273 for 1–3 h | 172.93 (FeB) 199.43 (Fe2B) | Integral method | [33] |
| ASP®2012 | Powder | 1123–1223 for 2–6 h | 314.716 (FeB + (Fe2B) | Parabolic law | [41] |
| AISI M2 | Powder | 1173–1323 for 4–10 h | 226.02 (FeB) 209.04 (Fe2B) | Dybkov model | [42] |
| AISI D2 | Powder | 1223–1273 for 3–10 h | 208.04(FeB) 197.46 (Fe2B) | Mean diffusion coefficient method | [31] |
| Hardox-450 | Powder | 1123–1223 for 2–6 h | 157.99 (Fe2B) | Parabolic law | [43] |
| SAE 1020 | Powder | 1123–1223 for 4–12 h | 183.14 (Fe2B) | Integral method | [44] |
| AISI D2 | Salt bath | 1073–1273 for 2–8 h | 170 (FeB + Fe2B) | Parabolic law | [30] |
| AISI 304 | CRTD-Bor | 1223–1323 for 0.25–1 h | 181.46 (Fe2B) | Parabolic law | [45] |
| AISI 316 | Plasma-paste-boriding | 973–1073 for 3–7 h | 118.12 (FeB + Fe2B) | Parabolic law | [46] |
| AISI 316 L | Pulsed DC powder | 1123–1273 for 0.5–2 h | 162 (FeB) 171 (Fe2B) | Diffusion model | [47] |
| Royalloy | Powder | 1173–1323 for 1–10 h | 242.79 (FeB) 223.0 (Fe2B) | Integral method | This work |
Disclaimer/Publisher’s Note: The statements, opinions and data contained in all publications are solely those of the individual author(s) and contributor(s) and not of MDPI and/or the editor(s). MDPI and/or the editor(s) disclaim responsibility for any injury to people or property resulting from any ideas, methods, instructions or products referred to in the content. |
© 2023 by the authors. Licensee MDPI, Basel, Switzerland. This article is an open access article distributed under the terms and conditions of the Creative Commons Attribution (CC BY) license (https://creativecommons.org/licenses/by/4.0/).
Share and Cite
Orihel, P.; Drienovský, M.; Gabalcová, Z.; Jurči, P.; Keddam, M. Characterization and Boron Diffusion Kinetics on the Surface-Hardened Layers of Royalloy Steel. Coatings 2023, 13, 113. https://doi.org/10.3390/coatings13010113
Orihel P, Drienovský M, Gabalcová Z, Jurči P, Keddam M. Characterization and Boron Diffusion Kinetics on the Surface-Hardened Layers of Royalloy Steel. Coatings. 2023; 13(1):113. https://doi.org/10.3390/coatings13010113
Chicago/Turabian StyleOrihel, Peter, Marián Drienovský, Zuzana Gabalcová, Peter Jurči, and Mourad Keddam. 2023. "Characterization and Boron Diffusion Kinetics on the Surface-Hardened Layers of Royalloy Steel" Coatings 13, no. 1: 113. https://doi.org/10.3390/coatings13010113