Article

Analysis of Influence of Insulating Resin Paint Film on Enameled Wire Properties Based on Molecular Simulation

1
School of Electrical Engineering, Beijing Jiaotong University, Beijing 100044, China
2
School of Materials Science and Engineering, China University of Petroleum, Qingdao 266580, China
*
Author to whom correspondence should be addressed.
Coatings 2022, 12(9), 1352; https://doi.org/10.3390/coatings12091352
Submission received: 25 July 2022 / Revised: 9 September 2022 / Accepted: 13 September 2022 / Published: 16 September 2022
(This article belongs to the Section Functional Polymer Coatings and Films)

Abstract

:
As one of the varieties of magnet wire, the enameled wire has excellent mechanical properties, heat resistance, ageing resistance, dimensional stability and chemical stability. This is one of the keys affecting the development of the electrical industry, especially the development of new motors. Different varieties of enameled wire insulating varnishes have advantages and disadvantages, in addition to their general properties. In order to improve the service life and reliability of the electrical coil of the motor, it is necessary to select the appropriate enameled wire reasonably according to different purposes. Molecular simulation technology can play a guiding role in the relationship between the molecular structure and properties of resins, help to understand the microscopic mechanism, shorten the experimental period, improve efficiency and save costs. In this paper, based on density functional theory (DFT) and molecular dynamics (MD), the microscopic properties of four insulating resins, polyamide–imide (PAI), polyester (PET), polyesterimide (PEI), and polyimide (PI), were studied. We also studied the influence mechanism of the insulating resin microstructure on the macroscopic properties of enameled wires, including adhesion, insulating properties and flexibility. The calculation results show that the polyester insulating enameled wire paint has good insulation performance and flexibility, the polyamide–imide paint has the best adhesion, and the polyimide insulating paint has very reliable insulation performance and flexibility. The performance research in this paper lays a foundation for the preparation of insulating resin coatings with better comprehensive properties. The performance research in this paper lays a foundation for preparing insulating resin paint with excellent comprehensive performance.

1. Introduction

Enameled wire is an essential component of generators, motors, transformers and other equipment, plays a crucial role in current conduction, and its insulation is of great significance. Enameled wire enamel is one of the primary materials for enameled wire insulation [1,2]. With the development of the synthetic chemical industry and the continuous development of new insulating materials, the variety of enameled wires is increasing, and each has its advantages and disadvantages. Calculating the properties of insulating resin molecules can reduce artificial data and analysis errors and lay the foundation for subsequent performance optimization of enameled wire insulating resins.
Molecular simulation technology uses computers to simulate the structure and behavior of molecules with atomic-level models and then simulate various physical and chemical properties of molecular systems. In recent years, with the extensive development of high-performance computing (HPC) facilities, computational algorithms and software packages, first-principles calculations, especially density function theory (DFT), have been widely used to study interface properties [3,4]. DFT can provide quantitative insights into ionic and covalent bonding processes by clearly indicating which molecules are energetically favorable to which molecules, and the magnitude of the energies involved [5]. First-principles calculations are well suited for systems with organic–inorganic materials to study molecules’ reactions and adsorption properties on mineral surfaces [6]. Tina et al. outline how molecular simulations can be used to characterize metal–organic frameworks for adsorption applications. Pan Rui et al. [7] studied the research content and basic methods of molecular simulation technology in the relationship between polyimide structure and properties in recent years. It shows molecular simulation technology’s efficiency, fidelity and importance in studying the relationship between material structures and properties. The experiments of polyimide play a role in verification and guidance, and the performance of PI with a particular structure is predicted. The comprehensive application of various advanced algorithms makes Material Studio a powerful simulation tool in the field of materials [8]. Molecular structure optimization and adsorption configuration can be performed using the DMol3 code in Materials Studio [9,10]. At the same time, the DMol3 module can analyze the adsorption energy, band structure and HOMO and LUMO of molecules. The analysis of mechanical properties can be calculated by the change in the total energy during the deformation process, evaluating mechanical behavior [7]. Liu Jialin studied the effects of grain size, strain rate, film width, nanopore and annealing temperature on its mechanical properties and deformation mechanism under uniaxial stretching of the Molecular Dynamics simulation [11]. Yunlong Cai drew the material’s stress–strain curve based on MD and qualitatively analyzed the mechanical properties of the material [12].There are only papers on improving the properties of enameled wire enamels through experiments. However, they have not explained their macroscopic properties from the perspective of the microstructure of enameled wire insulating resins. Alternatively, only a certain type of enameled wire varnish is studied without comparing the performance of various insulating varnishes.
We chose four kinds of enameled wire insulation varnishes that are most commonly used in the enameled wire production industry and have relatively good performance, including polyester (PET), polyimide (PI), polyesterimide (PEI), and polyamide–imide (PAI). Based on density functional theory and molecular dynamics, this paper studied and compared the microscopic properties of PET, PI, PEI, and PAI. We calculated these four molecules’ adsorption energies, HOMO–LUMO gaps, band structures, density of states (DOS), and stress strains. We explain the macroscopic properties of enameled wire insulation from a microscopic perspective, including the bonding properties, insulation properties, and flexibility properties. By comparing the calculation results, we obtained the insulating resin with the best all-around performance, which shortened the experimental period, improved the efficiency, and saved cost.

2. Computational Methods

2.1. DMol3

DMol3 in the Materials Studio 2019 simulation software is based on DFT, which can quickly and accurately simulate the chemical process of materials and predict the properties of materials. People use DMol3 to study the system’s chemical, electronic and structural properties, especially using DMol3 to simulate expensive practical experiments, which will save many costs and shorten the development cycle. When using DMol3 to study the system, the self-consistent (SCF) method of the single point energy of the system should first be used to optimize the geometric structure to obtain the most stable structure and then calculate the specific properties of the system.
In the calculation process, we used the DMol3 module of Materials Studio. Convergence accuracy during iterations is set to 1.0 × 10⁻² Å. The pseudopotential describes the interaction between the ionic real and the valence electrons, ignoring the inner electron effect. Electron exchange-correlation effects are described by the Perdew Burke Ernzerh (PBE) exchange-correlation potential in the generalized gradient approximation (GGA). The maximum atomic displacement in the convergence criterion is 0.3 Å and the total energy converges to 2.0 × 10⁻⁵ H. The convergence criterion of SCF is 1.0 × 10⁻⁵ H. In order to isolate the influence of Van der Waals force between layers, a vacuum layer is placed just above the Cu crystal plane to place molecules. The system is optimized to the lowest energy by fixing all the copper atoms in the bottom layer while the remaining atoms remain free. Molecules are adsorbed on the surface of Cu (100), and each Cu supercell only adsorbs one molecule. Each molecule has 3–5 adsorption sites, and ultimately only the lowest energy adsorption system is used. The complete data is given in the attachment, and this paper compares the most stable adsorption states for each molecule. Figure 1 shows the structural formulas of the four polymers.
DMol3 can calculate the specific properties of the system, including energy band structure, the density of states, electron density, work function, vibration frequency, Fukui index, HOMO–LUMO orbital, bond length, bond angle, bond order, dipole moment, polarizability, enthalpy, entropy, free energy, etc. In this paper, the adsorption energy and HOMO–LUMO gap of four different resin molecules adsorbed on the copper surface were calculated by DMol3. The molecular structure optimization results in this paper are shown in Figure 2.

2.2. Forcite

The simulation needs to be set within an ensemble for Molecular Dynamics simulations. An ensemble is a fundamental concept introduced to describe the statistical laws of a thermodynamic system. The so-called ensemble refers to a collection of many systems with identical macroscopic properties but different microscopic properties. Therefore, an ensemble is a collection of all the microscopic states of the system. Avatars are a conceptual tool. The statistical ensemble is a method pioneered by J. Willard Gibbs [18] in 1901. A statistical ensemble refers to setting a specific macroscopic condition. Microcanonical ensembles, canonical ensembles, and isothermal and isobaric ensembles are frequently used ensembles for MD simulations. In this paper, the canonical ensemble is used. In the canonical ensemble, referred to as the NVT ensemble, the total modulus of momentum is conserved in the simulated system. The number of atoms N, volume V and temperature T are all fixed. Any one of the systems can be used as a research object, while the remaining M-1 systems play the role of insulation. There is an energy exchange between the systems, and they are all in a thermally balanced closed system. The structure’s temperature during loading must be controllable in a canonical ensemble. Commonly used temperature control methods include the Berendsen and Nose–Hoover methods.
The general process of kinetic simulation includes three processes: geometry optimization, annealing and dynamics. The quality needs to be consistent in the three processes; Fine is used for structural optimization, and Fine is used for both annealing and kinetics. In the structural optimization process, the commonly used algorithms are the steepest descent method (steepest descent) and the conjugate gradient method (conjugate gradient). The steepest descent method is suitable for structures that deviate from the equilibrium position, and the conjugate gradient method is suitable for optimizing structures already close to the equilibrium position. Therefore, our model needs to use the steepest descent method and the conjugate gradient method to find the structure with the lowest energy. In the annealing process, the initial temperature is generally 300 K, and the mid-cycle temperature is 500 K. A value of 1 fs was chosen for the time step during annealing and kinetics, and the Andersen method for the temperature control (Thermostat) (Berendsen for the pressure control method). The selection of energy deviations is as large as possible to be larger than the system’s energy. The simulation time of the annealing process and kinetics are generally different. The simulation time of the annealing process is generally about 10–100 ps. The simulation time of more than 10 ns is generally selected for kinetics. For kinetic calculations, NVT was selected for the ensemble. We chose the COMPASS force field for application to organic molecules and polymers, and the cutoff distance was set to 12.5 Å. The xyz axis of PET has a length of 22.6900 Å, that of PAI is 12.8300 Å, that of PEI is 12.1800 Å, and that of PI is 28.2200 Å. The number of steps was set to 50,000, and uniaxial tension–compression tests were performed along the z-axis for four types of resin molecules at a constant temperature of 500 K at a constant strain rate.

3. Results and Discussions

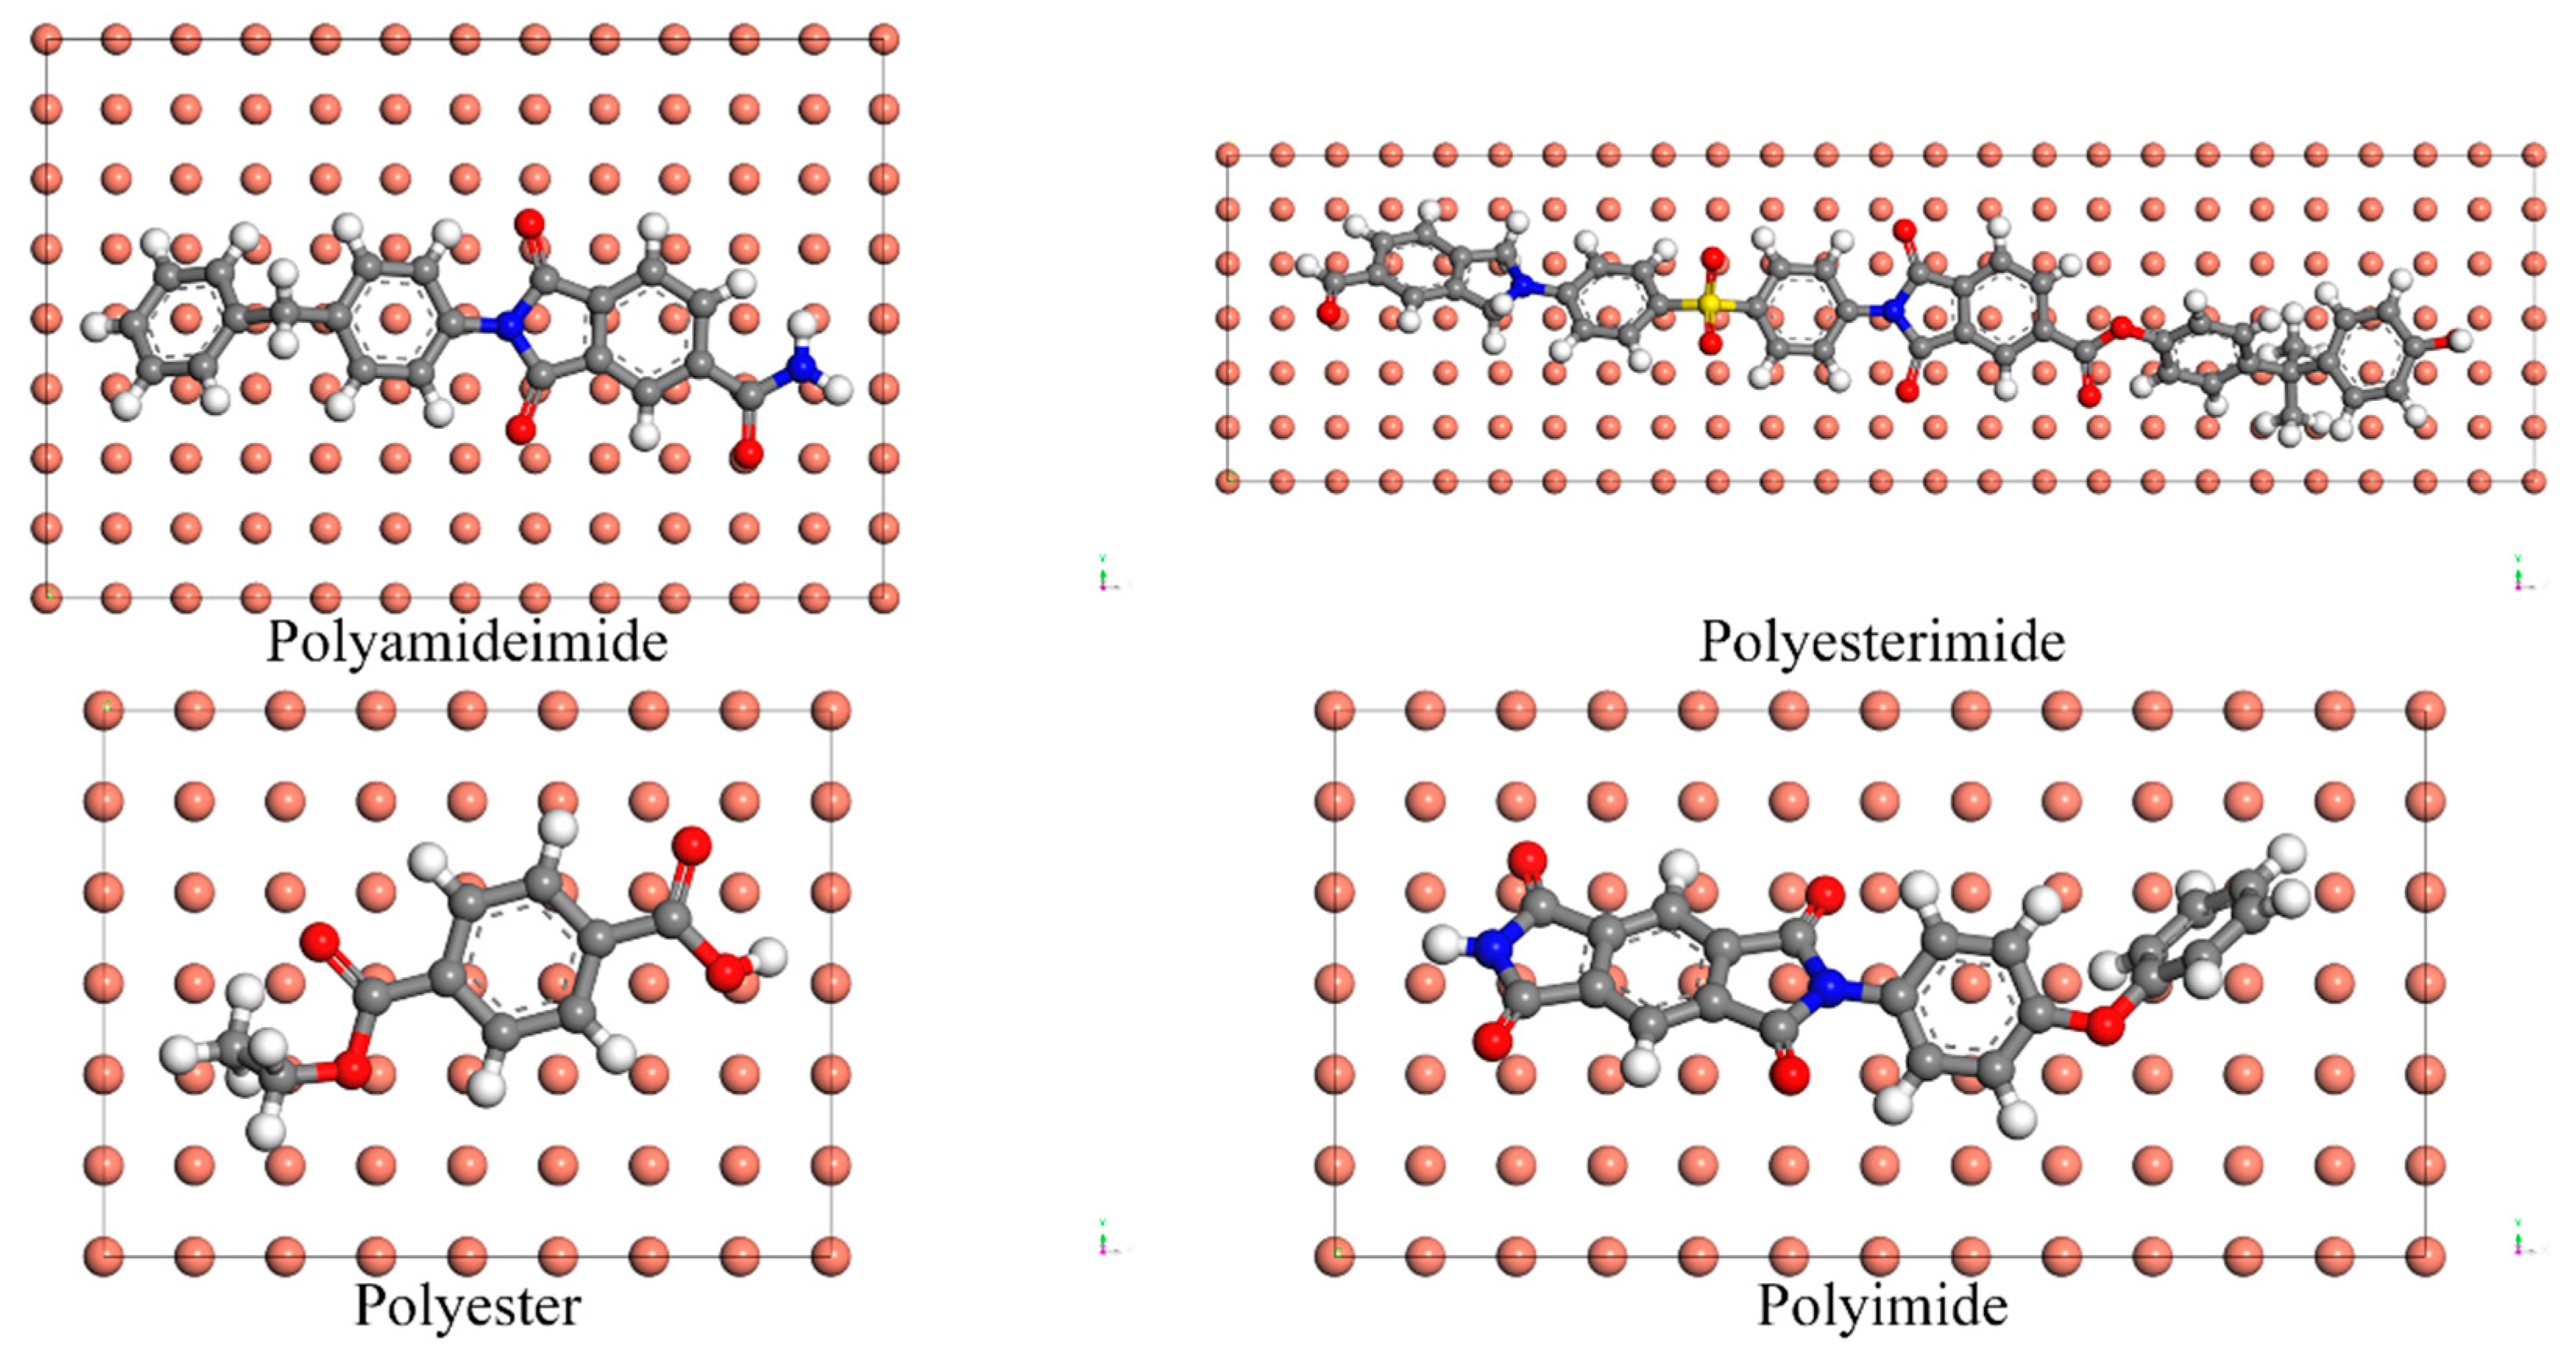
3.1. Adsorption Energy of Physical Adsorption

The adsorption energy is calculated from,
E adsorption   = E molecule - surface   E molecule   + E surface   ,  
where E molecule   , E surface   and E molecule - surface   represent the energy of a molecule, a clean surface and the whole system with the molecule adsorbed on the surface.
If the adsorption energy is negative, the adsorption process is exothermic, and the adsorption is stable. If the adsorption energy is positive, the adsorption process is endothermic, and the adsorption is unstable. The larger the absolute value of the adsorption energy, the stronger the interaction between the molecule and the surface. For computational studies, adsorption energies that are often inconsistent through different methods are often inconsistent due to the differences in the methods used. However, the adsorption energy calculated by the same method which help to characterize the adsorption capacity. Ataman et al. [19,20] studied the adsorption of a series of small organic molecules with different functional groups on the calcite [21] surface by the DFT method with the Quantum Espresso code. By comparing the adsorption energies of these molecules, the authors found that carboxylic acids (RCOOH) were more adsorbed than water and alcohols (R-OH), which in turn were more adsorbed than aldehydes (R-CHO). DFT calculations for plates and adsorbates of Joseph et al. were investigated and shown to be achievable with the high-throughput operation. This paper also presented algorithms and tools for the structural properties of slabs and their associated bulk structure automation. Moreover, we can use it in adsorption energy calculation. The adsorption energies calculated using the DFT method match the experimental results, indicating that the predicted values are reliable and offer the possibility of adsorbing other molecules on particular surfaces. Figure 3 shows the copper surface’s adsorption sites of the four resin molecules. Table 1 calculates the adsorption energies of the four molecules from the energy of the molecules, the energy of the Cu surface, and the system energy of the adsorbed molecules on the copper surface.
From Figure 4 and Table 1, we can see that PEI has the largest number of atoms and, using the Cu (12 × 3) supercell, has the longest time to calculate the time adsorption energy. The adsorption energies of PAI, PET, PEI, and PI are all negative values, indicating that the adsorption processes are all exothermic and the adsorption is stable. Because the absolute values of the adsorption energies of both PI and PAI molecules are relatively large, being −136.061 kcal/mol and −128.677 kcal/mol, they indicate that the interaction between PI and PAI and the Cu surface is more potent than others. In addition, the adsorption energy of the PEI molecule is −120.128 kcal/mol, and the adsorption effect is also relatively good. Therefore, PI and PAI, as the insulating varnish of enameled wire, have better adhesion on a Cu bare wire. We can use these two resins to make insulating varnish under economic conditions.

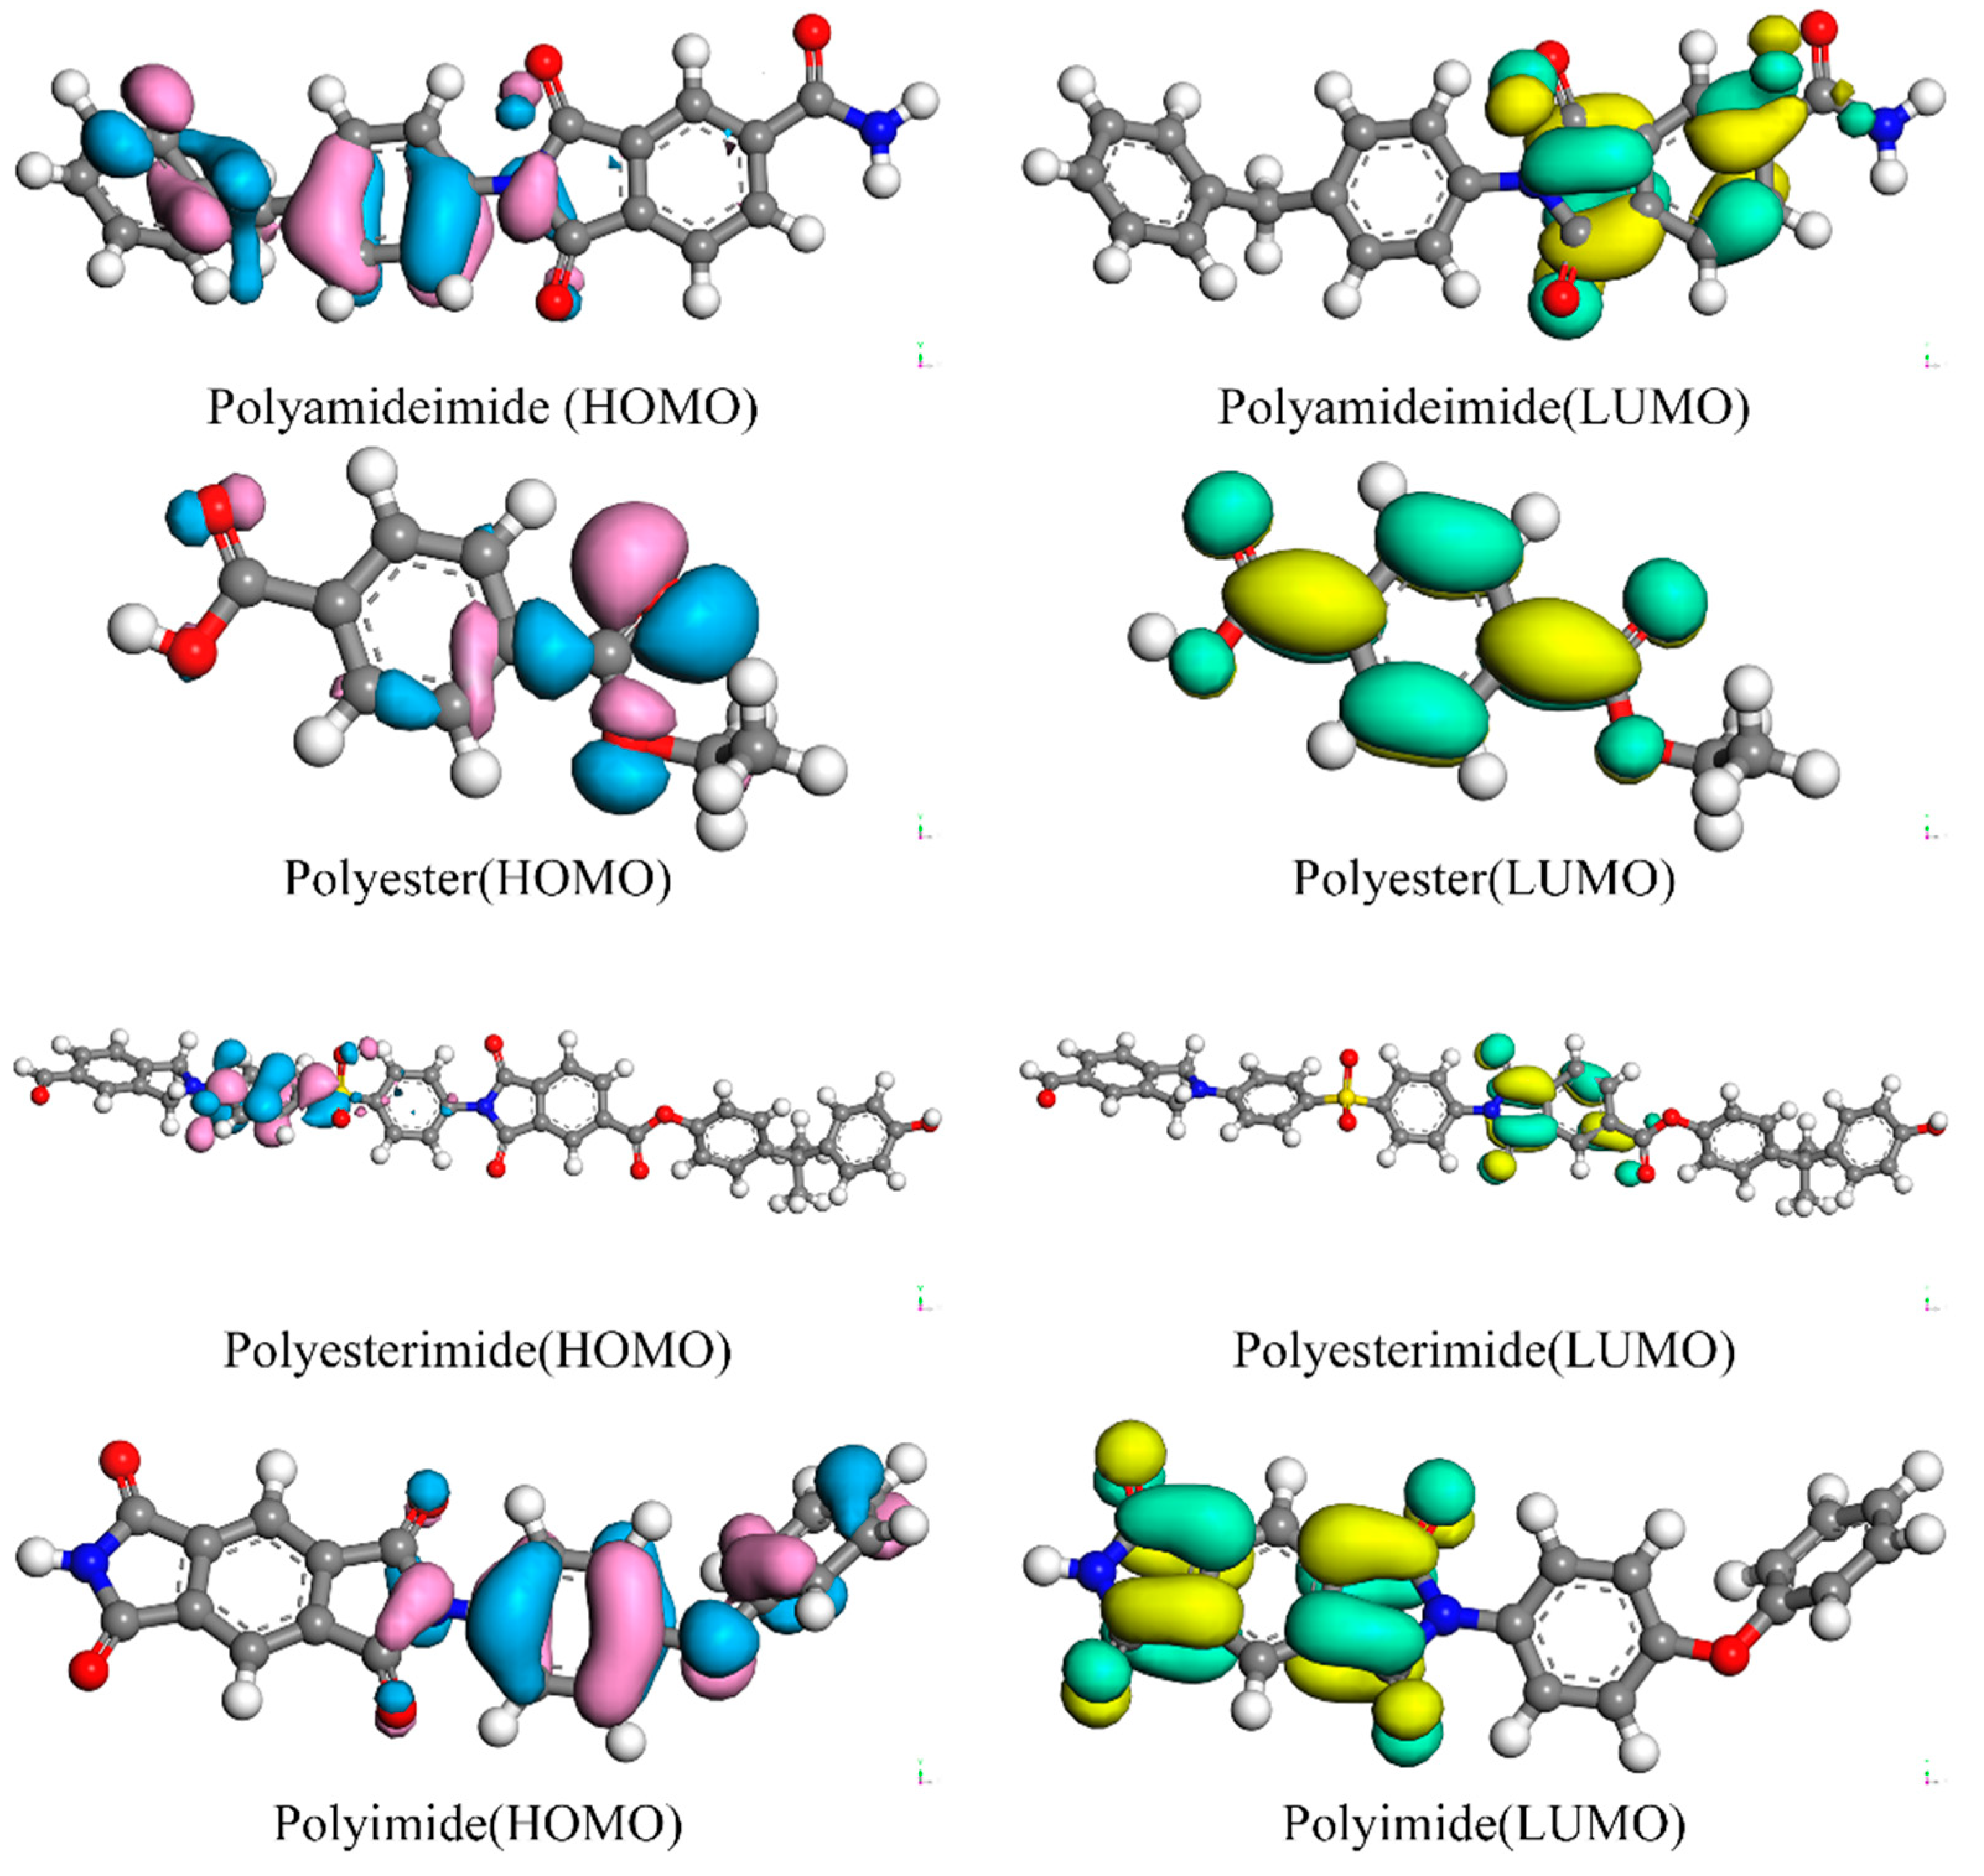
3.2. Frontier Orbitals (HOMO and LUMO)

Frontier molecular orbital theory was postulated in 1952 by Kenichi Fukui, who described the highest occupied molecular orbital (HOMO) and lowest unoccupied molecular orbital (LUMO) interaction from molecular orbital theory [22]. The highest occupied molecular orbital (HOMO) is the outermost orbital where the very best energy orbital is contained. The orbital acts as an electron donor, while the lowest unoccupied molecular orbital (LUMO) is that orbital with the lowest unoccupied energy level which acts as the electron receiver [23]. HOMO–LUMO energy levels are collectively referred to as the frontier orbits. HOMO and LUMO refer to the Highest Occupied Molecular Orbital and the Lowest Unoccupied Molecular Orbital, respectively. According to the front-line orbit theory, the two are collectively referred to as front-line orbits, and the electrons in the front-line orbits are called front-line electrons. The energy difference between HOMO and LUMO is called the “band gap”, also called the HOMO–LUMO level. Sometimes it can be used to measure whether a molecule is quickly excited. The smaller the band gap, the more efficiently the molecule is excited. The stability of a molecule is determined by the HOMO–LUMO gap, which is known as the dissimilarity in energy between the HOMO and LUMO of the molecule [24]. A large HOMO–LUMO gap means high molecule stability in chemical reactions, while a small HOMO–LUMO gap means low stability. Thus, the HOMO–LUMO gap may be defined mathematically as [25]:
Δ E = E L O M O E H O M O ,
where Δ E is the Energy gap, E L O M O is the Energy of LUMO and E H O M O is the Energy of HOMO.
Their energy difference is a vital stability indicator. The larger the negative value, the higher the molecular stability and the lower the reactivity; the smaller the negative value, the lower the molecular stability and the higher the reactivity. In the calculation process, we used the DMol3 module of Materials Studio. The DMol3 module selects-orbitals in properties and HOMO and LUMO for calculation. After the calculation, we opened the analysis dialogue and select orbitals. We saw the results of HOMO and LUMO and then clicked import to see HOMO and LUMO in the model. When viewing the calculation results of the electron cloud for the HOMO and LUMO orbitals in the analysis, there are two colours, blue and yellow, by default. HOMO uses blue and red in this article, while LUMO uses green and yellow. However, the two-color electron cloud does not represent HOMO and LUMO but the positive or negative sign of the wave function. Because the electron cloud is the square of the wave function, in order to distinguish the sign of the wave function, the electron cloud of two colors is introduced here. Figure 4 shows the distribution of HOMO–LUMO electron clouds of four molecules of PAI, PET, PEI and PI. In the figure, HOMO uses blue and red in the figure, representing the wave function’s positive and negative signs, respectively. LUMO uses green and yellow, representing the positive and negative signs of the wave function, respectively. Table 2 shows the calculated results of HOMO and LUMO and the energy difference in DMol3 modules of PAI, PET, PEI and PI.
The more significant the energy gap between HOMO and LUMO, the greater the energy reduction when free atoms become molecular bonds, and the more difficult it is for electrons to transition from h to l. At the same time, it shows that the more difficult it is for the molecule to undergo chemical changes, the more stable the molecule is. The transition of electrons from HOMO to LUMO is most likely in the whole atomic or molecular system. The energy required for any other transition is greater than the energy gap between HOMO and LUMO. The more effective the HOMO–LUMO gap, the greater the energy of the light that the electrons need to absorb for the transition from HOMO to LUMO, and the shorter the absorption wavelength. Therefore, this transition is less likely to occur, or the probability of occurrence is very low, and the chemical activity is also lower. From Table 2, we can see that the HOMO–LUMO energy gaps in the four molecules of PAI, PET, PEI and PI are −0.0805 H, −0.1303 H, and −0.0554 H, −0.0481 H, that is −2.1906 eV, −3.5457 eV, −1.5075 eV, −1.3089 eV. The HOMO–LUMO energy gaps between PET and PAI are bigger, indicating that PET and PAI are less likely to undergo chemical changes than PEI and PI. It also shows that these two molecules are relatively more stable and have better insulating properties. Therefore, when the insulation performance of the enameled wire insulating varnish is relatively high, the two polymer resins of PAI and PET can be selected first, followed by the two resins of PEI or PI.

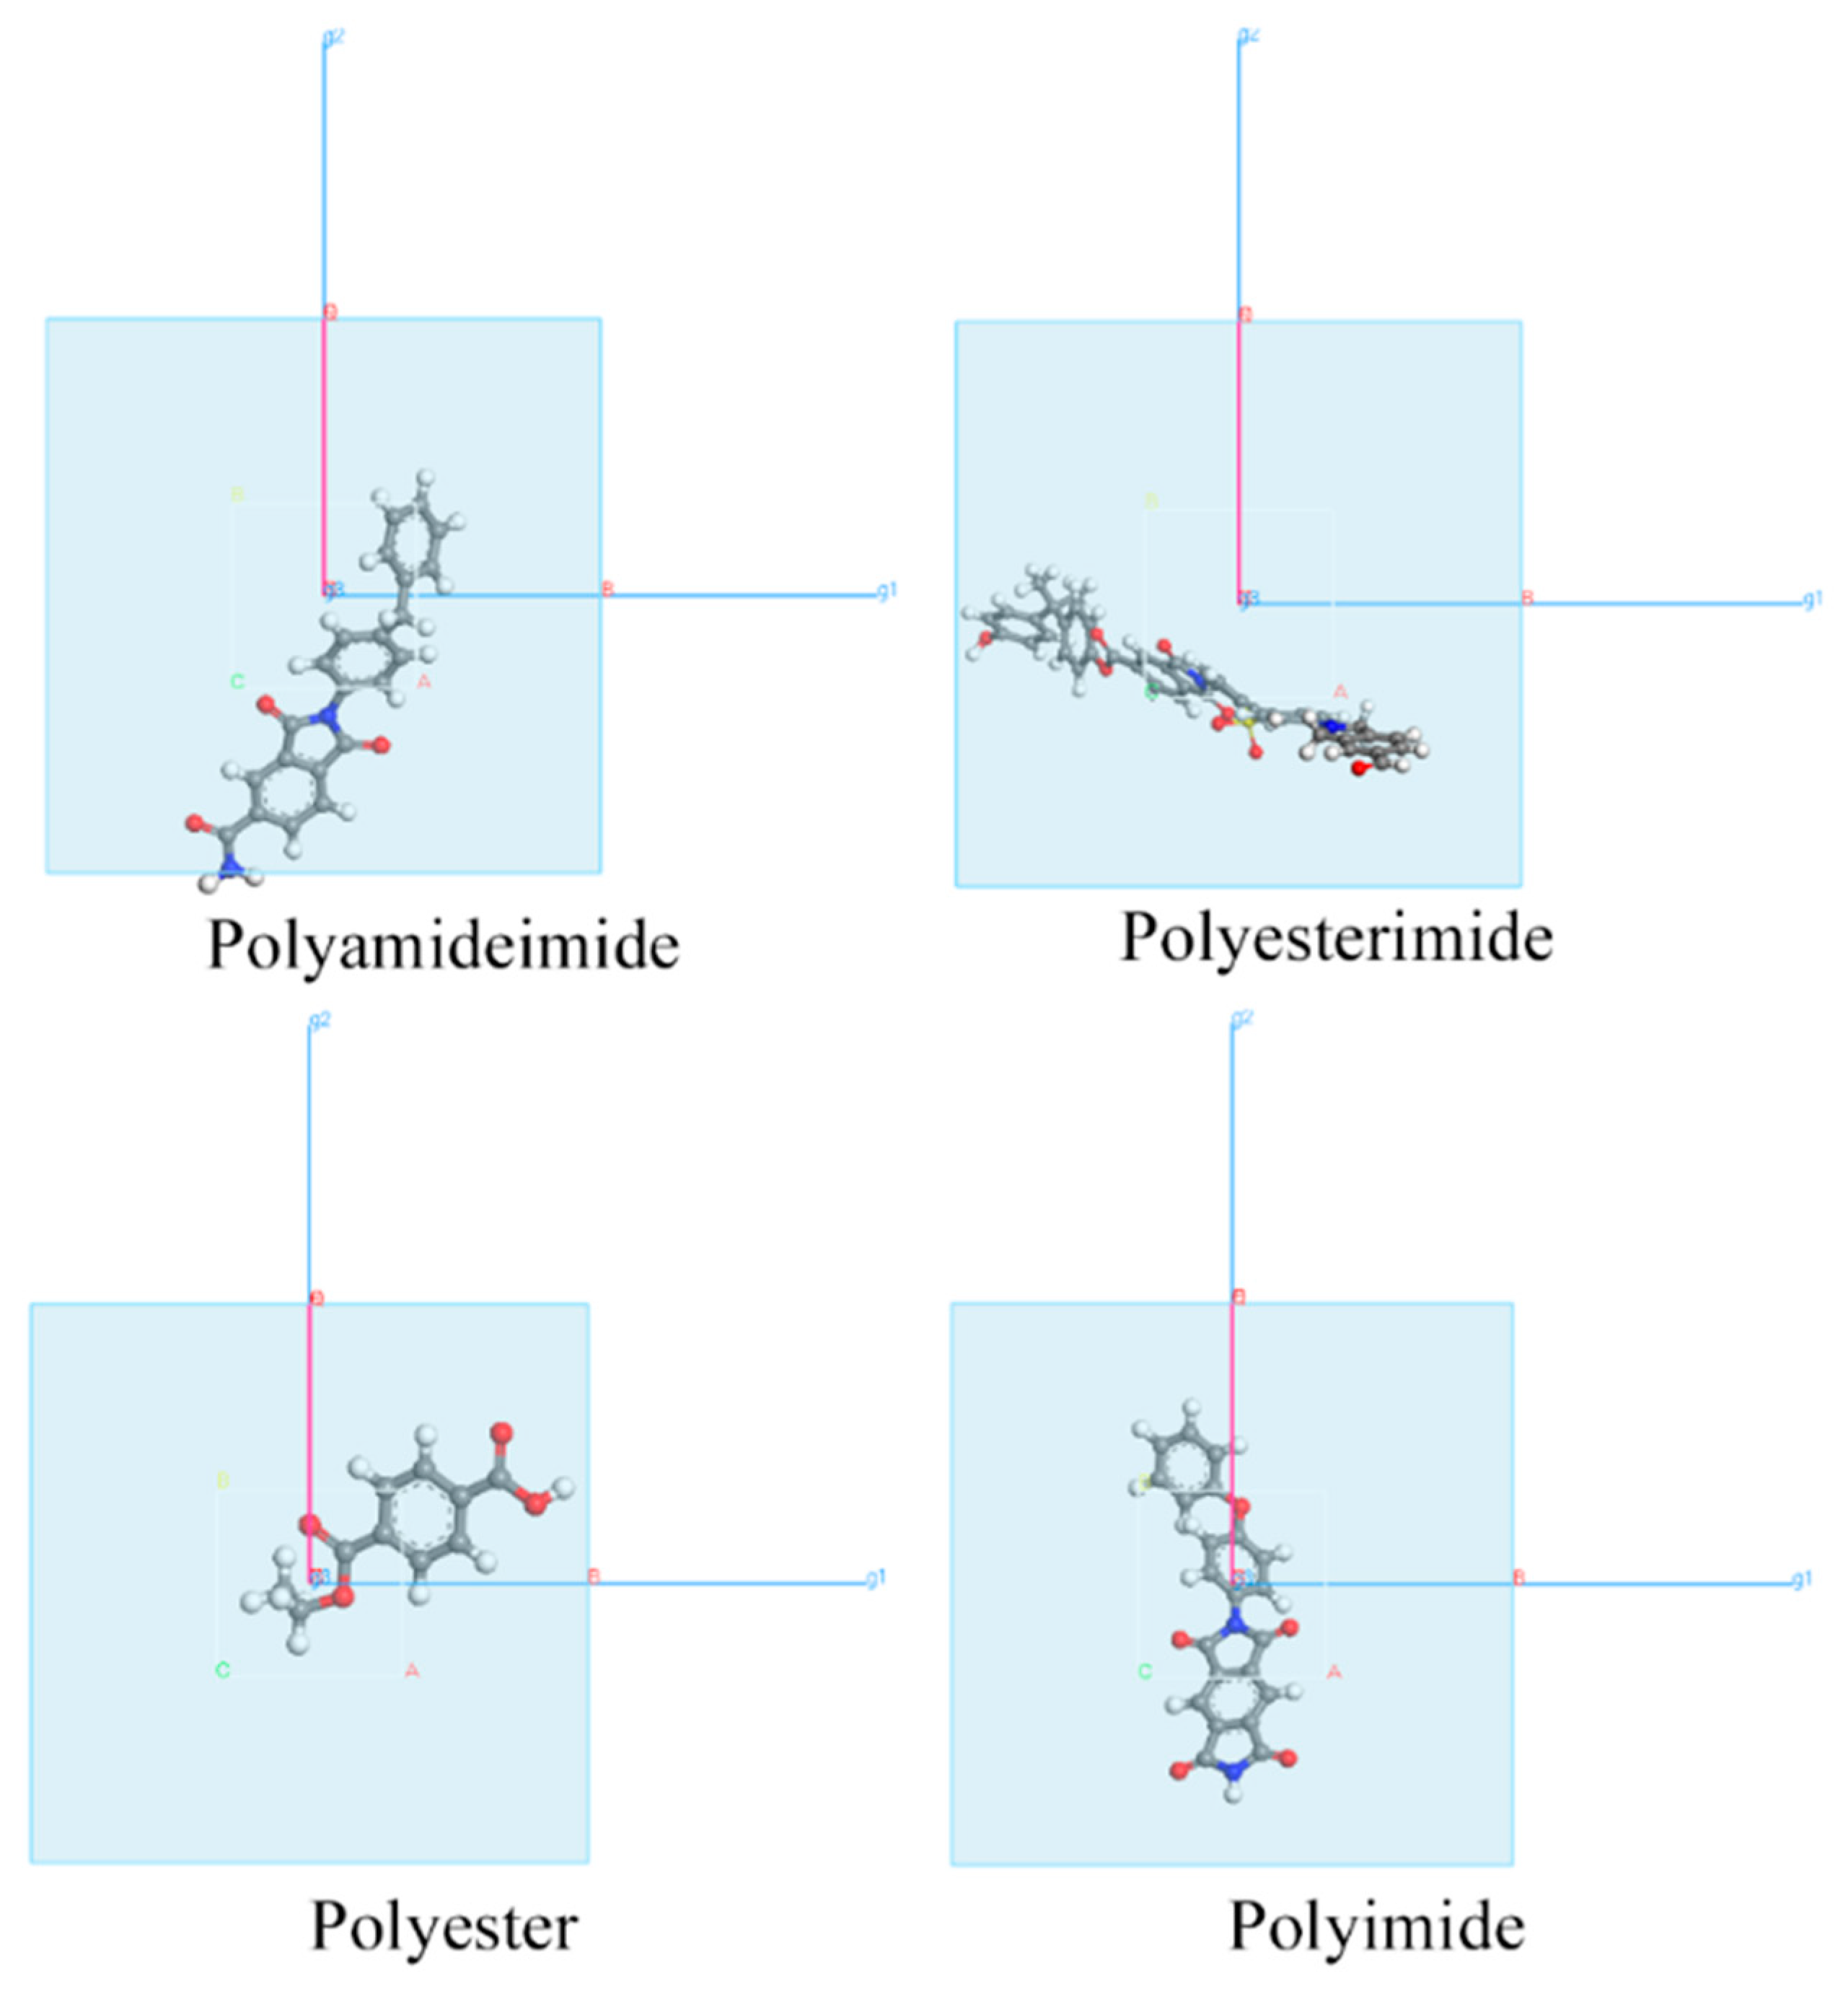
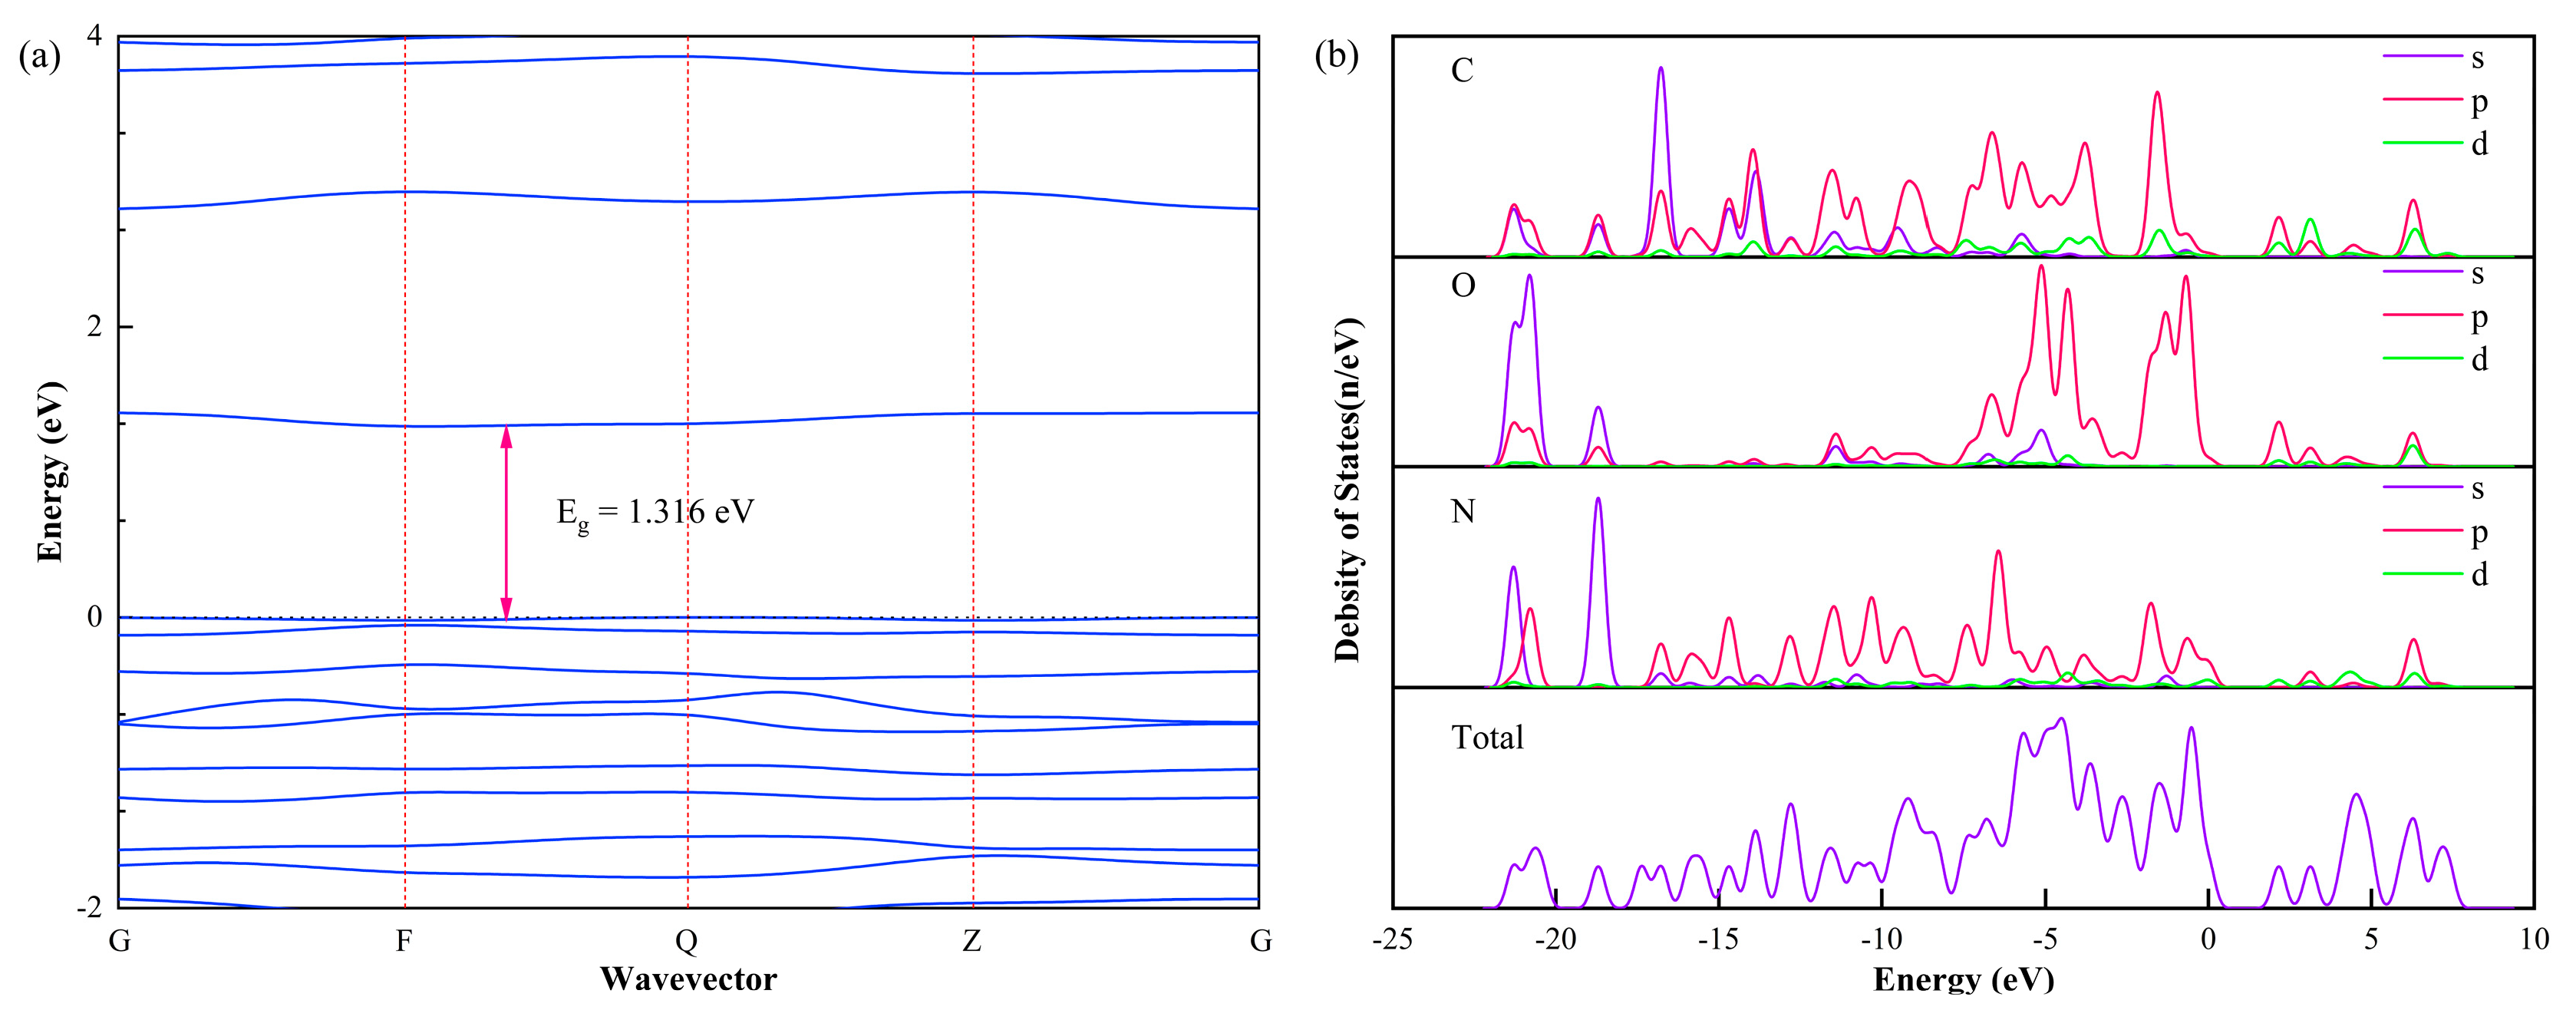
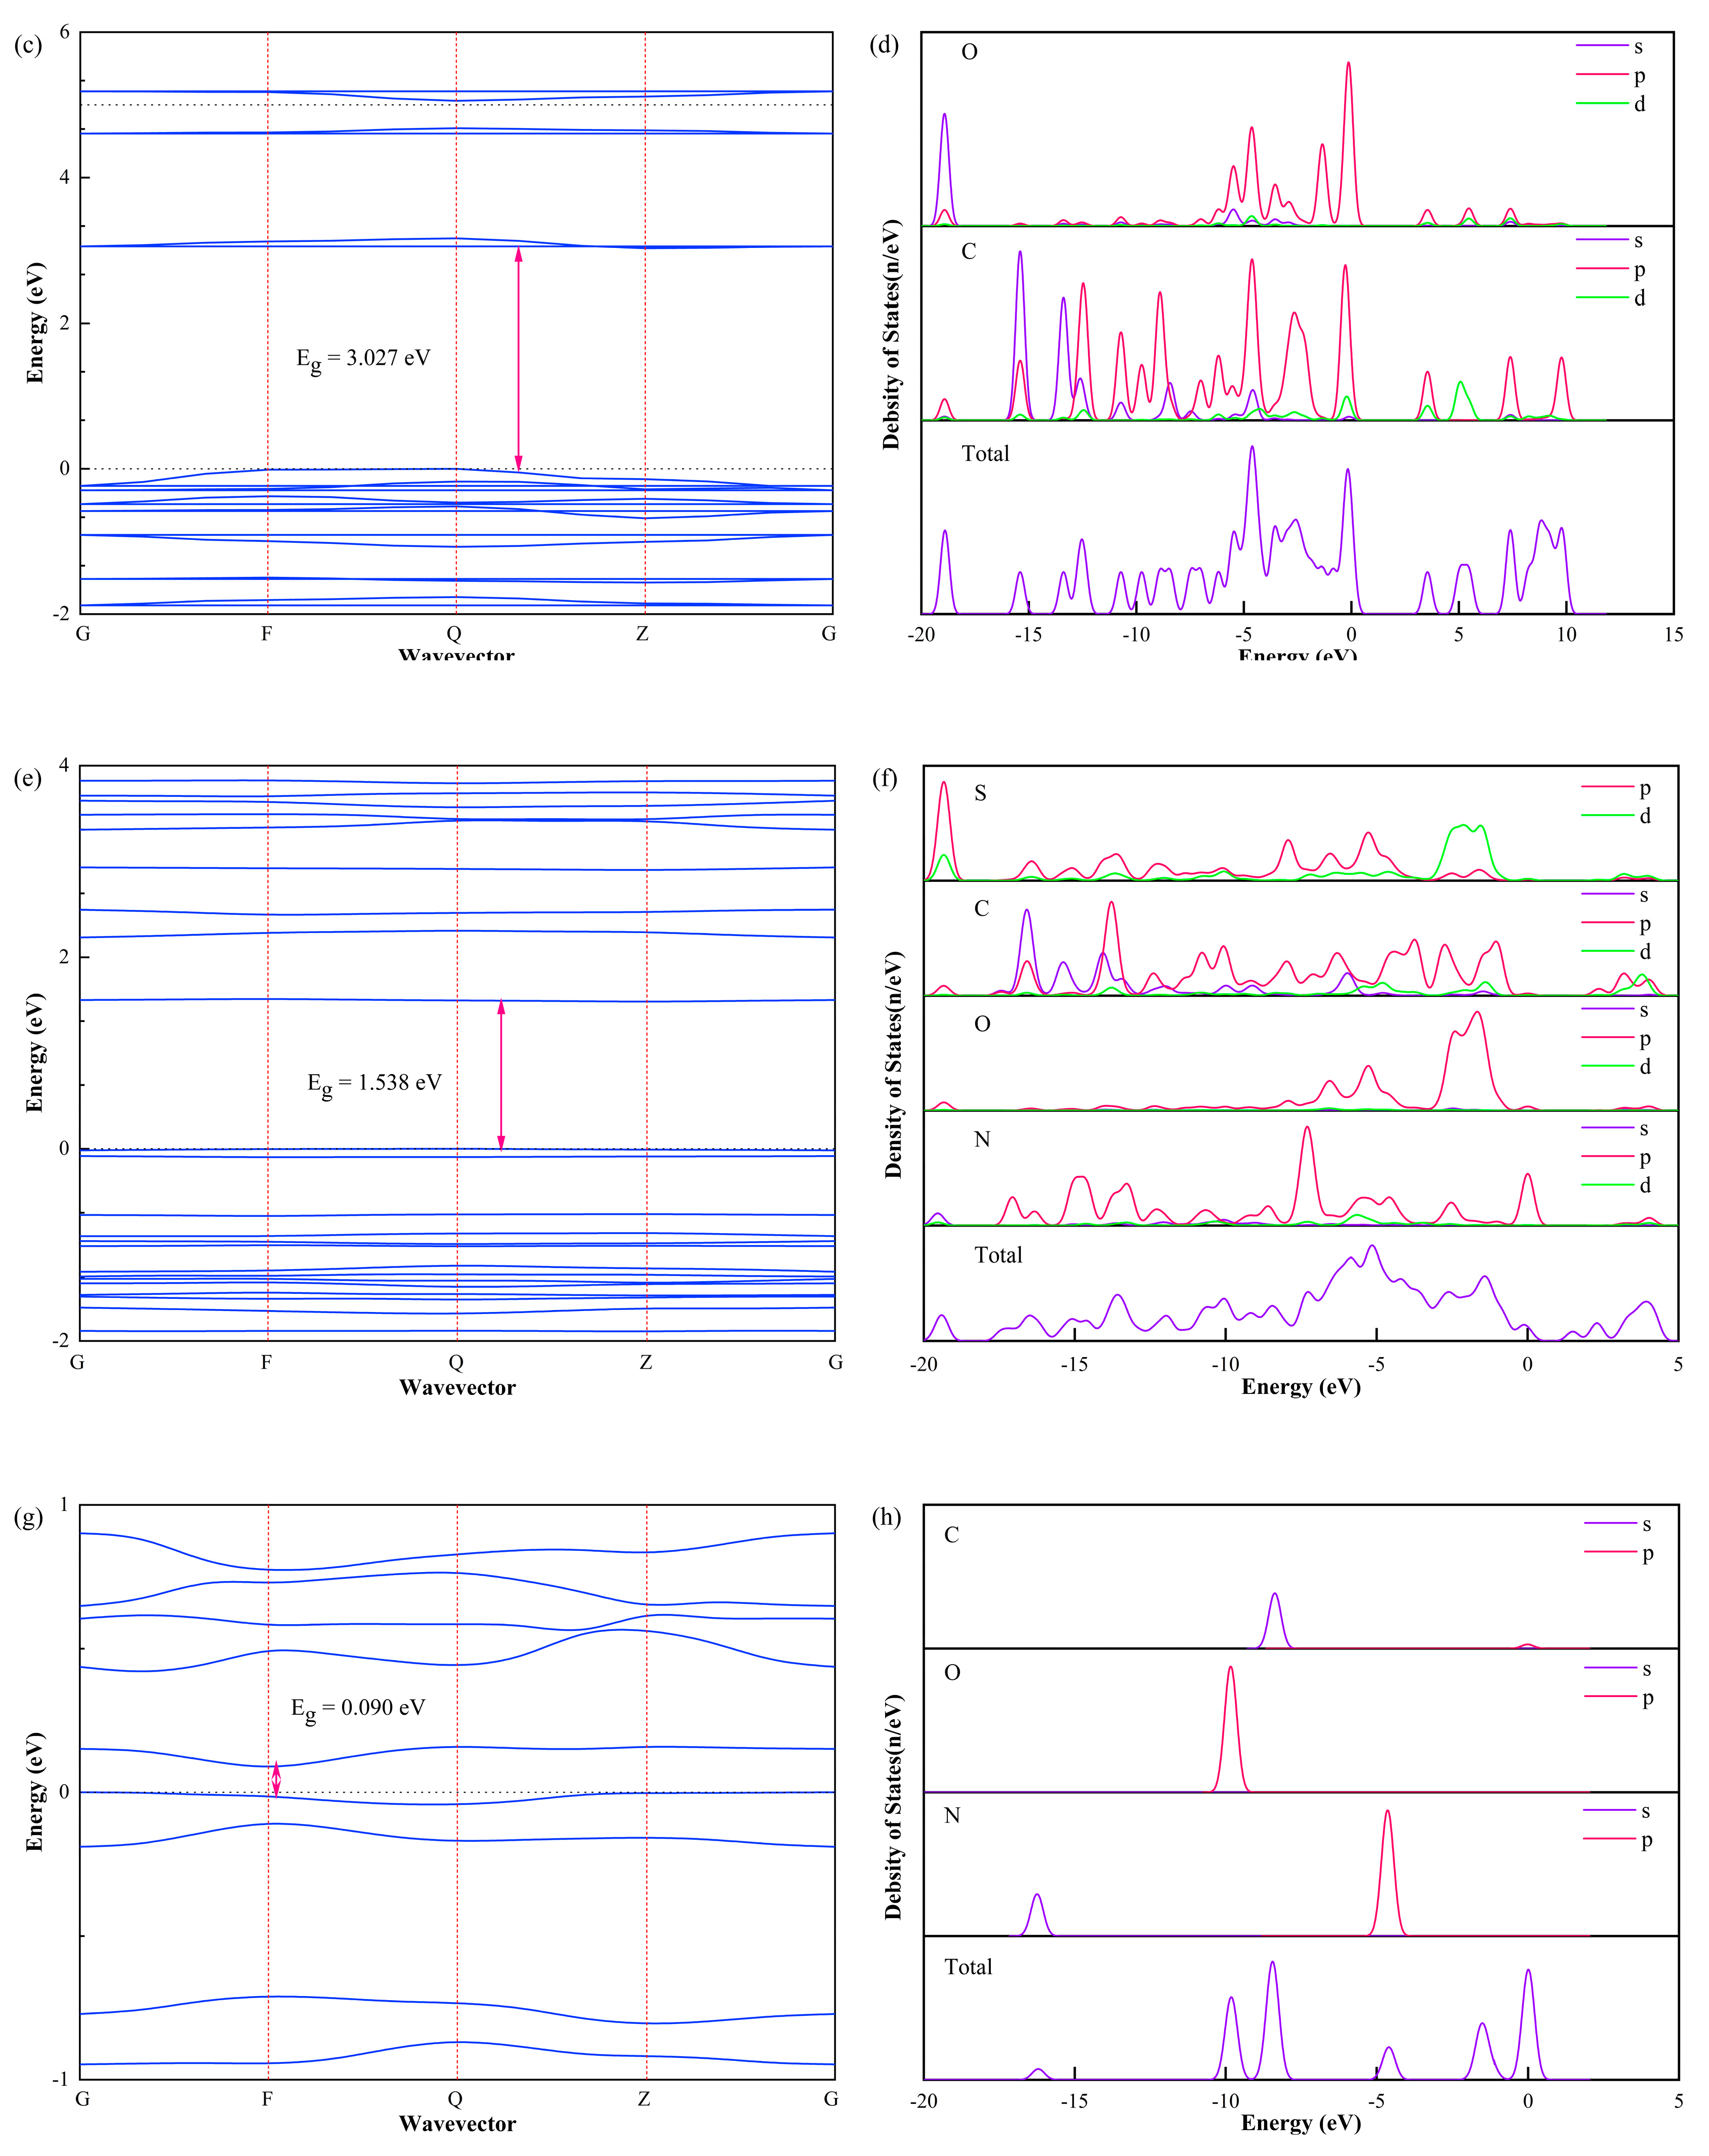
3.3. Band Structure and Density of States

The band structure is an essential part of electronic structure analysis, and we often analyze the band structure of materials in DFT calculations. The region below the Fermi level is called the valence band (VB), and the place where the valence band energy is highest is called the valence band maximum (VBM). The region above the Fermi level is called the conduction band (CB), and the region with the lowest conduction band energy is called the conduction band minimum (CBM). The width between CBM and VBM is called the band gap. We can distinguish material types based on the forbidden bandwidth between the valence band’s top and the conduction band’s bottom. If the forbidden band is 0, it is a metal material; if the forbidden bandwidth exceeds 4.5 ev, it is an insulator, and the material in the middle is a semiconductor. The width of the energy band occupies a significant position in the analysis of the energy band. The wider the energy band, that is, the greater the fluctuation in the energy band diagram, the smaller the effective mass of the electrons in this band, and the greater the degree of non-local and atomic orbitals that make up this energy band—thus, the more scalable the results become. On the contrary, a relatively narrow energy band indicates that the eigenstate corresponding to this energy band mainly consists of atomic orbitals localized to a certain lattice point. The electrons in this band are very localized, and the effective mass is relatively large. The density of states map can reflect the distribution of electrons in each orbital, remember the interaction between atoms, and reveal important information about chemical bonds. There are two forms of the density of states: partial density of states (PDOS) and total density of states (TDOS). If the Fermi energy level is in the interval of the zero DOS value, it means that the system is a semiconductor or an insulator; if a partial wave DOS crosses the Fermi energy level, the system is a metal.
First, a periodic unit cell structure is established for the four molecules—select Band structure in properties in the DMol3 module. Empty bands specify the number of empty bands to be included in the band structure calculation. K-point set specifies the precision of the k-point set with structural calculations. Each precision corresponds to an approximate interval between consecutive k-points on the inverse space path. We set the number of Empty bands to 12 and the default value of Medium for the k-point set of k-point sets. Figure 5 shows the Brillouin zones of four molecules of PAI, PET, PEI and PI. The light blue in the figure represents the reciprocal lattice, the magenta represents the Brillouin zone path, and k-dots represent the corresponding letter in the Brillouin zone path dialogue box.
The ordinate of the energy band diagram is the energy, and when the energy is 0 eV, it represents the Fermi level. Energy below 0 eV represents the valence band, and energy above 0 eV represents the conduction band. The band gap is between the valence band’s highest energy position and the conduction band’s lowest energy position. Material has a direct band gap when the valence band’s tallest and the conduction band’s lowest energy are in the same position. Material has an indirect band gap when the valence band’s highest energy and the conduction band’s lowest energy are not in the same position. Figure 6 is band gap and density of states of PAI, PET, PEI and PI. Figure 6a,c,e,g are the energy band diagrams of four molecules of PAI, PET, PEI and PI; Figure 6b,d,f,h are comparison charts of PDOS and DOS. The figures show the total density of states of each molecule and the partial density of states of the four main constituent elements of the molecule: nitrogen, oxygen, carbon, and sulfur.
As can be seen from the DOS plot, the Fermi levels of the four molecules are all close to 0 but not exactly 0. This shows that most of these four molecules show semiconducting properties. The left side of the Fermi level is the valence band, and the right side is the conduction band. The band gap of PAI is 1.316 eV, the valence band is mainly composed of s and p-orbitals of N, O, and C elements, and the conduction band is primarily formed of p and d orbitals. The band gap of PET is 3.027 eV, and the valence band is comprised mainly of C, and O. The element’s s and p-orbitals are composed, and the conduction band is composed primarily of p and d orbitals. The band gap of PEI is 1.538 eV, and the valence band is composed mainly of the p-orbitals of N, O, and S elements and the s-orbitals of C elements. The conduction band is formed primarily of It is composed of p- and d-orbitals. The band gap of PI is 0.090 eV, and the valence band is mainly composed of s and p-orbitals of N, O, and C elements. For insulating materials, the band gap should be as large as possible. PET has the largest band gap of the four materials, followed by PEI. Therefore, PET and PEI can be preferred when the insulating varnish of the enameled wire has higher insulation performance requirements. The PI molecule has the smallest band gap. In order to improve the insulating properties of the insulating varnish, it is necessary to dope other materials for modification.

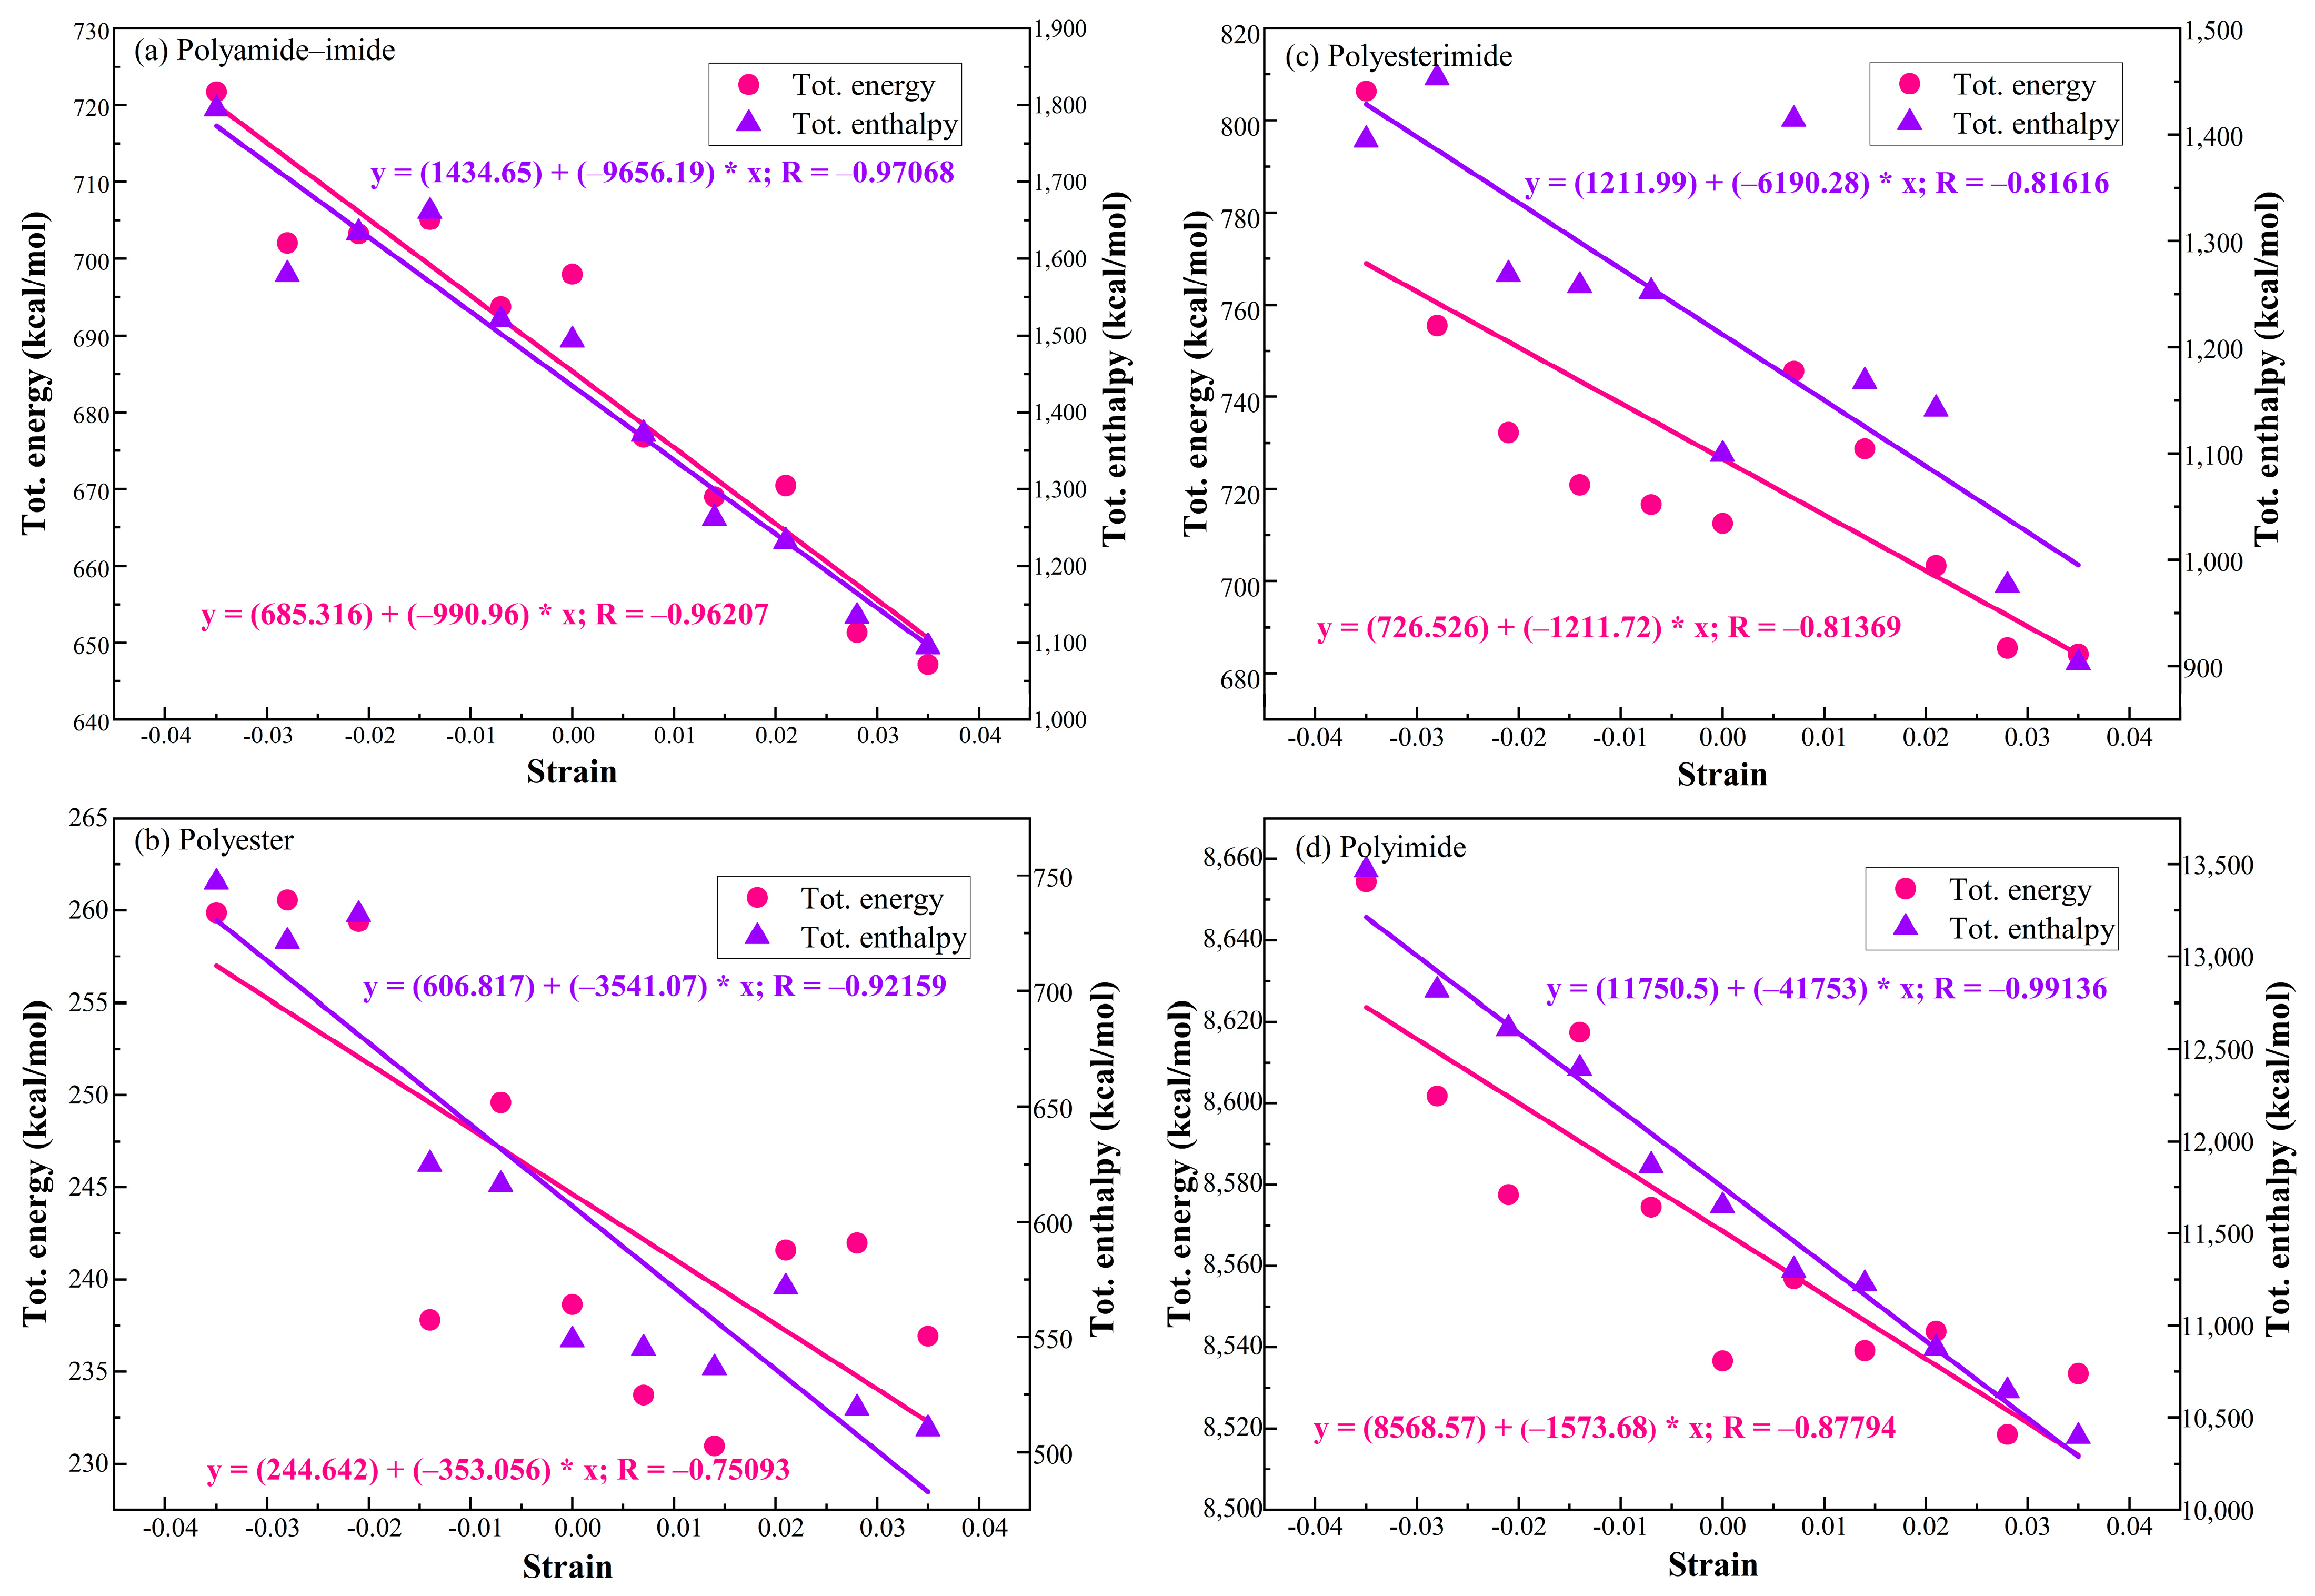
3.4. Dynamics Simulation

Amorphous cell stress–strain curves of four different types of resin molecules are shown in Figure 7. The periodic structure of each molecule is a cube, strain is applied on the Z-Axis, and a strain rate of 0.07% is performed each time. A total of 11 simulations are performed to analyze the mechanical properties of polyimide molecules. It can be seen from the figure that with the gradual stretching of the z-axis, the stress of the material gradually decreases. The abscissa of 0.00 to −0.04 represents a 4% strain in unit cell compression, and 0.00 to −0.04 represents a 4% strain in unit cell tension. Therefore, Figure 8 also shows that the stress of the four amorphous cells increases with the compressive strain and decreases with the growth of tensile strain. However, because of the different molecular types, the fitting degrees of the stress–strain curves of the four materials are different. We can observe that the PI molecule have the best stress–strain fit and the slightest stress change. The other three molecules have a relatively poor fit and an enormous change in stress.
Figure 8 shows the energy–strain curves of the amorphous cell constructed with PAI, PET, PEI and PI. It can be seen from Figure 7 that the total energy and total enthalpy of the four molecules both decrease with c-axis stretching. The abscissa of 0.00 to −0.04 represents a 4% strain in unit cell compression, and 0.00 to −0.04 represents a 4% strain in unit cell tension. Therefore, this also shows that each amorphous cell’s total energy and total enthalpy increase with the increase of compressive strain and decrease with the increase of tensile strain. The Pearson correlation coefficients of total energy and strain for PAI, PEI, PET, and PI are −0.96207, −0.81369, −0.75093, and −0.87794, respectively. It shows that the total energy of the four resin materials negatively correlates with the strain, and the correlation is relatively high. The highest correlation of PAI is −0.96207, indicating that the enameled wire made with polyamide–imide paint has better flexibility than the other three. Secondly, the flexibility of polyimide insulating paint is also better. Therefore, when the flexibility of the enameled wire is more important, the two insulating varnishes, PAI and PI, can be preferred.

4. Conclusions

Enameled wire is one of the keys affecting the development of the electrical industry, especially the development of new motors. According to different purposes of use, selecting the appropriate resin paint to make enameled wire is necessary. Based on density functional theory and molecular dynamics, this paper uses the DMol3 module and Forcite module of Materials Studio to study the effects of different types of insulating resins on the properties of enameled wires. The conclusions are as follows:
Bulleted lists look like this:
  • The absolute value of the adsorption energy of PI and PAI molecules is relatively large, and the adsorption effect is better, so the enameled wire made of PI and PAI has better adhesion performance.
  • The HOMO–LUMO gap between PET and PAI is larger, and the possibility of chemical change is lower than that of PEI and PI, indicating that PET and PAI are more stable.
  • The band gap of PET is the largest among the four materials, followed by PEI, and the band gap of PI molecule is the smallest. Therefore, we can give preference to PET insulating paint when the insulating paint of the enameled wire has high requirements for insulation performance.
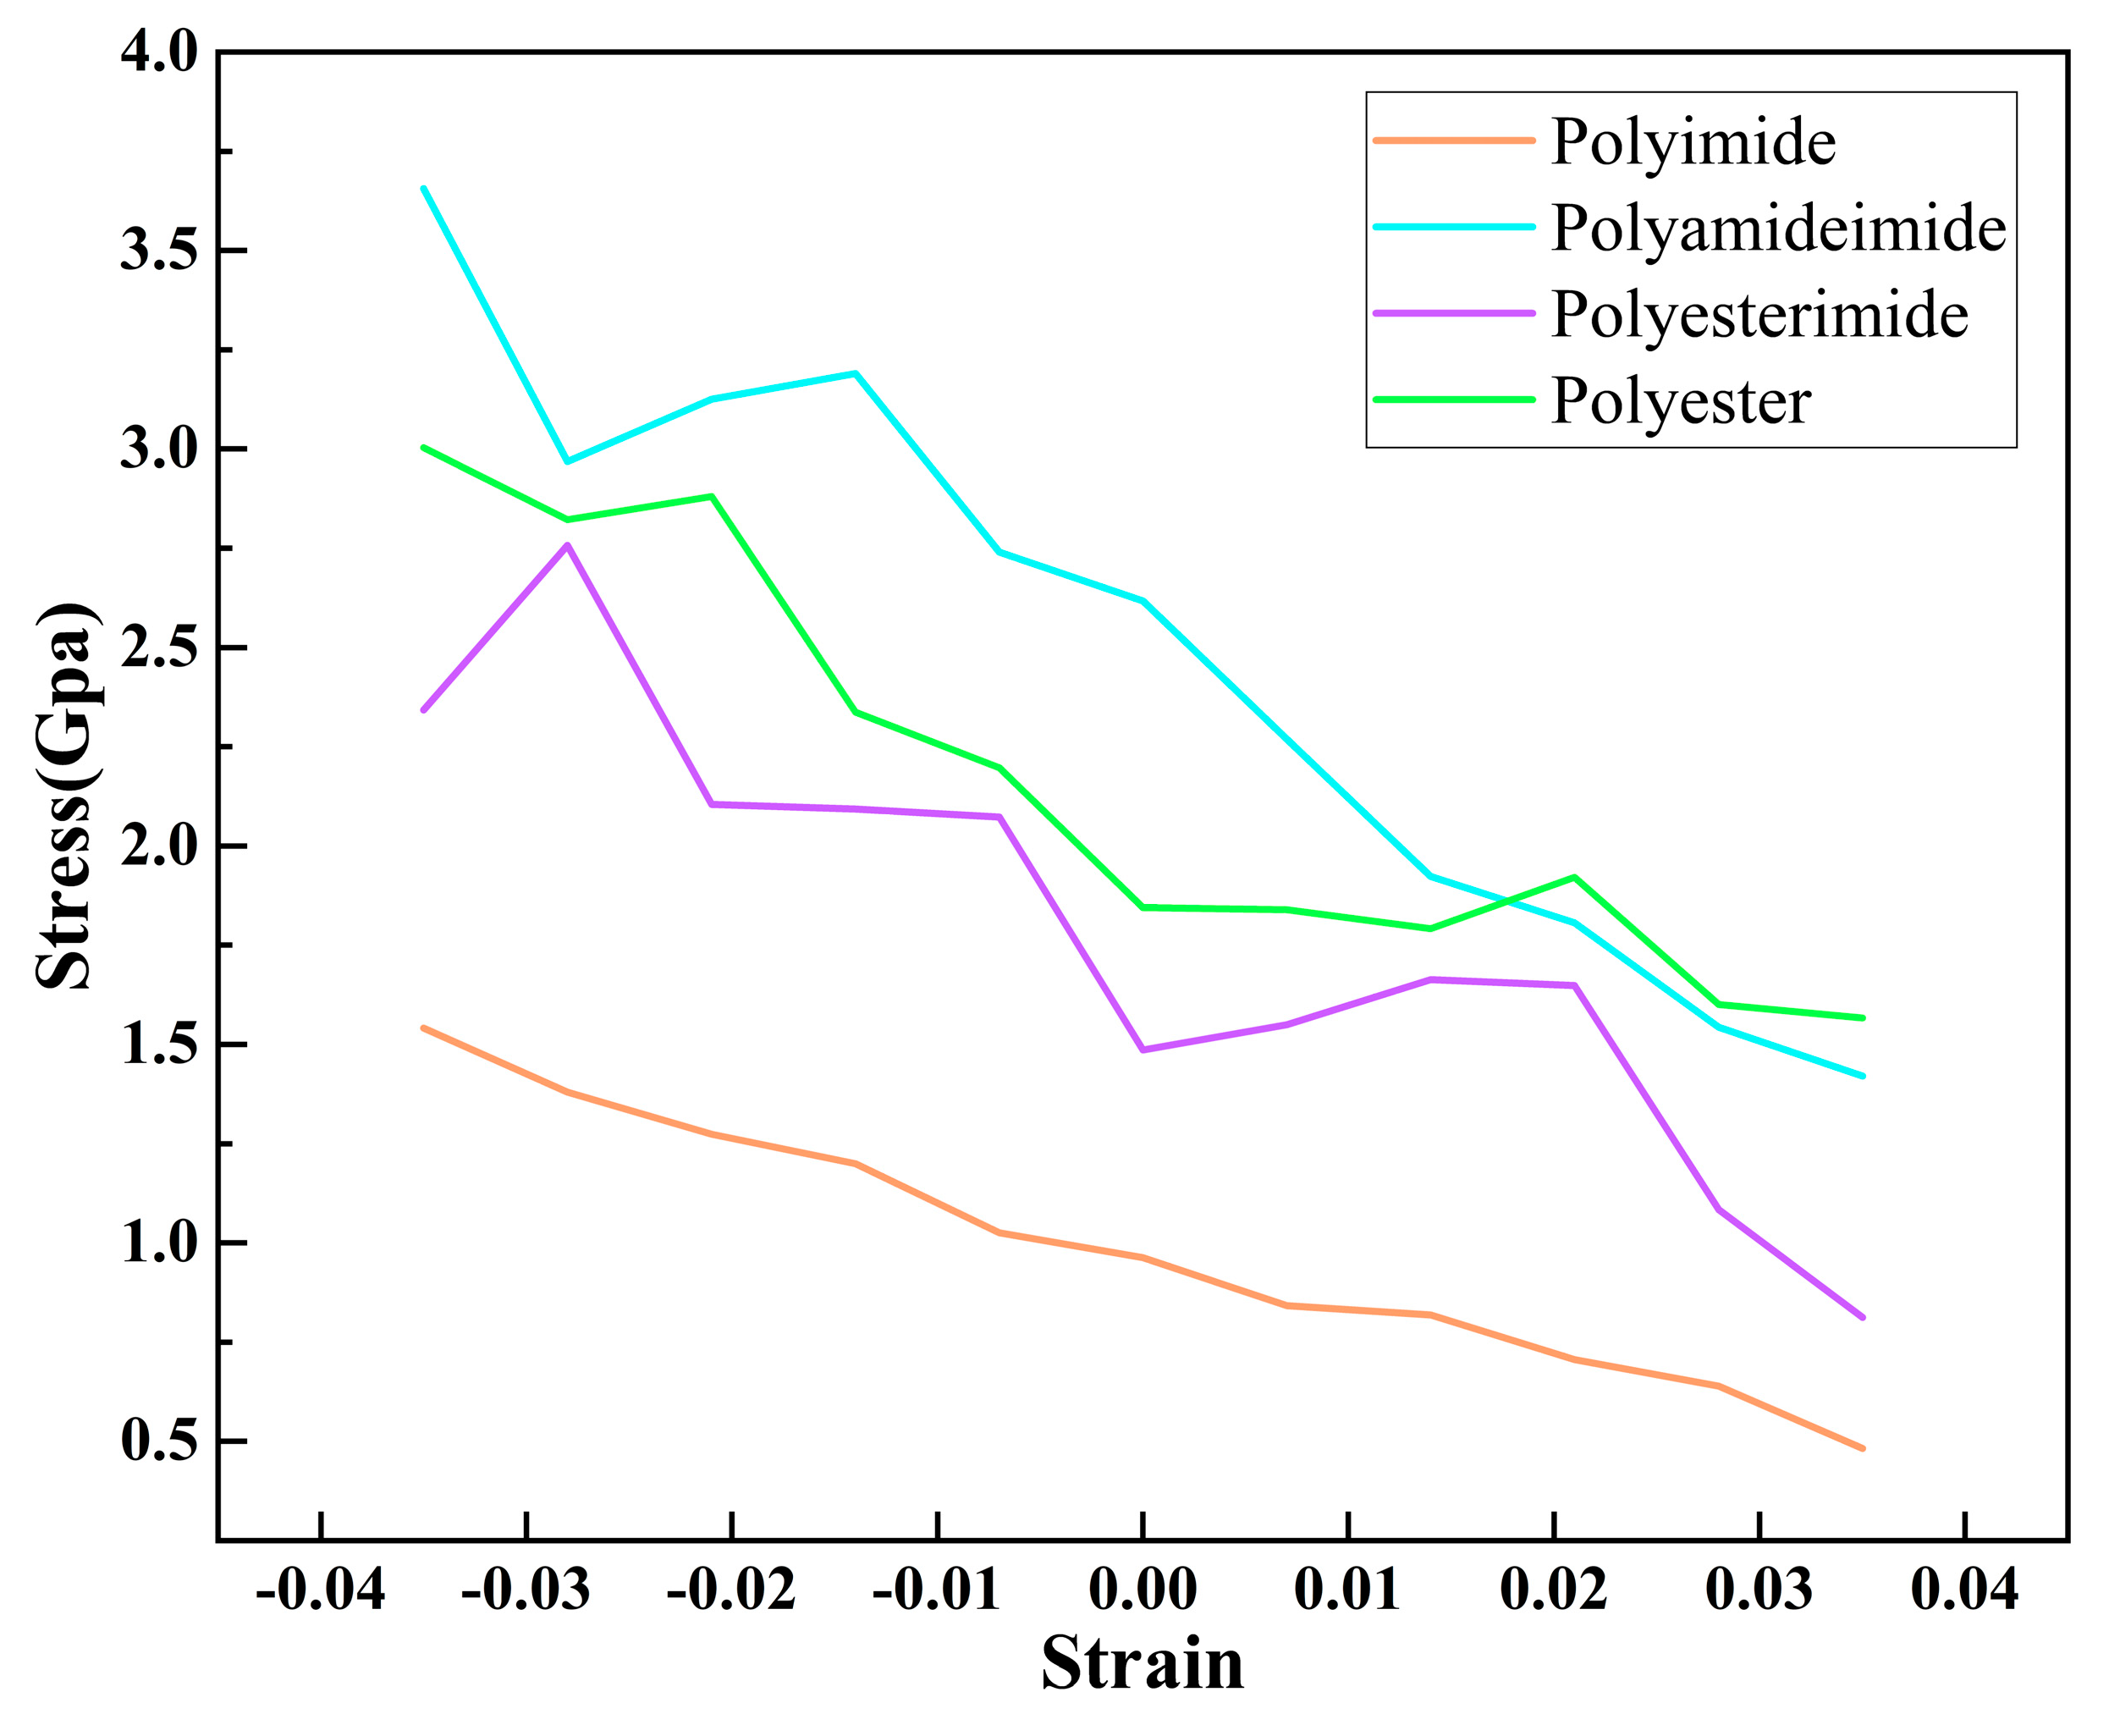
  • The total energy and enthalpy of PAI, PET, PEI, and PI increases with the increase of compressive strain and decrease with the increase of tensile strain. The correlation between energy and strain of PAI and PI is relatively high, and the flexibility of the enameled wire made of PAI and PI resin paint is better than that of PET and PEI.
This paper studied the properties of adhesion, insulation and flexibility of commonly used enameled wire varnishes from the microscopic point of view. The results show that polyester varnish has good insulation performance and flexibility, and polyamide–imide varnish has the best adhesion performance. Furthermore, polyimide insulating varnish’s insulating performance and flexibility are also very reliable. After the above calculations and analyses, we selected two materials for in-depth electrical and chemical experiments. We are now experimenting with modifying insulating resins to design insulating resin coatings with excellent comprehensive properties and improve the reliability and economy of motor and electrical coils.

Author Contributions

Conceptualization, Z.W. and Z.Z.; methodology, Z.Z., H.R., H.Z. and Y.C.; software, Z.Z.; validation, Z.Z.; formal analysis, Z.W. and H.Z.; investigation, Z.Z.; resources, Z.W.; data curation, Z.Z.; writing—original draft preparation, Z.Z.; writing—review and editing, Z.Z., Y.C. and H.R.; visualization, Z.Z.; supervision, Z.W.; project administration, Z.W.; funding acquisition, Z.W. All authors have read and agreed to the published version of the manuscript.

Funding

Supported by National Key Research and Development Program 2018YFB2100100.

Institutional Review Board Statement

Not applicable.

Informed Consent Statement

Not applicable.

Data Availability Statement

Not applicable.

Conflicts of Interest

The authors declare no conflict of interest.

References

  1. Zhang, H.; Liao, H.; Zhang, X.; Ni, J. Preparation and properties of water-soluble thermosetting polyester enamelled wire enamels. Insul. Mater. 2021, 54, 34–38. [Google Scholar]
  2. Yang, Y.; Xu, Y.; Zhang, Q. Research progress of polyimide insulating plastics for enamelled wires. Mod. Plast. Process. Appl. 2017, 29, 60–63. [Google Scholar]
  3. Tan, X.; Fang, M.; Wang, X. Sorption speciation of lanthanides/actinides on minerals by TRLFS, EXAFS and DFT studies: A Review. Molecules 2010, 15, 8431–8468. [Google Scholar] [CrossRef] [PubMed]
  4. Gavini, V.; Bhattacharya, K.; Ortiz, M. Quasi-Continuum Orbital-Free Density-Functional Theory: A route to multi-million atom non-periodic DFT calculation. J. Mech. Phys. Solids 2007, 55, 697–718. [Google Scholar] [CrossRef]
  5. Segall, M.D.; Lindan, P.J.D.; Probert, M.J.; Pickard, C.J.; Hasnip, P.J.; Clark, S.J.; Payne, M.C. First-principles simulation: Ideas, illustrations and the CASTEP code. J. Phys. Condens. Matter 2002, 14, 2717–2744. [Google Scholar] [CrossRef]
  6. Zhao, H.; Yang, Y.; Shu, X.; Wang, Y.; Ran, Q. Adsorption of organic molecules on mineral surfaces studied by first-principle calculations: A review. Adv. Colloid Interface Sci. 2018, 256, 230–241. [Google Scholar] [CrossRef] [PubMed]
  7. Pan, R.; Gu, Y. Application of molecular simulation methods in the study of the relationship between the structure and properties of polyimide. Polym. Mater. Sci. Eng. 2005, 21, 15–19. [Google Scholar]
  8. Yin, J. Molecular Simulation and Characterization of Nano-Hybrid Film Microstructure and Electrical Properties. Ph.D. Thesis, Harbin University of Science and Technology, Harbin, China, 2006. [Google Scholar]
  9. Li, K.; Li, N.; Yan, N.; Wang, T.; Zhang, Y.; Song, Q.; Li, H. Adsorption of Small Hydrocarbons on Pristine, N-Doped and vacancy graphene by DFT study. Appl. Surf. Sci. 2020, 515, 146028. [Google Scholar] [CrossRef]
  10. Rath, S.S.; Sinha, N.; Sahoo, H.; Das, B.; Mishra, B.K. Molecular modeling studies of oleate adsorption on iron oxides. Appl. Surf. Sci. 2014, 295, 115–122. [Google Scholar] [CrossRef]
  11. Liu, J. Molecular Dynamics Simulation of Mechanical Properties and Deformation Mechanisms of Metal Nanocrystalline Materials. Ph.D. Thesis, Jilin University, Changchun, China, 2021. [Google Scholar]
  12. Cai, Y. Research on the Compression and Resilience Performance of Carbon Nanotubes Based on Molecular Dynamics Simulation. Master’s Thesis, Inner Mongolia University of Technology, Hohhot, China, 2021. [Google Scholar]
  13. Ji, D.; Li, T.; Hu, W.; Fuchs, H. Recent progress in aromatic polyimide dielectrics for organic electronic devices and circuits. Adv. Mater. 2019, 31, 1806070. [Google Scholar] [CrossRef] [PubMed]
  14. Diaham, S.; Locatelli, M.L.; Lebey, T.; Dinculescu, S. Dielectric and thermal properties of Polyamide-Imide (PAI) films. In Proceedings of the 2009 IEEE Conference on Electrical Insulation and Dielectric Phenomena, Virginia Beach, VA, USA, 18–21 October 2009; IEEE: Virginia Beach, VA, USA, 2009; pp. 482–485. [Google Scholar]
  15. Diaham, S.; Locatelli, M.-L. Dielectric properties of polyamide-imide. J. Phys. D Appl. Phys. 2013, 46, 185302. [Google Scholar] [CrossRef]
  16. Petitgas, B.; Seytre, G.; Gain, O.; Boiteux, G.; Royaud, I.; Serghei, A.; Gimenez, A.; Anton, A. High temperature aging of enamelled copper wire—Relationships between chemical structure and electrical behavior. In Proceedings of the 2011 Annual Report Conference on Electrical Insulation and Dielectric Phenomena, Cancun, Mexico, 16–19 October 2011; IEEE: Cancun, Mexico, 2011; pp. 84–88. [Google Scholar]
  17. Murray, T. New Technology of Polyamide-Imide Wire Enamels. The P.D. George company: St. Louis, MO, USA. Available online: elantas.com (accessed on 15 July 2022).
  18. Gibbs, J.W. Elementary Principles in Statistical Mechanics Developed with Especial Reference to the Rational Foundation of Thermodynamics. Available online: https://www.ams.org/journals/bull/1906-12-04/S0002-9904-1906-01319-2/ (accessed on 17 July 2022).
  19. Ataman, E.; Andersson, M.P.; Ceccato, M.; Bovet, N.; Stipp, S.L.S. Functional group adsorption on calcite: I. Oxygen containing and nonpolar organic molecules. J. Phys. Chem. C 2016, 120, 16586–16596. [Google Scholar] [CrossRef]
  20. Ataman, E.; Andersson, M.P.; Ceccato, M.; Bovet, N.; Stipp, S.L.S. Functional group adsorption on calcite: II. Nitrogen and sulfur containing organic molecules. J. Phys. Chem. C 2016, 120, 16597–16607. [Google Scholar] [CrossRef]
  21. First-Principles Investigation of the Lattice Vibrations in the Alkali Feldspar Solid Solution. Available online: https://link.springer.com/article/10.1007/s00269-014-0715-8 (accessed on 16 July 2022).
  22. Braga, L.S.; Leal, D.H.S.; Kuca, K.; Ramalho, T.C. Perspectives on the role of the Frontier Effective-for-Reaction Molecular Orbital (FERMO) in the study of chemical reactivity: An updated review. Curr. Org. Chem. 2020, 24, 314–331. [Google Scholar] [CrossRef]
  23. Chidiebere, C.W.; Duru, C.E.; Mbagwu, J.C. Application of computational chemistry in chemical reactivity: A review. J. Niger. Soc. Phys. Sci. 2021, 3, 292–297. [Google Scholar] [CrossRef]
  24. Yang, Y.; Sun, A.; Eslami, M. A Density functional theory study on detection of amphetamine drug by silicon carbide nanotubes. Phys. E Low-Dimens. Syst. Nanostruct. 2021, 125, 114411. [Google Scholar] [CrossRef]
  25. Hussain, R.; Saeed, M.; Yasir Mehboob, M.; Ullah Khan, S.; Khan, M.U.; Adnan, M.; Ahmed, M.; Iqbal, J.; Ayub, K. Density functional theory study of palladium cluster adsorption on a graphene support. RSC Adv. 2020, 10, 20595–20607. [Google Scholar] [CrossRef] [PubMed]
Figure 1. Structural formulas of the four polymers [13,14,15,16,17].
Coatings 12 01352 g001
Figure 2. The optimized structure of PAI, PEI, PET and PI polymer monomers.
Coatings 12 01352 g002
Figure 3. Top view of adsorption sites for PAI, PEI, PET and PI.
Coatings 12 01352 g003
Figure 4. HOMO and LUMO electron cloud distributions for PAI, PET, PEI, and PI.
Coatings 12 01352 g004
Figure 5. Brillouin zones for PAI, PET, PEI and PI.
Coatings 12 01352 g005
Figure 6. Band gap and Density of States of Polyamide–imide: (a) band structure; (b) PDOS and DOS; Band gap and Density of States of Polyester: (c) band structure; (d) PDOS and DOS; Band gap and Density of States of Polyesterimide: (e) band structure; (f) PDOS and DOS; Band gap and Density of States of Polyimide: (g) band structure; (h) PDOS and DOS.
Coatings 12 01352 g006aCoatings 12 01352 g006b
Figure 7. Amorphous cell stress–strain curves for PAI, PET, PEI, and PI.
Coatings 12 01352 g007
Figure 8. Amorphous cell energy–strain curves for PAI, PET, PEI and PI.
Coatings 12 01352 g008
Table 1. The adsorption energy calculation process and results of PAI, PET, PEI and PI.
Types E molecule   E surface   E molecule - surface   E adsorption  
Polyamide–imide−741,827.337 −247,235,809.960 −247,977,765.974 −128.677
Polyester−431,390.392 −98,820,241.886 −99,251,749.028 −116.750
Polyesterimide−1,783,765.813 −36,597,135.761 −38,381,021.702 −120.128
Polyimide−892,885.203 −148,690,935.521 −149,583,956.785 −136.061
Unit: kcal/mol.
Table 2. HOMO, LUMO and Energy gap of PAI, PET, PEI and PI.
TypesHOMO [eV]LUMO [eV] Δ E [eV]
Polyamide–imide−5.5431 −3.3525 −2.1906
Polyester−6.4111 −2.8654 −3.5457
Polyesterimide−5.1866 −3.6791 −1.5075
Polyimide−5.3689 −4.0600 −1.3089
Publisher’s Note: MDPI stays neutral with regard to jurisdictional claims in published maps and institutional affiliations.

