Next Article in Journal
Dynamics of Colloidal Mixture of Cu-Al2O3/Water in an Inclined Porous Channel Due to Mixed Convection: Significance of Entropy Generation
Next Article in Special Issue
Protective Cr Coatings with ZrO2/Cr Multilayers for Zirconium Fuel Claddings
Previous Article in Journal
A Facile Way to Modify Polyester Fabric to Enhance the Adhesion Behavior to Rubber
Previous Article in Special Issue
Nanoscale Composite Protective Preparation for Cars Paint and Varnish Coatings
 
 
coatings-logo
Article Menu
Article

Oxide Nanostructured Coating for Power Lines with Anti-Icing Effect

by
Andrey Vladimirovcih Blinov
1,
Dmitry Aleksandrovich Kostyukov
1,
Maria Anatolevna Yasnaya
1,
Pavel Aleksandrovich Zvada
1,
Lyudmila Pavlovna Arefeva
2,
Valery Nikolaevich Varavka
2,
Roman Aleksandrovich Zvezdilin
1,
Alexander Aleksandrovich Kravtsov
1,3,
David Guramievich Maglakelidze
1,
Alexey Borisovich Golik
1,
Alexey Alekseevich Gvozdenko
1,
Natalia Viatcheslavovna Lazareva
4,
Elena Nikolaevna Kushch
4,
Vadim Nikolaevich Goncharov
5,
Maxim Andreevich Kolodkin
1,
Mohammad Ali Shariati
6 and
Andrey Ashotovich Nagdalian
1,7,*
1
Department of Physics and Technology of Nanostructures and Materials, North Caucasus Federal University, 355017 Stavropol, Russia
2
Don State Technical University, 344000 Rostov-on-Don, Russia
3
Federal Research Center the Southern Scientific Centre of the Russian Academy of Sciences, Chehova Street 41, 344006 Rostov-on-Don, Russia
4
Economic Security and Auditing Department, North Caucasus Federal University, 355017 Stavropol, Russia
5
Department of Scientific Research, Technological Institute of Service—Branch of the Don State Technical University in Stavropol, 355000 Stavropol, Russia
6
Department of Scientific Research, K.G. Razumovsky Moscow State University of Technologies and Management (The First Cossack University), 109004 Moscow, Russia
7
Saint Petersburg State Agrarian University, 196601 Saint Petersburg, Russia
*
Author to whom correspondence should be addressed.
Coatings 2022, 12(9), 1346; https://doi.org/10.3390/coatings12091346
Submission received: 26 July 2022 / Revised: 8 September 2022 / Accepted: 9 September 2022 / Published: 16 September 2022
(This article belongs to the Special Issue Protective Composite Coatings: Implementation, Structure, Properties)

Abstract

:
This paper presents the results of the development of a technology to obtain a nanostructured coating for the protection of overhead wires and the possibility of their application in the electric power industry. The paper provides an analysis of available data on methods of combating ice in different countries, ways to protect the surface of metals from environmental influences, and new materials used for protection. We studied the possibility of using a protective nanostructured coating to protect overhead wires. A technology for obtaining a protective nanostructured coating based on silicon oxide and methods for applying it to the wire of overhead lines are proposed. The analysis of the elemental composition and surface morphology of overhead line wires with protective coating is carried out by scanning electron microscopy. The influence of the nanostructured coating on the high-frequency signal bandwidth and wire resistance using a PCIe-6351 data acquisition board, equipped with a BNC-2120 terminal module generating a frequency signal were determined using the National Instruments LabVIEW software package. The subject of the study was a 110 kV overhead power line with a protective coating developed in this work. By analyzing the calculation, we obtained the operating requirements of the developed nanostructured coating. As a result, we developed a protective coating satisfying the working conditions and investigated its properties. In the final phase of the experiment, we tested the electrical characteristics of overhead wires with the developed protective coating.

1. Introduction

Electricity is an essential resource for a prosperous life. It is impossible to imagine our civilization without electricity: economic and social progress would be relegated to the past and our daily lives completely transformed. Electrical power has become universal. As we know, electricity is transmitted from power plants to homes by power lines; by wires. This poses a problem—in wet and cold regions of the world, where temperatures reach negative values, wires become frosted, which leads to a decrease in electrophysical and mechanical properties and the breaking of power lines [1,2].
There are several solutions to solve this problem. For example, the most common one is to heat the wires using higher than the rated current (the Joule effect). The de-icing effect of power lines is achieved by a short-term increase in the current strength or a short-circuiting of the conductor [3,4].
In modern conditions, with an increasing trend towards general savings in the world, the heating of wires is an irrational waste of energy. In this case, it is necessary to seek other approaches for anti-icing. For example, the development of various kinds of protective coatings with hydrophobic properties. Wang et al. (2011) presented a study confirming the economic feasibility of using hydrophobic compositions to protect electrical wires from icing [5].
It is reported that the hydrophobic coating of the aluminum surface of power lines is not able to provide complete protection against ice formation, but significantly delays this process. Menini and Farzaneh (2009) demonstrated a successful surface treatment experience with an anti-icing coating based on poly(tetrafluoroethylene) [6]. The proposed compound provided a wetting contact angle up to 140°. The researchers were able to reduce the ice adhesion by 2.5 times and preserve the hydrophobic properties after several cycles of icing.
Protective coatings are thin films made of various chemical compounds. In particular, coatings based on MnO2/PS composite (manganese oxide polystyrene), ZnO/PS composite (zinc oxide polystyrene), CaCO3 (precipitated calcium carbonate), as well as coatings based on carbon nanotubes, fluorinated silanes, fluoropolymer coatings, SiO2, and composites with other oxides, etc. [7,8,9,10,11,12,13,14,15,16,17].
Of the compounds listed, coatings based on nanoscale oxide materials are the most promising. The anisotropic structure possessed by ceramic materials allows for the formation of strong protective coatings, which is why silicon dioxide-based coatings have received widespread recognition. SiO2 forms a relief structure with low surface energy, which contributes to the creation of a hydrophobic layer [18]. Ligang Xu and Junhui He obtained superhydrophobic coatings based on silicon oxide nanoparticles with a maximum wetting contact edge angle of 156° at a sliding angle of ≤2° and a maximum transmittance of 83.7% [19].
There are many methods to obtain silicon dioxide at the nanoscale: self-assembly method on a substrate [20], sonochemical method [21], magnetron sputtering method [22], and others [23,24]. Among all of the methods, the sol-gel method should be noted, which is economical, simple, and effective. Thus, it is possible to fine-tune the particle size during synthesis, to set the necessary porosity and, in particular, the surface energy [25].
However, to form a film with superhydrophobic properties, it is not enough to use only silicon dioxide. Many studies show that modification of SiO2 with other oxide particles, such as TiO2, ZnO, ZrO2, Fe2O3, etc., is beneficial [26,27,28,29,30]. Therefore, the purpose of this work was to develop a technique to obtain a nanostructured oxide coating to protect power lines from icing, and investigate its elemental composition, morphology, structural and mechanical properties, and practical effectiveness. Consequently, the novelty of the work is associated with:
(1)
the use of nanostructured coating;
(2)
comparison of methods for obtaining a nanostructured coating;
(3)
determination of the optimal number of layers of nanostructured coating;
(4)
evaluation of the effect of nanostructured coating on the mechanical characteristics of power lines.

2. Materials and Methods

2.1. Materials

The following materials were used in the experiment: tetraethoxysilane (LLC “Silan”, Dankov, Russia), ethyl alcohol (LLC “Suvorovsky”, Stavropol, Russia), 25% ammonia (LLC “Metachem”, Moscow, Russia), and distilled water. For the practical approval of the preparation, we used non-heat-treated aluminum alloy ABE (Table 1).

2.2. Synthesis and Technique of Applying a Protective Coating

In this work, we obtained a silicon oxide-based protective coating in two ways, depending on the application technique:
1.
Application of SiO2 nanoparticles sol to the surface of ABE wire. Synthesis of silicon oxide (SiO2) nanoparticles was carried out by the Stober method according to the following method [31]:
A total of 24 mL of distilled water and 65 mL of ethyl alcohol (96%) were injected into a 250 mL round-bottomed flask under constant stirring on a Heidolph MR Hei-Standard magnetic stirrer (“Heidolph Instruments” GmbH & CO. KG, Schwabach, Germany);
(a)
continued heating at 50 °C with the addition of 8 mL of 25% aqueous ammonia solution;
(b)
with constant stirring, 3 mL of tetraethoxysilane solution was slowly added dropwise,
(c)
the resulting sol was stirred for 1 h at 50 °C.
The ABE wire samples were immersed in this solution for 2 min and dried in a drying chamber Oven 125 (“IKA”, Staufen, Germany) at 150 °C for 10 min. After each drying, the mass of the obtained sample was measured. To apply the next layer, the operation was repeated. The number of layers varied from 1 to 5 (Figure 1).
2.
The sequential immersion method, based on alternating stages of applying tetraethoxysilane and ammonia solution (T = 25 °C; τ = 1 min) to the surface of ABE wire [32]. After each stage of immersion, the ABE wire samples were dried in a drying chamber Oven 125 (“IKA”, Germany) at 150 °C for 10 min. To apply the next layer, the operation was repeated. The number of layers varied from 1 to 5 (Figure 2). When the wire is sequentially immersed in a solution of tetraethoxysilane and ammonium hydroxide, a layer of silicon dioxide is formed in accordance with the reaction:
( C 2 H 5 O ) 4 Si + H 2 O NH 4 OH , pH > 7 SiO 2 + 4 C 2 H 5 OH .

Research Methods

Measurements of the size and zeta potential of colloidal SiO2 particles were carried out by acoustic and electroacoustic spectroscopy methods in the DT-1202 analyzer (“Dispersion Technology” Inc., Bedford Hills, NY, USA).
The microstructure and elemental composition of the surface of ABE wire samples were studied by scanning electron microscopy and energy dispersive microanalysis on a MIRA-LMH scanning electron microscope (Tescan, Brno, Czech Republic) with the AZtecEnergy Standard/X-max 20 (standard) elemental composition determination system (Tescan, Brno, Czech Republic) [33].
The study of the structural and mechanical properties of coated wires were carried out on a universal testing machine LabTest 6 (LLC “LABTEST”, Moscow, Russia) using DOLI Test & Motion software (LLC “LABTEST”, Moscow, Russia). Samples of ABE wires were subjected to a tensile test in static loading mode.
To measure the wetting contact angle, we prepared Ø 10 mm aluminum plates, the composition of which corresponded to the composition of the ABE wire. A nanostructured coating based on oxide materials was deposited on a part of the plates by consecutive immersion. The other part of the plates was treated with SiO2 nanoparticles sol. A series of samples with a different number of application cycles of the oxide material-based nanostructured coating was prepared. The number of cycles varied from 1 to 5. The application of a drop of distilled water onto the experimental coating was carried out by an automatic micropipette; the wetting contact angle was measured using the LAUDA Scientific Surface Analyzer 100 device (“LAUDA DR. R. WOBSER” GmbH & CO. KG, Lauda-Königshofen, Germany).
The determination of the effectiveness of oxide coatings under laboratory conditions was carried out in the climate chamber EVCLIM KGH-250 (LLC “ERSTVAK”, Moscow, Russia). Three series of wire samples were placed in a climate chamber at 98% humidity and −40 °C temperature for 24 h; one of the samples was treated with a nanostructured oxide coating developed by sequential immersion in a solution of tetraethoxysilane and ammonia (5 layers); the second sample was coated by immersion in SiO2 nanoparticle sol (5 layers); and the third sample was an uncoated wire (control sample). Then, the samples were removed from the climate chamber and the amount of ice formed was recorded.
All studies were carried out in a five-fold repetition (n = 5). Statistical data processing was carried out in the Statistica 10.0 software (Statsoft, Tulsa, OK, USA). Graphical data processing was carried out in the Origin software (OriginLab, Northampton, MA, USA).
The analysis of the effect of the nanostructured coating on the high-frequency signal was carried out experimentally. The test was conducted on a test bench consisting of a PCIe-6351 signal generation and data acquisition module with a BNC-2120 terminal generating a frequency signal, using the National Instruments LabVIEW software package (“National Instruments” Inc., Austin, TX, USA) [34]. Figure 3 shows the connection diagram of this module with an ABE wire core. Using LabVIEW software, we also developed and wrote a program for the correct operation of the PCIe-6351 module with the BNC-2120 terminal.
The measuring equipment used operates under the control of a program for generating voltage signals of a given shape, amplitude, and frequency, and measuring voltage waveforms, performed in the LabVIEW graphics programming environment, controls the hardware via the DAQmx driver. We used the method of direct estimation of the measured values of stresses at the ends of the experimental sample. Applying the generated voltage to one end of the wire sample, its value is measured at the connection point and at the opposite end of the sample. The voltage is generated with the specified parameters of amplitude, frequency, and initial phase. The measurement of voltage signals is performed continuously for 1 s and is recorded as an array of instantaneous values with a sampling frequency exceeding the frequency of the generated signal by an order of magnitude.
The images of the block diagram panel associated with the program are shown in Figure 4 and Figure 5. Figure 4 shows the first part of the program code for managing the data generation and collection device. The first is the configuration of the analog voltage signal generation channel with the specified parameters of the minimum and maximum levels and the number of the generation channel. Next, the parameters of the continuous signal generation mode are set, as is the number of samples per unit time describing the signal and the selection of the clock source of the signal generator. Figure 5 illustrates the second part of the generation device control code. All operations of this part are performed in a loop by condition and contain three stages. The first one is aimed at forming a sequence of values describing the signal of the required shape, frequency, and amplitude. Then, the generated data array is loaded into the clipboard of the digital-to-analog converter, and the final action is the start of signal generation. When the cycle stops on demand or when an error occurs, generation stops and all settings of the generation device are cleared.
To study the effect of the nanostructured coating on the high-frequency signal, the method of direct estimation of the measured values of stresses at the ends of the experimental sample was used. By applying the generated voltage to one end of the wire sample, its value can be measured at the connection point and at the opposite end of the sample. The voltage is generated with the specified parameters of amplitude, frequency, and initial phase. Voltage signals are measured continuously for 1 s and recorded as an array of instantaneous values with a sampling frequency exceeding the frequency of the generated signal by an order of magnitude. Accordingly, the voltage waveforms at the ends of the sample are measured. Then, the effective voltage values (U1 and U2) and voltage frequencies (f1 and f2) are determined, as well as the voltage drop on the sample ΔU, as the voltage difference (U1–U2). The instrumental measurement error was 1%.

3. Results and Discussion

3.1. Study of SiO2 Nanoparticles

The SiO2 nanoparticles sol obtained by the Stober method was studied by acoustic and electroacoustic spectroscopy. The results of the SiO2 particles size determination and the nature of their size distribution are presented in Figure 6.
As can be seen in Figure 4, the distribution of SiO2 nanoparticles has a unimodal character; the average size of silicon oxide particles is 90 ± 12 nm (the value of the average hydrodynamic radius ± standard deviation). A silicon oxide particle has a small negative charge equal to −0.14 mV.

3.2. Investigation of the Process of Applying Nanostructured Coatings

The synthesized SiO2 nanoparticles sol was applied to the ABE wire surface. During the experiment, we prepared five groups of ABE wire with a different number of layers of SiO2 nanoparticles on the surface. Each group contained five samples. After each SiO2 nanoparticles application cycle, the samples were dried and weighed on analytical scales. 
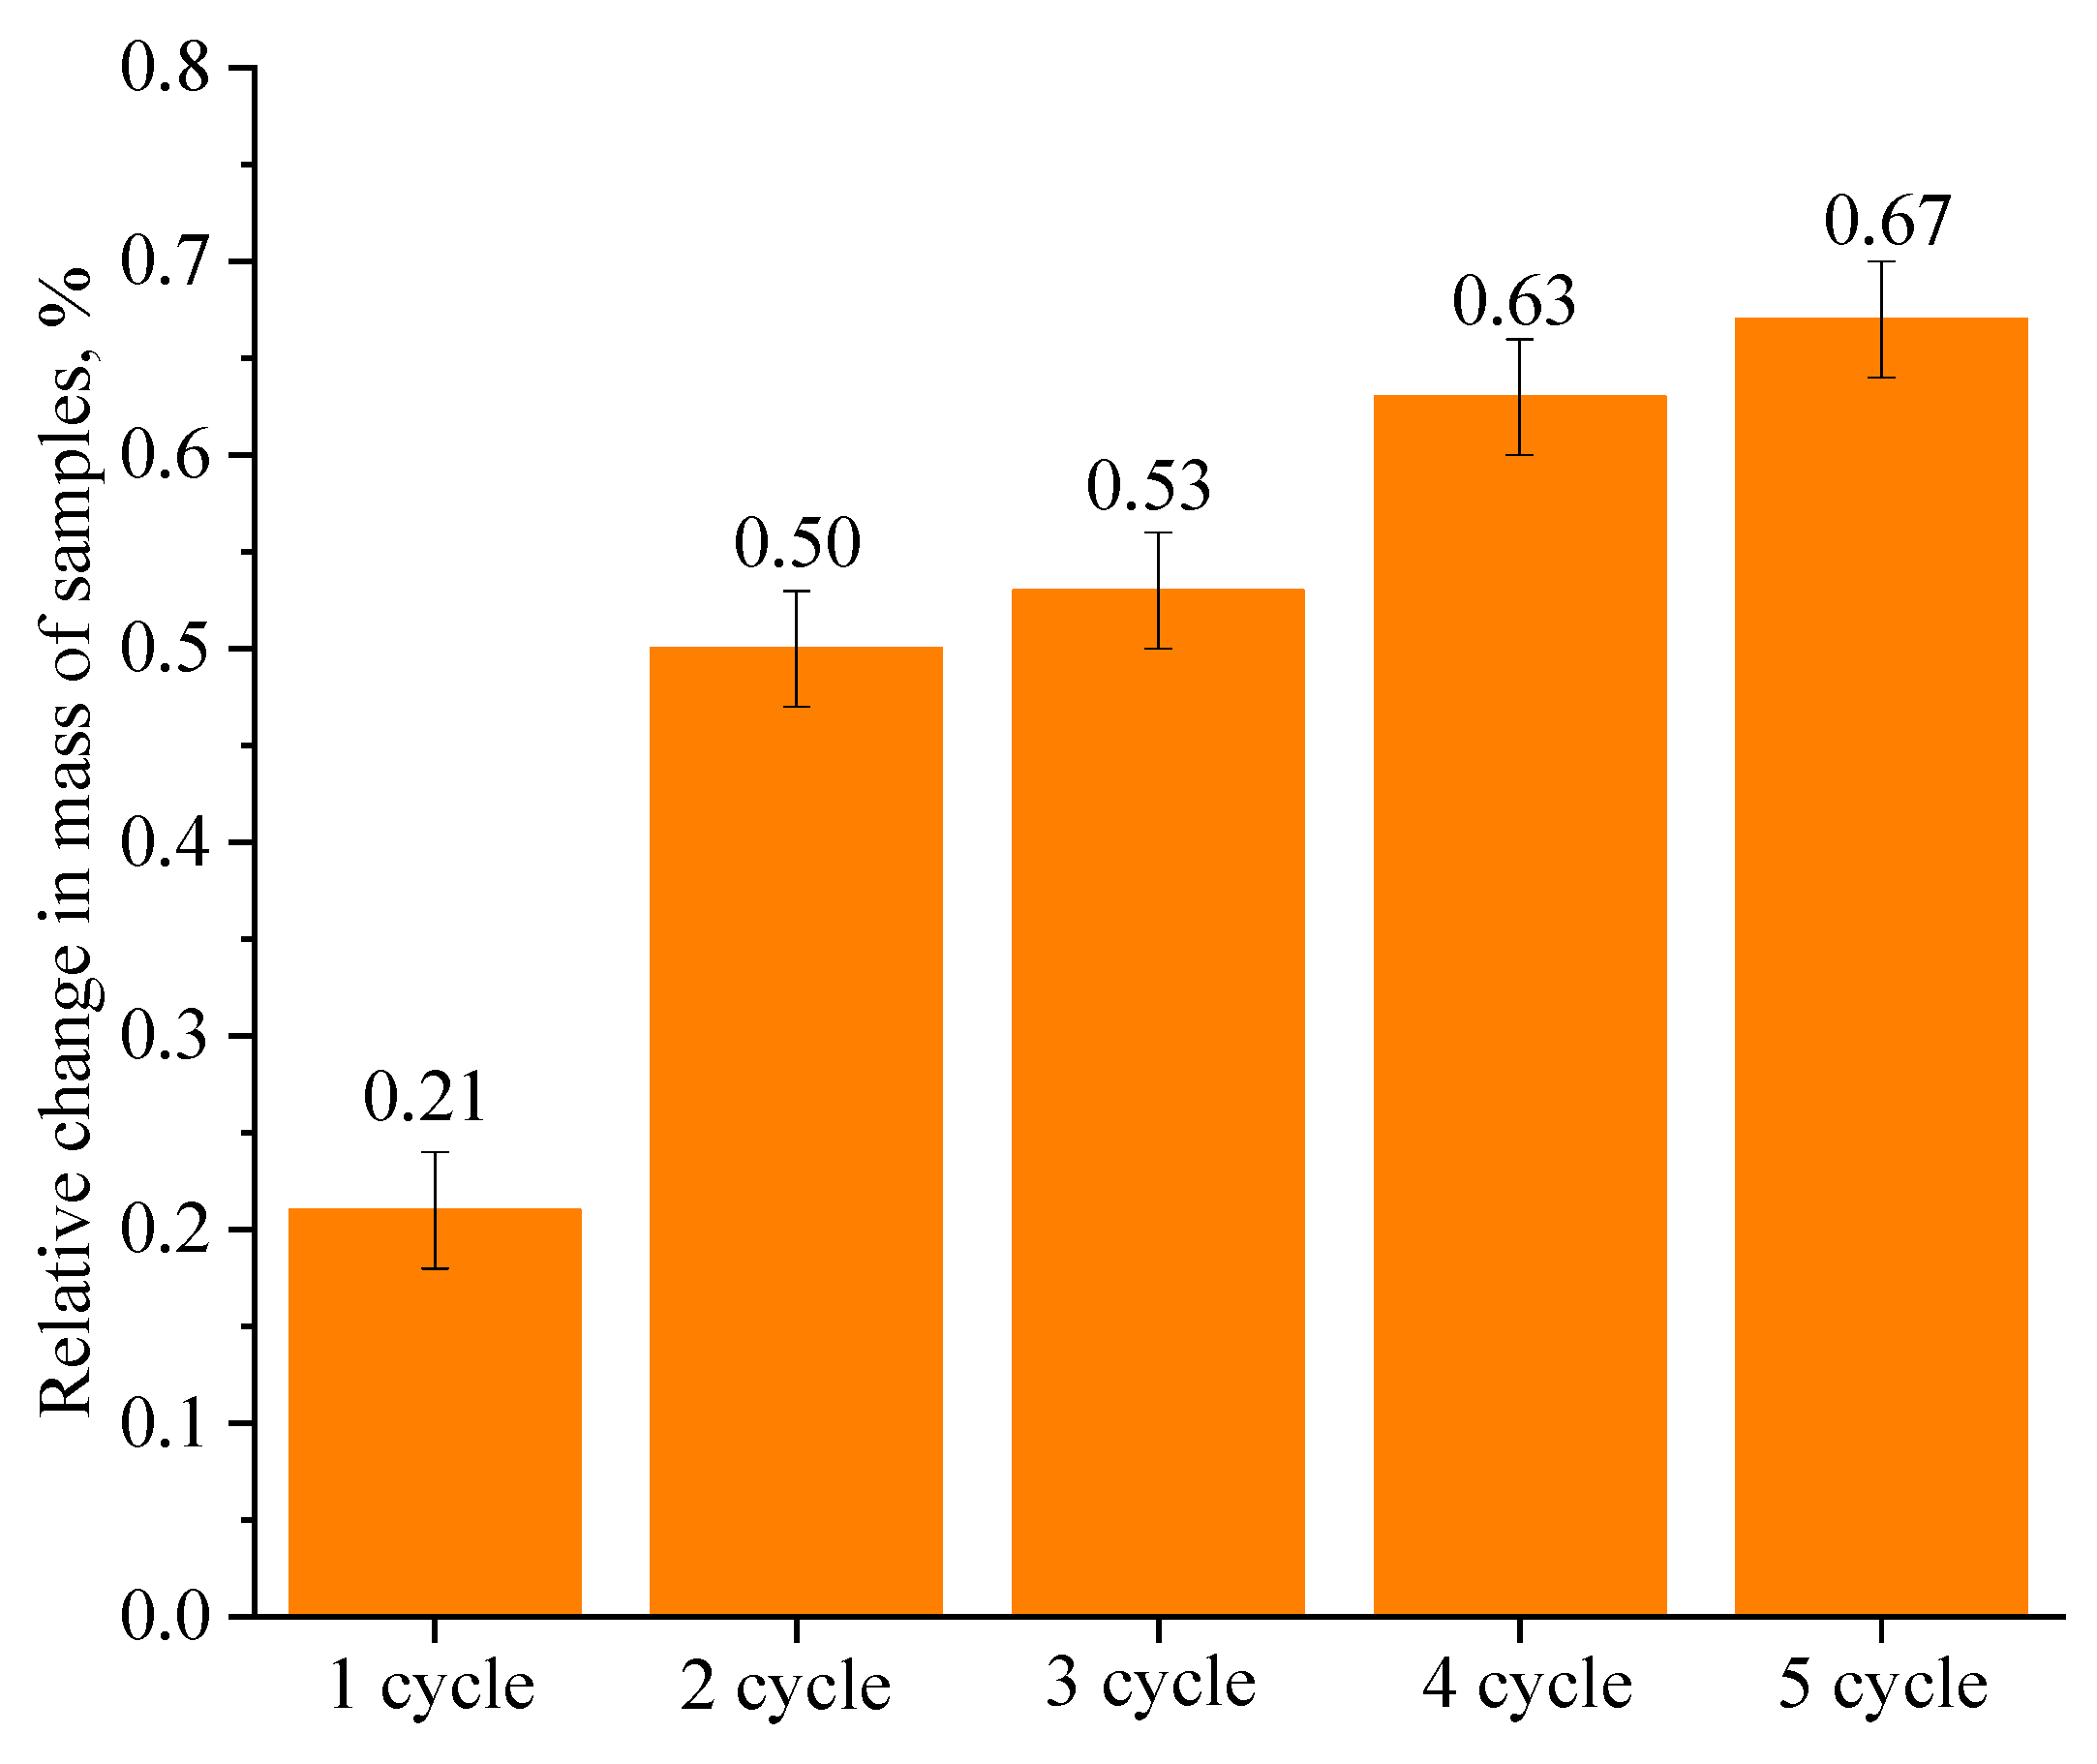
Figure 7 shows a histogram of the relative mass variation (%) of the samples as a function of the number of SiO2 nanoparticles layers deposited.
As can be seen in Figure 7, after each cycle, the mass of the samples increased by 0.13% on average.
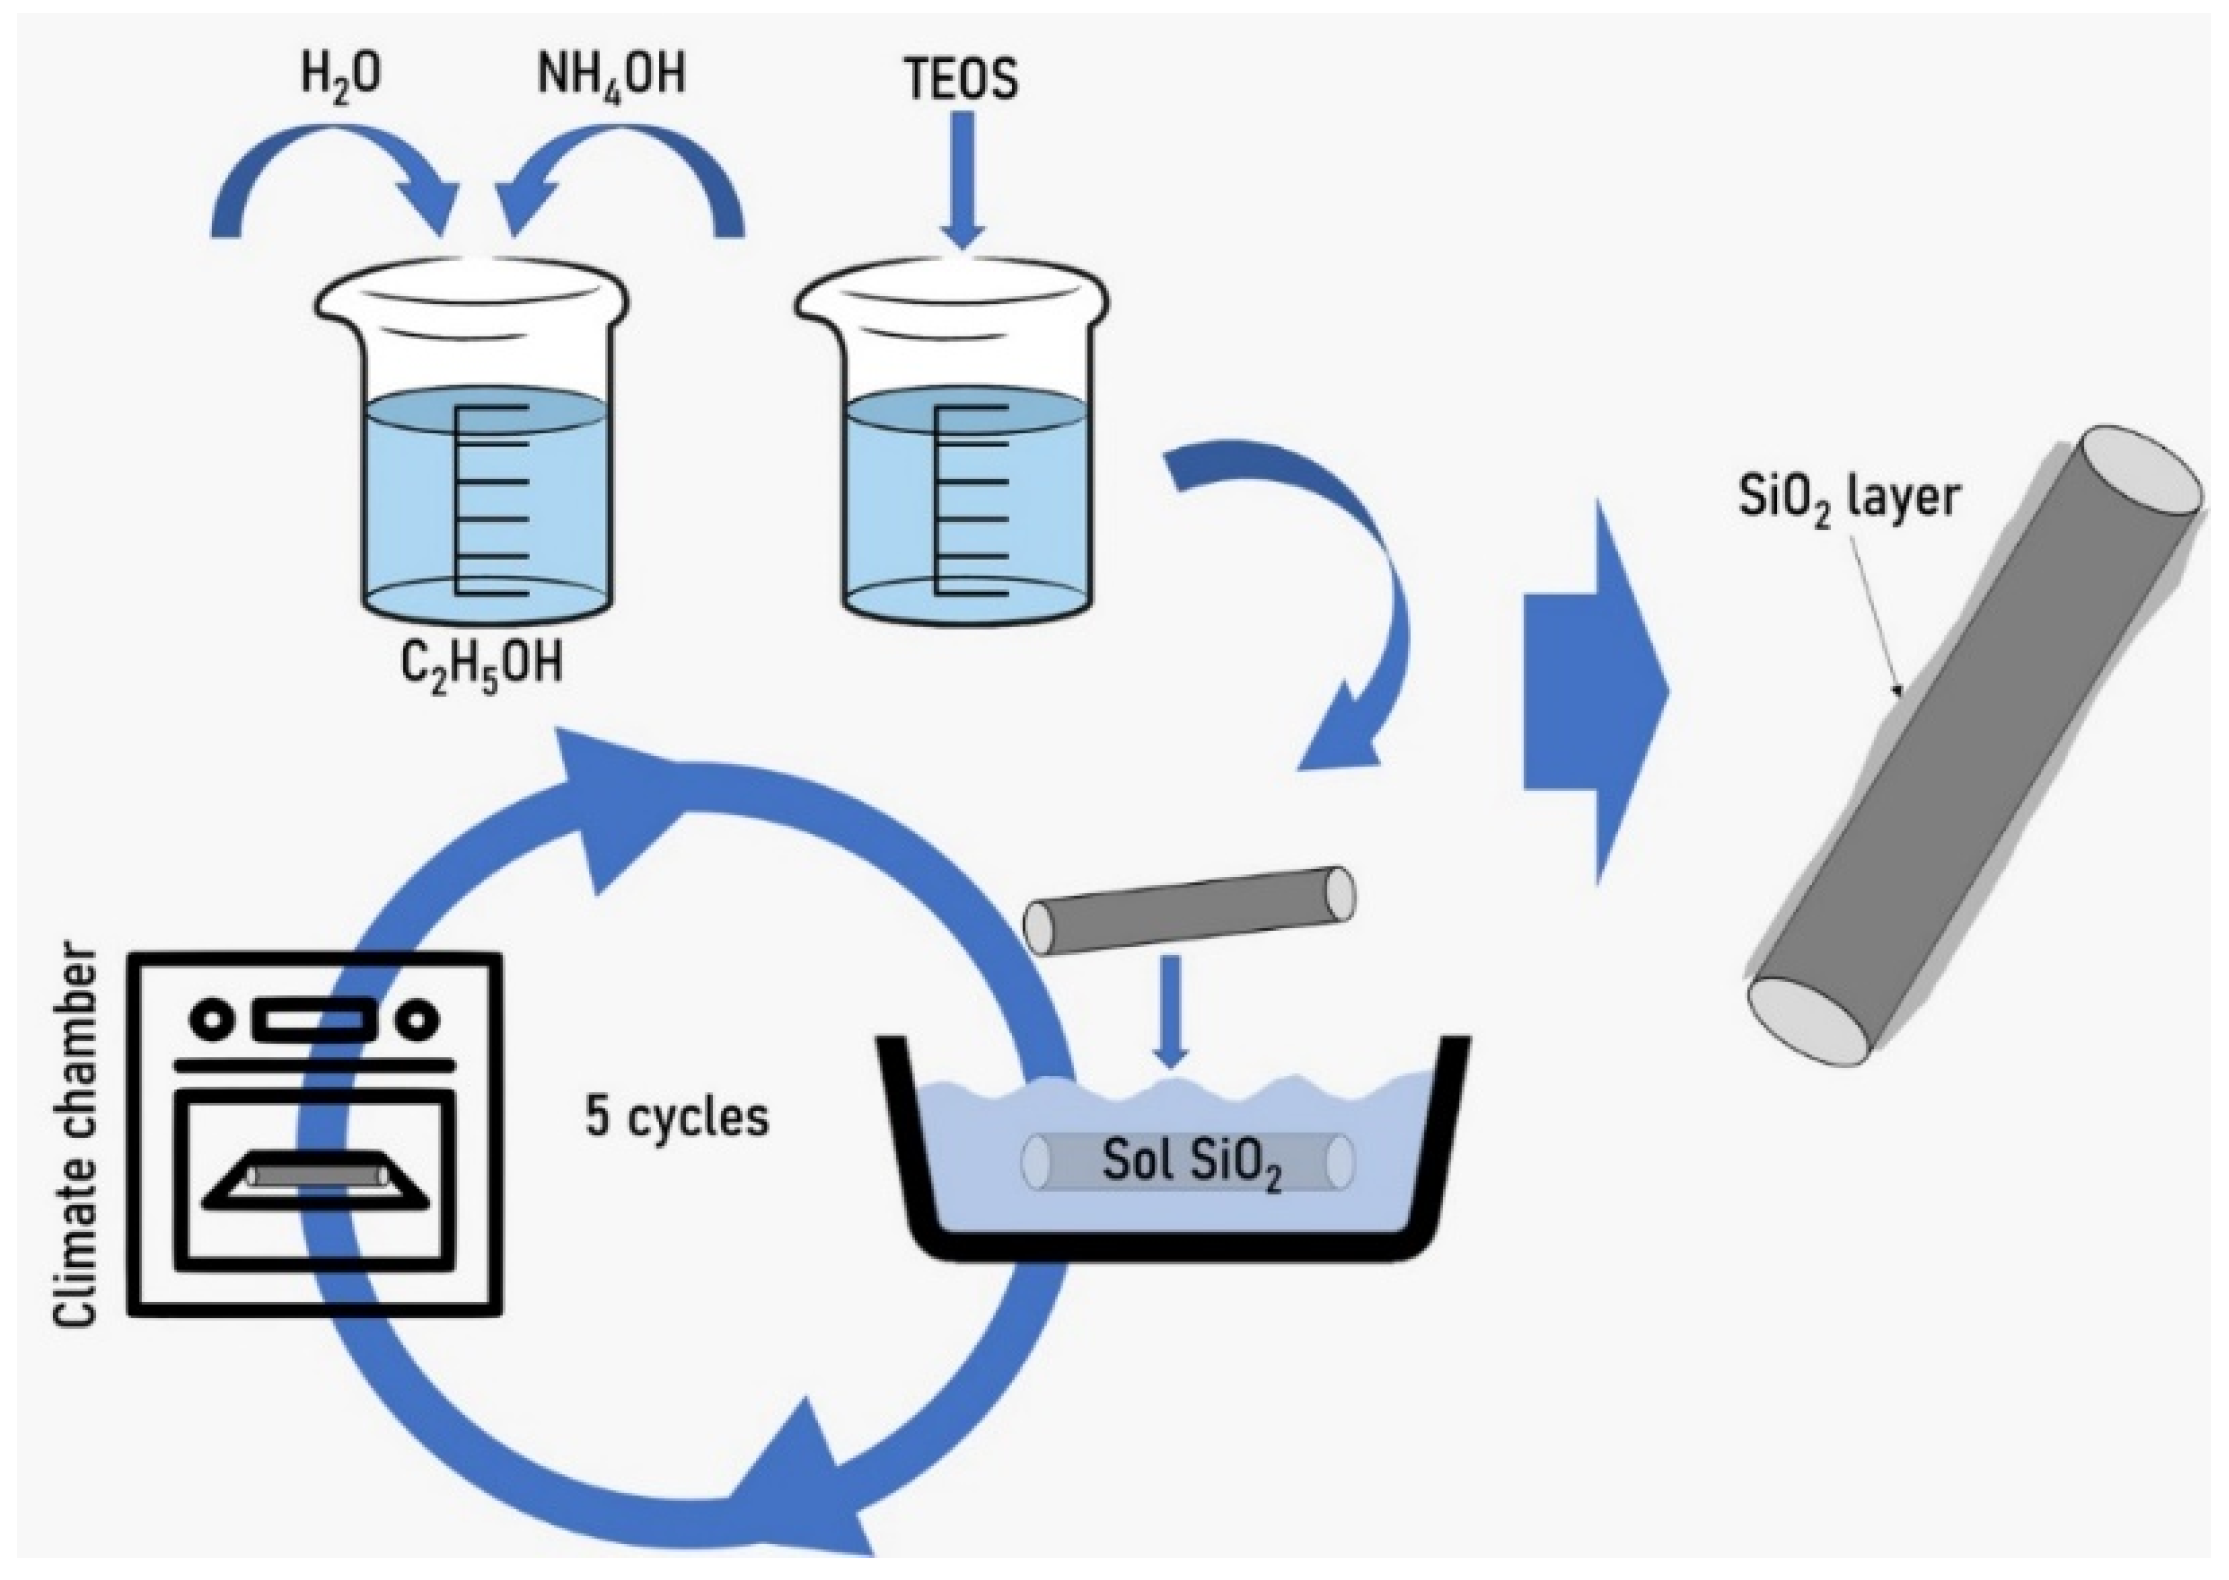
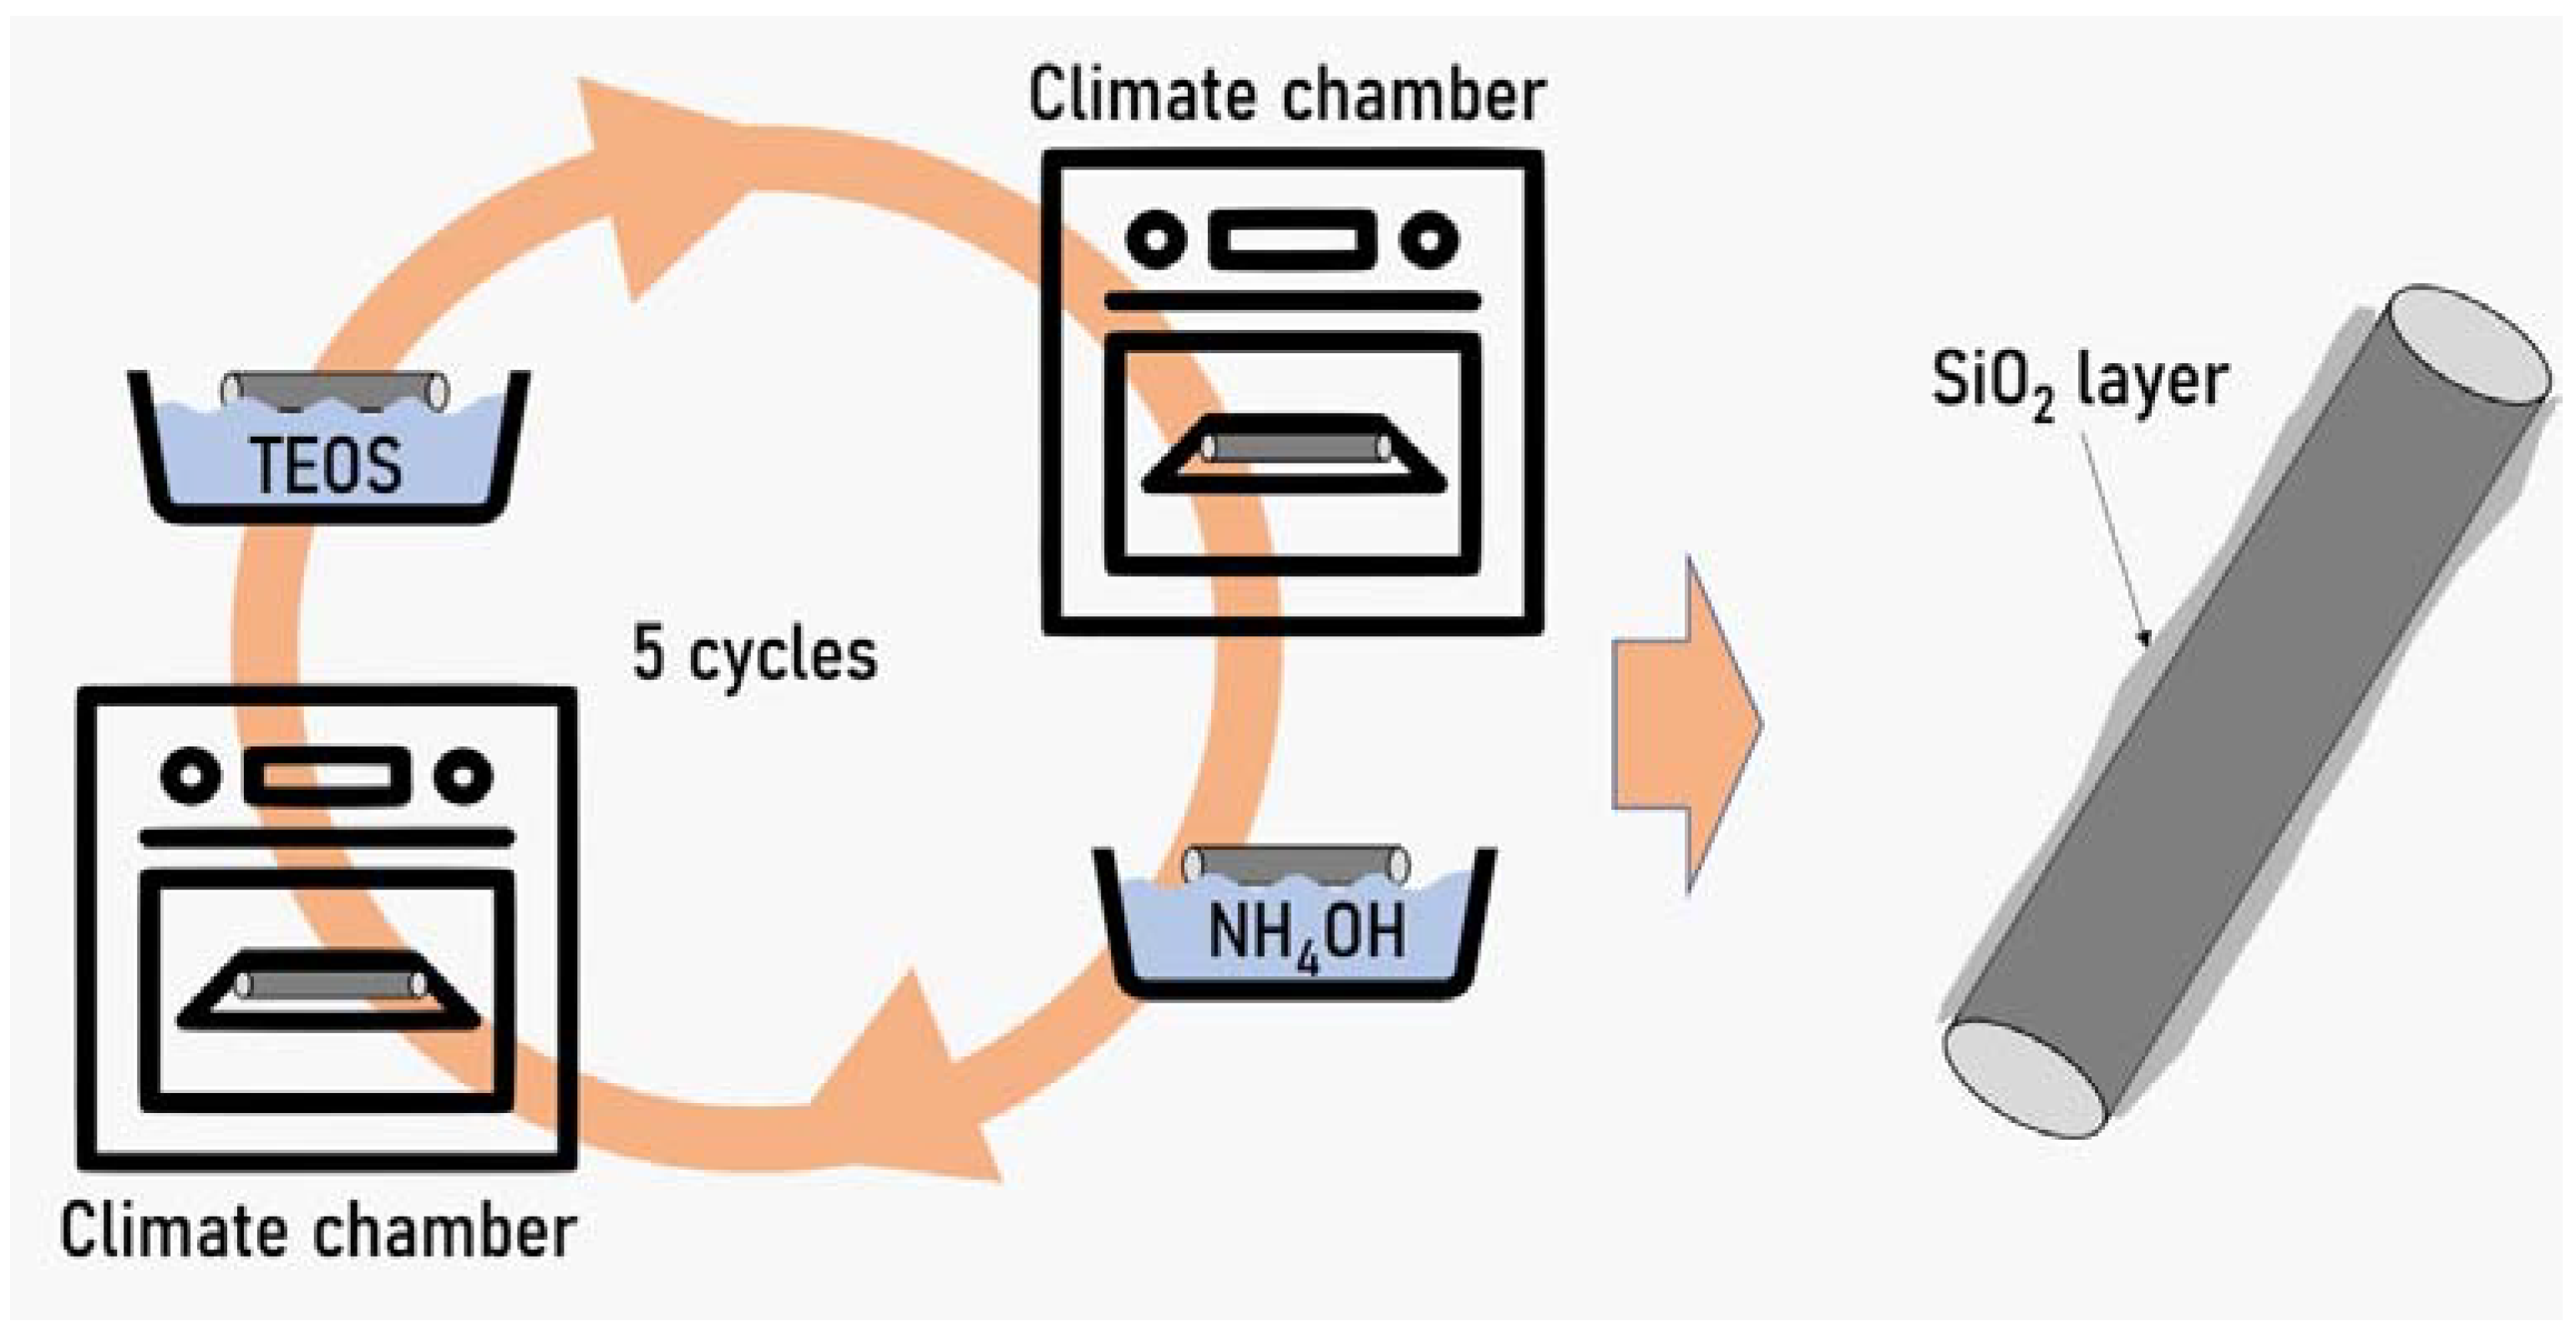
In the second part of the experiment, the protective coating was applied by sequential immersion in tetraethoxysilane and a 25% aqueous ammonia solution. Before the first tetraethoxysilane application cycle, the ABE wire samples were washed with distilled water and dried.
During the experiment, five groups of ABE wire samples with different contents of silicon oxide layers were obtained. Each group contained five samples After each application cycle, the samples were dried at a temperature of 150 °C and weighed. According to the of weighing results, the variation of the mass from the samples in relation to the initial mass of the ABE wire was determined. 
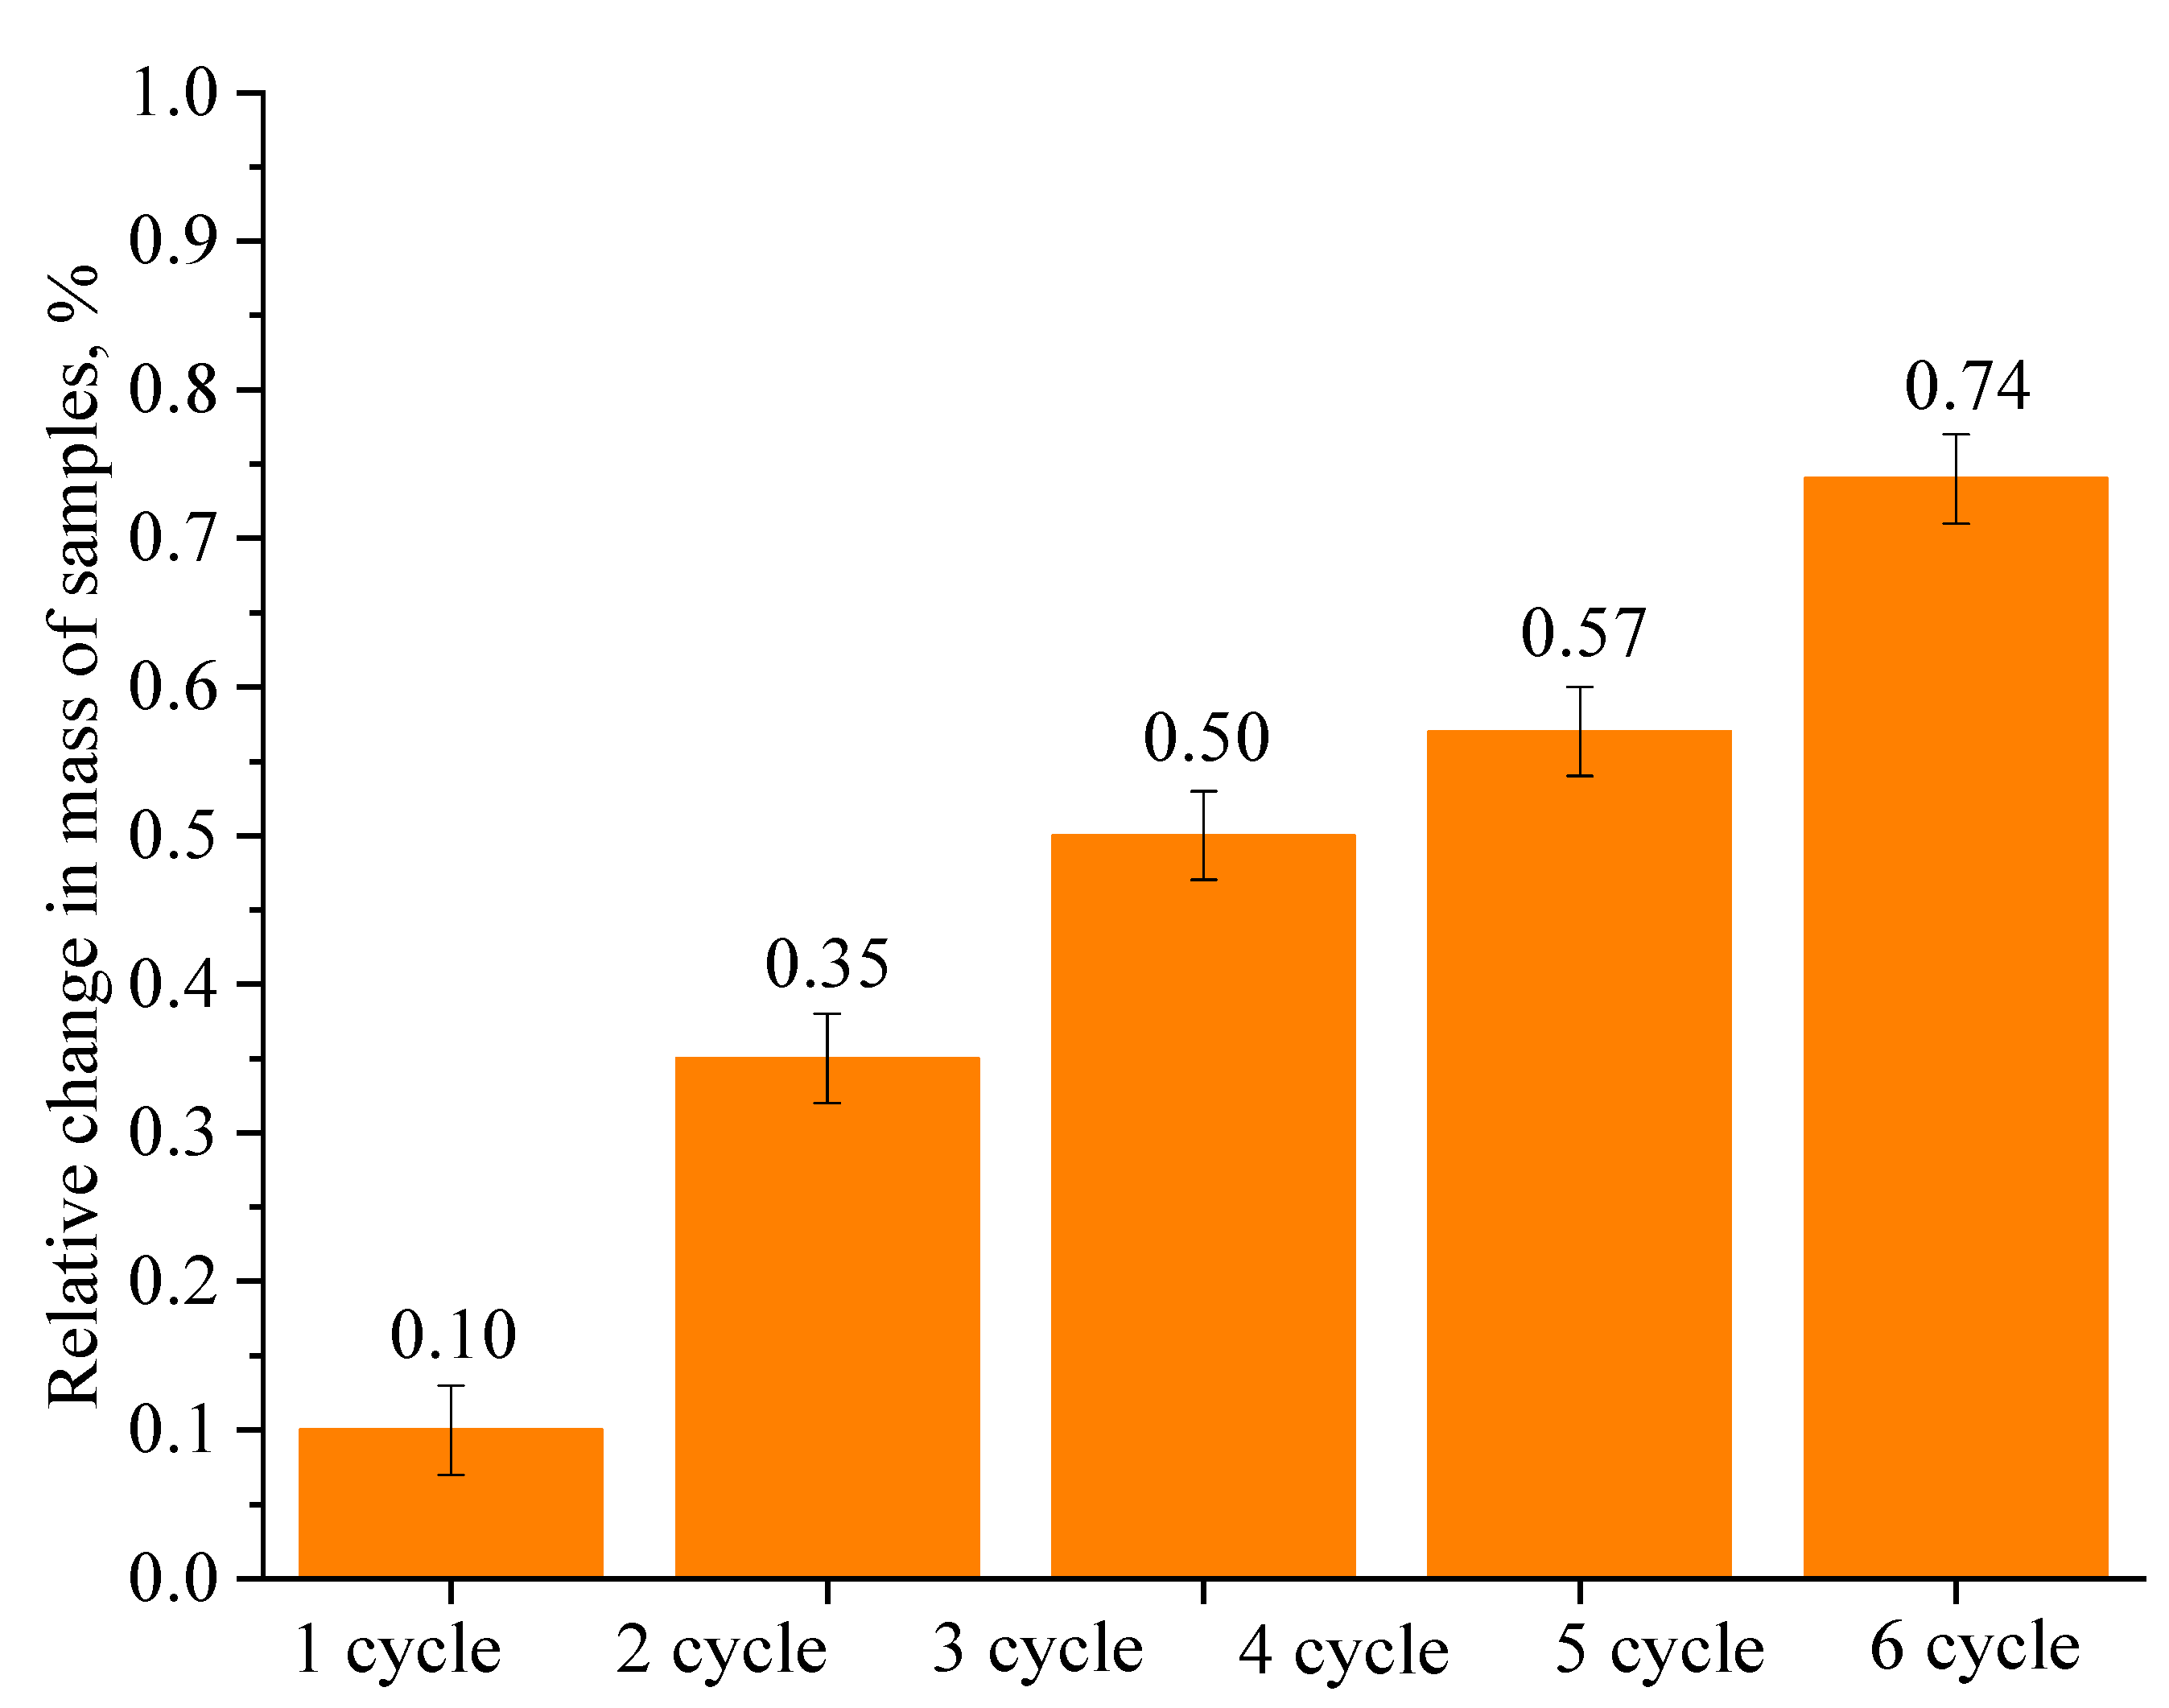
Figure 8 shows the dependence of the relative change in the mass of samples after each immersion cycle.
As can be seen in Figure 8, the average mass of samples after each cycle increased by 0.15%. After the application of five layers of protective coating, the relative change in the weight of the ABE wire does not exceed 1%. In more detail, the mechanical effect of additional weight due to the application of a nanostructured coating is analyzed in Section 3.8.
A comparative analysis of the change in the mass of ABE wires after the application of protective coating in two ways showed that the mass of samples treated with SiO2 nanoparticles sol changes faster after the third cycle, and the mass of samples treated with a protective coating applied by the sequential immersion method changes faster after the fourth cycle. It is important to note that when applying a single coating layer, the largest change in the mass of the sample (0.21%) is observed in the case of using SiO2 nanoparticles sol.
In the third stage of the experiment, we analyzed the elemental composition of the ABE wire samples using a Tescan MIRA-LMH scanning electron microscope with the AZtecEnergy Standard/X-max 20 (standard) elemental composition determination system (Tescan, Brno, Czech Republic). 
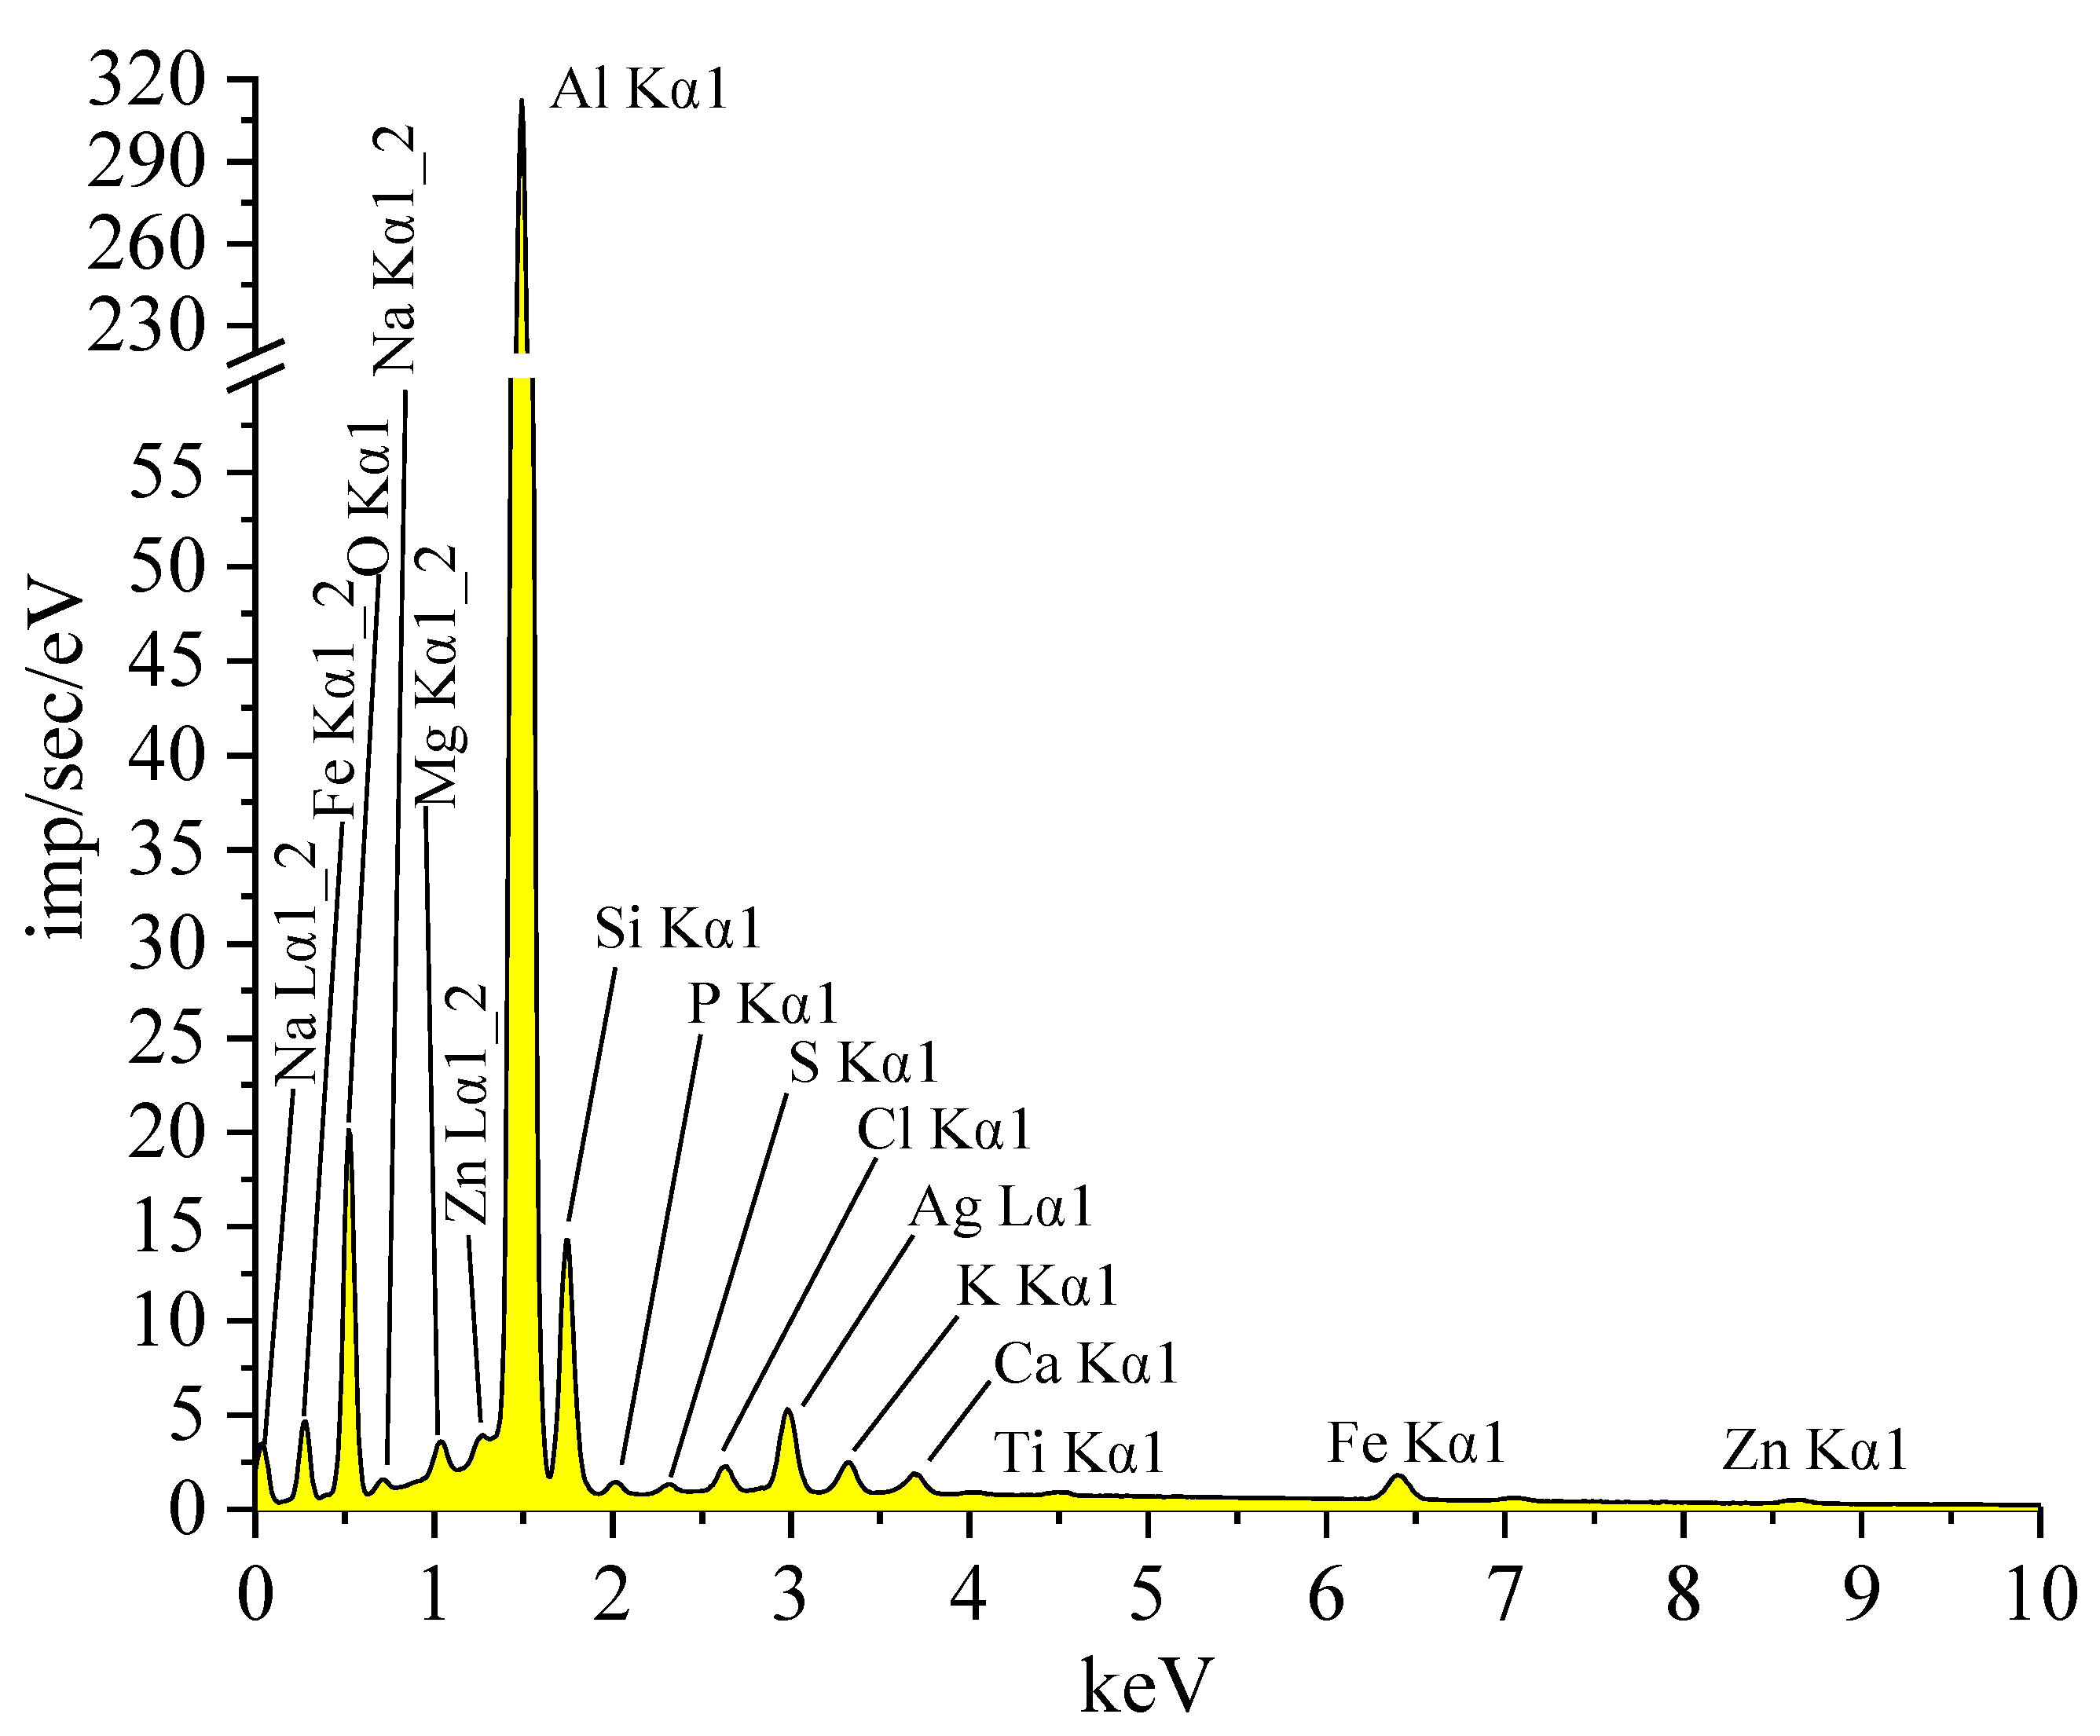
Figure 9 shows the elemental composition spectrum of an electrical aluminum alloy of the ABE wire, and Table 2 shows the interpretation of the spectrum.
The interpretation of the elemental composition spectrum showed that the aluminum alloy contains C, O, Na, Mg, Al, Si, P, S, Cl, K, Ca, Ti, Fe, Zn, and Ag. The sample contains 43.73 ± 0.37% (atom.) aluminum, 3.57 ± 0.06% (atom.) silicon, 0.15 ± 0.01% (atom.) magnesium, 0.04 ± 0.01% (atom.) titanium, and 0.55 ± 0.04% (atom.) iron, which corresponds to the composition of the ABE grade aluminum alloy according to GOST 839-80. The presence of elements such as carbon, oxygen, sodium, sulfur, phosphorus, and zinc, which are not declared for ABE wire in GOST 839-80, can be explained by contamination on the wire surface.
Table 3 shows the elemental composition of ABE wire samples with different numbers of layers of protective coating applied by the method of sequential immersion in tetraethoxysilane and ammonia solution.
From the analysis of the data presented in Table 3, we can draw the following conclusions:
(1)
after the application of a protective coating on the wire surface, the content of silicon and oxygen in the sample starts to increase;
(2)
with the increase of the number of layers of protective coating, the silicon and oxygen content in the sample composition increases and the aluminum content decreases. The decrease in the aluminum content is associated with an increase in the silicon oxide layer on the surface of the samples, which covers the surface of the aluminum wire and does not allow the use of a scanning electron microscope to determine the aluminum content on the surface of the samples.
Table 4 shows the results of determining the elemental composition of ABE wire with a different number of layers of protective coating applied by the method of immersion of samples in SiO2 nanoparticles sol.
From the analysis of the results presented in Table 4, we can draw the following conclusions:
(1)
after applying the protective coating, the silicon and oxygen content increases with the number of layers of the protective coating, and the aluminum content decreases;
(2)
the oxygen and silicon content in the protective coating applied by immersion in silicon oxide sol is lower than that of the protective coating applied by sequential immersion in tetraethoxysilane and ammonia.
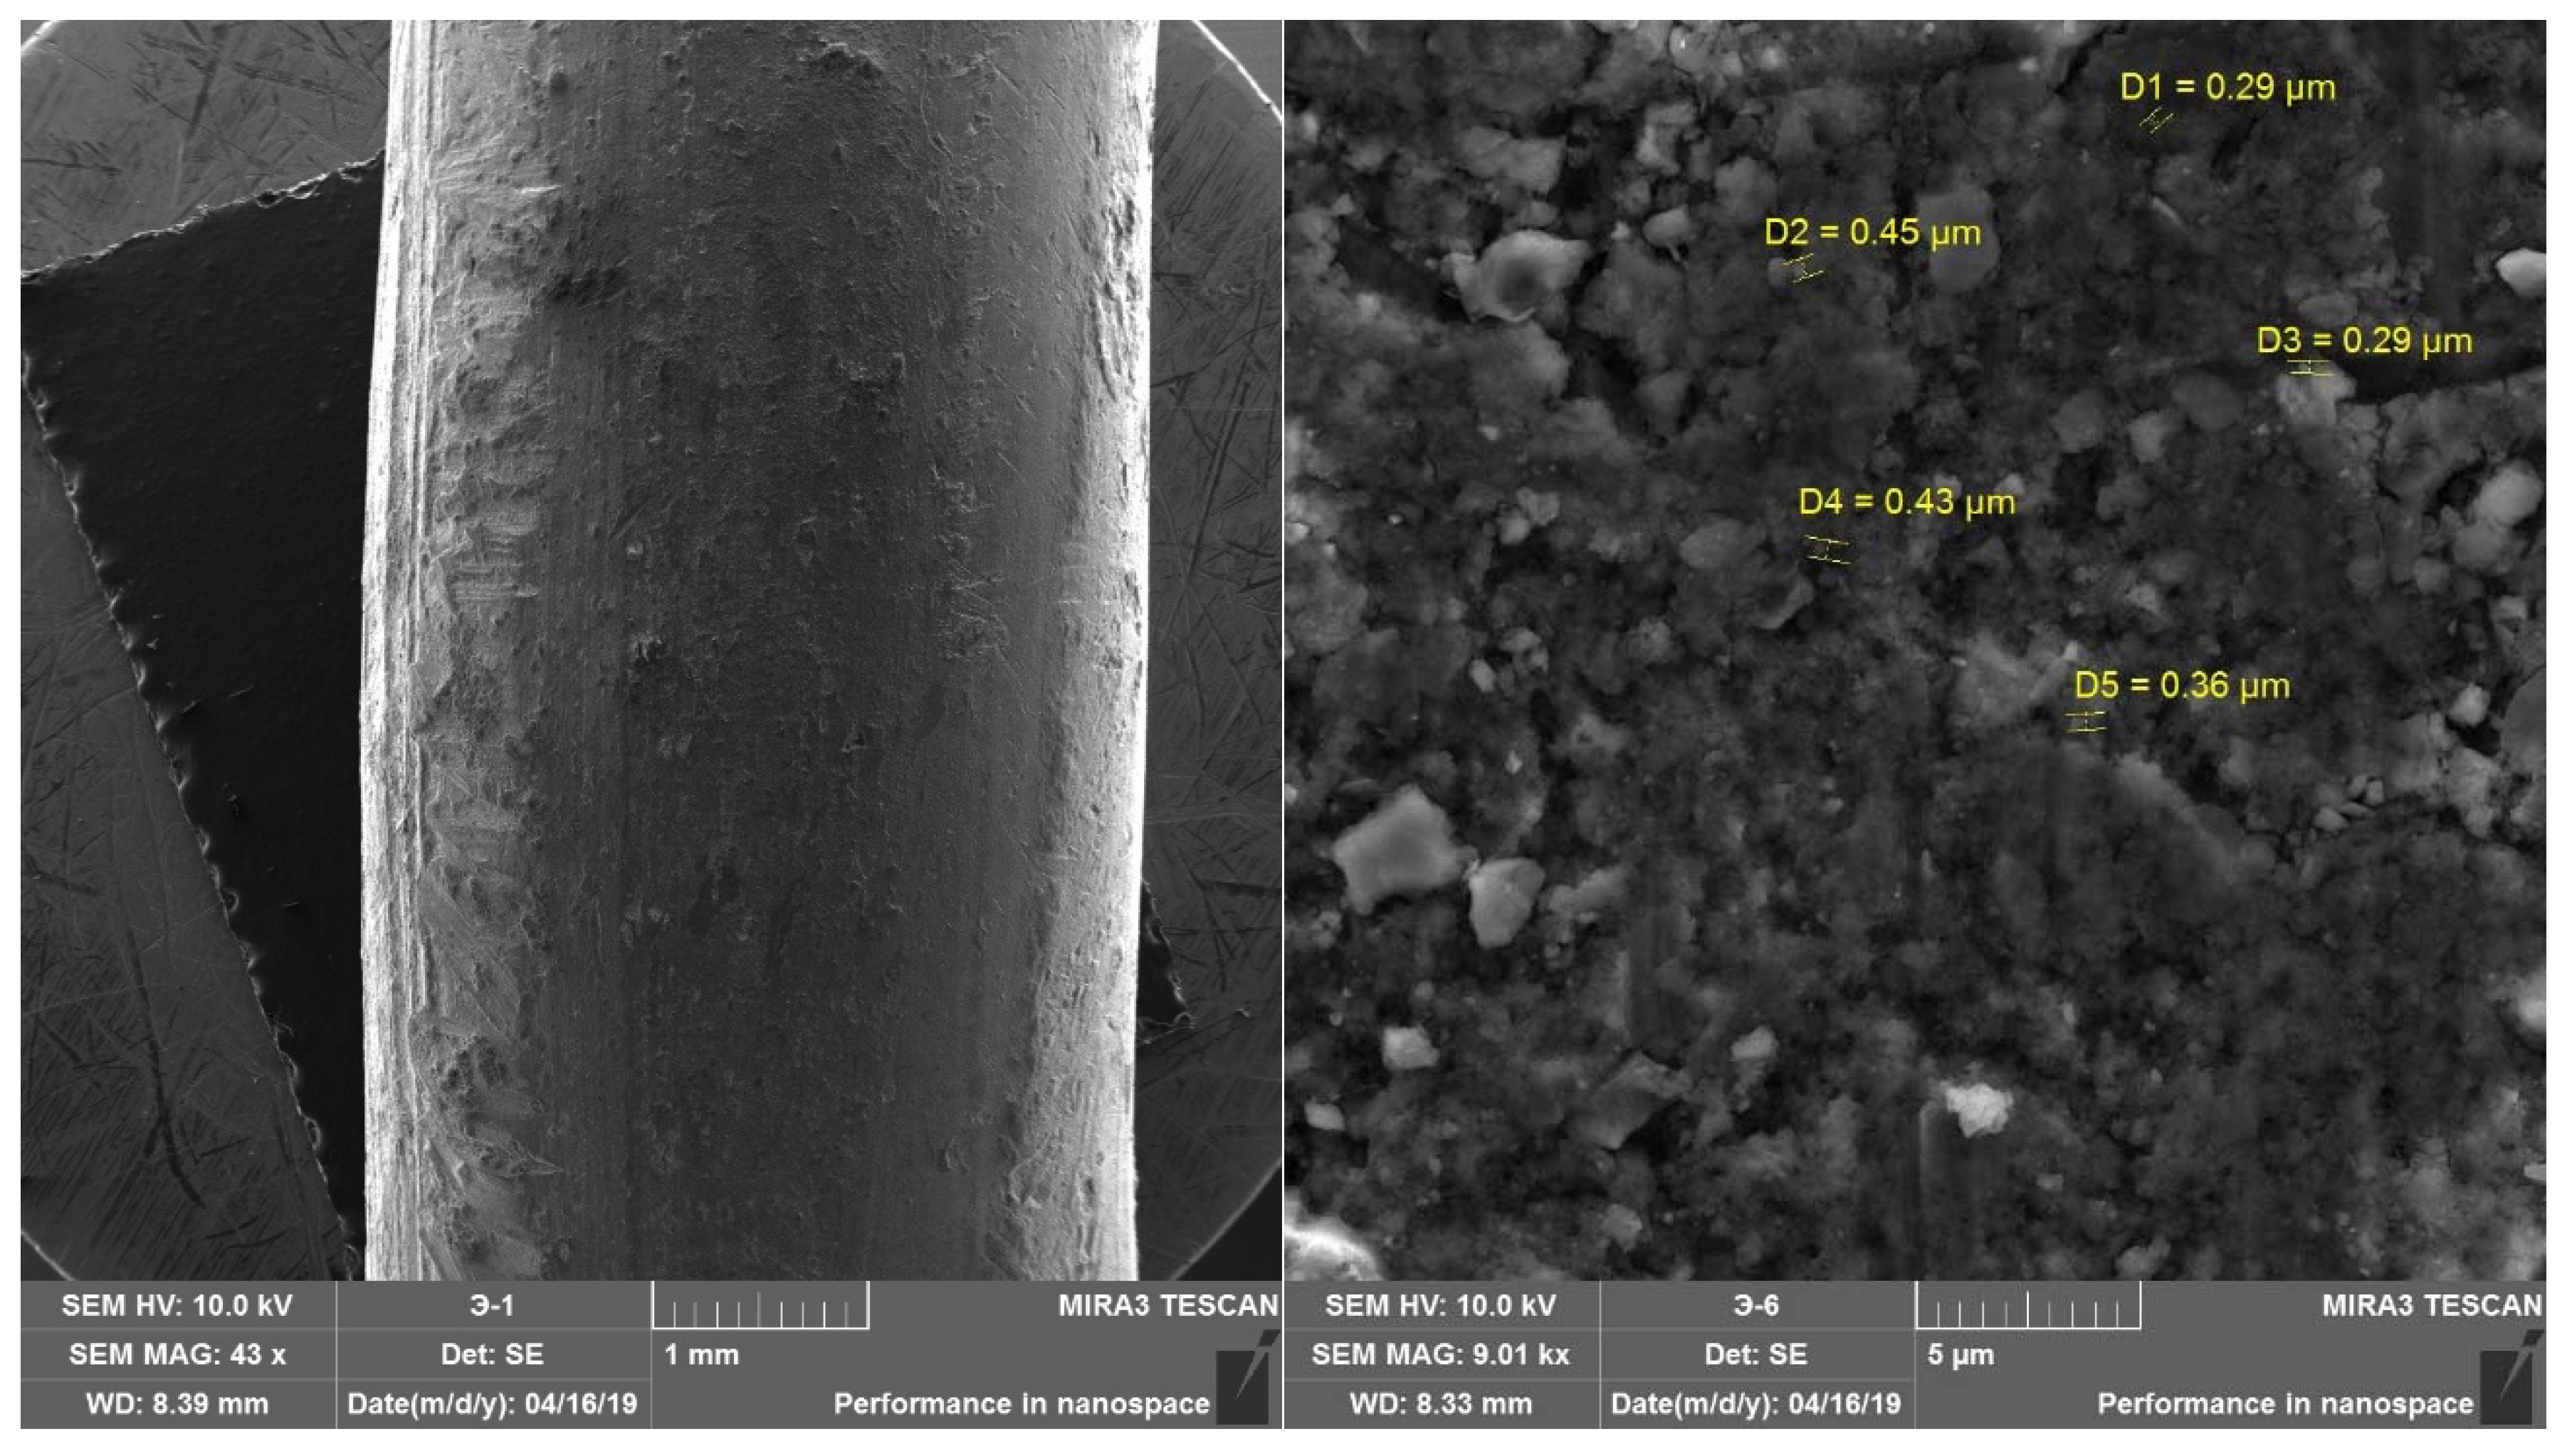
Next, we investigated the morphology of the surface of metallic aluminum by scanning electron microscopy (SEM). According to SEM micrographs (Figure 10), the surface structure of metallic aluminum is homogeneous and non-porous. With an increase in the resolution of the SEM, granules of crystalline aluminum oxide, of sizes from 0.3 to 0.45 microns, are clearly distinguishable on the surface.
Next, we studied the surface morphology of the experimental samples. Since the morphology of the samples’ surface has a similar character, samples containing one, three, and five layers of protective coating on the surface were chosen as examples.
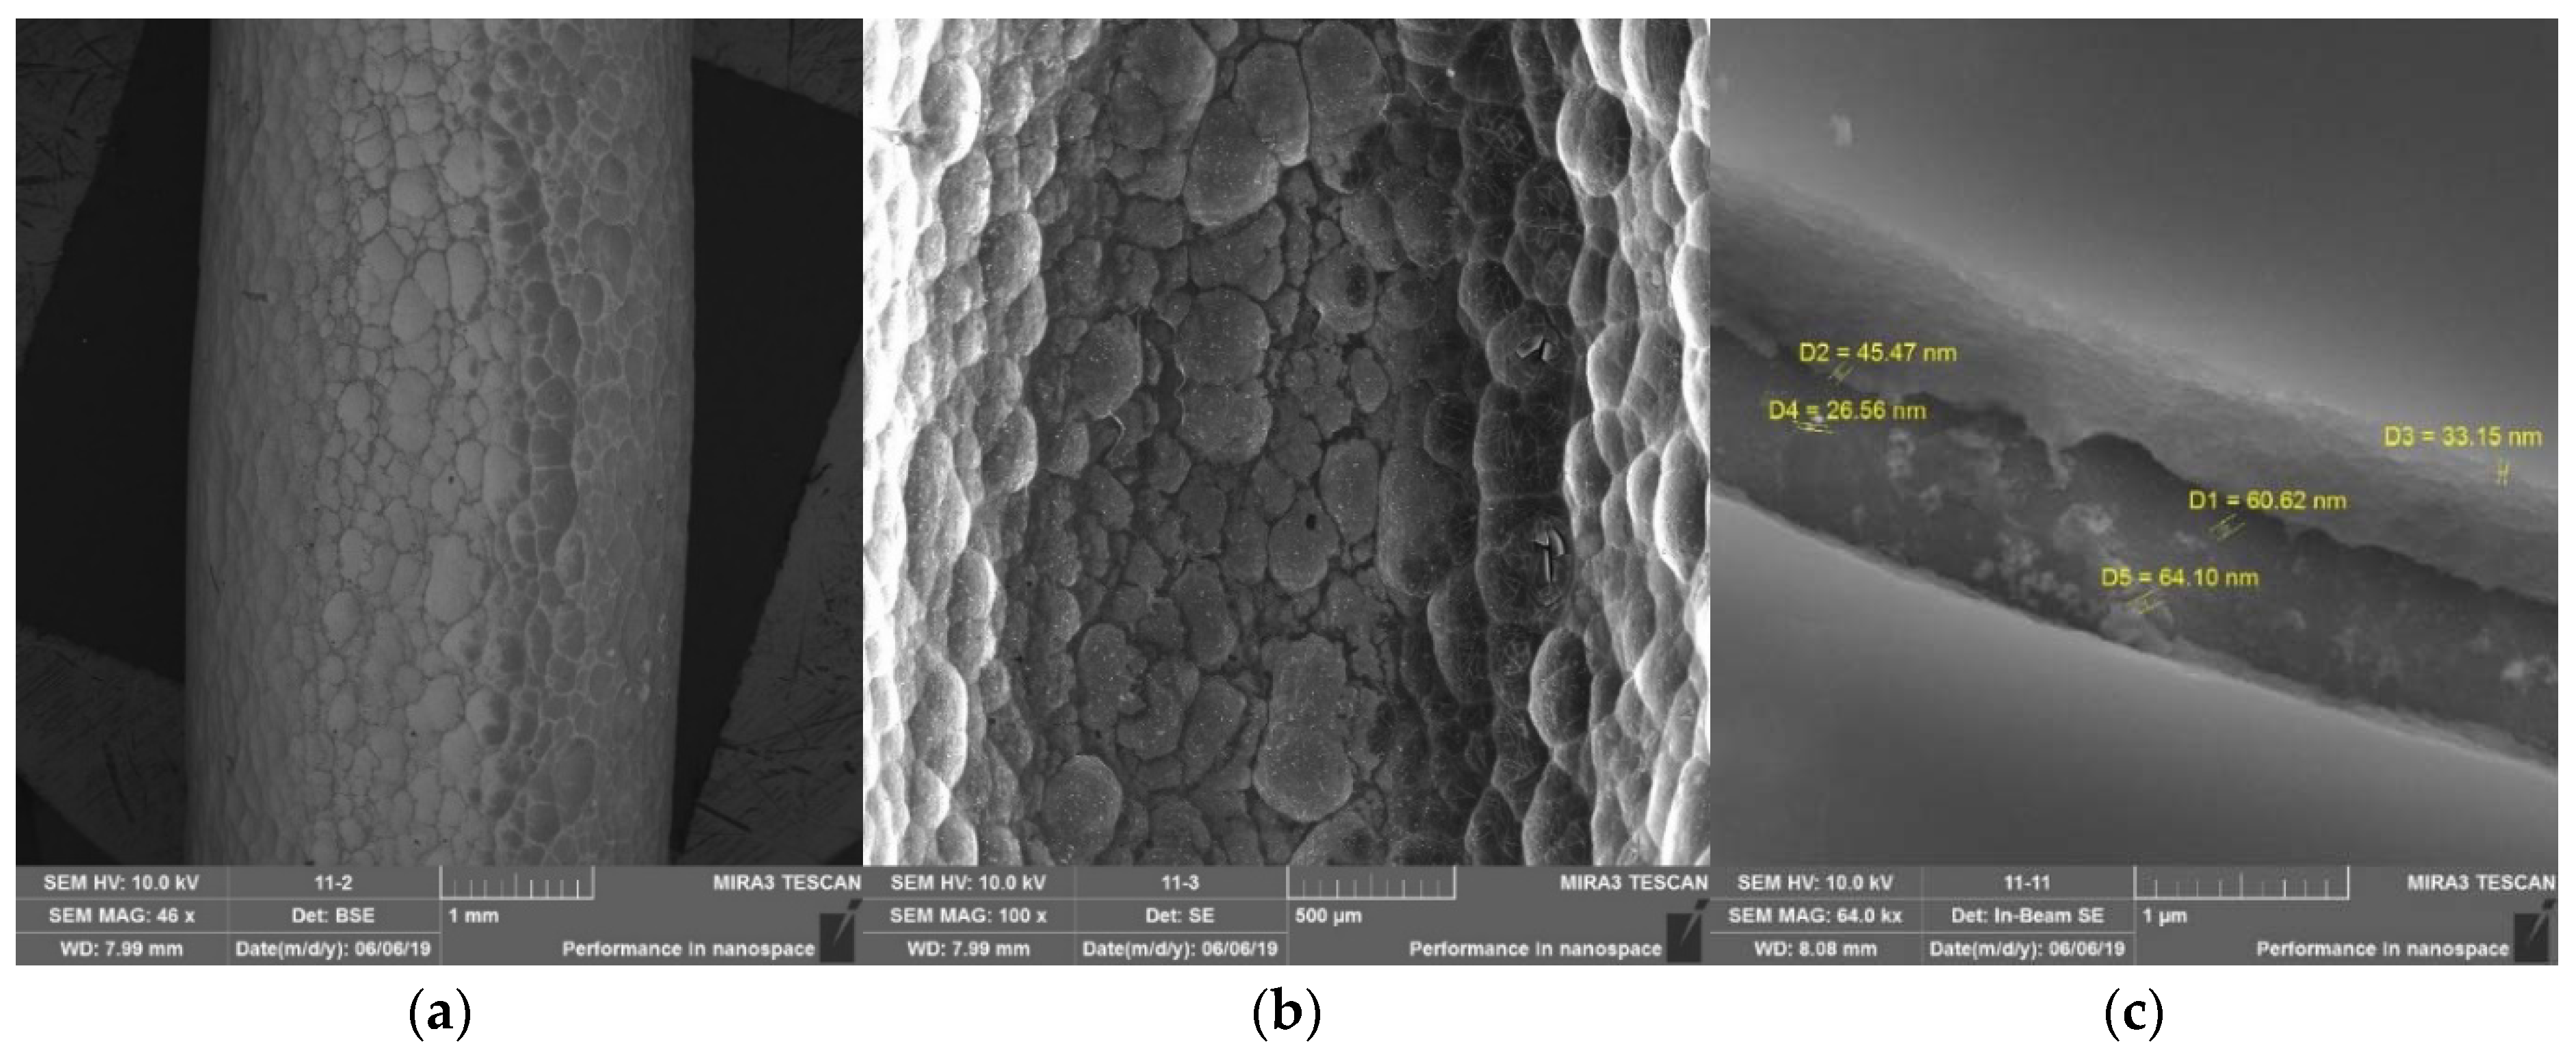
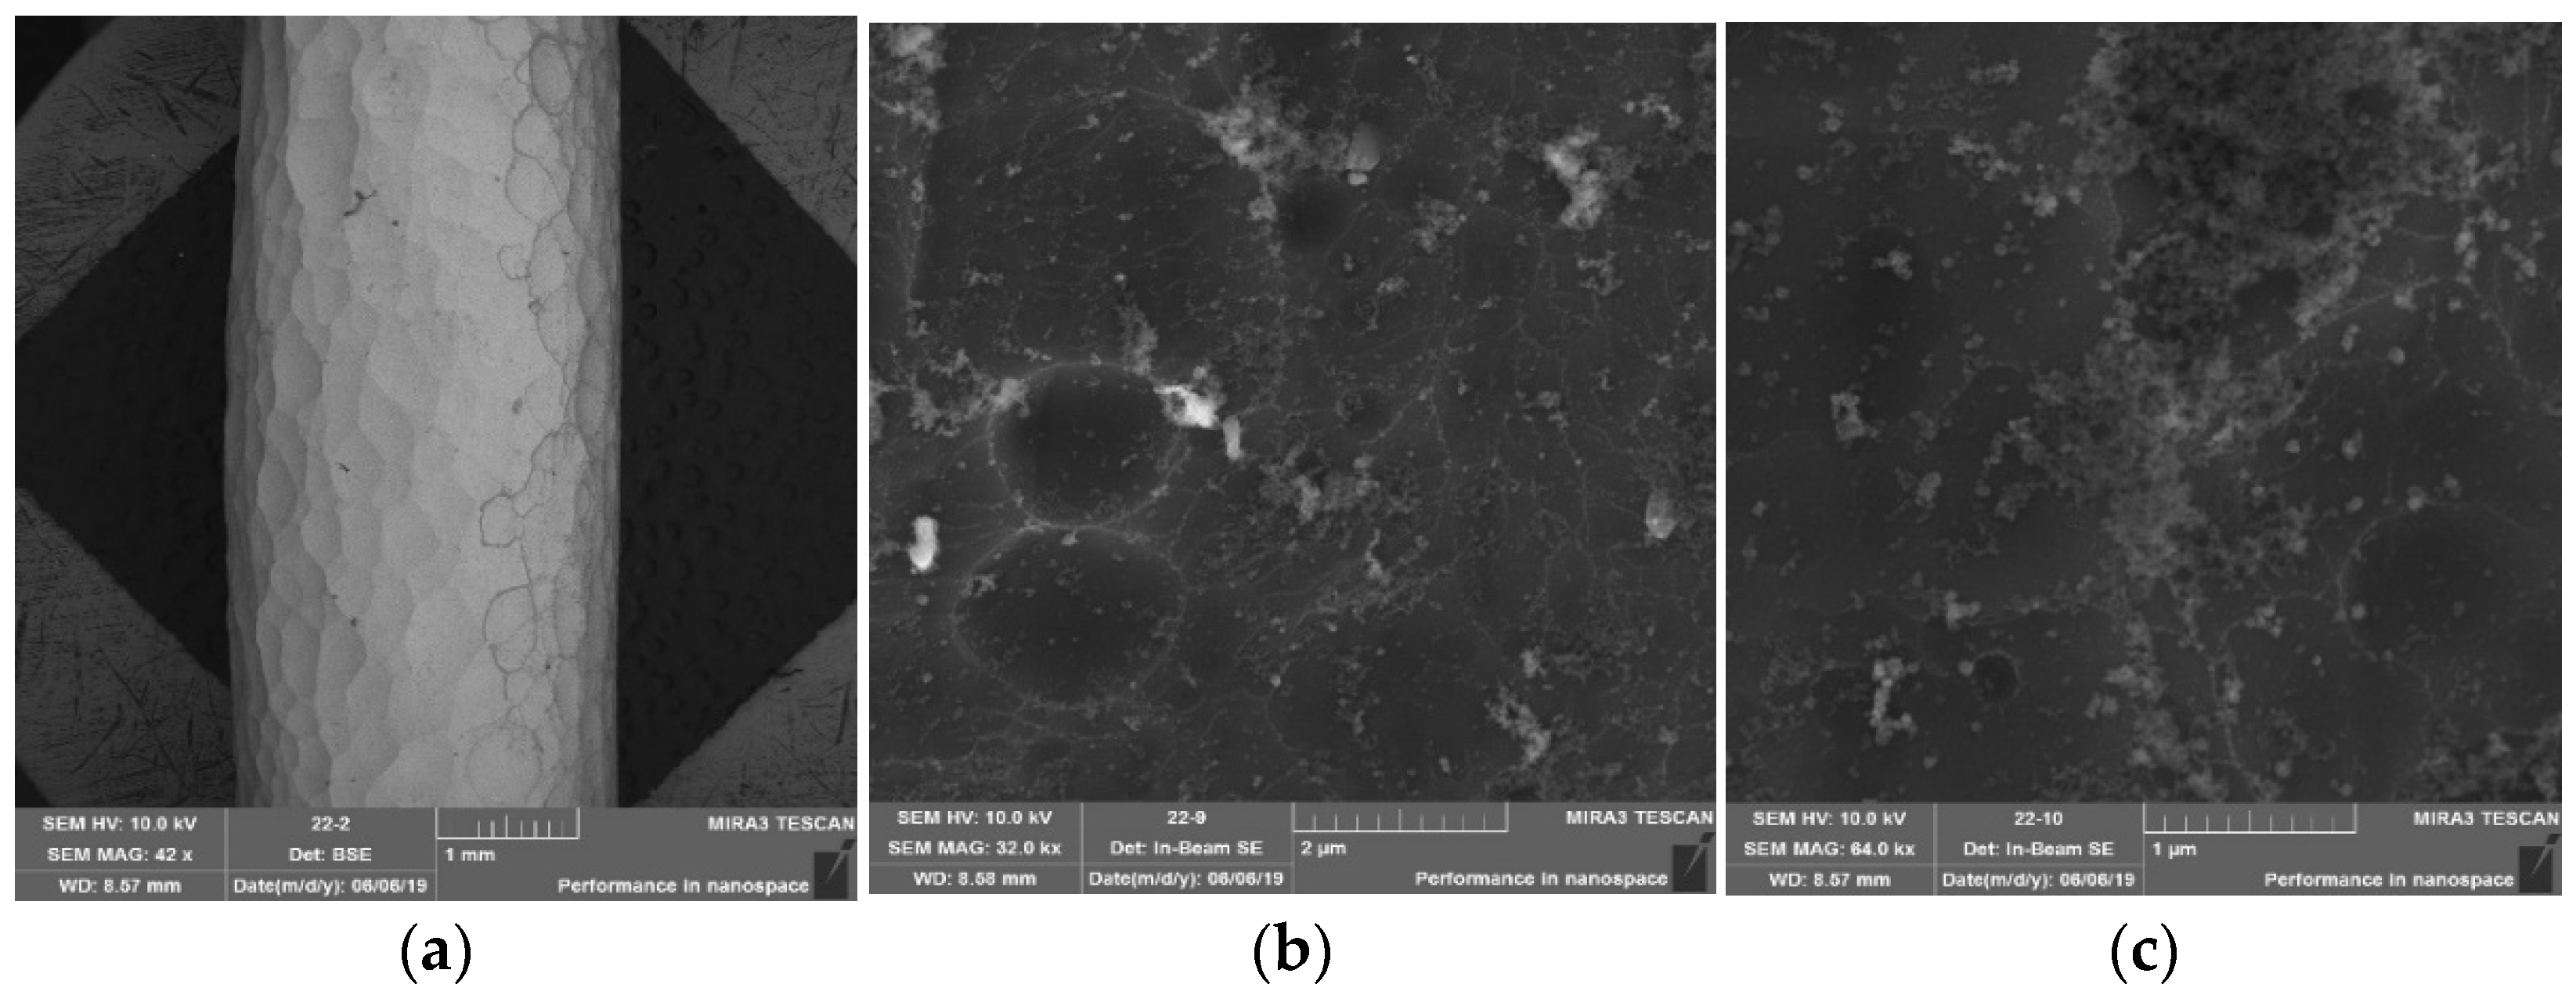
Figure 11 shows SEM micrographs of the surface of a sample containing one layer of protective coating applied by sequential immersion in tetraethoxysilane and ammonia.
As can be seen from Figure 11, indentations are visible on the surface of the sample, and a silicon oxide film is present on the surface, which does not uniformly cover the surface of the sample. With a significant magnification, it can be seen that the film is not continuous, but consists of silicon oxide nanospheres with a diameter from 26 to 65 nm.
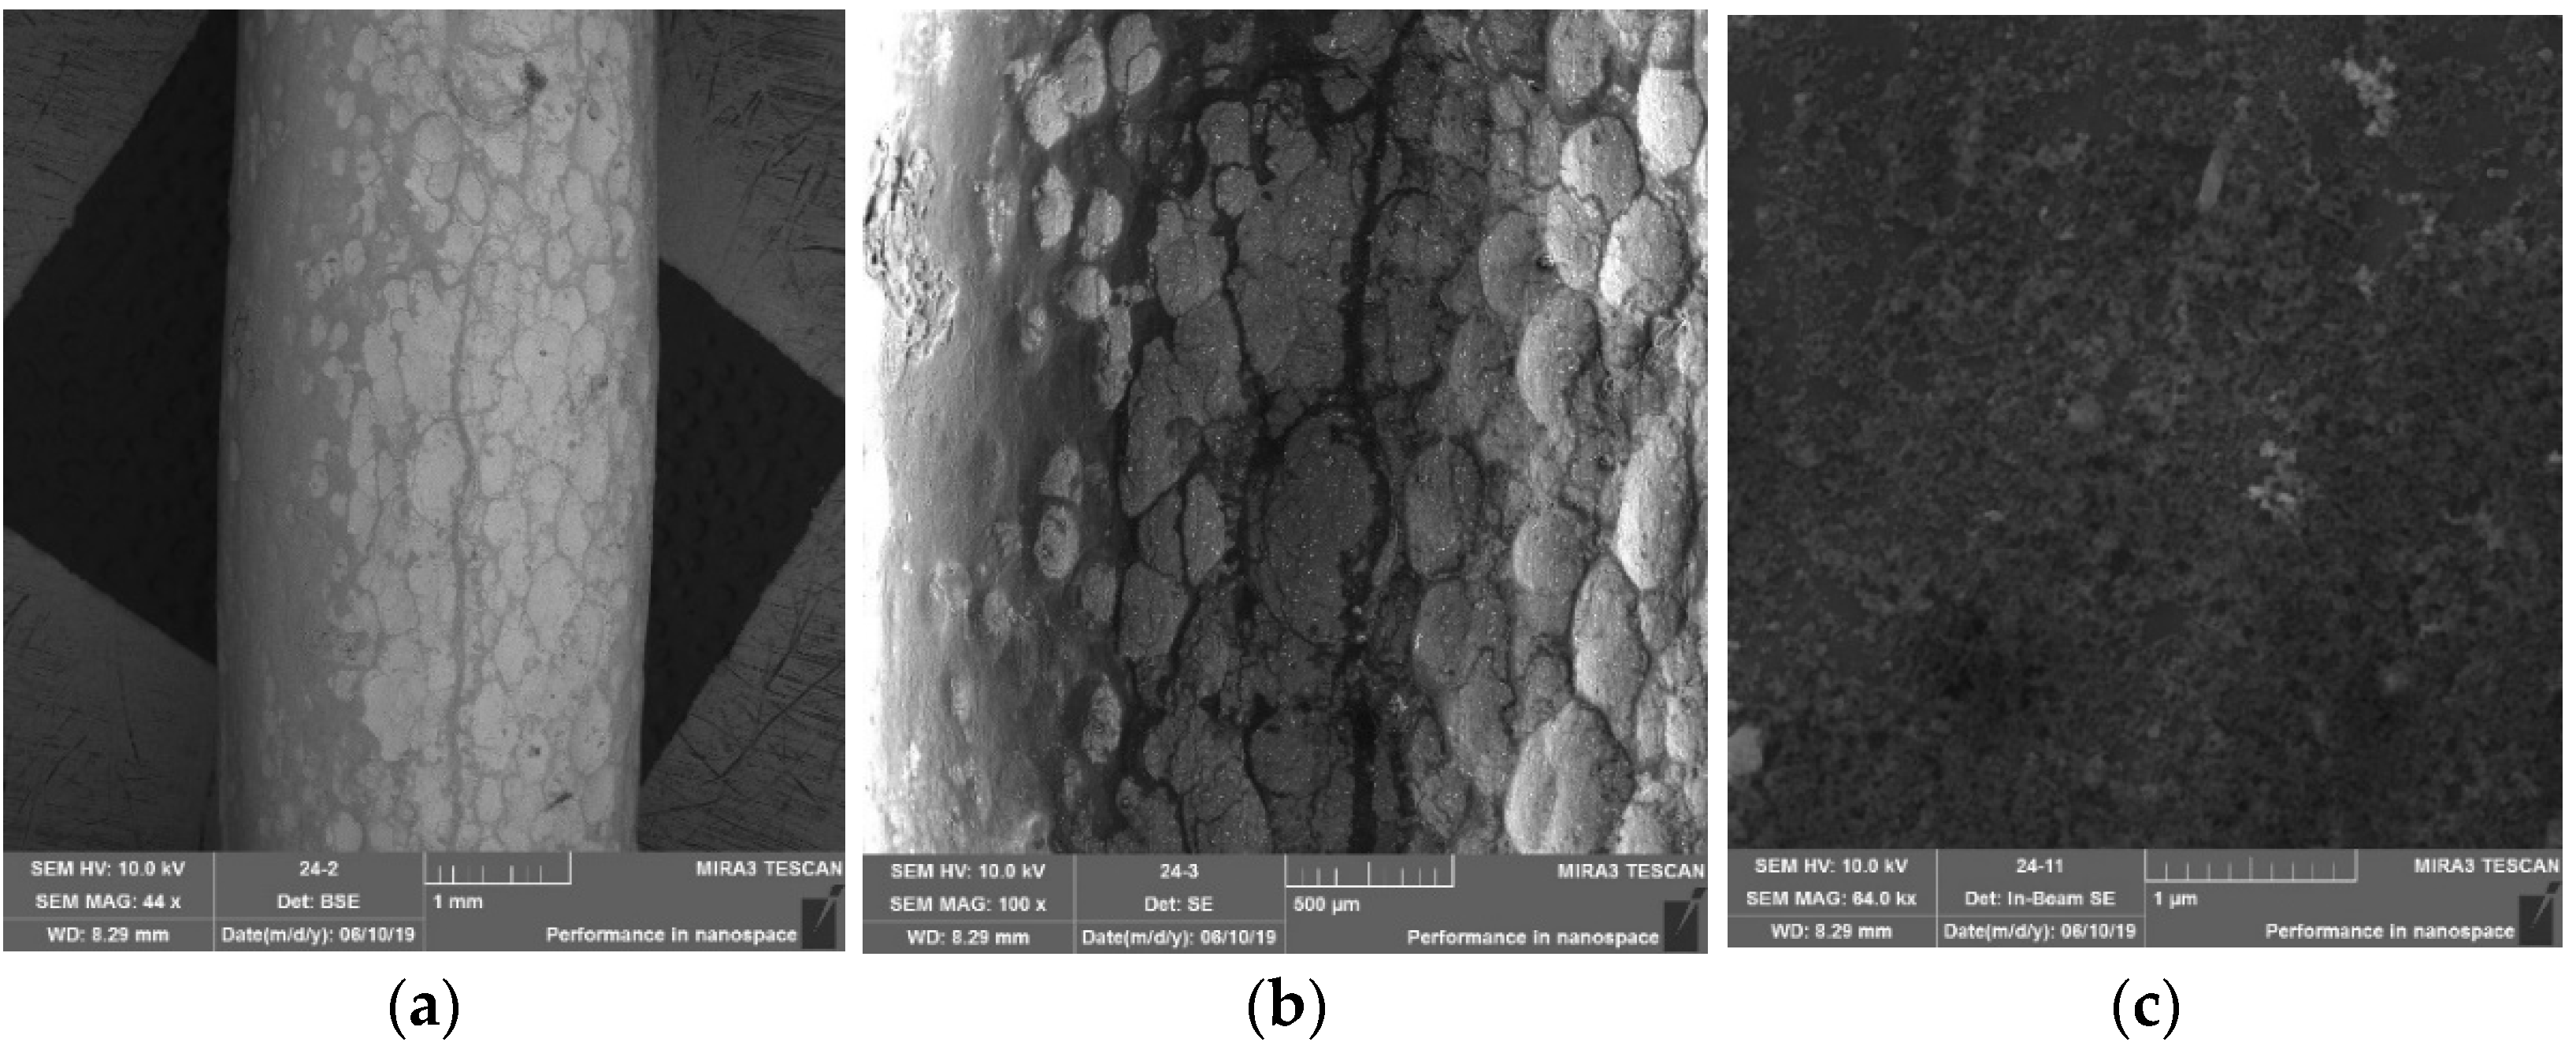
Figure 12 shows SEM micrographs of the surface of a sample containing three layers of protective coating applied by sequential immersion in tetraethoxysilane and ammonia.
As can be seen from Figure 12, after the application of the third layer of protective coating, the surface of the sample is more uniformly covered with a silicon oxide film. With magnification, it can be seen that the coating consists of flakes of various sizes.
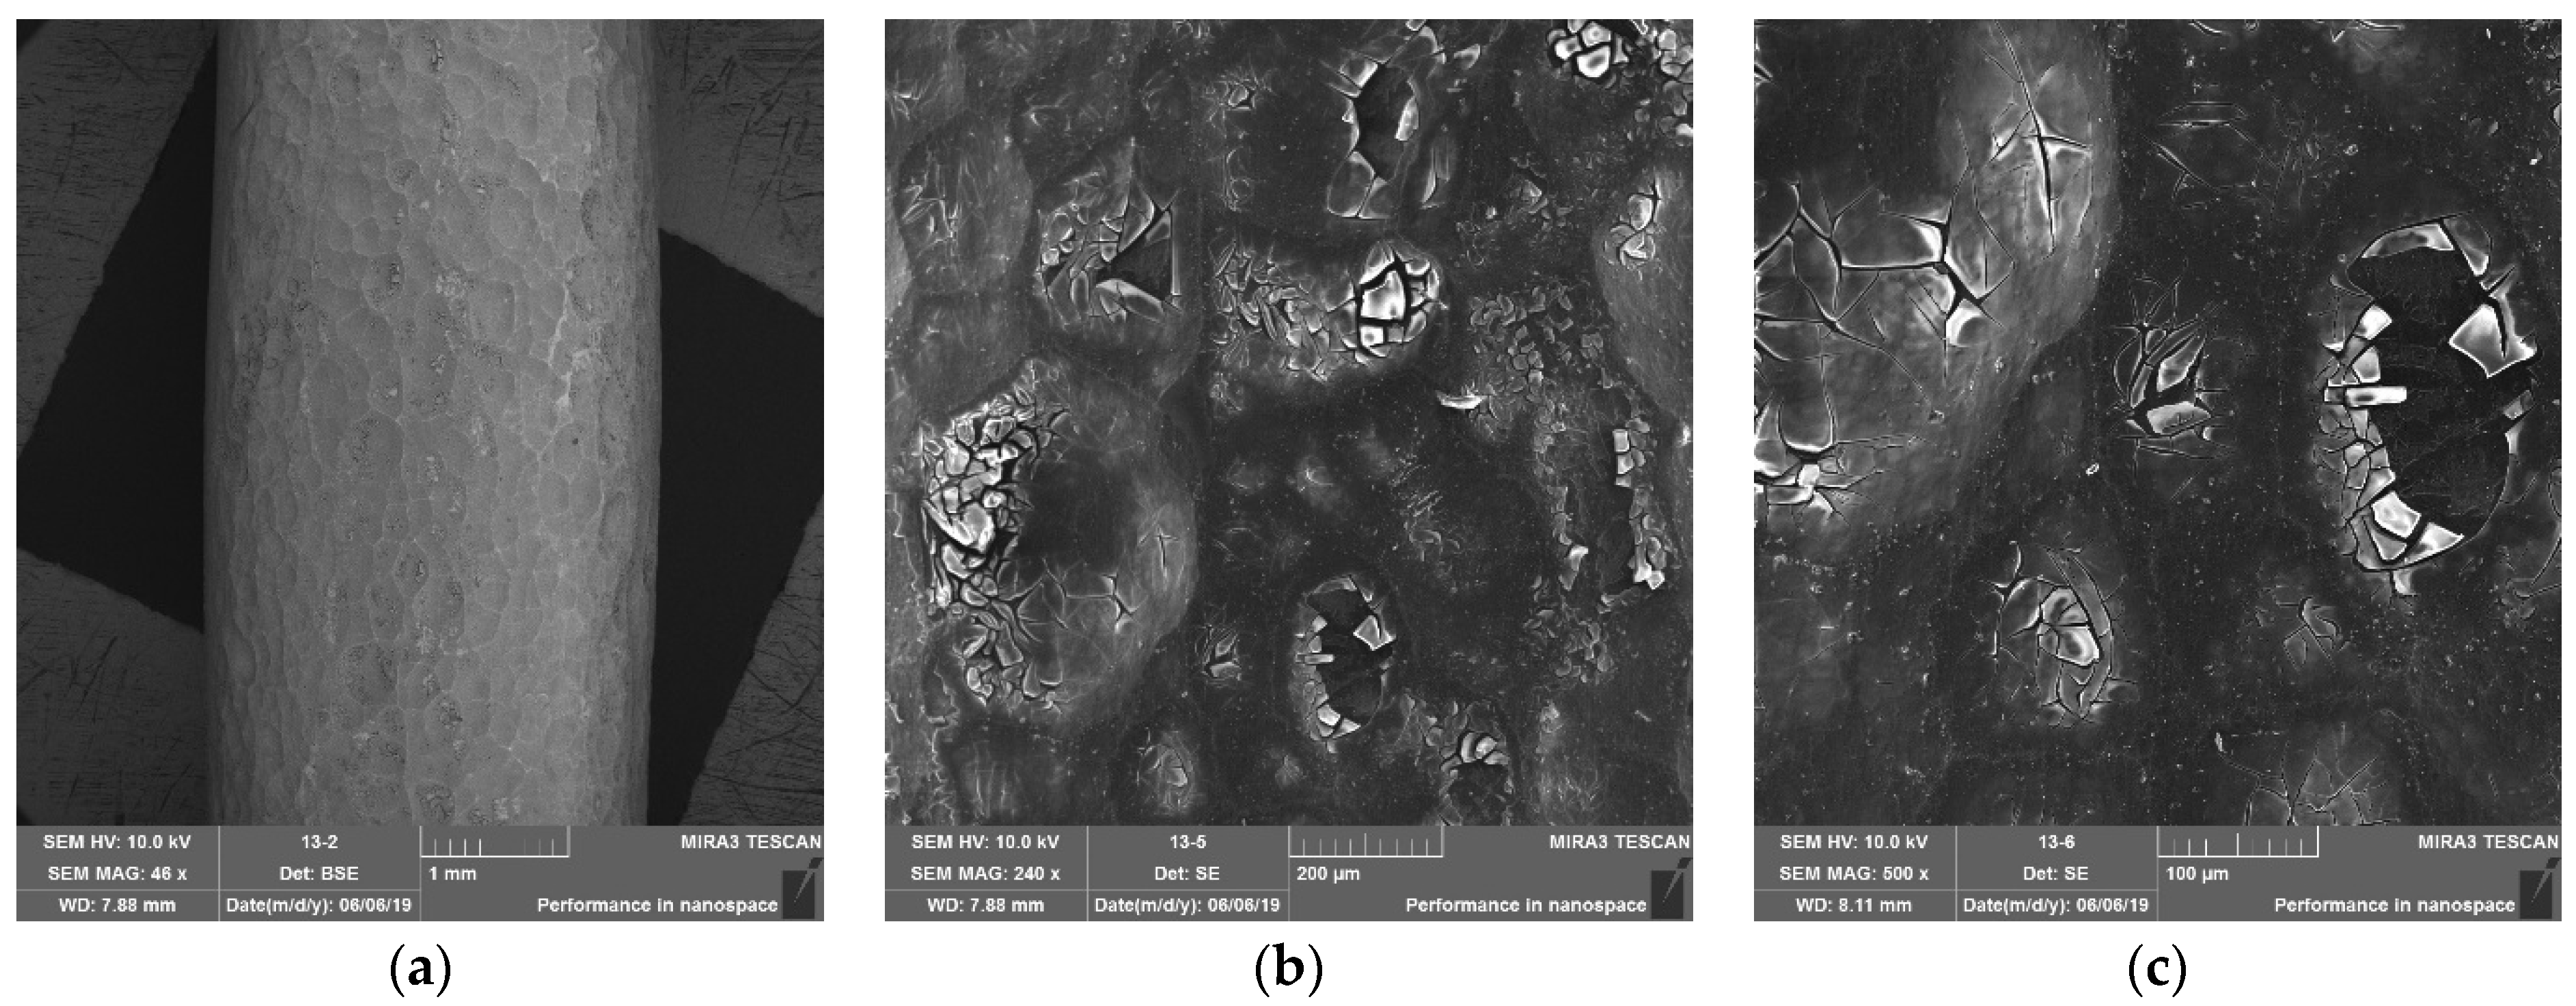
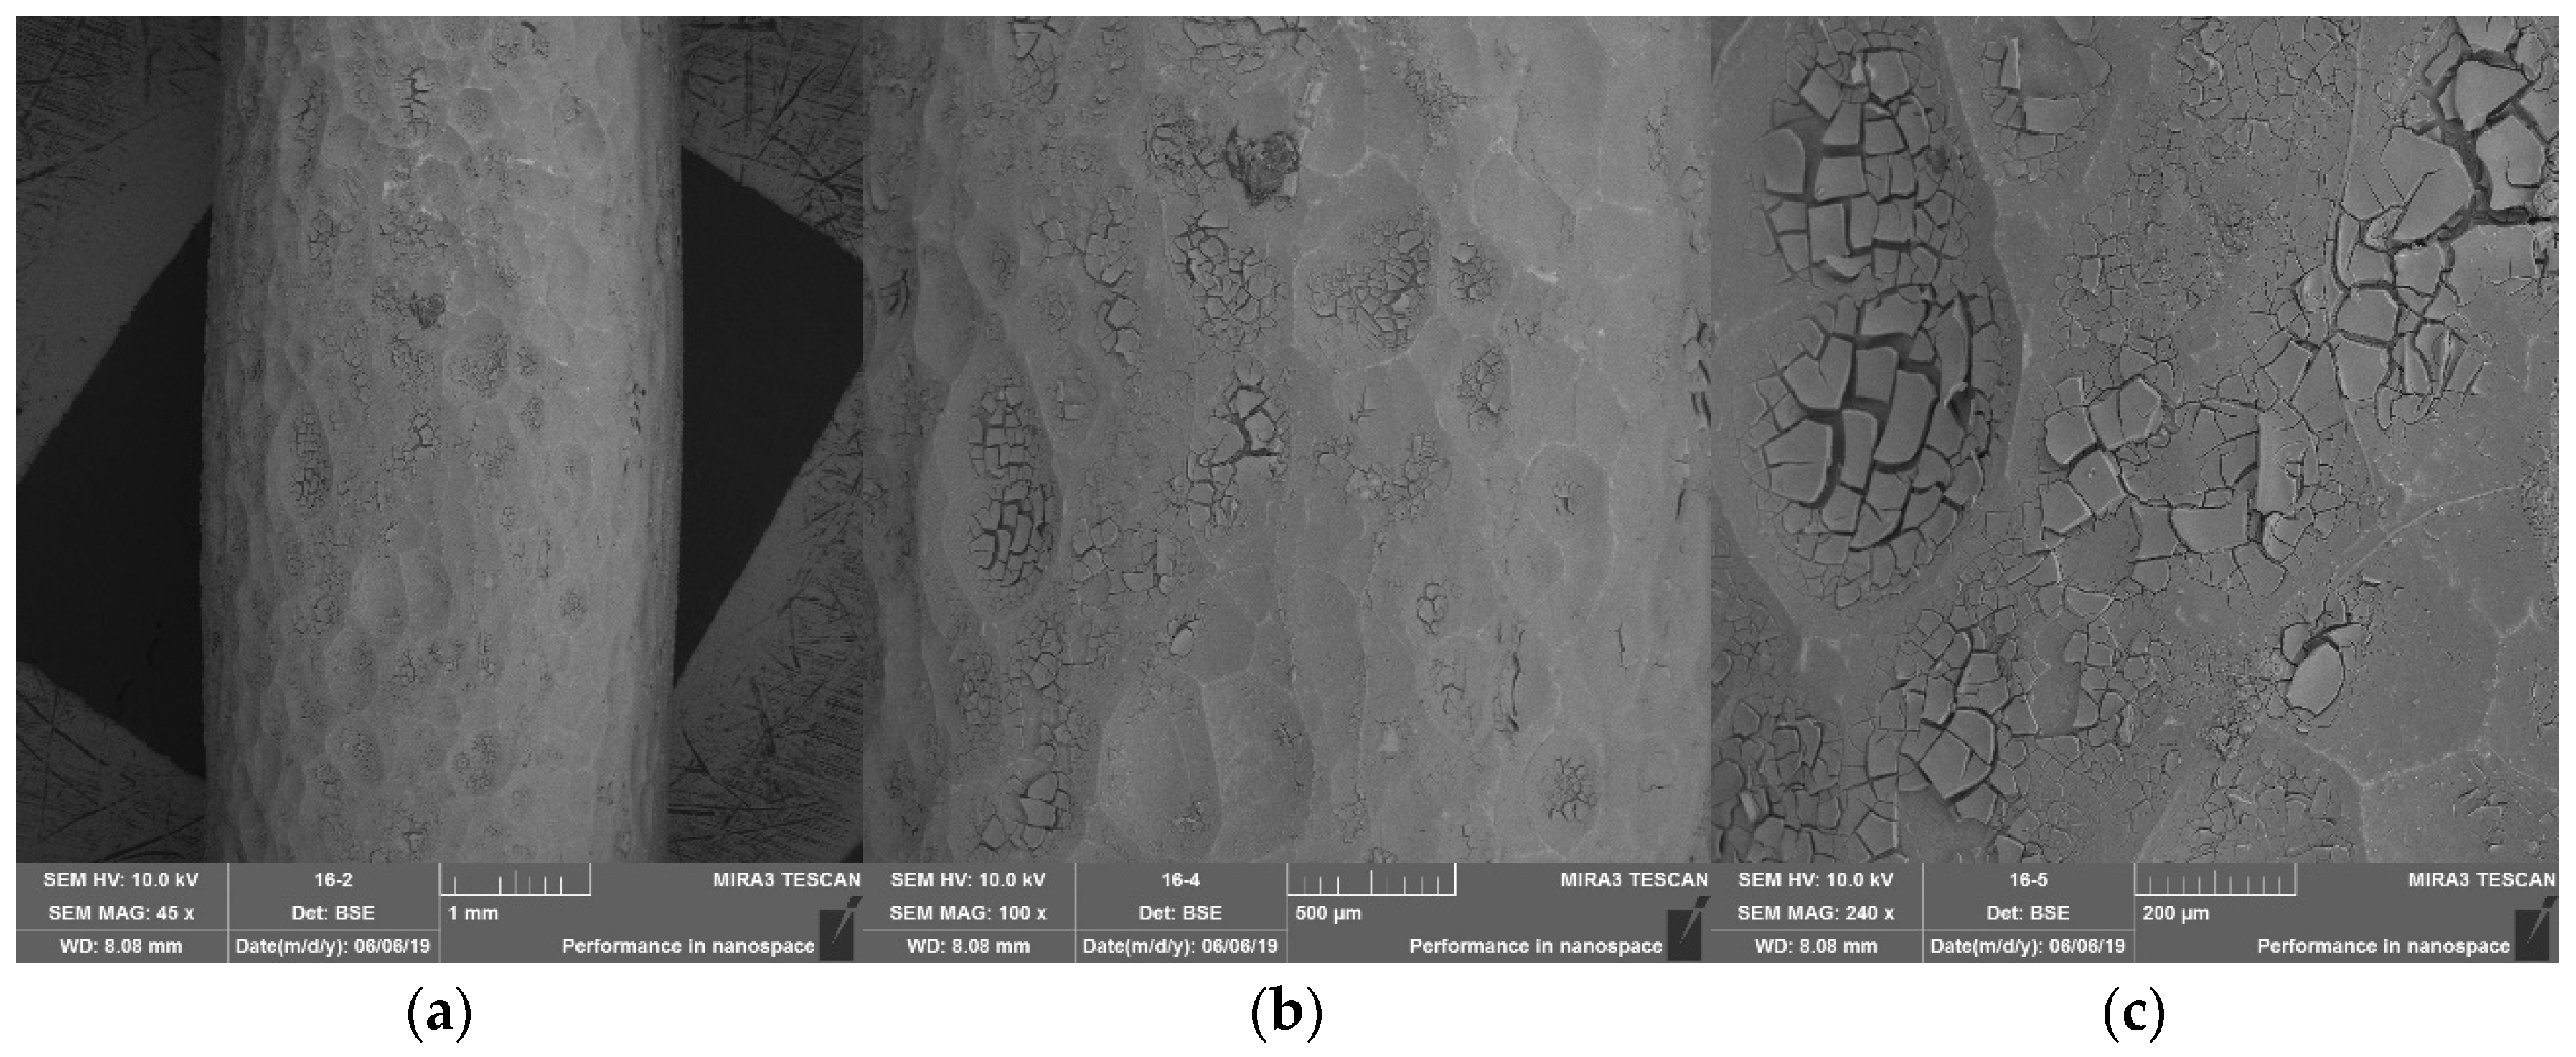
Figure 13 shows SEM micrographs of the surface of a sample containing five layers of protective coating applied by sequential immersion in tetraethoxysilane and ammonia.
As can be seen from Figure 13, after the application of the five layers of protective coating, the surface of the sample is covered with a significant layer of silicon oxide. With magnification, it can be seen that in the pitting recesses, the oxide layer is denser, resulting in cracking of the coating.
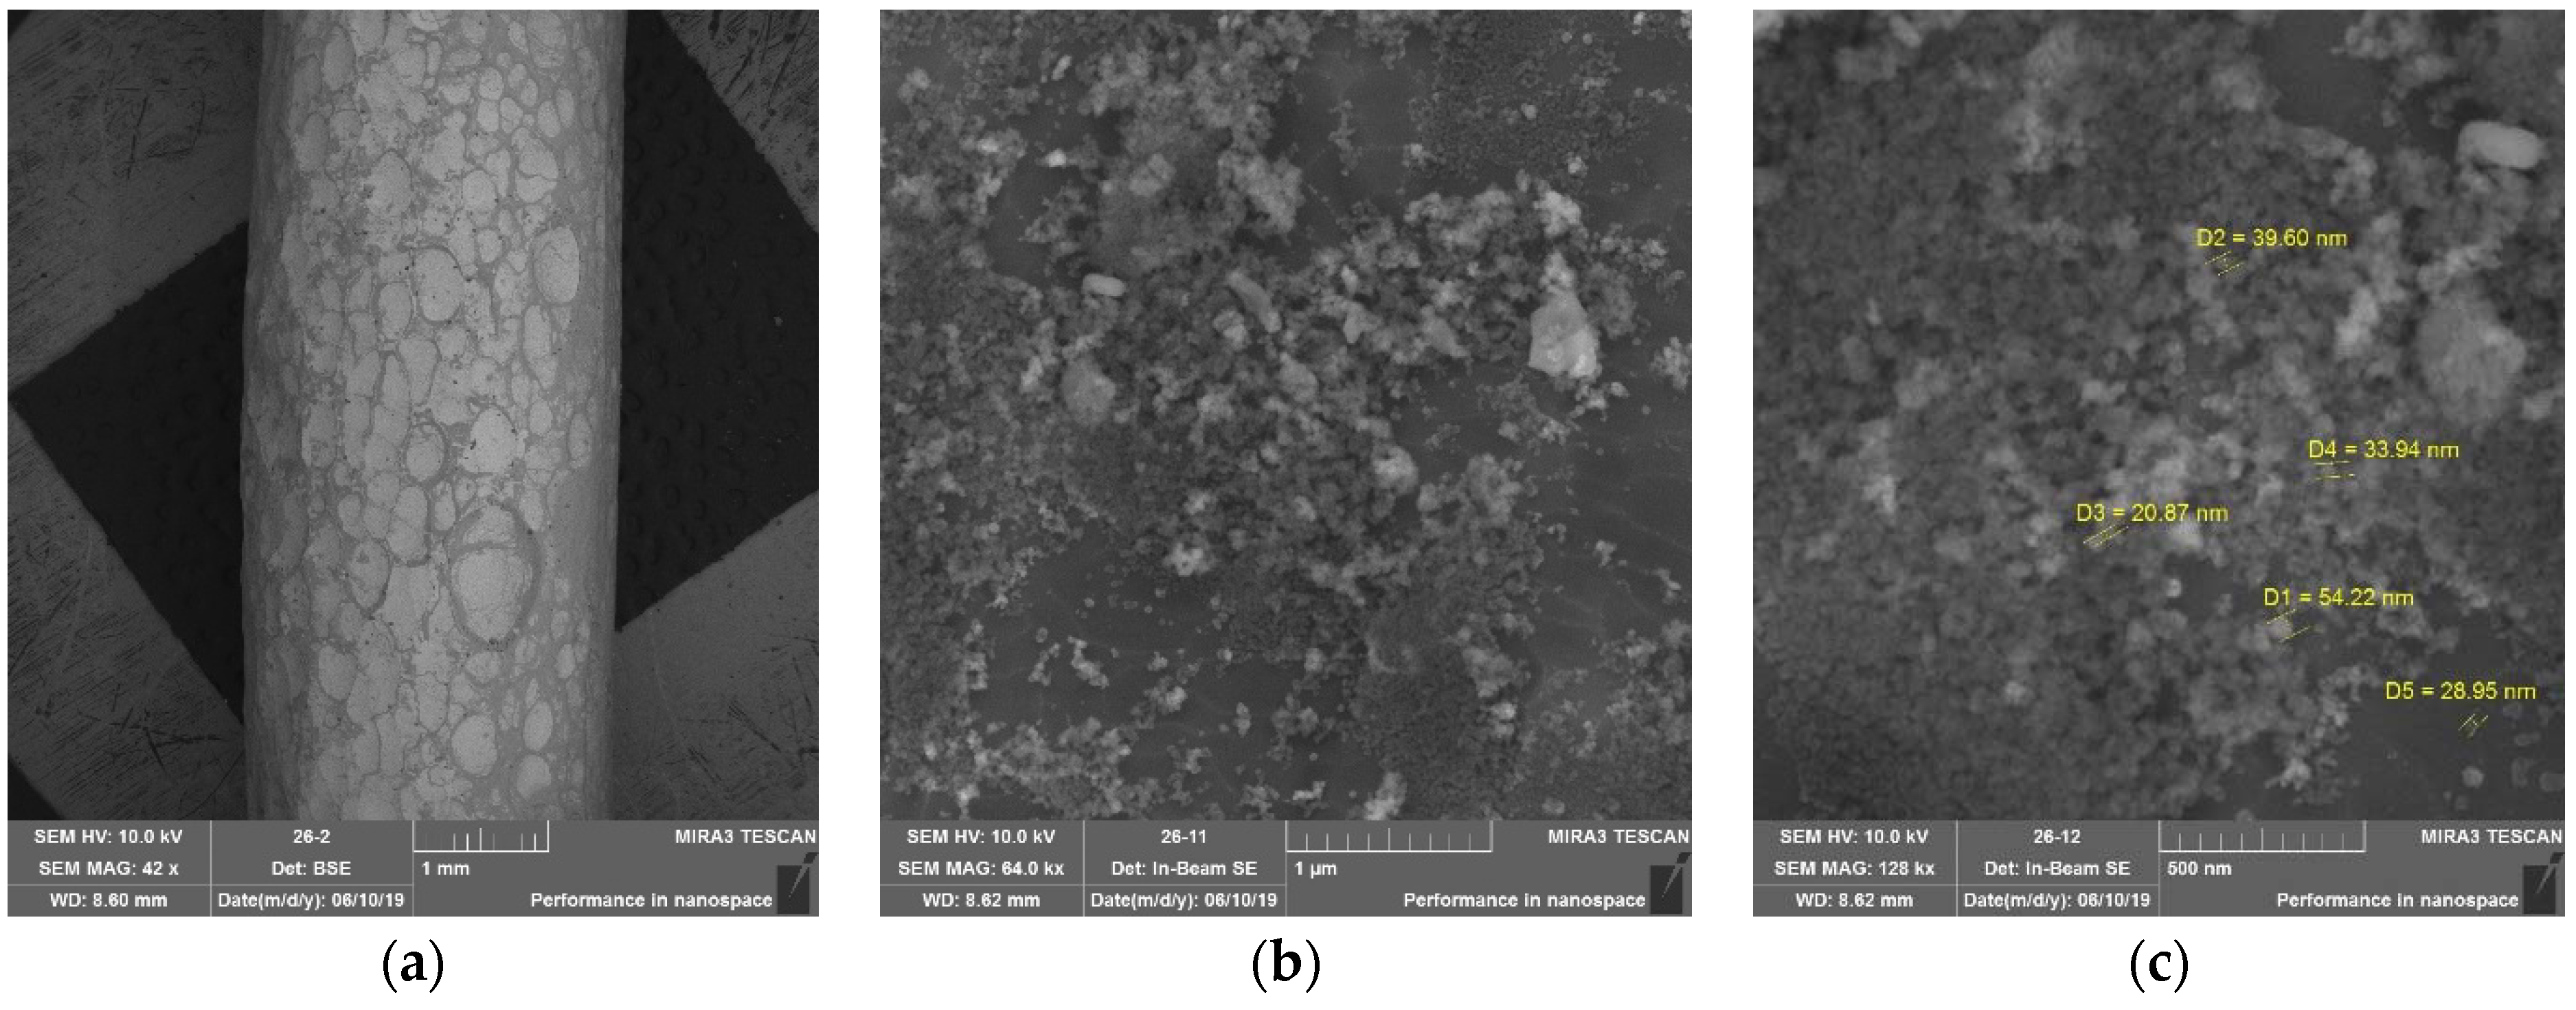
Figure 14, Figure 15 and Figure 16 show SEM micrographs of samples containing one, three, and five layers of protective coating, respectively, deposited by immersion in SiO2 nanoparticles sol.
As can be seen from Figure 14, Figure 15 and Figure 16, the surface of the ABE wire after applying layers of silicon oxide, regardless of the number of layers, is not uniformly coated. The degree of coating increases with the number of cycles of silicon oxide application, but the main amount of aluminum oxide is decreased. With magnification, it can be seen that the coating is not homogeneous and consists of a silicon oxide nanosphere with different diameters ranging from 20 to 55 nm.
Thus, by the comparison of SEM micrographs of the surface of ABE wire samples with protective coating, we can conclude that the sequential immersion method in tetraethoxysilane and ammonia lead to denser and more uniform films of silicon oxide on the samples’ surface, while immersion in SiO2 nanoparticles sol does not allow for the achievement of the same degrees of surface coatings.

3.3. Investigation of Structural and Mechanical Properties of Nanostructured Coatings

In the next stage of research, we investigated the structural and mechanical characteristics of the coated wires on a universal testing machine LabTest 6. We used the DOLI Test & Motion software Version 3.5. As a result of the study, stretching diagrams were obtained for all samples. Three of them are shown in Figure 17.
Based on the analysis of tensile diagrams, the dependences of the tensile strength of the samples on the coating cycles were obtained and are presented in Figure 18.
An analysis of the dependences obtained showed that the deposition of a nanostructured oxide coating on the wire increases the tensile strength of the material. It can be seen that for the sample coated by successive immersion in tetraethoxysilane and ammonia, the tensile strength was about 2385 N after five deposition cycles, and for the wire coated by immersion in the SiO2 nanoparticle sol, the tensile strength was about 2305 N after five cycles. Thus, a coating deposited by successive immersion in tetraethoxysilane and ammonia exhibits increased strength, which is due to the uniform distribution of dense silicon oxide films on the surface of the samples. The results of investigation of structural and mechanical properties of nanostructured coatings are consistent with the results of the study of the microstructure of the surface of AEF wires. It is important to note that this material does not have a yielding area.

3.4. Investigation of the Effect of the Number of Nanostructured Coating Layers on the Wetting Contact Angle

In addition to studying the structural and mechanical properties of the samples, we analyzed the effect of the number of layers of oxide nanostructured coating on the wetting contact angle. The results of this study are presented in Figure 19.
The analysis showed that the application of 1–2 layers of nanostructured oxide coating hardly affected the wetting contact angle. By applying 3–4 layers of oxide nanostructured coating, an increase in the wetting contact angle reached 90°, which indicates the formation of hydrophobic properties of the surface. In the samples with five layers of oxide nanostructured coating, the value of the wetting contact angle exceeded 120°, which is characteristic of materials with superhydrophobic properties. It should be noted that the sequential immersion method in tetraethoxysilane and ammonia achieves a larger wetting contact angle than the immersion method in SiO2 nanoparticles sol.

3.5. Investigation of the Effectiveness of Nanostructured Coating in Critical Climatic Conditions

To study the effectiveness of the oxide nanostructured coating under model conditions, we placed three ABE wires in a climate chamber with humidity set at 98% and a temperature of −40 °C for 24 h. The first sample was treated with an oxide nanostructured coating developed by sequential immersion in tetraethoxysilane and ammonia; the second sample was treated by immersion in SiO2 nanoparticle sol; and the third sample was a control. The result is shown in Figure 20.
As a result, the samples of the control group contained 24.57 ± 1.34 g of ice, and the ABE wire samples treated by successive immersion in tetraethoxysilane and ammonia contained 9.41 ± 0.47 g of ice. No ice crust formation was observed on the surface of ABE wire samples treated by sequential immersion in tetraethoxysilane and ammonia. The mass change in this series of samples before and after being placed in the climate chamber was 0.52 ± 0.13 g.

3.6. Investigation of the Effect of a Nanostructured Coating on a High-Frequency Signal

As it is known, the protective coatings under development for overhead line wires can improve or deteriorate the bandwidth of high-frequency communication channels, as well as affect the electrical characteristics of the conductor. Therefore, we experimentally determined the change of the studied characteristics from the application method and the number of layers of oxide nanostructured coating [35,36,37].
The influence of the nanostructured coating on the high-frequency signal was determined in the National Instruments LabVIEW software package using the BNC-2120 module generating a frequency signal. During the experiment, we increased the frequencies from 50 Hz to 239,000 Hz and observed changes in voltage parameters with frequency changes. In the experiment, three types of wire were used. A wire without any application, a wire with the application of tetraethoxysilane and ammonia solution, and a wire with the application of SiO2 nanoparticles sol. Figure 21 shows the signal attenuation graphs at different frequencies for all ABE wire samples.
According to the obtained graph, it can be concluded that the wire coated with tetraethoxysilane and ammonia at a frequency of 100,000 Hz has the smallest voltage deviation. Thus, it can be said that covering the wire with tetraethoxysilane and ammonia results in a significant decrease in the magnitude of signal attenuation in the studied range.

3.7. Investigation of the Effect of a Nanostructured Coating on the Resistance of an ABE Wire

The effect of nanocoating on the resistance of the ABE wire was evaluated using the LabVIEW software package version 2022 Q3. The resistance of each aluminum core with a length of 30 cm was measured. Figure 22 shows the resistance values of ABE wire samples.
From the graphs (Figure 22), it can be seen that the reactance value (X) of the SiO2-coated ABE wire decreased by 18% compared to the control sample (from 0.000325 ± 0.00001 to 0.000275 ± 0.00001), while the total resistance (Z) also decreased by 13% (from 0.00034 ± 0.00001 to 0.00030 ± 0.00001), which leads to a decrease in active power losses and an improvement in the parameters of the electrical regime. At the same time, the highest resistance value was observed in the samples treated by tetraethoxysilane and ammonia. Based on these results, it can be concluded that power losses will be minimal at SiO2 coating application.

3.8. Investigation of the Effect of Nanostructured Coating on the Mechanical Characteristics of Power Lines

Since the applied substance has its own density and mass (the density of the applied substance g0 = 2.65 kg/m3 and the wall thickness of one coating layer b = 0.0002 mm), it is necessary to create conditions such that the sag, as well as distance to the ground, is within acceptable limits according to the electrical installation rules (Table 5) [35].
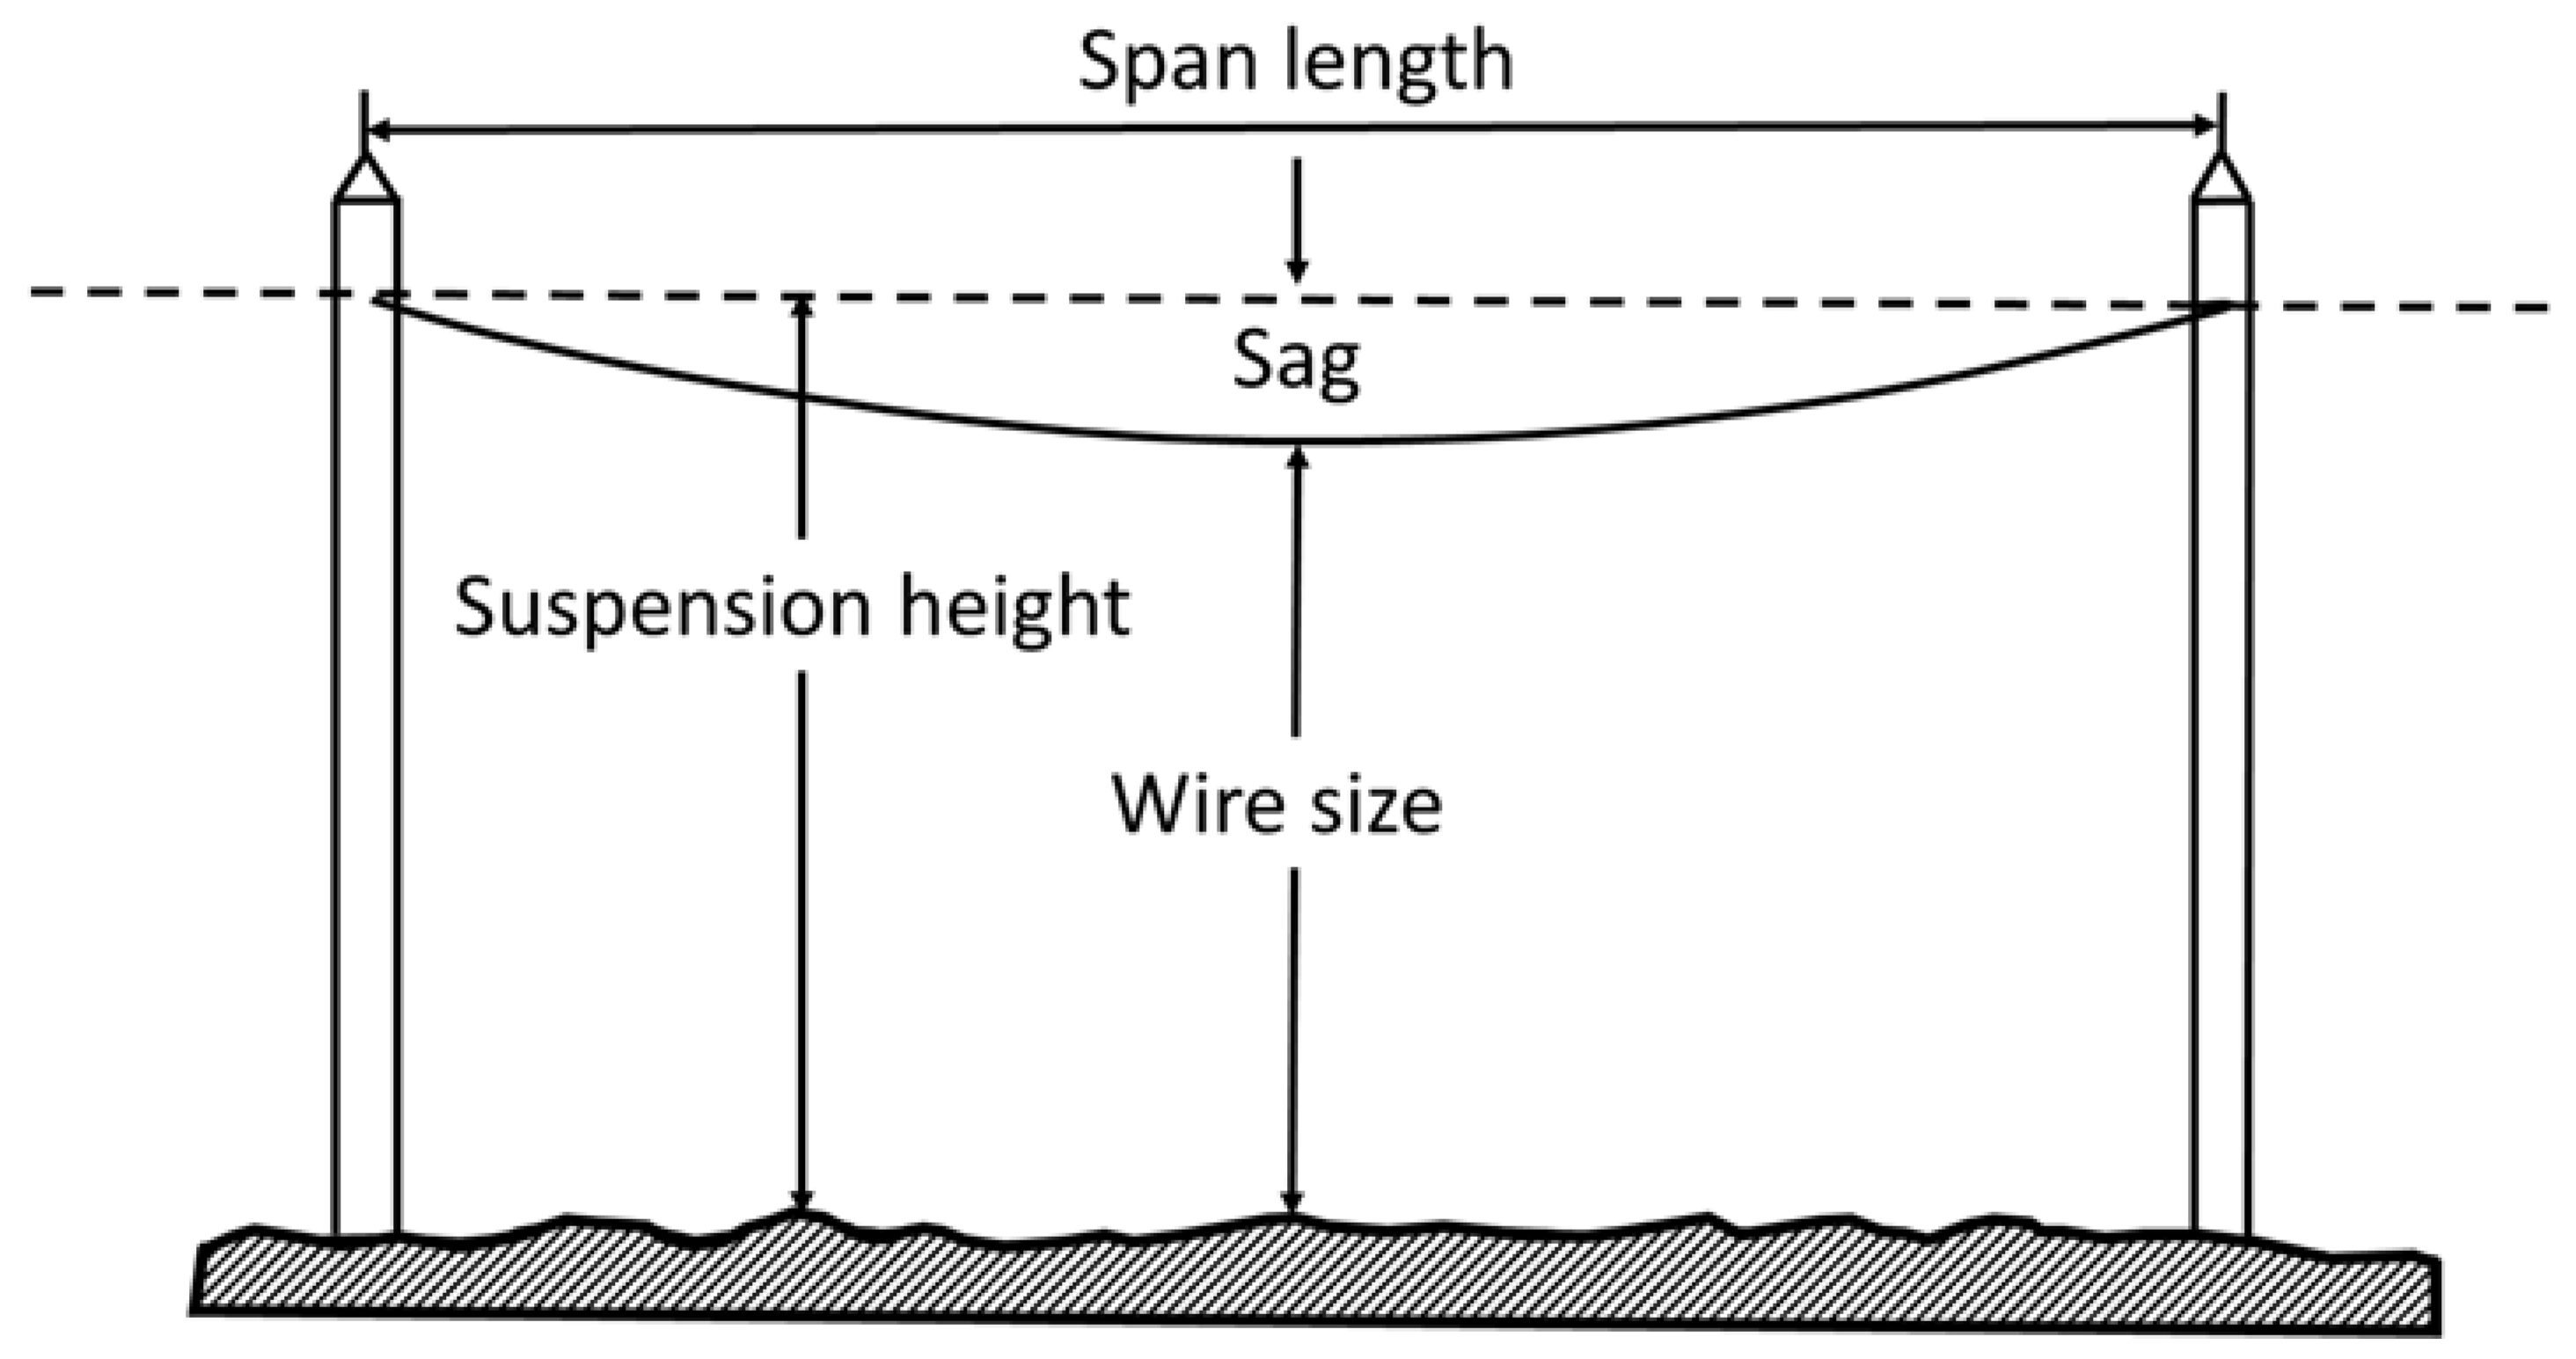
The sagging arrow is the vertical distance between an imaginary horizontal line with the wire attachment point and the lowest point of the wire sagging in the span (Figure 23). The ground dimension is referred to as the smallest vertical distance between the lowest point of wire sag and the surface of the earth (rivers, lakes, railways, bridges, etc.). The span length is the distance along the line between two adjacent intermediate supports [38].
The wires are subjected to mechanical loads directed vertically (self-weight and ice) and horizontally (wind). Under the action of loads, tensile stresses occur in the metal [38]. A single load is a load that falls on 1 m of wire length. A specific unit load is a mechanical load uniformly distributed along the wire span, which falls on 1 m of the length of the wire and 1 mm2 of the wire cross-section [39]. These loads are calculated under the condition that the load is uniformly distributed and there are no wind gusts.
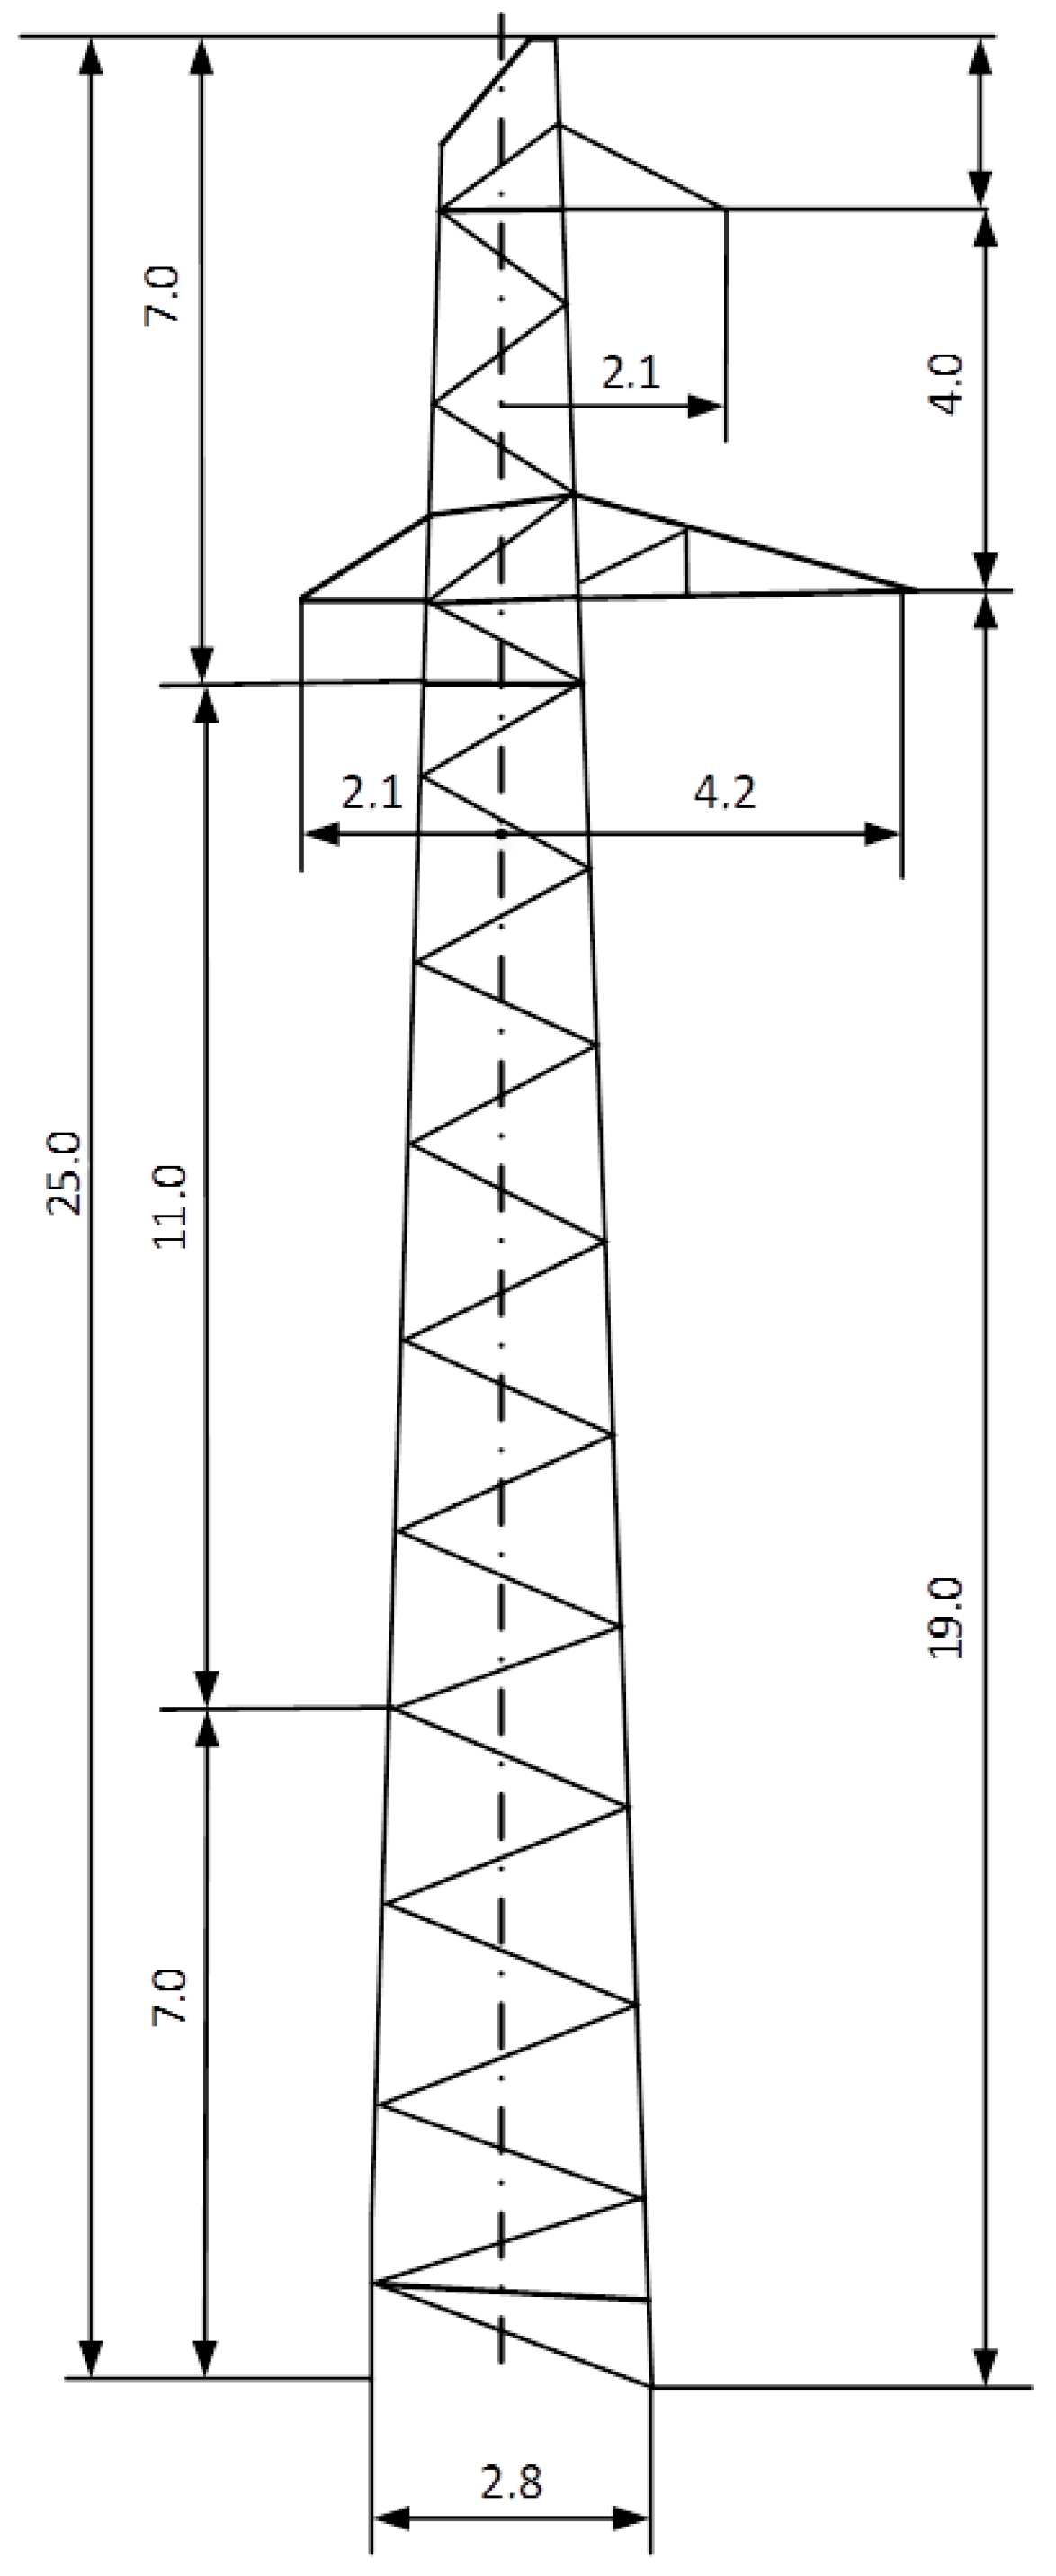
To calculate the dependence of the wire sag on the mass of the oxide nanostructured coating, we used an experimental intermediate support P-1TS-St-S (Table 6, Figure 24) [40].
For the calculated theoretical experiment, we used the PS-70-V insulator corresponding to the voltage (Table 7) and the geometric dimensions of the line (Table 8)
With data on the experimental support and the insulator, we can calculate the maximum possible sag. Calculations were carried out in accordance with the guidelines “Mechanical part of overhead power lines” and GOST 839-2019 “Non-insulated conductors for overhead power lines. Specifications” [41,42,43].
The sag is defined as:
f m a x = h w i r e H s i z e Δ H s i z e ,
where:
Hsize—Line size, m;
ΔHsize—Size margin, m;
hwire—Height of the wires to the insulators, which is equal to:
h w i r e = h w λ ,
where:
λ—the constructive length of the insulators (1.35 m);
hw—the arithmetic mean of the heights of the centers of gravity of individual wires, which is equal to:
h w = h w 1 + h w 2 + h w 3 3
h w = 19 + 19 + 23 3 = 20.3   m
Using Equation (2), we found the height of the wire fixation:
h w i r e = 20.3 1.35 = 18.95   m .
Further, according to Formula (1), we calculated the maximum allowable sag:
f m a x = 18.95 7 0.3 = 11.65   m .
The stress of the wire’s own weight, which depends on its material, can be determined by Formula (4).
γ 1 = G 0 × 10 3 F c a l
where:
G0—weight of 1 km of wire, kg/km;
Fcal—the calculated cross-section of the wire, mm2 (reference value) [44].
For experimental calculations, we used normative characteristics of the ABE wire (Table 9).
𝛾1 = 471 × 10−3/136.43 = 3.452 × 10⁻³ daN/m·mm2.
Knowing the load of the wire from its own weight, we calculated the sag using Formula (5).
f = γ 1 × L s i z e 2 8 × σ t o l ,
where:
Lsize—overall span length (400 m);
σtol—standard permissible wire voltage.
f = 3.452 × 10 3 × 400 2 8 × 8.7 = 7.93   m .
Thus, it can be concluded that the sag remains within the allowable range when loaded by the wire’s own weight. We then calculated the load of a wire with N layers of oxide nanostructured coating (Formula (6)).
γ 2 N = g 0 × π × N × b c a l ( d + N × b c a l ) × 10 3 F c a l ,
where:
g0—density of coating (2.65 kg/m3);
bcal—thickness of 1 layer;
d—outer diameter of the ABE wire (15.2 mm);
N—number of layers.
Then, we calculated the load of a wire with one layer of oxide nanostructured coating:
𝛾21 = 2.65 × 3.14 × 1 × 0.0002(15.2 + 1 × 0.0002) × 10−3/136.43 = 1.855 × 10⁻⁷ daN/m·mm2
The weight of the wire was also calculated with an increase in the amount of oxide nanostructured coating by one layer (Formula (7)).
γ 3 2 = γ 1 + γ 2 1 ,
γ 3 2 = 3.452 × 10 3 + 1.855 × 10 7 = 3.4522 · 10 3   daN / m · mm 2 .
From the calculations, it can be seen that one layer of the applied coating changes the load of 0.0002 · 10 3   daN/m·mm2 (0.006%), which will not affect the increase in the sag, b how will the situation change if the overhead line wire is treated with 100 layers of oxide nanostructured coating? The following is a similar calculation using Formulas (6) and (7):
γ 2 100 = 2.65 × 3.14 × 100 × 0.0002 ( 15.2 + 100 × 0.0002 ) × 10 3 136.43 = 1.858 × 10 5   daN / m · mm 2 .
            γ 3 100 = 3.452 × 10 3 + 1.858 × 10 5 = 3.471 × 10 3   daN / m · mm 2 .
The value of sag according to Formula (5) will be:
f = 3.471 × 10 3 × 400 2 8 × 8.7 = 7.98   m .
Even with 100 layers of nanostructured oxide coating on the ABE wire, the load will increase by 0.019 × 10 3 daN/m·mm2 (0.55%), and the sag will only increase by 0.05 m, which will also be absolutely not critical. In addition, we carried out calculations for a large number of hydrophobic coating layers.

4. Conclusions

We have developed a nanostructured coating for the protection of the wires of power lines. Two methods of applying a nanostructured coating to the surface of the ABE wire were used in this work: the method of sequential immersion in a solution of tetraethoxysilane and ammonia, and the method of immersion in SiO2 nanoparticles sol. We have established that the method of sequential immersion in a solution of tetraethoxysilane and ammonia is optimal, which has the following advantages compared to the method of immersion in SiO2 nanoparticles sol:
formation of denser and more homogeneous coatings, consisting of silicon oxide nanoparticles with a diameter from 26 to 65 nm;
higher content of silicon (21.68 ± 0.14% compared to 15.8 ± 0.05%) and oxygen (46.95 ± 0.27% compared to 37.8 ± 0.28%) in samples of nanostructured coatings;
higher tensile strength (2385 N compared to 2305 N);
higher wetting contact angle (130° compared to 110°);
higher efficiency in critical climatic conditions (ice mass 0.52 ± 0.13 compared to 9.41 ± 0.47 g);
lower voltage deviation at 100,000 Hz (0.5% compared to 3.5%).
The disadvantage of nanostructured coatings obtained by sequential immersion in a solution of tetraethoxysilane and ammonia is an increase in reactive and total resistance, which leads to a loss of power in transmission lines. The use of nanostructured coatings obtained by immersion in SiO2 nanoparticles sol allows for the reduction of the reactive resistance by 18% and the total resistance by 13% compared with the control sample.
The calculation of the sag and the mechanical effect of the additional weight of the nanostructured coating showed that the application of five layers of coating does not significantly affect the mechanical characteristics of power lines.
The data obtained will become the basis for the industrial introduction of a new type of hydrophobic coatings for wires intended for northern regions with extremely low seasonal temperatures.

Author Contributions

A.V.B.: conceptualization, methodology, and supervision; D.A.K.: conceptualization, methodology, and supervision; M.A.Y.: methodology and investigation; P.A.Z.: investigation and formal analysis; L.P.A.: methodology and investigation; V.N.V.: investigation and visualization; R.A.Z.: investigation and writing—original draft; A.A.K.: investigation; D.G.M.: investigation and software; A.B.G.: investigation and visualization; A.A.G.: validation, software, and investigation; N.V.L.: formal analysis and resources; E.N.K.: writing—review and editing and resources; V.N.G.: formal analysis and resources; M.A.K.: investigation; M.A.S.: writing—review and editing; A.A.N.: writing—review and editing and project administration.. All authors have read and agreed to the published version of the manuscript.

Funding

This research received no external funding.

Institutional Review Board Statement

Not applicable.

Informed Consent Statement

Not applicable.

Data Availability Statement

All data are available upon request to the corresponding author.

Acknowledgments

The authors are thankful to the reviewers for positive evaluation of the article, useful recommendations, and for the time devoted to reviewing our manuscript. The work was carried out using the equipment of the Center for Collective Use of the North Caucasus Federal University with financial support from the Ministry of Education and Science of Russia, unique project identifier RF—2296.61321x0029 (agreement No. 075-15-2021-687).

Conflicts of Interest

The authors declare that they have no known competing financial interests or personal relationships that could have appeared to influence the work reported in this paper.

References

  1. Farzaneh, M.; Savadjiev, K. Statistical Analysis of Field Data for Precipitation Icing Accretion on Overhead Power Lines. IEEE Trans. Power Deliv. 2005, 20, 1080–1087. [Google Scholar] [CrossRef]
  2. Ruszczak, B.; Tomaszewski, M. Extreme Value Analysis of Wet Snow Loads on Power Lines. IEEE Trans. Power Syst. 2015, 30, 457–462. [Google Scholar] [CrossRef]
  3. Laforte, J.L.; Allaire, M.A.; Laflamme, J. State-of-the-Art on Power Line De-Icing. Atmos. Res. 1998, 46, 143–158. [Google Scholar] [CrossRef]
  4. Cerrai, D.; Koukoula, M.; Watson, P.; Anagnostou, E.N. Outage Prediction Models for Snow and Ice Storms. Sustain. Energy Grids Netw. 2020, 21, 100294. [Google Scholar] [CrossRef]
  5. Wang, F.; Li, C.; Lü, Y. Influence of Hydrophobic Coating on Ice Accretion on Aluminum Conductor. Zhongguo Dianji Gongcheng Xuebao/Proc. Chin. Soc. Electr. Eng. 2011, 31, 123–128. [Google Scholar]
  6. Menini, R.; Farzaneh, M. Elaboration of Al2O3/PTFE Icephobic Coatings for Protecting Aluminum Surfaces. Surf. Coat. Technol. 2009, 203, 1941–1946. [Google Scholar] [CrossRef]
  7. Yury, K.; Filippov, M.; Makarov, A.; Malygina, I.; Soboleva, N.; Fantozzi, D.; Andrea, M.; Koivuluoto, H.; Vuoristo, P. Arc-Sprayed Fe-Based Coatings from Cored Wires for Wear and Corrosion Protection in Power Engineering. Coatings 2018, 8, 71. [Google Scholar] [CrossRef]
  8. Xu, X.; Zhang, Z.; Guo, F.; Yang, J.; Zhu, X.; Zhou, X.; Xue, Q. Fabrication of Bionic Superhydrophobic Manganese Oxide/Polystyrene Nanocomposite Coating. J. Bionic Eng. 2012, 9, 11–17. [Google Scholar] [CrossRef]
  9. Qing, Y.; Zheng, Y.; Hu, C.; Wang, Y.; He, Y.; Gong, Y.; Mo, Q. Facile Approach in Fabricating Superhydrophobic ZnO/Polystyrene Nanocomposite Coating. Appl. Surf. Sci. 2013, 285, 583–587. [Google Scholar] [CrossRef]
  10. Syafiq, A.; Vengadaesvaran, B.; Ahmed, U.; Rahim, N.A.; Pandey, A.K.; Bushroa, A.R.; Ramesh, K.; Ramesh, S. Facile Synthesize of Transparent Hydrophobic Nano- CaCO3 Based Coatings for Self-Cleaning and Anti-Fogging. Mater. Chem. Phys. 2020, 239, 121913. [Google Scholar] [CrossRef]
  11. Chen, X.; Zhu, Y.; Guo, Y.; Zhou, B.; Zhao, X.; Du, Y.; Lei, H.; Li, M.; Wang, Z. Carbonization Synthesis of Hydrophobic CaCO3 at Room Temperature. Colloids Surf. A Physicochem. Eng. Asp. 2010, 353, 97–103. [Google Scholar] [CrossRef]
  12. Li, W.; Wang, Y.; Feng, Y.; Wang, Q.; Xu, X.; Li, G.; Dong, G.; Jing, S.; Chen, E.; Fan, X.; et al. Fabrication of Robust Conductive and Superhydrophobic Coating Based on Carbon Nanotubes. Mater. Res. Express 2020, 7, 055009. [Google Scholar] [CrossRef]
  13. De Volder, M.F.L.; Tawfick, S.H.; Baughman, R.H.; Hart, A.J. Carbon Nanotubes: Present and Future Commercial Applications. Science 2013, 339, 535–539. [Google Scholar] [CrossRef]
  14. Polizos, G.; Winter, K.; Lance, M.J.; Meyer, H.M.; Armstrong, B.L.; Schaeffer, D.A.; Simpson, J.T.; Hunter, S.R.; Datskos, P.G. Scalable Superhydrophobic Coatings Based on Fluorinated Diatomaceous Earth: Abrasion Resistance versus Particle Geometry. Appl. Surf. Sci. 2014, 292, 563–569. [Google Scholar] [CrossRef]
  15. Lee, S.G.; Ham, D.S.; Lee, D.Y.; Bong, H.; Cho, K. Transparent Superhydrophobic/Translucent Superamphiphobic Coatings Based on Silica–Fluoropolymer Hybrid Nanoparticles. Langmuir 2013, 29, 15051–15057. [Google Scholar] [CrossRef]
  16. Shang, H.M.; Wang, Y.; Limmer, S.J.; Chou, T.P.; Takahashi, K.; Cao, G.Z. Optically Transparent Superhydrophobic Silica-Based Films. Thin Solid Films 2005, 472, 37–43. [Google Scholar] [CrossRef]
  17. Mahadik, S.A.; Kavale, M.S.; Mukherjee, S.K.; Rao, A.V. Transparent Superhydrophobic Silica Coatings on Glass by Sol–Gel Method. Appl. Surf. Sci. 2010, 257, 333–339. [Google Scholar] [CrossRef]
  18. Sivolapov, P.; Myronyuk, O.; Baklan, D.; Berehovyj, T. Formation of effective concentration of film forming superhydrophobic coatings based on silicon dioxide. Technol. Audit. Prod. Reserves 2021, 3, 59. [Google Scholar] [CrossRef]
  19. Xu, L.; He, J. Fabrication of highly transparent superhydrophobic coatings from hollow silica nanoparticles. Langmuir 2012, 28, 7512–7518. [Google Scholar] [CrossRef]
  20. Rosales, A.; Maury-Ramírez, A.; Gutiérrez, R.M.-D.; Guzmán, C.; Esquivel, K. SiO2@TiO2 Coating: Synthesis, Physical Characterization and Photocatalytic Evaluation. Coatings 2018, 8, 120. [Google Scholar] [CrossRef]
  21. Mazur, M.; Wojcieszak, D.; Kaczmarek, D.; Domaradzki, J.; Song, S.; Gibson, D.; Placido, F.; Mazur, P.; Kalisz, M.; Poniedzialek, A. Functional Photocatalytically Active and Scratch Resistant Antireflective Coating Based on TiO2 and SiO2. Appl. Surf. Sci. 2016, 380, 165–171. [Google Scholar] [CrossRef]
  22. Sirimahachai, U.; Ndiege, N.; Chandrasekharan, R.; Wongnawa, S.; Shannon, M.A. Nanosized TiO2 Particles Decorated on SiO2 Spheres (TiO2/SiO2): Synthesis and Photocatalytic Activities. J. Sol-Gel Sci. Technol. 2010, 56, 53–60. [Google Scholar] [CrossRef]
  23. Radev, D.D.; Uzunov, I. Nanosized Silicon Carbide Obtained from Rice Husks. Solid State Phenom. 2010, 159, 153–156. [Google Scholar] [CrossRef]
  24. Dou, W.; Wang, P.; Zhang, D.; Yu, J. An Efficient Way to Prepare Hydrophobic Antireflective SiO2 Film by Sol–Gel Method. Mater. Lett. 2016, 167, 69–72. [Google Scholar] [CrossRef]
  25. Farimani, M.H.R.; Shahtahmasebi, N.; Rezaee Roknabadi, M.; Ghows, N.; Kazemi, A. Study of Structural and Magnetic Properties of Superparamagnetic Fe3O4/SiO2 Core–Shell Nanocomposites Synthesized with Hydrophilic Citrate-Modified Fe3O4 Seeds via a Sol–Gel Approach. Phys. E Low-Dimens. Syst. Nanostructures 2013, 53, 207–216. [Google Scholar] [CrossRef]
  26. Meng, X.; Qian, Z.; Wang, H.; Gao, X.; Zhang, S.; Yang, M. Sol-Gel Immobilization of SiO2/TiO2 on Hydrophobic Clay and Its Removal of Methyl Orange from Water. J. Sol-Gel Sci. Technol. 2008, 46, 195–200. [Google Scholar] [CrossRef]
  27. Pietrzyk, B.; Porȩbska, K.; Jakubowski, W.; Miszczak, S. Antibacterial Properties of Zn Doped Hydrophobic SiO2 Coatings Produced by Sol-Gel Method. Coatings 2019, 9, 362. [Google Scholar] [CrossRef]
  28. Parale, V.G.; Kim, T.; Lee, K.-Y.; Phadtare, V.D.; Dhavale, R.P.; Jung, H.-N.-R.; Park, H.-H. Hydrophobic TiO2–SiO2 Composite Aerogels Synthesized via in Situ Epoxy-Ring Opening Polymerization and Sol-Gel Process for Enhanced Degradation Activity. Ceram. Int. 2020, 46, 4939–4946. [Google Scholar] [CrossRef]
  29. Śmieszek, A.; Donesz-Sikorska, A.; Grzesiak, J.; Krzak, J.; Marycz, K. Biological Effects of Sol–Gel Derived ZrO2 and SiO2/ZrO2 Coatings on Stainless Steel Surface—In Vitro Model Using Mesenchymal Stem Cells. J. Biomater. Appl. 2014, 29, 699–714. [Google Scholar] [CrossRef]
  30. Xu, S.; Jia, H.; Wang, C.; Zhao, W.; Wang, Y.; Yang, C.; Wu, H.; Zhu, J.; Wang, B.; Wang, Q. Low-Temperature Preparation of SiO2/Nb2O5/TiO2–SiO2 Broadband Antireflective Coating for the Visible via Acid-Catalyzed Sol–Gel Method. Coatings 2020, 10, 737. [Google Scholar] [CrossRef]
  31. Blinov, A.V.; Jasnaja, M.A.; Kravtsov, A.A.; Gvozdenko, A.A.; Raffa, V.V. Microstructure and Elemental Composition of Multicomponent Systems Based on Silicon, Titanium and Zirconium Oxides. IOP Conf. Ser. Mater. Sci. Eng. 2021, 1029, 012060. [Google Scholar] [CrossRef]
  32. Gurav, A.B.; Xu, Q.; Latthe, S.S.; Vhatkar, R.S.; Liu, S.; Yoon, H.; Yoon, S.S. Superhydrophobic Coatings Prepared from Methyl-Modified Silica Particles Using Simple Dip-Coating Method. Ceram. Int. 2015, 41, 3017–3023. [Google Scholar] [CrossRef]
  33. Țălu, Ș. Micro and Nanoscale Characterization of Three Dimensional Surfaces. Basics and Applications; Napoca Star Publishing House: Cluj-Napoca, Romania, 2015; pp. 21–27. [Google Scholar]
  34. Elliott, C.; Vijayakumar, V.; Zink, W.; Hansen, R. National Instruments LabVIEW: A Programming Environment for Laboratory Automation and Measurement. J. Lab. Autom. 2007, 12, 17–24. [Google Scholar] [CrossRef]
  35. Kurita, T.; Nishimori, Y.; Toshimitsu, F.; Muratsugu, S.; Kume, S.; Nishihara, H. Surface Junction Effects on the Electron Conduction of Molecular Wires. J. Am. Chem. Soc. 2010, 132, 4524–4525. [Google Scholar] [CrossRef] [PubMed]
  36. Zhang, X.; Cotton, I.; Li, Q.; Rowland, S.M.; Emersic, C.; Lian, C.; Li, W. Experimental Verification of the Potential of Superhydrophobic Surfaces in Reducing Audible Noise on HVAC Overhead Line Conductors. High Volt. 2022, 7, 692–704. [Google Scholar] [CrossRef]
  37. Arshad; Momen, G.; Farzaneh, M.; Nekahi, A. Properties and Applications of Superhydrophobic Coatings in High Voltage Outdoor Insulation: A Review. IEEE Trans. Dielectr. Electr. Insul. 2017, 24, 3630–3646. [Google Scholar] [CrossRef]
  38. Brumsickle, W.E. Dynamic Sag Correctors: Cost-Effective Industrial Power Line Conditioning. IEEE Trans. Ind. Appl. 2001, 37, 212–217. [Google Scholar] [CrossRef]
  39. Oluwajobi, F.; Ale, O.; Ariyanninuola, A. Effect of Sag on Transmission Line. J. Emerg. Trends Eng. Appl. Sci. 2012, 3, 627–630. [Google Scholar]
  40. Rezaeva, M.A. Lightning Resistance Analysis of Overhead Power Lines on Composite Supports in Comparison with Overhead Lines on Traditional Supports. In Proceedings of the 2020 International Multi-Conference on Industrial Engineering and Modern Technologies (FarEastCon), Vladivostok, Russia, 6–9 October 2020; IEEE: Piscataway, NJ, USA, 2020; pp. 1–5. [Google Scholar]
  41. GOST 839-2019; Non-Insulated Conductors for Overhead Power Lines. Specifications. USSR State Committee for Standards: Moscow, Russia, 2019; p. 21.
  42. Popov, E.N. Mechanical Part of Overhead Power Lines; Amur State un-t: Blagoveshchensk, Russia, 1999. [Google Scholar]
  43. Farzaneh, M.; Jakl, F.; Arabani, M.P.; Eliasson, A.J.; Fikke, S.M.; Gallego, A.; Haldar, A.; Isozaki, M.; Lake, R.; Leblond, L. Systems for Prediction and Monitoring of Ice Shedding, Anti-Icing and De-Icing for Power Line Conductors and Ground Wires; University of Huddersfield: Huddersfield, UK, 2010. [Google Scholar]
  44. Faibisovich, D.L. Electrical Network Design Handbook; ENAS: Moscow, Russia, 2012. [Google Scholar]
Figure 1. Scheme of formation of a nanostructured coating by SiO2 sol deposition.
Coatings 12 01346 g001
Figure 2. Scheme of formation of a nanostructured coating by sequential immersion in tetraethoxysilane and ammonia.
Coatings 12 01346 g002
Figure 3. Connection diagram of the BNC-2120 module with ABE wire.
Coatings 12 01346 g003
Figure 4. The first part of the block diagram panel.
Coatings 12 01346 g004
Figure 5. The second part of the block diagram panel.
Coatings 12 01346 g005
Figure 6. Histogram of SiO2 nanoparticle size distribution.
Coatings 12 01346 g006
Figure 7. Relative change in the mass of ABE wire samples treated with SiO2 nanoparticles sol.
Coatings 12 01346 g007
Figure 8. Relative change in the mass of ABE wire samples treated with a hydrophobic coating by sequential immersion method.
Coatings 12 01346 g008
Figure 9. Spectrum of the elemental composition of an electrical aluminum alloy of one of the ABE wire samples.
Coatings 12 01346 g009
Figure 10. Micrography of the SEM surface of metallic aluminum.
Coatings 12 01346 g010
Figure 11. SEM micrographs of the surface of a sample containing one layer of protective coating applied by sequential immersion in tetraethoxysilane and ammonia. (a) zoom ×46; (b) zoom ×100; (c) zoom ×64,000.
Coatings 12 01346 g011
Figure 12. SEM micrographs of the surface of a sample containing three layers of protective coating applied by sequential immersion in tetraethoxysilane and ammonia. (a) zoom ×48; (b) zoom ×240; (c) zoom ×500.
Coatings 12 01346 g012
Figure 13. SEM micrographs of the surface of a sample containing five layers of protective coating applied by sequential immersion in tetraethoxysilane and ammonia. (a) zoom ×45; (b) zoom ×100; (c) zoom ×240.
Coatings 12 01346 g013
Figure 14. SEM micrographs of the surface of a sample containing one layer of protective coating applied by immersion in SiO2 nanoparticles sol. (a) zoom ×42; (b) zoom ×32,000; (c) zoom ×64,000.
Coatings 12 01346 g014
Figure 15. SEM micrographs of the surface of a sample containing three layers of protective coating applied by immersion in SiO2 nanoparticles sol. (a) zoom ×44; (b) zoom ×100; (c) zoom ×64,000.
Coatings 12 01346 g015
Figure 16. SEM micrographs of the surface of a sample containing five layers of protective coating applied by immersion in SiO2 nanoparticles sol. (a) zoom ×42; (b) zoom ×64,000; (c) zoom ×128,000.
Coatings 12 01346 g016
Figure 17. Stretching diagrams: (a) ABE wires treated by sequential immersion in tetraethoxysilane and ammonia (five cycles); (b) ABE wires treated by immersion in SiO2 nanoparticles sol (five cycles); (c) uncoated wires (control sample).
Coatings 12 01346 g017
Figure 18. The dependences of the value of the tensile strength of samples on the number of coating cycles on the surface of the ABE wires: (a) ABE wires treated by sequential immersion in tetraethoxysilane and ammonia; (b) ABE wires treated by immersion in SiO2 nanoparticles sol; (c) uncoated wires (control sample).
Coatings 12 01346 g018
Figure 19. Dependence of the wetting contact angle on the number of application cycles: (a) ABE wires treated by sequential immersion in tetraethoxysilane and ammonia; (b) ABE wires treated by immersion in SiO2 nanoparticles sol; (c) uncoated wires (control sample).
Coatings 12 01346 g019
Figure 20. Photograph of ABE wire after climate chamber: (a) control sample (b) ABE wires treated by immersion in SiO2 nanoparticles sol (c) ABE wires treated by sequential immersion in tetraethoxysilane and ammonia.
Coatings 12 01346 g020
Figure 21. Graph of attenuation values for different frequencies: (a) ABE wires treated by sequential immersion in tetraethoxysilane and ammonia (five cycles); (b) ABE wires treated by immersion in SiO2 nanoparticles sol (five cycles); (c) uncoated wires (control sample).
Coatings 12 01346 g021
Figure 22. Resistance values of ABE wire samples: (a) ABE wires treated by sequential immersion in tetraethoxysilane and ammonia (five cycles); (b) ABE wires treated by immersion in SiO2 nanoparticles sol (five cycles); (c) uncoated wires (control sample).
Coatings 12 01346 g022
Figure 23. Scheme of the main terminology of the power line.
Coatings 12 01346 g023
Figure 24. Steel intermediate support of 110 kV overhead line.
Coatings 12 01346 g024
Table 1. Chemical composition of the electrical aluminum alloy of the AVE brand.
-Chemical Composition, %wt.Tensile Strength, MPa
SiFeCuMgZnTi, V, Cr, MrAl
ABE0.45–0.600.35–0.70 0.050.45–0.60 0.05≈0.015remaining portion132–170
Table 2. Interpretation of the spectra of the elemental composition of an electrical aluminum alloy of the ABE wire samples.
ElementType of LineWeight, %Sigma Weight, %Content of Atom, %
CK series14.72 ± 0.17 0.5425.75 ± 0.21
OK series18.60 ± 0.230.1324.42 ± 0.23
NaK series0.33 ± 0.010.010.30 ± 0.01
MgK series0.18 ± 0.050.010.15 ± 0.01
AlK series56.19 ± 0.420.3643.73 ± 0.37
SiK series4.78 ± 0.070.033.57 ± 0.06
PK series0.15 ± 0.010.010.10 ± 0.01
SK series0.15 ± 0.010.010.10 ± 0.01
ClK series0.46 ± 0.020.010.27 ± 0.02
KK series0.70 ± 0.020.010.38 ± 0.02
CaK series0.45 ± 0.010.010.24 ± 0.01
TiK series0.09 ± 0.010.010.04 ± 0.01
FeK series1.46 ± 0.040.020.55 ± 0.04
ZnK series0.48 ± 0.030.020.15 ± 0.02
AgL series1.26 ± 0.020.020.24 ± 0.02
Summ:-100.00-100.00
Data presented are the mean of five repetitions (n = 5) ± standard error.
Table 3. The ratio of elements (% atom.) present in the samples prepared with sequential immersion method.
ElementsContent of Atom, %
Control1 Layer2 Layers3 Layers4 Layers5 Layers
C25.75 ± 0.2123.44 ± 0.319.72 ± 0.0810.39 ± 0.059.21 ± 0.0514.48 ± 0.07
O24.42 ± 0.2316.17 ± 0.0538.64 ± 0.1336.01 ± 0.2143.04 ± 0.1446.95 ± 0.27
Al43.73 ± 0.3757.1 ± 0.2137.8 ± 0.2640.43 ± 0.2429.36 ± 0.2816.7 ± 0.15
Si3.57 ± 0.063.16 ± 0.0513.56 ± 0.1012.87 ± 0.0518.09 ± 0.1821.68 ± 0.14
K0.38 ± 0.02-----
Ca0.24 ± 0.01-----
Ti0.04 ± 0.01-----
Fe0.55 ± 0.040.13 ± 0.010.14 ± 0.010.18 ± 0.010.14 ± 0.010.13 ± 0.02
Zn0.15 ± 0.02--0.02 ± 0.01--
Ag0.24 ± 0.02-0.05 ± 0.010.1 ± 0.010.15 ± 0.010.07 ± 0.01
Na0.30 ± 0.01-0.08 ± 0.01---
Mg0.15 ± 0.01-----
P0.10 ± 0.01-----
S0.10 ± 0.01-----
Cl0.27 ± 0.02-----
Table 4. The ratio of elements (% atom.) present in the samples prepared with the method of immersion of samples in SiO2 nanoparticles sol.
ElementsControl1 Layer2 Layers3 Layers4 Layers5 Layers
C25.75 ± 0.2115.56 ± 0.1823.69 ± 0.1312.7 ± 0.1210.19 ± 0.2114.2 ± 0.14
O24.42 ± 0.2313.47 ± 0.1325.73 ± 0.2025.1 ± 0.1931.82 ± 0.1437.8 ± 0.28
Al43.73 ± 0.3767.21 ± 0.3839.81 ± 0.3755.1 ± 0.3442.78 ± 0.2330.6 ± 0.21
Si3.57 ± 0.063.54 ± 0.129.49 ± 0.096.76 ± 0.0713.5 ± 0.0615.8 ± 0.05
K0.38 ± 0.02-0.22 ± 0.02--0.09 ± 0.01
Ca0.24 ± 0.01-0.05 ± 0.01-0.11 ± 0.010.09 ± 0.01
Ti0.04 ± 0.01---1.15 ± 0.030.78 ± 0.03
Fe0.55 ± 0.040.14 ± 0.010.16 ± 0.010.17 ± 0.010.12 ± 0.010.12 ± 0.01
Zn0.15 ± 0.02-0.02 ± 0.010.02 ± 0.010.02 ± 0.010.02 ± 0.01
Ag0.24 ± 0.02-0.21 ± 0.02-0.29 ± 0.030.24 ± 0.02
Na0.30 ± 0.010.05 ± 0.020.41 ± 0.010.09 ± 0.01-0.36 ± 0.01
Mg0.15 ± 0.01-----
P0.10 ± 0.01-----
S0.10 ± 0.01-0.04 ± 0.01---
Cl0.27 ± 0.02-0.16 ± 0.01---
Table 5. Minimal vertical distance between overhead wires and the ground surface and industrial buildings and structures in a populated area.
Working Conditions of the Overhead LinesThe Minimal Distance (m),
at an Overhead Lines Voltage (kV)
<20<35110150220330500750
To the surface of ground6777.581115.523
To industrial buildings and structures334457.5812
Wire breakage in an adjacent span to the ground surface5.05.55.55.55.56--
Table 6. Structural dimensions and characteristics of the support.
ParameterMeaning
Type of supportP-1TS-St-S
Total height of the support, m25
Installation height of the traverse of phase A, m19
Installation height of the traverse of phase B, m19
Installation height of the traverse of phase C, m23
Overall span length, m400
Table 7. Physical and mechanical characteristics of the insulator.
ParameterValue
Type of insulatorPS-70-B
Number of insulators8
Electromechanical destructive load, daN70
Total weight of insulators, kg36
Construction height, m1.35
Table 8. Geometric dimensions of the line.
ParameterValue
Height of insulators, m1.35
Height of the suspension of insulators of the wire 1 of the phase A circuit (hw1), m19
Height of the suspension of insulators of the wire 1 of the phase B circuit (hw2), m19
Height of the suspension of insulators of the wire 1 of the phase C circuit (hw3), m23
Line size, m7
Size margin, m0.3
Table 9. Physical and mechanical characteristics of the ABE wire.
Physical and Mechanical CharacteristicsValue
Diameter of the wire, mm15.2
Calculated cross-section of the wire Fcal, mm2136.43
Specific weight of the wire G0, kg/km471
Elastic modulus, E × 10−3 daN/mm28.25
Temperature coefficient of linear expansion α × 106 K−119.2
The normative permissible stress of the wire at the average annual temperature σtol, daN/m·mm28.7
Publisher’s Note: MDPI stays neutral with regard to jurisdictional claims in published maps and institutional affiliations.

