Article

Evaluation Test of NO Degradation by Nano-TiO2 Coatings on Road Pavements under Natural Light

1
School of Civil Engineering and Architecture, Wuhan University of Technology, Wuhan 430070, China
2
China Construction Second Engineering Bureau Ltd., Beijing 100160, China
3
School of Transportation and Logistics Engineering, Wuhan University of Technology, Wuhan 430063, China
4
Hubei Provincial Communications Planning and Design Institute Co., Ltd., Wuhan 430051, China
*
Authors to whom correspondence should be addressed.
Coatings 2022, 12(8), 1200; https://doi.org/10.3390/coatings12081200
Submission received: 2 July 2022 / Revised: 10 August 2022 / Accepted: 15 August 2022 / Published: 17 August 2022
(This article belongs to the Special Issue Functional Materials for Building and Pavement Coatings)

Abstract

:
Reducing or degrading nitrogen oxides (NOx) emitted by automobile exhausts has diversified ways. This paper presents a solution to degrade NO by Nano-sized titanium dioxide (Nano-TiO2) mixed with coating materials for traffic marking on road pavements. The effect on degradation was evaluated by adopting a simple laboratory test with statistical analysis. During the test, five different contents of Nano-TiO2, 2%, 3%, 4%, 5%, and 6%, mix with a coating material for pavement marking, followed by an interpretation of the micro mechanism of degradation effect. The results show that the pavement marking coatings mixed with Nano-TiO2 has a good performance on NO degradation. The effect of degradation is increased with increasing the content of Nano-TiO2 particles, however. At the same time, a peak value with about 70% of the maximum removing rate existed when applying 4% Nano-TiO2 due to the agglomeration phenomenon for nanoparticles close to each other for adding more Nano-TiO2. The methods to reduce agglomeration are also suggested, and a routine field test for all potential traffic coating materials is recommended in this study.

1. Introduction

In the last decades, the number of vehicles especially in urban has been rapidly increasing worldwide. During this increase, the traditional internal combustion engine automobile still takes the central part of them. This indicates that vehicle emissions, such as CxHy, NOx, CO, CO2, SO2, and H2S, are still one of the significant sources of atmospheric pollution. Exhaust gas endangers human beings’ health and pollutes the air to cause serious environmental problems, such as the greenhouse effect, acid rain, and haze. For example, air pollution kills 15,000 Bangladeshis each year [1]. Most of the conventional methods to reduce exhaust pollution focus on vehicle design and fuel consumption. However, road pavement has a large area and a wide range of longitudinal extensions, which gives the potential innovation opportunity for seeking more solutions to mitigate environmental pollution.
From previous research [2], the approximate height of automobile exhaust gas distribution above the pavement is less than 5 m from the centreline of the road pavement and within 25 m of the horizontal direction of the emission source. This distribution provides a feasible platformo-TiO2 to degrade the vehicle exhaust. Nano-TiO2 is a stable photocatalytic material to decompose vehicle emissions, and as a kind of self-cleaning material, the usage of Nano-TiO2 on the pavement to reduce exhaust pollution has become one of the hottest fields in recent years [3,4,5,6,7,8,9,10,11,12,13]. Nano-TiO2 particles can be used in many forms, such as mixing with pavement materials or spraying on pavement surfaces. Currently, photocatalyst materials are majorly used by painting on or mixing with asphalt or cement concrete pavements to degrade the vehicle exhaust. In 2005, a 5 km long road pavement surface with photocatalyst material mixed with cement concrete was constructed at the north toll gate of Sanqiao in Nanjing [14]. Many efforts on the tests of photocatalytic degradation of exhaust gas were made, which showed that the average degradation rate of NOx in vehicles is much higher than that of hydrocarbons [15]. Moreover, the Nano-TiO2 particles even can be used for all transportation facilities in the distribution range of automotive exhaust which involves the exhaust pollution area, such as vehicles body, outside wall, bridge beam/deck, tunnel pavement, and traffic marking, as shown as Figure 1.
In 1972, Nano-TiO2 could play the role of a catalyst in a trial was discovered [16], which triggered the research and application of photocatalytic technology. It was later proved that Nano-photocatalytic materials and related products were relatively stable in chemical processing due to their nature, no pollution to the environment, and notably no loss in the reaction. This corresponding work became one of the most valuable research areas in the academic field. In the early 1970s, Nano-photocatalytic technology was gradually developed as a new environmental protection technology [17]. It can convert pollutants into CO2, water, and other small inorganic molecules. A large number of companies used TiO2 photocatalysts as raw materials to develop a variety of environmental-friendly materials. These new materials are used in different places with severe air pollution, such as traffic trunks or highway noise barriers. Also, photocatalytic thin plates are applied, and solar energy can effectively remove harmful substances such as NOx and SO2 to improve air quality. Since then, several photocatalysts with Nano-sized TiO2 have been developed as the materials for the complete degradation of contaminated air and organic compounds in wastewater [18,19,20]. Under the irradiation of light, nanomaterials can convert light energy into chemical energy and promote the synthesis or degradation of organisms [21]. Similarly, photocatalyst materials can degrade nitrogen oxides (NOx) produced by vehicle exhaust [22]. Figure 2 shows the photocatalytic mechanism by TiO2 [23].
As a photocatalytic material, Nano-TiO2 plays a crucial role in controlling exhaust pollution. Under the photocatalytic action of Nano-TiO2, automobile exhaust will undergo a chemical reaction and then generate water (H2O), carbon dioxide (CO2), salts, and other non-toxic substances. Importantly the whole chemical processing never causes secondary pollution to the environment [24]. The classification of major TiO2-based construction and building materials is shown in Table 1 [6]. Therefore, using Nano-TiO2 to degrade the vehicle’s exhaust on road pavement has been verified as a feasible technology.
During this research, the basic catalytic principle or process of NOx in the exhaust by Nano-TiO2 can be depicted in Figure 3. As a photocatalytic material, the process shows that Nano-TiO2 can treat automobile exhaust gas properly. Under the photocatalytic action of Nano-TiO2, the chemical reaction with exhaust gas can be triggered and then generate water, carbon dioxide, salts, and other non-toxic substances, and thus does not cause secondary pollution to the environment.
However, spraying emulsified coatings on road pavement or mixing with pavement materials in the whole cross-section often leads to higher construction costs and lower performance due to less effective contact between Nano-TiO2 particles and vehicle emissions and the rapid loss of Nano-TiO2 caused by tire wearing and rain wash. Considering that traffic marking is the essential requirement of regular road operation, the coating material for traffic marking provides a potential medium to carry Nano-TiO2 particles. Notably, the traffic marking coatings has less contact between tire and pavement, which indicates it is possible to degrade the pollution of automobile exhaust by using Nano-TiO2 coatings due to lasting longer being as photocatalyst. In addition, non-ultraviolet environment for NOx the degradation test is very few to be found from all previous research. This paper presents a simple test evaluation on degradation NOx by Nano-TiO2 coated on traffic marks based on the previous research. The main objective of this research is to evaluate the effect of Nano-TiO2 on the degradation of NO by using pavement coating materials under natural light, in terms of several key indices such as catalytic decomposition efficiency, catalytic decomposition amount, and catalytic decomposition rate, et al. The grey decision theory is also applied to process the test data to determine the optimal content of Nano-TiO2 with the best performance of NO degradation.

2. Materials and Methods

2.1. Materials and Apparatus

Since acrylic emulsions are widely used as base coatings, Nano-TiO2 and acrylic emulsions are combined to complete the development of the composite coating materials. The major components referring to the Nano-TiO2 coating test evaluation mainly consist of an acrylic emulsion (Water-borne pure acrylic emulsion, from Hangzhou, China), and anatase TiO2 nanoparticles with a size of 10 nm (XZ-Ti01, from Nanjing, China). For simplicity, the acrylic emulsion and anatase TiO2 nanoparticles are mixed in a glass container at room temperature (25 °C ± 1 °C) by manually stirring using a glass rod to obtain Nano-TiO2 coating material for no less than 60 min. The samples with a different ratio of Nano-TiO2 coated on the plastic plate with the size of 30 cm × 20 cm × 18 mm are separately put in the test chamber and go through a degradation test. The critical materials, mixing process, and the connection of test devices in the laboratory are shown in Figure 4a–c, respectively.
The primary devices in this test are an AVL exhaust gas analyzer produced by the company in Graz in Austria, a glass container, and nitrous cylinders with the standard NO gas cylinder (9.5 ± 0.3 MPa) which is from Wuhan, Hubei Province of China. The AVL exhaust gas analyzer was applied to measure the gas concentration change in a closed container with high sufficient measurement accuracy and a short measurement period. Glass container was taken as a test chamber. The TiO2 exhaust gas catalysis needs ultraviolet rays, and the glass container facilitates the easy passage of ultraviolet rays. Nitrous cylinders were used to provide the source of exhaust gas. Since the gas concentration of the exhaust gas directly discharged from the automobile is difficult to control and is not representative, a fixed concentration of gas cylinders is selected to reduce the experimental error as low as possible.

2.2. Test Methods

  • Test preparation. Test exhaust gas catalytic decomposition under a natural light source glass container as the test chamber size is 30 cm × 18 cm × 20 cm. The experimental specimen area is 110 cm2, thickness is 1.5–1.8 mm, and the total mass of the prepared coating for each specimen is 40 g. The reducing weight method is used to accurately obtain the coating material from the glass container. For simplicity, the glass rod is still used as a tool to coat the mixture on the plate. Six hours is required time for a drying condition under room temperature to all samples before the formal test to make the weight of all samples stable. To ensure the consistent intensity (w/m2) of UV light, the test was conducted from 11:30 a.m. to 2:30 p.m. outside Wuhan. At the beginning of the test, start the calibrated exhaust gas analyzer, AVL, for heating. After heating up for about 30 min, the leakage inspection was conducted to ensure that the equipment was working well and ready for testing.
  • Installation of the test specimens. Nano-TiO2 is proposed to be added at a mass ratio of hydrocarbons, 3%, 4%, 5%, and 6%, respectively, of coating material to produce five different contents of treated coating mixtures. Place the coating specimen mixed with Nano-TiO2 particles on a plastic plate into a closed Quartz glass container with a thickness of 3 mm to check that the chamber is hermetically closed enough. Repeat this step for each prepared specimen before formally testing.
  • Connection equipment. Latex hoses connected the devices to ensure that the connection is airtight. After the connection was completed, check the tightness of the device to ensure the hoses are well sealed. Take close observation of the connections during each testing.
  • Releasing the exhaust. To ensure that the test condition is close to the actual situation, the concentration of NO on the road pavement is controlled at the level of about 195 ± 15 ppm [25]. Release of gas through NO cylinders, when the gas concentration in the vessel approaches the initial concentration, the exhaust gas releasing is set to stop.
  • Recording the test data. After stopping the exhaust gas release, the AVL data was recorded automatically, and the data were recorded every 5 min. The total test time was setting about 60 min.
  • Test completion. After each test, the exhaust gas in the container needs to be drained completely, and the test specimen was taken out to prepare for the next group tested in the chamber. For each specimen, three times to repeat the measurements as the parallel test, and the average value is selected as the test data.

3. Results and Discussions

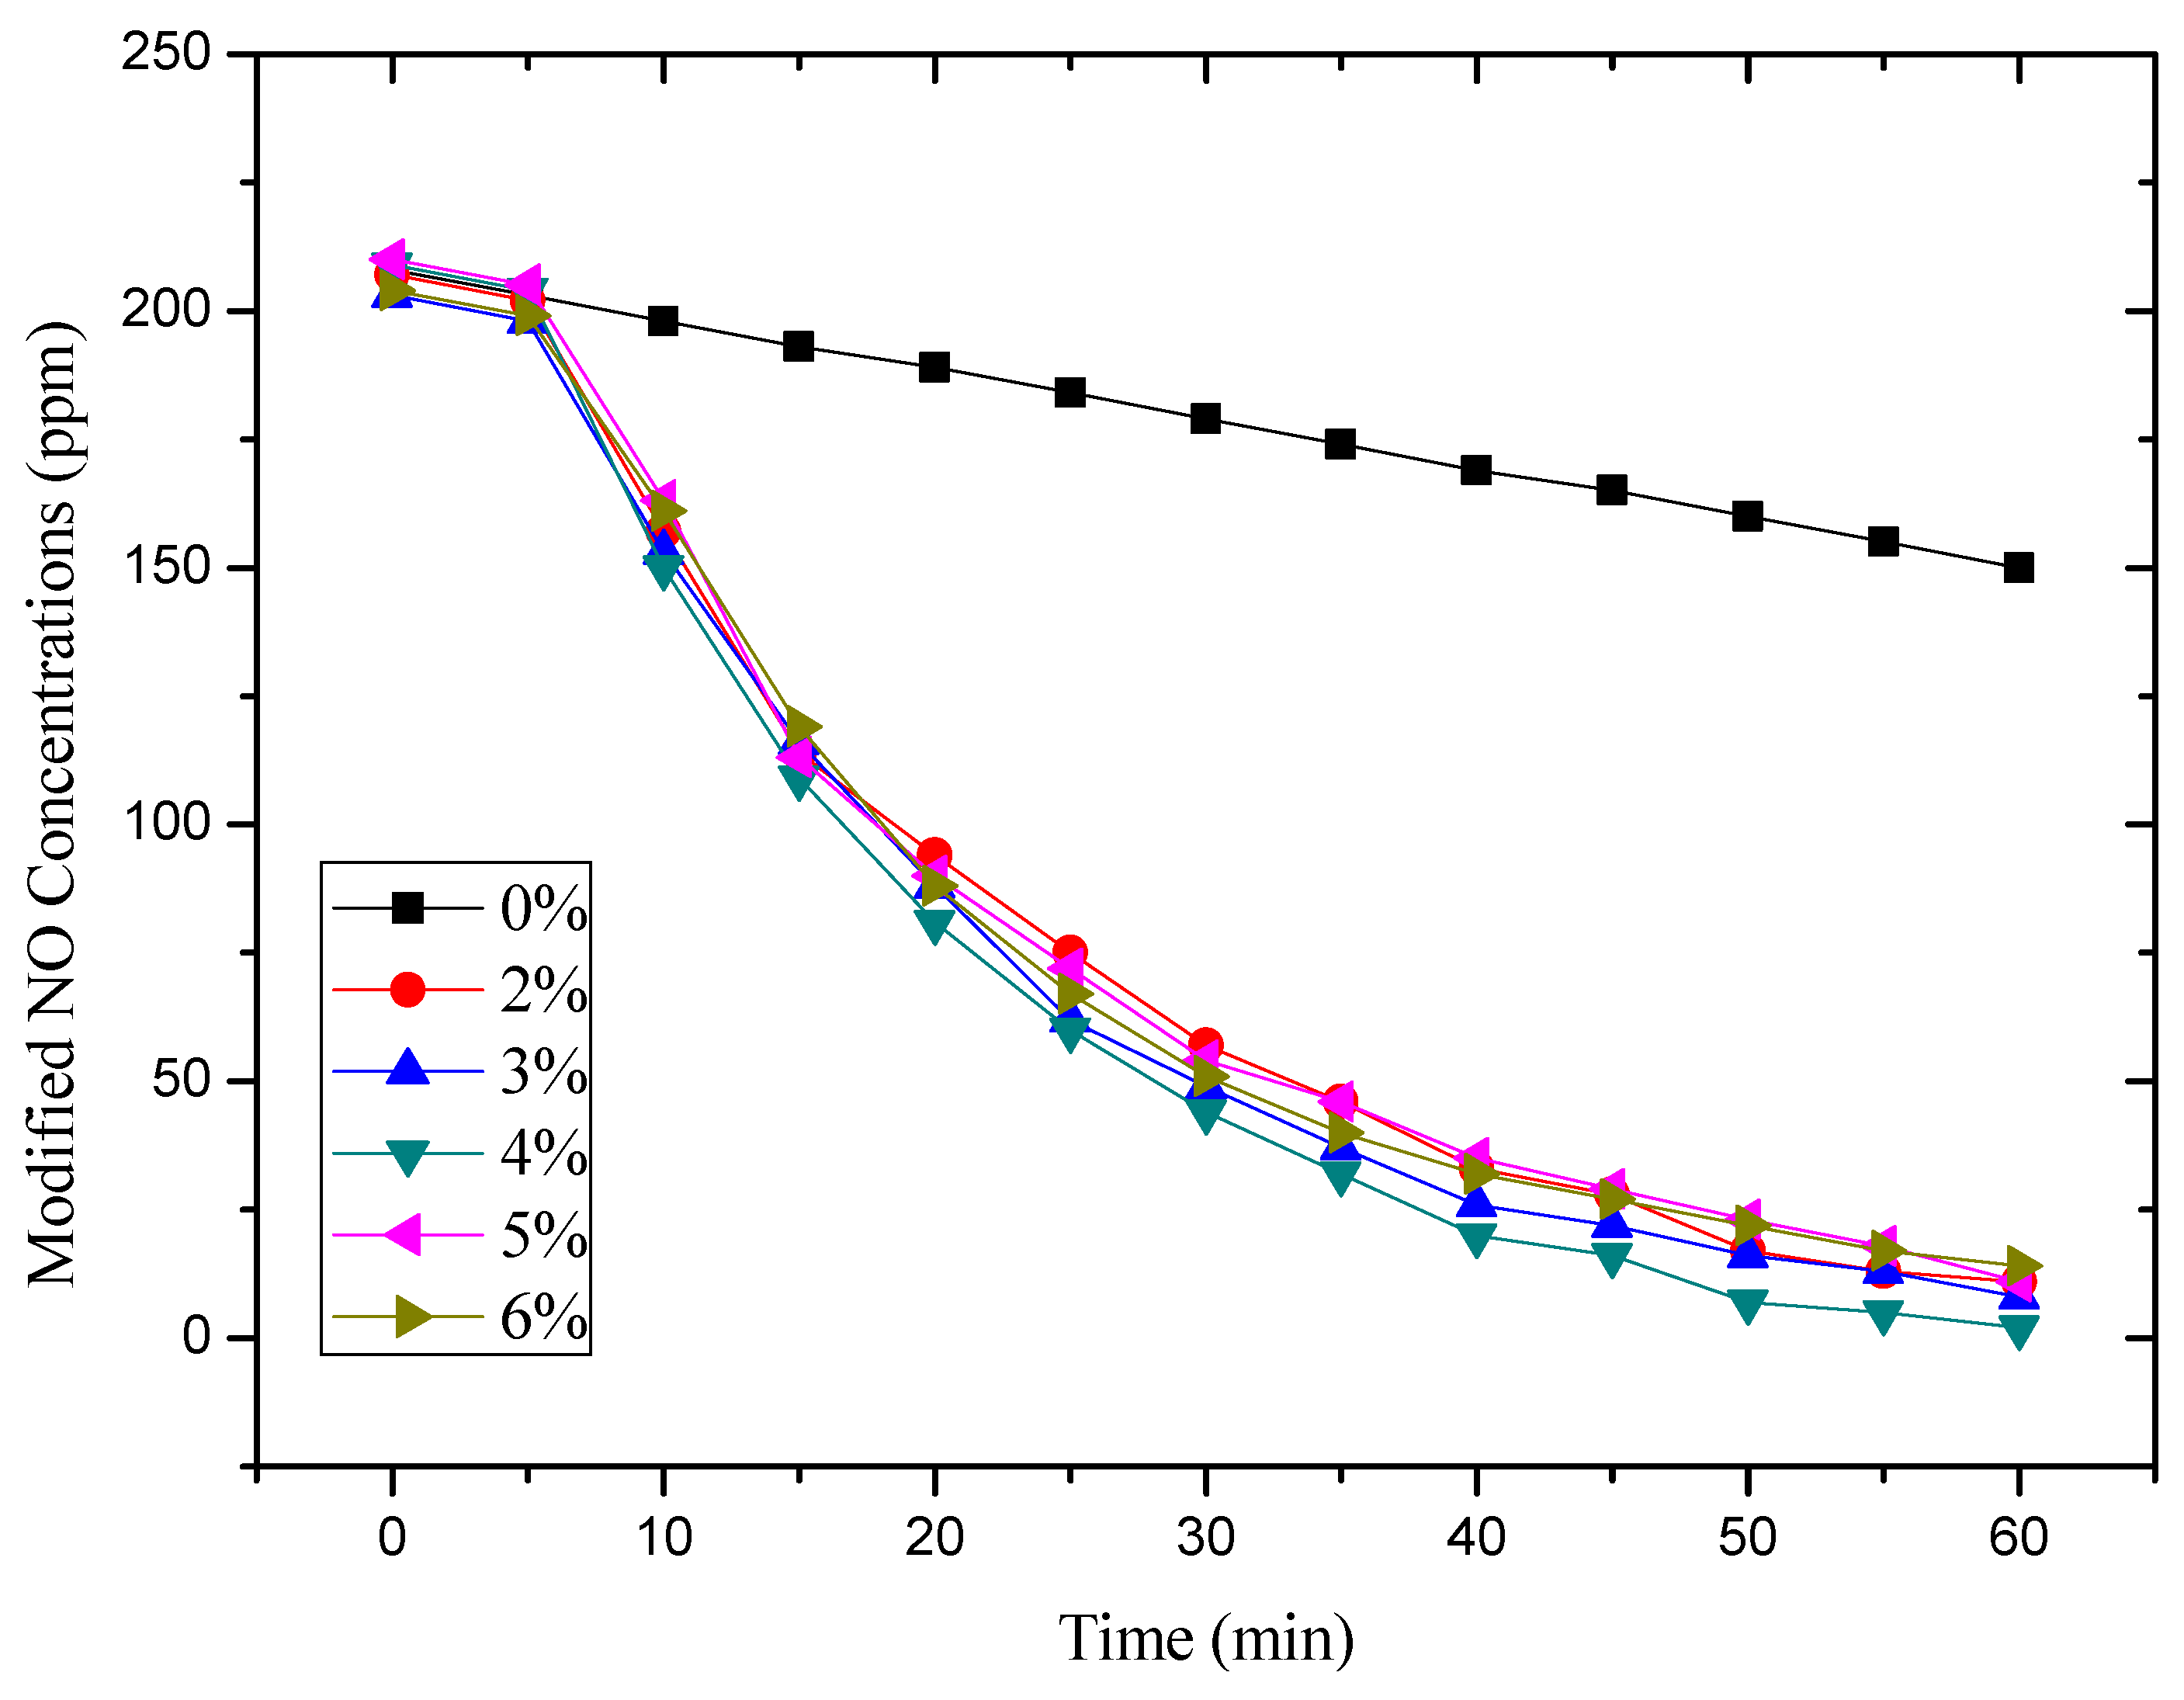
3.1. Catalytic Decomposition of Exhaust Gas under Natural Light

According to the procedure above, those five groups of coating samples with different content of Nanp-TiO2, 2%, 3%, 4%, 5%, and 6%, NO catalytic decomposition tests were conducted. To ensure the accuracy of the test data and compare the effect of catalytic decomposition, a reference group of the sample without Nano-TiO2 added was performed using the same processing. The original test data are listed in Table 2.
Concerned that the initial concentration was not the same, it is necessary to amend the concentration tested in the chamber. According to the previous research [26,27], a method put forward by the test evaluation can be expressed as follows: count the ratio of the gas concentration’s decrement at a particular time and the initial concentration, then subtract the ratio of gas concentration’s decrement of the reference test at a particular time and the initial concentration. Then, the difference is multiplied by the initial concentration to obtain the final corrected data, correcting automobile exhaust in the container at a specific time. The formula is shown below [27].
P v t = ( p t 1 p t p 0 p t 1 p t p 0 ) × P 0
where,
  • P v t —Correction of automobile exhaust in the container at a particular time (ppm).
  • p t 1 —A moment ago, the measured value in automobile exhaust gas container (ppm).
  • p t —A time measurement value in the automobile exhaust gas container (ppm).
  • p 0 —The initial concentration of the container of automobile exhaust (ppm).
  • p t —The concentration of a time not containing Nano-TiO2 specimen container of automobile exhaust (ppm).
  • p t 1 —The concentration of a moment ago without TiO2 specimen container of automobile exhaust (ppm).
  • p 0 —The initial concentration of Nano-TiO2 specimen container of automobile exhaust (ppm).
Based on the formula above, the modified data are shown in Figure 5.

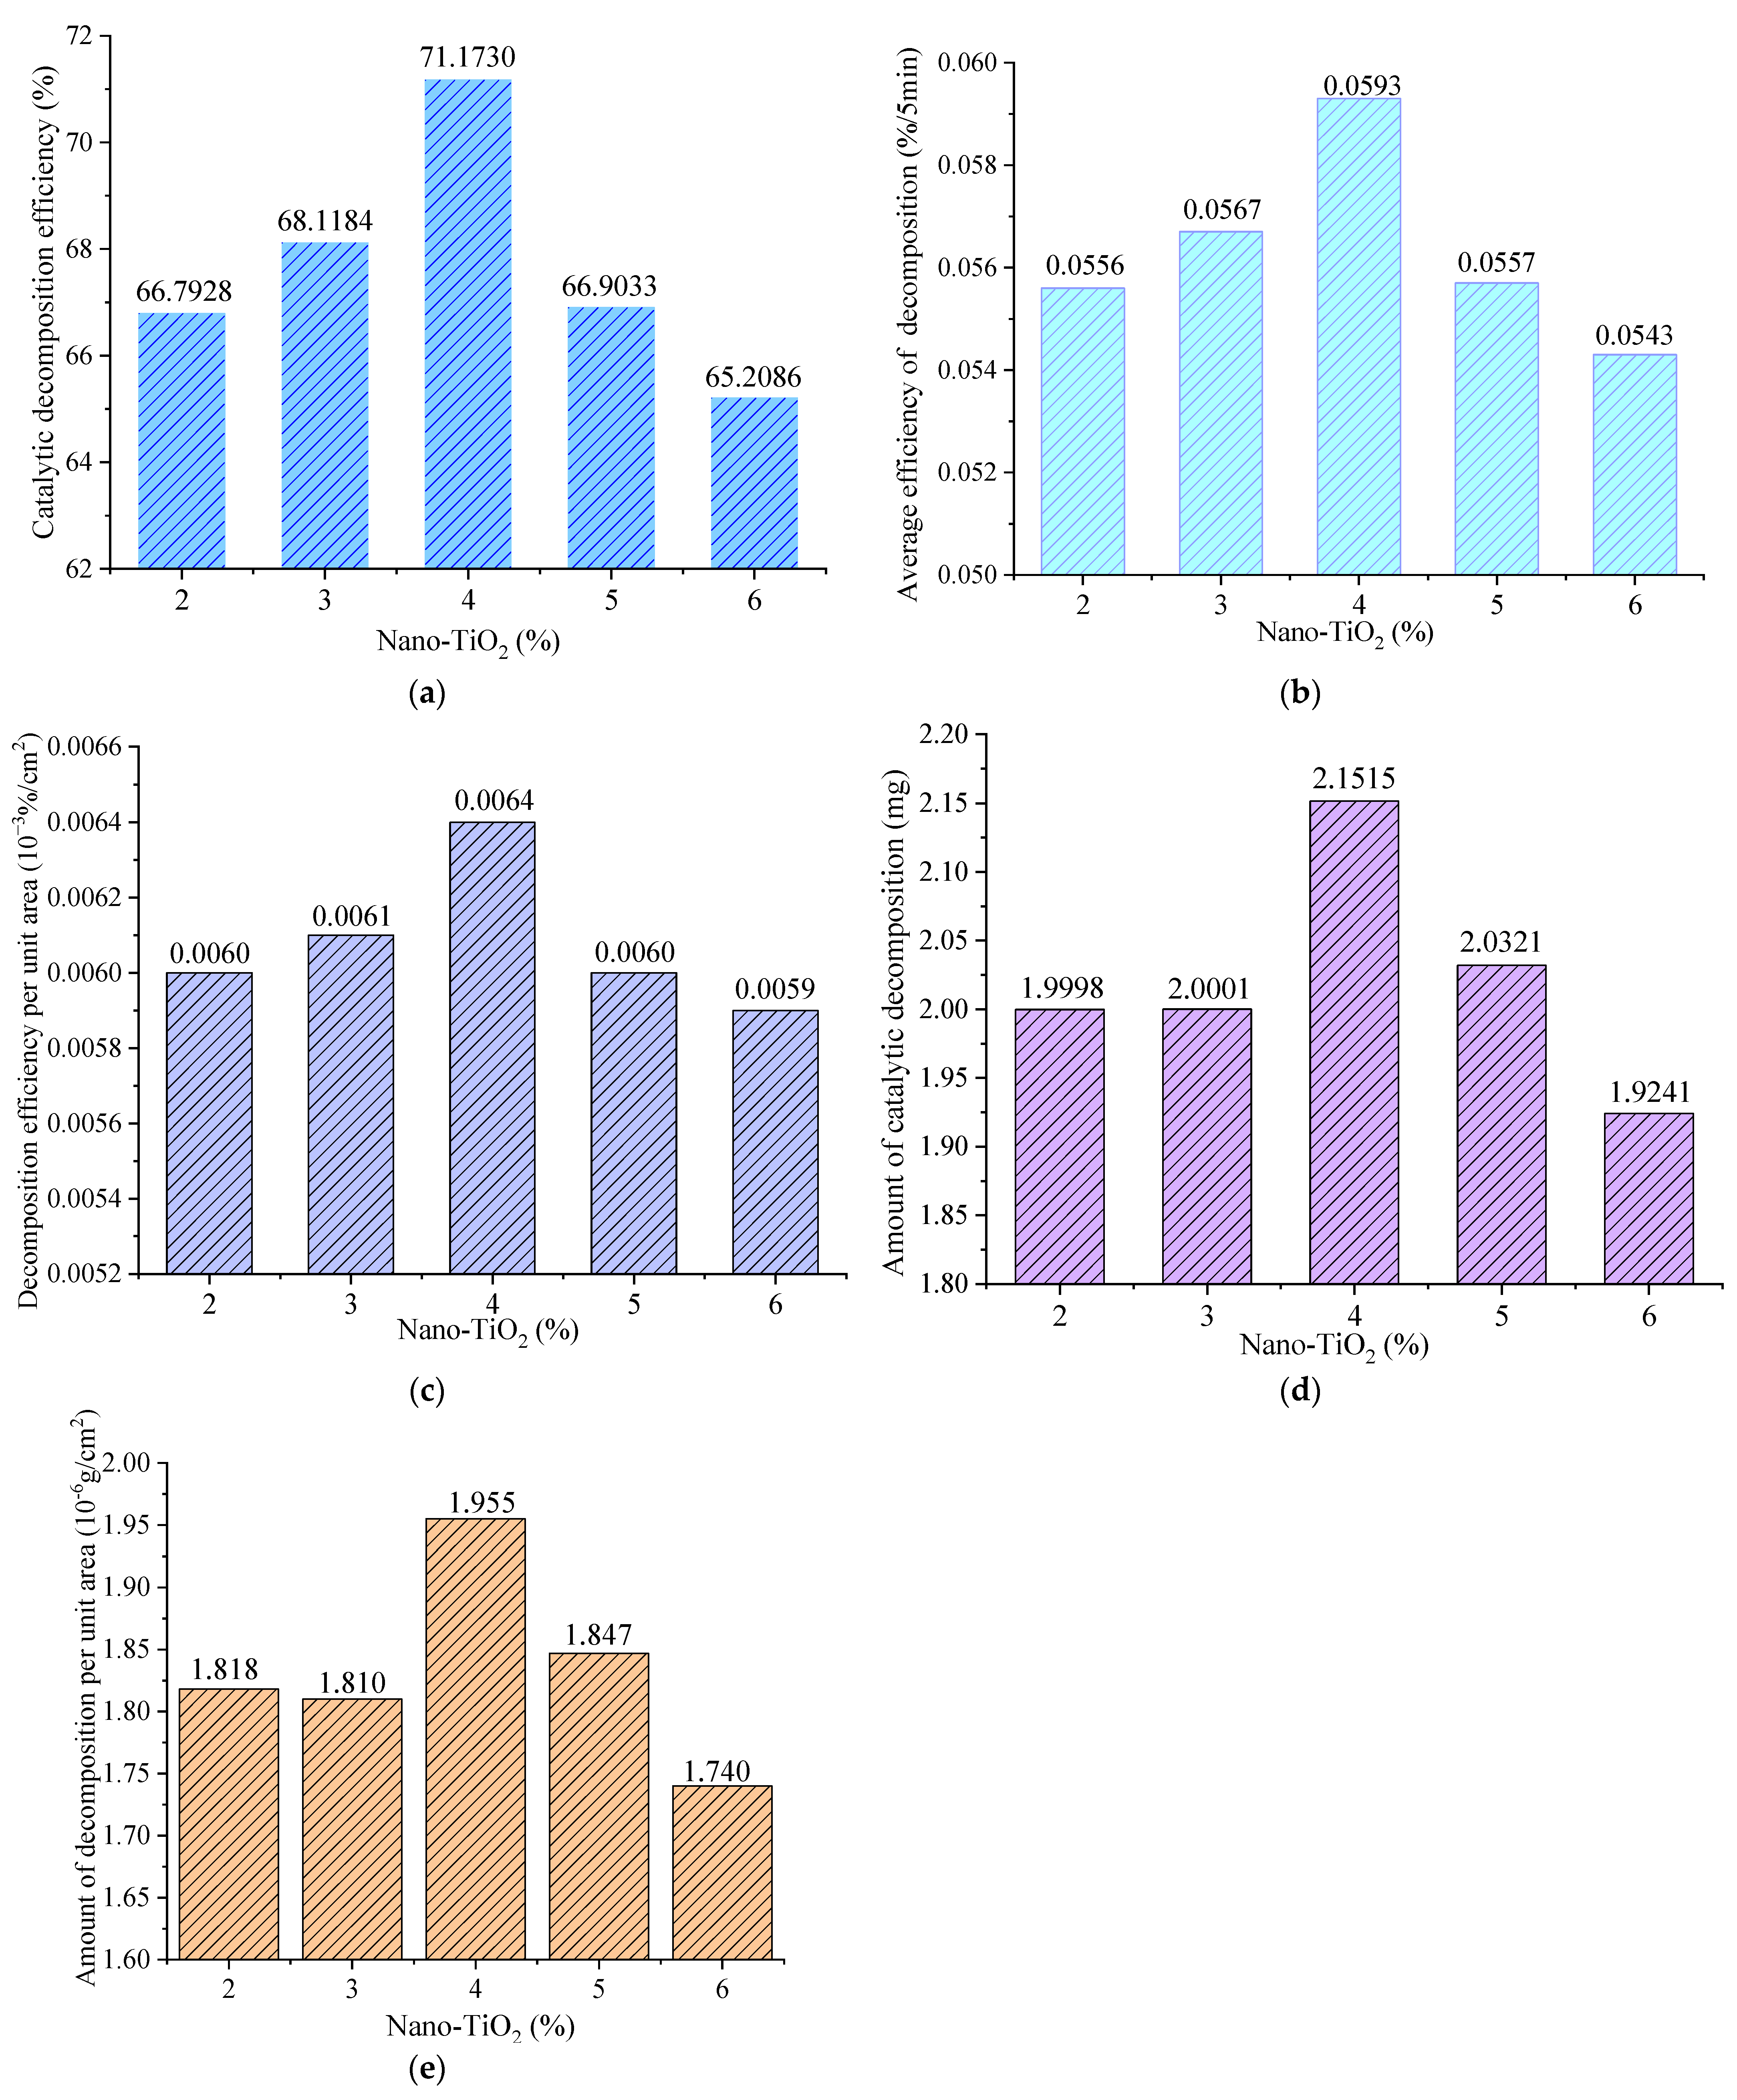
3.2. Evaluation System of Degradation Effect

3.2.1. Average Catalytic Decomposition Efficiency per Unit Area

Average catalytic decomposition efficiency per unit area can be calculated by catalytic decomposition efficiency and the average decomposition efficiency. Catalytic decomposition efficiency can avoid the differences in the initial concentration, which makes the different schemes comparable, excluding other factors’ interference. It shows the effect of adding the actual gas decomposition of TiO2 nanoparticles. The efficiency of the catalytic decomposition formula is as follows,
C = i = 0 i = t ( P t 1 p t p 0 × 100 p t 1 p t p 0 × 100 )
where,
  • C —Catalytic decomposition efficiency (%); the other symbols are the same as the above.
Because catalyst dosage under different catalytic efficiency will be the average difference in the coating, it is not easy to evaluate the specific efficiency. However, the average efficiency of catalytic decomposition and catalytic decomposition of the coating can reflect the exhaust speed and further quantify the catalytic activity. Meanwhile, it shows the effect of adding the actual gas decomposition of Nano-TiO2 particles compared as intuitively reasonable. The catalytic decomposition formula of the average energy is as below,
V c = C T
where,
  • Vc—The average efficiency of catalytic decomposition (%/5 min)
  • C—Catalytic decomposition efficiency (%)
  • T—Catalytic reaction time [22]
The amount of catalytic decomposition of exhaust gas per unit area directly affects the coating’s practical application range and application scenarios. The average catalytic decomposition efficiency per unit area can directly reflect the actual performance of the coating and facilitate the evaluation of the coating. The formula for calculating the average catalytic decomposition efficiency per unit area is as below,
e = V c A
where,
  • e —Average catalytic decomposition efficiency per unit area (10−3%/cm2)
  • A—Total area of the paint (cm2)
  • V c —Average catalytic decomposition efficiency (%/5 min)

3.2.2. Amount of Catalytic Decomposition per Unit Area

Catalytic decomposition refers to coating in the complete catalytic decomposition, catalytic decomposition of the quality. The amount of catalytic decomposition can show the intuitive ability of coating degradation of exhaust gas. The amount of catalytic decomposition formula is listed below,
m = M c × P 0 22.4 × V 0
where,
  • m —The amount of catalytic decomposition (mg)
  • M —The molar mass of gas (g/mol)
  • C —Catalytic decomposition efficiency (%)
  • P 0 —The initial concentration of the container of automobile exhaust
  • V 0 —The adequate volume of the sealed container (m3)
Since the amount of catalytic decomposition can only show the total mass of the exhaust gas catalyzed by the coating in different proportions in the catalytic process, it cannot directly reflect the decomposition ability of the coating per unit area. Therefore, the index of catalytic decomposition per unit area is used. The performance of the coating was evaluated and compared. The calculation formula for the Amount of catalytic decomposition per unit area is as follows:
d = m A
where,
  • d —Amount of catalytic decomposition per unit area (10−6 g/cm2)
  • A—Total area of the paint (cm2)
  • m —The amount of catalytic decomposition (10−6 g)
According to the formulas above, the catalytic decomposition efficiency of Nano-TiO2 treated coating was evaluated via the five parameters above, the catalytic decomposition efficiency (C), average efficiency of catalytic decomposition (Vc), average catalytic decomposition efficiency per unit area (e), Amount of catalytic decomposition (m), Amount of decomposition per unit area (d). These five parameter values change with different Nano-TiO2 content shown in Figure 6a–e, respectively. From the formula derivations above, it can be seen that C, Vc, and e have consistency, while d has a similar change with m. Therefore, e and d are two recommended parameters to evaluate the catalytic decomposition efficiency of Nano-TiO2 applied for traffic coatings on the pavement.

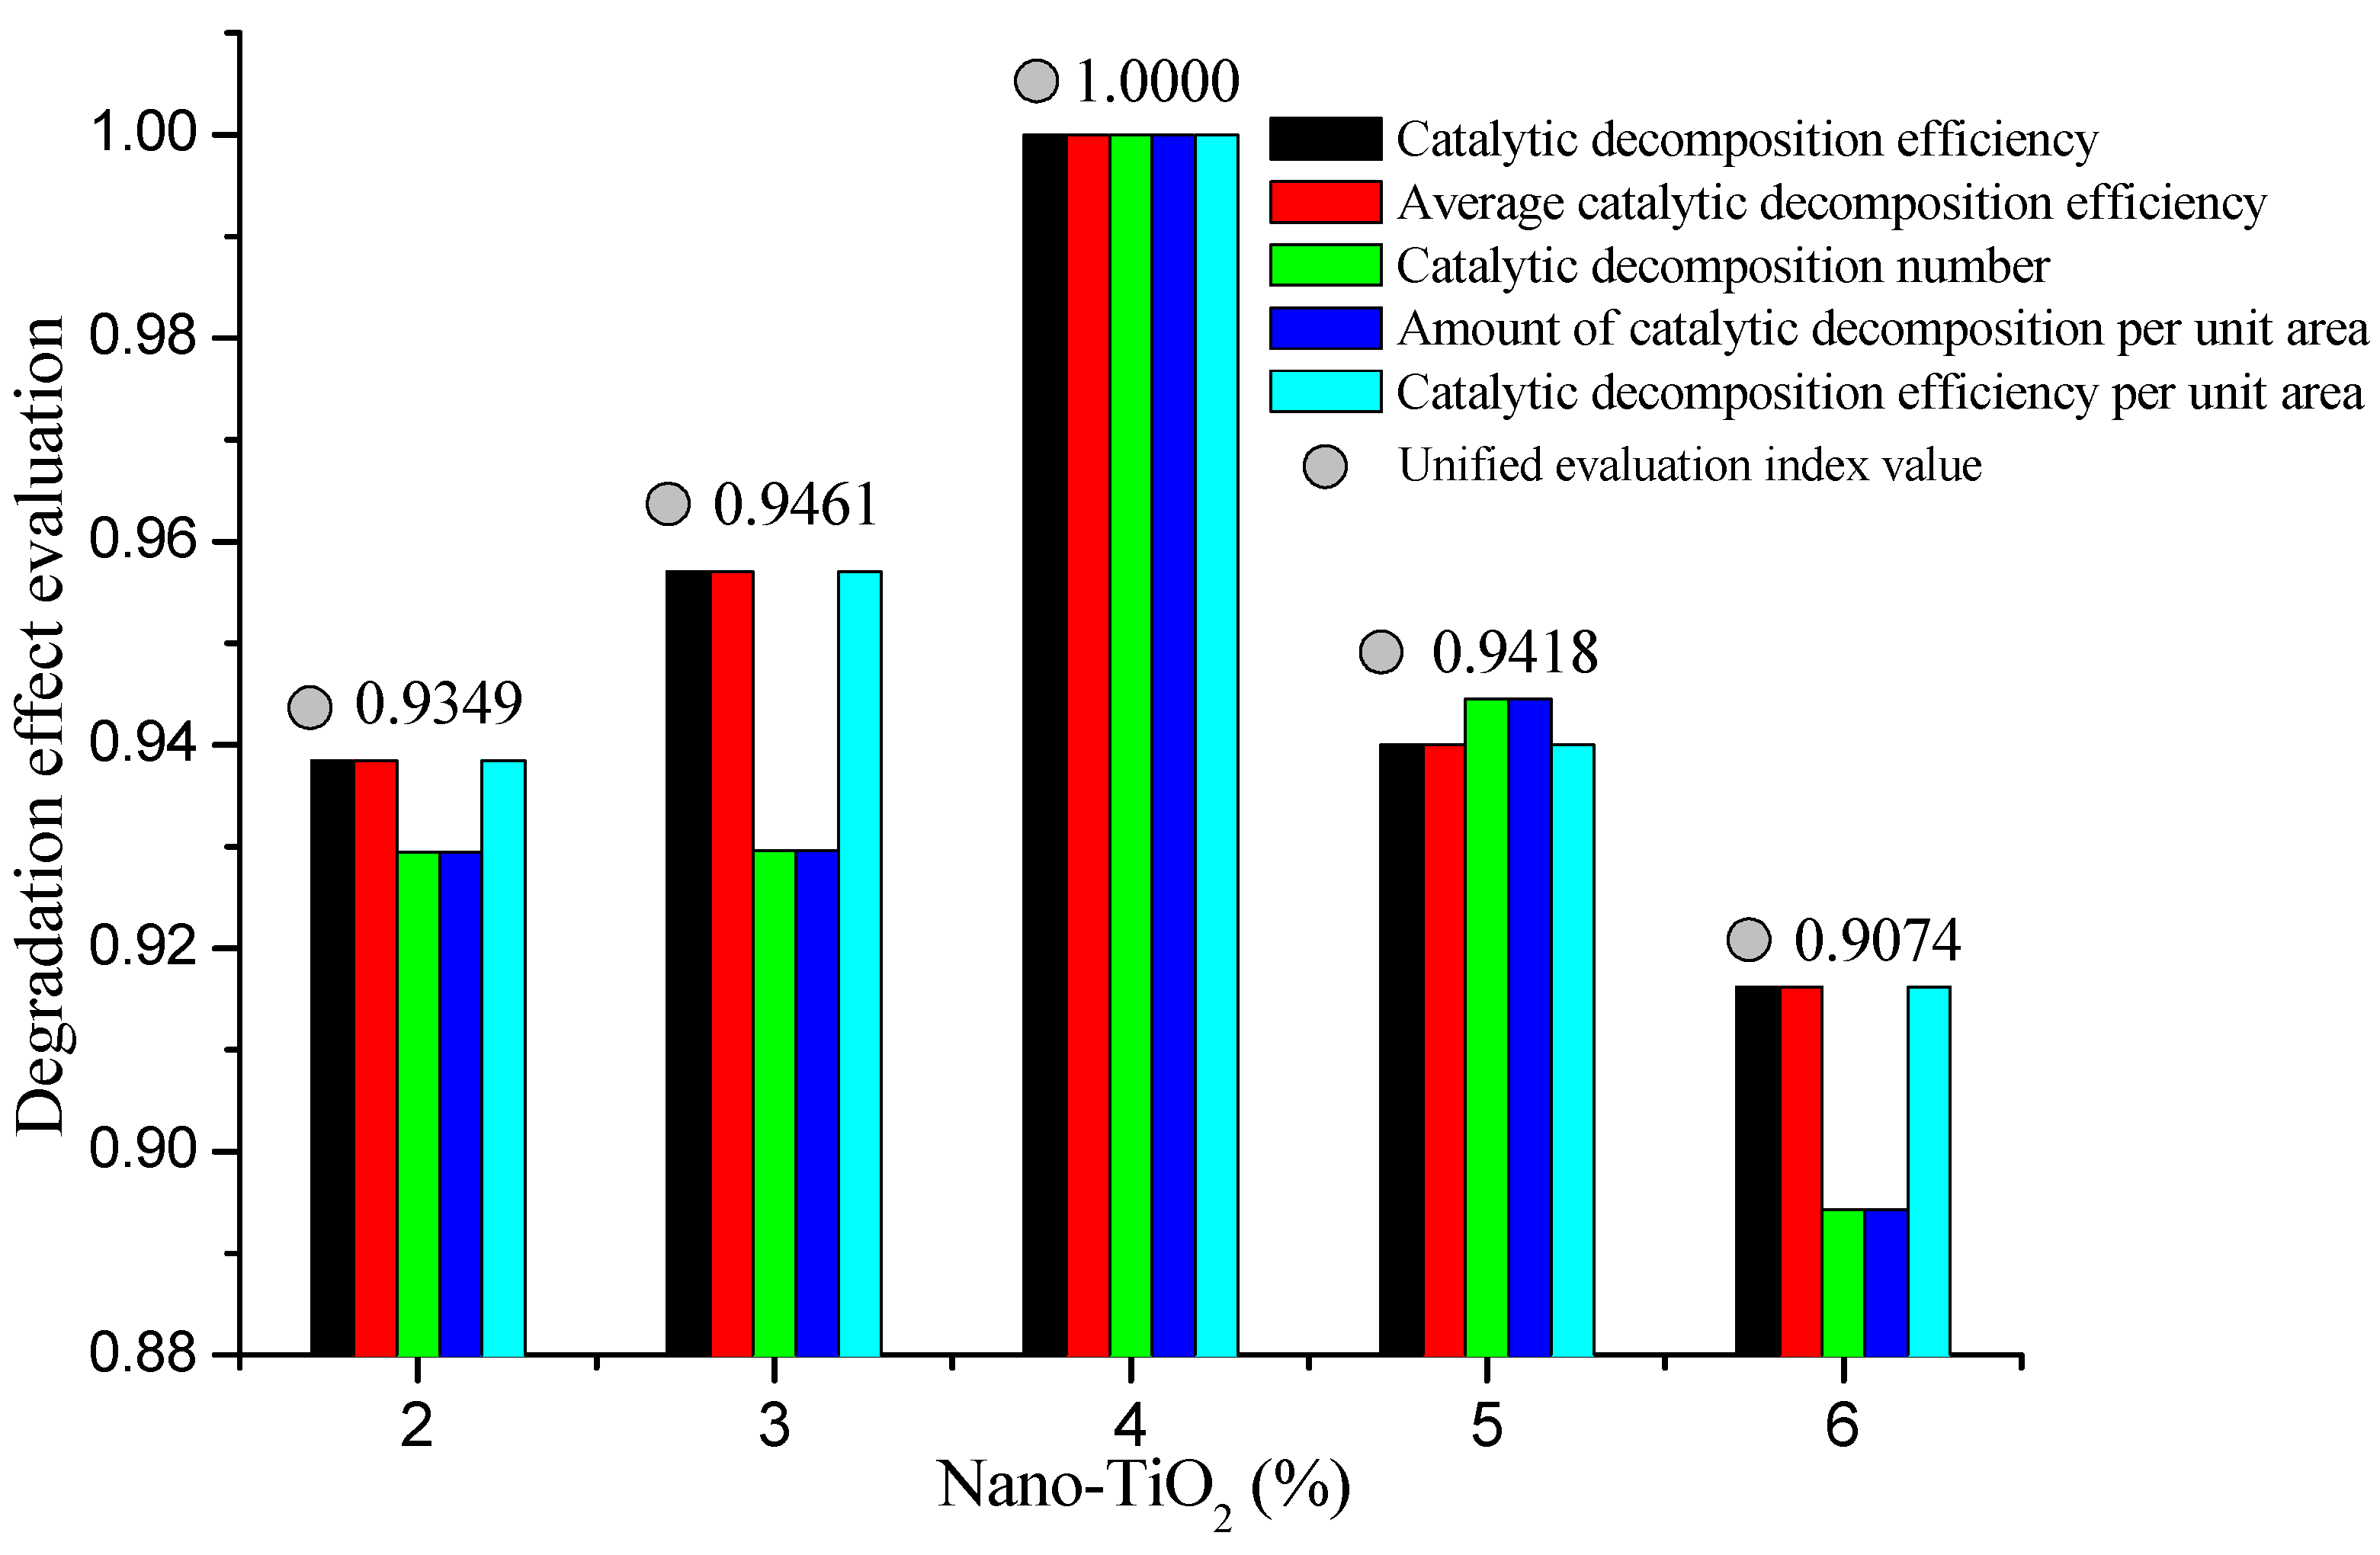
3.3. Evaluation of the Degradation Effect of NOx

Due to the higher evaluation index of the degradation effect of NOx, and to make rational use of each index, it is reasonable to adopt the method of grey decision theory [28] to select the degradation effect of NOx from the best coating on the various indicators and data processing. Nanometer TiO2 coating NO degradation index system contains the five parameters above, catalytic decomposition efficiency (%), the average efficiency of catalytic decomposition (%/5 min), the amount of catalytic decomposition (mg), Amount of catalytic decomposition per unit area, and catalytic decomposition efficiency per unit area. The polarity classification degradation index is the maximum (Max).
Catalytic decomposition efficiency, the average efficiency of catalytic decomposition, the Amount of catalytic decomposition, and the effective utilization rate of catalyst have the maximum polarity, which indicates it is possible to use the upper limit effect measurement. The coating cost per square meter has the minimum polarity, which uses the lower limit effect measurement. The upper limit effect measurement formula is shown below,
M e f f ( u i j k ) = r i j k = u i j k max i max j u i j k
The lower limit effect measurement formula can be expressed as below,
M e f f ( u i j k ) = r i j k = min i min j u i j k u i j k
Therefore, the coating degradation effect evaluation is shown in Figure 7.
According to the test results, 4% Nano-TiO2 coating is the best selection to be applied. Meanwhile, it also indicates an optimum content of Nano-TiO2 in terms of the optimum degradation effect of NOx when mixed with pavement coating materials. The results show that when the proportion of Nano-TiO2 is between 2% and 4%, the degradation rate and catalytic decomposition efficiency of Nano-TiO2 coating increase with the increase of the proportion of Nano-TiO2; when the addition ratio of Nano-TiO2 is 4%. At 6%, the degradation rate and catalytic decomposition efficiency of Nano-TiO2 coatings decreased with the increase of the proportion of Nano-TiO2. This is inconsistent with common sense. Common sense is that the degradation level of NOx by Nano-TiO2 coating should be accelerated with the increase of Nano-TiO2. From the mechanism of TiO2 photocatalysis, it is found that the agglomeration phenomenon of nanoparticles influences this.
The agglomeration of nanoparticles means that the original nanoparticles are connected during preparation, separation, processing, and storage. A plurality of particles forms a large particle—the phenomenon of clusters. From the point of view of thermodynamics, nanoparticles have significant specific surface area characteristics and high surface energy. The particles will spontaneously decrease toward the surface area to achieve thermodynamic equilibrium, so the particles will agglomerate and agglomerate. Due to the phenomenon of agglomeration of the nanoparticles, the particle size of the particles increases, and the properties possessed by the nanoparticles disappear. Nano-TiO2 coating with the addition of Nano-TiO2, the agglomeration of nanoparticles becomes more and more prominent, resulting in the reduction of Nano-TiO2 particles participating in light and catalysis in the addition of more Nano-TiO2, but the more the degradation level of NOx common phenomenon. The reunion phenomenon can be summarised in Figure 8.
To reduce the influence of the agglomeration effect of the nanoparticles and increase the catalytic efficiency, the following methods can be used to treat the coating to improve the catalytic efficiency, (1) wash the used Nano-TiO2 coating materials with organic substances such as absolute ethanol and ethylene glycol, (2) add appropriate dispersant (inorganic electrolyte, organic polymer, surfactant, (3) use a unique drying process for coatings to remove moisture between the Nano-TiO2 particles, and (4) use ultrasonic cavitation technology to make moisture collapse by high energy, micro-jet, and shock waves. However, all the methods above need to be verified by test in further research.

4. Conclusions

NOx is the leading component group of conventional vehicle exhaust. Except for vehicle design and emission control, the coating material for traffic marking on road pavement provides a potential medium to carry the photocatalyst. Due to the good catalytic performance of Nano-TiO2, this paper presents a simple but quick evaluation test under the natural light circumstance using six groups of sample tests, including one group of the blank test without Nano-TiO2 particles, and five groups of coating materials mixed with five different Nano-TiO2 addition ratios (2%, 3%, 4%, 5%, and 6%), and the degradation effects of NO in these five groups were compared to evaluate the effect of Nano-TiO2 coating on catalytic decomposition of NO. According to the work above, four conclusions can be drawn below.
(1)
Nano-TiO2 has a noticeable degradation effect on NO in the automobile exhaust gas. After only 1 h of reaction, the removal rate of NO by nano-TiO2 coating sample can reach up to more than 65%, even with the maximum rate up to 71% with 4% of Nano-TiO2, which means Nano-TiO2 coating can effectively degrade automobile exhaust, and it is feasible to use Nano-TiO2 coating to degrade automobile exhaust.
(2)
A parameter system for NO degradation evaluation was established. The catalyst average catalytic decomposition efficiency, catalytic decomposition efficiency, catalytic decomposition amount, catalytic decomposition per unit area, and catalytic decomposition efficiency per unit area and unified effect measurement can be taken as an evaluation system to verify the catalyst degree of Nano-TiO2 to NO. However, two parameters, average catalytic decomposition efficiency per unit area and Amount of decomposition per unit area, are recommended to evaluate the decomposition efficiency for derivation consistency.
(3)
The degradation effect decreases with a specific increase of Nano-TiO2 due to the agglomeration effect of nanoparticles. When increasing Nano-TiO2 up to 4% of mass ratio, the NO degradation effect reaches the highest level. Specifically, the degradation level of NO in Nano-TiO2 coatings increases first and then decreases with the increase of Nano-TiO2 particles, mainly caused by the agglomeration effect of nanoparticles.
(4)
Nano-TiO2 carried on the traffic marking materials is a cost-effective solution of NO degradation due to less contact with vehicle tires and lasting longer catalysis than mixed with pavement mixture. Considering the inappropriate scale of the test, a routine field test on Nano-TiO2 coated with different marking materials is strongly recommended to guide the actual projects. Except for pavement traffic coatings, all transportation facilities in the influenced range of exhaust which involves into the emission area, such as vehicles body, outside wall, bridge beam/deck, tunnel pavement as well as the other surface coatings for facilities can also be considered to incorporate into the degradation solutions. In addition, the degradation effect of the other NOx, such as NO2, needs further study.

Author Contributions

Conceptualization and resources, M.F. and Y.L.; methodology, L.P. and Y.C.; software, L.Z.; validation, formal analysis and investigation as well as data curation, L.P., Y.C. and L.Z.; writing—original draft preparation, Y.C.; writing—review and editing, M.F. and Y.L.; supervision, M.F.; project administration, L.P.; funding acquisition, M.F. and Y.L. All authors have read and agreed to the published version of the manuscript.

Funding

This research was funded by the Research Program of China State Construction Engineering Corporation (Grant Number CSCEC-2019-Z-29).

Institutional Review Board Statement

Not applicable.

Informed Consent Statement

Informed consent was obtained from all subjects involved in the study.

Data Availability Statement

Not applicable.

Acknowledgments

Appreciations from the authors go to Xianjun Hou, Zhou Wang, and Fuming Peng of the School of Automotive Engineering of the Wuhan University of Technology for their generous help and unconditional guidance on the usage of test devices.

Conflicts of Interest

The authors declare no conflict of interest.

References

  1. Mahmood, S.A.I. Air pollution kills 15,000 Bangladeshis each year: The role of public administration and governments integrity. J. Public Adm. Policy Res. 2011, 3, 129–140. [Google Scholar]
  2. Zhou, H.; Yang, P.; Gao, Y. A wind-tunnel investigation on the dispersion of urban-traffic-emitted pollutants. J. Tongji Univ. 1994, 22, 306–311. [Google Scholar]
  3. Yu, H.; Dai, W.; Qian, G.; Gong, X.; Zhou, D.; Li, X.; Zhou, X. The NOx Degradation Performance of Nano-TiO2 Coating for Asphalt Pavement. Nanomaterials 2020, 10, 897. [Google Scholar] [CrossRef] [PubMed]
  4. Lee, J.W.; Lee, S.H.; Jang, Y.I.; Park, H.M. Evaluation of Reducing NO and SO2 Concentration in Nano SiO2-TiO2 Photocatalytic Concrete Blocks. Materials 2021, 14, 7182. [Google Scholar] [CrossRef]
  5. Segundo, I.R.; Zahabizadeh, B.; Landi, S., Jr.; Lima, O., Jr.; Afonso, C.; Borinelli, J.; Freitas, E.; Cunha, V.M.; Teixeira, V.; Costa, M.F.; et al. Functionalization of Smart Recycled Asphalt Mixtures: A Sustainability Scientific and Pedagogical Approach. Sustainability 2022, 14, 573. [Google Scholar] [CrossRef]
  6. Chen, J.; Poon, C.S. Photocatalytic construction and building materials: From fundamentals to applications. Build. Environ. 2009, 44, 1899–1906. [Google Scholar] [CrossRef]
  7. Chen, M.; Liu, Y. NOx removal from vehicle emissions by functionality surface of asphalt road. J. Hazard. Mater. 2010, 174, 375–379. [Google Scholar] [CrossRef]
  8. Dylla, H.H.; Marwa, M. Characterization of nanoparticles released during construction of photocatalytic pavements using engineered nanoparticles. J. Nanopart. Res. 2012, 14, 825. [Google Scholar] [CrossRef]
  9. Liu, W.; Wang, S.; Zhang, J.; Fan, J. Photocatalytic degradation of vehicle exhausts on asphalt pavement by TiO2/rubber composite structure. Constr. Build. Mater. 2015, 81, 224–232. [Google Scholar] [CrossRef]
  10. Wang, D.; Leng, Z.; Hüben, M.; Oeser, M.; Steinauer, B. Photocatalytic pavements with epoxy-bonded TiO2-containing spreading material. Constr. Build. Mater. 2016, 107, 44–51. [Google Scholar] [CrossRef]
  11. Qian, G.P.; Wang, N.; Zhou, D.Y. Experimental investigation of the degradation of NOx by Nano-Tio2 pavement functional coating on purification NO. J. Transp. Sci. Eng. 2016, 32, 29–32. [Google Scholar]
  12. Wang, H.; Jin, K.; Dong, X.; Zhan, S.; Liu, C. Preparation Technique and Properties of Nano-TiO2 Photocatalytic Coatings for Asphalt Pavement. Appl. Sci. 2018, 8, 2049. [Google Scholar] [CrossRef]
  13. Huang, M.; Wen, X. Experimental Study on Photocatalytic Effect of Nano TiO2 Epoxy Emulsified Asphalt Mixture. Appl. Sci. 2019, 9, 2464. [Google Scholar] [CrossRef]
  14. Qian, C.; Zhao, L.; Dafang, F.U.; Li, L.I. Study on the effect of temperature. humidity and light intensity on photocatalytic oxidation of NO2 immobilized on cement-based materials. J. Environ. Sci. China 2005, 25, 623–630. [Google Scholar]
  15. Han, X.; Bai, H.; Guan, Q.; Li, H.; Du, X. Design on testing system for degrading automobile emission with photocatalytic material TiO2. J. Northeast For. Univ. 2005, 33, 89–91. [Google Scholar]
  16. Fujishima, A.; Honda, K. Electrochemical Photolysis of Water at a Semiconductor Electrode. Nature 1972, 238, 37–38. [Google Scholar] [CrossRef]
  17. Tryk, D.A.; Fujishima, A.; Honda, K. Recent topics in photoelectrochemistry: Achievements and future prospects. Electrochim. Acta 2000, 45, 2363–2376. [Google Scholar] [CrossRef]
  18. Szczepanik, B. Photocatalytic degradation of organic contaminants over clay-TiO2 nanocomposites: A review. Appl. Clay Sci. 2017, 141, 227–239. [Google Scholar] [CrossRef]
  19. Ouwehand, J.; Van Eynde, E.; De Canck, E.; Lenaerts, S.; Verberckmoes, A.; Van Der Voort, P. Titania-functionalized diatom frustules as photocatalyst for indoor air purification. Appl. Catal. B Environ. 2018, 226, 303–310. [Google Scholar] [CrossRef]
  20. Byrne, C.; Subramanian, G.; Pillai, S.C. Recent advances in photocatalysis for environmental applications. J. Environ. Chem. Eng. 2018, 6, 3531–3555. [Google Scholar] [CrossRef]
  21. Bethi, B.; Sonawane, S.H.; Bhanvase, B.A.; Gumfekar, S.P. Nanomaterials-based advanced oxidation processes for wastewater treatment: A review. Chem. Eng. Process. Process Intensif. 2016, 109, 178–189. [Google Scholar] [CrossRef]
  22. Linsebigler, A.L.; Lu, G.; Yates, J.T. Photocatalysis on TiO2 Surfaces: Principles, Mechanisms, and Selected Results. Chem. Rev. 1995, 95, 735–758. [Google Scholar] [CrossRef]
  23. Banerjee, S.; Dionysiou, D.D.; Pillai, S.C. Self-cleaning applications of TiO2 by photo-induced hydrophilicity and photocatalysis. Appl. Catal. B Environ. 2015, 176–177, 396–428. [Google Scholar] [CrossRef]
  24. Chen, M.; Jin, L.; Liu, Y.; Guo, X.; Chu, J. Decomposition of NO in automobile exhaust by plasma–photocatalysis synergy. Environ. Sci. Pollut. Res. 2014, 21, 1242–1247. [Google Scholar] [CrossRef]
  25. Zhang, W. Research on Automobile Exhaust Catalytic Decomposition of TiO2 Asphalt Pavement Materials; Chang’an University: Xi’an, China, 2014. [Google Scholar]
  26. Fang, M.; Cheng, Y.; Zhan, L. Study on the degradation efficiency and road performance of automobile exhaust for anti-skip color pavement. J. China Foreign Highw. 2016, 36, 226–229. [Google Scholar]
  27. Deng, Y. Study on the Surface Characteristics of Color Pavement Degradation of Automobile Exhaust; Xinjiang UIniversity: Ürümqi, China, 2015. [Google Scholar]
  28. Julong, D. Introduction to Grey System Theory. J. Grey Syst. 1989, 1, 1–24. [Google Scholar]
Figure 1. Possible applications of Nano-TiO2 coating (background photo from online).
Coatings 12 01200 g001
Figure 2. Mechanism of TiO2 photocatalysis [23].
Coatings 12 01200 g002
Figure 3. Catalytic principle of Nano-TiO2 coatings.
Coatings 12 01200 g003
Figure 4. Test devices and mixing process for degradation effect of nano-TiO2 coating material. (a) Critical materials (Left: anatase Nano-TiO2 particles; Right: Nano-TiO2 coatings). (b) Mixing process flowchart of coating samples. (c) Devices connection in the laboratory.
Coatings 12 01200 g004
Figure 5. NO concentration variation with Nano-TiO2 change.
Coatings 12 01200 g005
Figure 6. Catalytic evaluations with different contents of Nano-TiO2. (a) Catalytic decomposition efficiency (C). (b) Average catalytic efficiency (Vc). (c) Decomposition efficiency per unit area (e). (d) Amount of catalytic decomposition (m). (e) Amount of decomposition per unit area (d).
Coatings 12 01200 g006
Figure 7. Effect of the coating degradation.
Coatings 12 01200 g007
Figure 8. Nano-TiO2 agglomeration for decreasing the catalytic speed.
Coatings 12 01200 g008
Table 1. Classification of TiO2-based photocatalytic construction and building materials [6].
CategoriesProductsFunction
Exterior
construction
materials
Tiles, glass, tents, plastic films, panelsSelf-cleaning
Interior furnishing
materials
Tiles, wallpaper, window blinds, paints,
finishing coatings
Self-cleaning,
anti-bacterial
Road construction materialsSoundproof walls, tunnel walls, roadblocks, concrete pavementsAir-cleaning, Self-cleaning
Table 2. NO concentrations tested in containers.
Nano-TiO2 (ppm, %)023456
Time (min)
0208207203209210204
5203162158155168166
10198119121114118124
151939892859492
201898067657772
251846254495956
301795142375145
351743831254037
401693226203331
451652221122827
501601818102322
55155161371619
60150121141412
Publisher’s Note: MDPI stays neutral with regard to jurisdictional claims in published maps and institutional affiliations.

