Article

Study on Nanoscale Friction Behavior of TiC/Ni Composites by Molecular Dynamics Simulations

1
School of Mechanical and Electrical Engineering, Lanzhou University of Technology, Lanzhou 730050, China
2
School of Petroleum and Chemical Engineering, Lanzhou University of Technology, Lanzhou 730050, China
*
Author to whom correspondence should be addressed.
Coatings 2022, 12(8), 1168; https://doi.org/10.3390/coatings12081168
Submission received: 7 June 2022 / Revised: 28 July 2022 / Accepted: 9 August 2022 / Published: 12 August 2022

Abstract

:
To systematically investigate the friction and wear behavior of TiC/Ni composites under microscopic, the molecular dynamics (MD) method was used to simulate nano-friction on the TiC/Ni composite. Mechanical properties, abrasion depth, wear rates, temperature change of the material during friction, the microscopic deformation behavior, and the evolution of nickel-based titanium carbide microstructure at high-speed friction have been systematically studied. It was found that the variation of tangential and normal forces is related to the relative position of the grinding ball and the TiC phase, when the grinding ball is located above the TiC phase, large fluctuations in the frictional force occur and extreme value of normal force appears, shallow abrasion depth and low wear rate. During the friction process, there is a high-stress area between the grinding ball and the TiC phase, generating a large number of dislocations. The presence of the TiC phase hinders the development and extension of defects, resulting in a significant increase in temperature. At the same time, dislocation entanglement occurs, which improves the wear resistance of the workpiece. In addition, it was also found that the internal atomic motion guided by the carbonized phase was related to the position of the grinding ball relative to the reinforced phase, with the reinforced phase presenting a tendency to rotate in different directions when the grinding ball was in different positions relative to the reinforced phase, which in turn affected the deformation of the whole workpiece.

1. Introduction

In recent years, academics in various countries have carried out intensive research and development of composite materials with complex structures, high dimensional accuracy, and superior mechanical properties, to meet the needs of high-performance engines in the aerospace sector [1,2,3,4,5]. Among them, metal matrix composite material uses metal as the matrix, and introduces ceramic crystals as the second phase into the metal matrix to improve the hardness and wear resistance of the metal matrix. Among many metal matrix composites, TiC/Ni composites have not only the high strength, oxidation resistance and corrosion resistance of nickel matrix [6,7], but also have excellent mechanical properties (high strength and high modulus) and high-temperature stability of titanium carbide [8], which makes the prepared TiC/Ni composites without reducing the toughness have a higher specific strength, specific stiffness and heat resistance. It has developed into a composite material for important heated parts in aero-engine blades [9]. However, TiC/Ni composites often fail due to frictional wear under actual service conditions, so it is of great scientific importance to study the frictional wear behavior of TiC/Ni composites in depth.
In the present work, research on reinforcing TiC and Ni-based alloys has achieved some results. Xu et al. [8] synthesized gradient TiC particle-reinforced nickel-based composite coatings in situ by laser melting. The results showed that the microhardness of the composite coatings was high at the surface and low at the bottom, which was similar to the gradient distribution of TiC-reinforced particles. Cai et al. [10] designed wear-resistant CoCrNi/(TiC)x composites by introducing TiC into the alloy to improve the wear resistance of CoCrNi alloy. It was found that the compressive yield strength of the CoCrNi/(TiC)x composites increased with the increase of TiC content. Qiao et al. [11] investigated the cutting and machining properties of TiC-reinforced titanium matrix composites (TiC-TMCs) by additive manufacturing (AM). The results showed that different AM parameters lead to different microstructures, which results in different machinability of TiC-TMCs. Li et al. [12] introduced TiC particles into Al-Bi-Cu alloy to control its microstructure, increase its tensile strength and improve its wear properties. They found that alloy with 1 wt% TiC had the lowest frictional wear coefficient and smooth and flat wear surface. Dilek et al. [13] investigated the effect of TiC concentration on morphology, microcrystalline size, micro stress, mechanical, tribological, and electrochemical properties of TiC-enhanced Ni-W co-depositions. It was demonstrated that the best results were obtained at a TiC concentration of 15 g/L.
However, traditional friction experiments mainly simulate the frictional wear of materials based on actual service conditions and invert the frictional wear mechanism from the friction products, the effect of wear on the tissue structure, the morphology of the friction surface, and other related representations [14,15,16]. Nevertheless, due to the limitations of experimental equipment and conditions, the motion of dislocations cannot be observed, and the dislocation evolution process is complex and diverse, such inferred results have certain errors [17]. Meanwhile, material wear is a continuous process in small increments with transient wear up to the micro/nano level [18]. Moreover, the discrete state of the atoms in material at the nanoscale makes it difficult to apply analytic methods based on classical mechanics and continuous media. Therefore, molecular dynamics simulation becomes an effective means to study materials, which can analyze the motion of atoms from the nanoscale, accurately observe the process of phase transition and dynamic migration of materials, and study the nucleation and evolution of internal dislocations in materials, which can well compensate for the shortcomings of experiments [19,20,21]. Additionally, the properties of the material and the working environment can be easily changed according to the needs of the research, creating a bridge between the macroscopic properties and the microscopic nature of the material [22,23,24]. Guo et al. [25] investigated the scratch-induced material removal behavior and mechanism of single-crystal AlN diamond abrasives at the atomic level, through molecular dynamics simulations and nano-wear tests. The results showed that the wear was linearly correlated with the normal load within a limited load range, but could not be maintained at high loads. Liu et al. [26] investigated the effect of cavity defects on the mechanism of dislocation evolution and the mechanical properties of nickel-based high-temperature alloy γ/γ′ thought molecular dynamics simulations. The results show that the accumulation and reaction between dislocations is the most direct cause of the degradation of the mechanical properties of nickel-based high-temperature alloys with cavity defects. Hao et al. [27] studied the effect of the anisotropy of nickel-based single crystal high-temperature alloys on the atomic and close-to-atomic scale (ACS) cutting. They found that ACS cutting is performed on the [011] surface along the [011] direction, the dislocation slips and stacking faults propagation area is small, and the subsurface with few defects can be obtained. Yin et al. [28] performed atomic simulations of the effect of orientation on the tensile/compression properties of nickel-based single-crystal high-temperature alloys. They have shown that the evolution of dislocations and dislocations of layer is one of the reasons for crystal anisotropy.
Nano-friction is becoming an indispensable friction method, while the friction mechanism of TiC/Ni composites under microstructure is still vacant. In this paper, the frictional behaviors of TiC/Ni composites at the atomic level are investigated by MD simulations. The strengthening mechanism of the reinforcement in TiC/Ni composites and the frictional wear behaviors of TiC/Ni composites are systematically analyzed in terms of the interaction between atoms. It is important to further reveal the nature of frictional wear in the friction process of TiC/Ni composites, and to investigate the mechanical properties and defect structure of TiC/Ni composites, etc. The obtained results can help promote further application of TiC/Ni composites.

2. Method

2.1. Simulation Modelling

In the study, a large-scale atomic/molecular parallel simulator (LAMMPS) [29] is to be used to perform molecular dynamics simulations. Analogue output analysis is via OVITIO visualization software [30]. Figure 1a shows the established MD simulation model, which contains a rigid spherical diamond grinding ball and a TiC/Ni composite material matrix. The TiC/Ni composite material consists of two base units, the TiC phase and Ni phase, and the Ni phase serves as the matrix of the composite material. First, the Ni phase MD model was established with FCC crystalline structure with the lattice constant of 3.524. Next, four spherical pores were introduced to accommodate the TiC phase nanofillers, where the crystal structure and lattice constant of TiC are face-centered cubic lattice and 4.33 Å, respectively [31]. In addition, reinforcement particles are considered to be evenly distributed spheres, which has been widely used in MD simulations [32,33]. The distribution and geometric characteristics of the introduced TiC phases are shown in Figure 1a, to better visualize the details of the model, the model was cut along the [010] direction, and four spherical TiC phases were uniformly distributed in the Ni matrix with a diameter of 50 Å, 25 Å from the surface, and a distance of 30 Å between the TiC phases. The simulation, in which a constant load is applied to the grinding ball at the microscopic level, and linear friction is made along the [−100] direction, enables a systematic study of the deformation behaviors throughout the process from the start of material contact until compaction, and also reflects the protective effect of reinforced phase on the material at different depths relative to the grinding ball, as shown in Figure 1b. Based on the proposed model, the nano-scale wear characteristics of TiC/Ni composites can be investigated in depth.
Table 1 shows the parameters selected for this simulation. The dimensions of the workpiece are 450 × 160 × 180 Å, along with the directions [100], [010] and [001]. The simulation contains 1,211,706 atoms, of which 1,174,305 are nickel atoms, 25,717 are TiC atoms and 11,648 are tool C atoms. The workpiece atoms are, from top to bottom, the Newtonian layer, the thermostatic layer, and the fixed layer. The Newtonian layer is the focus area for the study of material deformation during friction and follows the classical Newton’s second law, whose equations of motion are integrated numerically using the Velocity-Verlet algorithm [34]. The atoms in the constant temperature layer follow Nose-Hoover thermodynamics to simulate the heat dissipation during friction, and readjust the atomic velocity every ten steps (time step of 1 fs) to maintain the temperature at 300 K. The boundary layer acts as a fixation for the specimen to keeps the system from moving rigidly. The boundary layer plays a fixed role for the workpiece to ensure that the workpiece does not move rigidly, and to avoid deformation of the workpiece caused by inconsistencies with the actual machining [35,36,37], free boundaries are used in the x- and z-directions. To reduce the influence of size effects on the simulation results, a periodic boundary is used in the y-direction [38].

2.2. Selection of Potential Function

The choice of the interatomic interaction potential plays an important role in the accuracy of the simulation results, and there are seven interatomic interactions in this simulation: (1) The interaction between diamond grinding ball atoms (C-C) is described using the Tersoff potential [39]. (2) The interaction between the matrix nickel atoms (Ni-Ni) is described by the developed embedded atom method (EAM) potential [40,41]. (3) The interaction between the diamond grinding ball and the matrix nickel atom (C-Ni) is described using the Morse potential. The equation is shown in (1) [42]:
U Morse ( r i j ) = D [ e 2 α ( r i j r 0 ) 2 e α ( r i j r 0 ) ]
where α is the bulk modulus fitted to the material, rij and r0 are the separations and equilibrium distance between atoms i and j, respectively, and D is the cohesion energy of the exchange interaction. Table 2 shows the corresponding potential parameters.
(4) MEAM is used to describe the interaction forces between Ti-Ti, Ti-C, Ti-Ni, and C-C in the TiC/Ni composite matrix. The total energy of the system E is as follows [45,46]:
E = i { F i ( ρ i ) + 1 2 ( i j ) S i j ϕ i j ( r i j ) }
where the embedding energy of atom i in the background electron density ρi is Fi; the shielding function is Sij; the pairwise interaction between atoms i and j is ϕ i j ( r i j ) ; and the distance between atoms i and j is rij. The parameters are shown in Table 3 and Table 4. Among the parameters that define the 2 NN MEAM between two atoms are the cohesion energy Ec, the equilibrium distance re, the bulk modulus B, and the screening parameters. Ec, re, and B can be obtained experimentally by material characterization. The screening parameters Cmax and Cmin, determine the validity of atom to be included in the interaction between two neighboring atoms (i and j). More details on 2 NN MEAM can be obtained from the literature [45,47].

3. Results and Discussion

3.1. Study on Mechanical Properties and Wear Mark Depth of the Workpiece

To accurately study the mechanical properties of the material throughout the friction process, the normal force Fn between the grinding ball and the workpiece was extracted, as shown in Figure 2. It can be seen that Fn fluctuates up and down around a constant value throughout the friction process. The fluctuations are mainly related to the presence of the TiC phase. When the grinding ball frictions directly above the TiC phase, the defect at the lower end of the grinding ball nucleates and develops towards the inside of the workpiece. However, when the development of the defect encounters the TiC phase, the defect is not able to pass through the TiC phase and a relatively stable L-C dislocation is formed between the TiC phases, resulting in a continuous energy build-up in the action region, which makes the Fn increase. With the continued action of the grinding ball on the workpiece, maximum values of Fn occur, as shown in Figure 2a. However, when the grinding ball friction through the TiC phase, the Fn decreases sharply, with a minimum value appearing at point “b”. The main reason for the fact is that the original stable dislocation at the lower end of the grinding ball is destroyed at this time and the resistance to the grinding ball is reduced, resulting in a decrease of Fn. This indicates that the presence of the TiC phase leads to a significant increase in the normal force Fn, which helps to improve the deformation resistance of the material.
Figure 3a presents the dynamic response curve of the friction force Ff with the friction distance. It can be seen that as the friction distance increases, the fitted curve of Ff first increases rapidly and then gradually stabilizes. This can be attributed to the rapid increase in the workpiece atoms in contact with the grinding ball at the initial friction, leading to a rapid increase in the Ff. With the increase in friction distance, the workpiece atoms in contact with the grinding ball continue to increase, and the rate of increase in Ff gradually decreases, as shown by the black line in Figure 3a. When the applied constant load is not sufficient to drive the grinding ball in the z-direction, the final Ff fitted value will level off.
In addition, it was also found that Ff was found to be smaller when the grinding ball was directly above the TiC phase (Friction distances of 8, 16, 24, and 32 nm), whereas Ff was larger when the grinding ball was between two TiC phases (Friction distances of 12, 20, and 28 nm), as shown by the blue line in Figure 3a. This is mainly because the presence of TiC makes it difficult to remove material when the grinding ball is located above the TiC phase, while the grinding ball is located in the middle of two TiC phases, more atoms are removed and the hindrance to the grinding ball is strong; the whole friction process is constantly repeating the relative position change of the grinding ball and the TiC phase, which eventually makes Ff appear to fluctuate approximately periodically.
As shown in Figure 2 and Figure 3a, the normal force (Fn) and the friction force Ff during the friction process can be extracted. Thus, the variation curve of the friction coefficient with the friction distance is calculated using μ = Ff /Fn, as shown in Figure 3b. It can be seen that the friction coefficient fluctuates up and down around a constant value, but the friction coefficient is lower near the TiC phase, indicating that the presence of the TiC phase changes the friction coefficient of the Ni matrix.
Figure 4 presents a graph of the variation of the abrasion depth with the friction distance. To have a clearer observation of the variation of the abrasion depth during the friction process, the abrasion depth data has been fitted, as shown by the black line in Figure 4. One can see that as the friction distance increases, the overall abrasion depth growth rate gradually becomes slower and eventually stabilizes. This is mainly due to the friction of the grinding ball on the workpiece under a constant load.
To accurately analyze the effect of the presence of the TiC phase on friction during the friction process, four regions containing the TiC phase were selected, as shown in Figure 4a–c,s. As shown in Figure 4a, one can see that the depth of the abrasion marks in stages I and III continues to increase, while the depth of the abrasion marks in stage II is shallower than that in stages I and III. This is for reasons of the different lattice constants of the matrix nickel and TiC, when the matrix atoms are subjected to the downward action of the grinding ball, they tend to slip downwards at the interface between the two phases, resulting in an increase in the depth of the abrasion marks. In stage II, however, the grinding ball is located above the TiC phase, at which point the TiC phase as a whole assumes the force of the grinding ball on the workpiece, ultimately leading to a difference in the depth of the abrasion marks. This indicates that the presence of the TiC phase improves the resistance of the workpiece to abrasion. Similarly, there is also the phenomenon of the “a” region that exists when the grinding ball grinds to other locations of the TiC phase, as shown in Figure 4b,c, which is the reason for the near-periodic fluctuation of Ff. However, the distance between the grinding ball and the TiC phase at the beginning of the friction is far away, and the TiC is not significant relative to the role of the workpiece, and a similar law did not emerge, as shown in Figure 4s.
The wear rate reflects the wear resistance of the material. By using ovito to intercept the workpiece with a thickness of 1 nm every 1 nm in the x-direction, the intercepted wear mark after friction is output, so as to calculate the real wear mark area after rebound. Using Achard equation [50], the wear rate δ can be calculated according to the normal load F at the contact point, the sliding distance L and the wear volume V, as shown in Formula (3):
δ = V F L
The dynamic curve of the wear rate with friction distance was calculated by Equation (3), while the wear rate data were fitted to observe the effect of the presence of the TiC phase on the wear resistance of the nickel matrix, as shown by the black line in Figure 5. One can see that as the friction distance increases, the fitted curve gradually stabilizes and smaller values of the wear rate occur in the area above and adjacent to the TiC where the grinding ball is located, as shown in Figure 5 at 8, 16, 24, and 32 nm. This indicates that the presence of the TiC phase improves the wear resistance of the workpiece, resulting in a lower wear rate of the material. Additionally, it was found that the frequency of wear rate fluctuations increased with growing friction distance. This is because the distance between the grinding ball and TiC phase keeps getting closer and the relatively high hardness of TiC, the energy between the grinding ball and TiC phase keeps accumulating and releasing, dislocations keep generating and destroying, resulting in the discontinuity of material removal, which makes the frequency of wear rate fluctuation keep increasing.

3.2. Effects of Atomic Displacement

To observe the microscopic deformation behaviors of the workpiece during the friction process, typical atomic displacement vector maps of the workpiece when the grinding ball is located before and above the TiC phase were obtained to color according to the size of the atomic displacement, as shown in Figure 6. One can see that when the grinding ball just contacts the workpiece, the atoms at the lower end of the grinding ball produce a 45° displacement trend along the most likely to slip surface of FCC structure atoms, as shown in Figure 6(a1). However, the motion is hindered when the atoms encounter the TiC phase in motion, as shown in Figure 6(a2,a3). With the relatively large hardness of the TiC phase, the obstacles-cutting case is difficult to happen for the hard obstacles, so the atoms cannot break through the TiC phase to continue in their original direction of motion, resulting in a deflection of the direction of motion of the atoms, as shown in Figure 6(a4). With the friction distance increases, and the grinding ball continuing to move downwards, the effect on the workpiece atoms increases, whereas the atoms are still unable to break through the TiC phase, creating a tendency to move along the outer edge of the TiC phase towards the inside of the workpiece, as shown in Figure 6(b2,b3). Meanwhile, the nickel atoms rub against the atoms on the right side of the TiC phase during the motion, causing the TiC phase atoms to develop a rotational tendency. When more nickel atoms act on the TiC phase, the TiC phase atoms develop a counterclockwise rotational motion, and the immediately following nickel atoms also produce a counterclockwise rotational motion, as shown in Figure 6b. Nevertheless, when the grinding ball is pressed positively against the TiC phase, the TiC phase atoms occur in a clockwise rotational motion, as shown in Figure 6(c2). This is mainly due to the change in the position of the nickel atoms acting on the TiC phase; the atoms at the lower end of the grinding ball act on the upper surface of the TiC phase, and the mutual friction between the nickel and TiC phase atoms causes a clockwise rotational motion of the TiC phase atoms. It is noteworthy that the nickel atoms continue to move in the 45° direction after bypassing the TiC phase, as shown in Figure 6(c1). Similarly, when the grinding ball is located before the next TiC phase, the atoms produce a motion similar to that in Figure 6b, as shown in Figure 6(c3,c4). The above indicates that the TiC phase guides the movement of the atoms inside the workpiece, and the movement of the atoms in the TiC phase absorbs part of the force of the grinding ball on the workpiece, increasing the plastic deformation capacity of the workpiece.
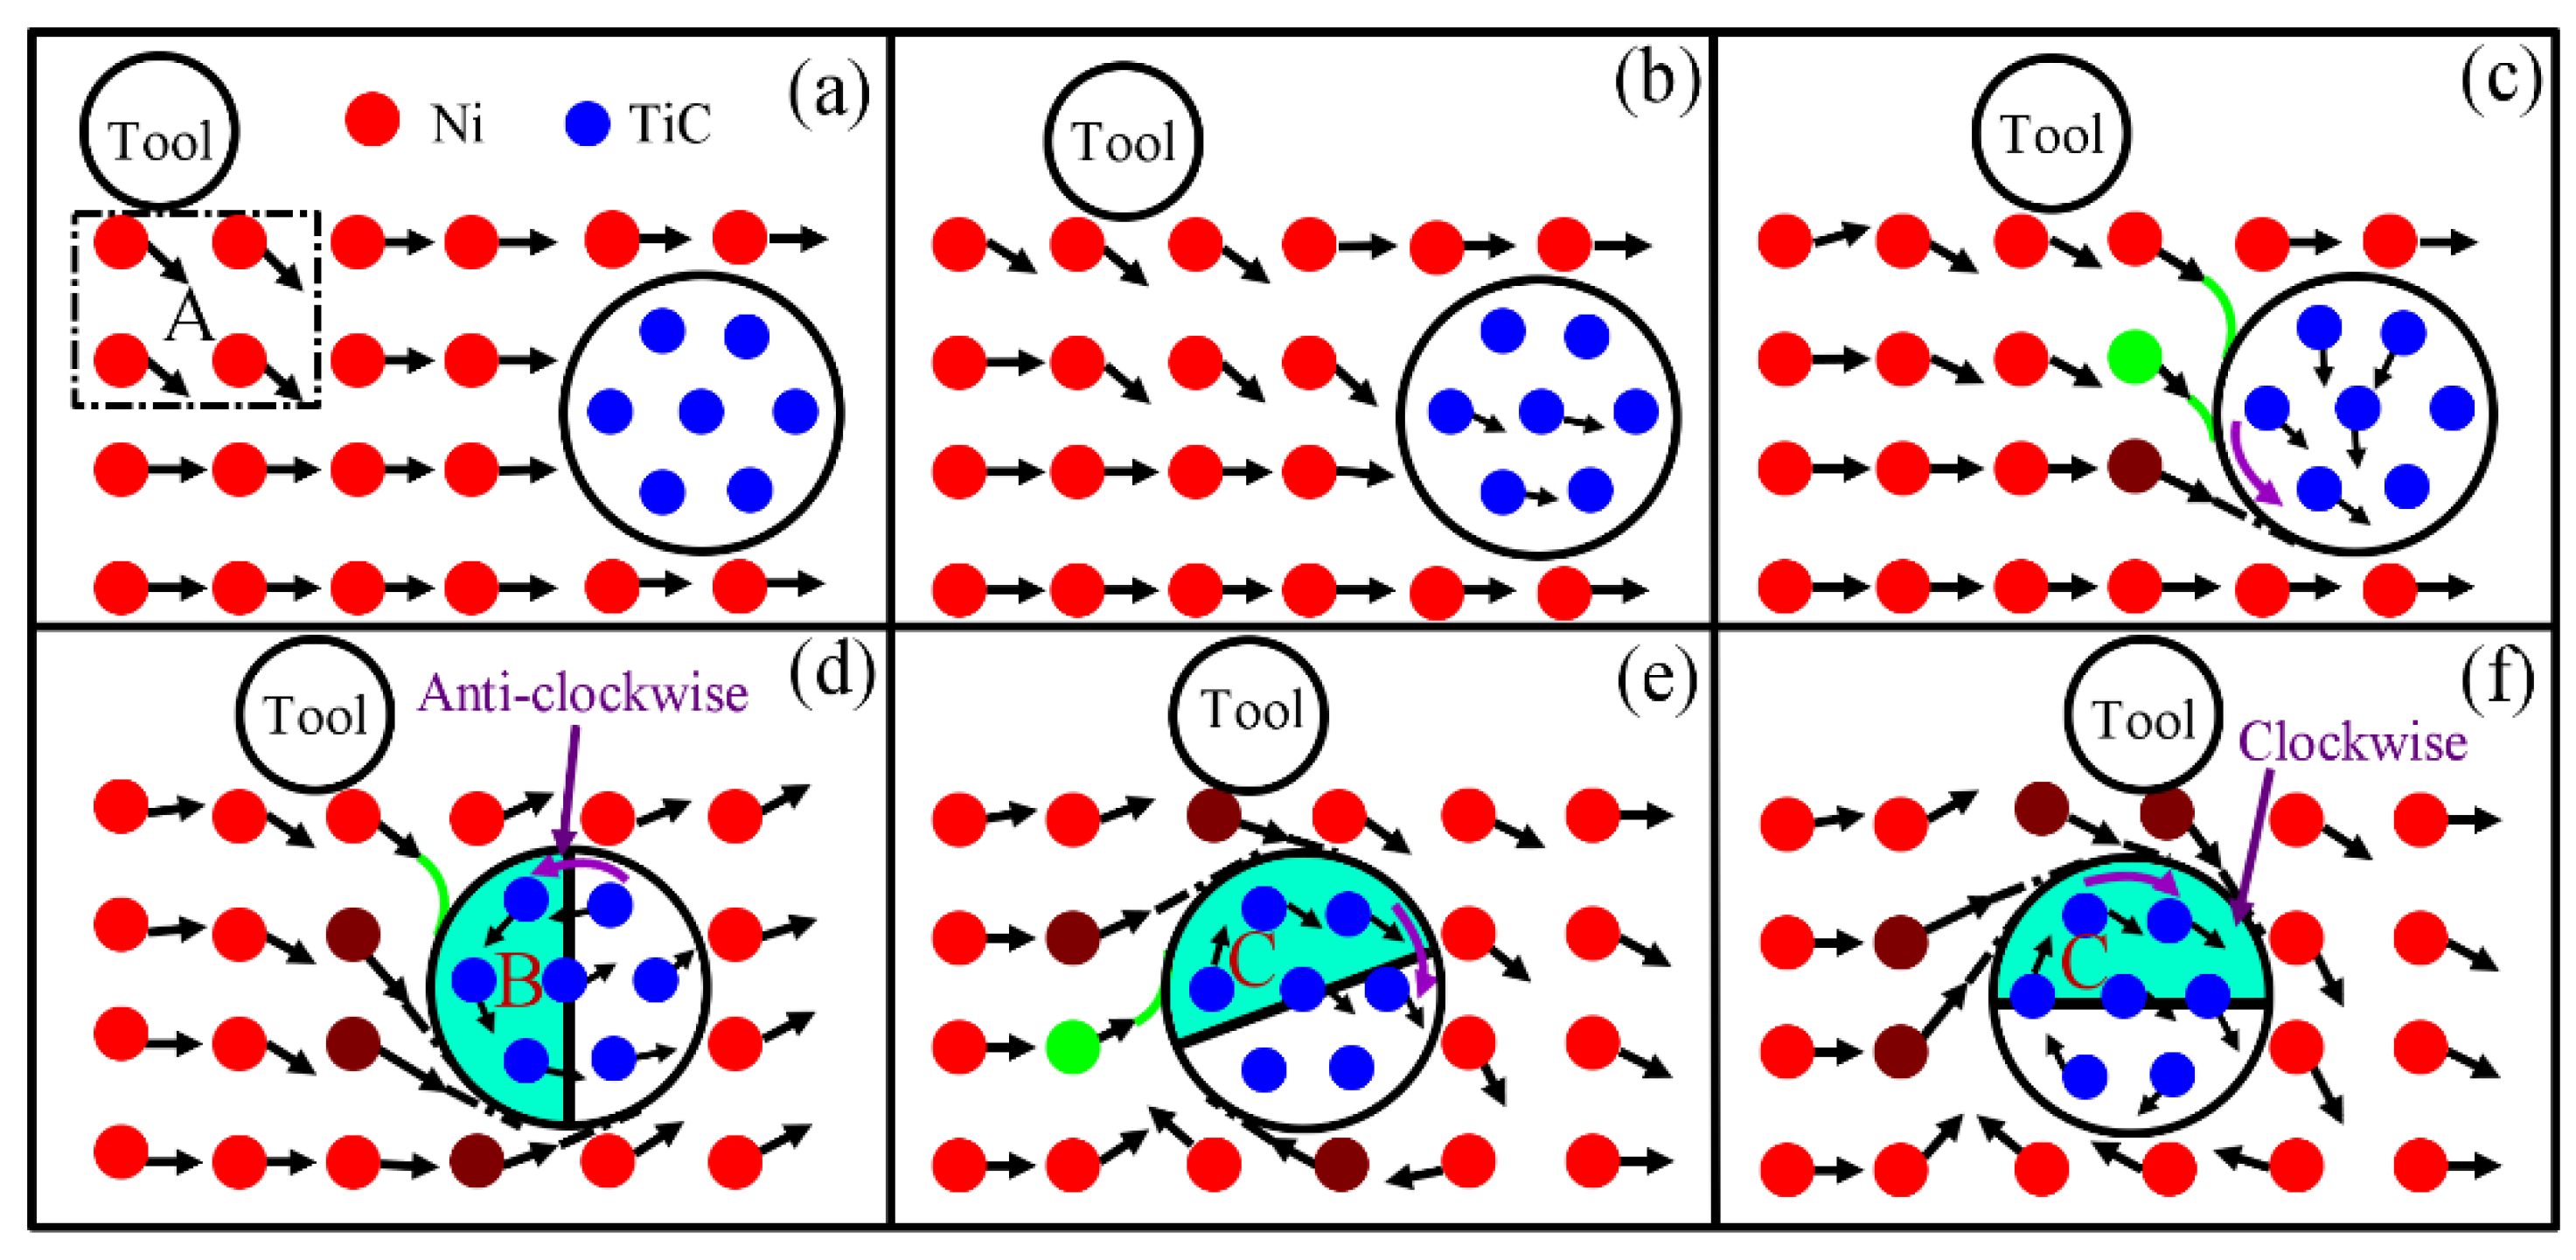
To illustrate the effect of the presence of the TiC phase on the movement of the matrix nickel atoms during the friction process, a schematic diagram of a continuous process in which a grinding ball is ground through the TiC phase is drawn, as shown in Figure 7. When the grinding ball is just in contact with the workpiece the atoms at the lower end of the ball are subjected to an external force, which causes a 45° prone on displacement along its plane of slip, as shown in area A Figure 7a. With the continuous action of the grinding ball, the displaced matrix atoms transfer the displacement tendency to some of the atoms in the TiC phase, as shown in Figure 7b. As the grinding ball moves closer and closer to the TiC phase, the number of nickel atoms acting on the TiC phase continues to increase, which causes the number of atoms displacement in the TiC phase continues to increase, as shown in Figure 7c. However, due to the relatively stable structure of the TiC phase, the nickel atoms cannot break through the TiC phase to maintain the original motion trend, creating a tendency to move around the TiC phase, as shown by the green line in Figure 7. As the growing number of matrix nickel atoms act on the B region of the TiC phase, they drive the TiC phase atoms to produce a counterclockwise rotational motion, and the nickel atoms immediately following the TiC also produce a counterclockwise rotational motion, as shown in Figure 7d. However, when the grinding ball was ground above the TiC phase, the TiC phase atoms and the surrounding nickel atoms produced a clockwise rotational motion. This is mainly due to a change in the area where the nickel atoms act on the TiC phase. When the grinding ball is located above the TiC phase, the nickel atoms at the lower end of the grinding ball act on the C region of the TiC phase, as seen in Figure 7e. Under the continuous friction of the grinding ball, the movement of the matrix nickel atoms below the grinding ball to the right produces continuous friction on the upper surface of the TiC phase, providing energy for the movement of the TiC phase atoms, resulting in the movement of the TiC phase atoms along a clockwise rotation, as shown in Figure 7f. This indicates that the internal atomic motion guided by the TiC phase is related to the position of the grinding ball concerning the reinforced phase.
The surface of the wear scar morphology was analyzed to reveal the microscopic behaviors of the TiC/Ni composite during the friction process. Figure 8 shows a top view of the TiC/Ni composite during nano-friction, with the atoms colored according to their height in the z-direction. One can see that when the grinding ball acts on the region without TiC phase, layer dislocations form and propagate in the <110> slip direction, and a large number of chip atoms symmetric distribution on both sides of the wear scar path, with a circular chip profile at the front of the grinding ball, as shown in Figure 8a. However, when the grinding ball acts above the TiC phase, there is a displacement difference between the workpiece surface at the front end of the grinding chip, the front end protrudes at a right angle, as shown in Figure 8b. This indicates that when the grinding ball is located above the TiC phase, violent plastic deformation occurs inside the workpiece, causing a displacement difference on the surface of the workpiece. Similarly, the same law occurs when the grinding ball friction to the next TiC phase, as shown in Figure 8c,d. In addition, it was also found that when the grinding ball was located above the TiC phase, the stacked atoms on both sides appeared asymmetrically distributed, as shown in Figure 8(d1,d2).

3.3. Variation of Internal Defects with Friction Processes

It has been indicated that lattice mismatch in metal matrix composites of more than 5% results in a semi-coherent interface between the matrix and the inclusions [51]. Where the lattice mismatch is calculated as follows:
δ = a N a S a N
where a S and a N are lattice constants of matrix and inclusion, respectively. According to the modelling data, the lattice mismatch in TiC/Ni matrix is about 18%.
To analyze the influence of the semi-coherent interface on the friction process of TiC/Ni composites, the generation, development, and extension of dislocations during the friction process were investigated and the Dislocation Extraction Algorithm (DXA) in OVITO [52] was used to identify dislocations. Previous studies have shown that the presence of local stress concentrations between the two phases will promote dislocation nucleation [53]. When the grinding ball contacts the workpiece, a large number of Shockley dislocations, with a small amount of Stair-Rod dislocations are generated, as shown in Figure 9a. Since Stair-Rod dislocations are fixed dislocations, they ensure the stability of the dislocation structure during motion and influence the deformation behavior by impeding the dislocation movement [23]. Under the continuous extrusion of the grinding ball, the two dislocations combined to form a new Stair-Rod dislocation, and the original Stair-Rod dislocation was not destroyed, as shown in Figure 9b. The corresponding dislocation interactions are expressed as:
1 6 [ 2 1 ¯ 1 ] + 1 6 [ 1 ¯ 2 1 ¯ ] = 1 6 [ 110 ] .
With the continued action of the grinding ball, new dislocations nucleated, developed, and extended, whereas the TiC phase blocked the further extension of dislocations, as shown in Figure 9c. This indicates that the TiC phase is an obstacle to the motion of dislocations. Cross-slip and obstacle cutting is the most common mechanisms through which dislocations can cross the obstacle [54]. Nevertheless, the presence of a high-stress field around the inclusions cannot provide the energy required for slip [2], resulting in the accumulation of a large number of dislocations between the grinding balls and the TiC phase, as shown in Figure 9(d1). Meanwhile, the adjacent TiC phase also hinders the extension of dislocations, as shown in Figure 9(d2). Subsequently, under the further action of the grinding ball, some reaction between the new dislocation and the fixed dislocation occurs, leading to the creation of a locked dislocation, as shown in Figure 9(e2). Consequently, the interaction of dislocations leads to the improved performance of TiC/Ni composites.
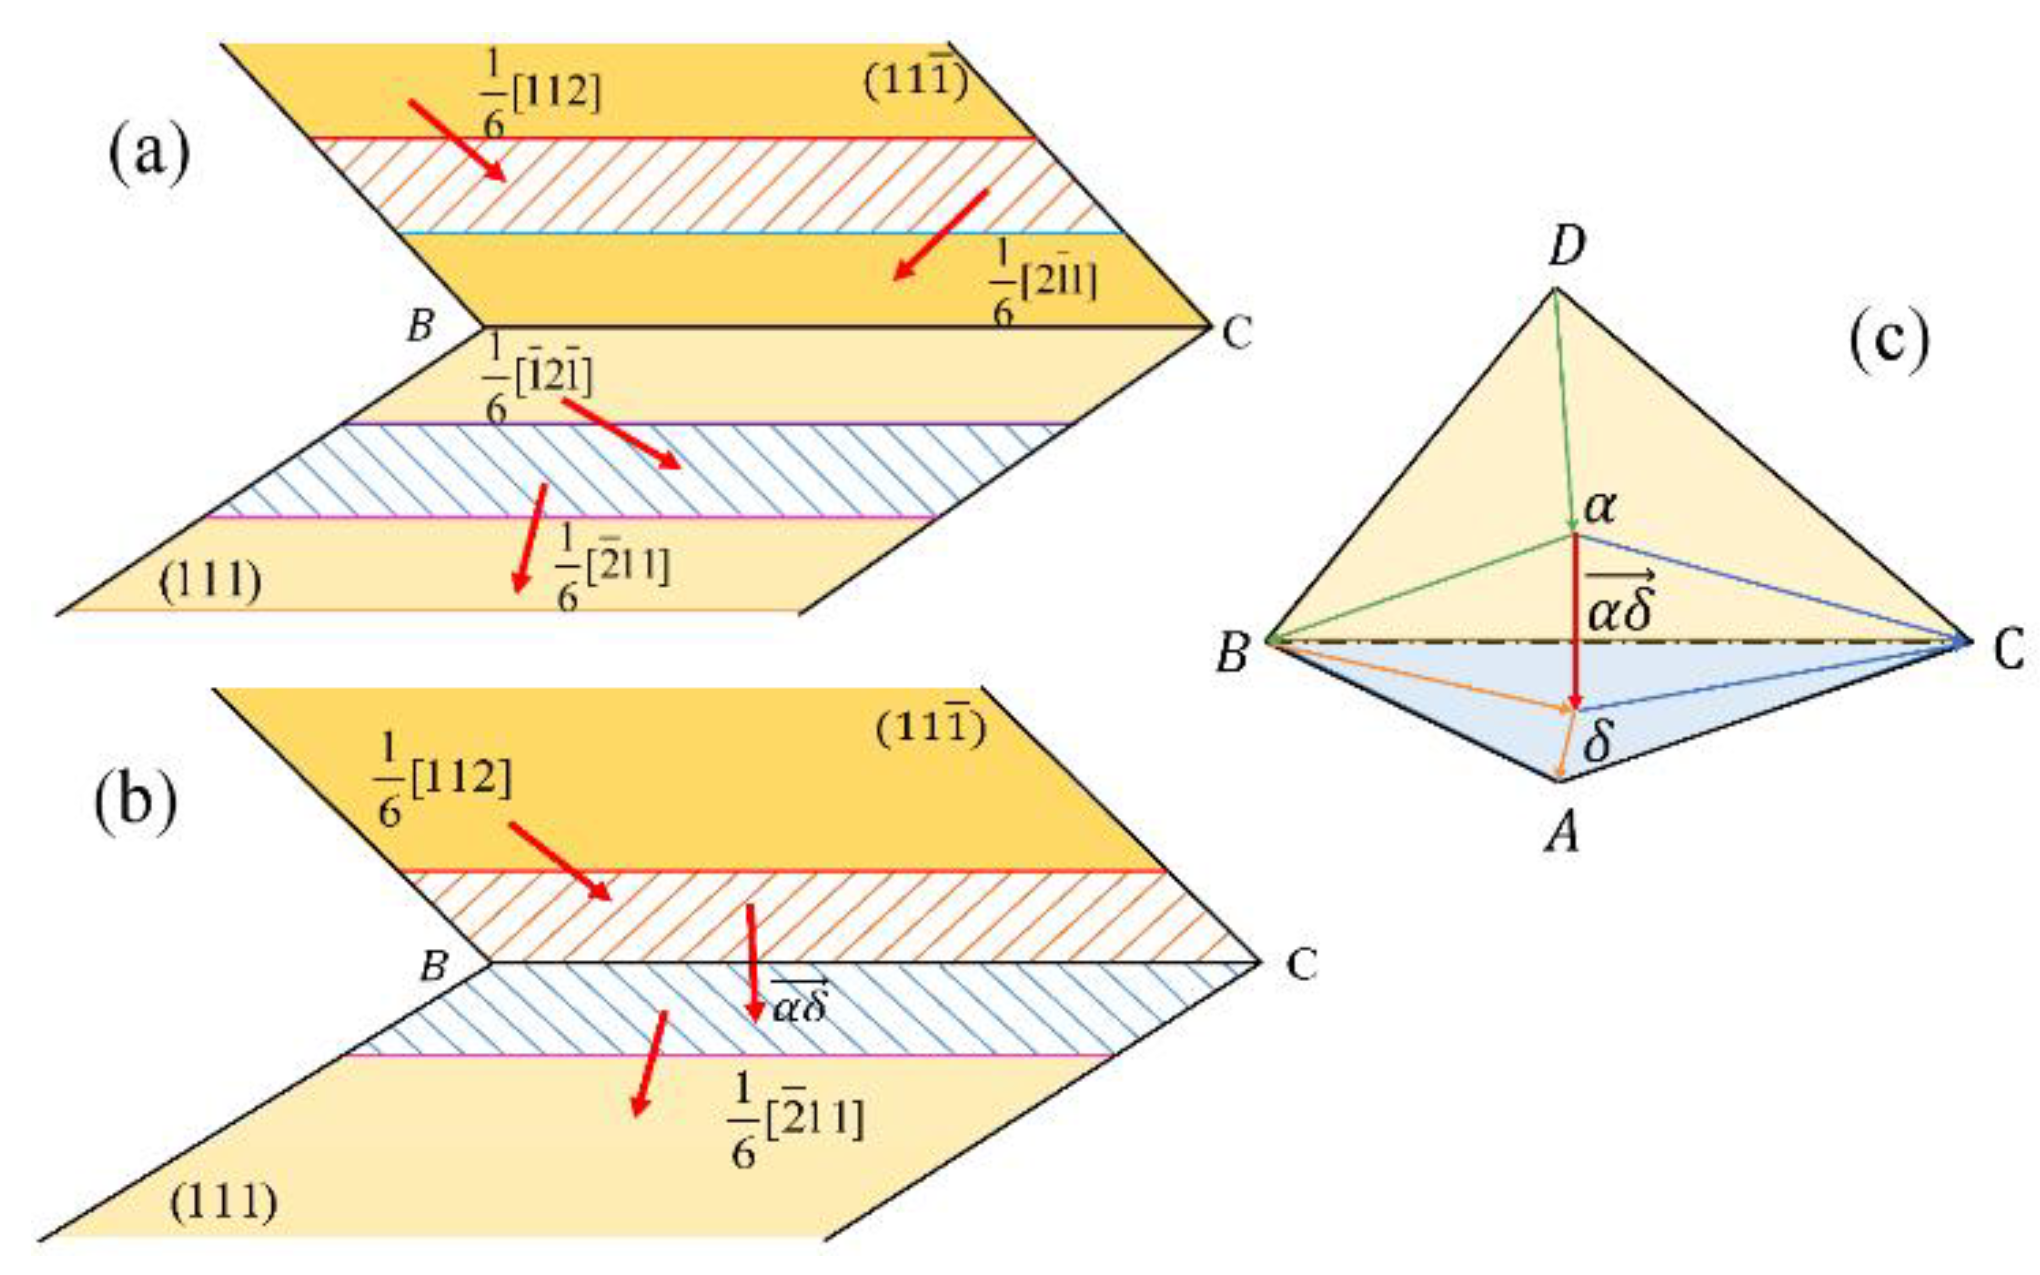
The accumulation of dislocations increases the energy and stress concentration at the contact surface, and the dislocations show different patterns of motion during further plastic deformation. Among them, the Perfect dislocation is decomposed into two Shockley extension dislocations, where the leading dislocations of the two extension dislocations meet on the intersecting slip surfaces. Figure 10 is a schematic diagram of the interaction between the first and second dislocation segments. In the (111) and ( 11 1 ¯ ) surface Thompson tetrahedra are represented by ABC and DBC, respectively, as shown in Figure 10c. The two reaction processes of the first dislocation segment in the ABC and DBC planes can be expressed as:
B A = B δ + δ A D B = D α + α B
As shown in Figure 10a, the dislocation reaction of the second dislocation segment:
1 2 [ 1 ¯ 10 ] 1 6 [ 1 ¯ 2 1 ¯ ] + 1 6 [ 2 ¯ 11 ] , 1 2 [ 101 ] 1 6 [ 112 ] + 1 6 [ 2 1 ¯ 1 ] .
Extended dislocations α B and B δ create a new dislocation α δ at the intersection of two planes. the reaction is
α B + B δ = α δ
As shown in Figure 10b, the dislocation reaction of the second dislocation segment:
1 6 [ 2 1 ¯ 1 ] + 1 6 [ 1 ¯ 2 1 ¯ ] 1 6 [ 110 ] .
The Berger vector of the new dislocation 1/6 [110] is on the (001) surface and the slip surface is (001), and since this dislocation cannot slip again on the slip surface, the dislocation is effectively locked and acts as an obstacle to any nearby moving dislocations that share the same slip system [55].
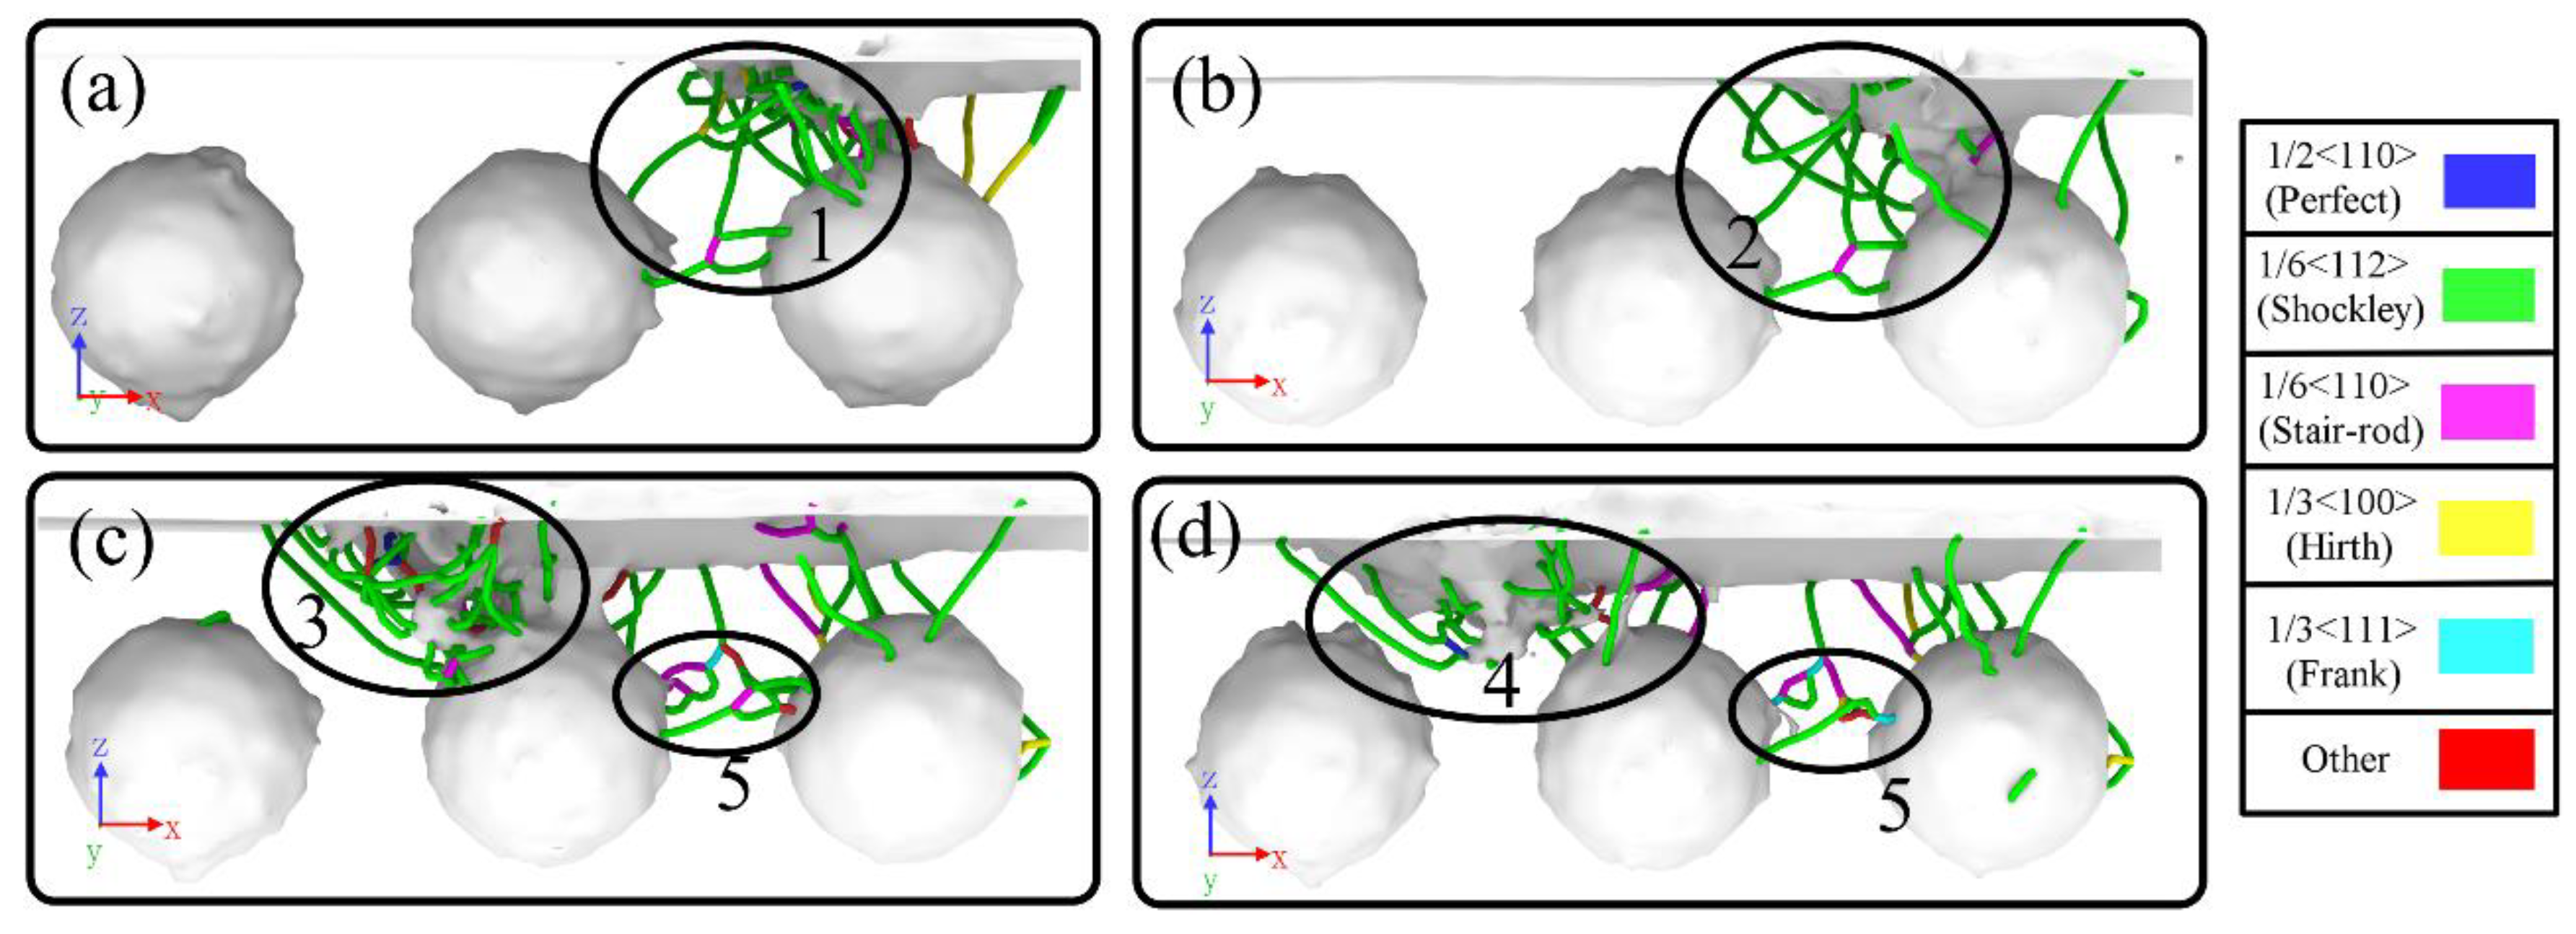
Figure 11 presents the schematic diagram of dislocations at different distances between the grinding ball and the TiC phase. When the friction distance is 8 nm, a large number of dislocations are generated between the grinding ball and the TiC phase, with the dislocations extending as far as the TiC phase, as shown in Figure 11(a1). When the dislocation extension is blocked, strengthening of this region occurs, similar situations were observed at stacking layer dislocations [56], grain boundaries [57], Ni-Cu interface [43], and Al-Si interface [58], etc. However, when the grinding ball leaves the TiC phase, the dislocations between the grinding ball and the TiC phase are reduced. This can be attributed to the action force between the grinding ball and the TiC phase being reduced, and the TiC phase also no longer blocks the extension and development of the defect, making fewer dislocations between them, as shown in Figure 11(b2). When the friction distance is 16 nm, the grinding ball and the TiC phase produce a large number of dislocations again, and more than the number of dislocations when the friction distance is 8 nm, as shown in Figure 11(c3). This is because the linear motion of the grinding ball under a fixed load, which fails to be compacted when the grinding ball moves 8 nm. With the distance between the grinding ball and the TiC phase decreasing, the action energy between the grinding ball and the TiC phase continues to become stronger, so that the dislocation changes complex, dislocation density increases, forming a dislocation network, resulting in the region being strengthened—denoted Orowan strengthening [59]. Likewise, the number of dislocations between the grinding balls and the TiC phase decreases when the friction of the grinding ball through the TiC phase, as shown in Figure 11(d4). In addition, during the friction process, the dislocations between the two TiC phases continuously move and interact, resulting in complex dislocation reactions and the formation of stepped rod dislocations, as shown in Figure 11(c5,d5).
To accurately analyze the variation of the total dislocation length during the friction process, the total dislocation lengths of Shockley, Perfect, Stair-Rod, Frank, Others, and Hirth were counted throughout the process, as shown in Figure 12. Moments 1, 2, 3, and 4 in Figure 12 correspond to moments a, b, c, and d, in Figure 11. One can see that throughout the friction process, the total length of dislocations peaks when the grinding ball is pressed positively against the TiC phase, as shown in Figure 12a,c. When the grinding ball leaves the TiC phase, the total length of dislocation appears as a valley, as shown in Figure 12b,d. Furthermore, the dislocation length can reflect the degree of internal plastic deformation to some extent. Combined with the results of Figure 11, it is further demonstrated that the closer the grinding ball is to the TiC phase, the easier it is to form a dislocation network, which eventually leads to an increase in hardness.
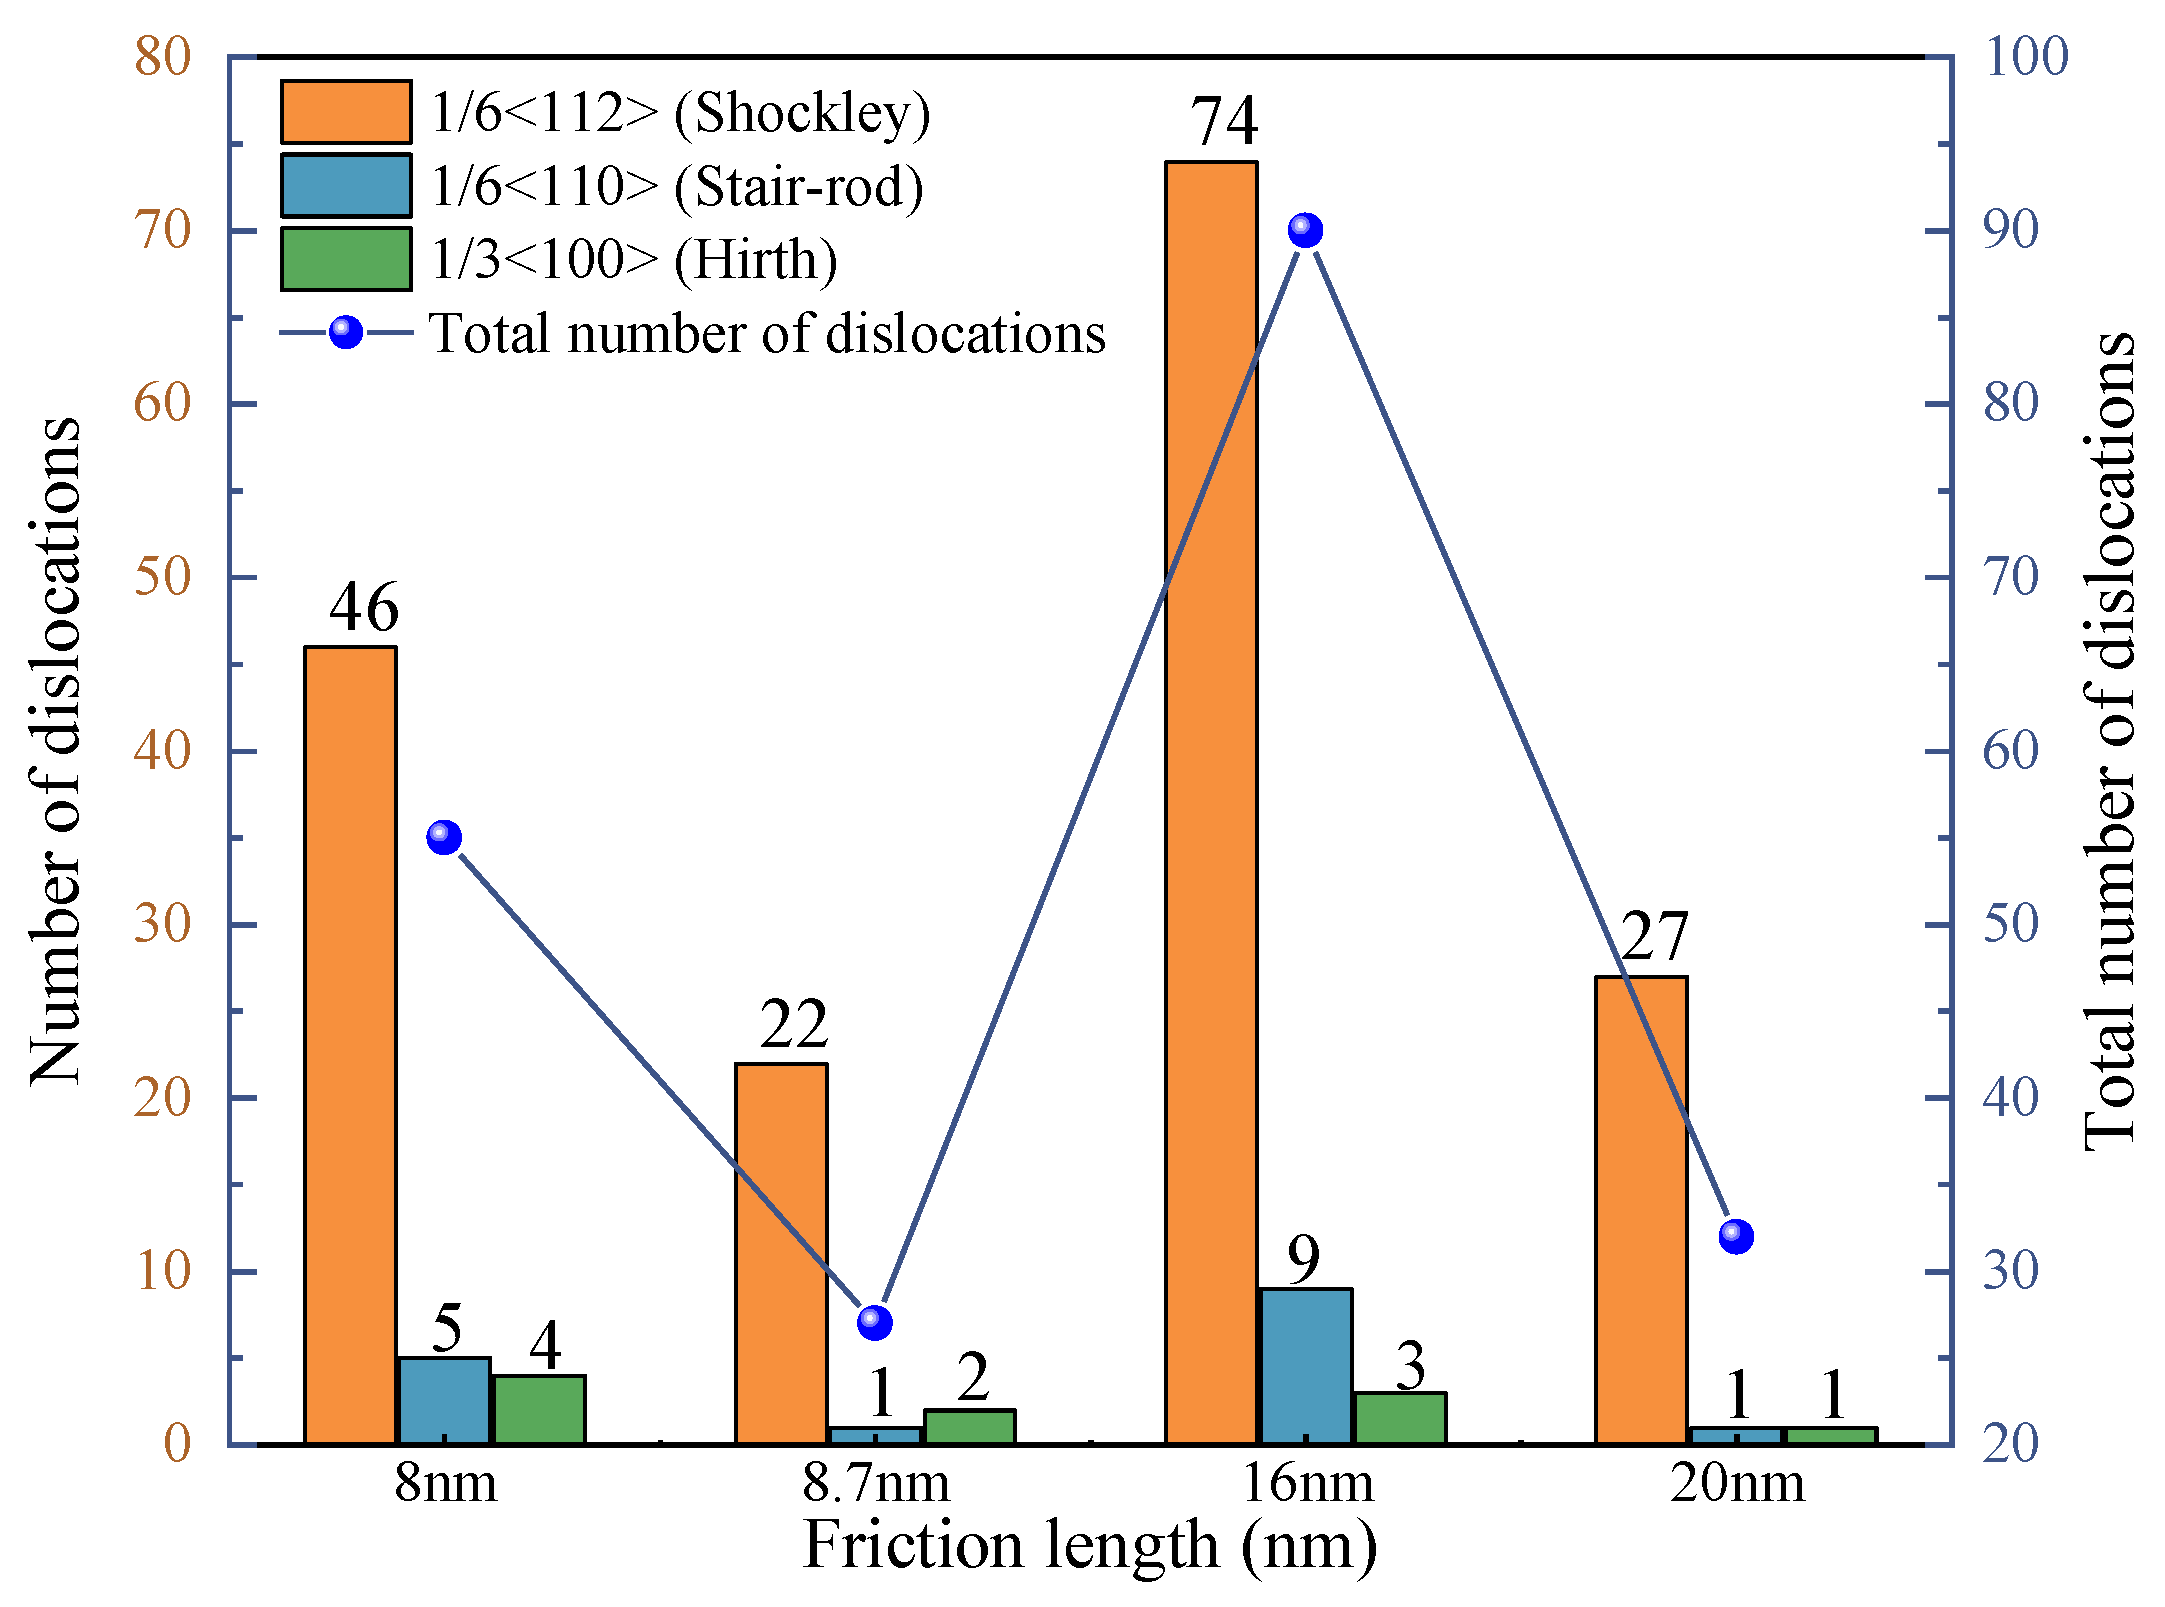
Meanwhile, to analyze the variation law of the number of dislocation bars during the friction process, the number of dislocation bars in a, b, c, and d in Figure 11 was counted, as shown in Figure 13. One can see that the number of Shockley dislocations is significantly higher when the TiC phase is positively pressed by the grinding ball, than when the TiC phase is not subjected to a positive pressure of the grinding ball. This phenomenon is also present in other dislocations, but the variation is not significant. Meanwhile, the closer the grinding ball is to the TiC phase, the more dislocation bars there are and the dislocation density increases. Moreover, the total number of dislocations when the grinding ball is positively pressurized on the TiC phase is also more than that when the grinding ball is not positively pressed. The above results, combined with Figure 11, further demonstrate that dislocation entanglement is easily formed between the grinding balls and TiC, resulting in enhanced deformation resistance of the workpiece.
To accurately analyze the variation in the number of defects in the workpiece during the friction process, the proportions of HCP, Other, and FCC in the atomic number of the workpiece were counted separately, using Common Neighbor Analysis (CNA) in OVITO, as shown in Figure 14. One can see that the percentage of amorphous atoms continues to rise throughout the friction process with some fluctuations, as shown in Figure 14a. This is due to the plastic deformation of the intact workpiece under the extrusion of the grinding balls and the accompanying creation and destruction of defects, resulting in a continuous increase in the proportion of amorphous atoms with fluctuations. In addition, a large number of HCP structural atoms are generated between them when the grinding ball is positively pressed against the TiC phase, as shown in Figure 14a, where the grinding ball friction distances are 8, 16, 24, and 32 nm. This indicates the presence of high compressive stresses between the grinding balls and the TiC phase, with a large number of dislocation nucleation to reduce stress concentration. Meanwhile, with the continuous action of the grinding ball on the workpiece, the atoms of single-crystal nickel with FCC structure leave the original lattice sites under the extrusion of the grinding ball and gradually change to BCP, BCC, and amorphous atoms, etc., leading to a decrease in the atomic percentage of FCC structure, as shown in Figure 14b.

3.4. Study on Stress and Temperature during Friction

To observe the TiC/Ni workpiece stress distribution, the von-Mises stress distribution is used, with the following equation [60]:
σ M = 1 2 ( σ A 2 + σ B 2 + σ C 2 ) + 3 B
where:
σ A 2 = ( σ x x σ y y ) 2 σ B 2 = ( σ x x σ z z ) 2 σ C 2 = ( σ y y σ z z ) 2 B = ( σ x y 2 + σ x z 2 + σ y z 2 )
where σij is the virial stress component of each atom.
Figure 15 presents the distribution of the von-Mises stresses in the TiC/Ni composites during the nano-friction process. One can see that when the grinding ball first friction to the TiC phase, the region of high von-Mises stress is located between the grinding ball and the TiC phase, in and around the TiC phase, as shown in Figure 15a. With the gradual downward movement of the grinding ball, the stress between the grinding ball and the TiC phase gradually increases, and the atoms gradually change from light green to red, as shown in Figure 15b,d. However, when the grinding ball is located in the TiC-free phase, high von-Mises stress regions only appear near the grinding ball, mainly in light green, as shown in Figure 15c. It is indicated that for TiC/Ni composites, the presence of reinforcements is accompanied by the generation of stress fields in the interfacial region. The more concentrated the stress in part of the region, the easier it is to form a region of high dislocation density, which is consistent with our previous observations in Figure 11. Consequently, the interaction of dislocations strengthens this region, leading to improved properties of the TiC/Ni composites.
Meanwhile, the change in stress during friction was analyzed and the number of partially stressed atoms was counted, as shown in Figure 16. One can see that when the grinding ball is not located above the TiC phase, valleys appear in the number of high-stress atoms, as shown in points a, b, c and d in Figure 16. When the grinding ball is located above the TiC phase, a peak in the number of highly stressed atoms appears, and the peak gradually increases as the grinding ball gets closer to the TiC phase. However, the number of highly stressed atoms remains almost constant without a large downward shift of the grinding ball, as shown by the black line in Figure 16. In addition, atoms with relatively high stresses are generated when the grinding ball first touches the intact workpiece surface, as shown in area e in Figure 16. The above results combined with Figure 15 further demonstrate the existence of a high-stress region between the grinding ball and TiC.
Figure 17 presents the temperature distribution of the workpiece when the grinding ball is in different positions. As shown in Figure 17a, when the grinding ball first grinds into the TiC phase, the friction depth is 9.715 Å. The high-temperature atoms are mainly grinding chips. However, the atomic temperature of the TiC phase is slightly higher than the atomic temperature of the matrix at the same height. This can be attributed to the fact that some of the energy of the atoms during their movement acts directly on the TiC phase. Meanwhile, the TiC blocks the development and extension of defects, resulting in higher temperatures for the TiC atoms. With the increasing friction distance and friction depth, the high-temperature atoms in the upper hemisphere of the TiC phase increase significantly, as shown in Figure 17b. This is because of the getting closer distance between the grinding ball and the TiC phase, the increased action of the grinding ball on the workpiece atoms, the intense movement of the atoms, and the shorter movement distance and weaker energy loss, resulting in more high-temperature atoms in the upper hemisphere of the TiC phase. However, the temperature of the matrix atoms is still lower than the temperature of the TiC atoms at the same height. When the friction distance is 24 nm, the friction depth is 13.198 Å. At this point, the overall atoms of the TiC phase are predominantly high temperature, as shown in Figure 17c. This is due to the closer distance between the grinding ball and the TiC phase, the more intense atomic motion of the squeeze and the constant interaction between the atoms of the TiC phase, resulting in the overall atoms of the TiC phase all changing to high-temperature atoms. Again, the temperature of the matrix atoms remains lower than the temperature of the TiC atoms at the same height. However, when the abrasion depth variation is no longer significant, the atomic temperature of the TiC phase is still dominated by high-temperature atoms, as shown in Figure 17d. It is worth noting that the temperature of the atoms below the TiC phase does not change significantly during the entire friction process.
To analyze the variation of atomic temperatures more clearly, the number of atoms at different friction distances and temperatures was counted, as shown in Figure 18. One can see that the number of atoms above 1000 °C increase faster as the friction distance increases. However, when the friction distance exceeds 24 nm, the number of atoms above 1000 °C remains essentially constant, as shown in orange in Figure 18. This is caused by the relative distance between the grinding ball and the TiC phase, the closer the distance, the more high-temperature atoms. Whereas after a friction distance of 24 nm, the relative distance between the grinding ball and the TiC phase remains essentially constant, so the number of high-temperature atoms remains essentially constant. Additionally, the number of atoms stabilizes after a continuous decrease at 800–1000 °C. This is because, after the friction distance of 24 nm, there is no longer a large movement of the grinding ball downward. Meanwhile, there is a heat exchange between the substrate and the outside world, which eventually the friction temperature has a tendency to stabilize. The above results, combined with Figure 17, further indicate that the temperature of the TiC phase atoms during the friction process is above 1000 °C.
Figure 19 presents the graph of the temperature of the two phases with the friction distance during the friction process. One can see that in the whole process, the average temperature of TiC atoms first rises rapidly and then tends to be stable gradually, and there is a large fluctuation. In addition, the average temperature of TiC atoms is higher than the temperature of the whole workpiece. This can be attributed to the TiC phase impeding the movement of atoms and blocking the development and extension of defects, causing the TiC to generate a large amount of heat, which makes for a higher average TiC phase than the overall workpiece temperature. The temperature fluctuations are mainly caused by the uneven nucleation and development of dislocations and the discontinuity of defects acting on the TiC phase.
The overall temperature of the workpiece rises slowly and then tends to stabilize. This is because the large amount of heat generated by the extrusion, shearing and friction of the workpiece by the grinding ball at the beginning of the friction. Meanwhile, the movement of the atoms at the beginning of the friction is not in contact with the TiC phase, and the TiC phase does not absorb a certain amount of heat. In addition, the friction initially produces fewer atoms of abrasive chips, which cannot carry away a large amount of heat, eventually leading to a slow rise in the overall temperature of the workpiece first. When the friction distance exceeds 24 nm, the overall temperature of the workpiece tends to stabilize as the grinding ball no longer has a large downward movement.
To analyze the variation of the average temperature of the TiC balls with the friction distance, the average temperature of each TiC ball during the friction process was extracted, as shown in Figure 20. Where the order of the grinding balls friction over the TiC balls is TiC4 balls to TiC1 balls, one can see that the average temperature of the TiC4 ball keeps increasing with the increase of the friction distance; however, the temperature starts to drop as the grinding ball has ground through the TiC4 ball. This is mainly because TiC as a strengthening phase absorbs part of the force of the grinding ball on the workpiece, and after the grinding ball leaves the TiC ball, the TiC ball is no longer squeezed by the grinding ball, and the weakening of the surrounding atomic movement, as well as the elastic recovery of the atoms, leads to a weakening of the squeezing of the TiC phase, resulting in a continuous decrease in the average temperature of the TiC ball. Similarly, the same phenomenon occurs for the average temperature of the TiC balls when the friction distance of the grinding balls is 16, 24, and 32 nm, as showed by the indigo, green, and red lines in Figure 20. It is noticeable that the closer the grinding ball is to the TiC phase, the higher the TiC phase is, as shown by the dash line ab in Figure 20.

4. Conclusions

This paper uses molecular dynamics simulation of the TiC/Ni composite nano-friction process to make a series of studies on the effect of the presence of tit-anium carbide on the frictional behaviors of nickel-based alloys. Our conclusions are summarized below.
TiC phase impedes the motion of dislocations, making it impossible for the dislocations to realize the cross-slip and obstacle cutting mechanisms. The energy continues to accumulate, and the normal force peaks. As the distance between the grinding ball and the TiC phase decreases, the frictional force increases continuously and appears to fluctuate approximately periodically with different relative positions of the grinding ball and the TiC phase.
The internal atomic motion guided by the TiC phase is related to the position of the grinding ball relative to the reinforced phase. When the grinding ball interacts with the pure nickel phase, the workpiece atom produces a 45° displacement trend to the inside of the workpiece. The atoms rotate anti-clockwise when the grinding ball is located at the front of the TiC phase, and clockwise when the grinding ball is located above the TiC phase. This indicates that the TiC absorbs part of the force of the grinding ball on the workpiece and improves the resistance of the workpiece to deformation.
The interface in TiC/Ni composites leads to local stress concentration between the grinding ball and TiC phase, which promotes the formation of dislocations; dislocation density increases, dislocation networks are formed for dislocation, and regions are strengthened. The closer the grinding ball is to the TiC phase, the greater the number of high-stress atoms, the more concentrated the stress is, and the easier it is to form a high dislocation density region.
During the friction process, the temperature of the TiC phase grows faster than of matrix nickel atoms, and the stable temperature of TiC phase atoms is higher than that of matrix nickel atoms; the temperature of the TiC phase is above 1000 K, while the temperature of the matrix is around 400 K. Each time the grinding ball acts on the TiC phase, the TiC phase generates a higher temperature and the temperature keeps increasing as the distance between the grinding ball and the TiC phase becomes closer.

Author Contributions

Formal analysis, L.W.; Project administration, Z.Z. (Zhou Zhang); Resources, W.C. and X.M.; Validation, Z.W.; Writing—original draft, D.Q.; Writing—review & editing, M.Z. and Z.Z. (Zongxiao Zhu), M.Z. and D.Q. All authors have read and agreed to the published version of the manuscript.

Funding

The project was supported by the National Natural Science Foundation of China (Grant No. 52005236) and the Natural Science Foundation of Gansu Province (20JR5RA442).

Institutional Review Board Statement

Not applicable.

Informed Consent Statement

Informed consent was obtained from all subjects involved in the study.

Data Availability Statement

Data are contained within the article.

Conflicts of Interest

The authors declare no conflict of interest.

References

  1. Kong, D.C.; Dong, C.F.; Ni, X.Q.; Zhang, L.; Man, C.; Zhu, G.L.; Yao, J.Z.; Wang, L.; Cheng, X.Q.; Li, X.G. Effect of TiC content on the mechanical and corrosion properties of Inconel 718 alloy fabricated by a high-throughput dual-feed laser metal deposition system. J. Alloy. Compd. 2019, 803, 637–648. [Google Scholar] [CrossRef]
  2. Mohammadi, S.; Montazeri, A.; Urbassek, H.M. Geometrical aspects of nanofillers influence the tribological performance of Al-based nanocomposites. Wear 2020, 444, 203117. [Google Scholar] [CrossRef]
  3. Xu, S.H.; Qiu, J.W.; Zhang, H.B.; Cao, H.Z.; Zheng, G.Q.; Yong, L. Friction behavior of Ti-30Fe composites strengthened by TiC particles. Trans. Nonferrous Met. Soc. China 2021, 31, 988–998. [Google Scholar] [CrossRef]
  4. Shahzad, K.; Radwan, A.B.; Fayyaz, O.; Shakoor, R.A.; Uzma, M.; Umer, M.A.; Baig, M.N.; Raza, A. Effect of concentration of TiC on the properties of pulse electrodeposited Ni–P–TiC nanocomposite coatings. Ceram. Int. 2021, 47, 19123–19133. [Google Scholar] [CrossRef]
  5. Yin, Z.; Zhu, P.; Li, B. Study of Nanoscale Wear of SiC/Al Nanocomposites Using Molecular Dynamics Simulations. Tribol. Lett. 2021, 69, 38. [Google Scholar] [CrossRef]
  6. Ren, J.; Hao, M.; Lv, M.; Wang, S.; Zhu, B. Molecular dynamics research on ultra-high-speed grinding mechanism of monocrystalline nickel. Appl. Surf. Sci. 2018, 455, 629–634. [Google Scholar] [CrossRef]
  7. Khoei, A.R.; Eshlaghi, G.T.; Shahoveisi, S. Atomistic simulation of creep deformation mechanisms in nickel-based single crystal superalloys. Mater. Sci. Eng. A 2021, 809, 140977. [Google Scholar] [CrossRef]
  8. Xu, L.F.; Xiao, R.; Qu, G.; Wang, D.S. In Situ Synthesized Graded TiC Particulate Reinforced Ni-based Composite Coating Prepared by Laser Cladding. In Journal of Physics: Conference Series; IOP Publishing: Bristol, UK, 2021; p. 012050. [Google Scholar]
  9. Gu, D.; Cao, S.; Lin, K. Laser Metal Deposition Additive Manufacturing of TiC Reinforced Inconel 625 Composites: Influence of the Additive TiC Particle and Its Starting Size. J. Manuf. Sci. Eng. 2016, 139, 200–210. [Google Scholar] [CrossRef]
  10. Cai, Y.L.; Tong, Y.G.; Hu, Y.L.; Huang, H.F.; Zhang, X.C.; Hua, M.Y.; Xu, S.; Mei, Y.B.; Ma, C.B.; Li, Z.F. Wear-Resistant TiC Strengthening CoCrNi-Based High-Entropy Alloy Composite. Materials 2021, 14, 4665. [Google Scholar] [CrossRef]
  11. Qiao, G.W.; Zhang, B.; Bai, Q.; Gao, Y.M.; Du, W.; Zhang, Y.W. Machinability of TiC-reinforced titanium matrix composites fabricated by additive manufacturing. J. Manuf. Processes 2022, 76, 412–418. [Google Scholar] [CrossRef]
  12. Li, C.M.; Yin, Y.G.; Cao, G.; Xu, M.; Li, R.R.; Zhang, G.T.; Chen, Q.; Yang, B.X. Effect of TiC on Microstructure and Strength of Al-Bi-Cu Alloys. J. Mater. Eng. Perform. 2022, 31, 524–533. [Google Scholar] [CrossRef]
  13. Dilek, S.; Algül, H.; Akyol, A.; Alp, A.; Akbulut, H.; Uysal, M. Pulse electro co-deposition of submicron-sized TiC reinforced Ni–W coatings: Tribological and corrosion properties. J. Asian Ceram. Soc. 2021, 9, 673–685. [Google Scholar] [CrossRef]
  14. Cui, Y.Z.; Zheng, M.L.; Zhang, W.; Wang, B.; Zhang, L. Study of dry sliding friction and wear behavior of bionic surface of hardened steel. Mater. Express 2019, 9, 535–544. [Google Scholar] [CrossRef]
  15. Mengis, L.; Grimme, C.; Galetz, M.C. Tribological properties of the uncoated and aluminized Ti–48Al–2Cr–2Nb TiAl alloy at high temperatures. Wear 2021, 477, 203818. [Google Scholar] [CrossRef]
  16. Wang, D.Q.; Sun, D.L.; Han, X.L.; Wang, Q.; Zhang, N.B. Investigation on tribological behavior of Ti2AlN/TiAl composite at room and elevated temperature. Tribol. Lett. 2018, 66, 52. [Google Scholar] [CrossRef]
  17. Jin, Z.J.; Xie, F.; Guo, X.G. Wear mechanism of single crystal diamond tool against mold steel by molecular dynamics simulation. Nanotechnol. Precis. Eng. 2016, 14, 410–415. [Google Scholar]
  18. Zhu, Z.X.; Jiao, S.; Wang, H.; Wang, L.J.; Zheng, M.; Zhu, S.Y.; Cheng, J.; Yang, J. Study on nanoscale friction and wear mechanism of nickel-based single crystal superalloy by molecular dynamics simulations. Tribol. Int. 2022, 165, 107322. [Google Scholar] [CrossRef]
  19. Xu, Y.X.; Wang, M.C.; Zhu, F.L.; Liu, X.J.; Chen, Q.; Hu, J.X.; Lu, Z.; Zeng, P.J.; Liu, Y.H. A molecular dynamic study of nano-grinding of a monocrystalline copper-silicon substrate. Appl. Surf. Sci. 2019, 493, 933–947. [Google Scholar] [CrossRef]
  20. Xu, F.F.; Fang, F.Z.; Zhang, X.D. Effects of recovery and side flow on surface generation in nano-cutting of single crystal silicon. Comput. Mater. Sci. 2018, 143, 133–142. [Google Scholar] [CrossRef]
  21. Zheng, M.; Qu, D.F.; Wei, X.C.; Zhang, Z.; Zhu, Z.X.; Wang, L.J.; Chen, W.H. Molecular dynamics study on the nanoscale repeated friction and wear mechanisms of TiC/Ni composites. Appl. Phys. A 2022, 128, 294. [Google Scholar] [CrossRef]
  22. Hao, Z.P.; Lou, Z.Z.; Fan, Y.H. Study on staged work hardening mechanism of nickel-based single crystal alloy during atomic and close-to-atomic scale cutting. Precis. Eng. 2021, 68, 35–56. [Google Scholar] [CrossRef]
  23. Wang, J.P.; Liang, J.W.; Wen, Z.X.; Yue, Z.F.; Peng, Y. Unveiling the local deformation behavior of typical microstructures of nickel-based single crystals under nanoindentation. Mech. Mater. 2022, 166, 104204. [Google Scholar] [CrossRef]
  24. Zhang, J.; Li, W.Y.; Qin, R.Q.; Chen, P.; Liu, Y.; Liu, X.; Gao, L. An atomic insight into the stoichiometry effect on the tribological behaviors of CrCoNi medium-entropy alloy. Appl. Surf. Sci. 2022, 593, 153391. [Google Scholar] [CrossRef]
  25. Guo, J.; Tan, S.L.; Xiao, C. Atomistic understanding of scratching-induced material attrition of wurtzite single-crystal AlN using nanoscale diamond abrasive. Tribol. Int. 2022, 169, 107483. [Google Scholar] [CrossRef]
  26. Liu, H.; Wang, X.M.; Liang, H.; Zhao, Z.N.; Li, L.; Yue, Z.F.; Deng, C.H. The effect of void defect on the evolution mechanisms of dislocations and mechanical properties in nickel-based superalloys by molecular dynamics simulation of real γ/γ′ structures. Int. J. Solids Struct. 2020, 191, 464–472. [Google Scholar] [CrossRef]
  27. Hao, Z.P.; Lou, Z.Z.; Fan, Y.H. Influence of anisotropy of nickel-based single crystal superalloy in atomic and close-to-atomic scale cutting. Precis. Eng. 2020, 66, 347–362. [Google Scholar] [CrossRef]
  28. Yin, Q.; Lian, Y.D.; Wen, Z.X.; Pei, H.Q.; Wang, J.D.; Yue, Z.F. Atomic simulation of the effect of orientation on tensile/compressive properties in nickel-based single crystal superalloys. J. Alloy. Compd. 2022, 893, 162210. [Google Scholar] [CrossRef]
  29. Plimpton, S. Fast parallel algorithms for short-range molecular dynamics. J. Comput. Phys. 1995, 117, 1–19. [Google Scholar] [CrossRef]
  30. Stukowski, A. Visualization and analysis of atomistic simulation data with OVITO–the Open Visualization Tool. Model. Simul. Mater. Sci. Eng. 2010, 18, 015012. [Google Scholar] [CrossRef]
  31. Murray, J.L. Phase Diagrams of Binary Titanium Alloys; ASM International: Almere, The Netherlands, 1987; pp. 340–345. [Google Scholar]
  32. Xu, F.; Fang, F.; Zhang, X. Hard particle effect on surface generation in nano-cutting. Appl. Surf. Sci. 2017, 425, 1020–1027. [Google Scholar] [CrossRef]
  33. Shao, J.; Xiao, B.; Wang, Q.; Ma, Z.; Yang, K. An enhanced FEM model for particle size dependent flow strengthening and interface damage in particle reinforced metal matrix composites. Compos. Sci. Technol. 2011, 71, 39–45. [Google Scholar] [CrossRef]
  34. Verlet, L. Computer “experiments” on classical fluids. I. Thermodynamical properties of Lennard-Jones molecules. Phys. Rev. 1967, 159, 98. [Google Scholar] [CrossRef]
  35. Dai, H.F.; Chen, J.J.; Liu, G.J. A numerical study on subsurface quality and material removal during ultrasonic vibration assisted cutting of monocrystalline silicon by molecular dynamics simulation. Mater. Res. Express 2019, 6, 065908. [Google Scholar] [CrossRef]
  36. Abdulkadir, L.N.; Abou-El-Hossein, K.; Jumare AILiman, M.M.; Olaniyan, T.A.; Odedeyi, P.B. Review of molecular dynamics/experimental study of diamond-silicon behavior in nanoscale machining. Int. J. Adv. Manuf. Technol. 2018, 98, 317–371. [Google Scholar] [CrossRef]
  37. Cheong, W.; Zhang, L. Molecular dynamics simulation of phase transformations in silicon monocrystals due to nano-indentation. Nanotechnology 2000, 11, 173. [Google Scholar] [CrossRef]
  38. Wang, Y.; Tang, S.; Guo, J. Molecular dynamics study on deformation behaviour of monocrystalline GaN during nano abrasive machining. Appl. Surf. Sci. 2020, 510, 145492–145512. [Google Scholar] [CrossRef]
  39. Tersoff, J. Modeling solid-state chemistry: Interatomic potentials for multicomponent systems. Phys. Rev. B 1989, 39, 5566. [Google Scholar] [CrossRef]
  40. Foiles, S.M.; Baskes, M.I.; Daw, M.S. Embedded-atom-method functions for the fcc metals Cu, Ag, Au, Ni, Pd, Pt, and their alloys. Phys. Rev. B 1986, 33, 7983–7991. [Google Scholar] [CrossRef]
  41. Johnson, R.A. Alloy models with the embedded-atom method. Phys. Rev. B 1989, 39, 12554. [Google Scholar] [CrossRef]
  42. Maekawa, K.; Itoh, A. Friction and tool wear in nano-scale machining—A molecular dynamics approach. Wear 1995, 188, 115–122. [Google Scholar] [CrossRef]
  43. Fang, Q.; Wang, Q.; Li, J.; Zeng, X.; Liu, Y. Mechanisms of subsurface damage and material removal during high speed grinding processes in Ni/Cu multilayers using a molecular dynamics study. RSC Adv. 2017, 7, 42047–42055. [Google Scholar] [CrossRef]
  44. Deng, X.; Zhang, G.; Wang, T.; Ren, S.; Shi, Y.; Bai, Z.; Cao, Q. Microstructure and oxidation resistance of a multiphase Mo-Si-B ceramic coating on Mo substrates deposited by a plasma transferred arc process. Ceram. Int. 2019, 45, 415–423. [Google Scholar] [CrossRef]
  45. Baskes, M.I. Modified embedded-atom potentials for cubic materials and impurities. Phys. Rev. B 1992, 46, 2727. [Google Scholar] [CrossRef]
  46. Kim, Y.M.; Lee, B.J. Modified embedded-atom method interatomic potentials for the Ti–C and Ti–N binary systems. Acta Mater. 2008, 56, 3481–3489. [Google Scholar] [CrossRef]
  47. Lee, B.J.; Baskes, M. Second nearest-neighbor modified embedded-atom-method potential. Phys. Rev. B 2000, 62, 8564. [Google Scholar] [CrossRef]
  48. Elkhateeb, M.G.; Shin, Y.C. Molecular dynamics-based cohesive zone representation of Ti6Al4V/TiC composite interface. Mater. Des. 2018, 155, 161–169. [Google Scholar] [CrossRef]
  49. Kim, Y.K.; Kim, H.K.; Jung, W.S.; Lee, B.J. Development and application of Ni-Ti and Ni-Al-Ti 2NN-MEAM interatomic potentials for Ni-base superalloys. Comput. Mater. Sci. 2017, 139, 225–233. [Google Scholar] [CrossRef]
  50. Archard, J.F. Contact and rubbing of flat surfaces. J. Appl. Phys. 1953, 24, 981–988. [Google Scholar] [CrossRef]
  51. Porter, D.A.; Easterling, K.E. Phase Transformations Metals and Alloys; Chapman Halls, Van Nostrand Reinhold Co.: London, UK, 1981. [Google Scholar]
  52. Stukowski, A.; Bulatov, V.V.; Arsenlis, A. Automated identification and indexing of dislocations in crystal interfaces. Model. Simul. Mater. Sci. Eng. 2012, 20, 085007. [Google Scholar] [CrossRef]
  53. Dai, H.; Li, S.; Chen, G. Molecular dynamics simulation of subsurface damage mechanism during nanoscratching of single crystal silicon. Proc. Inst. Mech. Eng. Part J J. Eng. Tribol. 2019, 233, 61–73. [Google Scholar] [CrossRef]
  54. Chen, D.; Costello, L.L.; Geller, C.B.; Zhu, T.; McDowell, D.L. Atomistic modeling of dislocation cross-slip in nickel using free-end nudged elastic band method. Acta Mater. 2019, 168, 436–447. [Google Scholar] [CrossRef]
  55. Zhu, Z.X.; Gong, Y.D.; Zhou, Y.G.; Gao, Q. Molecular dynamics simulation of single crystal Nickel nanometric machining. Sci. China Technol. Sci. 2016, 59, 867–875. [Google Scholar] [CrossRef]
  56. Patil, R.P.; Doan, D.; Aitken, Z.H.; Chen, S.; Kiani, M.T.; Barr, C.M.; Hattar, K.; Zhang, Y.W.; Gu, X.W. Hardening in Au-Ag nanoboxes from stacking fault-dislocation interactions. Nat. Commun. 2020, 11, 2923. [Google Scholar] [CrossRef] [PubMed]
  57. Chen, S.; Aitken, Z.H.; Wu, Z.; Yu, Z.; Banerjee, R.; Zhang, Y.W. Hall-Petch and inverse Hall-Petch relations in high-entropy CoNiFeAlxCu1-x alloys. Mater. Sci. Eng. A 2020, 773, 138873. [Google Scholar] [CrossRef]
  58. Zhang, Z.; Urbassek, H.M. Dislocation-based strengthening mechanisms in metal-matrix nanocomposites: A molecular dynamics study of the influence of reinforcement shape in the Al-Si system. Comput. Mater. Sci. 2018, 145, 109–115. [Google Scholar] [CrossRef]
  59. Huo, S.Y.; Xie, L.J.; Xiang, J.F.; Pang, S.Q.; Hu, F.; Umer, U. Atomic-level study on mechanical properties and strengthening mechanisms of Al/SiC nano-composites. Appl. Phys. A 2018, 124, 1–12. [Google Scholar] [CrossRef]
  60. Doan, D.Q.; Fang, T.H.; Tran, A.S.; Chen, T.H. Residual stress and elastic recovery of imprinted Cu-Zr metallic glass films using molecular dynamic simulation. Comput. Mater. Sci. 2019, 170, 109162. [Google Scholar] [CrossRef]
Figure 1. Geometric characteristics of TiC/Ni Nanocomposites: (a) MD simulation diagram of nano friction; (b) motion structure diagram of grinding ball under fixed load.
Coatings 12 01168 g001
Figure 2. Variation of normal force during the friction of TiC/Ni composites: (a) generation of L-C dislocation; (b) destruction of L-C dislocation.
Coatings 12 01168 g002
Figure 3. Dynamic response curve against the friction distance of (a) friction force and (b) friction coefficient.
Coatings 12 01168 g003
Figure 4. Variation curve of wear mark depth and friction distance. Stages I, II and III are the front, the top, and the back of the TiC phase, respectively. (a)–(c) and (s) are the depth of grinding marks from the grinding and ball milling to the vicinity of TiC phase, respectively.
Coatings 12 01168 g004
Figure 5. Wear rate curve.
Coatings 12 01168 g005
Figure 6. Different position displacement vector displays: (a,b) is the displacement vector diagram of the grinding ball before the TiC phase; and (c) is the displacement vector diagram of the positive pressure TiC phase of the ball mill.
Coatings 12 01168 g006
Figure 7. Schematic diagram of atomic displacement affected by TiC phase in friction: (ad) the grinding ball is located before the TiC phase; (e,f) the grinding ball is located above the TiC phase. Area A indicates the most sliding direction of fcc structure. B and C indicate the areas where atoms act on the TiC phase.
Coatings 12 01168 g007
Figure 8. Friction surface morphology of TiC/Ni composite: The atoms are colored according to the z-axis position. (ad) denote friction surfaces with friction distances of 7 nm, 8 nm, 14 nm and 15.5 nm, respectively.
Coatings 12 01168 g008
Figure 9. Nucleation, movement, and interaction of dislocations in TiC/Ni composites during friction. The lines are dislocations evolution, where green, blue, pink, light blue, yellow, and red are Shockley, Perfect, Stair-Rod, Frank, Hirth, and other dislocations, respectively. (ac) denote successive processes where the grinding ball is located in front of the TiC phase, respectively. (d,e) respectively indicate the continuous process where the grinding ball is located directly above the TiC phase.
Coatings 12 01168 g009
Figure 10. Schematic diagrams of the interaction between the first and second dislocation segments. (a,b) is a schematic diagram of the interaction between the first and second dislocation segments. (c) represents Thompson tetrahedron.
Coatings 12 01168 g010
Figure 11. The evolution of dislocations in the TiC/Ni workpiece: (ad) are schematic diagrams of dislocations with friction distances of 8.0 nm, 8.2 nm, 16 nm, and 22 nm, respectively.
Coatings 12 01168 g011
Figure 12. Variation curve of dislocation length with friction distance: (a) 8.0 nm, (b) 8.2 nm, (c) 16 nm, and (d) 22 nm.
Coatings 12 01168 g012
Figure 13. Statistical diagram of the number of dislocations of Shockley, Stair-rod, Hirth, and the total number of dislocations at different positions.
Coatings 12 01168 g013
Figure 14. Defect atomic number statistics: (a) Percentage of HCP and Other structural atoms in total simulated atoms during friction; (b) Percentage of FCC structural atoms in total simulated atoms during friction.
Coatings 12 01168 g014
Figure 15. The von-Mises stress distribution in the TiC/Ni matrix: (a,b,d) grinding balls are located above the TiC phase, and (c) grinding balls are located in TiC free phase.
Coatings 12 01168 g015
Figure 16. Graph of the atomic number of different stresses increasing with friction distance. (a)–(d) indicates that the grinding ball is not located above the tic phase.
Coatings 12 01168 g016
Figure 17. Temperature nephogram of grinding ball in different TiC phases. (ad) show the temperature cloud diagram when the friction distance is 8, 16, 24 and 32 nm, respectively.
Coatings 12 01168 g017
Figure 18. Statistics of the number of atoms at different temperatures when the grinding ball is in different TiC phases.
Coatings 12 01168 g018
Figure 19. Response curve of friction temperature with time.
Coatings 12 01168 g019
Figure 20. The temperature response curve of each TiC ball with time step length. a and b respectively represent the temperature when the grinding ball is directly above the TiC phase.
Coatings 12 01168 g020
Table 1. Calculation parameters in MD friction simulation.
MaterialsWorkpieceTool: Diamond
DimensionsCubic: 45 × 16 × 18 nmSpherical: R = 2.5 nm
Atomic number1,200,02211,648
Interatomic potentialMEAM/c EAM MorseTersoff
Timestep1 fs
Initial temperature300 k
Grinding velocity10−3 Å/fs
Normal load70 nN
Table 2. Parameter setting of Morse potential function [43,44].
Atomic TypeEquilibrium Distance r0Elastic Modulus aCohesion Energy D
C-Ni2.4 Å2.2 Å−10.100 eV
Table 3. Parameters for 2 NN MEAM potential for Ti, Ni, and C [48,49].
EcreBAb(0)b(1)b(2)b(3)t(1)t(2)t(3)CminCmaxd
Ti4.872.921.100.662.701.003.001.006.80−2.0−12.01.001.440.00
C7.371.544.441.184.252.802.005.003.201.44−4.481.412.800.00
Ni4.452.4901.8760.942.561.506.001.503.101.804.362.800.810.05
Table 4. 2 NN-MEAM potential parameters for individual binary systems. The units of Ec and re are eV and Å, respectively [48,49].
Ti-CNi-Ti
Ec6.905.012
re2.212.57
Cmin(X-Y-X)0.640.68
Cmin(Y-X-Y)1.190.36
Cmin(X-X-Y)0.640.44
Cmin(X-Y-Y)1.190.23
Cmax(X-Y-X)2.701.44
Cmax(Y-X-Y)2.801.44
Cmax(X-X-Y)1.441.44
Cmax(X-Y-Y)2.801.44
r0Y/r0X6.001.00
Publisher’s Note: MDPI stays neutral with regard to jurisdictional claims in published maps and institutional affiliations.

