Review

Review: Modeling and Simulation of Membrane Electrode Material Structure for Proton Exchange Membrane Fuel Cells

1
College of Mechanical Engineering, Yellow River Conservancy Technical Institute, Kaifeng 475000, China
2
Mechanical and Electrical Engineering Institute, Zhengzhou University of Light Industry, Zhengzhou 450002, China
3
Guangdong Provincial Key Laboratory of Digital Manufacturing Equipment, Guangdong HUST Industrial Technology Research Institute, Dongguan 523808, China
*
Author to whom correspondence should be addressed.
Coatings 2022, 12(8), 1145; https://doi.org/10.3390/coatings12081145
Submission received: 1 July 2022 / Revised: 25 July 2022 / Accepted: 4 August 2022 / Published: 9 August 2022

Abstract

:
Hydrogen energy is recognized as the clean energy with the most development potential, and hydrogen fuel cell technology is considered the ultimate solution utilizing hydrogen energy. The proton exchange membrane fuel cell (PEMFC) has the merits of high energy efficiency, high energy density, low operating temperature, is clean, and affords environmental protection. Improving the structure of each functional layer could play a significant role in improving PEMFC performance. In addition, membrane electrode assemblies (MEAs) are the core components of a PEMFC, and their structure includes three main parts, namely, the gas diffusion layer (GDL), catalytic layer (CL), and proton exchange membrane (PEM). Therefore, this review focuses on progress in the modeling and simulation of the material structure in MEAs. First, the GDL simulation models are critically reviewed, including two-phase calculation models and microscopic simulation models. Second, CL microstructure models are comprehensively evaluated, involving power density enhancement, catalyst loading distribution, electrochemical reaction and its performance optimization. Third, the PEM simulation model, relating to molecular dynamics (MD) simulation techniques, 3D numerical techniques, and multiphysics simulation, are reviewed. Finally, the three aspects of similarity, individuality, and complementarity of these simulation models are discussed, and necessary outlooks, including the current limitations and challenges, are suggested, providing a reference for low-cost, high-performing PEMFC membrane electrodes for the future.

1. Introduction

Coal, oil, natural gas and other fossil fuels are the foundation of modern industry. In 2021, China’s natural gas consumption was 372.6 billion cubic meters, an increase of 12.7%; its consumption of refined oil was 341.48 million tons, an increase of 3.2%, of which gasoline, diesel and aviation fuels increased by 5.7%, 0.5% and 5.7%, respectively. There is no doubt that these fossil energy sources are non-renewable and unsustainable. Moreover, the use of these non-renewable energy sources will also lead to increasingly serious environmental pollution, such as the emission of carbon dioxide, sulfur dioxide and other toxic chemicals [1,2,3]. In 2019, Chinese leaders announced that the country would adopt more powerful policies and measures, strive to peak carbon dioxide emissions by 2030, and strive to achieve carbon neutrality by 2060 [4,5]. Hence, it is necessary to seize the opportunity of the latest scientific and technological revolution and industrial transformation. It is, therefore, of great significance to find alternatives to traditional fossil energy and to develop and utilize sustainable and green renewable energy [6].
Hydrogen energy is recognized as a clean energy with the most development potential. In the 19th century, human beings became interested in the application of hydrogen energy. Hydrogen fuel cell technology is considered the ultimate solution utilizing hydrogen energy. Fuel cells can be divided into proton exchange membrane fuel cells (PEMFCs), solid oxide fuel cells, phosphoric acid fuel cells, molten carbonate fuel cells and alkaline fuel cells, according to the different electrolytes in the membrane electrodes [7,8,9,10,11,12,13]. Among these, the PEMFC has the merits of high energy efficiency, high energy density, low operating temperature, is clean, and affords environmental protection. It is now a mainstream fuel cell technology, widely used in electric vehicles, fixed power stations, communication equipment, aerospace, home power supply and other fields [9,14]. As seen in Figure 1, hydrogen is divided into protons and electrons as it enters the fuel cell from the anode side. The electrons are then forced through an external circuit to produce a current as the protons travel through the electrolyte to the cathode side. Finally, oxygen is delivered to the cathode, where it interacts with protons, electrons and water to form steam, which is subsequently expelled via the exhaust [15].
Proton exchange membrane fuel cells are mainly composed of end plates, flow field plates, membrane electrode assemblies (MEAs) and sealing elements. The MEA is the core component of a PEMFC, being an all-in-one site for reaction generation, multiphase material transfer and energy conversion in fuel cells and water electrolysis. The three-phase interfacial reactions involved, and complex mass and heat transfer processes, directly determine the performance, lifetime and cost of the PEMFC [16,17]. The structure of an MEA includes three main parts, including the gas diffusion layer (GDL), catalytic layer (CL) and proton exchange membrane (PEM). In the actual electrochemical reaction process, the functional layers of GDL, CL and PEM must coordinate with each other and participate together. Improving the material structure of each functional layer could play a significant role in improving PEMFC performance [16]. Therefore, the material structure design of membrane electrodes is now of great research interest, especially in terms of their modeling and simulation.
This review focuses on the progress in the modeling and simulation of PEMFC membrane electrode material structures. First, the GDL simulation models are critically reviewed, including two-phase calculation models and microscopic simulation models. Second, CL microstructure models are comprehensively evaluated, involving power density enhancement, catalyst loading distribution, electrochemical reaction and its performance optimization. Third, the PEM simulation models, relating to MD simulation techniques, 3D numerical techniques, multiphysics simulation and machining learning methods, are reviewed. Finally, the three aspects of similarity, individuality, and complementarity of these simulation models are discussed, and necessary outlooks, including the current limitations and challenges, are suggested.

2. GDL Simulation Models

2.1. Brief Introduction

The GDL is located between the gas flow field and the CL. Its main functions are to collect current, conduct gas and discharge reaction product water. The GDL is usually composed of a macroporous layer and a microporous layer [18], as shown in Figure 2. For the macroporous layer, the materials are mostly porous carbon paper and carbon cloth, with a thickness of about 100–400 μm, and its function is to support the microporous layer and the CL. The microporous layer mainly plays the role of improving the interface state between the GDL and the CL, reducing the contact resistance and limiting the leaching of water [18,19]. On the one hand, the effect of the electrode permeability on PEMFC performance depends strongly upon the flow-field pattern. On the other hand, the gas diffusion layer may be one of the components with the most deformation. Some properties, such as permeability and pore size greatly influence the power density and efficiency of the fuel cell system [20]. In view of the complex microstructure inside the GDL, current techniques cannot fully and clearly determine its gas, liquid and heat interaction mechanism. Using the existing preparation technology to improve the components of GDL to prepare it with differentiated properties is expensive and time consuming, and cannot accurately solve the problem of the optimal GDL design. It is, therefore, still necessary to strengthen basic theoretical research.

2.2. Two-Phase Calculation Models

Bapat et al. [21] examined the impact of anisotropic resistivity on the current density and temperature distribution of PEMFCs using a two-dimensional two-phase model, as shown in Figure 3. Their findings showed that the higher in-plane resistivity of the GDL has a negative impact on the current density in the area close to the gas channel and results in a somewhat higher current density in the area close to the current collector. As the GDL in-plane resistivity increased, the local current density for the entire catalyst layer fell. In areas where the catalyst layer is immediately exposed to the gas channels, this effect was more pronounced. The temperature of a membrane electrode assembly (MEA) strongly affects the performance of fuel cells [22,23,24,25,26]. Without proper thermal management, the performance of the fuel cell may not be maintained. The minimum temperature expected in the MEA is about 333–353 K and the maximum temperature is about 373–473 K [27]. The maximum and minimum temperatures in the cathode catalyst layer were also dependent on the average current density rather than the local current density for GDLs with significant anisotropic thermal conductivity.
Meng et al. [28] established a mathematical model of the two-phase flow dynamics of fuel cells based on experimental observations. In the GDL, liquid water transport was described using the standard two-phase mixing model, while the gas channel (GC) employed the mist-flow model. To explain the water droplets that started to emerge on the GDL surface, an interfacial coverage model of liquid water at the GDL/GC interface was developed. This addition of this interface not only made it possible for the current two-phase model to predict how cathode flooding affects cell performance, but it also completely fixed the problem of the failure of earlier two-phase models to accurately depict how gas velocity (or stoichiometry) affects cell performance. Koido et al. [29] modeled the multi-component and two-phase liquid-gas transport phenomena in GDLs. They measured and predicted the two-phase flow properties of GDLs, as well as modeling two-phase multicomponent transport. In addition, they simulated gas–liquid two-phase transport using a multiphase mixing model and combined single-phase and two-phase lattice Boltzmann methods to make predictions. This method was applied to carbon fiber paper GDLs to identify their two-phase multicomponent transport. However, further development of transport simulation models of the two-phase flow properties in GDLs is required to incorporate thermal effects when coupled to other layers to investigate further their hidden phenomena.
As illustrated in Figure 4, Zhou et al. [30] used the VOF model with the finite element method (FEM) to simulate the two-phase flow in the GDL microstructure and to investigate the impact of various surface wettability distributions. The findings showed that two-phase flow, particularly in the GDL, is influenced by the single gradient variation of surface wettability. Additionally, the deeper immersion depth of thicker polytetrafluoroethylene could aid in removing moisture from the GDL. A significant reference for regulated water movement in the GDL could then be found in the suggested surface wettability distribution system. Shi et al. [31] created a three-dimensional VOF model to study the impact of liquid water saturation and liquid route development on microporous layer crack characteristics. They investigated the effect of crack shape, crack spacing and crack number on GDL liquid water transport. It was found that the liquid water saturation of GDL increased with the number of cracks and the crack spacing, but not with the crack shape.

2.3. Microscopic Simulation Models

Yiotis et al. [32] proposed an algorithm for stochastic reconstruction and the accurate characterization of GDLs in resin deposition. Using the fiber diameter, average porosity, anisotropy and the resin content of the composites as inputs, their model solved the corresponding conservation equations at the microscale in the obtained digital domain to determine their effective transport properties, such as the Darcy permeation rate, effective diffusivity, thermal/electrical conductivity and pore tortuosity, focusing on the effects of dielectric anisotropy and resin content. The experimental results showed that, as shown in Figure 5, the pore-scale velocities calculated using the model were very close to the results obtained for the X-ray μ-CT samples.
Göbel et al. [33] adopted synchrotron radiation-based X-ray tomography and focused ion beam scanning electron microscopy (FIB-SEM) analysis methods to study the microstructure of MPL-containing carbon fiber-based GDL materials to simulate GDL flow and thermal properties. Figure 6 shows the simulated saturation levels for the two GDLs as a function of capillary pressure, in which the capillary pressure–saturation curves characterize the pore size distribution and microstructure of the GDLs, respectively. The findings demonstrated that the H14C7 material has a saturation of 20% at a capillary pressure of 670 Pa, and the 28BC material has a saturation of 40% at a capillary pressure of 310 Pa. Paper-based GDLs, such as 28BC, were more prone to flooding, and water management of H14C7 was beneficial under high-current density. This suggests that the mass transfer properties of GDLs can be better understood by establishing pores of different pore size and shape.
Zhou et al. [34] proposed mathematical models to study the effect of the assembly force of different GDLs and membranes. The results showed that the cellular structure of porous GDL undergoes significant deformation due to its weak mechanical strength. Cell performance was inversely proportional to film thickness but more sensitive to changes in assembly force. Moreover, Zhou et al. [35] applied a stochastic model to reconstruct the microstructure of uncompressed GDL. Subsequently, FEM was used to perform assembly pressure simulations to generate the compressed GDL microstructure, and a VOF model was established to study the two-phase flow in the compressed GDL. The proposed hybrid model, shown in Figure 7, investigated the effect of assembly pressure on the deformation of the GDL. The assembly pressure was found to cause uneven deformation of the GDL along the thickness direction. In addition, the simulation results confirmed that the water saturation decreased with the increase in the compression ratio when the capillary pressure was greater than 4 kPa. When the capillary pressure was lower than 3 kPa, however, the compression had little effect on the water saturation.

2.4. Summary

To realize high performance in PEMFCs, GDL materials should meet the requirements of ultra-thinness, high mechanical strength, high permeability and low resistivity. The optimization of the GDL material structure through traditional processes, such as design, preparation and experiment is time consuming and inefficient. The solution to the dilemma requires a combination of simulation models and traditional methods. At present, the two-phase model is a commonly used model to study GDL fluid characteristics and flooding phenomena of different degrees of complexity [28,36]; however, the two-phase model is a macroscopic model and lacks correlation with the real two-phase fluid flow, resulting in a difference between the simulation and experimental results. The establishment of the microstructure model enables an understanding of the influence of the GDL microstructure on multiphase mass transfer [32,35]. However, the establishment of the microscopic model is relatively complicated, and the computation is very large, requiring further optimization. For example, it can be combined with artificial intelligence models to reduce computing time by 1–2 orders of magnitude at the expense of a small amount of accuracy [37,38,39]; other modeling approaches for GDL are shown in Table 1.

3. Simulation Models of CL

3.1. Brief Introduction

Optimizing the catalyst in membrane electrode assemblies (MEAs) involves a better understanding of Pt utilization at the triple-phase boundary in the catalyst layer, where the reactant, the ionic conducting polymer and the electronic conducting substrate are present on the same platinum (Pt) or Pt-alloy nanoparticle (NP) [47]. Platinum can only be used for electrochemical reactions when it is simultaneously in contact with the membrane electrolyte and the carrier, while allowing the reactant gas and water to enter and exit the reaction site. Therefore, increasing the number of these active sites and improving the utilization efficiency of platinum are critical to improving battery performance. The challenge is to activate Pt as a catalyst and to improve the catalytic performance by covering/impregnating the Pt NPs by a thin ionomer membrane, while maintaining their accessibility to the transport of fuel gases and water. Optimal battery performance always strikes the best balance between catalytic activity and maximum platinum utilization, proton conductivity and oxygen delivery [48].
Generally, the position where the reactive gas, Pt particles and high molecular polymer are combined is called the three-phase reaction interface, and is essentially the intersection of electron, proton and molecule (reactive gas) transfer channels. The CL is an important site in that the electrochemical three-phase reactions occur inside the fuel cells [49,50]. During the operation of fuel cells, the transfer of protons and electrons occurs, as well as the transfer of the two-phase flow of the reactant gas and the product water gas–liquid (the gas flow and the water flow are kept unobstructed). In general, the more effective reactive sites exposed in the catalytic layer, the stronger the catalytic ability of the catalytic layer and the better the performance of the fuel cell. The distribution of reactive sites is closely related to the material structure and shape of the catalytic layer. Therefore, improving the activity of the fuel cell catalyst layer and reducing the amount of the catalyst are urgent technical problems requiring solutions in the field of fuel cells. In addition, numerical simulation is an effective means of studying the CL mass transfer process [51,52] and includes power density enhancement, catalyst loading distribution, electrochemical reaction and its performance optimization.

3.2. Models and Simulation Results

Since the catalytic layer structure is heterogeneous and complex, macroscopic modeling methods may not capture the actual phenomena and interactions that occur. The best way to simulate the catalytic layer is to directly model and simulate the actual microstructure. Ebrahimi et al. [53] proposed a numerical method to evaluate the effect of different catalyst loadings on compact CL (CCL) to evaluate the performance effects of different catalyst loadings on PEMFCs, depicted in Figure 8. In their proposed method, a two-dimensional steady-state isothermal implicit model of a PEMFC was established, which was a CCL condensation model based on computational fluid dynamics (CFD) simulations. Experimental results showed that using the developed model to determine the optimal catalyst-loading distribution increases the maximum density of the PEMFC by about 7%. Sabharwal et al. [54] proposed a microscale electrochemical model, including a description of the ionomer membrane resistance and a multi-step electrochemical reaction model for the oxygen reduction reaction, to analyze microstructure, transport and electrochemical performance. Further, the pore morphology of the catalyst layer was extracted from the FIB-SEM images by employing a local thresholding algorithm to explain the microstructural variation between different images of the same catalyst layer, resulting in the anisotropy of the catalyst layer. Micro-scale numerical mass transport simulations show that transport predictions are affected by image resolution and that a minimum domain size of 200 nm is needed to estimate transport properties. To improve the design of the cathode CL, Barreiros et al. [55] proposed a multi-physical model combining an electron microscope characterization technique and numerical simulation to realize its discretization (platinum, carbon, ionomer and pore phase) and the morphology design of the microstructure. The established multi-physical model, as shown in Figure 9, includes gas and ion transport in Nafion and gas transport in pores. The electrochemical problem was solved through the four-step reaction mechanism, and the numerical simulation of the catalyst layer was realized. The results showed that due to the oxygen-diffusion limitation of the Nafion membrane, the structural heterogeneity had a great impact on the mass transfer performance, which, to a certain extent, may be related to the competition effect between particles.
Machine learning (ML) is also utilized in PEMFC chemical reaction molding and is classified into two categories (black box and white box approaches). Calculation and time expenses are typically quite expensive in multi-physical approaches for complex chemical reaction molding (electrochemical/physical molding based on the white box method). However, ML is able to understand the inherent laws of complicated physical model simulation results, which can substantially aid the application of these physical models at reasonable prices. Dalasm et al. [56] devised a mathematical surrogate technique (in Figure 10a) that combines a physical model of the cathode CL with an artificial neural network (ANN) model to forecast CL performance, such as activation over-potential, in PEMFCs. For the testing dataset, the experiments revealed that the accuracy in prediction performance was reached with an R2 of 0.8. The most critical structural characteristics that affected CL performance were its thickness and membrane volume content, according to the surrogate model. Also, surrogate models of PEMFCs were created by Wang et al. [57], resulting in an efficient digital twin. The test set verification results showed that the relative root mean square errors (rRMSEs) between the prediction of surrogate ANN/SVM models and the simulation of multi-physical models ranged from 3.88 to 24.80%, indicating that the proposed models could be used to predict hydrogen concentration, relative humidity, oxygen, temperature and liquid saturation. Li et al. [58] suggested an intelligent method (in Figure 10b) for predicting the current density of a PEMFC by combining a 3D physical model with a deep belief network (DBN) model. With an R2 of 0.9979, the validated findings showed that the suggested model had outstanding accuracy in predicting PEMFC performance of current density.

3.3. Summary

The current research direction of CL materials is to adopt porous structure design, with a large specific surface area, high porosity, and a controllable porous structure. Therefore, since mathematical [59,60,61], statistical and meta heuristic models [62,63,64] of CL are based on the macroscopic level, they cannot accurately simulate microscopic chemical phenomena and interactions. The microscopic model established based on the chemical reaction process and material topology [53,54,55] can, therefore, better optimize the material structure of CL to obtain excellent performance, such as power density enhancement and catalyst-loading distribution. In addition, with the help of ML-related techniques, the CL chemical reaction process can be combined with ML algorithms [56,58] to reduce simulation time and cost, so as to better design the CL material structure. Other modeling approaches for CL are shown in Table 2.

4. PEM Simulation Models

4.1. Brief Introduction

It is well known that PEM is the key obstacle that restricts the commercial application of PEMFC batteries. Among the different ionomers available for PEMFC applications, perfluorosulfonate-type ionomers (PFSI), such as Nafion by DuPont, are used most widely. A PEM fuel cell requires expensive and scarce platinum or platinum-alloy catalyst particles to provide sufficient catalytic activity; it is important to reduce the platinum loading in the electrode and to improve the electrode performance [71,72,73,74]. Several studies concentrate on producing high-quality catalyst layers by using an optimal amount of Nafion [75,76,77,78,79]. Low Pt loading was also achieved by a process that features cross-linking carbon- supported Pt (Pt/C) with perfluorosulfonate ionomer during its coagulation from the colloid [80,81], thereby realizing efficient utilization of the platinum catalyst.
The operating temperature of PEM determines the operating temperature of the fuel cell and is a key factor affecting the manufacturing cost and operating life of a PEMFC [82,83]. PEM consists of a proton-conductive membrane coated with a porous electrocatalyst layer on both the anode and cathode sides. In MEAs, PEM is mainly responsible for proton conduction between the electrodes on both sides. When working, the role of PEM conducts protons in the MEA to form a closed loop [84,85,86]. Therefore, the fast proton- conduction characteristics in MEAs and the high catalytic activity of the catalyst are the necessary conditions to obtain high-performance PEMFC. Generally speaking, PEM materials should have good proton conductivity, allow low electro-osmosis of water molecules in the membrane, have low permeability of gas in the membrane, good electrochemical stability, good dry-wet conversion performance, good workability and be cost effective [87,88]. Despite great progress in recent PEM research, many problems still exist, such as complex material preparation, high production cost, short service life, and so on. The future development of PEM, therefore, also requires the use of a simulation model to solve the problems of its material structure in terms of the mechanism.

4.2. Molecular Dynamics Models and Results

Molecular dynamics (MD) is a comprehensive technology combining physics, mathematics and chemistry. It relies mainly on Newtonian mechanics to simulate the motion of the molecular system, so as to calculate the system’s configuration integral, and further calculate its thermodynamic quantities and other macro properties [89,90,91]. Similarly, MD-simulation techniques can also be used in the simulation of PEM to study details of its morphology, structure and transport properties [92]. To study the microstructure of the prepared PEM, Li et al. [93] employed MD simulations to study the migration behavior of water molecules and ions in hydrated sulfonated styrene-grafted fluorinated ethylene propylene (FEP) membranes with different side chain lengths. The simulation results showed that the proton conductivity of a membrane with a side chain length of 7 sulfostyrene units is the highest, at about three-fifths of the experimental data (in Figure 11). This indicated that the MD-simulation method has certain guiding significance for designing the PEM of a side chain structure polymer. Rao et al. [94] calculated and analyzed proton mobility and ion conduction using MD simulations to study the effect of crosslink formation on proton conduction. The simulation results demonstrated that with the increase in the number of crosslinks, the proton diffusion coefficient first increases and then decreases. This was because the formation of cross-links is beneficial for opening new channels and improving proton conductivity. However, too much crosslinking also reduced proton diffusivity due to blockage on the backbone. In addition, they also found that the conduction of protons is better at 350 K than at 300 K (in Figure 12), suggesting that temperature also has a significant effect on diffusivity and conductivity. In addition, several scholars also used an MD model to study other properties of PEM, such as proton transport and conductivity [95], proton mobility and thermal conductivities [96], water-induced phase segregation [97], water channel morphology [98], and so on.

4.3. Multiphysics Simulation and ML Methods

Jourdani et al. [99] adopted a 3D numerical model to study the effect of different membrane geometries on the performance of PEMFC. The geometric model, with the corresponding COMSOL multiphysics simulation results. The simulation results demonstrated that the performance of the PEMFC improves as the film thickness decreases toward the nanometer scale. Validation experiments confirmed that the proposed models are in good agreement with actual operation. Increasing the maximum power density of PEMFCs can further advance their applications, which require very high current densities. Tsukamoto et al. [100] performed 3D numerical simulations of full-scale PEMFC stacks at high current densities. The results revealed that GDL gas diffusivity and thermal conductivity significantly affect the distribution of its PEM temperature and water saturation, which are related to cell performance and durability. The influence of diffusivity and thermal conductivity of GDL gas on PEM temperature and water saturation is shown in Figure 13. Haghayegh et al. [101] proposed COMSOL multiphysics to evaluate the performance of PEM fuel cells with a serpentine flow structure. The model results confirmed that the catalyst had a higher specific surface area and active site and good catalytic performance; they also predicted a reasonable decrease in oxygen concentration along the channel, which indicated the consumption of oxygen by the electrochemical reaction. Liquid water was produced at a higher rate due to the high oxygen consumption of the cathode. Sezgin et al. [102] utilized COMSOL multiphysics to simulate high-temperature PEM fuel cells to study the effects of membrane conductivity, reactant inlet velocity, and designed performance parameters. Jourdani et al. [103] used COMSOL multiphysics to study the effect of membrane geometry on the performance of PEM fuel cells. The results demonstrated that the thinner the film, the more current the PEM fuel cell produces, the more oxygen and hydrogen it consumes, and the more water it produces.
The performance of an MEA is physically related to many parameters at different scales [104,105,106,107,108]. It is very expensive to optimize several parameters simultaneously when designing the experiment. Therefore, various models were proposed to locally simulate the internal processes of a PEMFC. These theoretical model simulations based on numerical analysis were shown to be able to describe the behavior of PEMFCs in certain processes with acceptable accuracy.
As data-driven models, ML models can consider and incorporate any feature from any physical or chemical processes at any scale into the model simultaneously. For example, ML can be integrated with multiphysics simulation models to optimize the performance of PEM. Tian et al. [109] proposed a method combining ANN, genetic algorithm (GA) and a 3D multiphysics model to predict the performance of PEM fuel cells, as shown in Figure 14. First, the multiphysics model generated a total of 1500 data points for training, testing and validating the ANN; second, deep learning was performed through GA to determine the maximum power and corresponding operating conditions; finally, the fuel cell was mapped through the learning results of ML physical and electrochemical processes. The results demonstrated that the combined ANN-GA method is suitable for predicting fuel cell performance and identifying operating parameters of maximum power at different temperatures, which is very useful in fuel cell applications. A deep learning-based method for optimizing a membraneless microfluidic fuel cell (MMFC) performance by combining the artificial neural network (ANN) and genetic algorithm (GA) was introduced [110]. A 3D multiphysics model that had an accuracy equivalent to experimental results (R2 = 0.976) was employed to generate the ANN training data. The ANN was equivalent to the simulation (R2 = 0.999) but with far better computation resource efficiency as the its execution time was only 0.041 s. As shown in Figure 15, the ANN-GA and numerically calculated maximum power densities differed only by 0.766%. The ANN-GA and 3D multiphysics simulations agree well in predicting the occurrence of the power density and current density at optimal operating conditions.
Yin and Razmjooy [111] proposed a method to identify the optimal parameters for PEMFCs, which integrates a DBN model and an improved deer-hunting optimization algorithm. The method was then used to optimize the performance of the parameters in the PEMFC stack. The simulation results confirmed that their proposed method has high accuracy in predicting the parameters of the PEMFC stack. Zhou et al. [112] proposed a degradation model for PEMFC-stack performance based on a multiphysics aging model and a particle filter. The proposed model was based on physical fuel cell equations. In order to take performance degradation into account, three aging coefficient ohmic losses, reaction activity losses and reactant mass transfer losses were integrated into the major internal physical-aging phenomenon equations. By fitting the polarization curve at the start of life, the aging parameters were initialized first. Two phases, the learning phase and the prediction phase, rule the prediction. In order to study the aging behavior and update the aging parameters, a particle filter framework was used for the learning phase. Suitable fitting curve functions were then identified to satisfy the aging parameter evolutions; the functions were used to extrapolate and predict their evolutions during the prediction phase to finally predict voltage evolution. Although this method yields pleasing results, its accuracy is subject to variations in operating conditions. In fact, this prediction method was based on the identification of the best fitting curves, so the fitting functions must be altered if the operating conditions change. As a result, the suggested modeling approach would prefer to focus on steady-state operations and constant operating temperature.

4.4. Summary

It is very effective to model the material and structure of PEM using the MD method, and to analyze and design the optimal material structure, so as to improve the performance of PEMFCs; it is also of great current research interest and challenge. With the help of the MD model, the modification of the material can be combined with the modification of the membrane morphology to increase the stability of the membrane while increasing the proton conduction, thereby improving its performance and prolonging service time. However, is difficult to model the problem to be solved using the MD method, and the simulation calculation is time-consuming [113,114]. At the same time, the output results of the model are difficult to verify directly, which also hinders further promotion and application of this method. Multiphysics simulation and machining learning methods have their own advantages and disadvantages [115,116,117]. In the future, it may be a useful option to combine multiphysics simulation and machining learning methods to solve the PEM material structure problem, so that the calculation time and cost can be greatly reduced under the premise of sacrificing less predictive performance. Other modeling approaches for PEM are shown in Table 3.

5. Discussion

This review focuses on progress in the modeling and simulation of membrane electrode material structures for PEMFCs, including GDL, CL and PEM models. Table 4 lists the comparison of different models of PEMFCs grouped by GDL, CL and PEM. As listed in Table 4, the advantages and shortcomings of models based on microstructure simulation or integrated with ML are reviewed. This section discusses the above in terms of three aspects: similarity, individuality and complementarity of these simulation models.

5.1. Similarity

The three simulation models of the GDL, CL and PEM are all based on the respective mechanisms of the core component MEAs to study the multiphase material transfer and electrochemical reaction of electrons, protons, reaction gases and product water, so as to optimize the material structure of MEAs, and obtain a high-performance, long-life and low-cost MEA. Another similarity is that these three models are mainly three-dimensional models, especially for modeling the microstructure of materials, which is more conducive to performance prediction. It is worth noting that hybrid modeling is also a future development trend in these three types of models [55,93]. For example, for GDL simulation modeling, the integration of the FEM model and the VOF model is used to predict the wettability distribution. In CL simulation modeling, the prediction of PEMFC performance can be achieved through the fusion of a CL physical model with an ML model. Similarly, the computation time of the PEM simulation model can be reduced by the fusion of DBN and 3D numerical models.

5.2. Individuality

Naturally, there are obvious differences in the three simulation models established for GDL, CL and PEM due to different research objects. For example, for the GDL model, more attention is paid to the coupling relationship between the material structure and the permeability and drainage, so as to realize gas transfer and drainage of the reaction product water. The best way to simulate CL operation is to perform directly through multiphysics modeling based on the actual microscopic material structure, such as studying CL layer thickness, catalyst location, pore morphology and load distribution, and clarifying the mechanism of gas and ion transport in CL, such as electrochemical reactions. Since fast proton conduction properties within the MEA and the high catalytic activity of the catalyst are necessary conditions for obtaining high-performance PEMFCs, the existing models mainly address membrane material design, geometry optimization, etc., through MD and multiphysics models, and ML methods.

5.3. Complementarity

The current MEA electrodes still have problems, such as high cost and poor durability, and these must be addressed. The existing mainstream methods are mainly based on the modeling of a single GDL, CL and PEM core component to solve its local problems. Since the MEA electrode is the site of reaction, multiphase mass transfer and energy conversion in the fuel cell and water electrolysis, it involves a three-phase interface reaction and a complex mass and heat transfer process [16]. It is difficult to solve the global material structure optimization problem of the MEA electrode only through local simulation by a single model. This may require integrating the respective advantages of GDL, CL and PEM models to establish a higher-level integration model.

6. Outlook

As the core component of a fuel cell, the MEA is of great significance in improving fuel cell performance and life, and reducing cost; this would accelerate the large-scale commercialization process of PEMFCs. A core problem for the MEA is the optimal design of materials and structures. The mechanism of multiphase material transport and electrochemical reaction can be clarified through simulation calculation, thereby accelerating the research progress. Therefore, with the help of a simulation model, developing an MEA with a simpler preparation process, more stable performance and lower cost is an important development direction for the future. Based on the literature review in this study, future development directions for the modeling and simulation of material structures for PEMFCs is as follows.
(1)
For the modeling of membrane electrode material structure optimization, existing models are mainly constructed for GDL, CL or PEM single components. In the future, a hybrid model could be built; this would integrate the simulation model of the three components mentioned above to realize the overall modeling of MEAs. In addition, most of the existing simulation models involve single-scale modeling [30,53,93], either macro scale or micro material structure models. If a cross-scale hybrid model is established, it may be more beneficial for solving the existing difficulties.
(2)
To obtain a low-cost and long-life PEMFC, it is necessary to find a suitable and cheaper preparation method for the MEA microstructure. In addition to traditional preparation methods, non-traditional machining methods, such as laser machining [122,123], electrical discharge machining [124,125] and electrochemical machining [126,127], also made good progress in the preparation of microstructures. This means that a future 3D digital simulation MEA model must also consider the influence of the preparation process on the microstructure, so as to establish a more accurate model. In addition, reliability design, which can prolong the in-service time of equipment, is widely used in the engineering field [128,129]. When dealing with MEA material structure optimization modeling in the future, reliability design should be integrated into the simulation process to improve the life of PEMFCs.
(3)
With the rapid development of computer technology, ML technology is widely used in the fields of industrial inspection and measurement [130,131,132], medical diagnosis [133,134], life sciences [135,136] and so on. For example, AlphaFold2 constructed a protein structure prediction model through ML; it was able to predict the properties of proteins from gene sequences, obtaining 98.5% of the human protein structure [135]. Therefore, the combination of the ML method and an MEA simulation model to realize autonomous prediction (with preliminary artificial intelligence) may be the focus of research in the future.

Author Contributions

Conceptualization, methodology, writing—first draft, Y.C. (Yanyan Chen) and W.M.; formal analysis and data analysis, Y.L. and Y.X.; literature review, Y.C. (Yang Cao), X.G. and W.M.; fund acquisition, Y.C. (Yang Cao) and W.M. All authors have read and agreed to the published version of the manuscript.

Funding

This work was supported by the Local Innovative and Research Teams Project of Guangdong Pearl River Talents Program (2017BT01G167), Henan Provincial Youth Backbone University Teacher Training Plan (2021GGJS090) and by the Henan Provincial Key Scientific and Technological Project (222102220011).

Institutional Review Board Statement

Not applicable.

Informed Consent Statement

Not applicable.

Conflicts of Interest

The authors declare no conflict of interest.

References

  1. Wang, G.; Zou, L.; Huang, Q.; Zou, Z.; Yang, H. Multidimensional nanostructured membrane electrode assemblies for proton exchange membrane fuel cell applications. J. Mater. Chem. A 2019, 7, 9447–9477. [Google Scholar] [CrossRef]
  2. Dai, G.; Wang, Q.; Xue, S.; Wang, G.; Zou, Z.; Yu, N.; Wu, Y. A sensor of liquid methanol for direct methanol fuel cells. Anal. Chim. Acta 2021, 1177, 338785. [Google Scholar] [CrossRef] [PubMed]
  3. Kim, C.; Chun, Y.; Peck, D.; Shin, D. A novel process to fabricate membrane electrode assemblies for proton exchange membrane fuel cells. Int. J. Hydrogen Energy 1998, 23, 1045–1048. [Google Scholar] [CrossRef]
  4. New Era of Word View—A Big Test: Carbon Peak and Carbon Neutralization. 2022. Available online: http://cn.chinadaily.com.cn/a/202206/06/WS629ddedfa3101c3ee7ad9222.html (accessed on 5 June 2022).
  5. We Will Strive to Reach the Peak Value of Carbon Emissions by 2030 and Strive to Achieve Carbon Neutrality by 2060. 2020. Available online: https://www.scimall.org.cn/article/detail?id=4479161 (accessed on 5 June 2022).
  6. Address at the General Debate of the 75th United Nations General Assembly. Available online: http://www.thjj.org/sf_D68E6120FC25401F8C141EB8A3033DCF_227_bjmmgj.html (accessed on 8 June 2022).
  7. Wang, Y.; Seo, B.; Wang, B.; Zamel, N.; Jiao, K.; Adroher, X.C. Fundamentals, materials, and machine learning of polymer electrolyte membrane fuel cell technology. Energy AI 2020, 1, 100014. [Google Scholar] [CrossRef]
  8. Debe, M.K. Electrocatalyst approaches and challenges for automotive fuel cells. Nature 2012, 486, 43–51. [Google Scholar] [CrossRef]
  9. Duan, C.; Tong, J.; Shang, M.; Nikodemski, S.; Sanders, M.; Ricote, S.; Almansoori, O.R. Readily processed protonic ceramic fuel cells with high performance at low temperatures. Science 2015, 349, 1321–1326. [Google Scholar] [CrossRef]
  10. Bloom Energy 2020. Available online: https://www.bloomenergy.com (accessed on 12 June 2022).
  11. AFC Energy 2020. Available online: www.afcenergy.com (accessed on 12 June 2022).
  12. Doosan Fuel Cell 2020. Available online: www.doosanfuelcellamerica.com (accessed on 12 June 2022).
  13. FuelCell Energy 2020. Available online: www.fuelcellenergy.com (accessed on 13 June 2022).
  14. Song, Z.; Wang, B.; Cheng, N.; Yang, L.; Banham, D.; Li, R.; Ye, S.; Sun, X. Atomic layer deposited tantalum oxide to anchor Pt/C for a highly stable catalyst in PEMFCs. J. Mater. Chem. A 2017, 5, 9760–9767. [Google Scholar] [CrossRef]
  15. Mohiuddin, A.K.M.; Basran, N.; Khan, A.A. Modelling and validation of Proton exchange membrane fuel cell (PEMFC). Mater. Sci. Eng. 2018, 290, 012026. [Google Scholar] [CrossRef] [Green Version]
  16. Yang, B.; Han, Q.; Xiang, Z. Progress of membrane electrode structure and its design for proton exchange membrane fuel cell. Chem. Ind. Eng. Prog. 2021, 40, 4882–4893. (In Chinese) [Google Scholar]
  17. Fu, X.; Gao, R.; Jiang, G.; Li, M.; Bai, Z. Evolution of Atomic-scale Dispersion of FeNx in Hierarchically Porous 3D Air Electrode to Boost the Interfacial Electrocatalysis of Oxygen Reduction in PEMFC. Nano Energy 2021, 83, 105734. [Google Scholar] [CrossRef]
  18. Park, S.; Lee, J.W.; Popov, B.N. Effect of carbon loading in microporous layer on PEM fuel cell performance. J. Power Sources 2006, 163, 357–363. [Google Scholar] [CrossRef]
  19. Qi, Z.; Kaufman, A. Improvement of water management by a microporous sublayer for PEM fuel cells. J. Power Sources 2002, 109, 38–46. [Google Scholar] [CrossRef]
  20. Soler, J.; Hontanon, E.; Daza, L. Electrode permeability and flow-field configuration: Influence on the performance of a PEMFC. J. Power Sources 2003, 118, 172–178. [Google Scholar] [CrossRef]
  21. Bapat, C.J.; Thynell, S.T. Effect of anisotropic electrical resistivity of gas diffusion layers (GDLs) on current density and temperature distribution in a Polymer Electrolyte Membrane (PEM) fuel cell. J. Power Sources 2008, 185, 428–432. [Google Scholar] [CrossRef]
  22. Hakenjos, A.; Muenter, H.; Wittstadt, U.; Hebling, C. A PEM fuel cell for combined measurement of current and temperature distribution, and flow field flooding. J. Power Sources 2004, 131, 213–216. [Google Scholar] [CrossRef]
  23. Wang, M.; Guo, H.; Ma, C. Temperature distribution on the MEA surface of a PEMFC with serpentine channel flow bed. J. Power Sources 2006, 157, 181–187. [Google Scholar] [CrossRef]
  24. Vie, P.J.S.; Kjelstrup, S. Thermal conductivities from temperature profiles in the polymer electrolyte fuel cell. Electrochim. Acta 2004, 49, 1069–1077. [Google Scholar] [CrossRef]
  25. He, S.; Mench, M.M.; Tadigadapa, S. Thin film temperature sensor for real-time measurement of electrolyte temperature in a polymer electrolyte fuel cell. Sensor. Actuat. A Phys. 2006, 125, 170–177. [Google Scholar] [CrossRef]
  26. Mench, M.M.; Burford, D.J.; Davis, T.W. In situ temperature distribution measurement in an operating polymer electrolyte fuel cell. ASME Int. Mech. Eng. Congr. Expo. 2003, 37181, 415–428. [Google Scholar]
  27. Authayanun, S.; Saebea, D.; Patcharavorachot, Y.; Arpornwichanop, A. Effect of different fuel options on performance of high-temperature PEMFC (proton exchange membrane fuel cell) systems. Energy 2014, 68, 989–997. [Google Scholar] [CrossRef]
  28. Meng, H.; Wang, C.Y. Model of two-phase flow and flooding dynamics in polymer electrolyte fuel cells. J. Electrochem. Soc. 2005, 152, A1733. [Google Scholar] [CrossRef]
  29. Koido, T.; Furusawa, T.; Moriyama, K. An approach to modeling two-phase transport in the gas diffusion layer of a proton exchange membrane fuel cell. J. Power Sources 2008, 175, 127–136. [Google Scholar] [CrossRef]
  30. Zhou, X.; Wu, L.; Niu, Z.; Bao, Z.; Du, Q. Effects of surface wettability on two-phase flow in the compressed gas diffusion layer microstructures. Int. J. Heat Mass Transf. 2020, 151, 119370. [Google Scholar] [CrossRef]
  31. Shi, X.; Jiao, D.; Bao, Z.; Jiao, K.; Chen, W.; Liu, Z. Liquid transport in gas diffusion layer of proton exchange membrane fuel cells: Effects of micro-porous layer cracks. Int. J. Hydrogen Energy 2022, 47, 6247–6258. [Google Scholar] [CrossRef]
  32. Yiotis, A.G.; Kainourgiakis, M.E.; Charalambopoulou, G.C.; Stubos, A.K. Microscale characterisation of stochastically reconstructed carbon fiber-based Gas Diffusion Layers; effects of anisotropy and resin content. J. Power Sources 2016, 320, 153–167. [Google Scholar] [CrossRef]
  33. Goebel, M.; Godehardt, M.; Schladitz, K. Multi-scale structural analysis of gas diffusion layers. J. Power Sources 2017, 355, 8–17. [Google Scholar] [CrossRef]
  34. Zhou, Y.; Jiao, K.; Du, Q.; Yin, Y.; Li, X. Gas diffusion layer deformation and its effect on the transport characteristics and performance of proton exchange membrane fuel cell. Int. J. Hydrogen Energy 2013, 38, 12891–12903. [Google Scholar] [CrossRef]
  35. Zhou, X.; Niu, Z.; Bao, Z.; Wang, J.; Jiao, K. Two-phase flow in compressed gas diffusion layer: Finite element and volume of fluid modeling. J. Power Sources 2019, 437, 226933. [Google Scholar] [CrossRef]
  36. Wang, Y.; Chen, K.S. Advanced control of liquid water region in diffusion media of polymer electrolyte fuel cells through a dimensionless number. J. Power Sources 2016, 315, 224–235. [Google Scholar] [CrossRef] [Green Version]
  37. Santamaria, A.D.; Mortazavi, M.; Chauhan, V.; Benner, J.; Philbrick, O.; Clemente, R.; Jia, H.; Ling, C. Machine Learning Applications of Two-Phase Flow Data in Polymer Electrolyte Fuel Cell Reactant Channels. J. Electrochem. Soc. 2021, 168, 054505. [Google Scholar] [CrossRef]
  38. Chauhan, V.; Mortazavi, M.; Benner, J.Z.; Santamaria, A.D. Two-phase flow characterization in PEM fuel cells using machine learning—ScienceDirect. Energy Rep. 2020, 6, 2713–2719. [Google Scholar] [CrossRef]
  39. Morey, C.; Baredar, P. Fuel Cell Technology-Polymer Electrolyte Membrane Fuel Cell; CRC Press: Boca Raton, FL, USA, 2020; pp. 107–122. [Google Scholar] [CrossRef]
  40. Springer, T.E.; Zawodzinski, T.A.; Gottesfeld, S. Polymer Electrolyte Fuel Cell Model. J. Electrochem. Soc. 1991, 138, 2334–2342. [Google Scholar] [CrossRef]
  41. Bernardi, D.M.; Verbrugge, M.W. A mathematical model of the solid-polymer-electrolyte fuel cell. J. Electrochem. Soc. 1992, 139, 2477–2491. [Google Scholar] [CrossRef]
  42. Nguyen, T.V.; White, R.E. A Water and Heat Management Model for Proton-Exchange-Membrane Fuel Cells. J. Electrochem. Soc. 1993, 140, 2178–2186. [Google Scholar] [CrossRef]
  43. Pasaogullari, U.; Wang, C.-Y.; Chen, K.S. Two-Phase Transport in Polymer Electrolyte Fuel Cells with Bilayer Cathode Gas Diffusion Media. J. Electrochem. Soc. 2005, 152, A1574–A1582. [Google Scholar] [CrossRef]
  44. Atyabi, S.A.; Afshari, E.; Wongwises, S.; Yan, W.-M.; Hadjadj, A.; Shadloo, M.S. Effects of assembly pressure on PEM fuel cell performance by taking into accounts electrical and thermal contact resistances. Energy 2019, 179, 490–501. [Google Scholar] [CrossRef]
  45. Berning, T.; Odgaard, M.; Kær, S.K. A Computational Analysis of Multiphase Flow through PEMFC Cathode Porous Media Using the Multifluid Approach. J. Electrochem. Soc. 2009, 156, B1301–B1311. [Google Scholar] [CrossRef]
  46. Ye, Q.; Nguyen, T.V. Three-Dimensional Simulation of Liquid Water Distribution in a PEMFC with Experimentally Measured Capillary Functions. J. Electrochem. Soc. 2007, 154, B1242–B1251. [Google Scholar] [CrossRef]
  47. Antolini, E. Review in applied electrochemistry. Number 54 recent developments in polymer electrolyte fuel cell electrodes. J. Appl. Electrochem. 2004, 34, 563–576. [Google Scholar] [CrossRef]
  48. Zhao, X.; Li, W.; Fu, Y.; Manthiram, A. Influence of ionomer content on the proton conduction and oxygen transport in the carbon-supported catalyst layers in DMFC. Int. J. Hydrogen Energy 2012, 37, 9845–9852. [Google Scholar] [CrossRef]
  49. Kulikovsky, A.A. Polarization curve of partially degraded catalyst layer. Electrochem. Commun. 2010, 12, 1780–1783. [Google Scholar] [CrossRef]
  50. Kandlikar, S.G. Microscale and Macroscale Aspects of Water Management Challenges in PEM Fuel Cells. Heat. Transfer Eng. 2008, 29, 575–587. [Google Scholar] [CrossRef]
  51. Marr, C.; Li, X. Composition and performance modelling of catalyst layer in a proton exchange membrane fuel cell. J. Power Sources 1999, 77, 17–27. [Google Scholar] [CrossRef]
  52. Wang, Y.; Chen, K.S.; Mishler, J.; Cho, S.C.; Adroher, X.C. A review of polymer electrolyte membrane fuel cells: Technology, applications, and needs on fundamental research. Appl. Energy 2011, 88, 981–1007. [Google Scholar] [CrossRef] [Green Version]
  53. Ebrahimi, S.; Roshandel, R.; Vijayaraghavan, K. Power density optimization of PEMFC cathode with non-uniform catalyst layer by Simplex method and numerical simulation. Int. J. Hydrogen Energy 2016, 41, 22260–22273. [Google Scholar] [CrossRef]
  54. Sabharwal, M.; Pant, L.M.; Putz, A.; Susac, D.; Jankovic, J.; Secanell, M. Analysis of Catalyst Layer Microstructures: From Imaging to Performance. Fuel Cells 2016, 16, 734–753. [Google Scholar] [CrossRef]
  55. Salvado, M.B.; Schott, P.; Guetaz, L.; Gerard, M.; David, T.; Bultel, Y. Towards the understanding of transport limitations in a proton-exchange membrane fuel cell catalyst layer: Performing agglomerate scale direct numerical simulations on electron-microscopy-based geometries. J. Power Sources 2021, 482, 228893. [Google Scholar] [CrossRef]
  56. Khajeh-Hosseini-Dalasm, N.; Ahadian, S.; Fushinobu, K.; Okazaki, K.; Kawazoe, Y. Prediction and analysis of the cathode catalyst layer performance of proton exchange membrane fuel cells using artificial neural network and statistical methods. J. Power Sources 2011, 196, 3750–3756. [Google Scholar] [CrossRef]
  57. Wang, B.; Zhang, G.; Wang, H.; Xuan, J.; Jiao, K. Multi-physics-resolved digital twin of proton exchange membrane fuel cells with a data-driven surrogate model. Energy AI 2020, 1, 100004. [Google Scholar] [CrossRef]
  58. Li, H.; Xu, B.; Du, C.; Yang, Y. Performance prediction and power density maximization of a proton exchange membrane fuel cell based on deep belief network. J. Power Sources 2020, 461, 228154. [Google Scholar] [CrossRef]
  59. Colombo, M.; Nova, I.; Tronconi, E. A simplified approach to modeling of dual-layer ammonia slip catalysts. Chem. Eng. Sci. 2012, 75, 75–83. [Google Scholar] [CrossRef]
  60. Tovazhnyanskii, L.L.; Tolchinsky, Y.A.; Ved, E.V.; Meshalkin, V.P. Three-level model of a surface catalytic reaction over a platinum catalyst. Theor. Found. Chem. Eng. 2011, 45, 589–594. [Google Scholar] [CrossRef]
  61. Selsil, A.; Movchan, N.V.; Movchan, A.B.; Kolaczkowski, S.T.; Awdry, S. Mathematical modelling of heat transfer in a catalytic reformer. IMA J. Appl. Math. 2005, 70, 201–220. [Google Scholar] [CrossRef]
  62. Melo, D.N.C.; Costa, C.B.B.; Vasco de Toledo, E.C.; Mariano, A.P.; Wolf Maciel, M.R.; Maciel Filho, R. Optimization of a three-phase catalytic slurry reactor using reduced statistical models. Int. J. Chem. React. Eng. 2010, 8, 1542–6580. [Google Scholar] [CrossRef]
  63. Melo, D.N.C.; Vasco de Toledo, E.C.; Mariano, A.P.; Santos, M.M.; Maciel Filho, R. An approach to optimization of a three phase catalyticslurry reactor by evolutionary optimization with geneticalgorithms. IFAC Proc. Vol. 2007, 40, 373–378. [Google Scholar] [CrossRef]
  64. Mariano, A.P.; Costa, C.B.B.; de Toledo, E.C.V.; Melo, D.N.C.; Maciel Filho, R. Analysis of the particle swarm algorithm in the optimization of a three-phase slurry catalytic reactor. Comput. Chem. Eng. 2011, 35, 2741–2749. [Google Scholar] [CrossRef]
  65. Hung, Y.; Tawfik, H.; Mahajan, D. Durability and characterization studies of polymer electrolyte membrane fuel cell’s coated aluminum bipolar plates and membrane electrode assembly. J. Power Sources 2009, 186, 123–127. [Google Scholar] [CrossRef]
  66. Thosar, A.U.; Agarwal, H.; Govarthan, S.; Lele, A.K. Comprehensive analytical model for polarization curve of a PEM fuel cell and experimental validation. Chem. Eng. Sci. 2019, 206, 96–117. [Google Scholar] [CrossRef]
  67. Dawes, J.E.; Hanspal, N.S.; Family, O.A.; Turan, A. Three dimensional CFD modelling of PEM fuel cells: An investigation into the effects of water flooding. Chem. Eng. Sci. 2009, 64, 2781–2794. [Google Scholar] [CrossRef] [Green Version]
  68. Han, C.; Chen, Z. Numerical simulations of two-phase flow in a proton-exchange membrane fuel cell based on the generalized design method. Energy Sources Part A 2019, 41, 1253–1271. [Google Scholar] [CrossRef]
  69. Mustata, R.; Valiño, L.; Barreras, F.; Gil, M.I.; Lozano, A. Study of the distribution of air flow in a proton exchange membrane fuel cell stack. J. Power Sources 2009, 192, 185–189. [Google Scholar] [CrossRef]
  70. Mazumder, S.; Cole, J.V. Rigorous 3-D Mathematical Modeling of PEM Fuel Cells. J. Electrochem. Soc. 2003, 150, A1503. [Google Scholar] [CrossRef]
  71. Ticianelli, E.A.; Derouin, C.R.; Srinivasan, S. Localization of platinum in low catalyst loading electrodes to to attain high power densities in SPE fuel cells. J. Electroanal. Chem 1988, 251, 275–295. [Google Scholar] [CrossRef]
  72. Wilson, M.S.; Gottesfeld, S. Thin-film catalyst layers for polymer electrolyte fuel cell electrodes. J. Appl. Electrochem. 1992, 22, 1–7. [Google Scholar] [CrossRef]
  73. Taylor, E.J.; Anderson, E.B.; Vilambi, N.R.K. Preparation of high-platinum-utilization gas diffusion electrodes for proton-exchange-membrane fuel cells. J. Electrochem. Soc. 1992, 139, L45. [Google Scholar] [CrossRef]
  74. Paganin, V.A.; Ticianelli, E.A.; Gonzalez, E.R. Development and electrochemical studies of gas diffusion electrodes for polymer electrolyte fuel cells. J. Appl. Electrochem. 1996, 26, 297–304. [Google Scholar] [CrossRef]
  75. Song, J.M.; Cha, S.Y.; Lee, W.M. Optimal composition of polymer electrolyte fuel cell electrodes determined by the AC impedance method. J. Power Sources 2001, 94, 78–84. [Google Scholar] [CrossRef]
  76. Antolini, E.; Giorgi, L.; Pozio, A.; Passalacqua, E. Influence of Nafion loading in the catalyst layer of gas-diffusion electrodes for PEFC. J. Power Sources 1999, 77, 136–142. [Google Scholar] [CrossRef]
  77. Lee, S.J.; Mukerjee, S.; McBreen, J.; Rho, Y.W.; Kho, Y.T.; Lee, T.H. Effects of Nafion impregnation on performances of PEMFC electrodes. Electrochim. Acta 1998, 43, 3693–3701. [Google Scholar] [CrossRef]
  78. Passalacqua, E.; Lufrano, F.; Squadrito, G.; Patti, A.; Giorgi, L. Nafion content in the catalyst layer of polymer electrolyte fuel cells: Effects on structure and performance. Electrochim. Acta 2001, 46, 799–805. [Google Scholar] [CrossRef]
  79. Sasikumar, G.; Ihm, J.W.; Ryu, H. Optimum Nafion content in PEM fuel cell electrodes. Electrochim. Acta 2004, 50, 601–605. [Google Scholar] [CrossRef]
  80. Uchida, M.; Aoyama, Y.; Eda, N.; Ohta, A. Investigation of the microstructure in the catalyst layer and effects of both perfluorosulfonate ionomer and PTFE-loaded carbon on the catalyst layer of polymer electrolyte fuel cells. J. Electrochem. Soc. 1995, 142, 4143. [Google Scholar] [CrossRef]
  81. Uchida, M.; Fukuoka, Y.; Sugawara, Y.; Ohara, H.; Ohta, A. Improved preparation process of very-low-platinum-loading electrodes for polymer electrolyte fuel cells. J. Electrochem. Soc. 1998, 145, 3708. [Google Scholar] [CrossRef]
  82. Deng, Y.; Chi, B.; Tian, X.; Cui, Z.; Liu, E.; Jia, Q.; Fan, W.; Wang, G.; Dang, D.; Li, M.; et al. g-C3N4 promoted MOF derived hollow carbon nanopolyhedra doped with high density/fraction of single Fe atoms as an ultra-high performance non-precious catalyst towards acidic ORR and PEM fuel cells. J. Mater. Chem. A 2019, 7, 5020–5030. [Google Scholar] [CrossRef]
  83. Hussain, A.; Ali, N.; Ali, S.S.; Hou, J.; Aslam, I.; Naeem, H.; Boota, M.; Ul-Hussan, M.; Yin, J.; Wang, X. Diverse morphological study for nonmetal-doped g-C3N4 composites with narrow bandgap for improved photocatalytic activity. Res. Chem. Intermed. 2022, 48, 2857–2870. [Google Scholar] [CrossRef]
  84. Wang, L.; Zhang, L.; Jiang, J. Experimental study of assembly clamping pressure on performance of PEM fuel cells. Appl. Mech. Mater. 2011, 44, 2399–2403. [Google Scholar] [CrossRef]
  85. Manso, A.P.; Marzo, F.F.; Barranco, J.; Garikano, X.; Garmendia Mujika, M. Influence of geometric parameters of the flow fields on the performance of a PEM fuel cell. A review. Int. J. Hydrogen Energy 2012, 37, 15256–15287. [Google Scholar] [CrossRef]
  86. Chandan, A.; Hattenberger, M.; El-Kharouf, A.; Du, S.; Dhir, A.; Self, V.; Pollet, B.G.; Ingram, A.; Bujalski, W. High temperature (HT) polymer electrolyte membrane fuel cells (PEMFC) A review. J. Power Sources 2013, 231, 264–278. [Google Scholar] [CrossRef]
  87. Borup, R.L.; Kusoglu, A.; Neyerlin, K.C.; Mukundan, R.; Ahluwalia, R.K.; Cullen, D.A.; More, K.L.; Weber, A.Z.; Myers, D.J. Recent developments in catalyst -related PEM fuel cell durability. Curr. Opin. Electrochem. 2020, 21, 192–200. [Google Scholar] [CrossRef]
  88. Araya, S.S.; Zhou, F.; Liso, V.; Sahlin, S.L.; Vang, J.R.; Thomas, S.; Gao, X.; Jeppesen, C.; Kær, S.K. A comprehensive review of PBI-based high temperature PEM fuel cells. Int. J. Hydrogen Energy 2016, 41, 21310–21344. [Google Scholar] [CrossRef]
  89. Chen, Y.; Guo, X.; Zhang, G.; Cao, Y.; Shen, D.; Li, X.; Zhang, S.; Ming, W. Development of a hybrid intelligent process model for micro-electro discharge machining using the TTM-MDS and gaussian process regression. Micromachines 2022, 13, 845. [Google Scholar] [CrossRef] [PubMed]
  90. Ming, W.; Zhang, S.; Zhang, G.; Du, Z.; Ma, J.; He, W.; Cao, C.; Liu, K. Progress in modeling of electrical discharge machining process. Int. J. Heat Mass Transf. 2022, 187, 122563. [Google Scholar] [CrossRef]
  91. Guo, J.; Zhang, G.; Huang, Y.; Ming, W.; Liu, M.; Huang, H. Investigation of the removing process of cathode material in Micro-EDM using an atomistic-continuum model. Appl. Surf. Sci. 2014, 315, 323–336. [Google Scholar] [CrossRef]
  92. Park, C.H.; Nam, S.Y.; Hong, Y.T. Molecular Dynamics (MD) study of proton exchange membranes for fuel cells. J. Membr. Sci. 2016, 26, 329–336. [Google Scholar] [CrossRef]
  93. Li, X.; Zhao, Y.; Li, W.; Wang, S.; Liu, X.; Xie, X.; Chen, J.; Li, Q.; Jensen, J.O. Molecular Dynamics simulation of radiation grafted FEP films as proton exchange membranes: Effects of the side chain length. Int. J. Hydrogen Energy 2017, 42, 29977–29987. [Google Scholar] [CrossRef]
  94. Rao, Z.; Zheng, C.; Geng, F. Proton conduction of fuel cell polymer membranes: Molecular Dynamics simulation. Comp. Mater. Sci. 2018, 142, 122–128. [Google Scholar] [CrossRef]
  95. Tai, C.C.; Chen, C.L.; Liu, C.W. Computer simulation to investigate proton transport and conductivity in perfluorosulfonate ionomeric membrane. Int. J. Hydrogen Energy 2017, 42, 3981–3986. [Google Scholar] [CrossRef]
  96. Zheng, C.; Geng, F.; Rao, Z. Proton mobility and thermal conductivities of fuel cell polymer membranes: Molecular Dynamics simulation. Comp. Mater. Sci. 2017, 132, 55–61. [Google Scholar] [CrossRef]
  97. Lyu, K.; Peng, Y.; Xiao, L.; Lu, J.; Zhuang, L. Communication water induced phase segregation in hydrocarbon proton exchange membranes. J. Energy Chem. 2018, 27, 1517–1520. [Google Scholar] [CrossRef] [Green Version]
  98. Park, C.H.; Kim, T.; Nam, S.Y.; Hong, Y.T. Water channel morphology of non-perfluorinated hydrocarbon proton exchange membrane under a low humidifying condition. Int. J. Hydrogen Energy 2019, 44, 2340–2348. [Google Scholar] [CrossRef]
  99. Jourdani, M.; Mounir, H.; Marjani, A.E.L. Numerical simulation of the performance of proton exchange membrane fuel cell with different membrane geometries. J. Mech. Eng. Sci. 2017, 11, 2941–2951. [Google Scholar] [CrossRef]
  100. Tsukamoto, T.; Aoki, T.; Kanesaka, H.; Taniguchi, T.; Yoneda, M. Three-dimensional numerical simulation of full-scale proton exchange membrane fuel cells at high current densities. J. Power Sources 2021, 488, 229412. [Google Scholar] [CrossRef]
  101. Haghayegh, M.; Eikani, M.H.; Rowshanzamir, S. Modeling and simulation of a proton exchange membrane fuel cell using computational fluid dynamics. Int. J. Hydrogen Energy 2017, 42, 21944–21954. [Google Scholar] [CrossRef]
  102. Sezgin, B.; Caglayan, D.G.; Devrim, Y.; Steenberg, T.; Eroglu, I. Modeling and sensitivity analysis of high temperature PEM fuel cells by using Comsol Multiphysics. Int. J. Hydrogen Energy 2016, 41, 10001–10009. [Google Scholar] [CrossRef]
  103. Jourdani, M.; Mounir, H.; El Marjani, A. Modeling a PEM fuel cell under different thicknesses of membrane. Adv. Appl. Fluid Mech. 2017, 20, 605–625. [Google Scholar] [CrossRef]
  104. Guo, S.J.; Zhang, S.; Sun, S.H. Tuning Nanoparticle Catalysis for the Oxygen Reduction Reaction. Angew. Chem. Int. Ed. 2013, 52, 8526–8544. [Google Scholar] [CrossRef]
  105. Wang, Y.J.; Wilkinson, D.P.; Zhang, J.J. Noncarbon Support Materials for Polymer Electrolyte Membrane Fuel Cell Electrocatalysts. Chem. Rev. 2011, 111, 7625–7651. [Google Scholar] [CrossRef]
  106. Trogadas, P.; Fuller, T.F.; Strasser, P. Carbon as catalyst and support for electrochemical energy conversion. Carbon 2014, 75, 5–42. [Google Scholar] [CrossRef]
  107. Cho, Y.H.; Park, H.S.; Cho, Y.H.; Jung, D.S.; Park, H.Y.; Sung, Y.E. Effect of platinum amount in carbon supported platinum catalyst on performance of polymer electrolyte membrane fuel cell. J. Power Sources 2007, 172, 89–93. [Google Scholar] [CrossRef]
  108. Guo, Y.; Pan, F.; Chen, W.; Ding, Z.; Yang, D.; Li, B.; Ming, P.; Zhang, C. The Controllable Design of Catalyst Inks to Enhance PEMFC Performance: A Review. Electrochem. Energy Rev. 2020, 4, 67–100. [Google Scholar] [CrossRef]
  109. Tian, P.; Liu, X.; Luo, K.; Li, H.; Wang, Y. Deep learning from three-dimensional multiphysics simulation in operational optimization and control of polymer electrolyte membrane fuel cell for maximum power. Appl. Energy 2021, 288, 116632. [Google Scholar] [CrossRef]
  110. Nguyen, D.D.; Pham, T.Q.D.; Tanveer, M.; Khan, H.; Park, J.W.; Park, C.W.; Kim, G.M. Deep learning–based optimization of a microfluidic membraneless fuel cell for maximum power density via data-driven three-dimensional multiphysics simulation. Bioresour. Technol. 2022, 348, 126794. [Google Scholar] [CrossRef]
  111. Yin, Z.; Razmjooy, N. PEMFC identification using deep learning developed by improved deer hunting optimization algorithm. Int. J. Power. Energy. Syst. 2020, 40, 189–203. [Google Scholar] [CrossRef]
  112. Zhou, D.; Wu, Y.; Gao, F.; Breaz, A.; Ravey, A. Miraoui Degradation prediction of PEM fuel cell stack based on multiphysical aging model with particle filter approach. IEEE Trans. Ind. Appl. 2017, 53, 4041–4052. [Google Scholar] [CrossRef]
  113. Shan, W.; Nackenhorst, U. An adaptive FE–MD model coupling approach. Comput. Mech. 2010, 46, 577–596. [Google Scholar] [CrossRef]
  114. Erban, R. From Molecular Dynamics to Brownian Dynamics. Proc. R. Soc. A Math. Phys. Eng. Sci. 2014, 470, 20140036. [Google Scholar] [CrossRef] [Green Version]
  115. Wang, J.; Ding, R.; Cao, F.; Li, J.; Dong, H.; Shi, T.; Liu, J. Comparison of state-of-the-art machine learning algorithms and data-driven optimization methods for mitigating nitrogen crossover in PEM fuel cells. Chem. Eng. J. 2022, 442, 136064. [Google Scholar] [CrossRef]
  116. Yue, M.; Li, Z.; Roche, R.; Jemei, S.; Zerhouni, N. Degradation identification and prognostics of proton exchange membrane fuel cell under dynamic load. Eng. Pract. 2022, 118, 104959. [Google Scholar] [CrossRef]
  117. Mert, S.O.; Toprak, M.M. Exergetic Comparison of Various Flow Patterns in PEMFCs. Int. J. Thermodyn. 2019, 22, 159–166. [Google Scholar] [CrossRef]
  118. Dutta, S.; Shimpalee, S. Numerical Prediction of Temperature Distribution in PEM Fuel Cells. Numer. Heat Transf. Part A Appl. 2000, 38, 111–128. [Google Scholar] [CrossRef]
  119. Kvesic, M.; Reimer, U.; Froning, D.; Lüke, L.; Lehnert, W.; Stolten, D. 3D modeling of a 200 cm2 HT-PEFC short stack. Int. J. Hydrogen Energy 2012, 37, 2430–2439. [Google Scholar] [CrossRef]
  120. Wöhr, M.; Bolwin, K.; Schnurnberger, W.; Fischer, M.; Neubrand, W.; Eigenberger, G. Dynamic modelling and simulation of a polymer membrane fuel cell including mass transport limitation. Int. J. Hydrogen Energy 1998, 23, 213–218. [Google Scholar] [CrossRef]
  121. Li, Y.; Zhou, Z.; Liu, X.; Wu, W.-T. Modeling of PEM fuel cell with thin MEA under low humidity operating condition. Appl. Energy 2019, 242, 1513–1527. [Google Scholar] [CrossRef]
  122. Huang, H.; Xu, Y.; Luo, G.; Xie, Z.; Ming, W. Molecular Dynamics Study of Laser Interaction with Nanoparticles in Liquids and Its Potential Application. Nanomaterials 2022, 12, 1524. [Google Scholar] [CrossRef]
  123. Zhang, Z.; Zhang, Y.; Liu, D.; Zhang, Y.; Zhao, J.; Zhang, G. Bubble Behavior and Its Effect on Surface Integrity in Laser-Induced Plasma Micro Machining Silicon Wafer. J. Manuf. Sci. Eng. 2022, 144, 091008. [Google Scholar] [CrossRef]
  124. Shen, D.; Ming, W.; Ren, X.; Xie, Z.; Liu, X. Progress in Non-Traditional Processing for Fabricating Superhydrophobic Surfaces. Micromachines 2021, 12, 1003. [Google Scholar] [CrossRef] [PubMed]
  125. Ming, W.; Xie, Z.; Ma, J.; Du, J.; Zhang, G.; Cao, C.; Zhang, Y. Critical review on sustainable techniques in electrical discharge machining. J. Manuf. Process. 2021, 72, 375–399. [Google Scholar] [CrossRef]
  126. Li, J.; Yang, Y.; Zhu, G.; Sun, C.; Chen, Y.; Wang, K.; Shi, S. The Anisotropic Electrochemical Machinability of Laser Cladding Deposited Ti6Al4V Alloy in NaCl Solution. Materials 2022, 15, 3642. [Google Scholar] [CrossRef]
  127. Schupp, A.; Beyss, O.; Rommes, B.; Klink, A.; Zander, D. Insights on the Influence of Surface Chemistry and Rim Zone Microstructure of 42CrMo4 on the Efficiency of ECM. Materials 2021, 14, 2132. [Google Scholar] [CrossRef]
  128. Li, X.; Zhu, H.; Chen, Z.; Ming, W.; Cao, Y.; He, W.; Ma, J. Limit state Kriging modeling for reliability-based design optimization through classification uncertainty quantification. Reliab. Eng. Syst. Saf. 2022, 224, 108539. [Google Scholar] [CrossRef]
  129. Li, X.; Han, X.; Chen, Z.; Ming, W.; Cao, Y.; Ma, J. A multi-constraint failure-pursuing sampling method for reliability-based design optimization using adaptive Kriging. Eng. Comput. 2020, 38, 297–310. [Google Scholar] [CrossRef]
  130. Ming, W.; Zhang, S.; Liu, X.; Liu, K.; Yuan, J.; Xie, Z.; Sun, P.; Guo, X. Survey of Mura Defect Detection in Liquid Crystal Displays Based on Machine Vision. Crystals 2021, 11, 1444. [Google Scholar] [CrossRef]
  131. He, W.; Jiang, Z.; Ming, W.; Zhang, G.; Yuan, J.; Yin, L. A critical review for machining positioning based on computer vision. Measurement 2021, 184, 109973. [Google Scholar] [CrossRef]
  132. Ming, W.; Cao, C.; Zhang, G.; Zhang, H.; Zhang, F.; Jiang, Z.; Yuan, J. Application of Convolutional Neural Network in Defect Detection of 3C Products. IEEE Access 2021, 9, 135657–135674. [Google Scholar] [CrossRef]
  133. Kandubothula, V.; Uppada, R.; Nandan, D. A review on detection of breast cancer cells by using various techniques. Soft Comput. Theor. Appl. 2020, 1154, 813–823. [Google Scholar] [CrossRef]
  134. He, W.; Liu, T.; Han, Y.; Ming, W.; Du, J.; Liu, Y.; Yang, Y.; Wang, L.; Jiang, Z.; Wang, Y.; et al. A review: The detection of cancer cells in histopathology based on machine vision. Comput. Biol. Med. 2022, 146, 105636. [Google Scholar] [CrossRef]
  135. Jumper, J.; Evans, R.; Pritzel, A.; Green, T.; Figurnov, M.; Ronneberger, O.; Tunyasuvunakool, K.; Bates, R.; Žídek, A.; Potapenko, A.; et al. Highly accurate protein structure prediction with AlphaFold. Nature 2021, 596, 583–589. [Google Scholar] [CrossRef]
  136. Sherman, M.A.; Yaari, A.U.; Priebe, O.; Dietlein, F.; Loh, P.R.; Berger, B. Genome-wide mapping of somatic mutation rates uncovers drivers of cancer. Nat. Biotechnol. 2022, 1–10. [Google Scholar] [CrossRef]
Figure 1. Schematic diagram of electrochemical process and application of a PEMFC [15].
Coatings 12 01145 g001
Figure 2. Schematic diagram of a PEMFC GDL [18].
Coatings 12 01145 g002
Figure 3. Schematic representation of computational domain of a PEMFC (a) and transport of electrons in a GDL (b) [20].
Coatings 12 01145 g003
Figure 4. Schematic of numerical model, integrating FEM and volume of fluid (VOF), for wettability distribution based on GDL microstructures [30].
Coatings 12 01145 g004
Figure 5. Random reconstruction domain images and velocity magnitude distributions at typical pore scales were calculated using LB models; (a) velocity magnitude profiles from LB simulations in a reconstructed digital domain; (b) of size 200 × 200 μm3; (c) in an X-ray μ-CT domain; (d) with ε = 0.78 of the same size [32].
Coatings 12 01145 g005
Figure 6. Water saturation and pore radius, for the two GDLs (H14C7 at 20% saturation level 181 and 28BC 40% saturation level), as a function of capillary pressure [33].
Coatings 12 01145 g006
Figure 7. Schematic diagram of FEM model and VOF model based on GDL microstructure in a PEMFC: (a) morphology of uncompressed and compressed GDL; (b) computational domain and boundary conditions for FEM model; (c) computational domain of FEM model; (d) the computational domain and boundary conditions for the VOF model [35].
Coatings 12 01145 g007
Figure 8. Numerical domain; (a) and overall optimization algorithm; (b) for power density optimization of a PEMFC [53].
Coatings 12 01145 g008
Figure 9. Numerical domain of a multi-physical model for CL [55]; (a) RAW FIB-SEM stack section portion of [100 × 100 × 100 nm]; (b) corresponding to the segmented stack section; (c) corresponding reconstructed carbon phase; (d) carbon phase with platinum particles distributed on the surface; (e) addition of an ionomer layer on the Pt/C aggregate; (f) addition of pore phase. (Legend grey: pore phase; green: ionomer stage; orange: carbon phase; yellow: platinum phase).
Coatings 12 01145 g009
Figure 10. Typical chemical reaction molding based on ML and physical model; (a) prediction of the CCL performance based on the combination of CCL physical and ANN models [56]; (b) an intelligent method, integrating a 3D physical model and a DBN model, to predict the current density of a PEMFC [58].
Coatings 12 01145 g010
Figure 11. MD simulations for the migration behavior of water molecules and ions in PEM; (a) water molecule and ion optimization; (b) final snapshots of FEP-g-SSt-n (n = 14, 7, 4) films obtained by MD simulations [93].
Coatings 12 01145 g011
Figure 12. Free volumes, simulated by MD models, for five systems at 300 and 350K [94].
Coatings 12 01145 g012
Figure 13. Influence of diffusivity and thermal conductivity of GDL gas on temperature and water saturation distribution of PEM; (a) gas/coolant flow direction; (b) temperature distribution of middle and terminal cells for the modified MEA at 3.5 A/cm2; (c) temperature of PEM; (d) water content of PEM; (e) water saturation in cathode GDL; (f) cell voltage [100].
Coatings 12 01145 g013
Figure 14. Optimization and control of PEM for maximum power by combined DL and 3D multiphysics simulation [109].
Coatings 12 01145 g014
Figure 15. Comparison of the polarization curves predicted by ANN-GA and calculated by the 3D multiphysics simulation under the GA-indicated optimal operating condition that leads to the maximum power density (j: current density; V: cell voltage; P: power density; ANN: artificial neural network; GA: genetic algorithm) [110].
Coatings 12 01145 g015
Table 1. Summary of GDL modeling.
Model
Dimension
Area of StudyData Used for Model ValidationReference
One-
dimensional
Fuel cell performanceExperimental dataSpringer et al. [40]
Species migration mechanism and factors affecting fuel cell performanceExperimental dataBernardi et al. [41]
Two-
dimensional
Humidification effectsNoneNguyen et al. [42]
Transport of two phases within the PEM fuel cellNonePasaogullari et al. [43]
Microstructure of two-phase flow in GDL and the influence of surface wettability distributionNoneZhou et al. [30]
Microstructure of MPL-containing carbon fiber-based GDL materialsNoneGöbel et al. [33]
Three-dimensionalEffect of cell assembly pressure on contact resistance between bipolar plate and GDLNoneAtyabi et al. [44]
Liquid water flow from GDLs to the gas channels of the PEM fuel cellExperimental dataBerning et al. [45]
Formation of liquid water with GDLs and CLs of the PEM fuel cellNoneYe et al. [46]
Table 2. Summary of CL modeling.
Model
Dimension
Area of StudyData Used for Model ValidationReference
One-
dimensional
Coarsening and performance monitoring of Pt particlesNoneHung et al. [65]
Two-dimensionalCalculation method of diffusion coefficient of in situ oxygen under different conditionsNoneThosar et al. [66]
Predicting the current density of PEMFCs by combining a 3D physical model with DBN modelNoneLi et al. [58]
A multi-physical model to realize its discretization and morphology design of microstructureNoneBarreiros et al. [55]
Three-dimensionalInfluence of water flooding on performance of PEM fuel cellNoneDawes et al. [67]
Effects of the air velocity and wettabilityExperimental dataHan et al. [68]
Air flow distribution in the PEM fuel stack for two different configurationsNoneMustata et al. [69]
Transport and formation of liquid waterExperimental dataMazumder et al. [70]
Table 3. Summary of PEM modeling.
Model
Dimension
Area of StudyData Used for Model ValidationReference
Two-
dimensional
Effects of heat generation on PEM fuel cell performanceNoneDutta et al. [118]
Microstructure of MPL-containing carbon fiber-based GDL materialsNoneZhou et al. [112]
Three-
dimensional
Performance of multi-cell PEM stack (five single cells)Experimental dataKvesić et al. [119]
Thermal and water management of single PEM fuel cell and multi-cell stacksNoneWöhr et al. [120]
Effects of oxygen transfer resistance and catalyst reduction on performance of Automotive PEM fuel cells at high current densityNoneLi et al. [121]
Deep learning-based method for optimizing a membraneless microfluidic fuel cell performance by combining the artificial neural network and genetic algorithmNoneNguyen et al. [110]
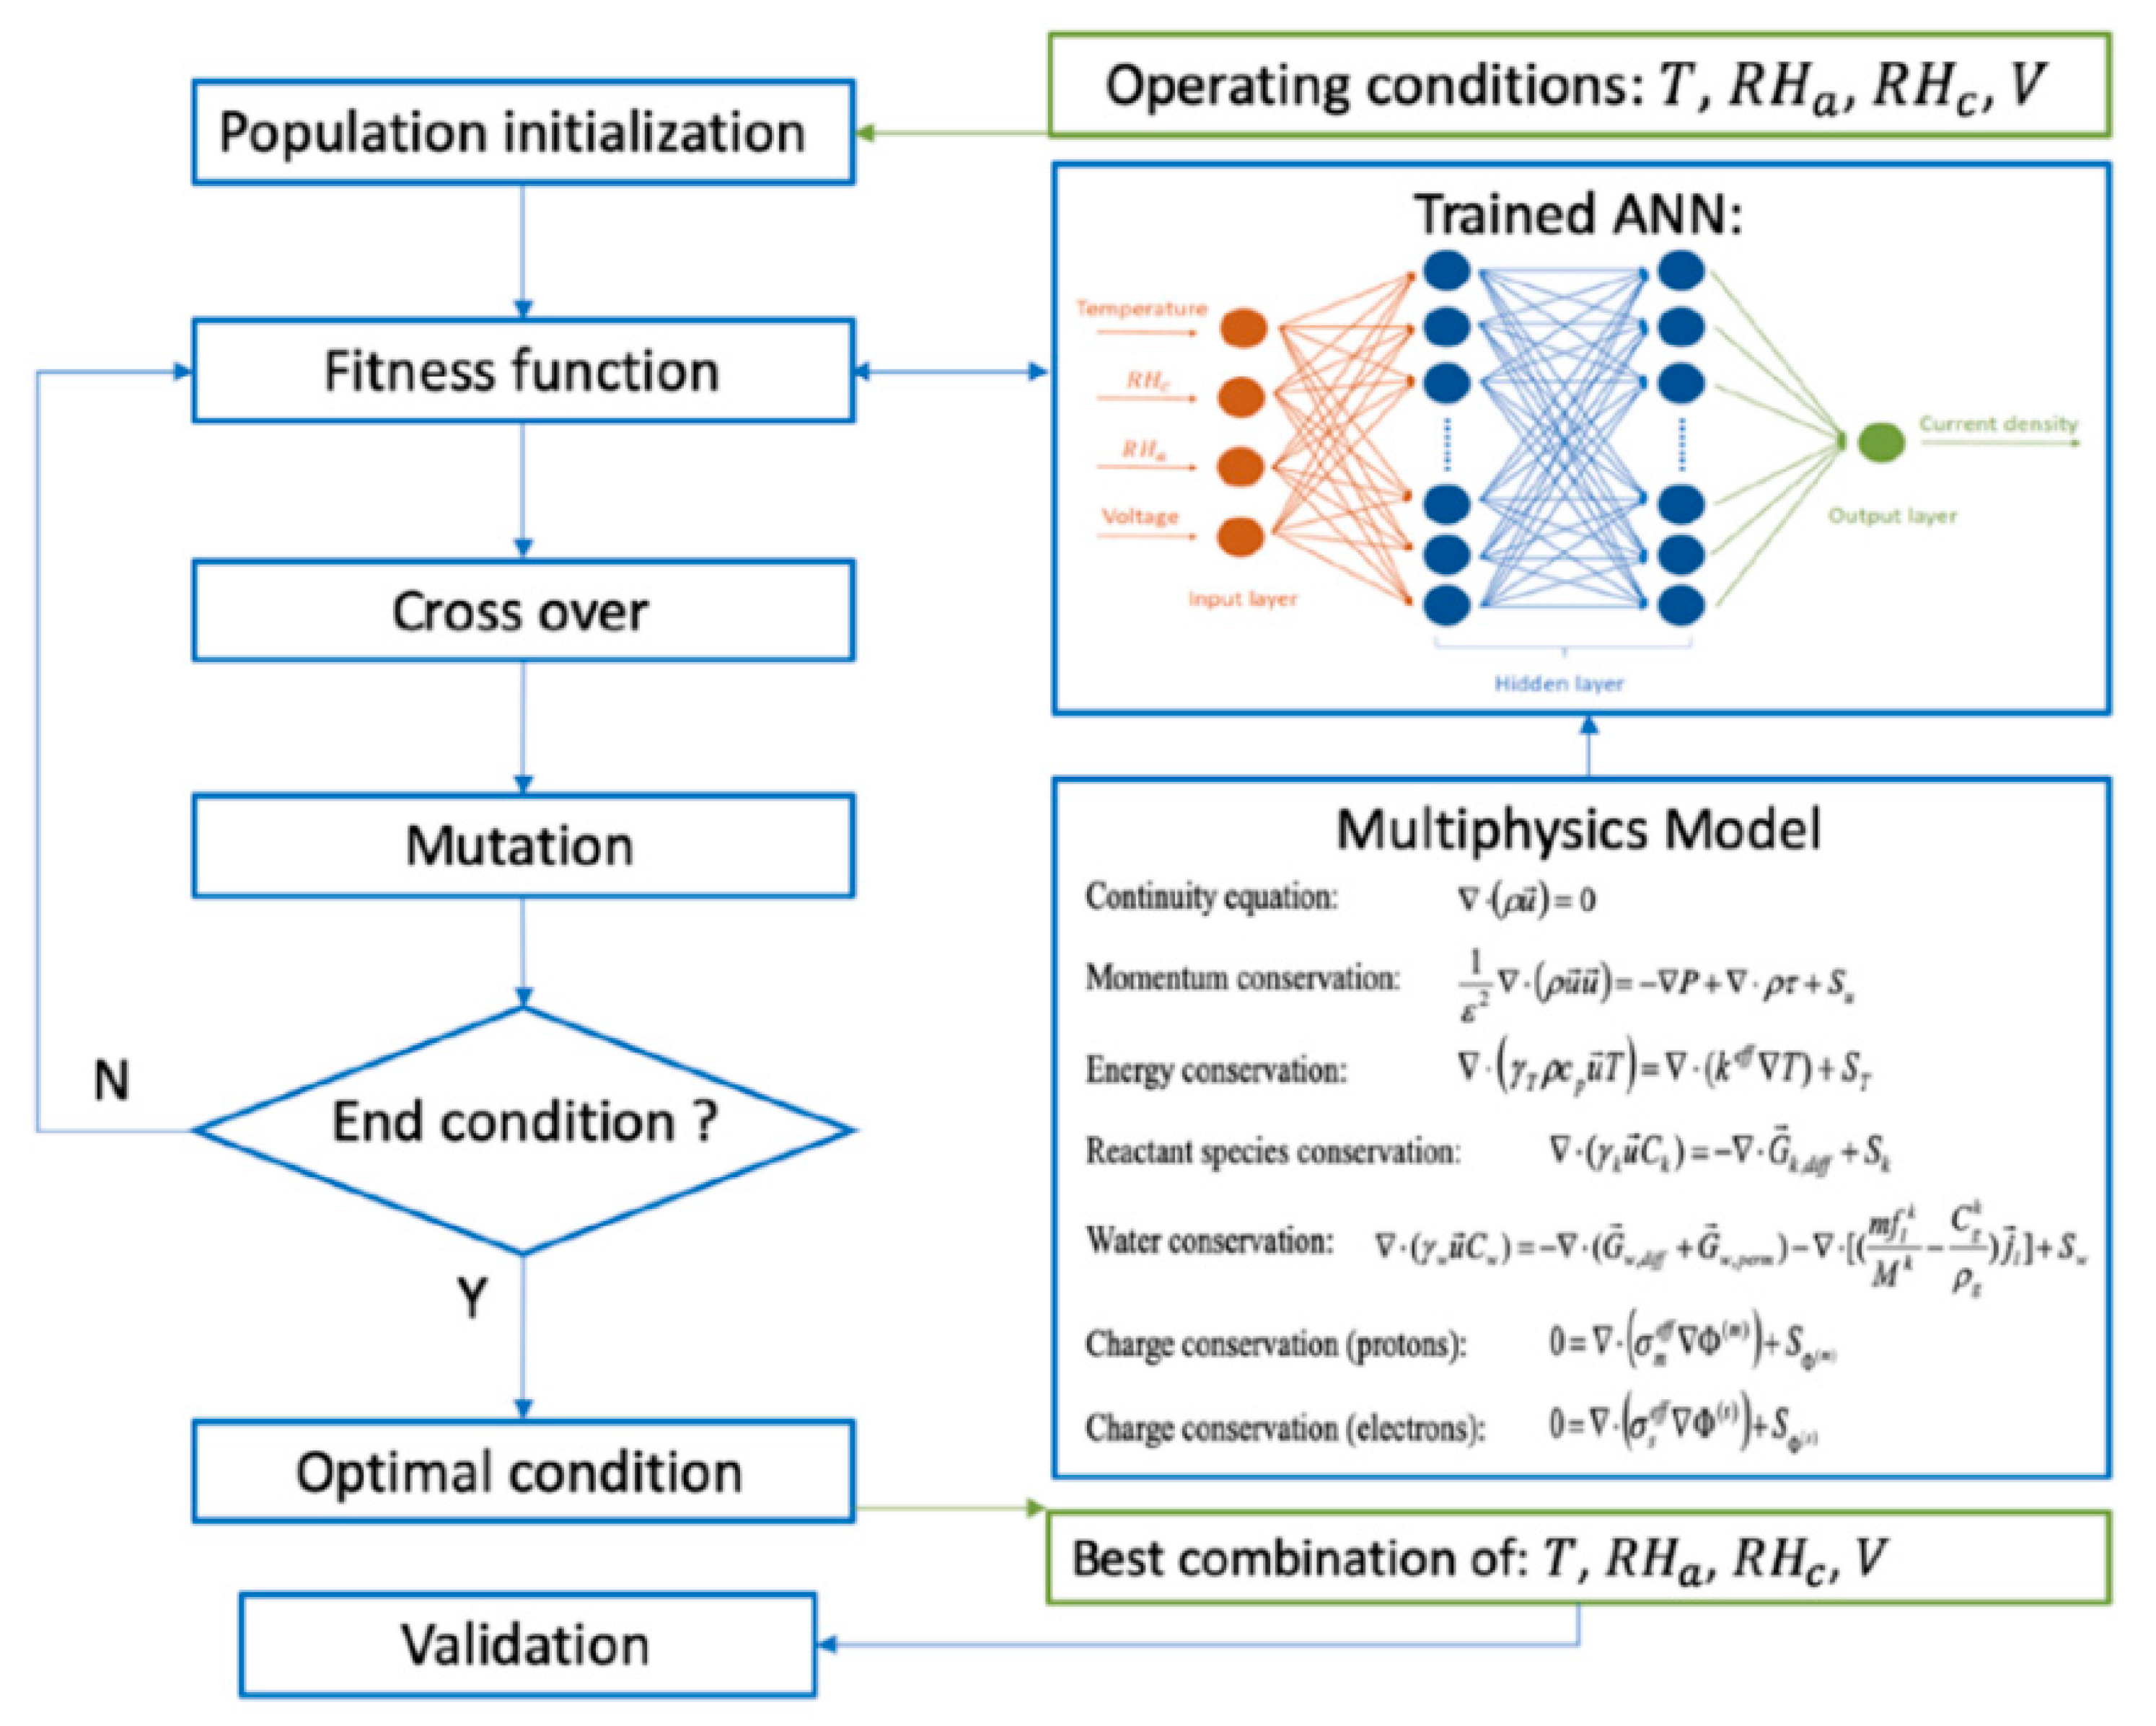
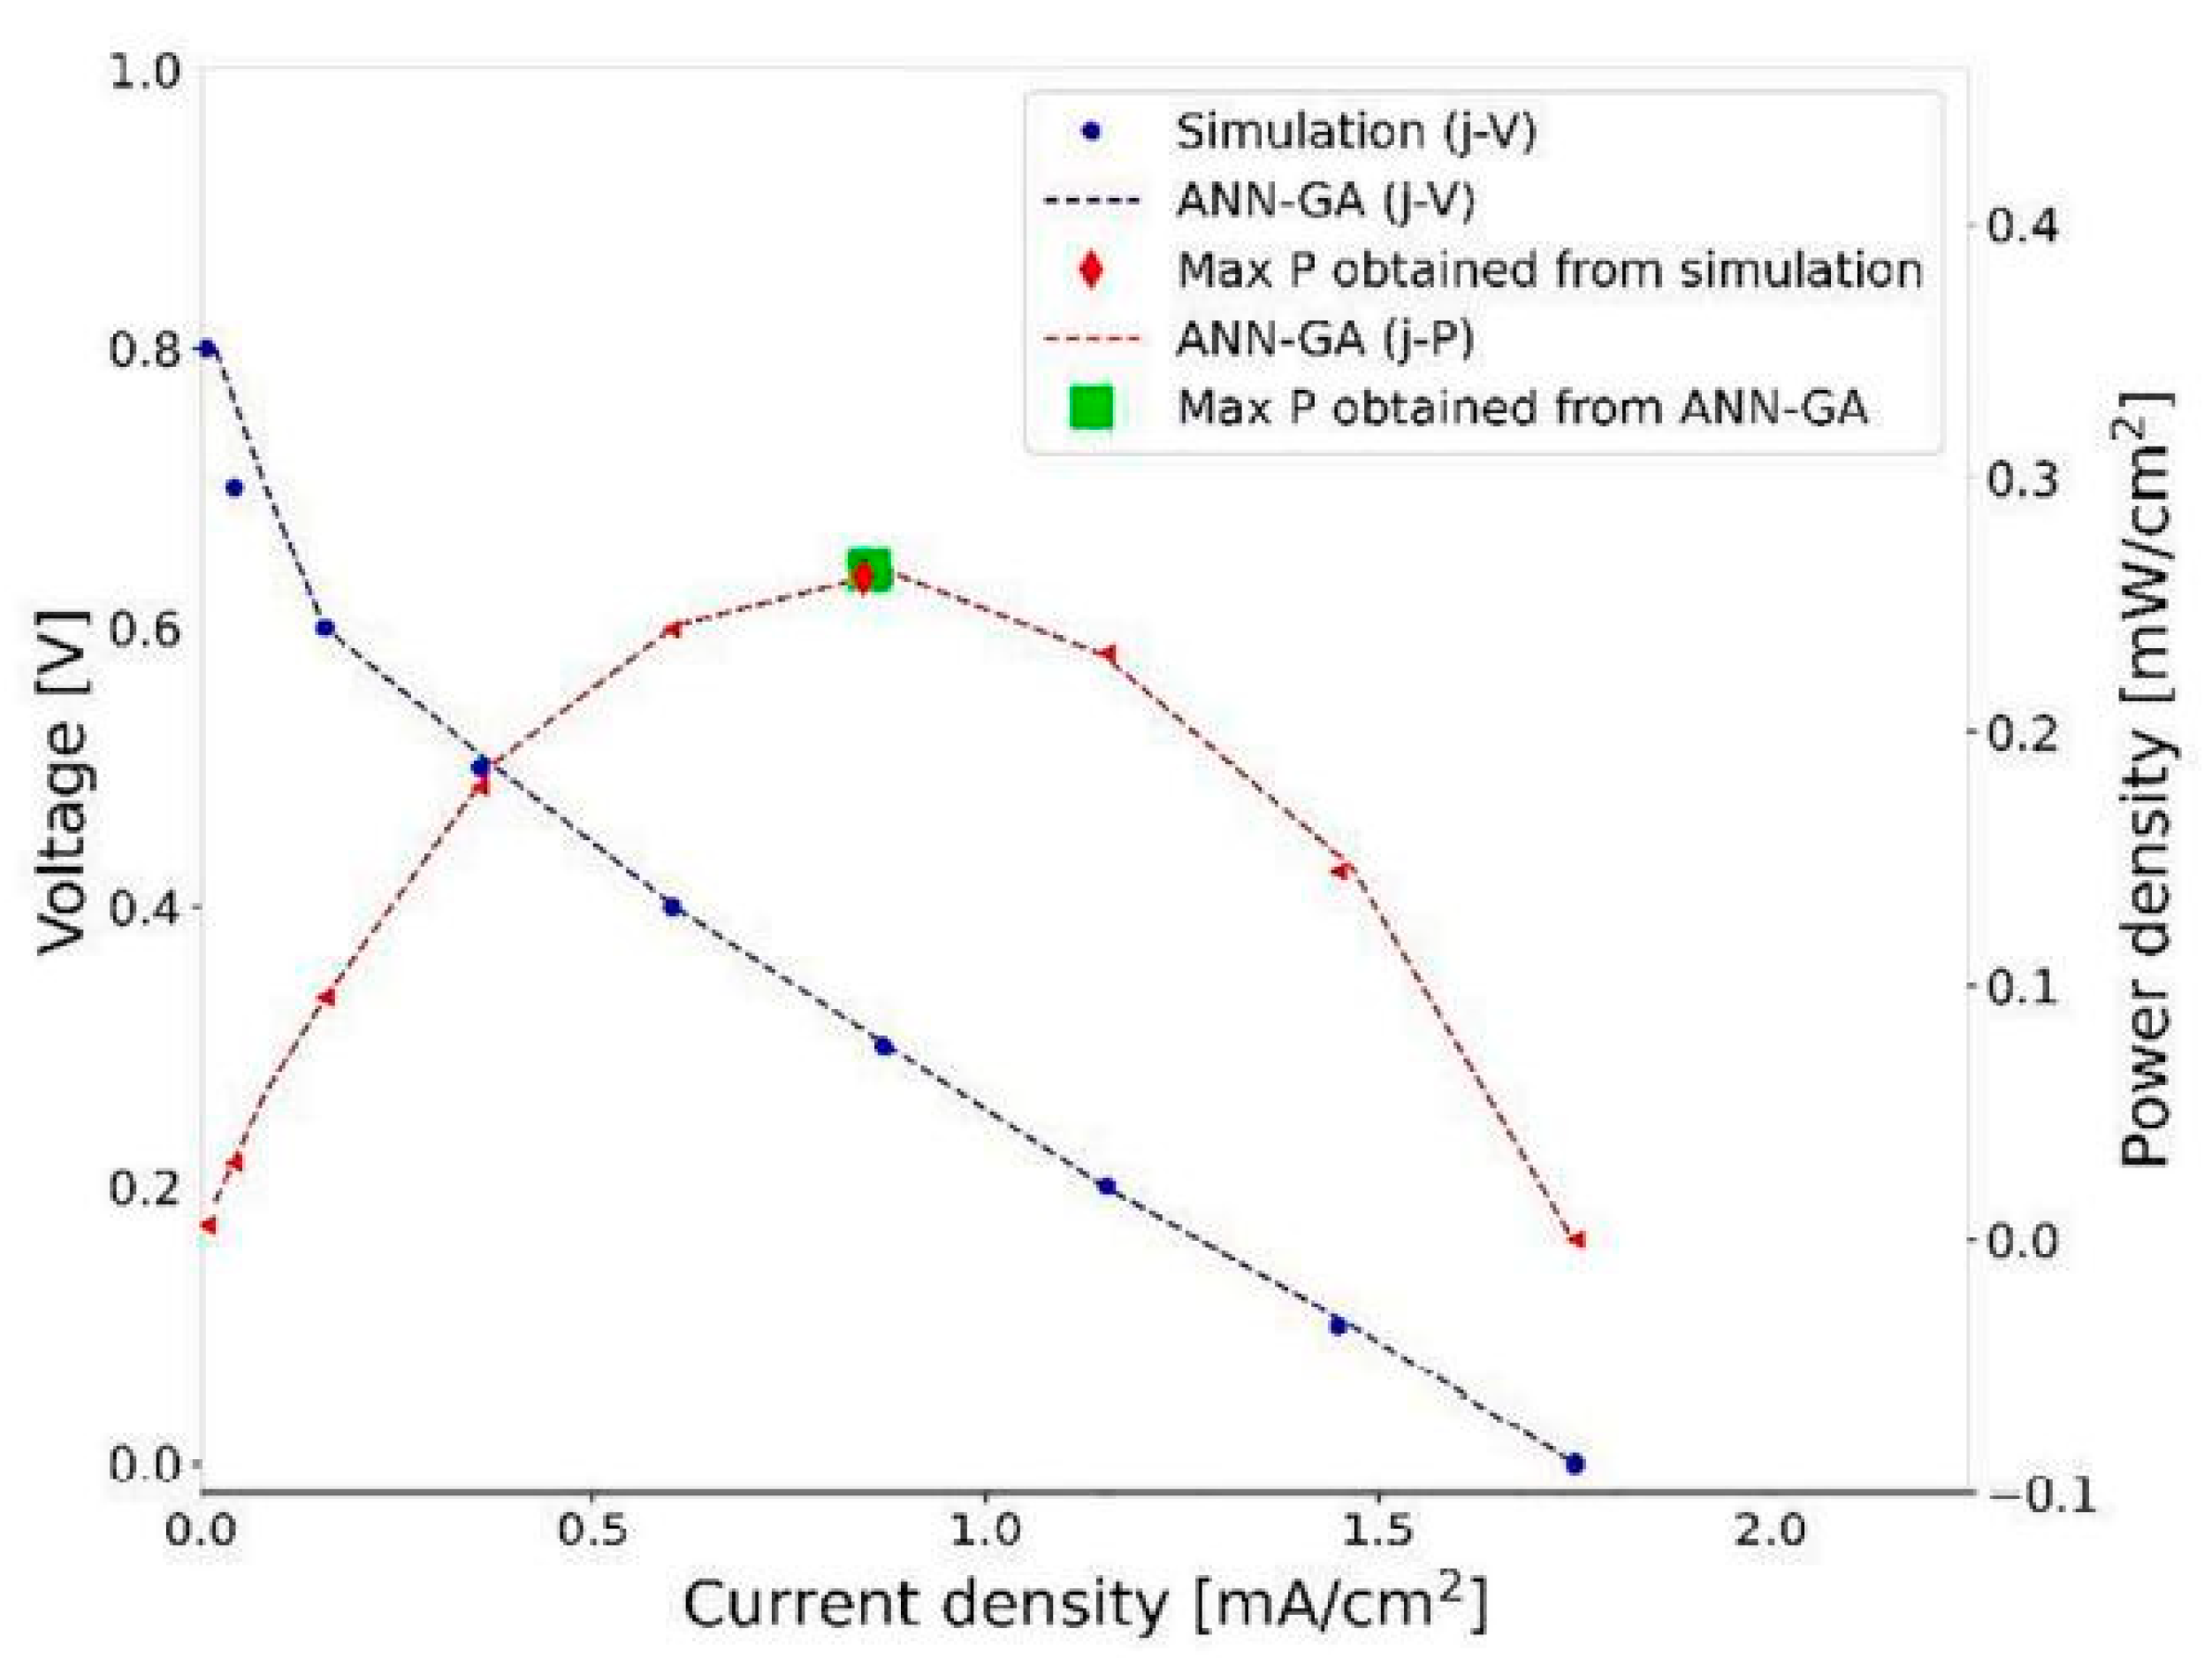
Method combining ANN, genetic algorithm and a 3D multiphysics model to predict the performance of PEM fuel cellsExperimental dataTian et al. [109]
A 3D numerical model was developed to study the influence of different membrane geometries on PEMFC performanceNoneJourdani et al. [99]
Table 4. Comparison of different models of PEMFCs grouped by GDL, CL and PEM.
ProposeModelsBased On
Microstructure Simulation
Integration with MLAdvantagesShortcomings
GDLTwo-dimensional two-phase model [21]; Two-phase flow model [28]NoNoSimple modeling and less calculationLack of GDL material microstructure characterization
Two-phase flow model [30]YesNoConvenient to study the influence of material structure on its performanceComplex modeling
A process-based algorithm [32]; a stochastic model [35]YesNoCould investigate the microscopic properties of materialsMultiple integrating models required to complete
CLA two-dimensional model [37]NoNoEasy to determine the optimal catalyst loading distributionMicrostructure of CL material is not considered.
A multi-physical model [39]YesNoCould be used to design the structural heterogeneityHigh modeling complexity
A physical model with ANN [49]YesYesCan be predicted the CCL performanceMultidisciplinary knowledge involved
PEMMolecular dynamics models [93,94]YesNoTo study details of its morphology, structure, etc.Complex modeling and long calculation time
Multiphysics simulation [99]NoNoTo obtain different membrane geometries on the performance of PEMFCsLack of research on material microstructure
Multiphysics simulation with ML [104]YesYesSuitable for predicting fuel cell performanceInterdisciplinary knowledge required
Publisher’s Note: MDPI stays neutral with regard to jurisdictional claims in published maps and institutional affiliations.

