Article

Effect of Si and P Content on the Si Phase and Solidification Behavior of Al-40Zn-xSi Alloys Using Synchrotron Radiation Real-Time Imaging

1
National Joint Engineering Research Center for Abrasion Control and Molding of Metal Materials, Henan University of Science and Technology, Luoyang 471003, China
2
Longmen Laboratory, Luoyang 471000, China
*
Authors to whom correspondence should be addressed.
These authors contributed equally to this work.
Coatings 2022, 12(8), 1127; https://doi.org/10.3390/coatings12081127
Submission received: 17 July 2022 / Revised: 27 July 2022 / Accepted: 1 August 2022 / Published: 5 August 2022

Abstract

:
In this paper, the effect of Si (1, 3, 5, 6 wt.%) and P (5, 10, 15, 20, 30 ppm) content on the Si phase and solidification behavior of Al-40Zn-xSi alloys are investigated via phase diagram calculation, scanning electron microscopy (SEM) and synchrotron radiation real-time imaging. It is found that Si content has a great influence on the microstructures of Al-40Zn-xSi alloys, and two distinct primary phases were separated by a critical composition at 5.49 wt.% Si in the calculated phase diagram. The microstructure contained not only needle-like eutectic Si, but also blocky primary Si particles in “hypoeutectic” commercial-purity Al-40Zn-5Si alloys. However, the synchrotron radiation real-time imaging experiment showed that the primary phase was α-Al in commercial-purity Al-40Zn-5Si alloys. The effect of P on the Si phase of the high-purity Al-40Zn-5Si alloy was also studied, showing that the number and size of the blocky primary Si particles in the high-purity “hypoeutectic” Al-40Zn-5Si alloys were mainly related to the P impurity content. A small minority of primary Si particles were found during the whole solidification process of the high-purity Al-40Zn-5Si alloy without P impurities, while a large number of primary Si particles were precipitated continuously at the front of α-Al dendrites in the high-purity Al-40Zn-5Si alloy with the addition of 20ppm P, which may have been caused by the fact that AlP particles can act as the heterogeneous nucleation sites of primary Si particles by a small undercooling in P-impurity-containing alloys.

1. Introduction

Al-Zn alloys have excellent wear resistance, casting property, thermal conductivity, and high temperature oxidation resistance, and are widely used in hot dip coatings for steel surfaces. A silicon element is often added into the Al-Zn alloys to enhance the fluidity, thermal stability, corrosion resistance, wear resistance and mechanical properties of Al-Zn alloys [1,2,3,4]. The effect of the Si element on the microstructures of Al-Zn alloys has become a hot research topic [5,6]. J.L. Yang [7] studied the effect of the Si element on the microstructures of Al-40Zn-xSi solder alloys and found that there was a small amount of blocky primary Si in the microstructure in addition to eutectic Si when the Si content was 4%. When the Si content reached 5%, more primary Si segregated and aggregated in the microstructure. However, K. Suzuki [8] found that when the Si content in the Al-40Zn-xSi alloy reached 4%, all the Si phase in the microstructure was eutectic Si without blocky primary Si. It can be seen from the above studies that the influence of Si content on the Si phase in Al-40Zn-xSi alloys is not yet clear; it is possible that the purity of the alloys has not been considered.
P is a common impurity element in aluminum alloys that has a significant effect on the precipitation of Si particles in aluminum alloys [9,10,11]. T.H. Ludwig [11] studied the influence of the P impurity element on the high-purity hypoeutectic Al-7Si alloy and found that the Si phase in the microstructure of the Al-7Si alloy was plate-like eutectic Si when the P element content was 3 ppm. When P element content was more than 5 ppm, blocky silicon particles appeared in the microstructure. Because AlP and the silicon phase have similar lattice structures and close lattice constants, the P element was also the main refiner of primary Si. The modification of eutectic Si was commonly carried out by adding Sr or Na elements [12,13,14,15,16].
Previous studies on the solidification mechanism of the Al-Si alloy or the Al-Si-Zn alloy have often been supported by supplementary experiments, such as thermal analysis or quenching water experiments [17,18,19,20,21]. The above techniques may lead to the loss of some key information in microstructure changes because the Al-Si eutectic reaction is complex [22,23]. Advances in synchrotron radiation microtomography have provided opportunities for the direct observation of in situ processes using X-rays [24,25,26]. Synchrotron radiation can be used to directly observe grain growth, phase precipitation, grain refinement, and the modification of alloys using high-intensity X-rays [27,28,29,30].
The purity of the Al-Zn-Si alloys, especially the P impurity content, has often been overlooked in previous research, leading to different microstructures of Al-Zn-Si alloys with the same Si contents. The effect of P impurity content on the Si phase in high-purity Al-Zn-Si alloys is still unclear and urgently needs to be studied. In this paper, the effect of Si and P content on the Si phase and the solidification behavior of the Al-40Zn-xSi alloy is studied by phase diagram calculation, SEM and synchrotron radiation real-time imaging technology. Moreover, the precipitation mechanism of the Si phase is further analyzed.

2. Materials and Methods

The commercial-purity Al-40Zn-xSi alloys (mass fraction x = 1, 3, 5, 6%) were prepared with industrial aluminum (99.7%), industrial silicon (99.3%) and pure Zn (99.995%). Firstly, a certain percentage of industrial aluminum and industrial silicon was melted in a resistance furnace holding at 750 °C for 30 min. Then, the 0#Zn blocks preheated to 200 °C were added into the melt holding for 15 min. The mechanical stirring was applied to the melt for 2 min before pouring to eliminate gravity segregation. The melt of 660 °C was then poured into a stainless-steel cup (Φ 30 mm × 40 mm) preheated to the same temperature as the melt. Thermocouples and paperless recorders were used to record the melt solidification curve (cooling rate was about 20 °C/min). The remaining melt was poured into a metal mold (Φ 30 mm × 60 mm) preheated to 200 °C. The microstructures of the samples were observed by scanning electron microscopy (SEM) after polishing.
The high-purity Al-40Zn-5Si alloys with different P contents were prepared with high-purity aluminum (99.995%), high-purity silicon (99.999%) and high-purity zinc (99.999%) by using the same smelting method as the Al-40Zn-xSi alloys. After adding high-purity zinc, the different contents of the Al-5P master alloy were added (the content of P in the melt was 5, 10, 15, 20 and 30 ppm), holding for 30 min. Then, the microstructure analysis and solidification curves of high-purity Al-40Zn-5Si alloys were also conducted. The chemical compositions of commercial-purity Al-40Zn-xSi alloys and high-purity Al-40Zn-5Si alloys are shown in Table 1.
The in situ and real-time investigation of the solidification process was carried out at beamline BL13W1 at the Shanghai Synchrotron Radiation Facility (SSRF). Solidifications were performed inside a resistance furnace with two opposite windows for the incident 25 keV monochromatic X-ray beam to pass through. Samples (25 mm × 12 mm and 100 μm thick) for the investigation were cut from the cast ingots and concealed in a container made of two rectangular 200 μm thick alumina ceramic plates. A thin mica sheet with a thickness of 100 μm was also placed between the two ceramic plates to fix the sample as a mold. The samples were melted in the furnace and held at 660 °C for 30 min to homogenize the melt, then cooled continuously at a cooling rate of 3 °C/min under an isothermal condition. In the experiment, the real-time imaging took place in the center of the sample. The transmitted beam was recorded by a CCD-based camera with spatial and temporal resolutions of 3.25 μm and 1 s, respectively, placed 60 cm behind the sample. The CCD camera gave a full field of view corresponding to 6.7 mm × 4.7 mm.

3. Results and Discussion

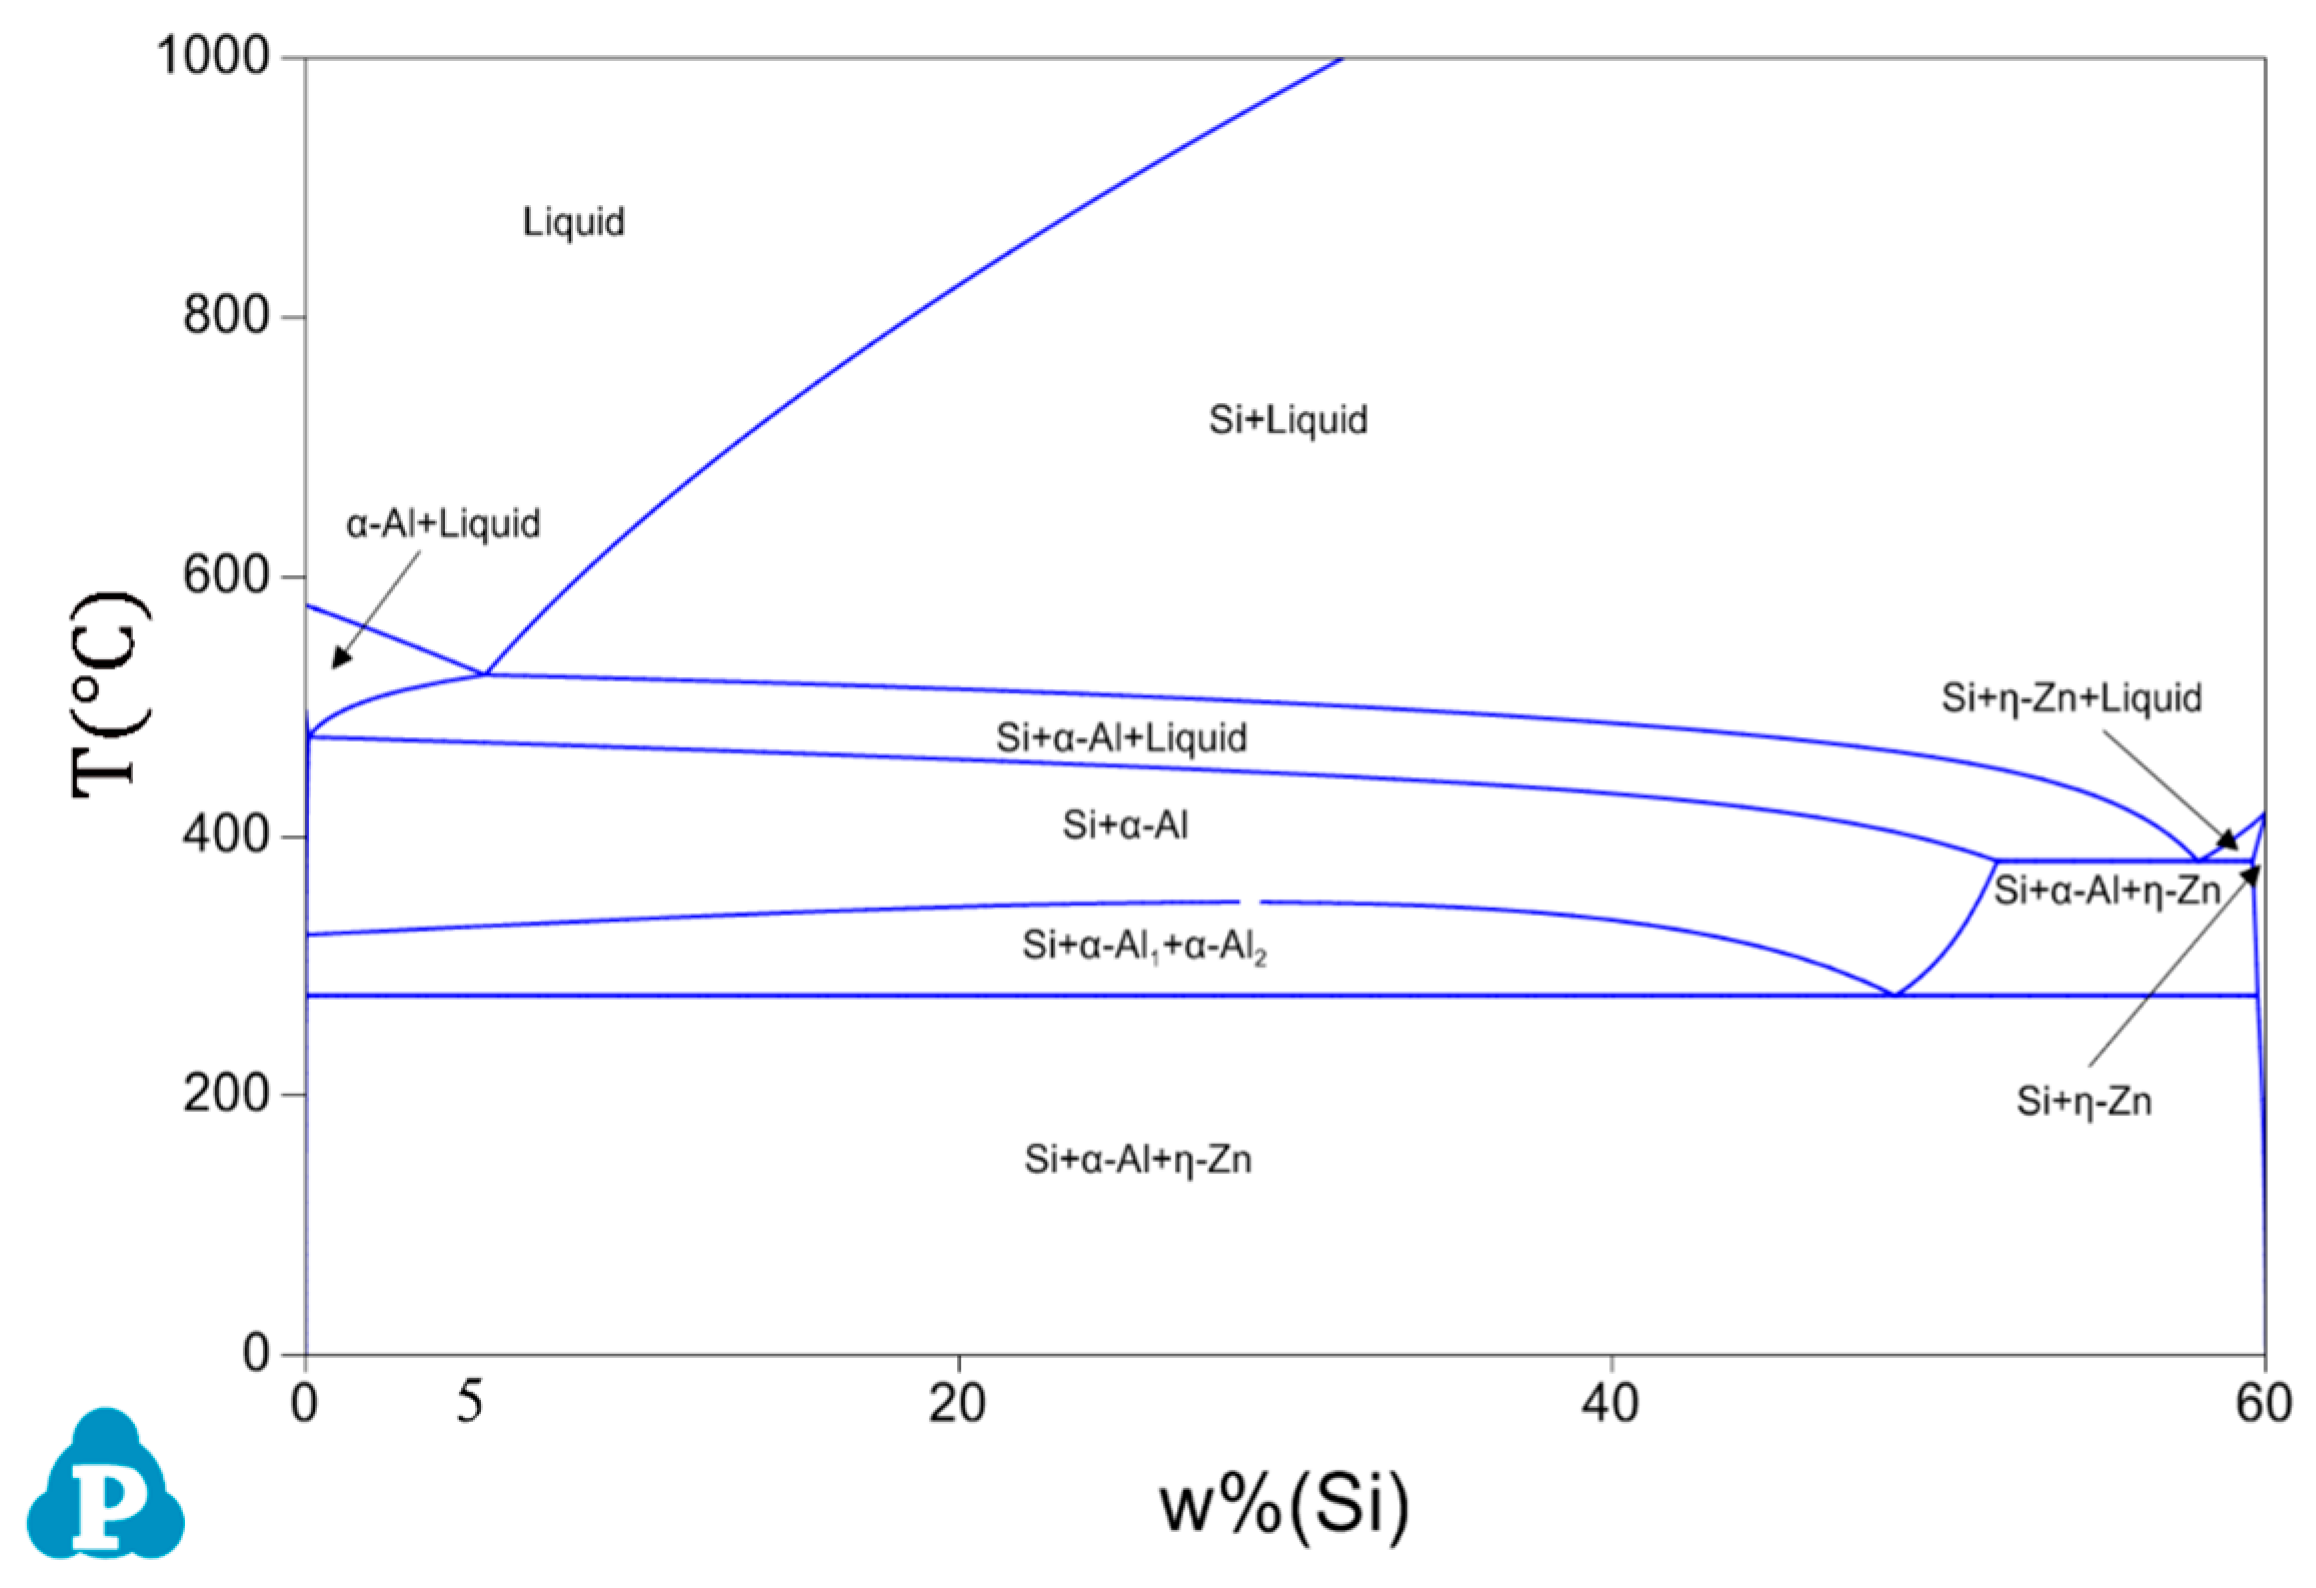
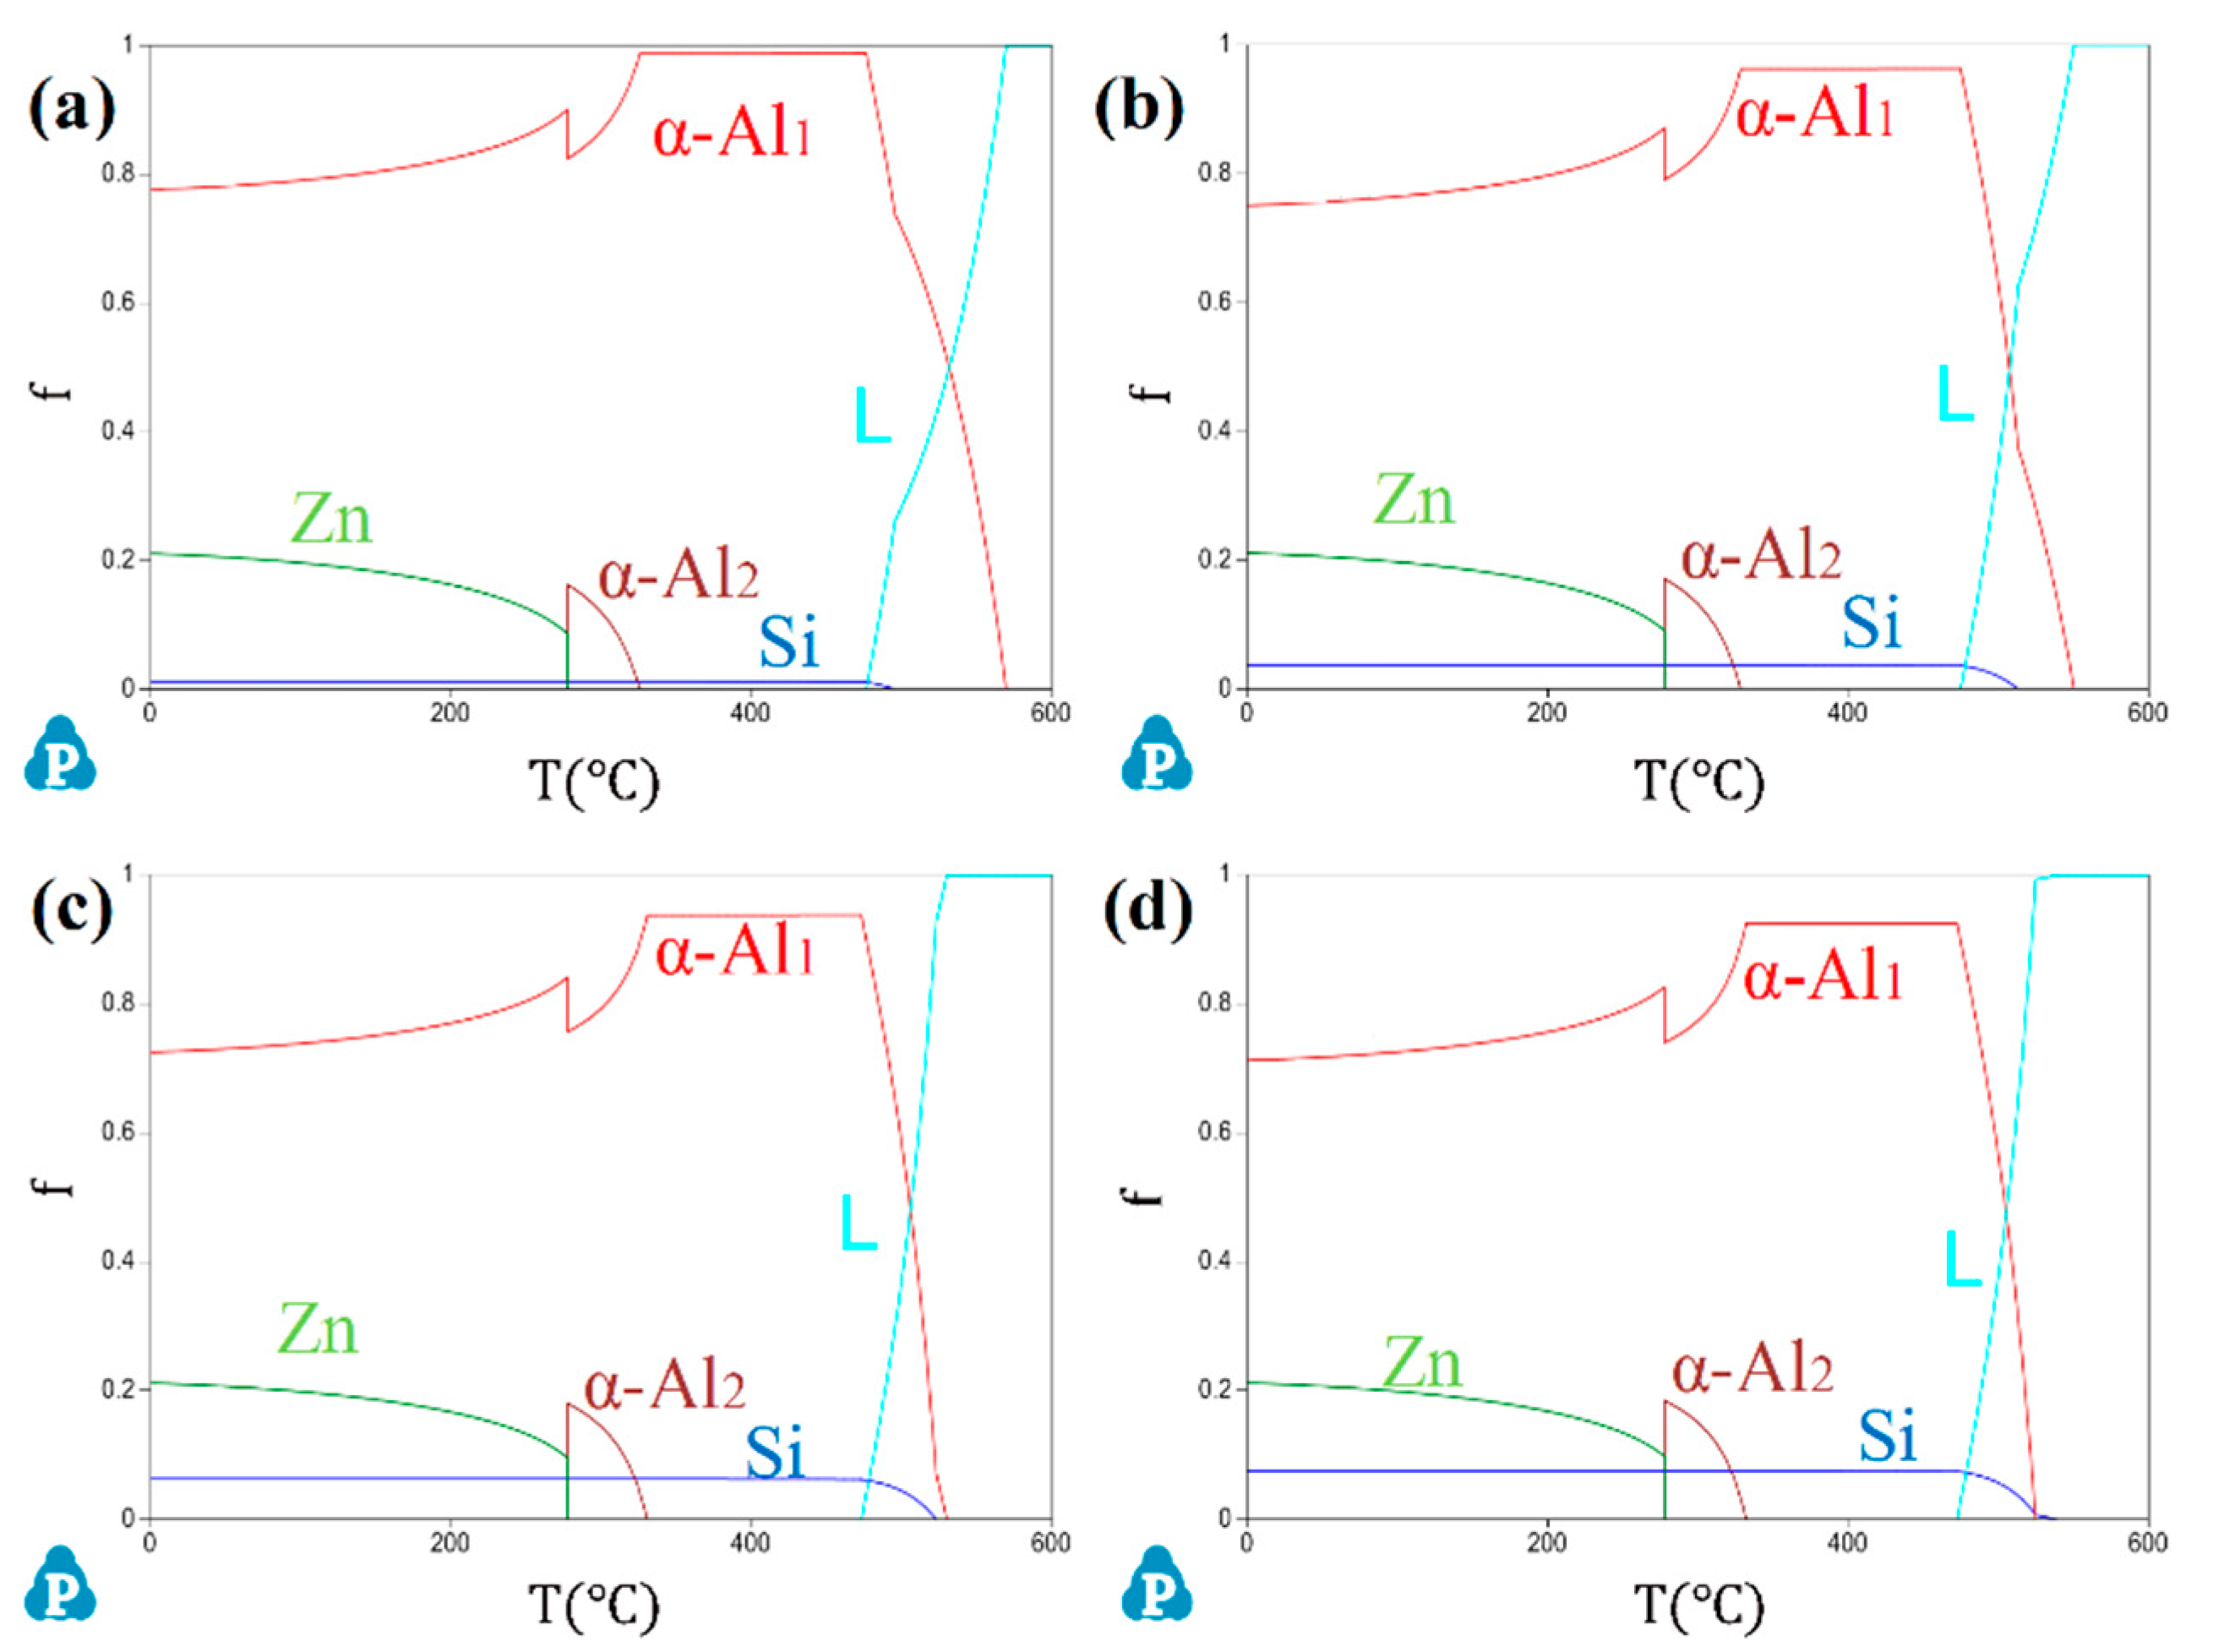
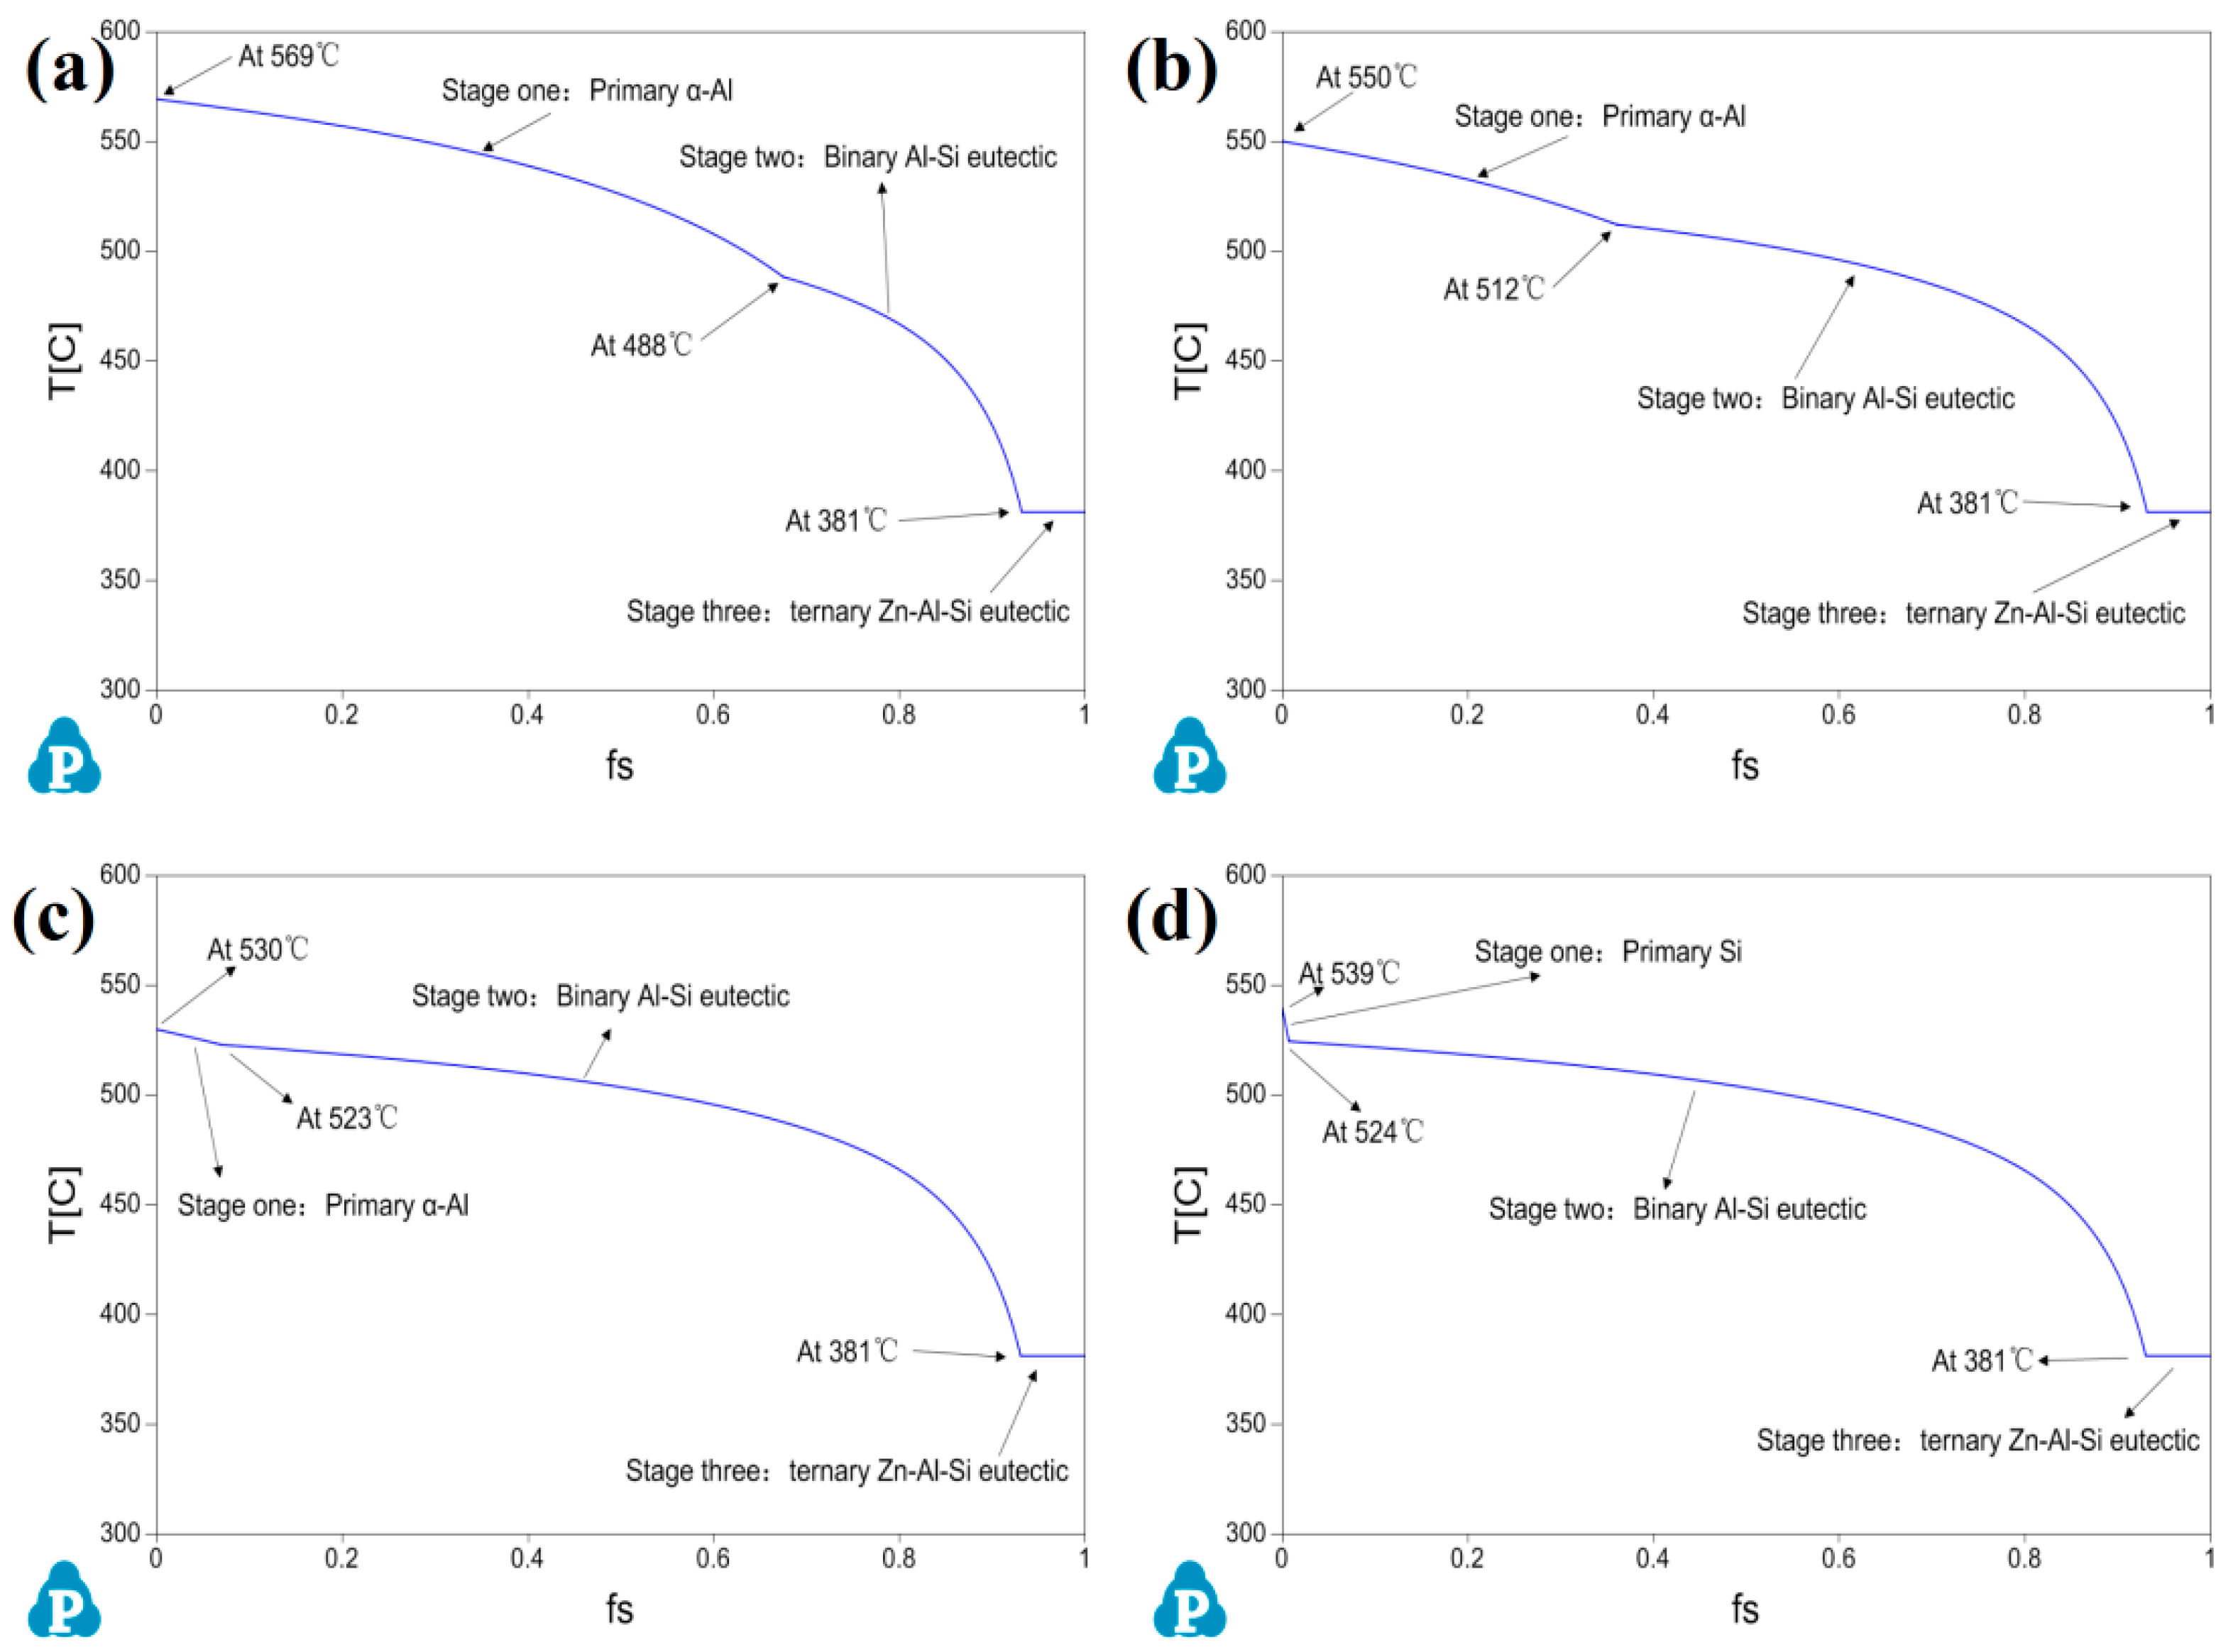
3.1. Phase Diagram and Solidification Process Simulation of Al-40Zn-xSi Alloy

With the rapid development of material mechanics and computer science, the computational phase diagram (CALPHAD) has gradually developed into a discipline. The Pandat (2016 version, CompuTherm LLC, Middleton, WI, USA) is a new generation of multiphase graph computing software using C++ language to study the Windows interface, which can not only calculate the phase diagram and equilibrium phase of the multi-component alloy on the basis of the relative binary phase diagram, but also simulate the solidification process under non-equilibrium solidification.
Figure 1 is the polythermal section diagram of the Al-40Zn-xSi ternary phase diagram calculated by Pandat software (the mass fraction of Zn element was fixed at 40%). It can be seen from Figure 1 that the primary phase was different with the change in silicon content in the Al-40Zn-xSi alloys. When Si (wt.%) was less than 5.49 wt.%, the primary phase was the α-Al phase. When Si (wt.%) was more than 5.49 wt.%, the primary phase was the silicon phase. It is worth noting that the Al-Si eutectic reaction temperature varied with the change in Si content.
Figure 2 is the phase fraction variation (Si, α-Al1, α-Al2, Zn and liquid) with temperature for the Al-40Zn-1Si, Al-40Zn-3Si, Al-40Zn-5Si and Al-40Zn-6Si alloys under equilibrium solidification calculated by Pandat software. It can be seen from Figure 2 that the four phase fractions with variations in temperature for the different Si content alloys were roughly the same. When the silicon content was 1%, 3% and 5%, all the silicon phases were eutectic Si. When the silicon content increased to 6%, the primary phase was no longer α-Al, but a small part of primary silicon. Therefore, it can be inferred that the silicon phase in Al-40Zn-6Si is composed of eutectic Si and primary Si. After the Al-Si eutectic reaction, the α-Al decomposed into α-Al1 and α-Al2, which had the same structure but different compositions. Then, α-Al and η-Zn eutectoid formed by the eutectoid reaction of α-Al2 with decreasing temperature. When cooled from 275 °C to room temperature, the solubility of zinc in α-Al decreased from 31.6% to 1.14%, and the solubility of aluminum in η-Zn decreased from 0.6% to 0.05%.
Due to the rapid cooling rate in the actual casting, the solidification process deviated from the equilibrium condition and non-equilibrium solidification occurred. The Scheil Mode of Pandat software can be used to calculate the solidification process of multi-component alloys under non-equilibrium conditions. In contrast to equilibrium solidification, scheil solidification assumes that no diffusion occurs in the solid phase and the liquid phase is homogeneous (infinitely diffused liquid). There is local equilibrium at the solid–liquid interface. Figure 3 shows the change in solid-phase fraction in Al-40Zn-xSi alloys with temperature during non-equilibrium solidification calculated by Pandat software. It can be seen from Figure 3a–c that with the increase in silicon content from 1% to 5%, the reaction temperature of primary α-Al dropped from 569 to 530 °C and the Al-Si eutectic reaction temperature rose from 488 to 523 °C. Figure 3d shows that when the Si content increased to 6%, the primary phase became silicon and the reaction temperature was 539 °C. Compared with the Al-40Zn-5Si alloy, the temperature change in the Al-Si eutectic reaction was not very large. The obvious difference from the equilibrium solidification is that the remaining melts (94.97% Zn, 4.97% Al, 0.06% Si) after the Al-Si eutectic reaction of the four alloys all underwent Zn-Al-Si ternary eutectic reactions at 381 °C, and eutectics of α-Al (82.8% Zn), η-Zn (1% Al) and Si were then formed. Finally, the eutectoid reaction of α-Al occurred at 275 °C to complete the solidification of the alloy.

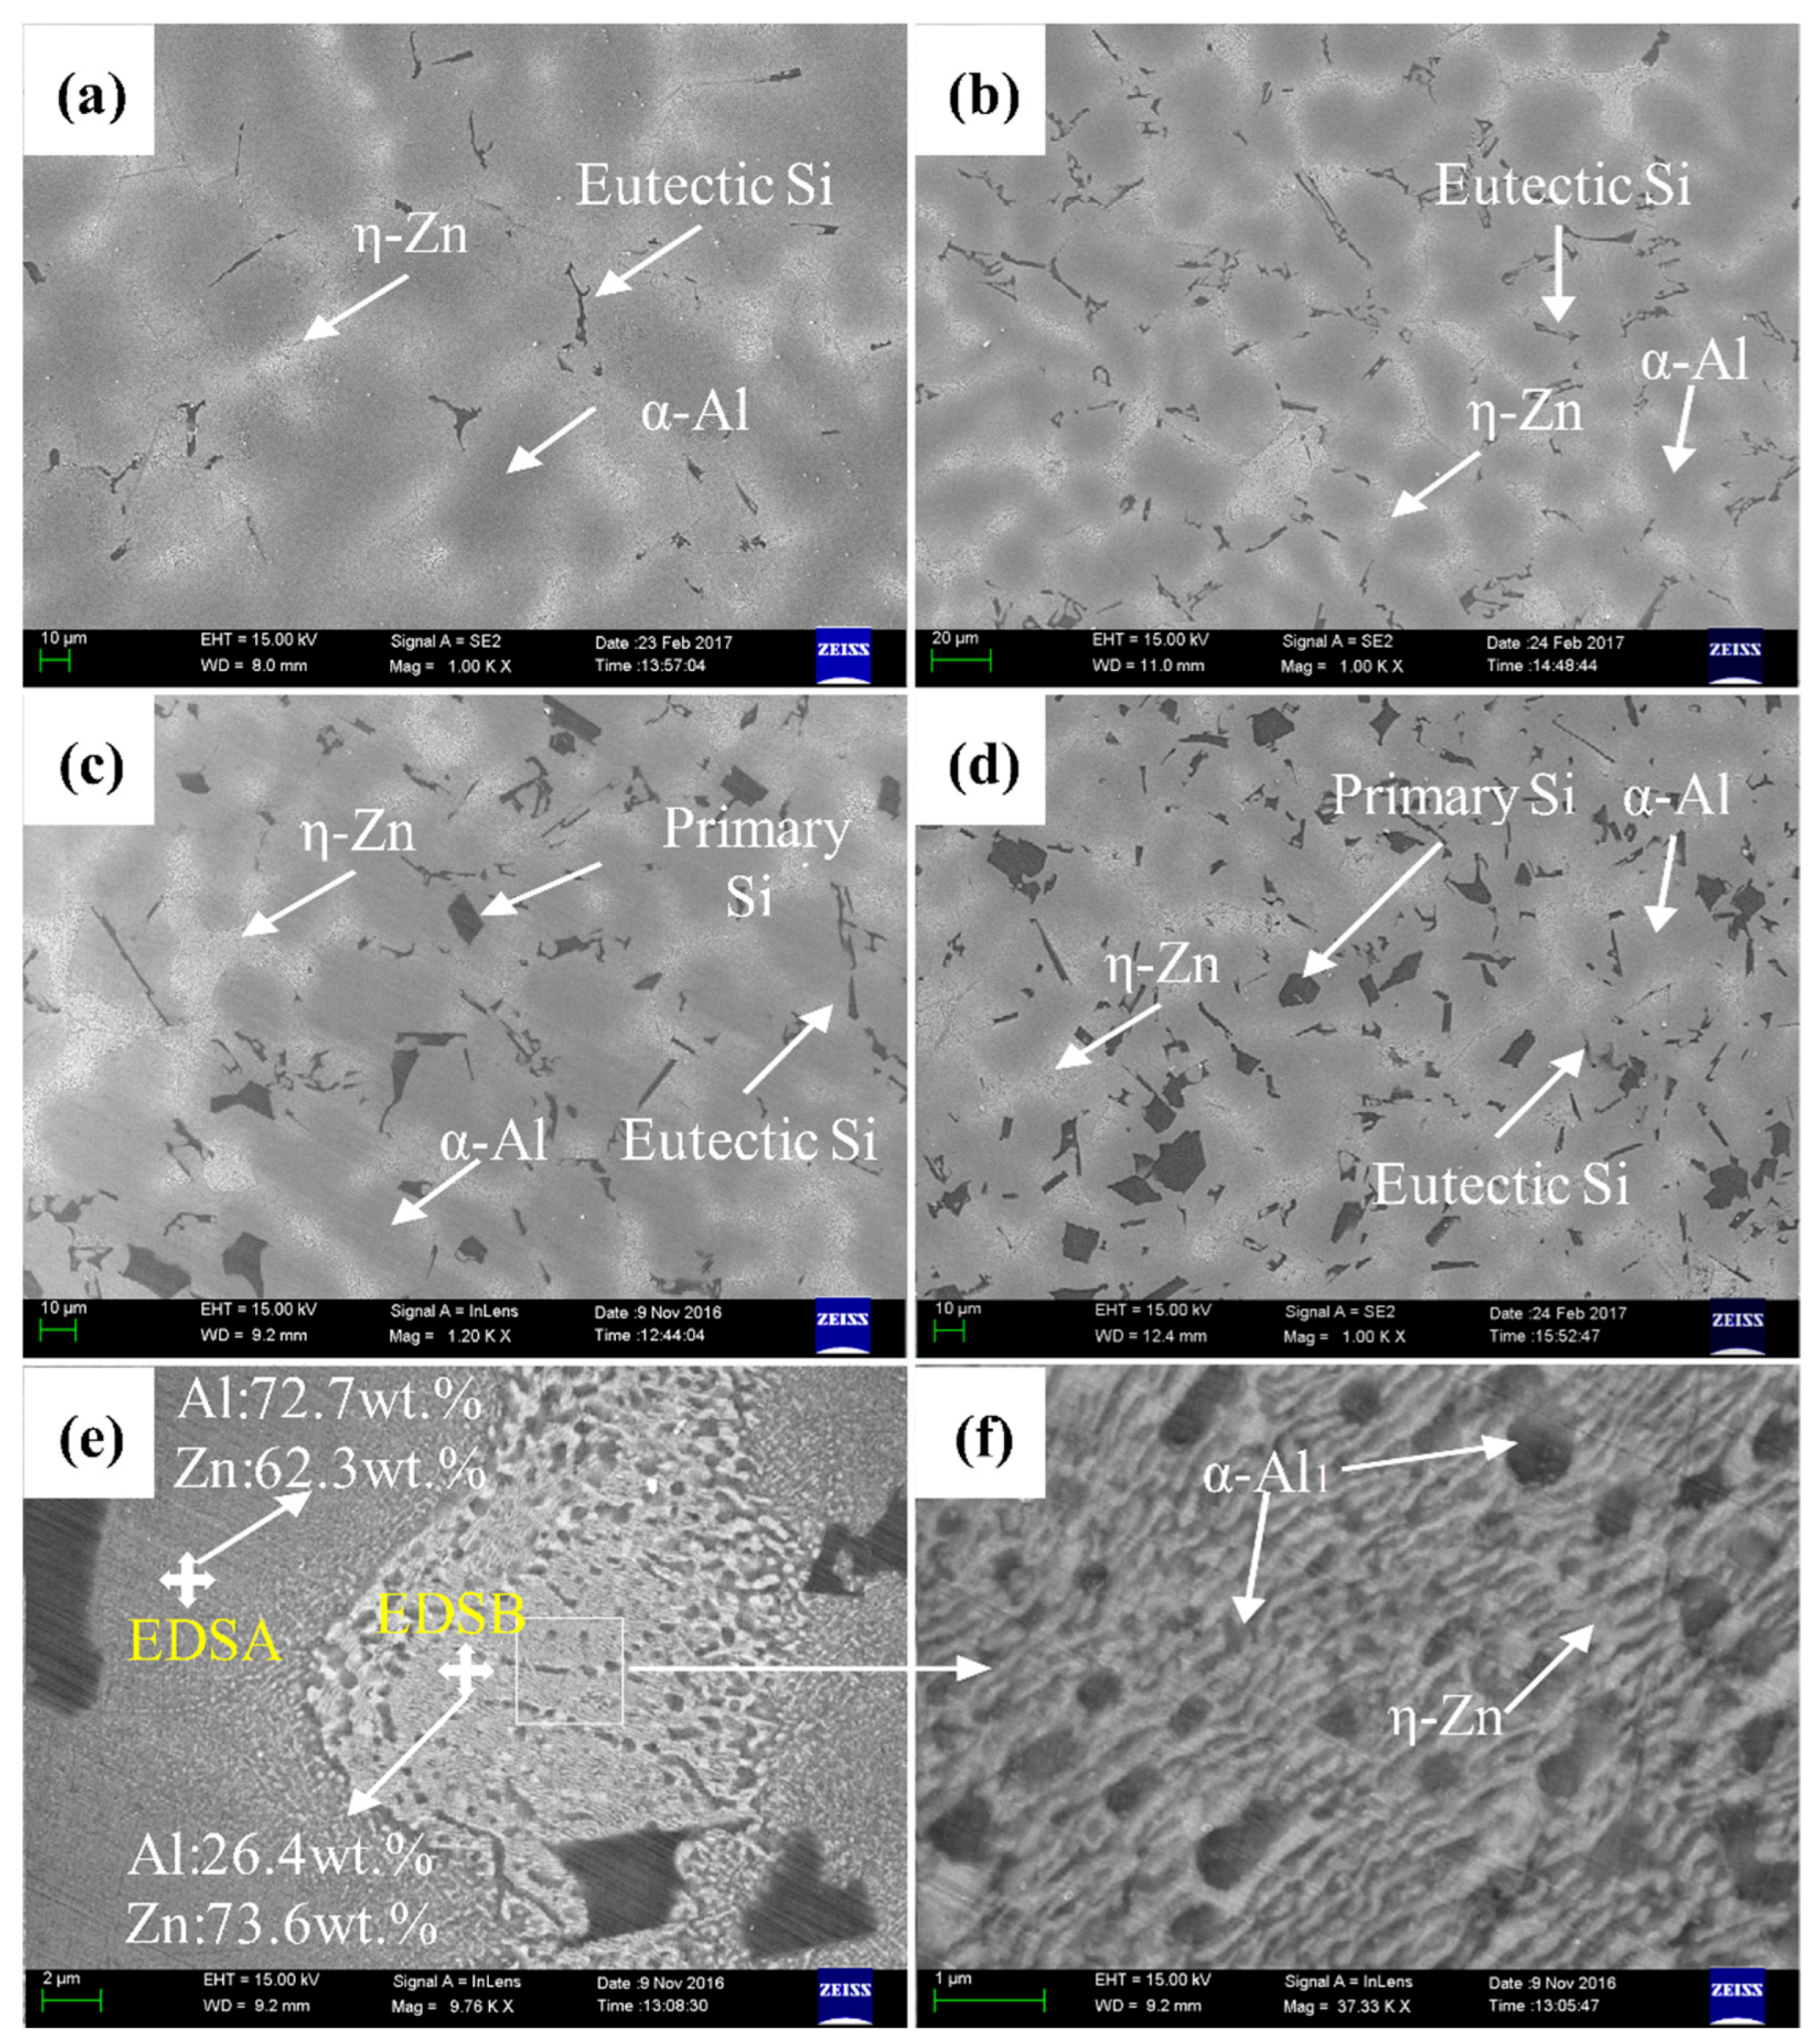
3.2. Microstructure of Commercial-Purity Al-40Zn-xSi Alloy

Figure 4 shows SEM images of the microstructures of the commercial-purity Al-40Zn-1Si, Al-40Zn-3Si, Al-40Zn-5Si and Al-40Zn-6Si alloys. It can be found that the silicon content in the alloys had a great influence on the microstructures of the commercial-purity Al-40Zn-xSi alloys. When Si content was 1% and 3%, only needle-like eutectic Si existed, as shown in Figure 4a,b. Therefore, it can be concluded that the primary phases of these two alloys were α-Al, which is consistent with the simulation results of Pandat software. However, as shown in Figure 4c, when the Si content increased to 5%, the microstructure contained not only needle-like eutectic Si, but also blocky primary Si particles. When Si content continued to increase to 6%, the number of blocky primary Si particles further increased, as shown in Figure 4d. Because the microstructures of these two alloys also contained α-Al dendrites, it was difficult to infer whether the primary phase was α-Al or silicon and whether the solidification of these two alloys was consistent with the simulation results of Pandat software. However, it is worth mentioning that the Zn-Al-Si ternary eutectic was found in the α-Al dendrites of the four alloys regardless of the Si content, which is consistent with the simulation results of non-equilibrium solidification by Pandat software. Figure 4e shows an SEM image of the ternary eutectic microstructure of the Al-40Zn-5Si alloy, and shows that the Zn content in the ternary eutectic microstructure was very high. By further increasing the magnification, it can be found that the eutectic was composed of α-Al and η-Zn eutectoid sheets, as shown in Figure 4f.
Figure 5a shows the cooling curves of Al-40Zn-1Si, Al-40Zn-3Si, Al-40Zn-5Si and Al-40Zn-6Si alloys during solidification. Although Zn-Al-Si ternary eutectic reactions and α-Al eutectoid reactions did occur during the solidification process, no platforms for the reactions were found in the cooling curve. In fact, the cooling curve was the result of the balance between reaction heat generation and melt heat dissipation. It can be seen from the simulation results that the melt of the Zn-Al-Si ternary eutectic and α-Al eutectoid reactions in the alloy were very small in Figure 2 and Figure 3, so the heat generated by the reactions was very small. When the melt heat dissipation rate was much greater than the reaction heat generation rate, the reaction was difficult to be reflected in the cooling curve. Figure 5b shows the enlarged cooling curve of the Al-Si eutectic reaction in Figure 5a. It can be seen that when Si content was 1% and 3%, the precipitation temperature of primary α-Al was consistent with the results simulated by Pandat software. However, the actual Al-Si eutectic reaction temperature (498 and 523 °C) was about 10 °C higher than that calculated by the software (488 and 512 °C). When Si content was 5%, it was difficult to distinguish the precipitation of the primary phase and the Al-Si eutectic reaction from the cooling curve because they were very close. When the Si content increased to 6%, it was found that the primary phase became silicon and the actual precipitation temperature of primary Si (558 °C) and the Al-Si eutectic reaction temperature (530 °C) were higher than those simulated by Pandat software (539 and 524 °C).

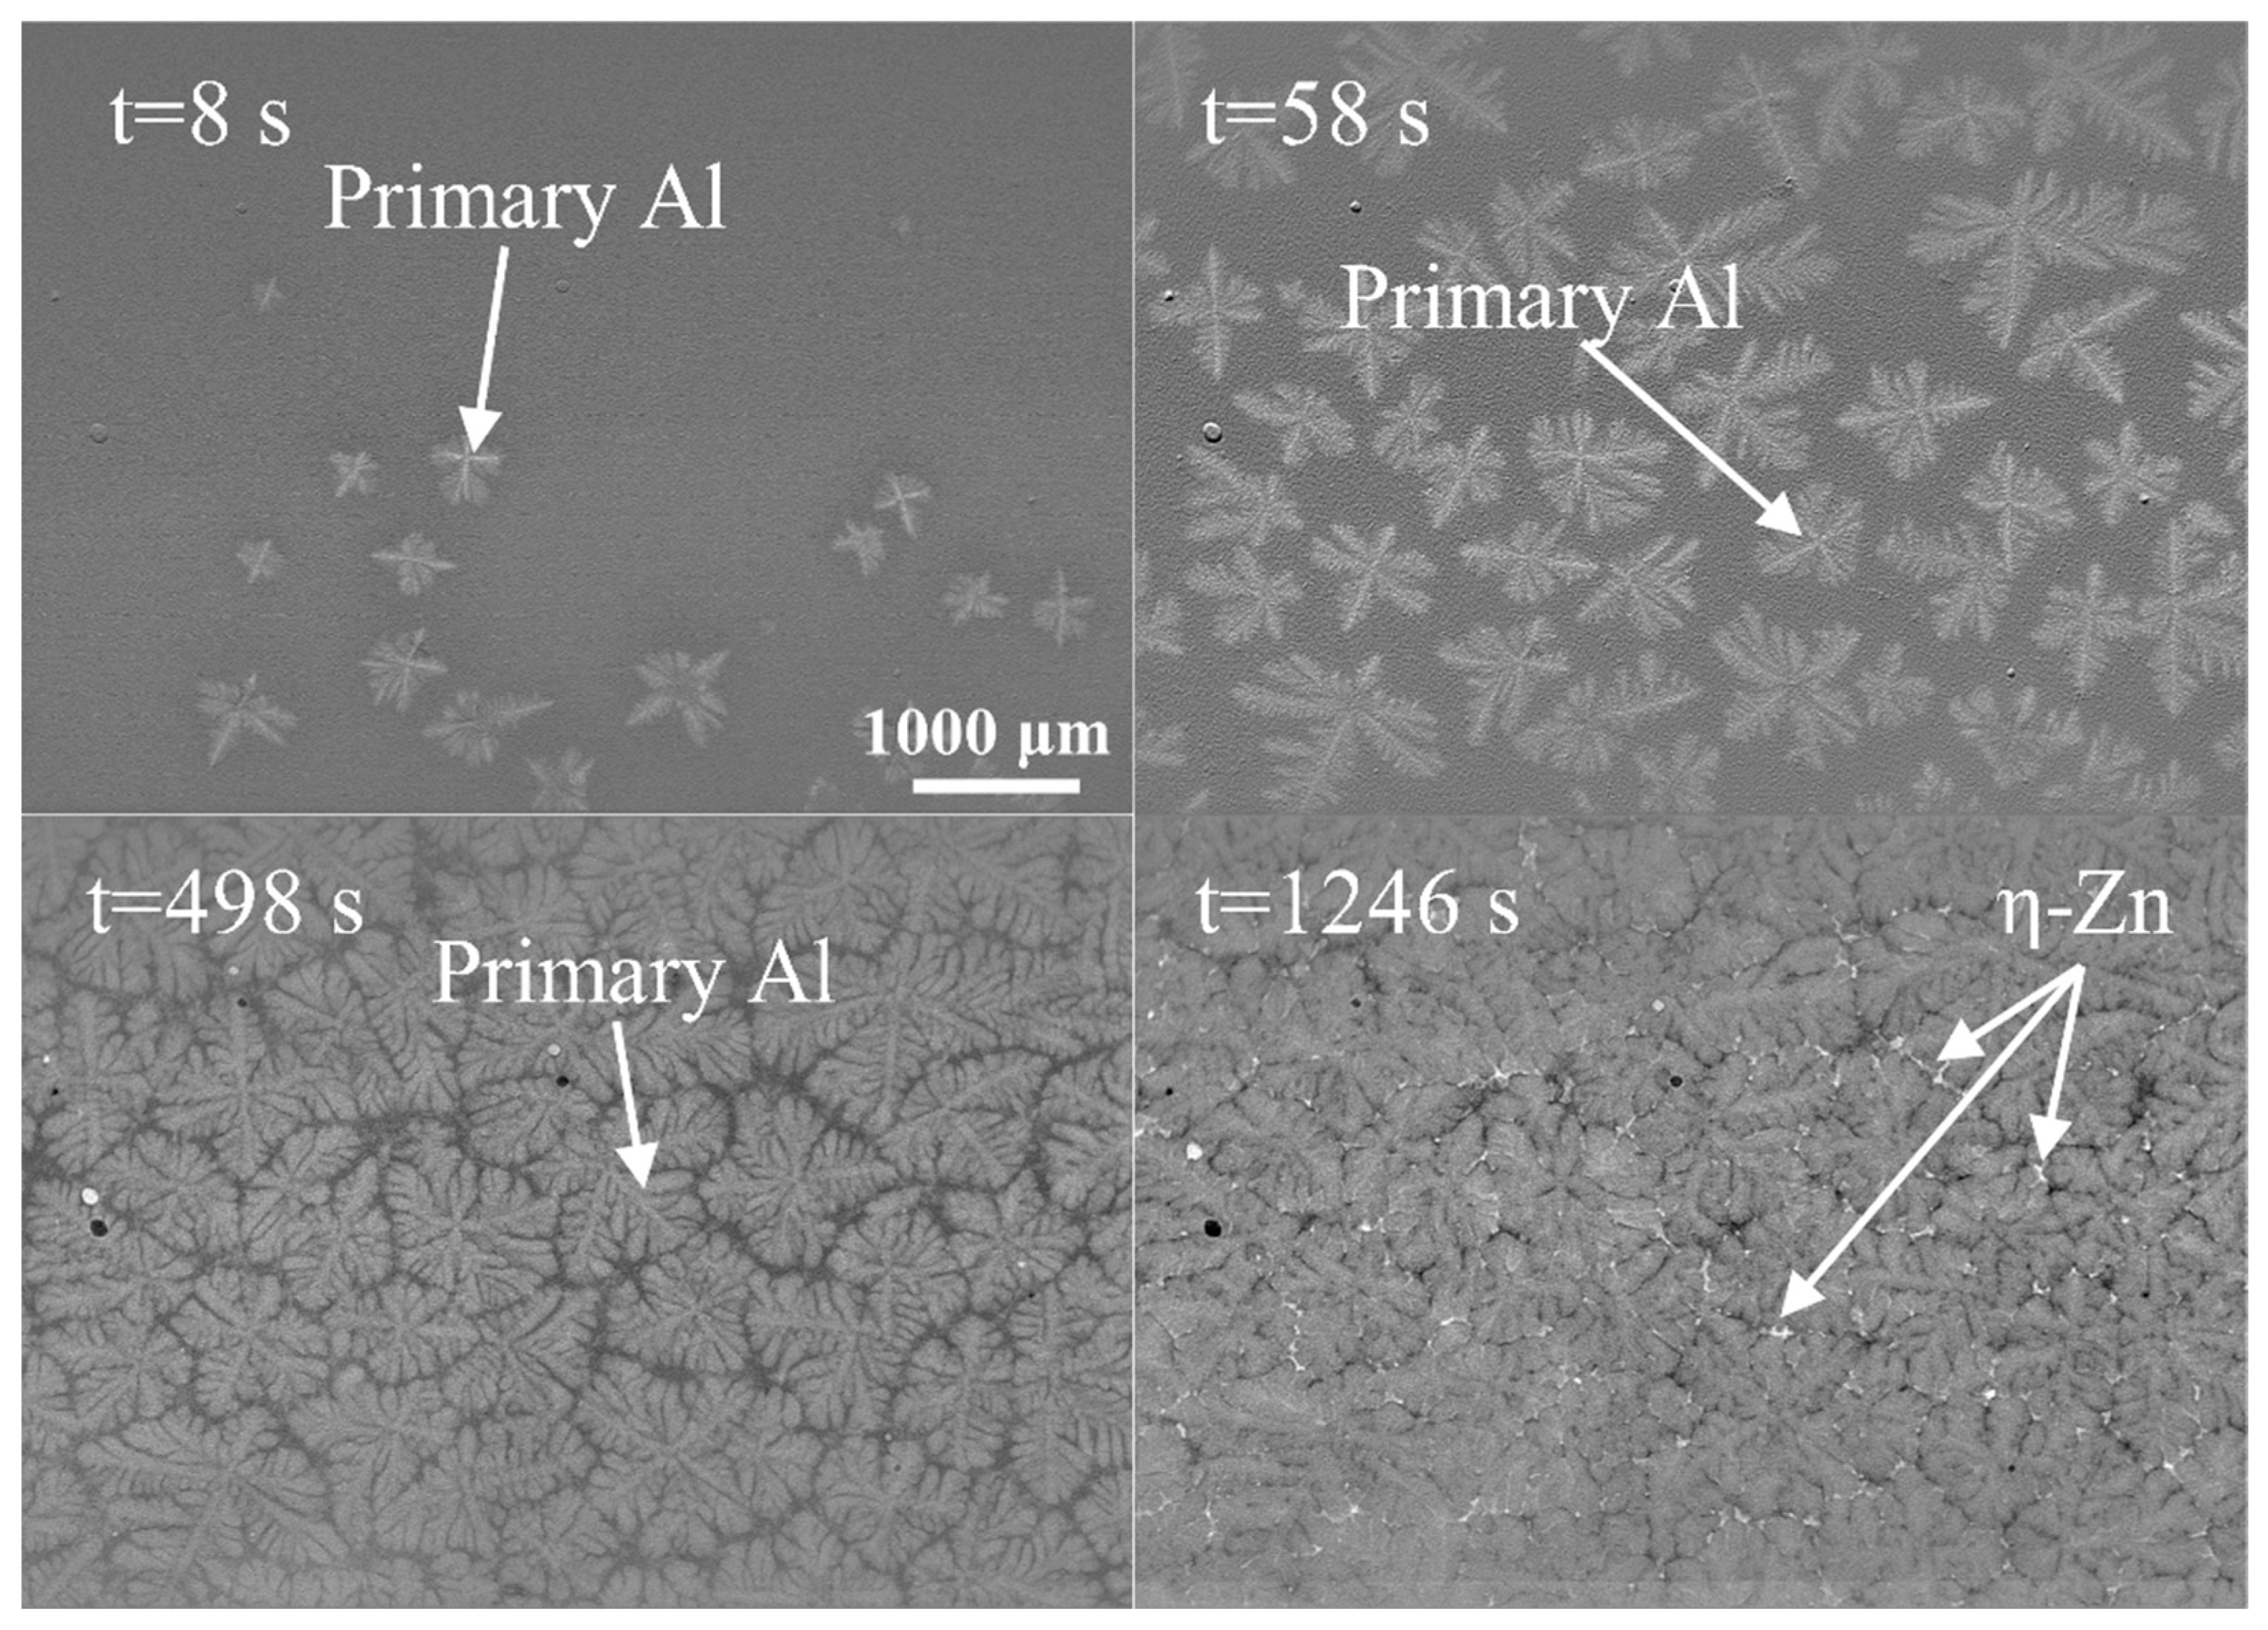
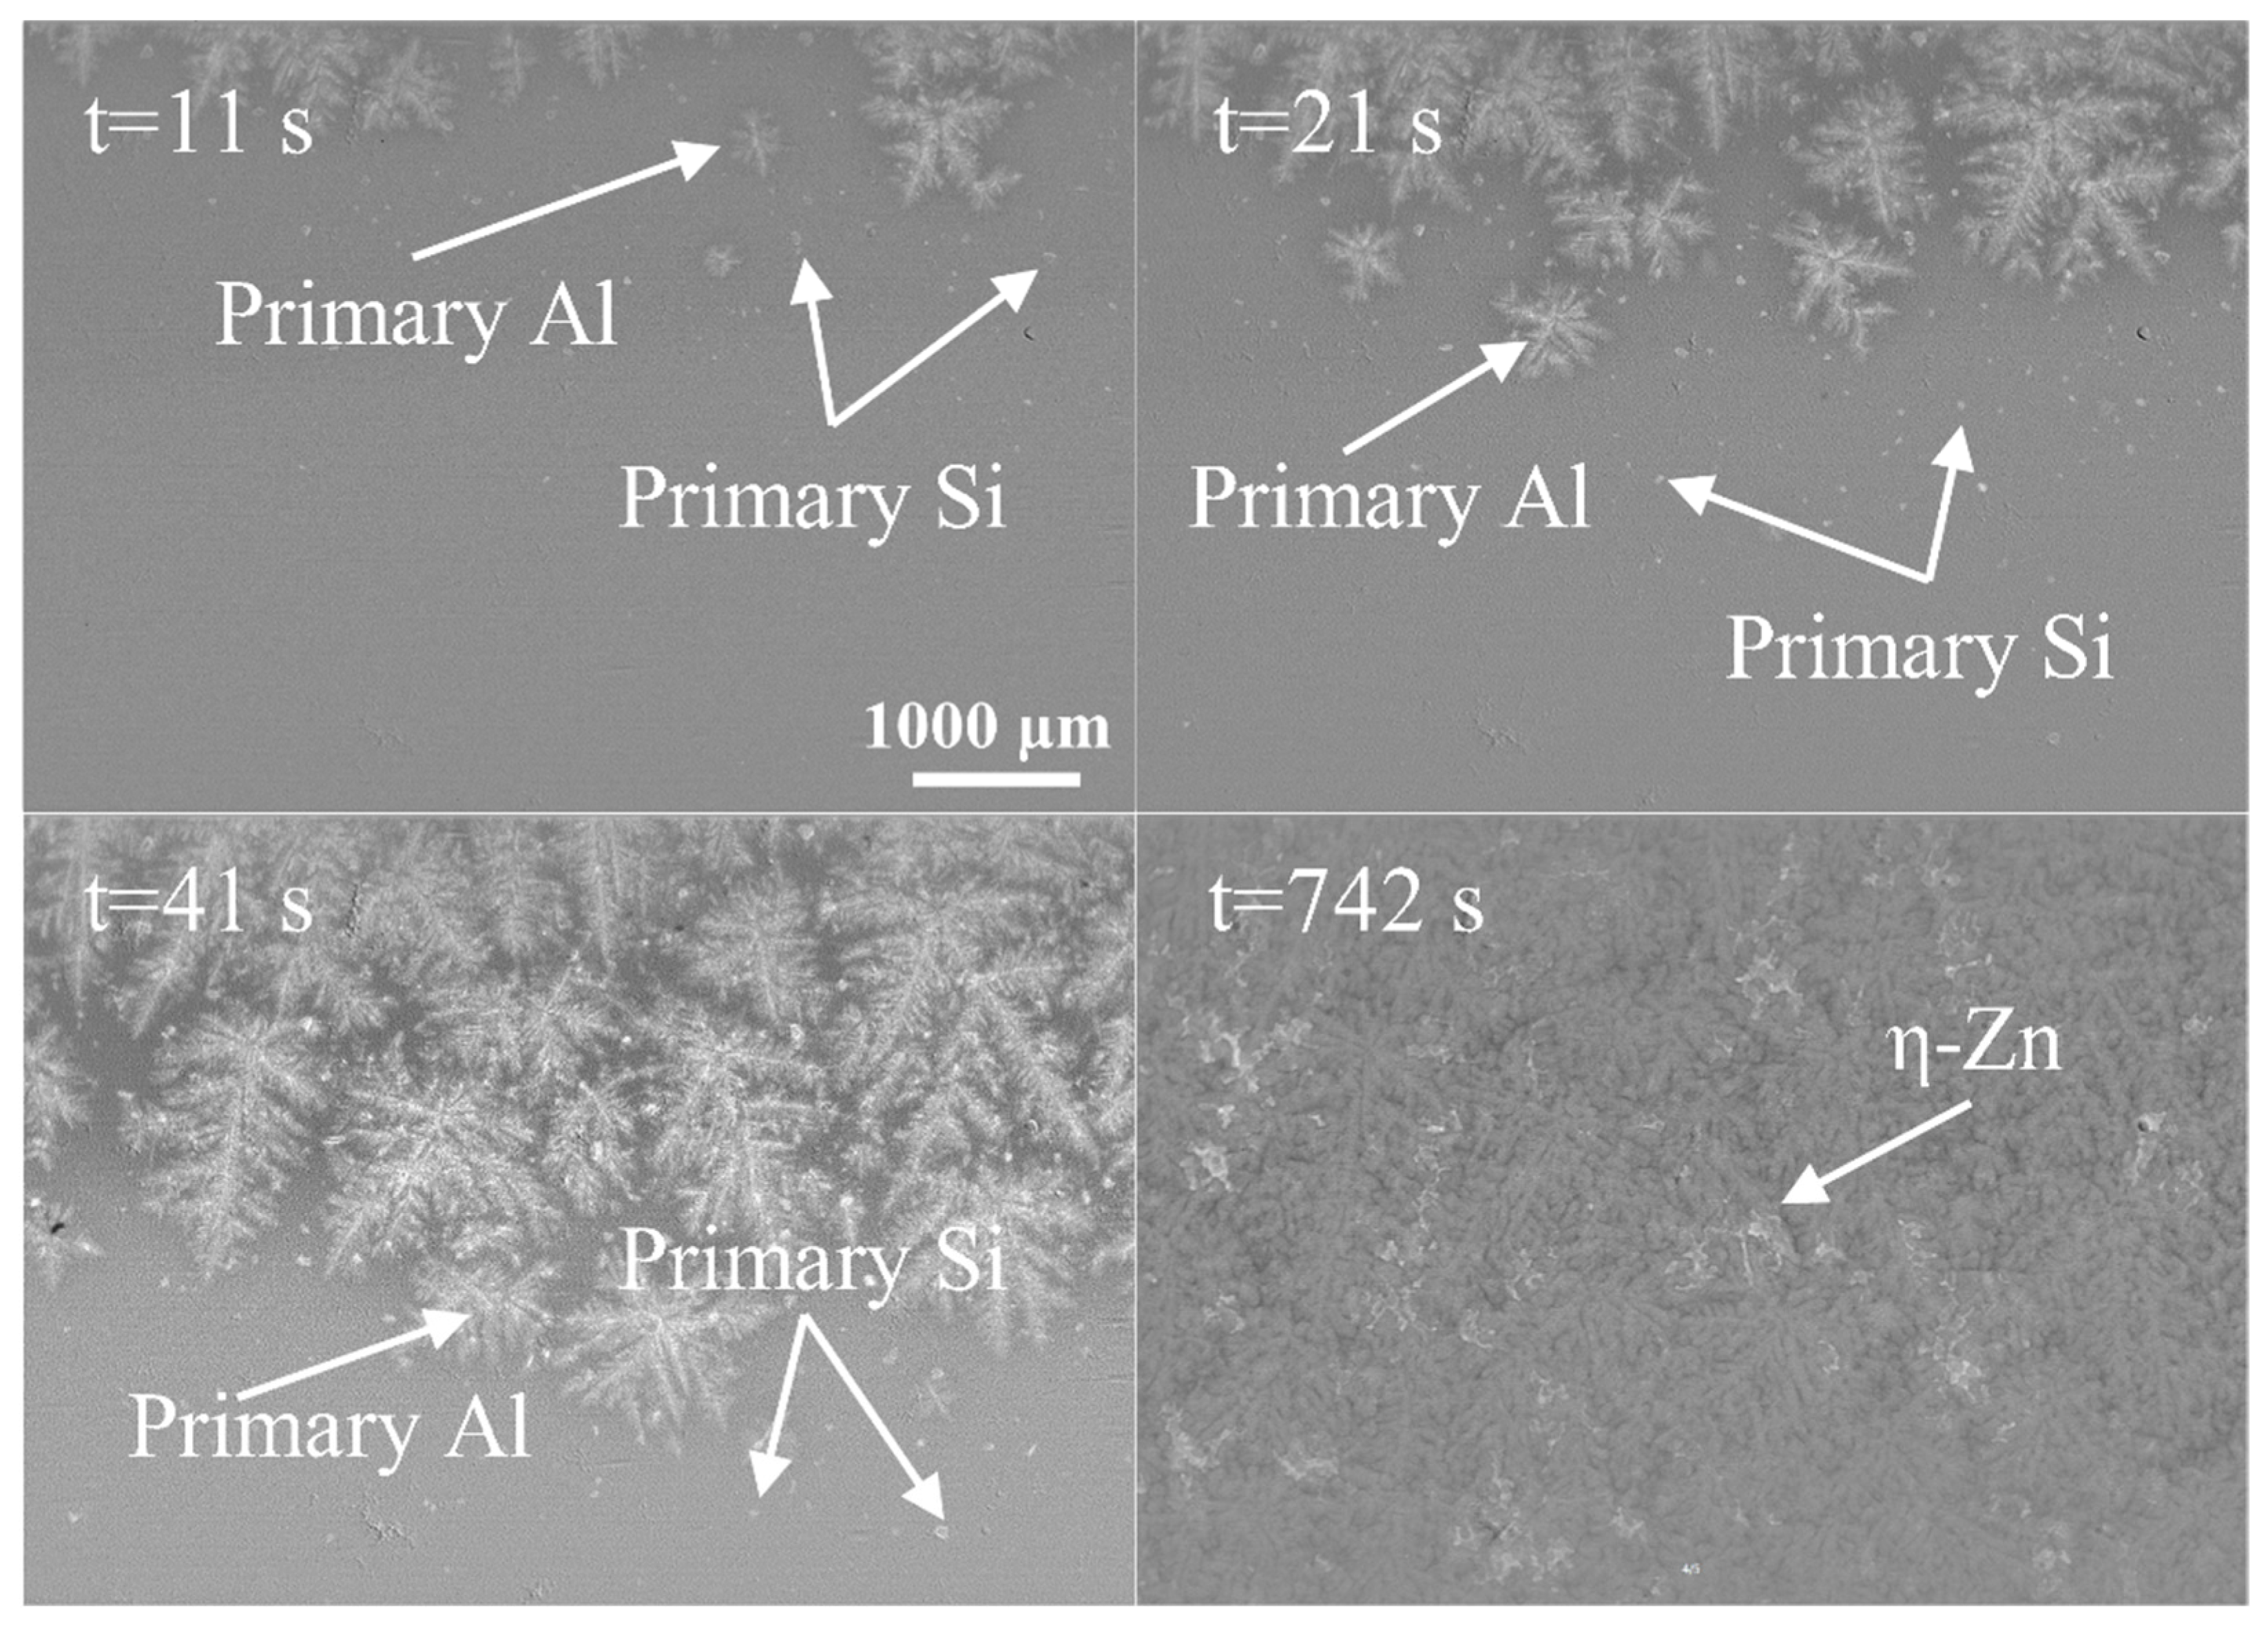
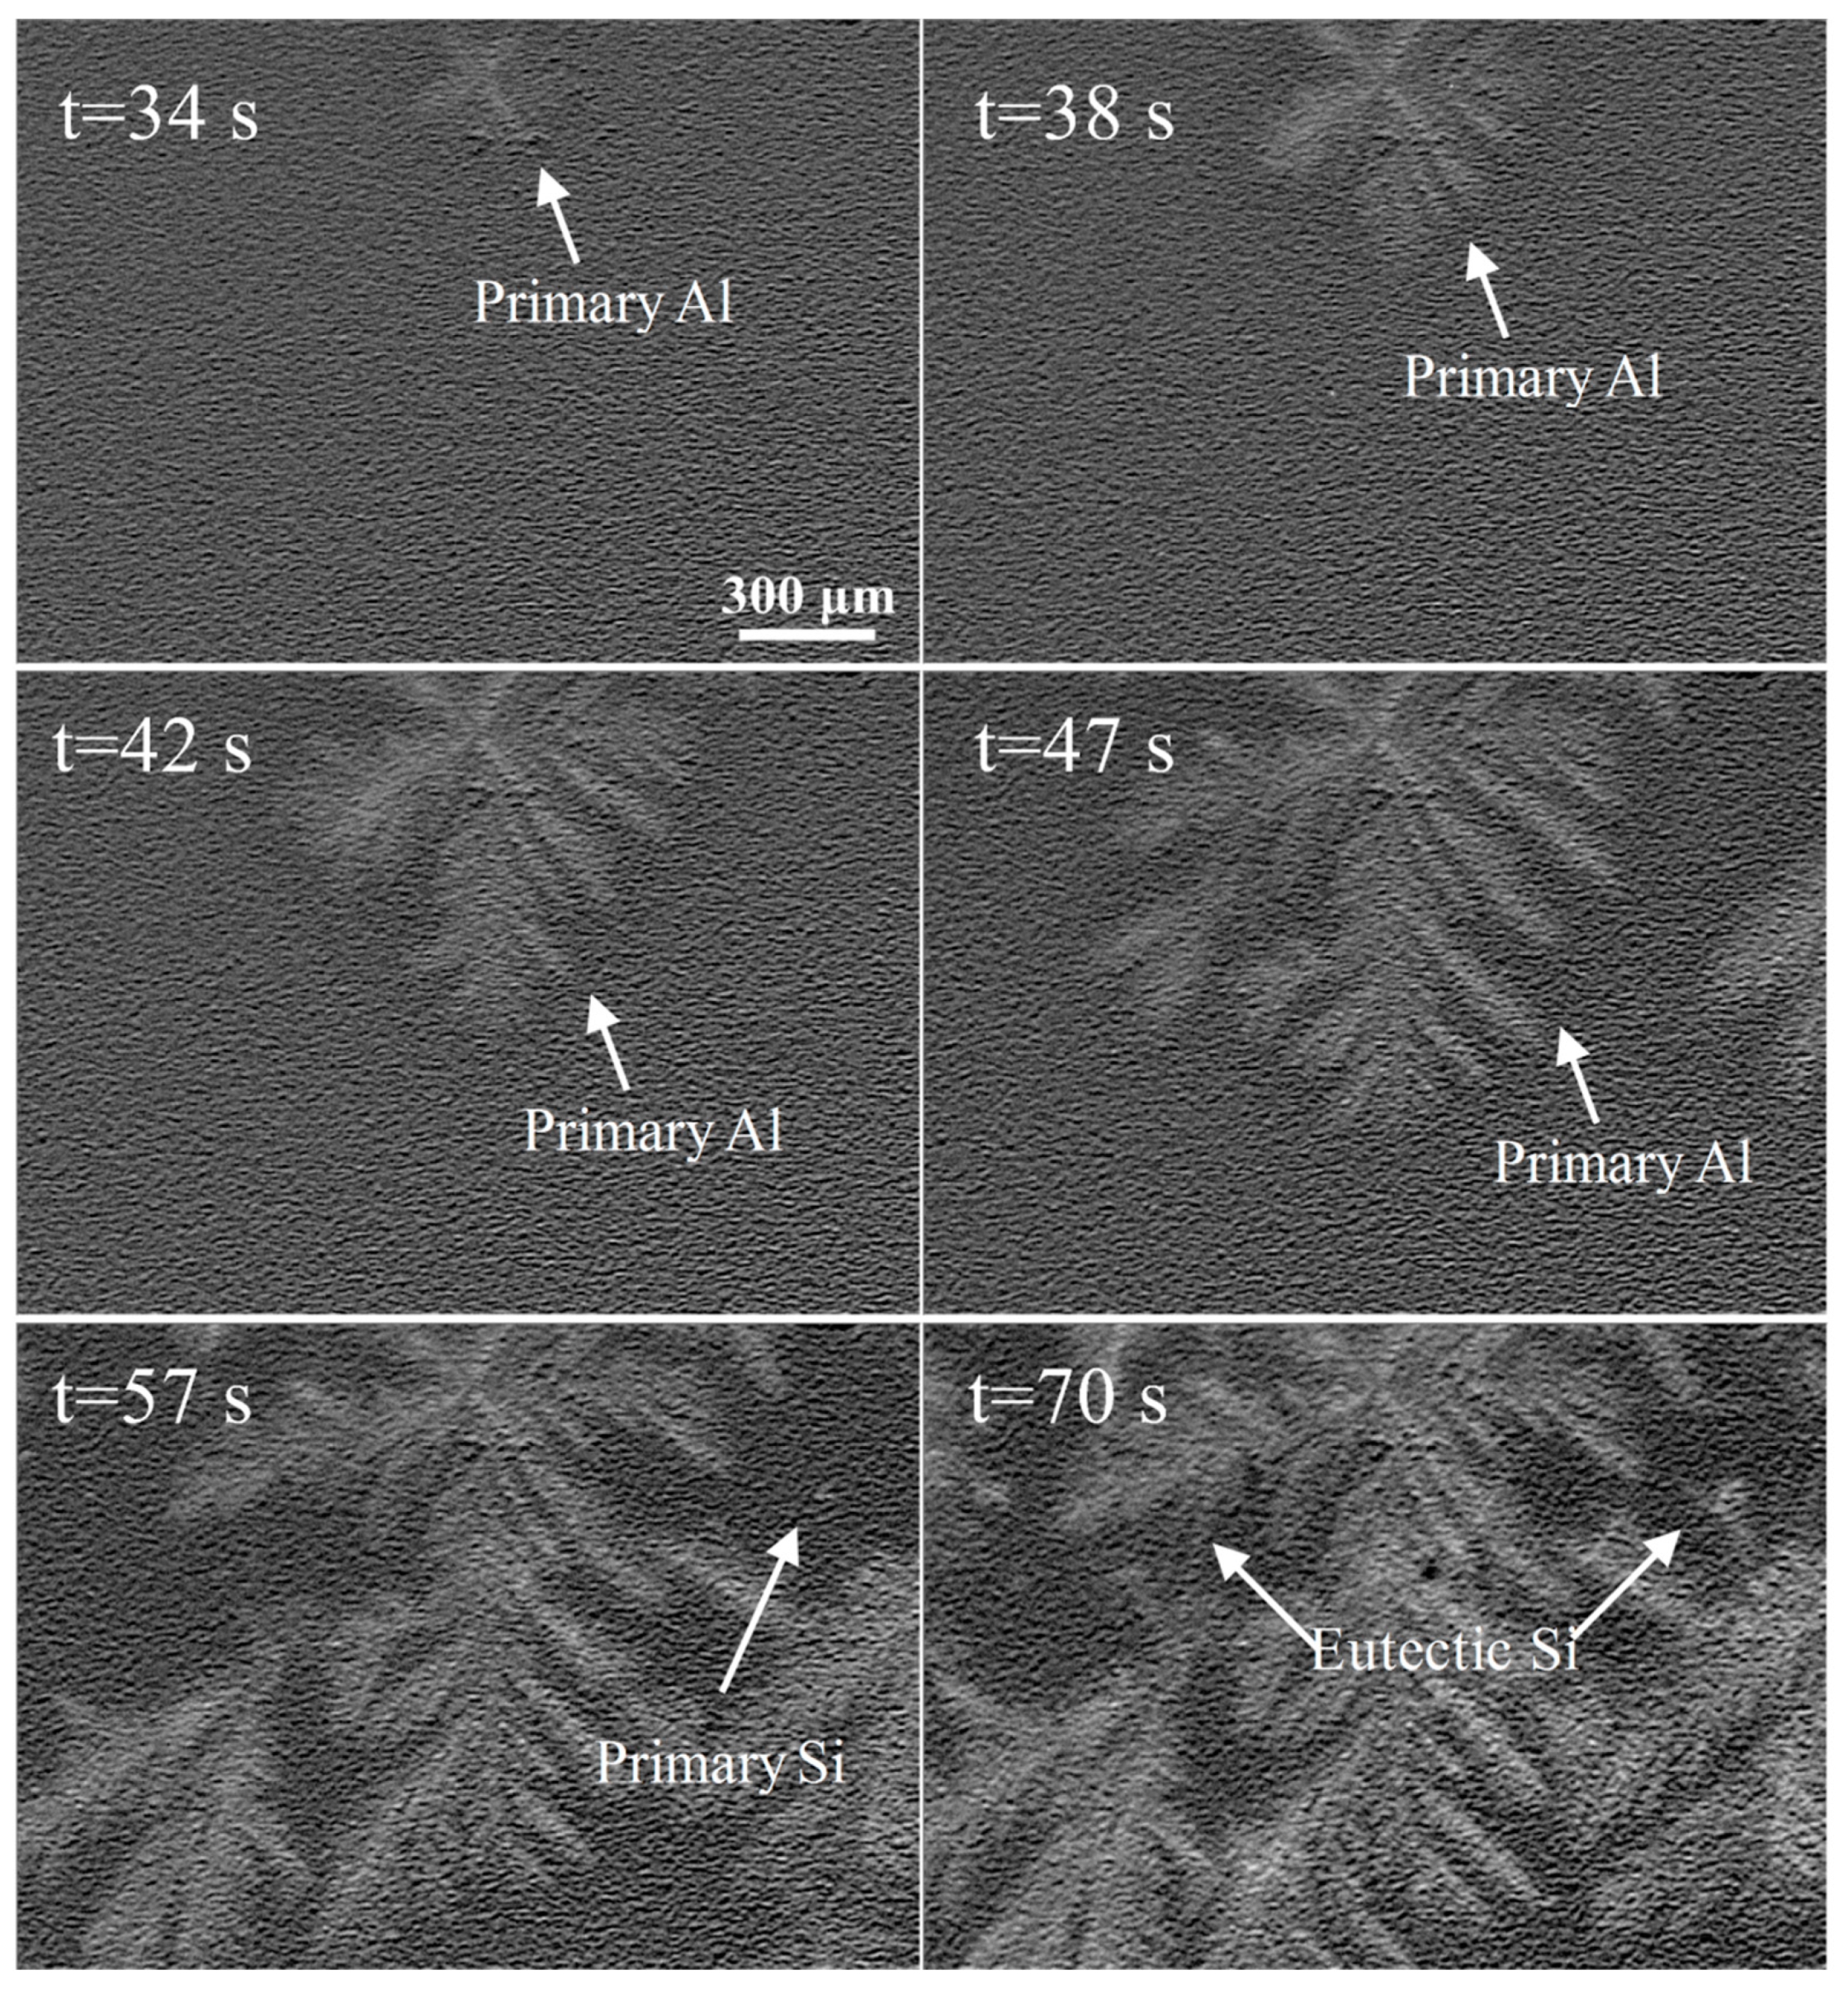
3.3. Synchrotron Radiation Real-Time Imaging of Commercial-Purity Al-40Zn-xSi Alloy

Since both the microstructures of Al-40Zn-5Si and Al-40Zn-6Si alloys contained α-Al dendrites, blocky primary Si and needle-like eutectic Si, it was difficult to infer whether the primary phase of the two alloys was α-Al or silicon. In order to clarify this, the synchrotron radiation real-time imaging technique was used to observe the solidification of the Al-40Zn-3Si, Al-40Zn-5Si and Al-40Zn-6Si alloys.
Figure 6 is synchrotron radiation image of the Al-40Zn-3Si alloy during solidification at different times; when t = 0 s is the moment when the first α-Al grain begins to appear in the image. Since the X-ray image taken is an inverted sample, the lower X-ray image represents the upper sample placed vertically. The lower part of sample solidified firstly during cooling because the bottom of sample stage was placed outside the furnace. The primary phase of Al-40Zn-3Si alloy was α-Al dendrite and some fractured α-Al dendrites floated from the lower sample to the upper, as shown in Figure 6 at t = 8 s. It has been reported that the fracture dendrites were all from upward-growing dendrites, which was because the dendrite density of α-Al was much lower than Zn-rich melt, and the downward-flowing Zn-rich melt was flushed out from the upward-growing dendrites, leading to local dendrite remelting. On the other hand, buoyancy also promoted dendrite fracture. However, it was very difficult to clearly observe the occurrence of the Al-Si eutectic reaction, especially at the growth interface of eutectic Si, because there had already been a large number of α-Al dendrites in the melt before the Al-Si eutectic reaction (Figure 6 at t = 498 s). As the temperature continued to decrease, the Zn-Al-Si ternary eutectic reaction occurred in the remaining interdendritic melt, as shown in Figure 6 at t = 1246 s, which was consistent with the non-equilibrium solidification process simulated by Pandat software and the microstructure of the Al-40Zn-3Si alloy.
Figure 7 shows the synchrotron radiation images of Al-40Zn-5Si alloy during solidification at different times. Similar to the Al-40Zn-3Si alloy, the primary phase was still α-Al dendrite, which is consistent with the ternary-phase diagram calculated by Pandat software. As the solid–liquid interface moved toward the upper sample, the blocky Si particles were found to nucleate and grow continuously at the front of α-Al dendrite, as shown in Figure 7 at t = 11 s Although the density of Si particles was much less than Zn-rich melts, these blocky Si particles were fixed in position and did not float towards the upper sample under buoyancy, or were pushed by the later growth of α-Al dendrites, as shown in Figure 7 at t = 21 s and t = 41 s. This is probably because these blocky Si particles nucleated at the surface of the ceramic plate, holding the sample. At the end of the solidification process, the Zn-Al-Si ternary eutectic reaction occurred in the interdendritic melt, as shown in Figure 7 at t = 742 s.
Figure 8 shows the synchrotron radiation images of the Al-40Zn-6Si alloy during solidification at different times. Although the microstructures of the commercial-purity Al-40Zn-5Si and Al-40Zn-6Si alloys were very similar, their solidification processes were quite different. As shown in Figure 8 at t = 163 s, the primary phase changed from α-Al dendrite in Al-40Zn-5Si alloy to blocky primary Si particles in the Al-40Zn-6Si alloy. Similar to the blocky Si particles precipitated at the front of the solid–liquid interface in the Al-40Zn-5Si alloy, the positions of these primary Si particles were also fixed, indicating that there was no difference in the nucleation mode of the blocky Si particles between these two alloys, whether they nucleated before or after the nucleation of α-Al dendrites. Before the Al-Si eutectic reaction, the primary Si particles grew at a slow rate. When the temperature reached the Al-Si eutectic temperature, the primary Si particles no longer grew, and the columnar α-Al was found to grow from the lower sample to the upper, as shown in Figure 8 at t = 343 s. However, due to the presence of primary Si particles and α-Al dendrites, the nucleation and growth of eutectic Si could not be clearly observed even after image processing, as shown in Figure 8 at t = 448 s. At the end of the solidification process, the ternary Zn-Al-Si eutectic reaction occurred in the interdendritic melt, as shown in Figure 8 at t = 1233 s. In conclusion, synchrotron radiation real-time imaging technology showed that the solidification processes of the Al-40Zn-3Si, Al-40Zn-5Si and Al-40Zn-6Si alloys were consistent with the non-equilibrium solidification process simulated by Pandat software and the actual solidification microstructure of the alloys.

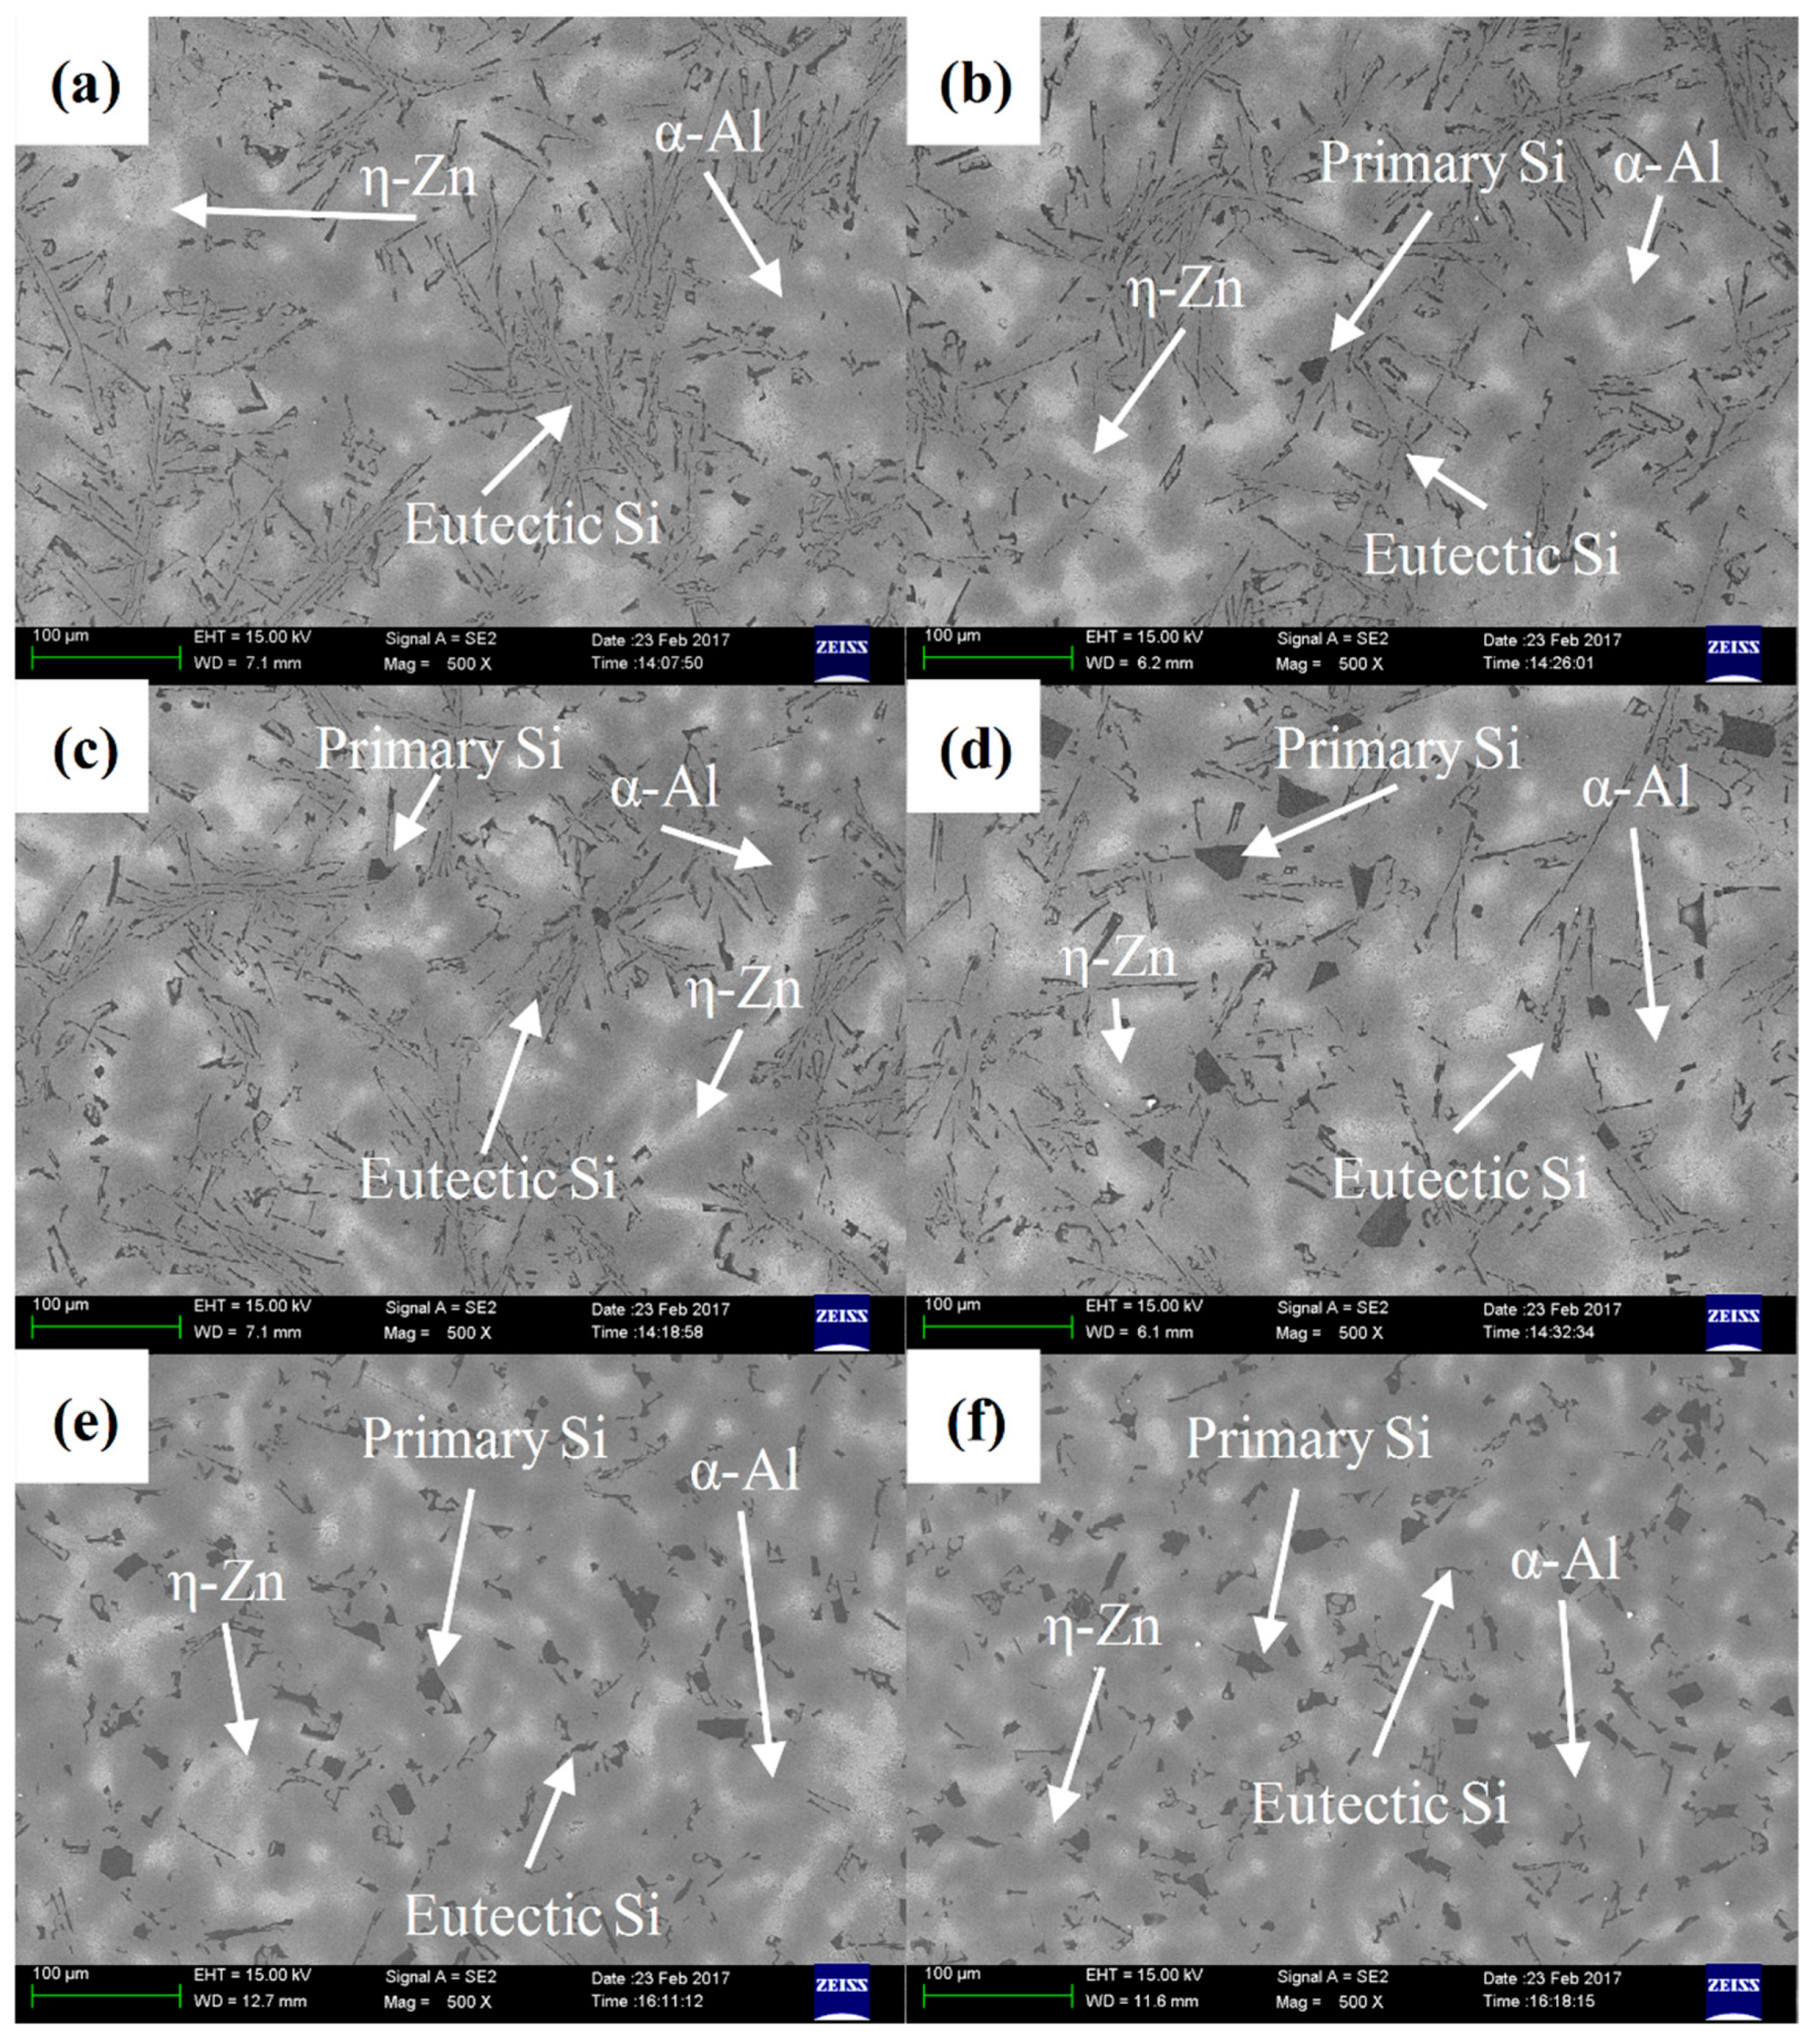
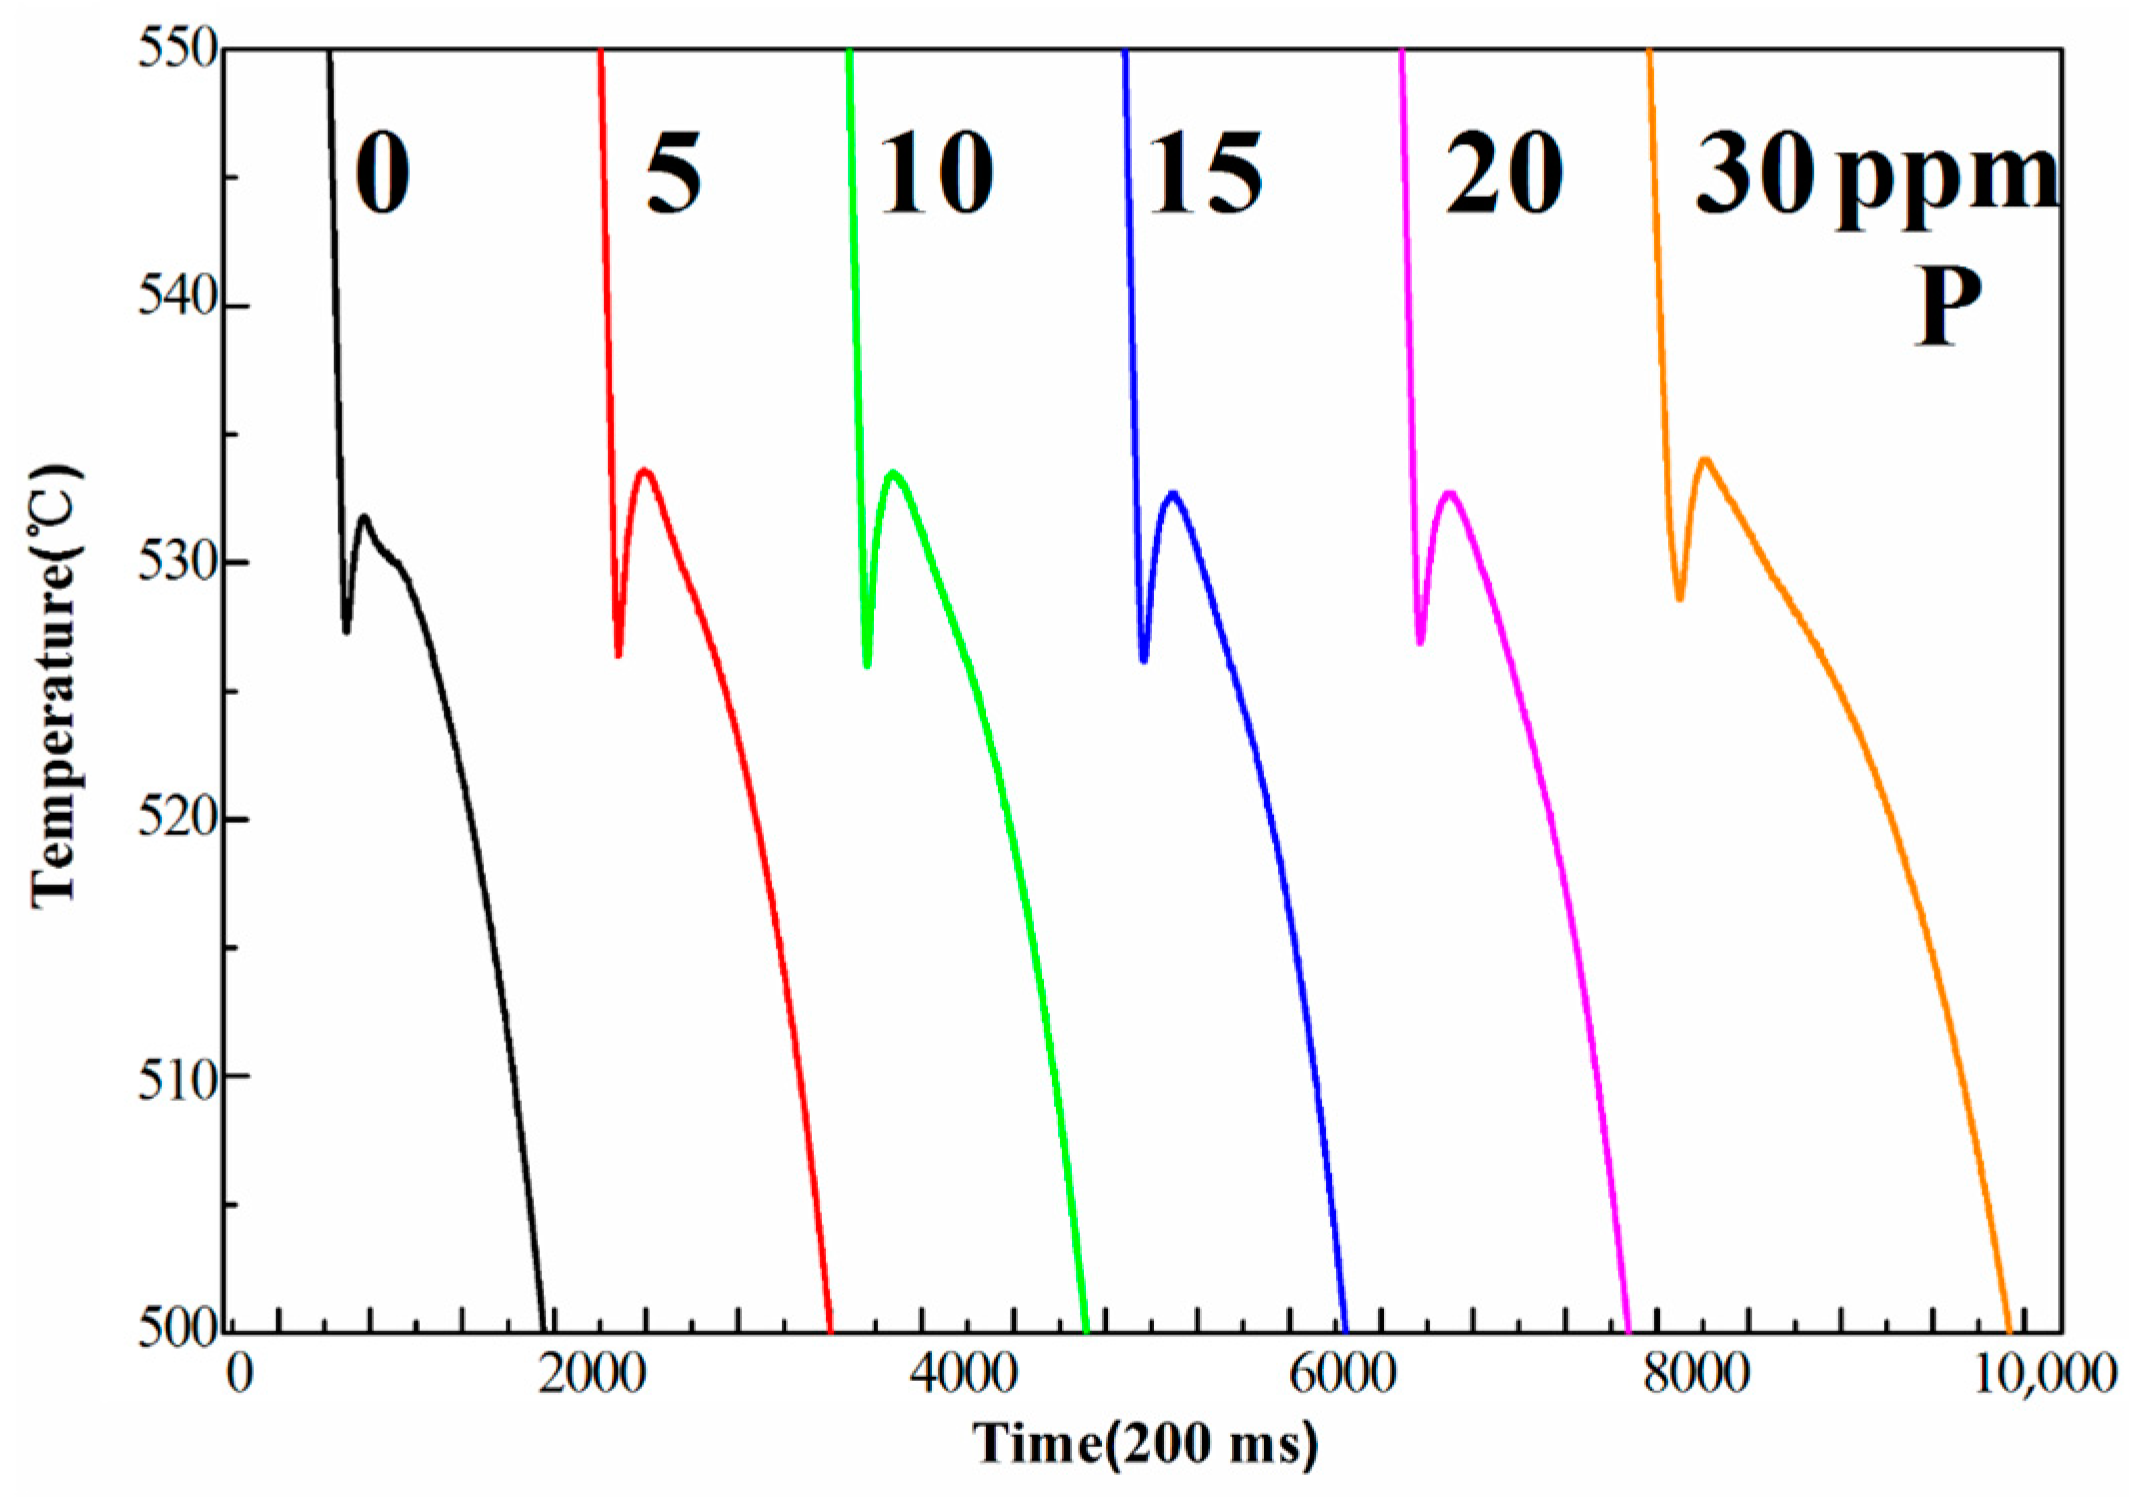
3.4. Effect of P Element on Microstructure of High-Purity Al-40Zn-5Si Alloy

The phase diagram and solidification process calculated by the Pandat software agree that the Al, Zn and Si components were of high purity. However, the impurity elements were more or less present in industrial production. It was found that the precipitation temperature of α-Al was basically consistent with the simulated results, but the eutectic reaction temperature was about 10 °C higher than the simulated results in the commercial-purity Al-40Zn-xSi alloys. Especially for the “hypoeutectic” Al-40Zn-5Si alloy, there were many blocky Si particles in the microstructure. P is a common impurity element in aluminum alloys. In order to explore the formation mechanism of the blocky Si particles in Al-40Zn-5Si, the effect of P content on the microstructure of the high-purity Al-40Zn-5Si alloy was investigated.
Figure 9 shows the microstructure of the high-purity Al-40Zn-5Si alloy with different contents of P. In the high-purity Al-40Zn-5Si alloy without any impurity elements, the amount of blocky Si particles was very small, as shown in Figure 9a. However, the amount of blocky Si particles increased with the increase in P element content. Meanwhile, the size of blocky Si particles decreased with the increase in P element content, as shown in Figure 9b–f. Especially when the P element was more than 20 ppm, the size of the blocky Si particles was greatly reduced, which was very similar to the microstructure of the Al-40Zn-5Si alloy prepared from industrial materials. Therefore, it can be concluded that the appearance of the blocky Si particles in the “near eutectic” commercial-purity Al-40Zn-5Si alloy was mainly related to the P impurity element. The number and size of the blocky Si particles depend on the P element content in the alloys.
Figure 10 is the measured cooling curve of high-purity Al-40Zn-5Si alloy with different contents of P element and only the eutectic reaction part of the Al-40Zn-5Si alloy (500–550 °C) is drawn. It can be seen from Figure 10 that although the precipitation temperature of primary α-Al and the Al-Si eutectic reaction temperature in the high-purity Al-40Zn-5Si alloy without the P element were very close, the two reactions can still be distinguished from the cooling curve. However, when the P element was added, it was difficult to distinguish the reactions from the cooling curve. The AlP particles can act as the nucleation sites of silicon, which increases the Al-Si eutectic reaction temperature and makes the eutectic reaction temperature closer to the precipitation reaction temperatures of primary α-Al. Thus, a higher recalescence temperature was observed in the high-purity Al-40Zn-5Si alloy with the P element.

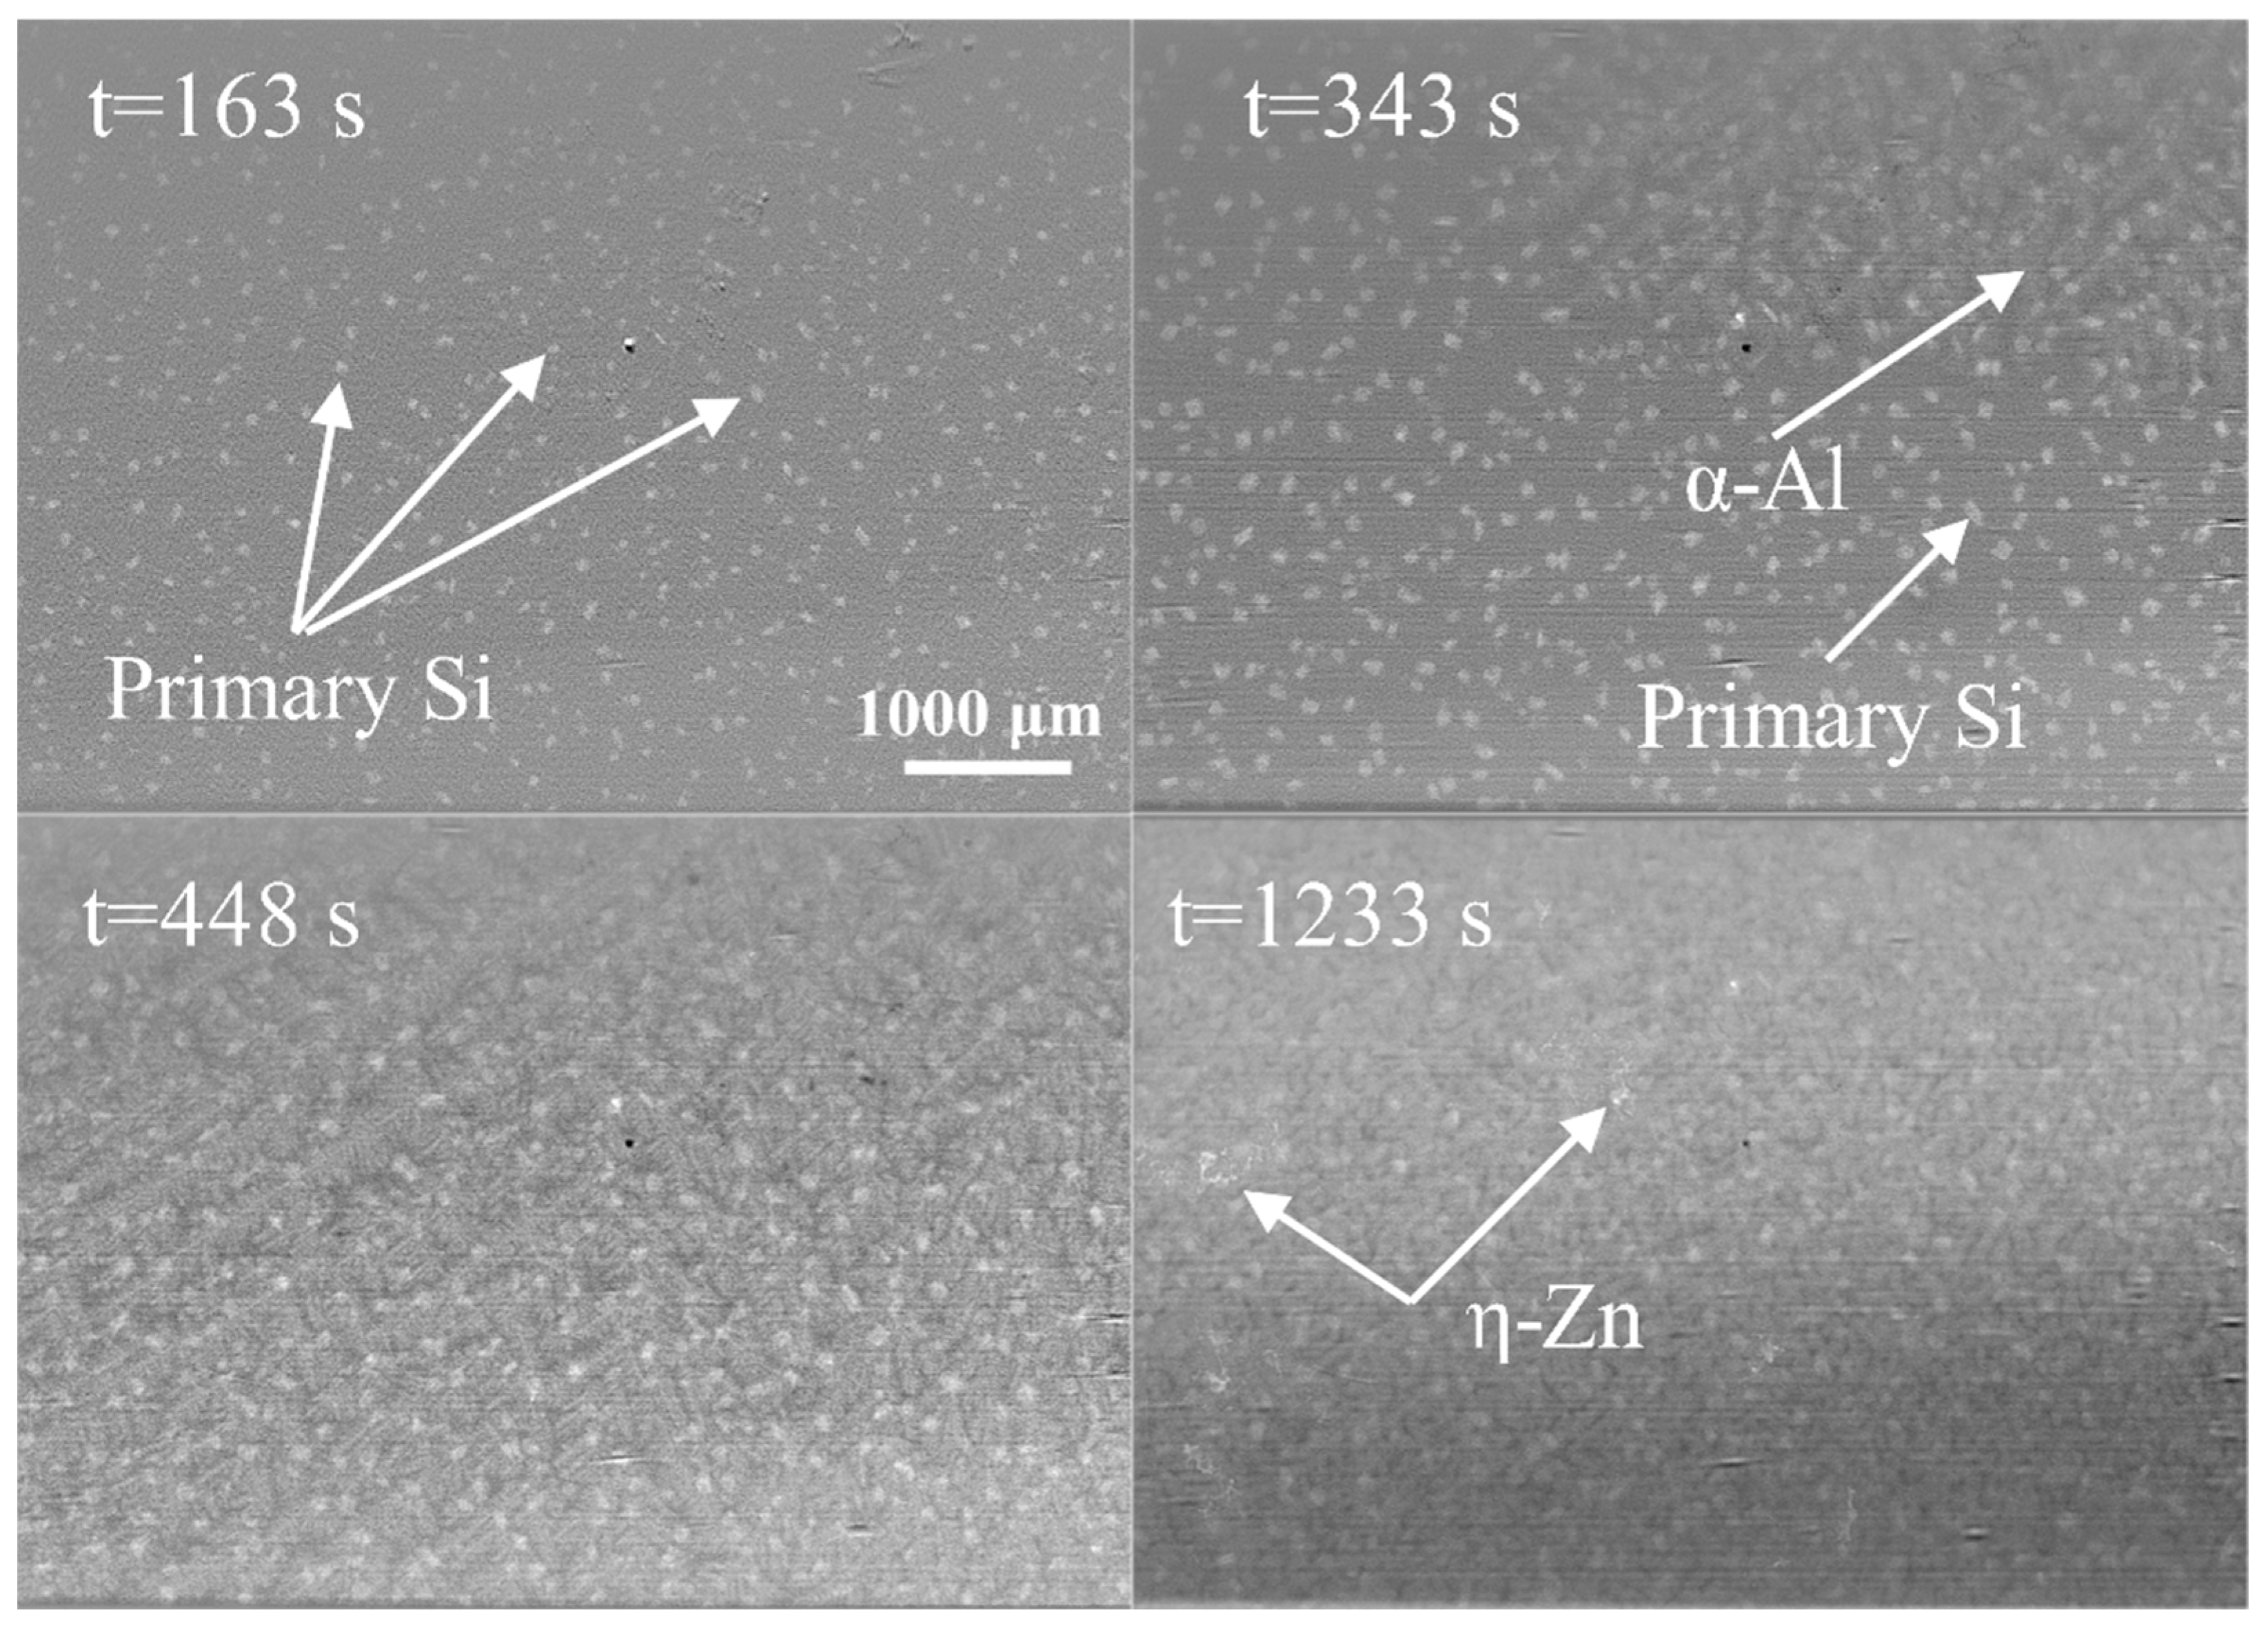
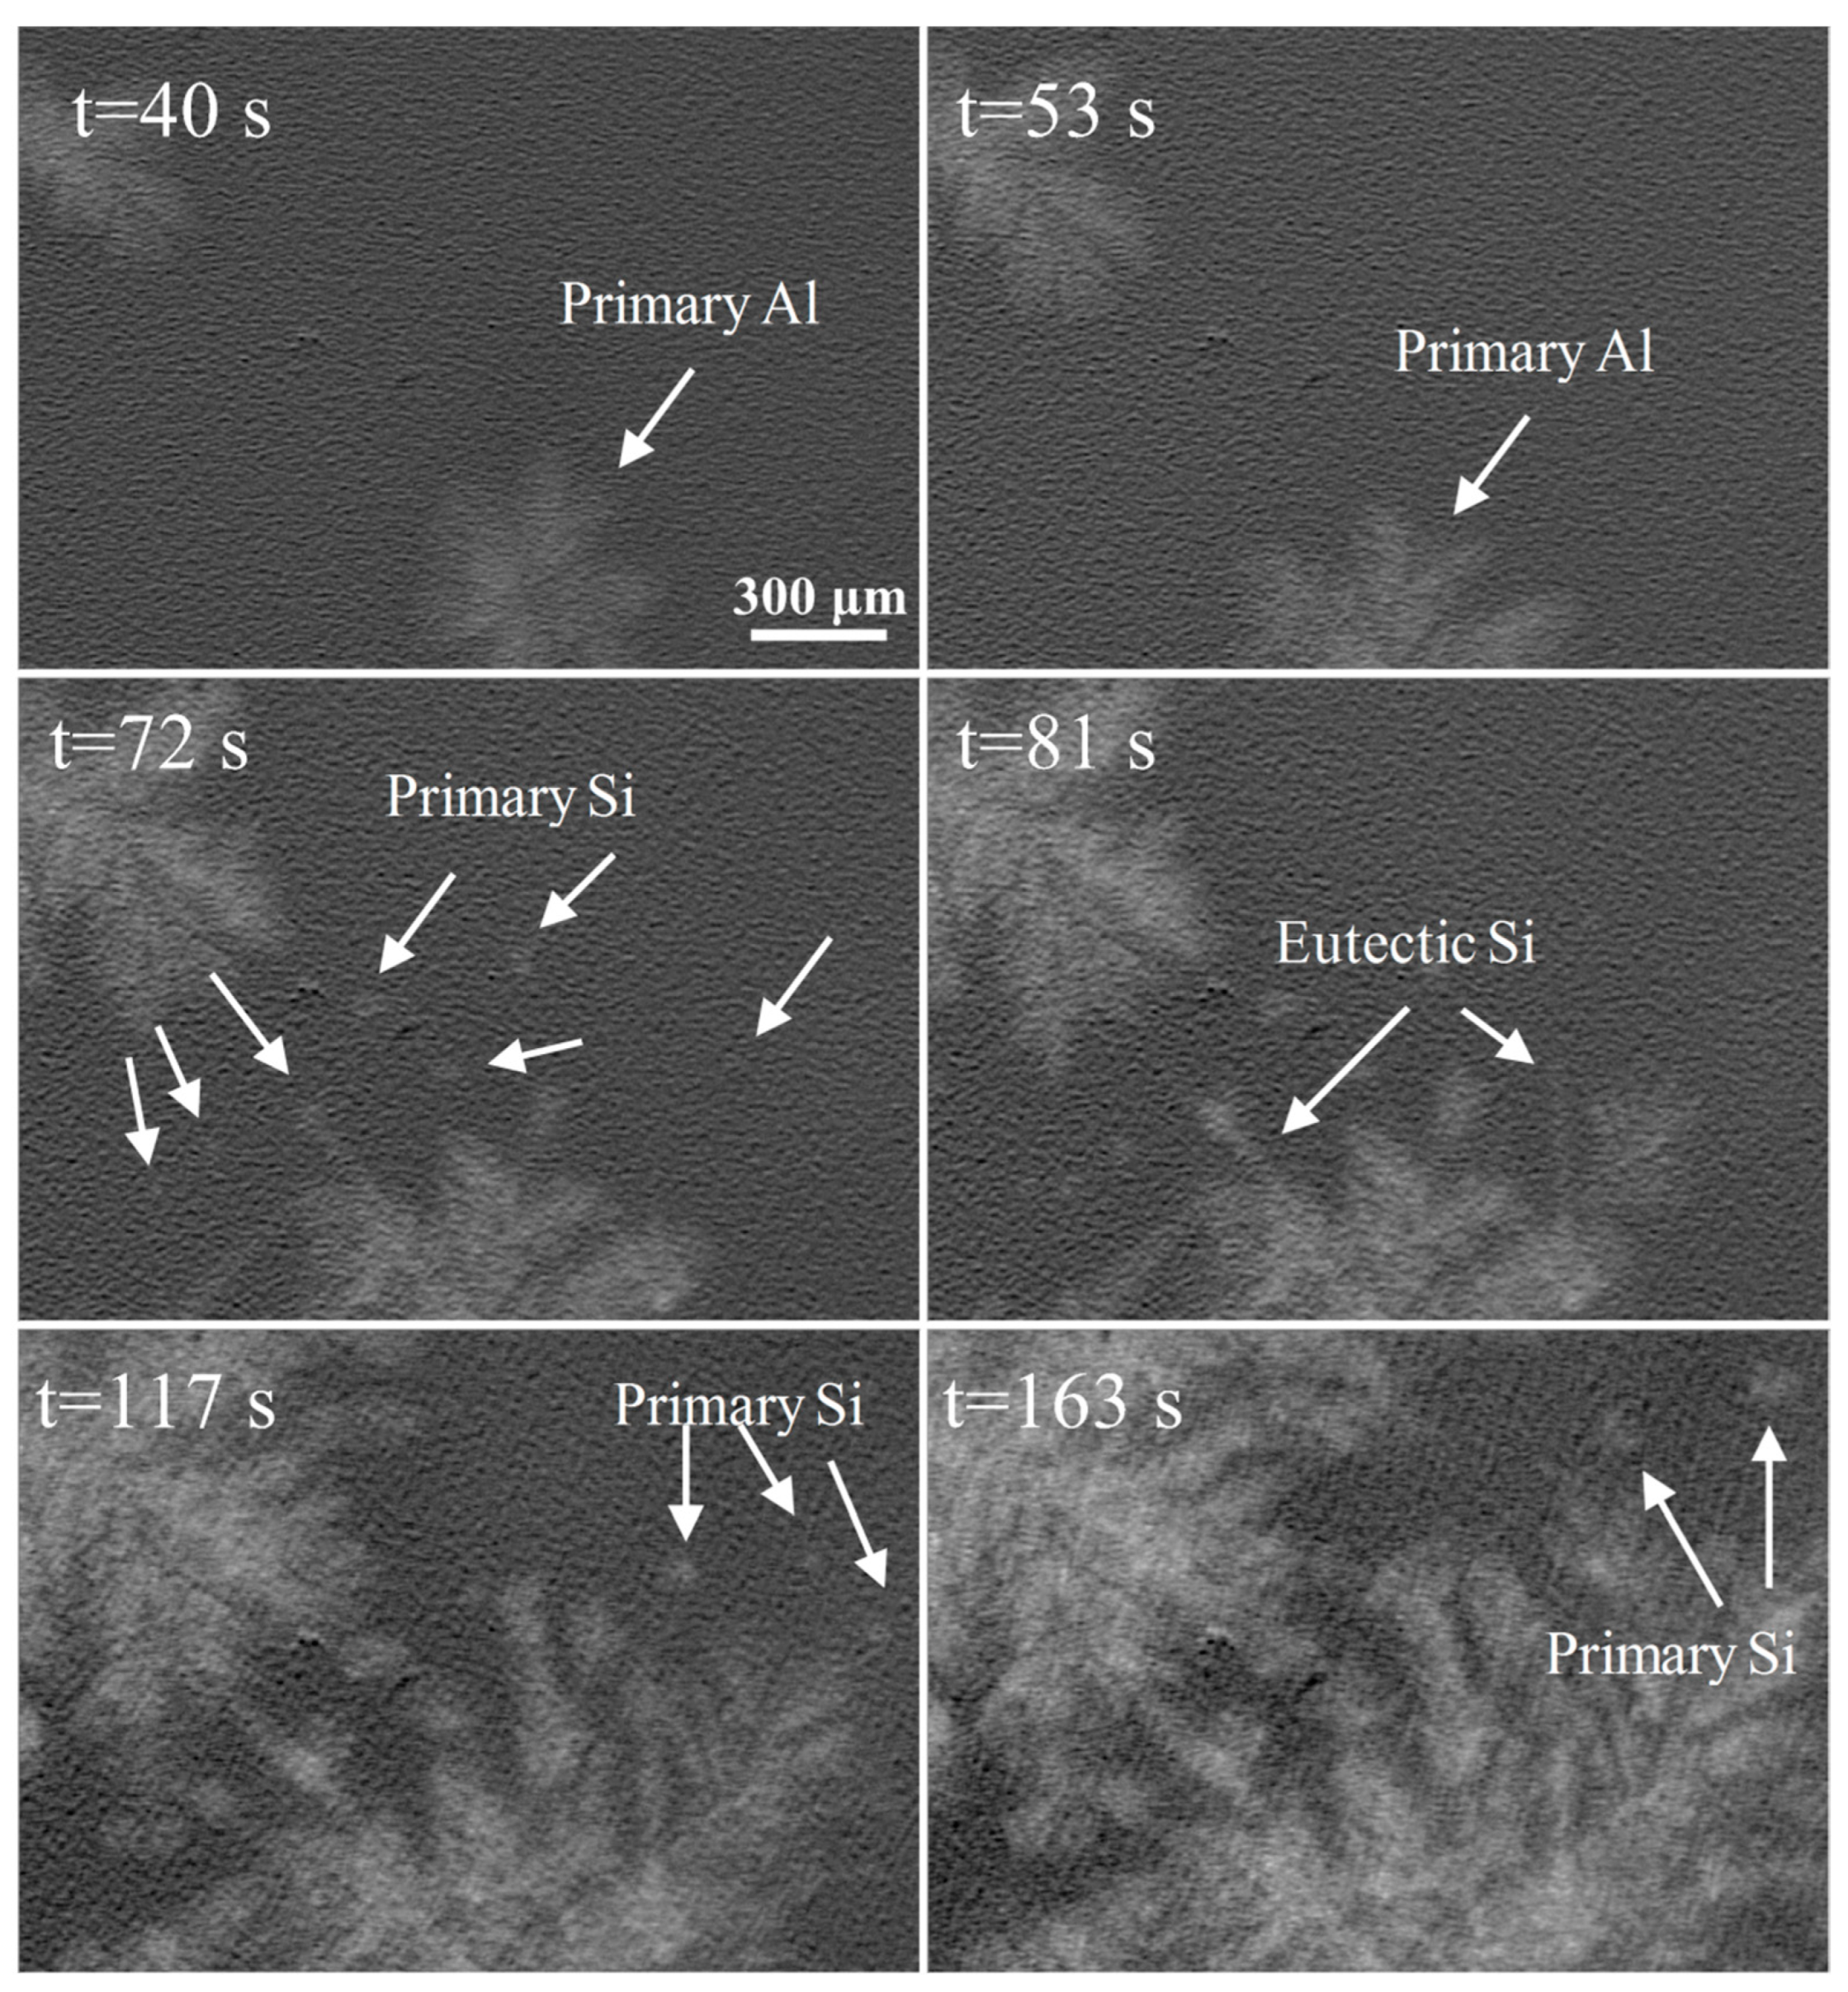
3.5. Synchrotron Radiation Real-Time Imaging of High-Purity Al-40Zn-5Si Alloy

Figure 11 shows a series of radiographs at different times, showing the solidification sequence of the high-purity Al-40Zn-5Si alloy when t = 0 s was the moment when the first α-Al grain began to appear in the image. The dendrite fracture was still observed in the high-purity Al-40Zn-5Si alloy, indicating that this phenomenon has no relationship with purity. Figure 11, at t = 34 s to 57 s, shows the rapid growth of primary α-Al dendrites and the initiation and growth of secondary dendrites on primary α-Al dendrites. It is worth noting that only a small minority of primary Si particles were found during the whole solidification process, as shown in Figure 11 at t = 57 s, indicating that the primary Si particles were difficult to nucleate in the melt at the front of the solid–liquid interface due to the lack of heterogeneous sites in the high-purity Al-40Zn-5Si alloy without the P impurity element, which is consistent with the microstructure of the high-purity Al-40Zn-5Si alloy in Figure 9. Subsequently, the needle-like eutectic Si nucleated and grew near the α-Al dendrite, as shown in Figure 11 at t = 70 s.
Figure 12 shows a series of radiographs at different times showing the solidification sequence of the high-purity Al-40Zn-5Si alloy with the addition of 20 ppm P. A primary α-Al dendrite was also selected as the object of observation in the field of vision, as shown in Figure 12 at t = 40 s and 53 s. Different from the high-purity Al-40Zn-5Si alloy, a large number of primary silicon particles were found to nucleate and grow in the melt at the front of the α-Al dendrites. Meanwhile, the needle-like eutectic Si also nucleated and grew rapidly near α-Al dendrites, as shown in Figure 12 at t = 72 s and 81 s. As the grain continued to grow, the dendritic α-Al grains nucleated on the surface of the blocky primary Si particles. When the primary silicon particles were surrounded, the solid–liquid interface continued to move forward, and the new primary Si particles precipitated continuously and grew at the front of the solid–liquid interface, as shown in Figure 12 at t = 117 s and 163 s. This result is also consistent with a large number of uniformly distributed primary Si particles in the microstructure of the Al-40Zn-5Si alloy containing 20 ppm of the P element in Figure 9.

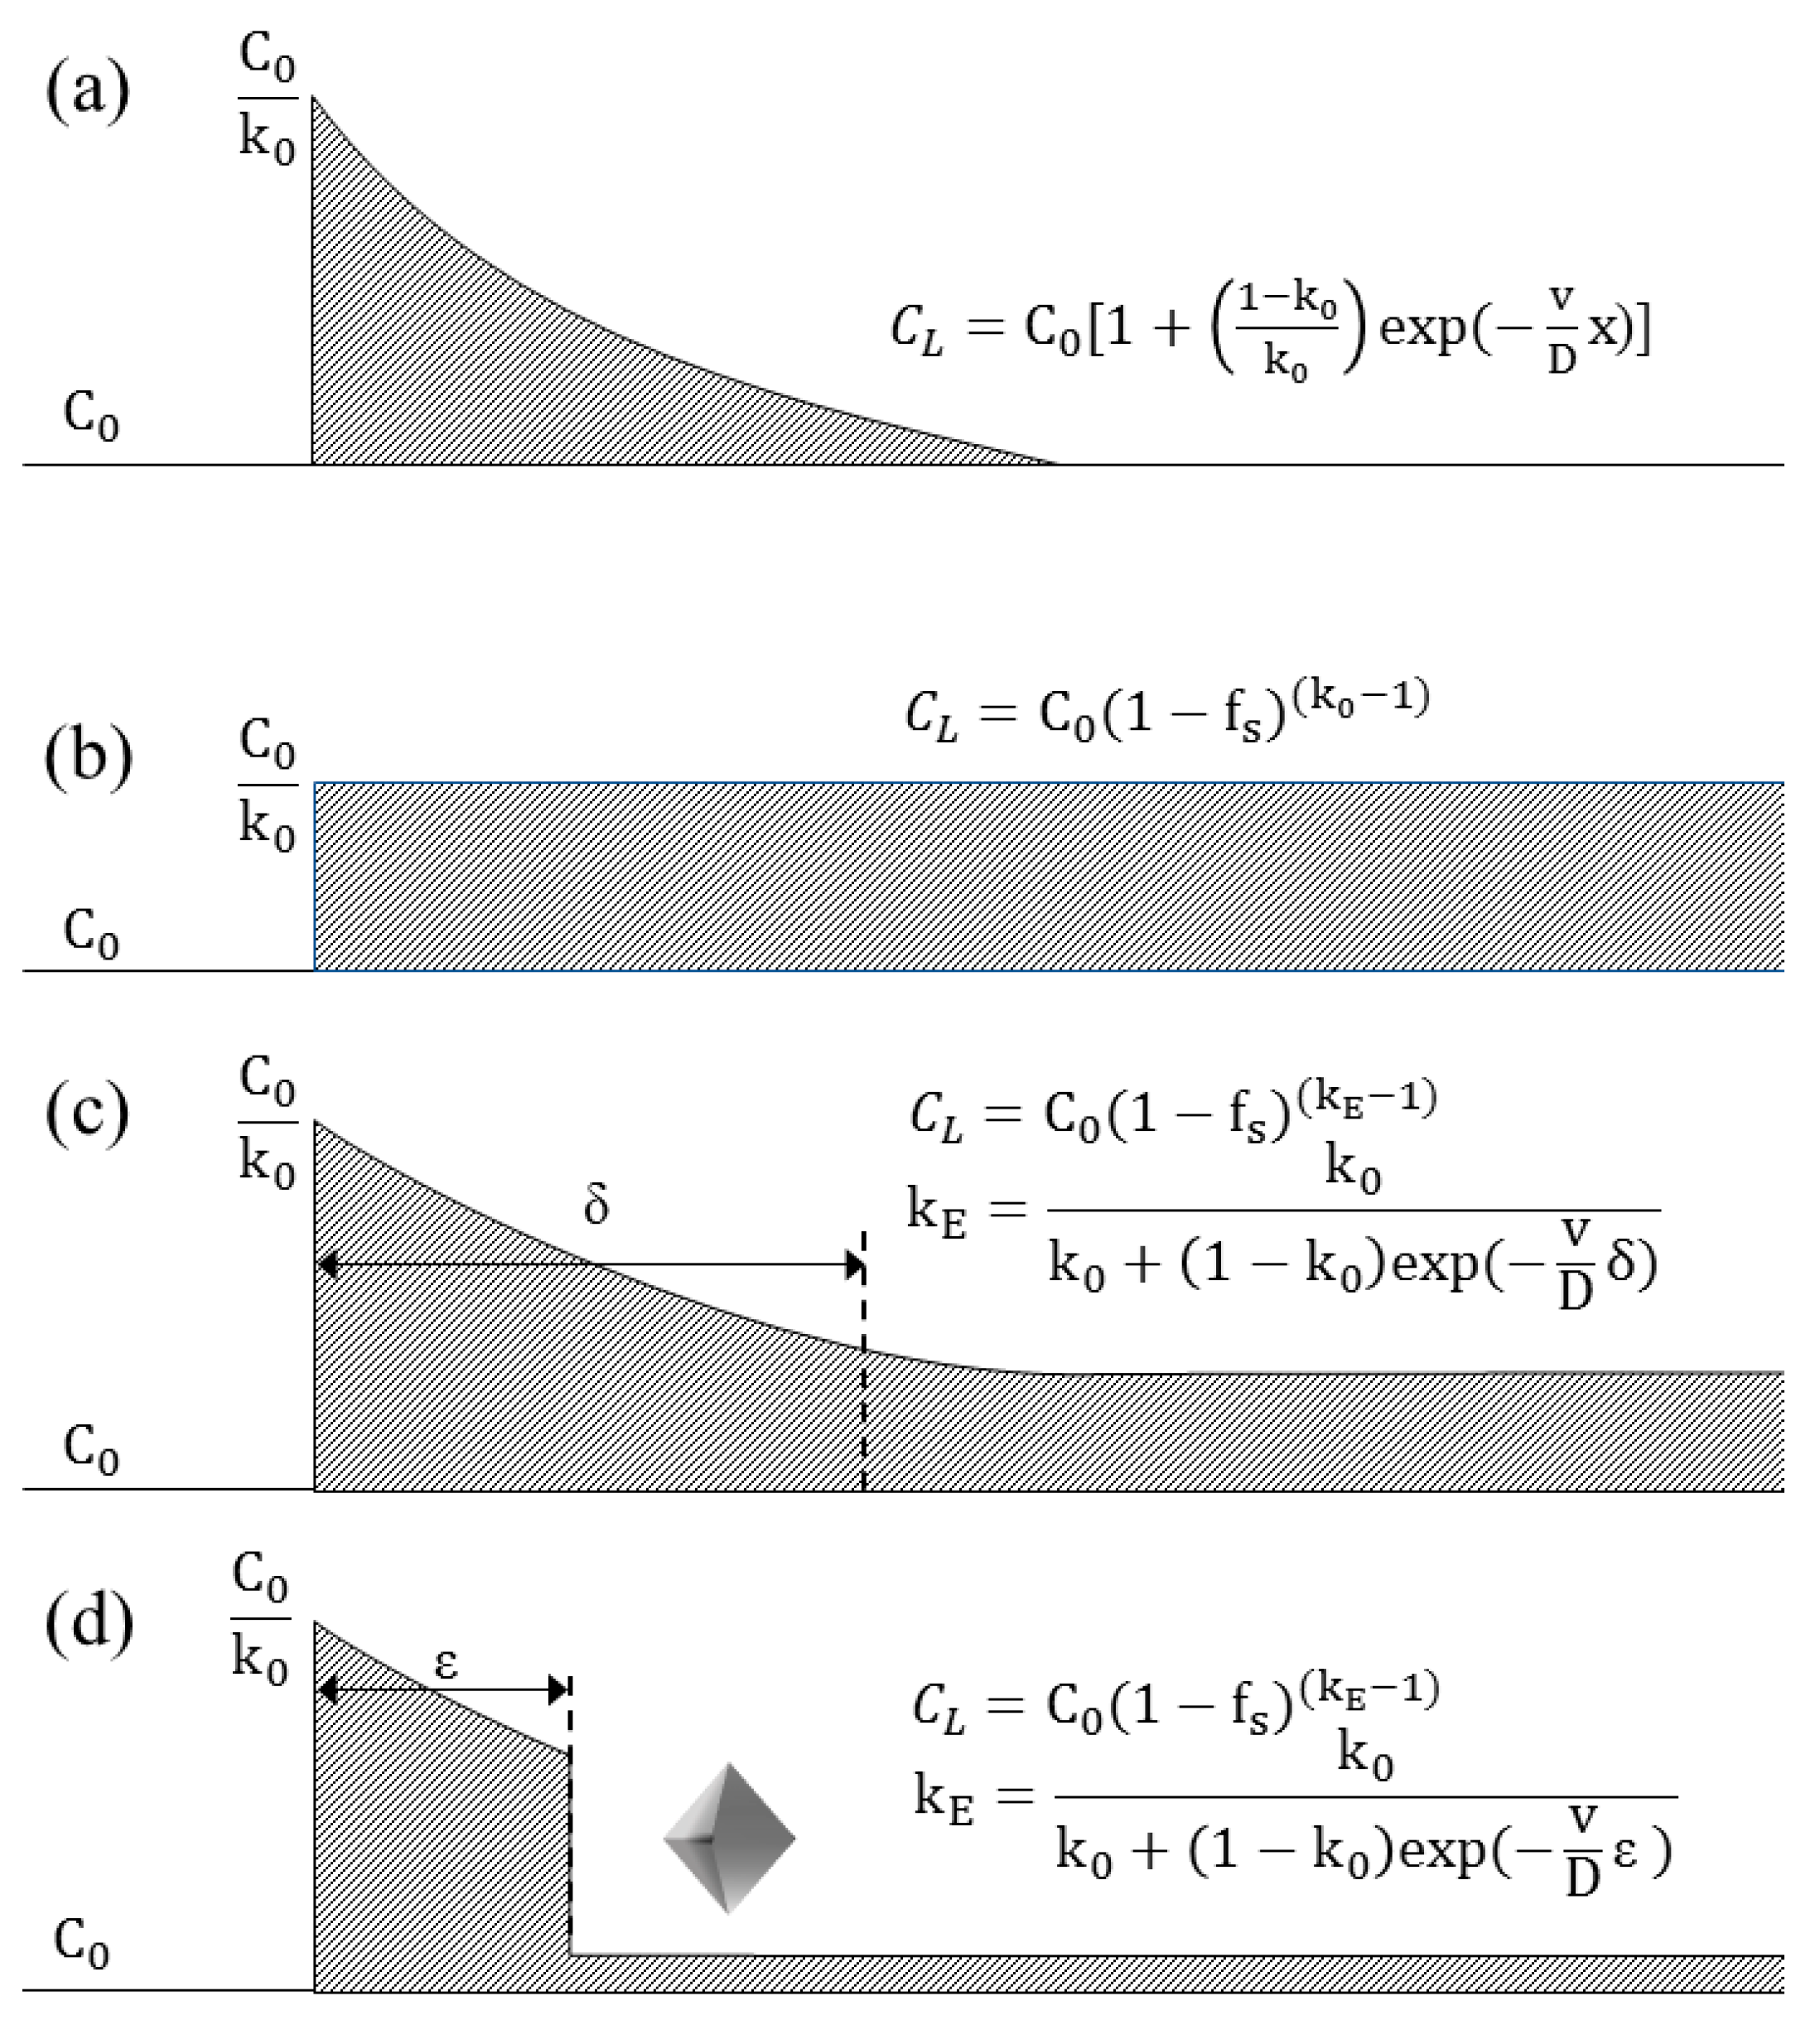
3.6. Precipitation Mechanism of Primary Si in Al-40Zn-5Si Alloy

In equilibrium solidification, the composition of the solid phase and liquid phase varies with the solidus and liquid lines, respectively. However, the composition of solid and liquid do not conform to the requirements of the equilibrium phase diagram in the actual solidification process. In addition to the interstitial solid solution, the solute diffusion coefficient in the solid phase is four orders of magnitude lower than that in the liquid phase, and the solute diffusion coefficient in the liquid phase is also four orders of magnitude lower than the thermal diffusion coefficient. Thus, the diffusion of solute in the liquid phase cannot become uniform quickly. However, the alloy composition accords the equilibrium phase diagram near the solid–liquid interface, which is near equilibrium solidification. Most of the solidification processes in actual material processing belong to this kind of equilibrium solidification.
In order to describe the equilibrium distribution characteristics of solute atoms on both sides of the solid–liquid interface, the equilibrium distribution coefficient k is adopted, which is defined as the ratio of the equilibrium solute concentration CS in the solid phase to the solute concentration CL in the liquid phase at a certain temperature:
k 0 = C S C L
Due to the low solubility of silicon in aluminum, the silicon element will be flushed out during the growth of the primary α-Al phase, leading to the enrichment of a large amount of silicon element at the front of α-Al. Figure 13 depicts the solute redistribution in the liquid phase at the solid–liquid interface under four conditions.
It is generally believed that solute does not diffuse in the solid phase, which is close to the actual situation. When there is no convection and only finite diffusion in the liquid phase (Figure 13a), the solute distribution equation in the liquid phase at a steady state is as follows [32]:
C L = C 0 [ 1 + ( 1 k 0 k 0 ) exp ( v D x ) ]
where C0 is the original composition of the liquid alloy, v is the growth rate of the interface, and D is the solute diffusion coefficient in the liquid phase. This formula indicates that when the alloy has a high growth rate of interface and a low solute diffusion coefficient, the gradient of solute composition at the solid–liquid interface is larger. If the melt is strongly stirred by an external force, the liquid phase can achieve uniform mixing. The physical model of solute redistribution under such solidification conditions is shown in Figure 13b and the solute distribution equation in the liquid phase is as follows [33]:
C L = C 0 ( 1 f s ) ( k 0 1 )
where C0 is the original composition of the liquid alloy and fS is the solid phase fraction.
However, in actual production, convection always exists more or less. In this case, the macroscopic transport of solute is caused by convection and diffusion. There is always a thin layer of liquid δ in the solid–liquid interface, which is not affected by convection. The physical model of solute redistribution under such solidification conditions is shown in Figure 13c. The solute distribution equation in the liquid phase under finite volume conditions is as follows [33]:
C L = C 0 ( 1 f s ) ( k E 1 )
k E = k 0 k 0 + ( 1 k 0 ) exp ( v D δ )
where C0 is the original composition of the liquid alloy, fS is the solid fraction, and kE is the effective solute distribution coefficient. With the increase in solidification time, the content of silicon in the front of the solid–liquid interface increases. Once the content of silicon exceeds the eutectic composition of the alloy, the primary Si particles may precipitate at the front of the solid–liquid interface. In the high-purity Al-40Zn-5Si alloy, due to the lack of heterogeneous nucleation sites of primary Si particles, the precipitation of primary silicon requires a larger undercooling, which is not conducive to the precipitation of primary Si particles at the front of the solid–liquid interface. In the Al-40Zn-5Si alloy containing P impurity, AlP particles can act as the heterogeneous nucleation sites of primary Si particles, and a small undercooling is required for the nucleation of primary Si particles at the front of the solid–liquid interface, as shown in Figure 13d. The precipitation of these primary Si particles will rapidly reduce the solute enrichment at the solid–liquid interface and reduce the thickness of the diffusion layer to ε. As the solid–liquid interface continues to advance, the solute concentration in the front of interface increases again. When it exceeds the eutectic composition of the alloy again, the new primary Si particles will nucleate again in the front of the interface, which is repeated until the solidification process is complete. In summary, the primary Si particles in the “hypoeutectic” Al-40Zn-5Si alloy are mainly related to the P impurity element and its content also determines the size and number of primary Si particles in the microstructure.

4. Conclusions

  • The phase diagram calculated by Pandat software showed two distinct primary phases, separated by a critical composition at about 5.49 wt.% Si. When Si (wt.%) was less than 5.49 wt.%, the primary phase was the α-Al phase. When Si (wt.%) was more than 5.49 wt.%, the primary phase was the silicon phase;
  • When Si content was 1% and 3%, only needle-like eutectic Si existed in the commercial-purity Al-40Zn-xSi alloys. When Si content was 5% and 6%, the microstructure contained not only needle-like eutectic Si, but also blocky primary Si particles;
  • Synchrotron radiation real-time imaging experiment showed that the primary phase was α-Al in the commercial-purity Al-40Zn-3Si and Al-40Zn-5Si alloys, and the primary phase was silicon in the commercial-purity Al-40Zn-6Si alloy;
  • A very small amount of blocky primary Si particles was found in the high-purity Al-40Zn-5Si alloy without the P impurity element. However, with increasing P impurity content, the amount of blocky primary Si particles increased and the size of the primary Si particles decreased in the high-purity Al-40Zn-5Si alloy;
  • The synchrotron radiation real-time imaging experiment showed that a small minority of primary Si particles were found during the whole solidification process of the high-purity Al-40Zn-5Si alloy. However, a large number of primary Si particles were precipitated continuously at the front of the α-Al dendrites in the high-purity Al-40Zn-5Si alloy with the addition of 20 ppm P, which may have been caused by the fact that AlP particles can act as the heterogeneous nucleation sites of primary Si particles by a small undercooling in P-impurity-containing alloys.

Author Contributions

Conceptualization, C.C.; Formal analysis, P.Z.; Funding acquisition, C.W.; Investigation, C.C.; Methodology, M.X. and L.X.; Project administration, G.Z.; Writing—original draft, J.G.; Writing—review & editing, F.M. All authors have read and agreed to the published version of the manuscript.

Funding

This research was funded by National Key R&D Program of China (2020YFB2008400), the Open Fund of Jiangsu Province Key Laboratory of High-end Structural Materials (hsm1903) and the Opening Project of Shanxi Key Laboratory of Controlled Metal Solidification and Precision Manufacturing, North University of China (MSPM201904).

Institutional Review Board Statement

Not applicable.

Informed Consent Statement

Not applicable.

Data Availability Statement

The data presented in this study are available on request from the corresponding author.

Conflicts of Interest

The authors declare no conflict of interest.

References

  1. Savaşkan, T.; Aydıner, A. Effects of silicon content on the mechanical and tribological properties of monotectoid-based zinc–aluminium–silicon alloys. Wear 2004, 257, 377–388. [Google Scholar] [CrossRef]
  2. Savaskan, T.; Murphy, S. Mechanical properties and lubricated wear of Zn-25Al-based alloys. Wear 1987, 116, 211–224. [Google Scholar] [CrossRef]
  3. Lee, P.P.; Savaskan, T.; Laufer, E. Wear resistance and microstructure of Zn-Al-Si and Zn-Al-Cu alloys. Wear 1987, 117, 79–89. [Google Scholar] [CrossRef]
  4. El Sebaie, O.; Samuel, A.; Samuel, F.; Doty, H. The effects of mischmetal, cooling rate and heat treatment on the hardness of A319.1, A356.2 and A413.1 Al–Si casting alloys. Mater. Sci. Eng. A 2008, 486, 241–252. [Google Scholar] [CrossRef]
  5. Xu, B.; Phelan, D.; Dippenaar, R. Role of silicon in solidification microstructure in hot-dipped 55 wt% Al–Zn–Si coatings. Mater. Sci. Eng. A 2008, 473, 76–80. [Google Scholar] [CrossRef]
  6. Peng, W.; Du, Q.; Wu, G.; Dan, W.; Hu, W.; Zhang, J. The role of Ti and Si in the nucleation of α-Al during hot dip coating of steel with Al–43.4 wt.% Zn–1.6 wt.% Si alloy. Surf. Coat. Technol. 2016, 299, 56–64. [Google Scholar] [CrossRef]
  7. Jinlong, Y.; Songbai, X.; Han, L.; Peng, X.; Wei, D. Effects of silicon on microstructures and properties of Al-40Zn-xSi filler metal. Rare Met. Mater. Eng. 2016, 45, 333–338. [Google Scholar] [CrossRef]
  8. Suzuki, K.; Kagayama, M.; Takeuchi, Y. Eutectic phase equilibrium of Al-Si-Zn system and its applicability for lower temperature brazing. Keikinzoku 1993, 43, 533–538. [Google Scholar]
  9. Wu, Y.; Wang, S.; Li, H.; Liu, X. A new technique to modify hypereutectic Al–24% Si alloys by a Si–P master alloy. J. Alloys Compd. 2009, 477, 139–144. [Google Scholar] [CrossRef]
  10. Peng, H.P.; Li, Z.W.; Zhu, J.Q.; Su, X.P.; Ya LI, U.; Wu, C.J.; Wang, J.H. Microstructure and mechanical properties of Al–Si alloy modified with Al–3P. Trans. Nonferrous Met. Soc. China 2020, 30, 595–602. [Google Scholar] [CrossRef]
  11. Ludwig, T.H.; Schaffer, P.L.; Arnberg, L. Influence of Phosphorus on the Nucleation of Eutectic Silicon in Al-Si Alloys. Met. Mater. Trans. A 2013, 44, 5796–5805. [Google Scholar] [CrossRef]
  12. Huifang, H. Study on Si Phase Morphology, Metamorphism and Properties of A1-25%Si Alloy; Chongqing University: Chongqing, China, 2010. [Google Scholar]
  13. Weixi, S. Metamorphism and Mechanism of Primary Silicon in Hypereutectic Al-Si Alloy by Nd; Dongbei University: Dalian, China, 2011. [Google Scholar]
  14. Zhu, X.; Wang, S.; Dong, X.; Liu, X.; Ji, S. Morphologically templated nucleation of primary Si on AlP in hypereutectic Al-Si alloys. J. Mater. Sci. Technol. 2022, 100, 36–45. [Google Scholar] [CrossRef]
  15. Dai, H.; Du, J.; Wang, L.; Peng, C.; Liu, X. First-principle study of the AlP/Si interfacial adhesion. Phys. B Condens. Matter 2010, 405, 573–578. [Google Scholar] [CrossRef]
  16. Faraji, M.; Todd, I.; Jones, H. Effect of solidification cooling rate and phosphorus inoculation on number per unit volume of primary silicon particles in hypereutectic aluminium—silicon alloys. J. Mater. Sci. 2005, 40, 6363–6365. [Google Scholar] [CrossRef]
  17. Zhang, L.; Ji, Z.-W.; Zhao, J.; He, J.; Jiang, H. Factors affecting eutectic Si modification in Al-Si hypoeutectic alloy with the addition of Na, Sr, Eu and Yb. Mater. Lett. 2021, 308, 131206. [Google Scholar] [CrossRef]
  18. Nogita, K.; Knuutinen, A.; McDonald, S.D.; Dahle, A.K. Mechanisms of eutectic solidification in Al–Si alloys modified with Ba, Ca, Y and Yb. J. Light Met. 2001, 1, 219–228. [Google Scholar] [CrossRef]
  19. Lu, S.-Z.; Hellawell, A. Growth mechanisms of silicon in Al-Si alloys. J. Cryst. Growth 1985, 73, 316–328. [Google Scholar] [CrossRef]
  20. Shamsuzzoha, M.; Hogan, L.M.; Berry, J.T. Effects of modifying agents on crystallography and growth of silicon phase in Al-Si casting alloys. Trans. Am. Foundrymens Soc. 1993, 100, 999. [Google Scholar]
  21. Dong, Y.; Shuai, S.; Zheng, T.; Cao, J.; Chen, C.; Wang, J.; Ren, Z. In-situ observation of solid-liquid interface transition during directional solidification of Al-Zn alloy via X-ray imaging. J. Mater. Sci. Technol. 2020, 39, 113–123. [Google Scholar] [CrossRef]
  22. Liao, H.; Zhang, M.; Bi, J.; Ding, K.; Xi, X.; Wu, S. Eutectic Solidification in Near-eutectic Al-Si Casting Alloys. J. Mater. Sci. Technol. 2010, 26, 1089–1097. [Google Scholar] [CrossRef]
  23. Liao, H.; Zhang, M.; Wang, H.; Dong, G.; Sun, G. Refinement of Eutectic Grains/Cells in Near-Eutectic Al-Si Alloys. Mater. Sci. Technol. Assoc. Iron Steel Technol. 2007, 1, 451. [Google Scholar]
  24. Mao, F.; Chen, F.; Han, Q.; Han, J.; Cao, Z.; Wang, T.; Li, T. Real time observation on the solidification of strontium-modified zinc–aluminum–silicon alloys by synchrotron microradiography. J. Alloys Compd. 2014, 608, 343–351. [Google Scholar] [CrossRef]
  25. Chen, F.; Mao, F.; Xuan, Z.; Yan, G.; Han, J.; Wang, T.; Cao, Z.; Fu, Y.; Xiao, T. Real time investigation of the grain refinement dynamics in zinc alloy by synchrotron microradiography. J. Alloys Compd. 2015, 630, 60–67. [Google Scholar] [CrossRef]
  26. Xu, Y.; Deng, Y.; Casari, D.; Mathiesen, R.H.; Li, Y. In-situ X-radiographic study of nucleation and growth behaviour of primary silicon particles during solidification of a hypereutectic Al-Si alloy. J. Alloys Compd. 2020, 832, 154948. [Google Scholar] [CrossRef]
  27. Tandjaoui, A.; Mangelinck-Noel, N.; Reinhart, G.; Billia, B.; Lafford, T.; Baruchel, J. Investigation of grain boundary grooves at the solid–liquid interface during directional solidification of multi-crystalline silicon: In situ characterization by X-ray imaging. J. Cryst. Growth 2013, 377, 203–211. [Google Scholar] [CrossRef]
  28. Nagashio, K.; Kuribayashi, K. Growth mechanism of twin-related and twin-free facet Si dendrites. Acta Mater. 2005, 53, 3021–3029. [Google Scholar] [CrossRef]
  29. Xu, Y.; Casari, D.; Du, Q.; Mathiesen, R.H.; Arnberg, L.; Li, Y. Heterogeneous nucleation and grain growth of inoculated aluminium alloys: An integrated study by in-situ X-radiography and numerical modelling. Acta Mater. 2017, 140, 224–239. [Google Scholar] [CrossRef]
  30. Bjurenstedt, A.; Casari, D.; Seifeddine, S.; Mathiesen, R.H.; Dahle, A.K. In-situ study of morphology and growth of primary α-Al (FeMnCr) Si intermetallics in an Al-Si alloy. Acta Mater. 2017, 130, 1–9. [Google Scholar] [CrossRef]
  31. Mao, F.; Li, J.; Yan, G. Effect of Eu on the silicon phase in Al-40Zn-5Si alloys. J. Alloys Compd. 2017, 722, 116–130. [Google Scholar] [CrossRef]
  32. Wang, W.M.; Bian, X.F.; Qin, J.Y.; Syliusarenko, S.I. The atomic-structure changes in Al-16 pct Si alloy above the liquidus. Met. Mater. Trans. A 2000, 31, 2163–2168. [Google Scholar] [CrossRef]
  33. Wang, S.R.; Ru, M.A.; Wang, Y.Z. Growth mechanism of primary silicon in cast hypoeutectic Al-Si alloys. Trans. Nonferrous Met. Soc. China 2012, 22, 1264–1269. [Google Scholar] [CrossRef]
Figure 1. Polythermal section of Al-40Zn-xSi phase diagram calculated by Pandat software [31].
Coatings 12 01127 g001
Figure 2. Phase fraction variation with temperature for Al-40Zn-xSi gold under equilibrium solidification calculated by Pandat software: (a) Al-40Zn-1Si, (b) Al-40Zn-3Si, (c) Al-40Zn-5Si, (d) Al-40Zn-6Si.
Coatings 12 01127 g002
Figure 3. Change in solid-phase fraction in Al-40Zn-xSi gold with temperature during non-equilibrium solidification calculated by Pandat software: (a) Al-40Zn-1Si, (b) Al-40Zn-3Si, (c) Al-40Zn-5Si, (d) Al-40Zn-6Si.
Coatings 12 01127 g003
Figure 4. Microstructure of Al-40Zn-xSi alloy: (a) Al-40Zn-1Si, (b) Al-40Zn-3Si, (c) Al-40Zn-5Si, (d) Al-40Zn-6Si, (e,f) ternary eutectic microstructure of Al-40Zn-5Si alloy.
Coatings 12 01127 g004
Figure 5. (a) Cooling curves of Al-40Zn-xSi alloys, (b) amplification of the reaction region of Al-Si eutectic in figure (a).
Coatings 12 01127 g005
Figure 6. Synchrotron radiation images of Al-40Zn-3Si alloy during solidification at different times.
Coatings 12 01127 g006
Figure 7. Synchrotron radiation images of Al-40Zn-5Si alloy during solidification at different times.
Coatings 12 01127 g007
Figure 8. Synchrotron radiation images of Al-40Zn-6Si alloy during solidification at different times.
Coatings 12 01127 g008
Figure 9. Microstructure of high-purity Al-40Zn-5Si alloy with different P contents: (a) 0, (b) 5 ppm, (c) 10 ppm, (d) 15 ppm, (e) 20 ppm, (f) 30 ppm.
Coatings 12 01127 g009
Figure 10. Cooling curves of high-purity al-40Zn-5Si alloy with different contents of P element.
Coatings 12 01127 g010
Figure 11. The series of radiographs at different times showing the solidification sequence of the high-purity Al-40Zn-5Si alloy.
Coatings 12 01127 g011
Figure 12. The series of radiographs at different times showing the solidification sequence of high-purity Al-40Zn-5Si alloy with the addition of 20 ppm P.
Coatings 12 01127 g012
Figure 13. Solute redistribution at the solid/liquid interface: (a) Diffusion only, (b) convection only, (c) both diffusion and convection and (d) occurrence of nucleation [33].
Coatings 12 01127 g013
Table 1. Chemical compositions of commercial-purity (CP) Al-40Zn-xSi and high-purity (HP) Al-40Zn-5Si (wt.%) alloys.
AlloysAlZnSiFeCuTiMgP
CPAl-40Zn-1SiBal.40.111.120.07<0.01<0.01<0.01<0.002
CPAl-40Zn-3SiBal.39.723.110.07<0.01<0.01<0.01<0.002
CPAl-40Zn-5SiBal.40.335.070.06<0.01<0.01<0.01<0.002
CPAl-40Zn-6SiBal.39.826.090.07<0.01<0.01<0.01<0.002
HPAl-40Zn-5SiBal.40.125.05
HPAl-40Zn-5SiBal.39.885.03<0.0005
HPAl-40Zn-5SiBal.39.935.11<0.001
HPAl-40Zn-5SiBal.40.144.93<0.0015
HPAl-40Zn-5SiBal.40.065.07<0.002
HPAl-40Zn-5SiBal.40.114.96<0.003
Publisher’s Note: MDPI stays neutral with regard to jurisdictional claims in published maps and institutional affiliations.

