Article

Deuterium Retention in Mixed Layers with Application in Fusion Technology

1
National Institute for Laser, Plasma and Radiation Physics, 409 Atomistilor Street, 077125 Magurele, Romania
2
Faculty of Physics, University of Bucharest, 405 Atomistilor Street, 077125 Magurele, Romania
3
Horia Hulubei National Institute of Physics and Nuclear Engineering, 077125 Magurele, Romania
*
Author to whom correspondence should be addressed.
Coatings 2022, 12(7), 951; https://doi.org/10.3390/coatings12070951
Submission received: 27 May 2022 / Revised: 24 June 2022 / Accepted: 26 June 2022 / Published: 5 July 2022
(This article belongs to the Special Issue State-of-the-Art on Coatings Research in Romania 2021-2022)

Abstract

:
Formation of Be-W mixed layers in thermonuclear fusion reactors can potentially alter the retention of hydrogen isotopes and affect the retention and release properties of these isotopes. This paper reports on the retention and release characteristics of D from reference Be, W layers as well as three Be-W mixed layers with well-defined atomic concentrations (2:1, 1:1, 1:2). The layers resulted from the sputtering of Be and W materials in Ar:D (1:1) mixture at 2 Pa using DC magnetron sputtering. The mixed layers’ deposition parameters were varied to adjust accordingly the deposition rate for each material in order to obtain the desired concentrations. Scanning electron microscope images showed that morphology is independent of composition for samples deposited on silicon substrates. In contrast, layers deposited on tungsten revealed a textured surface and morphological changes with W concentration variation. X-ray diffraction patterns of mixed layers evidenced the presence of a polycrystalline tungsten phase. Additionally, the degree of crystallinity is highly influenced by the plasma parameters and enhanced amorphization is evidenced by a decrease of crystalline size by a factor of 10 for mixed layers compared to the W reference layer. The release behavior of D from the layers is affected by the trapping contribution of both Be and W. Compared with implanted layers, presented in literature studies, the co-deposited layers show a high D occupancy of low energy trapping states, the majority of the D retained in the samples being released at temperatures below 623 K. High energy trapping becomes more pronounced for layers with a high Be concentration. The oxygen contamination observed for Be layers points to a mitigation of D retention in low energy trapping states and shifts the desorption chart towards a higher temperature due to enhanced retention in BeO associated traps. The D retention presents a linear decrease of W concentration in the sample.

1. Introduction

Despite the best efforts of the engineers and physicists from the fusion community, hydrogen (H) isotope retention in plasma facing components (PFC) was and still remains one of the most complex issues to solve in order to make a sustainable transition from experimental to commercial fusion reactors. The enhanced H isotope retention was the main reason behind the decision to replace carbon (C) with all metal PFCs in experimental and future commercial reactors [1,2,3]. For the foreseeable future, experimental reactors such as the International Thermonuclear Experimental Reactor (ITER) and the first generation commercial reactors’ demonstration power plant (DEMO) are designed to operate using deuterium (D) and tritium (T) as nuclear fuel. T raises important concerns regarding the operational costs and safety of the fusion reactor, due to its limited supply and radioactive properties [4,5,6,7,8].
To prevent a massive release into the environment in the case of containment failure, the total allowed T retention in ITER walls is limited to 700 g [9]. The current all-metal design of ITER includes the use of beryllium (Be) PFCs for the first-wall and tungsten (W) PFCs for the divertor, both materials presenting good plasma compatible properties [10]. Considering that nuclear fuel retention was the main reason for replacing C PFC with W and Be, retention in metallic layers is not necessarily small. In laboratory experiments, the levels of D/W have reached peak values of 5 at%, as was reported in several studies [11,12,13], and under the right conditions D retention in Be layers can reach levels (40 at%) similar to those observed in C PFC [12,14]. Under normal operating conditions, chemical sputtering should not be an issue for an all metal ITER design. However, despite the best efforts to magnetically confine the plasma, the first wall will still be subjected to an intense bombardment with plasma species, enhancing in the physical sputtering of Be PFC. Despite the low yield, W PFCs can also be sputtered, leading to prompt re-deposition on nearby surfaces [15]. Erosion and migration of these materials during ITER operations will lead to the formation of mixed-material layers with different properties in relation to original PFCs. Two main mechanisms responsible for nuclear fuel retention in ITER will be the implantation of the hydrogen isotopes into PFCs and co-deposition of the eroded materials together with nuclear fuel [4,16,17].
Experimental results and simulations show that, among the two retention mechanisms, co-deposition will be by far the most dominant mechanism in ITER. It will primarily consist of the formation of H isotopes containing Be layers in magnetically shadowed areas of the vessel and on the W PFCs in the divertor region [8,18,19]. Furthermore, by means of simulation it was estimated that the maximum T-allowed retention in ITER (700 g) will be reached after a limited number of 400 s pulses (between 3000–20,000), seriously affecting the reactor’s lifetime. In this context, it is important to develop reference samples and suitable deposition techniques in a laboratory framework to obtain and extrapolate usable results for ITER. In specialized literature, the most common technique employed to produce Be-D and W-D co-deposited layers is via linear plasma generators. Physical vapor deposition techniques, such as magnetron sputtering, can also be employed due to similarities between the resulting layers and those observed in current experimental fusion reactors such as JET [20,21]. One of the unwanted effects of plasma–wall interaction is the formation of the Bex-Wy layers with potential dramatic consequences for operations in ITER. Separate studies concerning the co-deposition of Be and W with D were performed and discussed in detail, providing important information about D retention and thermal release behavior in relation to deposition parameters (substrate temperature; ion energy and gas pressure; layers thickness; deuterium flow; layer composition) [11,13,21,22,23,24,25,26,27,28,29,30,31,32].
In contrast, D retention in mixed Be-W layers has been sparsely studied in the literature, with most of the experiments being conducted via D ion implantation. Mateus et al. implanted Be, W and Be-W (50–50 at%) layers obtained by the thermionic vacuum arc technique with 15 KeV H+ ions at room temperature to study the layers’ morphology influence on retention [33]. The results indicate only a negligible influence of this particular parameter on H retention. K. Sugiyama et al. studied the retention in Be based mixed layers (Be-C, Be-O and Be-W) at smaller D ion energies (200 eV) and he observed a significant reduction of D released from the Be-W layers and concluded that a small concentration of W can mitigate the formation of trapping sites in beryllium [34]. Another study, over a wider range of Be-W layer composition, was carried out by Jepu et al. using the Pisces B linear plasma generator [35]. The result showed that D retention primarily increases with the Be content in the sample. The same conclusion was derived by Dinca et al. in an experiment performed on samples with a similar composition [36]. Compared to implantation studies, the number of experiments that addressed retention in co-deposited layers is limited to only a couple. The first study that treated the retention in Be-W mixed layers was performed by the main author of this paper and it was devoted to understanding the influence of nitrogen impurity seeding on deuterium retention in mixed Be-W layers [37]. Among other structural and compositional differences, the authors observed that nitrogen significantly alters the trapping mechanisms and shifts the D desorption onset to higher temperatures, which could potentially affect the tritium removal procedures in ITER. It was also pointed out that N desorption is very well correlated with D desorption potentially acting as a trapping state barrier for D. This was followed by a more complex work by Zibrov et al. over a wide range of samples deposited at 0.8, 2.7 and 8 Pa respectively, with small amounts of W impurities (4.3–28 at%) [38]. He observed that D retention is positively correlated with the increase of gas mixture pressure and, in contrast with the conclusions of K. Sugiyama et al. [34], the results indicate an increase of retention with a factor of two for layers with low W content (4.3–7.3 at%) in comparison to Be-D layers, independently of the deposition pressure. As it was stated by the authors, this points to a different incorporation of D in co-deposits compared to implanted layers.
To extrapolate useful results for ITER, more studies are needed to accurately predict the trapping and thermal release behavior of D from mixed Be-W layers. In this manuscript we continue our previous work in Dinca et al. [36] by studying Be-W layers with the same metallic composition (Be-W (1:2, 1:1 and 2:1) as well as reference Be and W layers. Still, in this experiment the layers will be co-deposited with D, unlike the previous one where they were implanted. These two manuscripts can provide the basis for a comparison between the main D retention mechanisms in ITER (co-deposition and implantation) applied for a specific case. On the other hand, it can also be viewed as a continuation of Zibrov et al.’s [38] study and the results can bridge the gap in knowledge for a mixed Be-W layer with W content higher than 28%.

2. Materials and Methods

2.1. Layer Deposition

The co-deposition of mixed (Be-W) and reference (Be, W) layers together with D was performed in a small cylindrical shape vacuum chamber with a volume of 0.05 m3 (diameter of 40 cm–height of 40 cm). The chamber was pumped down to a base pressure of 10−4 Pa prior to the deposition with a vacuum system composed of a turbo-molecular and a dry scroll pump. A schematic representation of the deposition setup is illustrated in Figure 1.
The mixed and reference layers were deposited on three types of substrates—silicon (100), tungsten and graphite—all of them having the same dimensions (12 × 15 mm2). The tungsten and graphite underwent a polishing process. The first step consisted of a course of polishing using SiC paper and it was followed by a fine polishing with Al2O3 nanopowder, resulting in a nearly mirror finished surface with an average roughness of 50 nm. The resulting debris was removed using deionized water. Furthermore, the substrates are cleaned for 15 min in an ultrasonic bath in a mixture of acetone and isopropyl alcohol in order to facilitate the removal of microscopic dust particles. Subsequently, they were washed abundantly with distilled water and left to dry in atmospheric air. The Si 100 substrates were subjected to the same cleaning procedure. Subsequently, the substrates are mounted on a circular holder at a distance of 10 cm with regard to the Be and W sputtering sources.
When the base pressure value is 10−4 Pa, Ar is introduced in the vessel and a glow discharge is ignited on the substrates with the aim of removing surface impurities and oxides. The Be and W sputtering sources consisted of two water-cooled magnetron cathodes provided with high purity (99.95%) Be and W circular (50 mm diameter- 3 mm thickness) targets operated in DC magnetron sputtering regime. After the substrates cleaning, both Be and W target were sputtered clean in pure Ar atmosphere at 2 Pa for approximately 30 min. During this time the substrates were shielded with a shutter from the plasma sources. For the final step, D2 gas was introduced into the vacuum chamber through a calibrated Mass Flow Controller to initiate the reactive sputtering. The Ar/D ratio was 1:1 and this ratio was used for all depositions. The total pressure of the gas mixture was stable at 2 Pa throughout the whole coating process. A −80 V polarization voltage was supplied on the substrate to enhance the ion bombardment of the growing layers. During the deposition process, the substrates were indirectly heated by the two plasma sources. Considering that the plasma sources were operated at different powers depending on the layer composition, the substrate temperature varied from 340 K when only the Be was deposited to 360 K for mixed layer depositions.
The desired layer composition was adjusted by performing calibrations before each batch was deposited. A quartz microbalance was positioned in the virtual place of the substrates to evaluate separately the sputtering rate for Be and W, assuming a bulk density of 19.2 g/cm3 for W and 1.85 g/cm3 for Be [31]. Based on these calibrations, the process duration was adjusted for each batch to obtain a final desired thickness of 500 nm. In total, five batches of samples resulted from the experiment, namely reference Be and W layers and three mixed Be-W layers (1:2; 1:1; 2:1), respectively. The deposition parameters, such as Be and W discharge voltage (UBe, UW), discharge current (IBe, IW) and deposition rate (DBe, DW), are presented in Table 1. Together with these parameters each batch was indexed with a codename for an easier discussion of the results further on. Mixed Be-W will be assigned a codename dependent on the nominal atomic concentration of W in the layer. For example, the codename of Be-W (1:1) will be W50. Separately, a list of abbreviations is provided at the end of the manuscript for the most common terms used throughout the paper text.

2.2. Layer Analysis

A FEI Co. model Inspect S was used to acquire the SEM images for the mixed Be-W and reference Be and W layers co-deposited with deuterium. The analysis of the layer morphology was conducted for samples deposited on Si and W substrates. The measurement parameters were: 25 kV electron acceleration voltage, 5000× magnification and a working distance of 16.8 mm.
Crystalline structure investigations were carried out with X-ray diffraction (XRD). Measurements were performed only on layers deposited on Si(100) substrate due to the reduced layer thickness (500 nm) and in order to avoid the overlapping of W signals from the layer with the one given by the polycrystalline W substrates. Measurements were performed in a Bragg–Bretano configuration, using a classic diffractometer provided with a Cu-Kα X-ray source (0.154). The samples were analyzed over a wide 80° interval, between 20° and 100°, with a step of 0.01° and an acquisition time of 2 s per step.
Rutherford backscattering spectrometry (RBS) data were acquired for the mixed Be-W layers to provide reliable quantitative information regarding the Be and W concentration as well as the oxygen impurity distribution. Measurements were carried out in the 3 MV Tandem Accelerator facility available at IFIN-HH in Bucharest [39]. Layers deposited on 12 × 15 mm2 graphite substrate were investigated in a single measurement run. Ion beam analysis was only performed on layers deposited on graphite substrate because they allow a better quantification of the layer stoichiometry compared to Si substrates [34]. Samples were mounted on a holder inside a high vacuum chamber (10−5 Pa). A precise (0.01o) stage-controlled goniometer was used to sequentially position each sample for the experiment. A broad beam with a diameter of 1 mm composed of 4He+ monoenergetic ions was focused on the layers at normal incidence. The backscattered particles’ energy was measured with a silicon solid-state detector positioned at an angle θ = 165o with respect to the ion beam. The energy resolution of the detector was 18 keV and it was calibrated prior to the measurements with thin films of gold. The energy of the 4He+ ion beam was 2.6 MeV, selected below the 3.6 MeV threshold energy where neutrons from Be layers which can activate the materials inside the HV-chamber. The accumulated charge was measured with a Faraday Cup and the final value for each measurement was 10 µC. The elemental areal densities of the layer metallic constituents (Be and W) and impurities, respectively, were obtained by fitting the RBS experimental spectra with simulated spectra in SIMRA computer code developed at IPP Garching [40].
Thermal desorption spectroscopy was employed to investigate the D trapping and release behavior from mixed and reference layers. The experiments were conducted on layers deposited on W. The experimental setup was composed of a Quadrupole Mass Spectrometer (QMS), a quartz tube, an oven and a vacuum system. The samples were loaded into the quartz tube and were sequentially measured. Since the samples were heated via thermal radiation from the oven a calibration was carried out to correlate the temperature measured on the oven with the one measured on the sample. This was performed by placing a thermocouple in direct contact with the W bulk substrate during a full temperature cycle. After the samples were loaded into the quartz tube, the setup was pumped down to a base pressure of 10−6 Pa and the heating cradle area was outgassed up to 1300 K. Subsequently the samples were measured one by one and in between the measurements a blank full temperature cycle was performed to determine the background levels. In all TDS measurements the maximum temperature was set at 1300 K with a constant heating rate of 10 K/min. The released species were detected and recorded by the QMS as ion currents.

3. Results and Discussion

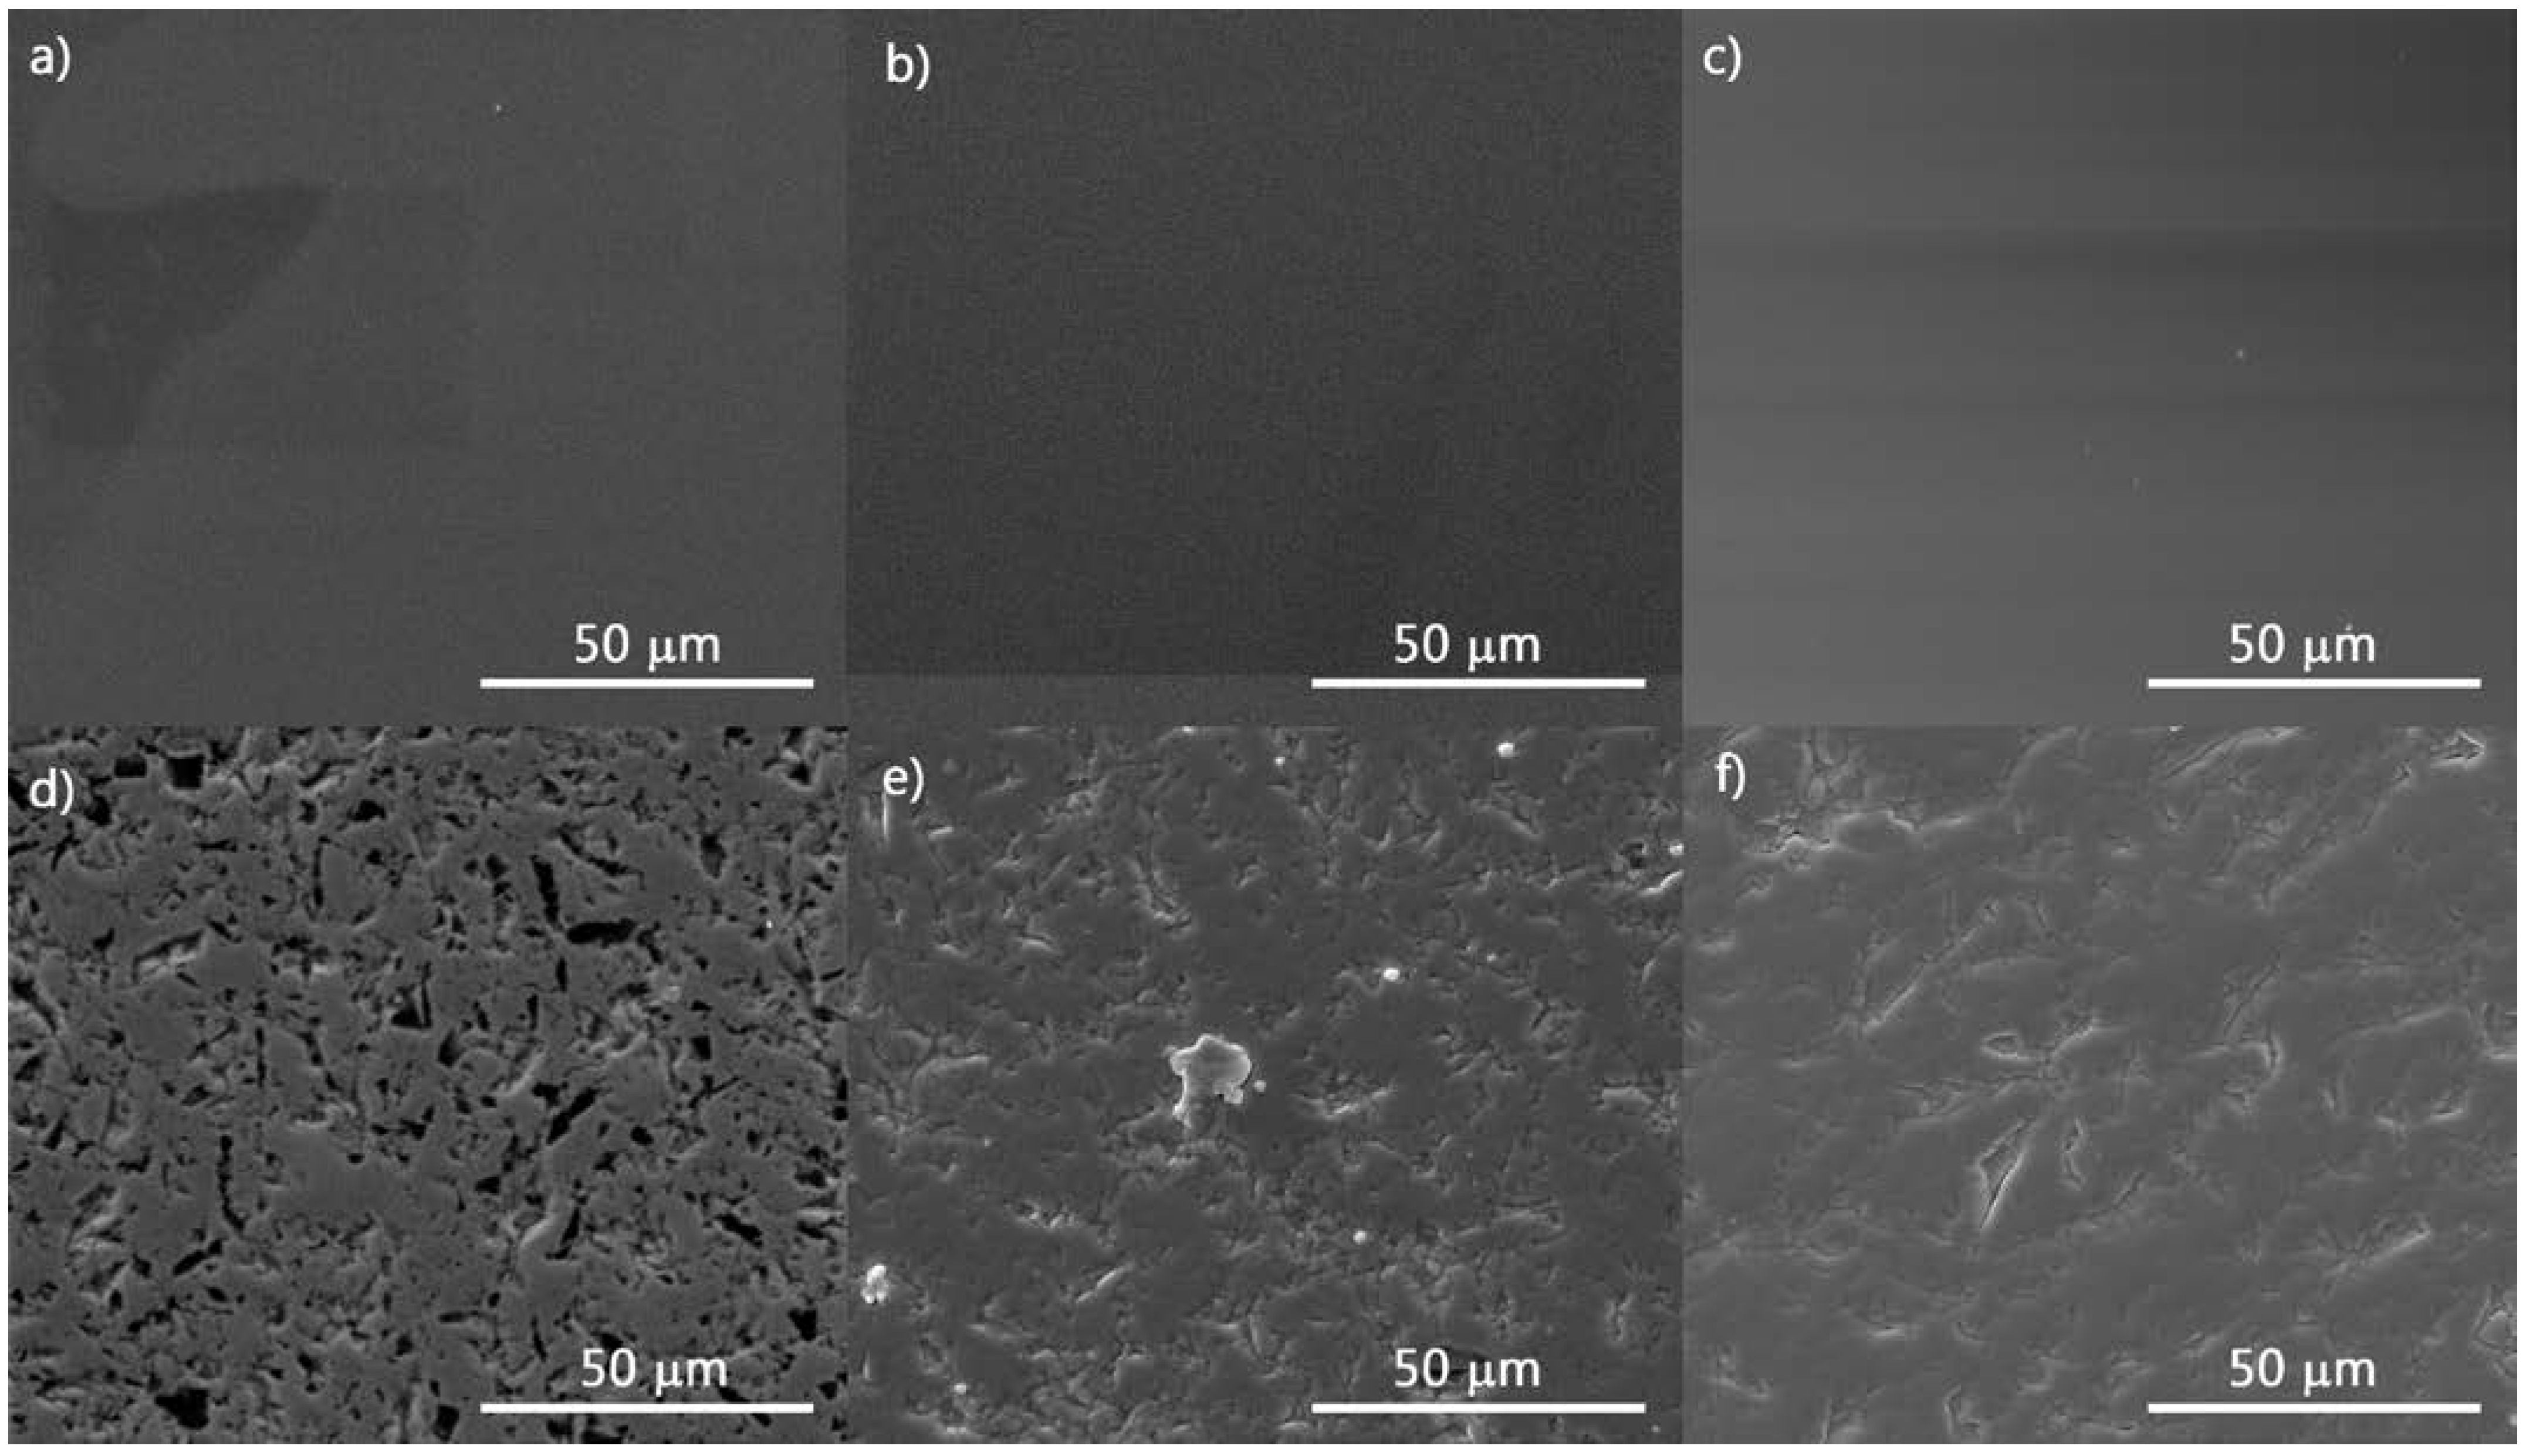
3.1. Layer Morphology

To investigate the material mixing and substrate influence on the morphology of D containing co-deposited layers, SEM micrographs were collected for samples W33, W50 and W66, respectively, deposited on W and Si substrates. The results are illustrated in Figure 2. The caption below includes the code of the samples together with the abbreviated symbol for the substrate
Clearly, from the beginning it can be observed that the substrate’s nature has a strong influence on the mixed Be-W layers’ growth. The W33 layer (Figure 2a) appears to be very smooth with no obvious imperfections and no specific features that can be observed at the magnification used here (5000X). It can also be pointed out that the layer is composed of small grains uniformly distributed along the surface and that could indicate a potential dense microstructure. However, this hypothesis cannot be verified using cross section images, due to work restrictions for beryllium. In a previous study [36] it was observed that a dense microstructure leads to a reduced D trapping in high energy binding states. Similar morphologies were observed for the rest of the mixed layers (Figure 2b,c), which can lead to the conclusion that in this case layer morphology is independent of Be and W composition. On the other hand, layers deposited on W substrate have a textured morphology with no ordered surface growth. This is emphasized by the morphology of the W33 sample (Figure 2d), where surface voids and defects are observed. These surface characteristics were also noticed for Be layers deposited on tungsten substrates in a previous work performed by the authors [41]. As it was underlined there the main cause can be the chemical and roughness difference between the Si and W substrates. Unlike the previous work, where only Be layers were deposited, here we can see an evolution of the surface morphology with the Be/W ratio in the samples. With the increase of the W concentration in layers, the surface defects tend to coalesce to form a compact surface morphology. This can be attributed to the ordinate growth of W on a substrate with similar properties.

3.2. Crystalline Structure

The diffraction pattern resulting for the Be layer (not shown here) deposited on the Si substrate did not indicate the presence of the diffraction peaks specific to a beryllium crystalline phase; the most likely explanation being the X-ray transparency properties of Be.
The diffraction pattern of the tungsten layer is illustrated in Figure 3. The investigated sample presented a crystalline phase corresponding to metallic tungsten, Im-3 m space group and a body-centered cubic arrangement of the atoms in the elemental lattice. The sample crystalline nature is evidenced by ordinate growth on W 110 and W 200 orientation. Additional reduced intensity and hkl orientations (not shown here) corresponding to the tungsten metallic phase (W 211 and W 220) were observed at higher angles; however, preferential growth of crystallites was on the W 200 orientation.
The diffraction patterns of mixed layers are presented in Figure 4. The shift between the patterns is intentionally introduced in order to better differentiate them. The pattern obtained for the W50 layer indicates the presence of the same tungsten metallic phase as that identified for the pure W layer, in this case with preferential growth on the W 110 orientation. Similar crystalline growth and orientations were identified for W66 and W33 layers, respectively. However, for W33, besides the W orientations, an additional crystalline hydride phase identified as a beryllium deuteride (BeD2) was identified, its only peaks corresponding to the preferential orientation of BeD2 (022). BeD2 formation was only observed for the W33 sample and one can argue that the high Be concentration in this sample is the main reason. However, a crystalline phase corresponding to BeD2 was not observed for the Be layers presented in this study or in previous studies where the layers were produced using the direct current magnetron sputtering technique [36,38,41]. Thus, the formation of these compounds here is not clearly understood. A direct comparison between the diffraction patterns of W and Be-W layers indicates a widening of the 110 orientations for mixed layers compared to pure W layer. The widening could be caused by the presence of both beryllium and deuterium in the tungsten matrix which can induce micro-stress. However, it is observed that between mixed layers the degree of crystallinity is not necessarily influenced by the Be content in the sample. On the contrary, the sample with the lowest Be concentration, namely W66, has the lowest crystalline order as shown in Figure 4, and the W50 presents the highest crystalline order among the mixed layers. The observed discrepancies can be caused by the different plasma parameters applied during the coating process. In Table 1, it can be seen for W66 that Be plasma parameters (I, V) are significantly lower, which in turn leads to a reduced plasma density, a lower ionization yield and consequently to a reduction of the ion flux impinging on the just forming layers. On the other hand, the W50 sample has the highest power applied to both Be and W cathodes, leading to an enhanced ion bombardment during deposition and consequently to an increased ad-atom mobility which improves the crystalline structure [42].
The analysis of the diffraction peak profiles was performed in order to assess the crystalline size from the peak full width at half maximum. The width of the Bragg peak is influenced by both sample and instrumental induced effects and thus for a correct analysis it is necessary to determine the widening induced by the diffractometer.
The instrumental peak broadening was measured using a corundum standard calibration material for the XRD equipment. The size of crystals for the metallic tungsten phase was calculated based on 110 orientation. The obtained results are shown in Table 2. A decrease of crystallite size with an order of magnitude can be seen from pure tungsten layers to mixed Be-W.

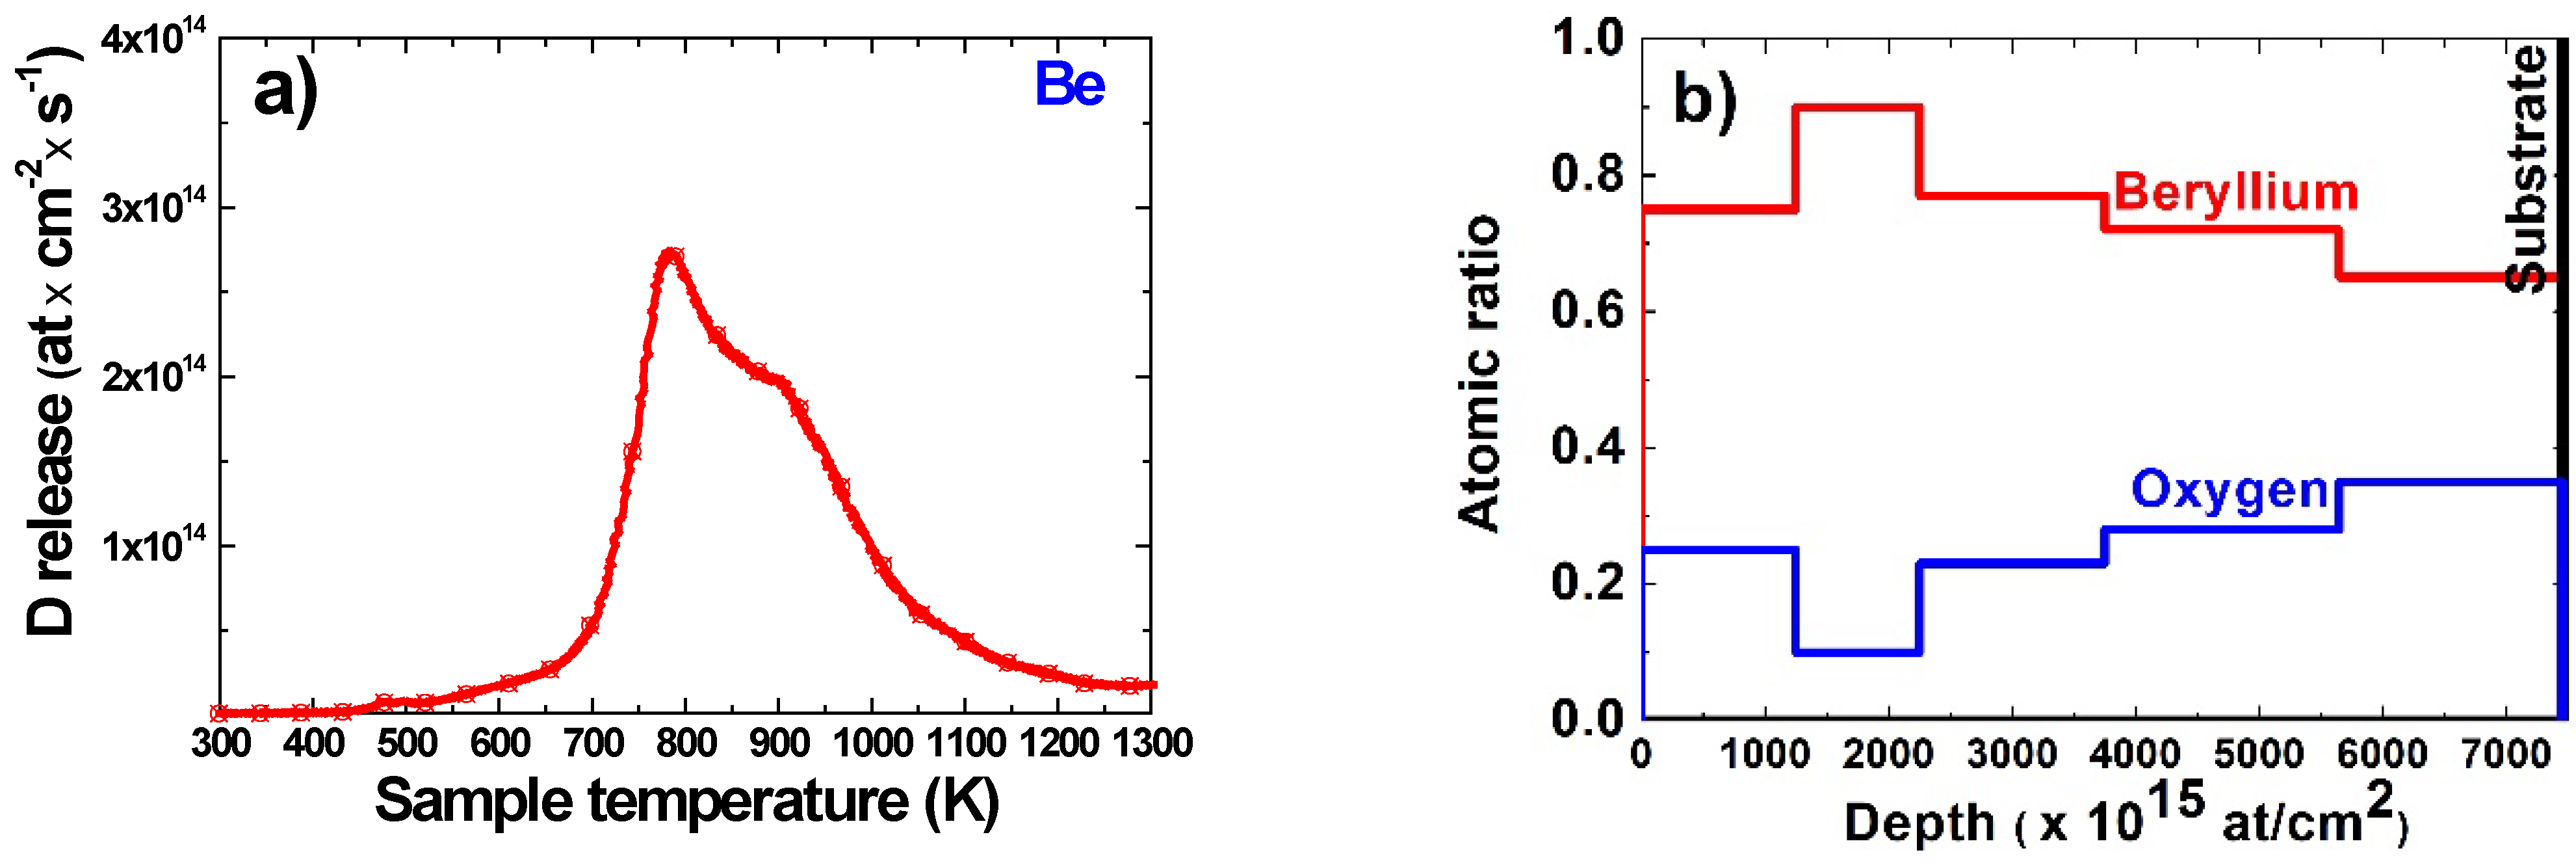
3.3. Compositional Analysis

Figure 5 illustrates the RBS spectrum of the W50 layer. As we can see the spectrum is represented as counts versus the channel number. The channel number allows for the identification of the layer atomic constituents and the counts axis provides information about the elemental abundance in layers. For the spectrum presented in Figure 5, we identified that the main constituents of the layers are W, O, the graphite substrate and of course Be, which will be indirectly quantified. The highest peaks in the spectrum correspond to W and C from the substrate.
In Figure 5 the experimental RBS spectrum (dots) is fitted with the simulated SIMRA spectra (line). A good correlation between them is observed and this is essential to obtain a better precision in determining the elemental areal densities.
The highest peaks noticed in the spectra correspond to W (from the deposited layer) and C (from the substrate) with a small contamination of oxygen which is present throughout the whole film thickness.
A comparison of the W signals corresponding to the mixed layers is presented in Figure 6. As can be seen, the typical W signal has a sharp clearly defined edge around channel 850, followed by a plateau and a tail-like elongated decrease (675–725). It can be observed that the count values are constant throughout the plateau region suggesting that tungsten is uniformly distributed throughout the film thickness.
Separately, the sharp increase at ~850 is given by He ions’ interaction with the layer surface. The tail elongation a result of the interaction with the layer–substrate interface and the elongation is more pronounced with the increase of substrate roughness.
The results obtained in Figure 6 for the mixed Be-W layers indicate, as expected, an increase of the W signal with its concentration in layers, with the most intense signal observed for W66. Besides this aspect, we can also observe that the width of the W peak is slightly different for each type of layer, which means that there are slight differences in film thickness also.
The depth profile of W33 results from the fitting of the experimental spectra with SIMRA (Figure 7). The largest part of the layer was simulated using a single layer with a width of 2.9 × 10¹⁸ at/cm2, attesting to the homogeneous distribution of the elements in depth. The resulting atomic concentrations for Be and W determined using RBS are similar to the desired concentrations for W33. On the other hand, the layer–substrate interface region was harder to resolve due to the inhomogeneity caused by the substrate roughness, requiring a total number of five layers to obtain a good agreement between the experimental and simulated data. The only impurity identified is oxygen, whose presence in the depth of the layers shows a continuous, small contamination of 5 at%. This contamination was also observed for the rest of the Be-W mixed layers, with the observation that it is larger close to the interface, the source most likely being the oxygen at the layer–substrate interface, which can diffuse in the deposited samples.

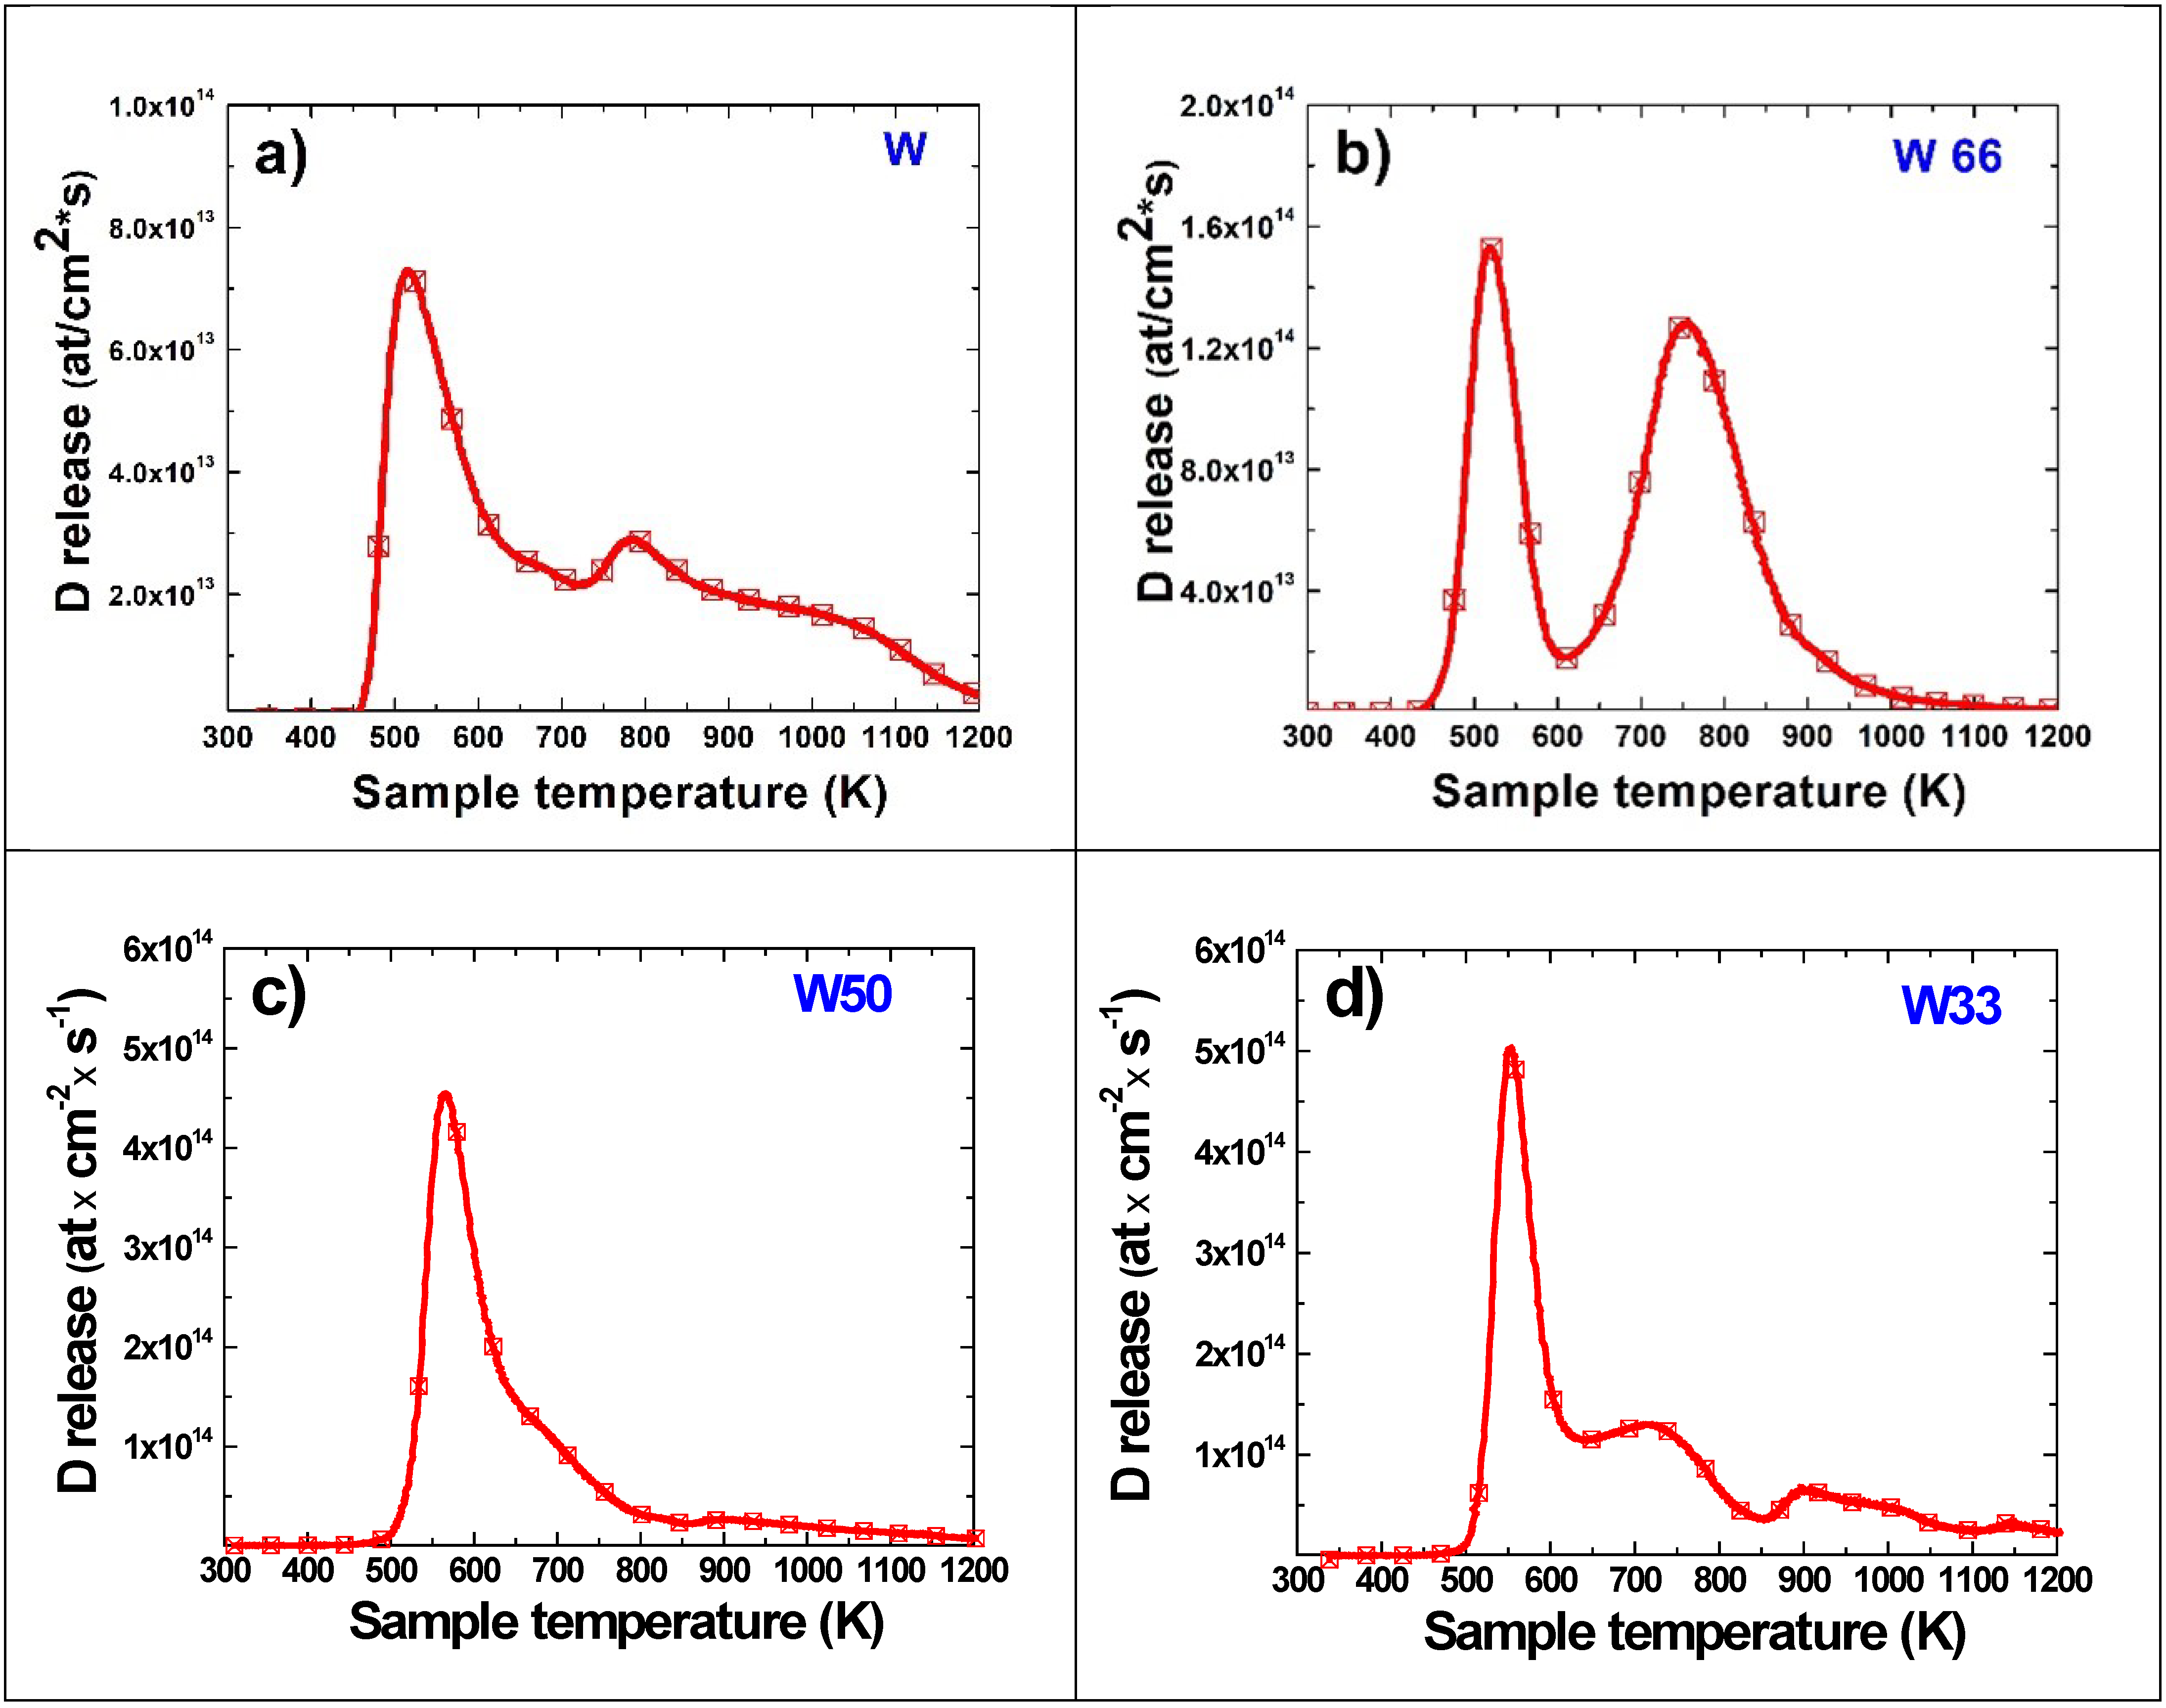
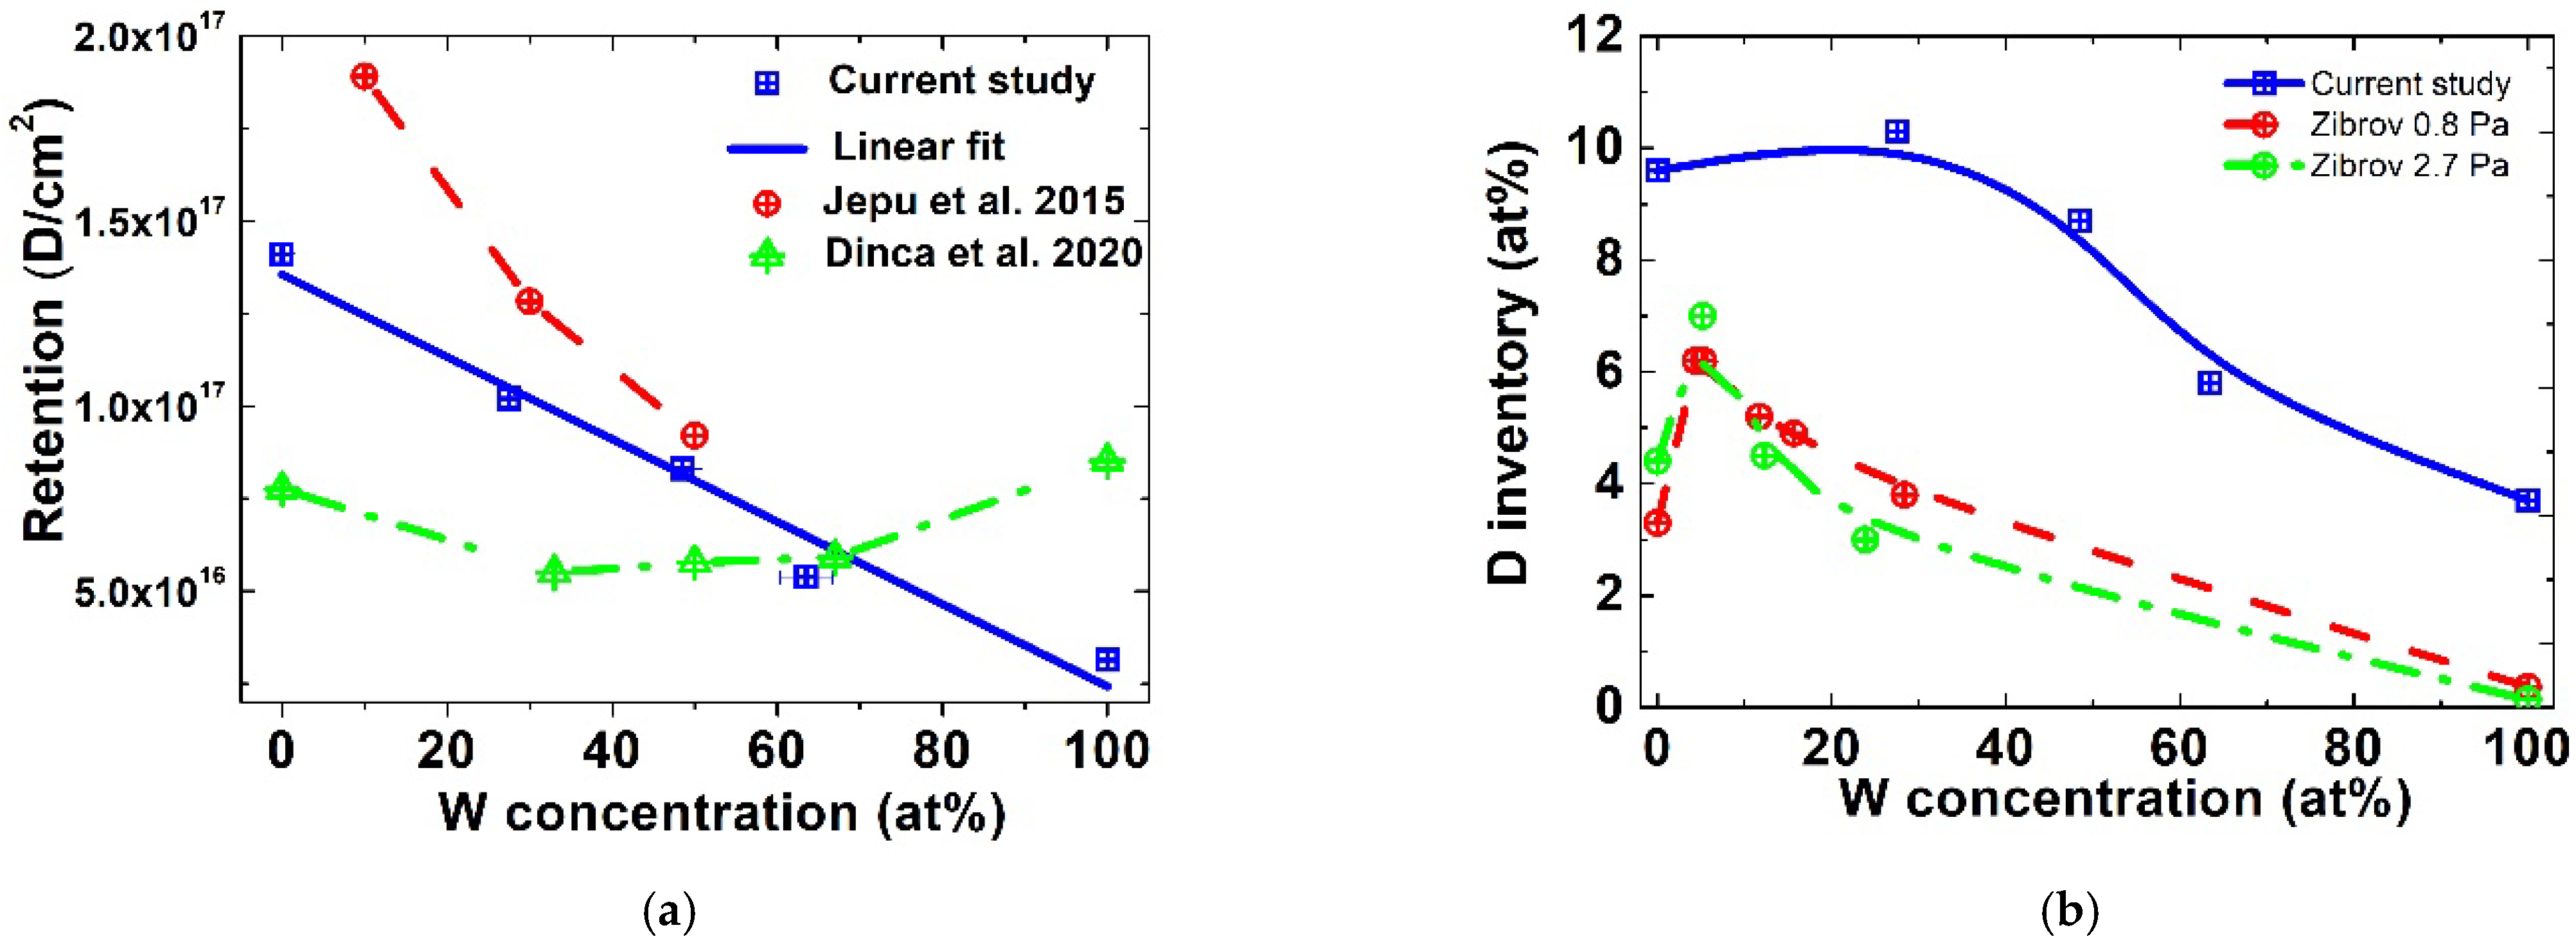
3.4. Deuterium Retention

During TDS measurements, the release of multiple gaseous species from the sample was monitored with an emphasis on mass 3 and mass 4, corresponding to HD and D2, respectively. As was observed in an earlier study [41], the release of D atoms from the co-deposited samples was mainly dominated by D2, unlike the HD dominated release from implanted layers [36]. To quantify the D2 release, calibrations were performed by leaking known amounts of D2 into the TDS chamber. For HD, H gas was leaked and the calibration factor was obtained as an average between the calibration factor of H and D2. By converting the ion current given by the QMS into an atom flux and normalizing it to the area of sample surface, the TDS charts below are given in at/cm2.
The D release curves resulting from the TDS measurement of W and mixed Be-W layers are presented in Figure 8. The desorption chart of the reference W sample (Figure 8a) has a two peak release behavior for deuterium. The first desorption feature on the chart is characterized by a broad strong release observed for the 450–600 K temperature range, with a peak at 510 K. This desorption feature was followed by a smaller release (730–850 K) with a distinct peak at 780 K. For temperatures above 850 K a “shoulder type” release is still observed up to the final programmed temperature. The desorption pattern of the W layer in this study is similar to those observed in previous works [43], and its appearance suggests the presence of at least three trapping energies. The D trapping energies in W were extensively studied by Poon et al. [43], who explained that the 520 K peak observed in TDS measurements is associated with the de-trapping of molecular and atomic D from vacancies. On the other hand, Wang et al. [29] attribute the 520 K release to D de-trapping from intrinsic defects, namely dislocations and grain boundaries. The continuous release observed in the high temperature range (>900 K) can also be explained by the trap modelling work performed by Poons [43]. In his work, the high energy trapping behavior can be explained by the clustering of vacancies or interstitial trapping sites leading to the formation of voids, with D being retained on the inner surface of the voids. By integrating the contribution of the trapping sites from the TDS spectra, the results show that the majority of the D content is released from vacancies complexes (64%) at temperatures below 900 K. A significant amount of D has also been released at temperatures above 900 K (36%), which suggests that “void-type defects” are created during deposition.
In an earlier work published by the authors [36], the W samples were implanted with D using a plasma torch. There, the main release occurred at temperatures larger than 800 K. However, in this study, the largest part of the D inventory (40%) in pure W layers is released at temperatures lower than 700 K.
The W66 desorption curves point to a similar release profile (Figure 8b) with the reference W layer. Desorption has an onset at 450 K and, after the second main release peak, it decreases exponentially at high temperatures. The first main feature observed on the chart, between 450 K and 600 K, has a maximum release at 520 K and it is followed by a second wide release, between 600 K and 900 K, with a maximum at 760 K. In comparison to the W reference, a small shift of the peaks in relation to temperature is noticed. In this case, the peak associated with low energy trapping is shifted with 10 K towards higher temperatures and the second release is shifted with 20 K towards lower temperatures. There is also a significant increase in release, with a factor 2 increase for the 520 K and a factor 3 increase for the 760 K peak, respectively. In this case, Be has a positive contribution concerning the energy trapping of D above 900 K, reducing the contribution of this trapping-state to D inventory by a factor of 2, compared to the pure W case. Yet, the increase of D released at lower temperatures can point to the fact that Be provides additional trapping sites for D in the layer. This hypothesis can also be supported by the fact that most trapping states in Be release D at similar temperatures to those observed for the main desorption features of W66 [44]. On the other hand, the power applied on Be cathode automatically increases the plasma density and implicitly the ionization rate which can also lead to an enhanced D ion flux towards the substrate. Both hypotheses mentioned above can have a complementary effect in practice, which can account for the large occupancy of the trapping sites observed in Figure 8b. In terms of trapping dominance, one can clearly see a large occupancy of the “intermediary” trapping sites (600–900 K) compared to low energy trapping. Thus, as expected, the results show that 68% of the D retained in the W66 is released at temperatures between 600 K and 900 K, 24% in 450–600 K range and only 8% above 900 K.
The desorption chart illustrated in Figure 8c presents the release from the W50 layer. Here, it can be seen that a further increase of Be content leads to drastic changes in the D trapping. In contrast with the two-step release behavior observed for W and W66, the release from W50 is dominated by one major peak followed by a low continuous desorption at higher temperatures. One striking difference is represented by the disappearance of the second release peak, which represented the dominant feature for W66. A probable cause might be the increase of the power applied on the Be target from 57 W (W66) to 130 W (W50) which may increase both the metallic and D ion flux to the substrate due to enhanced ionization and consequently increase the ad-atom mobility leading to the mitigation of the vacancies and reducing the available trapping sites for D. This hypothesis can be confirmed by the rise of the low temperature peak with a factor 3 compared to W66, suggesting an accumulation of D in unfavorable low energy trapping states. These states are also evidenced in implantation experiments performed at high D fluencies and become populated after the available trapping sites in Be are occupied [44]. Another important difference is represented by release onset which shifted with 50 K from 450 K (W and W66) to 500 K and of the main desorption peak from 520 K to 570 K. This shift may be caused by an increase in layer thickness, or it could potentially signal the transition from W associated trapping states (dislocation and grain boundaries) to Be trapping states, namely BeD2 [36,45]. The release continues with an elongated tail up to 800 K highlighting the presence of additional trapping sites specific for Be. Furthermore, the D occupancy of the high energy trapping sites has quadrupled compared to W66, indicating that their number increases with Be concentration in the sample. Since co-deposition implies a combined process between deposition and implantation, the defects can be also created in Be by energetic bombardment of the layers with gas ions (Ar, D) as is the case during implantation [44]. By integrating different desorption regions from the TDS spectra in Figure 8c, it resulted in half of the D being released below 623 K, which will be the wall conditioning temperature in ITER [9].
Desorption from the W33 sample is illustrated in Figure 8d. It presents a highly textured D release profile, which is associated with multiple trapping states occupancy. The low temperature peak is clearly defined (500–600 K) with a sharp appearance and a maximum release at 560 K. There is no significant difference compared to the release temperature for W50, clearly pointing to a Be trapping state (BeD2). Additionally, the intensity of the release is slightly larger than W50 and does not follow the trend observed earlier. This clearly confirms the dependence of the trapping state with fluency, since the latter should remain at similar levels with W50, considering that the power applied to the Be cathode is the same. The low temperature peak is followed by a wide feature resembling a desorption shoulder (600–850 K), with a maximum release at 720 K. This peak is attributed in the literature to oxygen impurities in the Be layer, where D is trapped as BeO-D and released by the decomposition of the hydroxide [44]. Another interesting phenomenon is represented by desorption from high energy traps. In contrast to previous samples, W33 has a pronounced release component at temperatures above 850 K, with two identifiable peaks at 900 K and 1150 K. The first was observed in previous studies performed by implantation at low fluency [44] and represent favorable energetic trapping states for D. The second peak could be associated with the decomposition of C-D bonds; however, since it was not visible in previous samples it is highly unlikely that this may be the cause of release. Its origin can be attributed to trapping and de-trapping phenomena in the depth of the Be layer. In comparison to W50, the contribution of high energy trapping doubled for W33. The release profile also indicates that the three trapping states identified for W33 have approximately equal contribution with only 35% of the D inventory being released up to 623 K.
Previously, the Be-W samples implanted by Jepu et al. [35] in the PISCES B facility on a corresponding range of compositions showed similar release behavior for Be with W33 and W50 samples in particular. The low temperature peak for all measured samples was observed, as in our case, in the 500–600 K range. However, the results of Jepu et al. must be treated carefully since the high ion flux used in their experiment (5.5–9.8 × 10²² ions m−2s−1) led to the depletion of Be from a large number of mixed layers. In contrast, the samples implanted at a lower ion flux (2.85 × 10²⁰ D m−2 s−1) by Dinca et al. [36] retained their intended composition and they showed a completely different retention and release behavior.
The low temperature peak was less apparent for the implanted compared to co-deposited samples, which is clear considering the reduced ion flux. Mixed implanted layers retained D at elevated temperatures in a similar way to W66 from the current study which makes the trapping states difficult to identify. In any case, the majority of the D released from implanted samples is trapped in vacancies and defects created by ion bombardment. In Be, deuterium is retained primarily in the BeO surface layer due to the shallow implantation range (<15 nm) at ITER relevant ion energies and due to the low H-isotopes solubility in Be.
On the other hand, the co-deposited layers primarily show a significant and, in many cases, dominant low temperature release. The retention in mixed layers is highly influenced by the Be concentration and by the plasma parameters. The increase of Be concentration also increases the density of the D trapping sites. Plasma parameters, primarily the power applied on the Be target, have a similar role to the fluency in implantation studies. Thus, it was noticed that low energy trapping sites’ occupancy increased with the applied power.
The D desorption curve from reference Be layer is illustrated in Figure 9. The quantity of D release at temperatures lower than 600 K is very small. Above 600 K, an exponential increase is observed with increasing temperature, which represents the main release from this layer. It has a maximum at 780 K and an additional not so obvious peak at ~950 K. Above 950 K, the release has an exponential decrease and continues at reduced levels up to the final programmed temperature. The D trapping mechanisms are similar to thoseobserved for the sample with the highest Be content among the mixed layers (W33), namely BeO-D and D trapping in defects.
The most important difference in relation to the mixed layers is represented by the disappearance of the low temperature peak even though the deposition conditions (pressure and temperature) remain similar. The root cause of the different retention behavior can be the creation of additional BeO trapping sites in the material. This idea is also strengthened by the RBS measurements performed on the Be layer. The depth profile resulting from SIMRA simulation is presented in Figure 9b and it shows an O contamination larger by at least a factor of four compared to the rest of the samples. It gradually increases from surface to interface where it reaches 35 at %, clearly implying that the unintentional O contamination occurred during deposition.
In a previous study, the authors investigated the D retention in Be in relation to the D2 flow introduced into the chamber [41]. The resulting samples showed minimum O contamination (2 at %) and one of the Be layers was obtained with the exact deposition conditions as the one in our current study (pressure, temperature, D2 and Ar flow) in the same coating facility [41]. These provide us with the opportunity to compare both samples given the identical deposition conditions and to assess the influence of oxygen on D release. In contrast to our current study, the ”clean” Be layer [41] had an early desorption onset and a very high occupancy of the low energy trapping states, with the largest part of the D inventory released at temperatures lower than 700 K. This plainly shows that a high oxygen contamination leads to the release of D at high temperatures and potentially introduces a recombination barrier which is detrimental for the in-vessel tritium management in ITER [9]. On the other hand, the D profile of the contaminated Be layer resembles more closely the release observed in implanted Be layers [36], which can be true considering that the shallow implantation depth leads to D retention in an oxidized sub-surface Be layer.
The total D inventory resulting from integrating the D release curves was presented earlier for reference and mixed layers. The resulting values are plotted in Figure 10a as a function of W concentration. Along with them, the results obtained by Jepu et al. and Dinca et al. [35,36] are also represented for comparison. The inventory resulted in Dinca et al. showed a higher concentration of D in “pure” layers and it decreases for mixed layers. Room temperature implantation data (Jepu et al.), despite showing a linear decrease, cannot confirm the trend since there are no data available for higher W concentrations. However, the results obtained for D implantation at 473 K are similar to those obtained by Dinca et al., with lower retention observed for equal Be and W at%. In contrast, the retention values from co-deposited samples presented in this study have a linear decrease with W concentration. A linear fit of the data shows that retention is characterized by the following relation:
R D = 1.34     10 17 + ( 1.15     10 15     X ) ,
where RD represents the D retention, X is the W concentration in layers. However, the above relation is extrapolated based on very few results and a narrow range of deposition pressures. To compare our results with the ones presented by Zibrov et al. [38], the retention is converted in at% using the RBS results (which gives the density of Be and W atoms). It can be seen that, despite the different deposition pressure, the three sets of data follow the same trend, namely the D concentration in the samples decreases with W concentrations. Furthermore, lower (<30 at%) W concentrations in both Zibrov et al. (0.8 Pa) and our current study confirm an increase of retention in comparison to “pure” Be layers. The cause of this phenomena is not yet known and it was not observed either in previous D implantation studies [34]. On the contrary, Sugiyama et al. in his work showed that samples with low W (6 at%) content had a reduced D retention compared to Be layers [34]. Therefore, the hypothesis that a small amount of W can produce additional trapping states in the host material is not confirmed. Thus, it is possible that the increased retention represents a particularity of the deposition technique. The authors go even further to suggest that igniting an additional plasma on the W cathode can lead to a significant increase of D ion flux due to additional ionizations.

4. Conclusions

The aim of this work was to improve the existing scarce knowledge regarding the D retention in mixed fusion related Be/W layers. The mixed and pure Be and W layers were obtained using the DC magnetron sputtering technique in an Ar/D (1:1) mixture. The SEM images show a smooth morphology for all the layers deposited on the Si substrate. The morphology of the layers deposited on W substrates is textured with voids and defects underlying the influence of the substrate in layer growth. The diffraction patterns of the samples showed the presence of a polycrystalline Wrt cubic phase with preferential W 200 orientation for W layer and W 110 for the Be/W layers. RBS measurements confirmed that the resulting concentrations are in good approximation with those intended by the authors. D release behavior from mixed layers is highly influenced by the contribution of trapping states from both Be and W. In terms of release, the co-deposited samples, unlike the implanted sample, present a high D occupancy of low energy trapping states which might prove beneficial for in-vessel tritium recycling procedures in ITER with the largest part of D being released at temperatures below 623 K. On the other hand, high oxygen contamination can be troublesome for layers with high Be content. It leads to the disappearance of the low temperature peak and shifts the release of D to higher temperatures by increasing D trapping in BeO traps. D retention in samples decreases linearly with the amount of W. In contrast, low W concentration (<30 at %) layers showed, both in this study and in Zibrov et al., that D concentration increases in comparison to the Be layer. Since this phenomenon was not confirmed in implantation studies, the authors consider it to be caused by an increase in D ionization and ion flux with the ignition of a second magnetron discharge. Future studies will aim to investigate the influence of substrate temperature and ion energy on the retention and release properties from mixed layers. Another important milestone is to quantify the ion flux towards the substrate under different deposition conditions.

Author Contributions

Conceptualization, P.D. and C.P.; Methodology, P.D. and C.S.; Validation C.P.L. and C.P.; Investigation, O.G.P., A.M.B., C.S., B.B., I.B., F.B. and P.D.; Data curation, P.D.; Writing—original draft preparation, P.D.; Writing—review and editing, C.P.; Visualization, P.D. and B.B.; Supervision, C.P. and C.P.L.; Project administration; P.D.; Funding acquisition, P.D. All authors have read and agreed to the published version of the manuscript.

Funding

This work was supported by a grant of the Romanian Ministry of Education and research, CNCS-UEFISCDI, project number PN-III-P1-1.1-PD-2019-1024, within PNCDI III, and also the Romanian Governmental Programme through the National Programme “Instalații și Obiective de Interes Național”.

Institutional Review Board Statement

Not applicable.

Informed Consent Statement

Not applicable.

Acknowledgments

This work was supported by a grant of the Romanian Ministry of Education and research, CNCS-UEFISCDI, project number PN-III-P1-1.1-PD-2019-1024, within PNCDI III. Ion beam experiments have been performed at 3 MV Tandetron accelerator from “Horia Hulubei” National Institute for Physics and Nuclear Engineering (IFIN-HH) and were supported by the Romanian Governmental Programme through the National Programme “Instalații și Obiective de Interes Național”.

Conflicts of Interest

The authors declare no conflict of interest.

Abbreviations

BeBeryllium
WTungsten
DDeuterium
TTritium
ArArgon
CCarbon
SiSilicon
BeOBeryllium oxide
BeD2Beryllium deuteride
ITERInternational Thermonuclear Experimental Reactor
DEMODemonstration Power Plant
PFCPlasma facing component
DC magnetronDirect current magnetron sputtering
QMSQuadrupole Mass Spectrometer
SEMScanning electron microscope
TDSThermal desorption spectroscopy
XRDX ray diffraction
RBSRutherford backscattering spectroscopy
SIMNRASoftware for simulation of RBS
W50codename of Be-W (1:1)
W33codename of Be-W (2:1)
W66codename of Be-W (1:2)

References

  1. Skinner, C.H.; Federici, G. Is carbon a realistic choice for ITER’s divertor? Phys. Scr. T 2006, T124, 18–22. [Google Scholar] [CrossRef]
  2. Pitts, R.A.; Coad, J.P.; Coster, D.P.; Federici, G.; Fundamenski, W.; Horacek, J.; Krieger, K.; Kukushkin, A.; Likonen, J.; Matthews, G.F.; et al. Material erosion and migration in tokamaks. Plasma Phys. Control. Fusion 2005, 47, B303. [Google Scholar] [CrossRef]
  3. Shimada, M.; Pitts, R.; Loarte, A.; Campbell, D.J.; Sugihara, M.; Mukhovatov, V.; Kukushkin, A.; Chuyanov, V. ITER research plan of plasma-wall interaction. J. Nucl. Mater. 2009, 390–391, 282–285. [Google Scholar] [CrossRef]
  4. Roth, J.; Tsitrone, E.; Loarte, A.; Loarer, T.; Counsell, G.; Neu, R.; Philipps, V.; Brezinsek, S.; Lehnen, M.; Coad, P.; et al. Recent analysis of key plasma wall interactions issues for ITER. J. Nucl. Mater. 2009, 390–391, 1–9. [Google Scholar] [CrossRef] [Green Version]
  5. Brooks, J.N.; Elder, J.D.; McLean, A.G.; Rudakov, D.L.; Stangeby, P.C.; Wampler, W.R. Analysis of a tungsten sputtering experiment in DIII-D and code/data validation of high redeposition/reduced erosion. Fusion Eng. Des. 2015, 94, 67–71. [Google Scholar] [CrossRef]
  6. Mayer, M.; Andrzejczuk, M.; Dux, R.; Fortuna-Zalesna, E.; Hakola, A.; Koivuranta, S.; Krieger, K.; Kurzydlowski, K.J.; Likonen, J.; Matern, G.; et al. Tungsten erosion and redeposition in the all-tungsten divertor of ASDEX Upgrade. Phys. Scr. T 2009, 2009, 014039. [Google Scholar] [CrossRef]
  7. Janeschitz, G. Plasma-wall interaction issues in ITER. J. Nucl. Mater. 2001, 290–293, 1–11. [Google Scholar] [CrossRef]
  8. Roth, J.; Tsitrone, E.; Loarer, T.; Philipps, V.; Brezinsek, S.; Loarte, A.; Counsell, G.F.; Doerner, R.P.; Schmid, K.; Ogorodnikova, O.V.; et al. Tritium inventory in ITER plasma-facing materials and tritium removal procedures. Plasma Phys. Control. Fusion 2008, 50, 103001. [Google Scholar] [CrossRef]
  9. De Temmerman, G.; Baldwin, M.J.; Anthoine, D.; Heinola, K.; Jan, A.; Jepu, I.; Likonen, J.; Lungu, C.P.; Porosnicu, C.; Pitts, R.A. Efficiency of thermal outgassing for tritium retention measurement and removal in ITER. Nucl. Mater. Energy 2017, 12, 267–272. [Google Scholar] [CrossRef] [Green Version]
  10. Parker, R.R. ITER in-vessel system design and performance. Nucl. Fusion 2000, 40, 473–484. [Google Scholar] [CrossRef]
  11. De Temmerman, G.; Doerner, R.P. Deuterium retention and release in tungsten co-deposited layers. J. Nucl. Mater. 2009, 389, 479–483. [Google Scholar] [CrossRef]
  12. Mayer, M.; Behrisch, R.; Plank, H.; Roth, J.; Dollinger, G.; Frey, C.M. Codeposition of hydrogen with beryllium, carbon and tungsten. J. Nucl. Mater. 1996, 230, 67–73. [Google Scholar] [CrossRef]
  13. Alimov, V.K.; Roth, J.; Shu, W.M.; Komarov, D.A.; Isobe, K.; Yamanishi, T. Deuterium trapping in tungsten deposition layers formed by deuterium plasma sputtering. J. Nucl. Mater. 2010, 399, 225–230. [Google Scholar] [CrossRef] [Green Version]
  14. Krat, S.; Mayer, M.; von Toussaint, U.; Coad, P.; Widdowson, A.; Gasparyan, Y.; Pisarev, A. Beryllium film deposition in cavity samples in remote areas of the JET divertor during the 2011–2012 ITER-like wall campaign. Nucl. Mater. Energy 2017, 12, 548–552. [Google Scholar] [CrossRef]
  15. Wang, P.; Jacob, W.; Elgeti, S. Deuterium retention in tungsten films after different heat treatments. J. Nucl. Mater. 2015, 456, 192–199. [Google Scholar] [CrossRef] [Green Version]
  16. Skinner, C.H.; Haasz, A.A.; Almov, V.K.H.; Bekris, N.; Causey, R.A.; Clark, R.E.H.; Coad, J.P.; Davis, J.W.; Doerner, R.P.; Mayer, M.; et al. Recent advances on hydrogen retention in iter’s plasma-facing materials: Beryllium, carbon. And tungsten. Fusion Sci. Technol. 2008, 54, 891–945. [Google Scholar] [CrossRef]
  17. Federici, G.; Doerner, R.; Lorenzetto, P.; Barabash, V. Beryllium as a plasma-facing material for near-term fusion devices. In Comprehensive Nuclear Materials; Elsevier: Amsterdam, The Netherlands, 2012; Volume 4, pp. 621–666. [Google Scholar] [CrossRef]
  18. Carpentier, S.; Pitts, R.A.; Stangeby, P.C.; Elder, J.D.; Kukushkin, A.S.; Lisgo, S.; Fundamenski, W.; Moulton, D. Modelling of beryllium erosion-redeposition on ITER first wall panels. J. Nucl. Mater. 2011, 415, S165–S169. [Google Scholar] [CrossRef]
  19. Schmid, K.; Krieger, K.; Lisgo, S.W.; Meisl, G.; Brezinsek, S. WALLDYN simulations of global impurity migration in JET and extrapolations to ITER. Nucl. Fusion 2015, 55, 053015. [Google Scholar] [CrossRef] [Green Version]
  20. Baron-Wiechec, A.; Fortuna-Zaleśna, E.; Grzonka, J.; Rubel, M.; Widdowson, A.; Ayres, C.; Coad, J.P.; Hardie, C.; Heinola, K.; Matthews, G.F. First dust study in JET with the ITER-like wall: Sampling, analysis and classification. Nucl. Fusion 2015, 55, 113033. [Google Scholar] [CrossRef]
  21. De Temmerman, G.; Baldwin, M.J.; Doerner, R.P.; Nishijima, D.; Schmid, K. An empirical scaling for deuterium retention in co-deposited beryllium layers. Nucl. Fusion 2008, 48, 075008. [Google Scholar] [CrossRef] [Green Version]
  22. Baldwin, M.J.; Schwarz-Selinger, T.; Doerner, R.P. Experimental study and modelling of deuterium thermal release from Be-D co-deposited layers. Nucl. Fusion 2014, 54, 073005. [Google Scholar] [CrossRef]
  23. Baldwin, M.J.; Doerner, R.P. Effect of layer thickness on the thermal release from Be-D co-deposited layers. Nucl. Fusion 2014, 54, 083032. [Google Scholar] [CrossRef]
  24. Baldwin, M.J.; Simmonds, M.J.; De Temmerman, G.; Doerner, R.P. Deuterium retention in Be-D co-deposits formed over an ITER relevant parameter space. Phys. Scr. 2020, 2020, 014014. [Google Scholar] [CrossRef]
  25. Hakola, A.; Heinola, K.; Mizohata, K.; Likonen, J.; Lungu, C.; Porosnicu, C.; Alves, E.; Mateus, R.; Radovic, I.B.; Siketic, Z.; et al. Effect of composition and surface characteristics on fuel retention in beryllium-containing co-deposited layers. Phys. Scr. 2020, 2020, 014038. [Google Scholar] [CrossRef] [Green Version]
  26. De Temmerman, G.; Doerner, R.P. Revised scaling equation for the prediction of tritium retention in beryllium co-deposited layers. Nucl. Fusion 2009, 49, 042002. [Google Scholar] [CrossRef]
  27. Katayama, K.; Imaoka, K.; Tokitani, M.; Miyamoto, M.; Nishikawa, M.; Fukada, S.; Yoshida, N. Deuterium and helium release and microstructure of tungsten deposition layers formed by RF plasma sputtering. Fusion Sci. Technol. 2008, 54, 549–552. [Google Scholar] [CrossRef]
  28. Doerner, R.P.; Baldwin, M.J.; De Temmerman, G.; Hanna, J.; Nishijima, D.; Roth, J.; Schmid, K.; Tynan, G.R.; Umstadter, K. Codeposition of deuterium with ITER materials. Nucl. Fusion 2009, 49, 035002. [Google Scholar] [CrossRef] [Green Version]
  29. Wang, P.; Jacob, W.; Gao, L.; Dürbeck, T.; Schwarz-Selinger, T. Comparing deuterium retention in tungsten films measured by temperature programmed desorption and nuclear reaction analysis. Nucl. Instrum. Methods Phys. Res. Sect. B Beam Interact. Mater. Atoms 2013, 300, 54–61. [Google Scholar] [CrossRef] [Green Version]
  30. Wang, P.; Jacob, W.; Gao, L.; Elgeti, S.; Balden, M. Deuterium retention in tungsten films deposited by magnetron sputtering. Phys. Scr. 2014, 2014, 014046. [Google Scholar] [CrossRef] [Green Version]
  31. Krat, S.; Gasparyan, Y.; Vasina, Y.; Davletiyarova, A.; Pisarev, A. Tungsten-deuterium co-deposition: Experiment and analytical description. Vacuum 2018, 149, 23–28. [Google Scholar] [CrossRef]
  32. Qiao, L.; Zhang, H.W.; Xu, J.; Chai, L.Q.; Hu, M.; Wang, P. Deuterium retention and release behaviours of tungsten and deuterium co-deposited layers. J. Nucl. Mater. 2018, 502, 247–254. [Google Scholar] [CrossRef]
  33. Mateus, R.; Hakola, A.; Tiron, V.; Porosnicu, C.; Lungu, C.P.; Alves, E. Study of deuterium retention in Be-W coatings with distinct roughness profiles. Fusion Eng. Des. 2017, 124, 464–467. [Google Scholar] [CrossRef]
  34. Sugiyama, K.; Porosnicu, C.; Jacob, W.; Jepu, I.; Lungu, C.P. Investigation of deuterium retention in/desorption from beryllium-containing mixed layers. Nucl. Mater. Energy 2016, 6, 1–9. [Google Scholar] [CrossRef] [Green Version]
  35. Jepu, I.; Doerner, R.P.; Baldwin, M.J.; Porosnicu, C.; Lungu, C.P. Temperature influence on deuterium retention for Be-W mixed thin films prepared by Thermionic Vacuum Arc method exposed to PISCES B plasma. J. Nucl. Mater. 2015, 463, 983–988. [Google Scholar] [CrossRef] [Green Version]
  36. Dinca, P.; Butoi, B.; Porosnicu, C.; Pompilian, O.G.; Staicu, C.; Lungu, C.P.; Burducea, I. Structure, morphology and deuterium retention and release properties of pure and mixed Be and W layers. J. Phys. D Appl. Phys. 2020, 53, 325304. [Google Scholar] [CrossRef]
  37. Dinca, P.; Porosnicu, C.; Butoi, B.; Jepu, I.; Tiron, V.; Pompilian, O.G.; Burducea, I.; Lungu, C.P.; Velicu, I.-L. Beryllium-tungsten study on mixed layers obtained by m-HiPIMS/DCMS techniques in a deuterium and nitrogen reactive gas mixture. Surf. Coat. Technol. 2017, 321, 397–402. [Google Scholar] [CrossRef]
  38. Zibrov, M.S.; Baldwin, M.J.; Mayer, M.; Nguyen, H.Q.; Brezinsek, S.; Doerner, R.P. Deuterium retention in mixed Be-W-D codeposited layers. Nucl. Fusion 2020, 60, 126005. [Google Scholar] [CrossRef]
  39. Burducea, I.; Straticiuc, M.; Ghiţa, D.G.; Moşu, D.V.; Cəlinescu, C.I.; Podaru, N.C.; Mous, D.J.W.; Ursu, I.; Zamfir, N.V. A new ion beam facility based on a 3 MV TandetronTM at IFIN-HH, Romania. Nucl. Instrum. Methods Phys. Res. Sect. B Beam Interact. Mater. Atoms 2015, 359, 12–19. [Google Scholar] [CrossRef]
  40. Mayer, M. “SIMNRA User’s Guide”, Tech. Report IPP, 9/113. Rep. IPP 1997. Available online: https://mam.home.ipp.mpg.de/SIMNRA-Users-Guide.pdf (accessed on 24 June 2022).
  41. Dinca, P.; Staicu, C.; Porosnicu, C.; Pompilian, O.G.; Banici, A.M.; Butoi, B.; Lungu, C.P.; Burducea, I. Deuterium retention and release behavior from beryllium co-deposited layers at distinct ar/d ratio. Coatings 2021, 11, 1443. [Google Scholar] [CrossRef]
  42. Tiron, V.; Bulai, G.; Costin, C.; Velicu, I.L.; Dincă, P.; Iancu, D.; Burducea, I. Growth and characterization of W thin films with controlled Ne and Ar contents deposited by bipolar HiPIMS. Nucl. Mater. Energy 2021, 29, 101091. [Google Scholar] [CrossRef]
  43. Poon, M.; Haasz, A.A.; Davis, J.W. Modelling deuterium release during thermal desorption of D+-irradiated tungsten. J. Nucl. Mater. 2008, 374, 390–402. [Google Scholar] [CrossRef]
  44. Reinelt, M.; Allouche, A.; Oberkofler, M.; Linsmeier, C. Retention mechanisms and binding states of deuterium implanted into beryllium. New J. Phys. 2009, 11, 043023. [Google Scholar] [CrossRef] [Green Version]
  45. Doerner, R.P.; Baldwin, M.J.; Buchenauer, D.; De Temmerman, G.; Nishijima, D. The role of beryllium deuteride in plasma-beryllium interactions. J. Nucl. Mater. 2009, 390–391, 681–684. [Google Scholar] [CrossRef]
Figure 1. Schematic representation of the deposition setup used for obtaining D containing BeW mixed layers. The QMB was positioned in the center of the substrate holder to measure the deposition rates and thickness in situ.
Coatings 12 00951 g001
Figure 2. SEM images of the top surface morphology of D containing mixed Be-W layer deposited on W and Si substrates: (a) W33 Si; (b) W50 Si; (c) W66 Si; (d) W33 W; (e) W50 W; (f) W66 W.
Coatings 12 00951 g002
Figure 3. XRD diffraction pattern of 500 nm thick tungsten layer.
Coatings 12 00951 g003
Figure 4. Overlapped diffraction patterns of the mixed Be-W layers.
Coatings 12 00951 g004
Figure 5. Experimental RBS data represented against the simulated spectrum in SIMNRA for W50.
Coatings 12 00951 g005
Figure 6. Comparative tungsten signal resulted from the RBS experimental spectra of the mixed Be-W layers.
Coatings 12 00951 g006
Figure 7. Depth profile of the W 33 sample depicting the element and impurity concentration in layer.
Coatings 12 00951 g007
Figure 8. Deuterium release comparison for samples: (a) W, (b) W66, (c) W50, (d) W33.
Coatings 12 00951 g008
Figure 9. (a) Thermal desorption of D from Be layer; (b) Elemental depth profile resulted from SIMRA simulation of Be layer experimental RBS spectra.
Coatings 12 00951 g009
Figure 10. (a) Total deuterium retention as a function of W concentration. Data reported by Jepu et al. and Dinca et al. (b) Deuterium inventory as a function of W concentration plotted along with data from Zibrov et al. for mixed layers deposited 0.8 Pa and 2.7 Pa.
Coatings 12 00951 g010
Table 1. Main deposition parameters for the mixed and reference D containing layers.
IndexBe Deposition ParametersW Deposition Parameters
UBe
(V)
Ibe
(mA)
DBe
(nm/s)
UW
(V)
IW
(mA)
DW
(Å/s)
Be4203200.86---
W---3201000.89
W334103200.84300700.79
W504103200.843901301.60
W663801500.373901201.40
Table 2. Crystallite size calculated for the most intense line in X ray diffraction pattern.
SampleW Crystallite Size (nm)BeO Crystallite Size (nm)BeD2 Crystallite Size (nm)
Be-18.88-
W11.95--
W661.3--
W501.7--
W330.9-50.97
Publisher’s Note: MDPI stays neutral with regard to jurisdictional claims in published maps and institutional affiliations.

