Article

Dielectric Properties of Plasma-Sprayed Fully Natural Garnets

1
The Czech Academy of Sciences, Institute of Plasma Physics, Za Slovankou 3, Prague 8, 182 00 Prague, Czech Republic
2
Department of Electrotechnology, Faculty of Electrical Engineering, Czech Technical University, Technicka 2, Prague 6, 160 00 Prague, Czech Republic
*
Author to whom correspondence should be addressed.
Coatings 2022, 12(7), 1017; https://doi.org/10.3390/coatings12071017
Submission received: 20 June 2022 / Revised: 8 July 2022 / Accepted: 13 July 2022 / Published: 18 July 2022
(This article belongs to the Special Issue High-Performance Dielectric Ceramic for Energy Storage Capacitors)

Abstract

:
Various kinds of natural garnets belonging to the almandine type (3FeO·Al2O3·3SiO2) were sprayed by plasma spray technique to build coatings on metallic substrates. The experimental garnet powders came from different mines in the Czech Republic and Mongolia. After coating and cooling the substrates were removed. In this way, self-supporting plates were obtained and further studied with microscopy, X-ray diffraction, and dielectric spectroscopy. Mechanical properties were in our focus as well. Microhardness was measured on cross sections dedicated to microstructure observation. Wear resistance in wet conditions was tested in a slurry. Reflectance was measured applying visible and infrared (VIS-NIR) radiation. Dielectric properties of coatings were studied at low voltage capacitance, loss tangent and also under direct current (DC) resistance. The results show that garnet minerals are interesting candidates for various optical and electronic applications; they have similar dielectric behavior as, for example, aluminum oxide or similar high-purity synthetic oxides, and, simultaneously, they have extraordinarily low reflectance in VIS-NIR radiation. The differences between natural powders and resulting coatings are discussed in connection with their chemical and phase compositions.

1. Introduction

Garnets are minerals found in the Earth’s crust, upper mantle and transition zone. They are extensively used as gemstones. During industrial treatment of gemstones, a lot of dust (fine powder) is released as waste, having no value for the gemstone producers. Plasma spraying offers protective coatings to metals, if the properly sized powder feedstock is available. The powder is accelerated in a plasma jet and deposited on a substrate surface. A search for inexpensive plasma spraying materials offering interesting properties led to the plasma spraying of garnets in their natural form. Garnets of almandine (so called oriental garnet) and andradite types have been easily processed by atmospheric plasma spraying at a wide variety of spray setup parameters [1]. Knowing that natural garnets exhibit dielectric properties similar to typical industrial dielectric ceramics, such as aluminum oxide [2], attracted the presented experimentation, along with examination of the dielectric properties of plasma sprayed garnet coatings. Since garnet minerals are environmentally friendly, easily available and, in the above-described form, also inexpensive, fabrication of electrical components based on garnet powder is a promising field of research.
Almandine type garnet, Fe3Al2Si3O12, could be considered a combination of three oxides 3(FeO) + 3(SiO2) + Al2O3. From the viewpoint of bond distances, d<Si-O> = 1.630 Å and d<Al-O> = 1.886 Å, almandine (exhibiting Fe2+ ions) is a central member of the wide group of garnets and is, in this way, predestined to behave as a stable dielectric material. In contrast, the Mg atom is slightly too small and Ca slightly too large in the pyrope garnet and grossular garnet, respectively. So, perhaps the unusual behavior of the dielectric properties for these two garnets is not surprising [2].
Moreover, plasma spraying of almandine was found earlier to be efficient with a high production rate [1], whereas spraying of pyrope garnet was observed to be a little more difficult. All deposited materials had a very decorative black color. This fact attracted our experimentation to examine the optical properties (reflectance) of plasma sprayed garnet coatings. Our first impression was that they should absorb a lot of energy in the visible and infrared spectra.
After interaction with plasma, garnets were typically in the amorphous (glassy) state. Porosity of plasma sprayed garnets reached typically low values of about 2% [1]. Thick coatings, and also free-standing tubes, have been made with these materials. Almandine and pyrope garnets are also mentioned in the literature as potential materials for thermal barrier coatings [3]. Plasma sprayed almandine was successfully applied as a covering layer for electrodes used at pulsed high voltage discharges generated in water [4]. Such discharges were tested for wastewater cleaning thanks to their high electric fields, intense ultraviolet radiation, overpressure shock waves, and the formation of various chemically active species. The role of the garnet coating was the redistributing of the electric field on the electrode during the pre-discharge phase [4].
At temperatures above 1000 °C, reductive decomposition of almandine garnet sets in, as indicated by a sharp endothermic peak at 1055 °C on the calorimetric (DSC) curve accompanied by a total mass loss of 3.51% [5].
The goals of our present research were to measure the dielectric properties [6,7,8] of garnet coatings processed via plasma spraying and to observe the influence of the initial composition (given by the mining locality) and the most important plasma setup parameter, i.e., spray distance SD, on the dielectric properties. Such a comparison has never been provided, particularly with respect to varying temperature.

2. Experimental

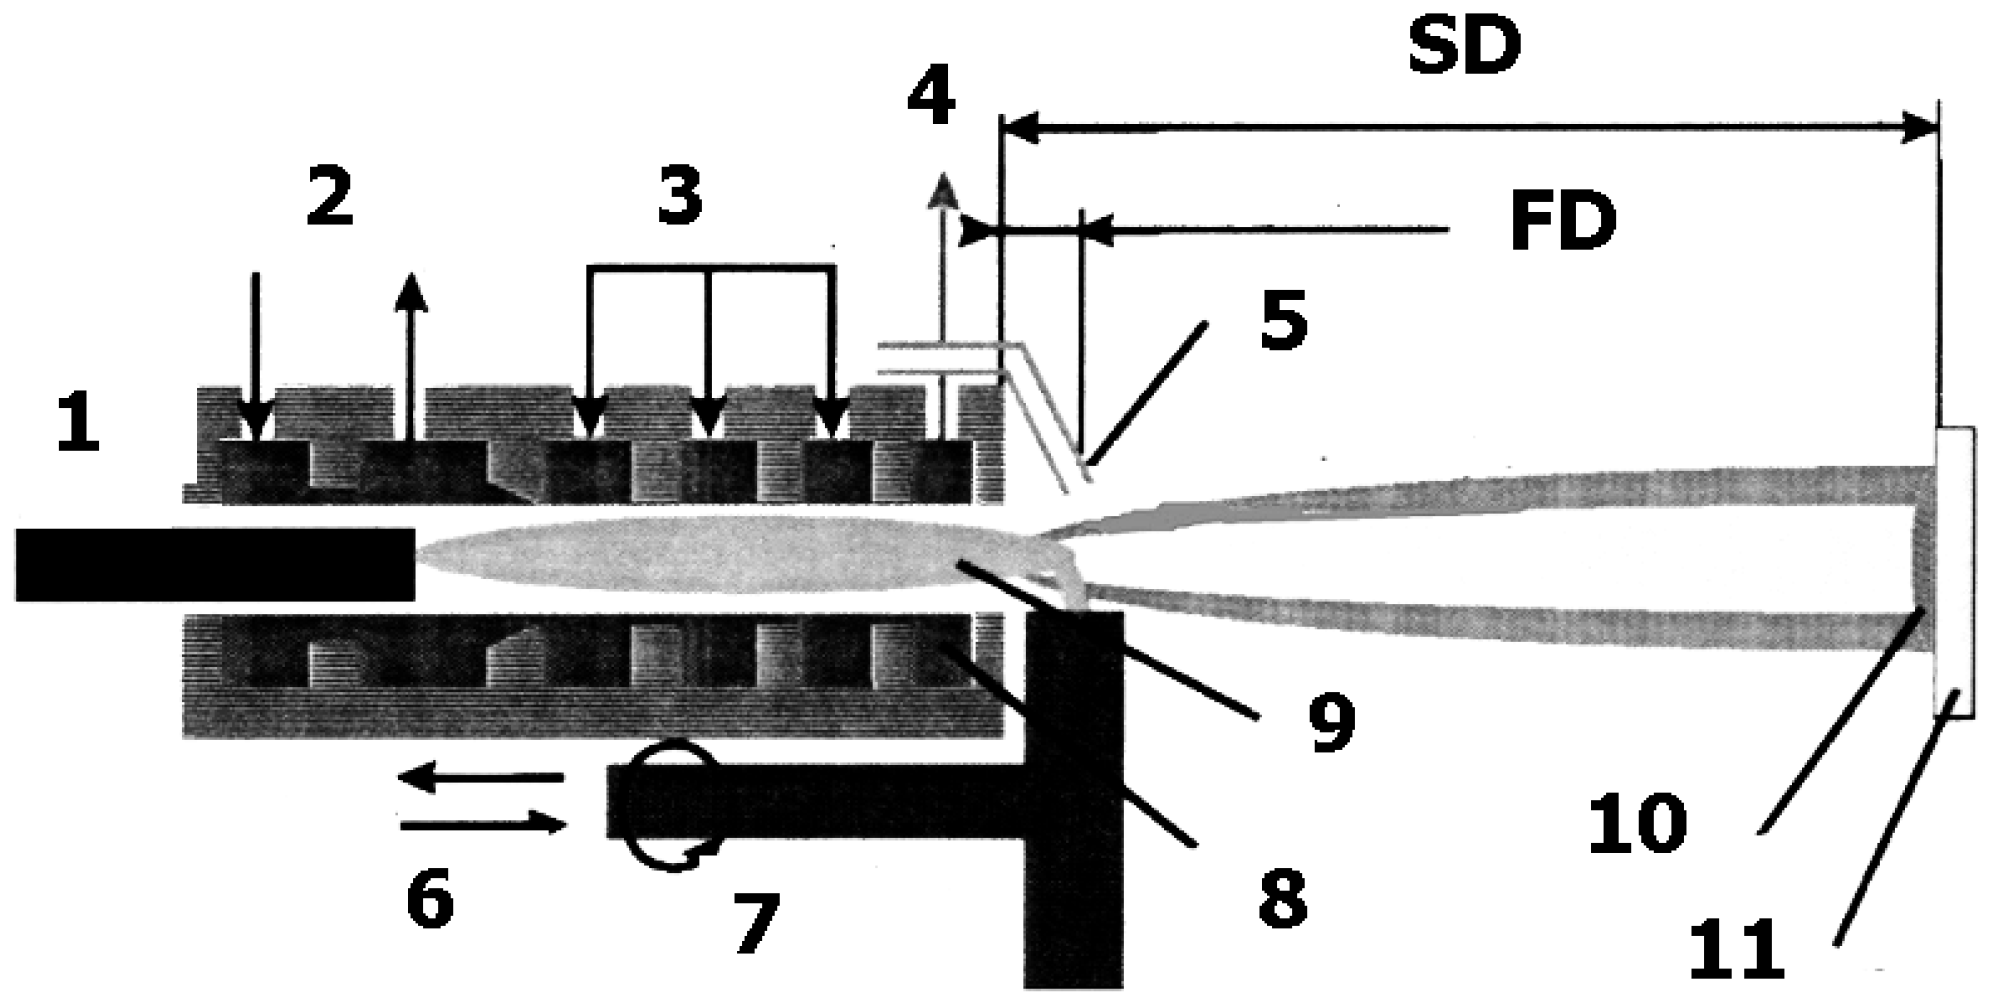
2.1. Powders and Spraying

Natural garnet in the form of raw mineral was received as “stones” that were crushed and sieved to obtain feedstock powder for spraying (size 63 to 125 μm). It is necessary to point out that they contained a certain amount of alkali metals, or similar impurities, due to their natural character. In addition, iron presence in the powders may rise, also due to wear of the steel parts of the crushing apparatus, since garnet is a rather hard mineral. The experimental powders for spraying originated from different mines in Mongolia (label Mong) and in the Czech Republic (label GBM).
The coating samples were manufactured using the high feed-rate water-stabilized plasma spray system WSP® 500 (IPP, Prague, Czech Republic), Figure 1. The WSP operates at about 160 kW of electric power in the arc and is able to spray high amounts of material per hour. In the current experiment, the feedstock feed-rate of 22 to 24 kg/h was used. The main spray parameters of this system, feeding distance (FD) and spray distance (SD), were optimized before deposition. FD was finally fixed at 65 mm and the influence of two SD values, 370 and 470 mm, was studied. By varying SD we were modifying the dwell time of the powder in plasma and also the impact temperature of the droplets to the substrate. As substrates, stainless steel coupons were used, preheated enough to allow an easy release of the coating after spraying, thanks to differences in the substrate and coating thermal expansion. The feedstock was loaded in the plasma by compressed air through two injectors. Deposited coatings were about 2 mm thick. They were then detached from the substrate by thermal cycling between approximately −170/+100 °C to form self-supporting plates, advantageous for electrical and optical testing.

2.2. Characterization Techniques

The coatings were observed by Scanning electron microscopy (SEM) using the Phenom-Pro microscope (Thermo Fisher Sci., Eindhoven, The Netherlands) equipped with the CeB6 thermionic cathode and working in backscattered electron mode (BSE). All images were recorded at 15 kV electron beam voltage. The Energy Dispersive X-ray (EDX) analysis, which is embedded in the SEM apparatus, was used to establish the elemental composition of samples. In the next step, the EDX spectrum was evaluated, and based on a unique set of peaks for each element, the chemical composition was determined. The X-ray signal used for EDX-measurements originated at an area at least 1 µm in diameter and around 1.5 µm depth. The element EDX maps were collected at the same electron beam tension as the micrographs.
For the microscopic observation polished cross sections were prepared. They served also for microhardness measurement. The light micrographs were further subjected to image analysis of porosity collected at 250× magnification via a CCD camera EOS 500D (Canon, Tokyo, Japan) linked with the microscope Neophot 32 (Zeiss, Oberkochen, Germany) and processed using the software Lucia (version 4.62, Laboratory Imaging, Prague, Czech Republic). For a more advanced description of pores, additional criteria besides the porosity percentage (“Area fraction of voids”, AF, i.e., content of pores and cracks in the coating material) were introduced. The first of them was “Number of Voids per unit area” (NV) on the cross section. The NV parameter in combination with the AF porosity percentage could distinguish between porosity representing a large number of fine voids or, alternatively, a small number of coarse voids. The second of them, “Equivalent Diameter” (ED) of voids, represented their mean size. The third additional parameter, Circularity (CIR), could obtain values between unity (i.e., a circle representing a projection of a globular pore) and zero (i.e., a line corresponding to a flat pore or a crack). All parameters were calculated based on analysis of ten images of each sample.
Selection of samples for the microstructure study included the criterion to be placed far enough from the edges, where the material is more sensitive to artificial porosity creation. Polished cross-sections were prepared, where the cutting was done using a diamond blade. Subsequently, the sections were mounted in a resin, and polishing was performed using the Tegramin-25 automatic system (Struers, Copenhagen, Denmark).
Powders of the feedstock material and coatings in the as-sprayed state were analysed by X-ray diffraction. The aim was to get information, including crystalline phase identification, and quantitative estimations of crystallinity. All samples were measured with a D8 Discover diffractometer (Bruker, Billerica, MA, USA) in the Bragg-Brentano geometry, applying Cu-Kalpha radiation and 1D LynxEye detector (Stockholm, Sweden). Precise alignment of the sample surface was done by laser check. We assumed the amorphous material to be of the same chemical composition as the crystalline one.
The self-supporting plates were ground from both sides to produce square plates with a smooth surface. A thin layer of aluminum as the electrode plate was sputtered in reduced pressure on the ground surface from both sides. Such specimens represented capacitors with dimensions 22 × 22 × 1.5 mm3. Capacitance was measured in the frequency range from 20 Hz to 1 MHz using programmable LCR-meter (4263B, Agilent, Santa Clara, CA, USA). The applied voltage was 1V AC and samples were clamped using the fixture BDS-1200 inside a heated cell Novotherm (Novocontrol, Montabaur, Germany). Relative permittivity εr was calculated based on measured capacitances and specimen dimensions. This same setup was used for the loss tangent Tan δ measurement at the same frequencies and temperatures. Electric AC resistance was measured also at the same conditions. All the mentioned parameters were monitored between temperatures 30 and 300 °C.
Electric DC resistance was measured at room temperature. 27 °C, using a special adapter, model 6105 (Keithley Instruments, Solon, OH, USA). The electric field was applied with a regulated high-voltage source and the values recorded by a multi-purpose electrometer Keithley 617C. The testing signal voltage was 100 ± 0.05 V DC, and the time of exposure 10 min. Volume resistivity was calculated from the measured resistance values and specimen dimensions.
Vickers microhardness of the coating samples dedicated to microscopy was measured on polished cross sections by light microscope equipped with a Hanemann head (Neophot, Zeiss, Jena, Germany) and Vickers indenter using 1N load. The mean value of microhardness was calculated as an average from 20 indentations.
The slurry abrasion response of coatings (SAR test) was done using an in-house built apparatus with fully compatible kinematics with ASTM standard G75-95, which was originally targeted on bulks and not coatings. The applied force was 22.24 N per specimen and the slurry was composed from alumina powder and water in weight ratio 1:1. The test was run for 4 cycles, each consisting in a 2-h increment, with mass loss being measured at the end of each increment. For the mass loss recording the specimens were ultrasonically cleaned and weighed. The wear loss was expressed as an Inverse wear rate IWR, i.e., how many meters of the run in a slurry were necessary to wear out 1 cubic millimeter of the sample material.
The diffuse reflectance was measured by an UV-VIS-NIR scanning spectrophotometer (Shimadzu, Kyoto, Japan) with a multi-purpose large sample compartment. The measured area was about 2 cm2. The reflectance obtained between 400 and 1400 nm radiation was collected (i.e., the UV range not utilized). Prior to the measurement a calibration was done using a BaSO4 reference, i.e., white and “absolutely reflecting” material, the reflectance of which was laid as 100% in the whole wavelength range.

3. Results and Discussion

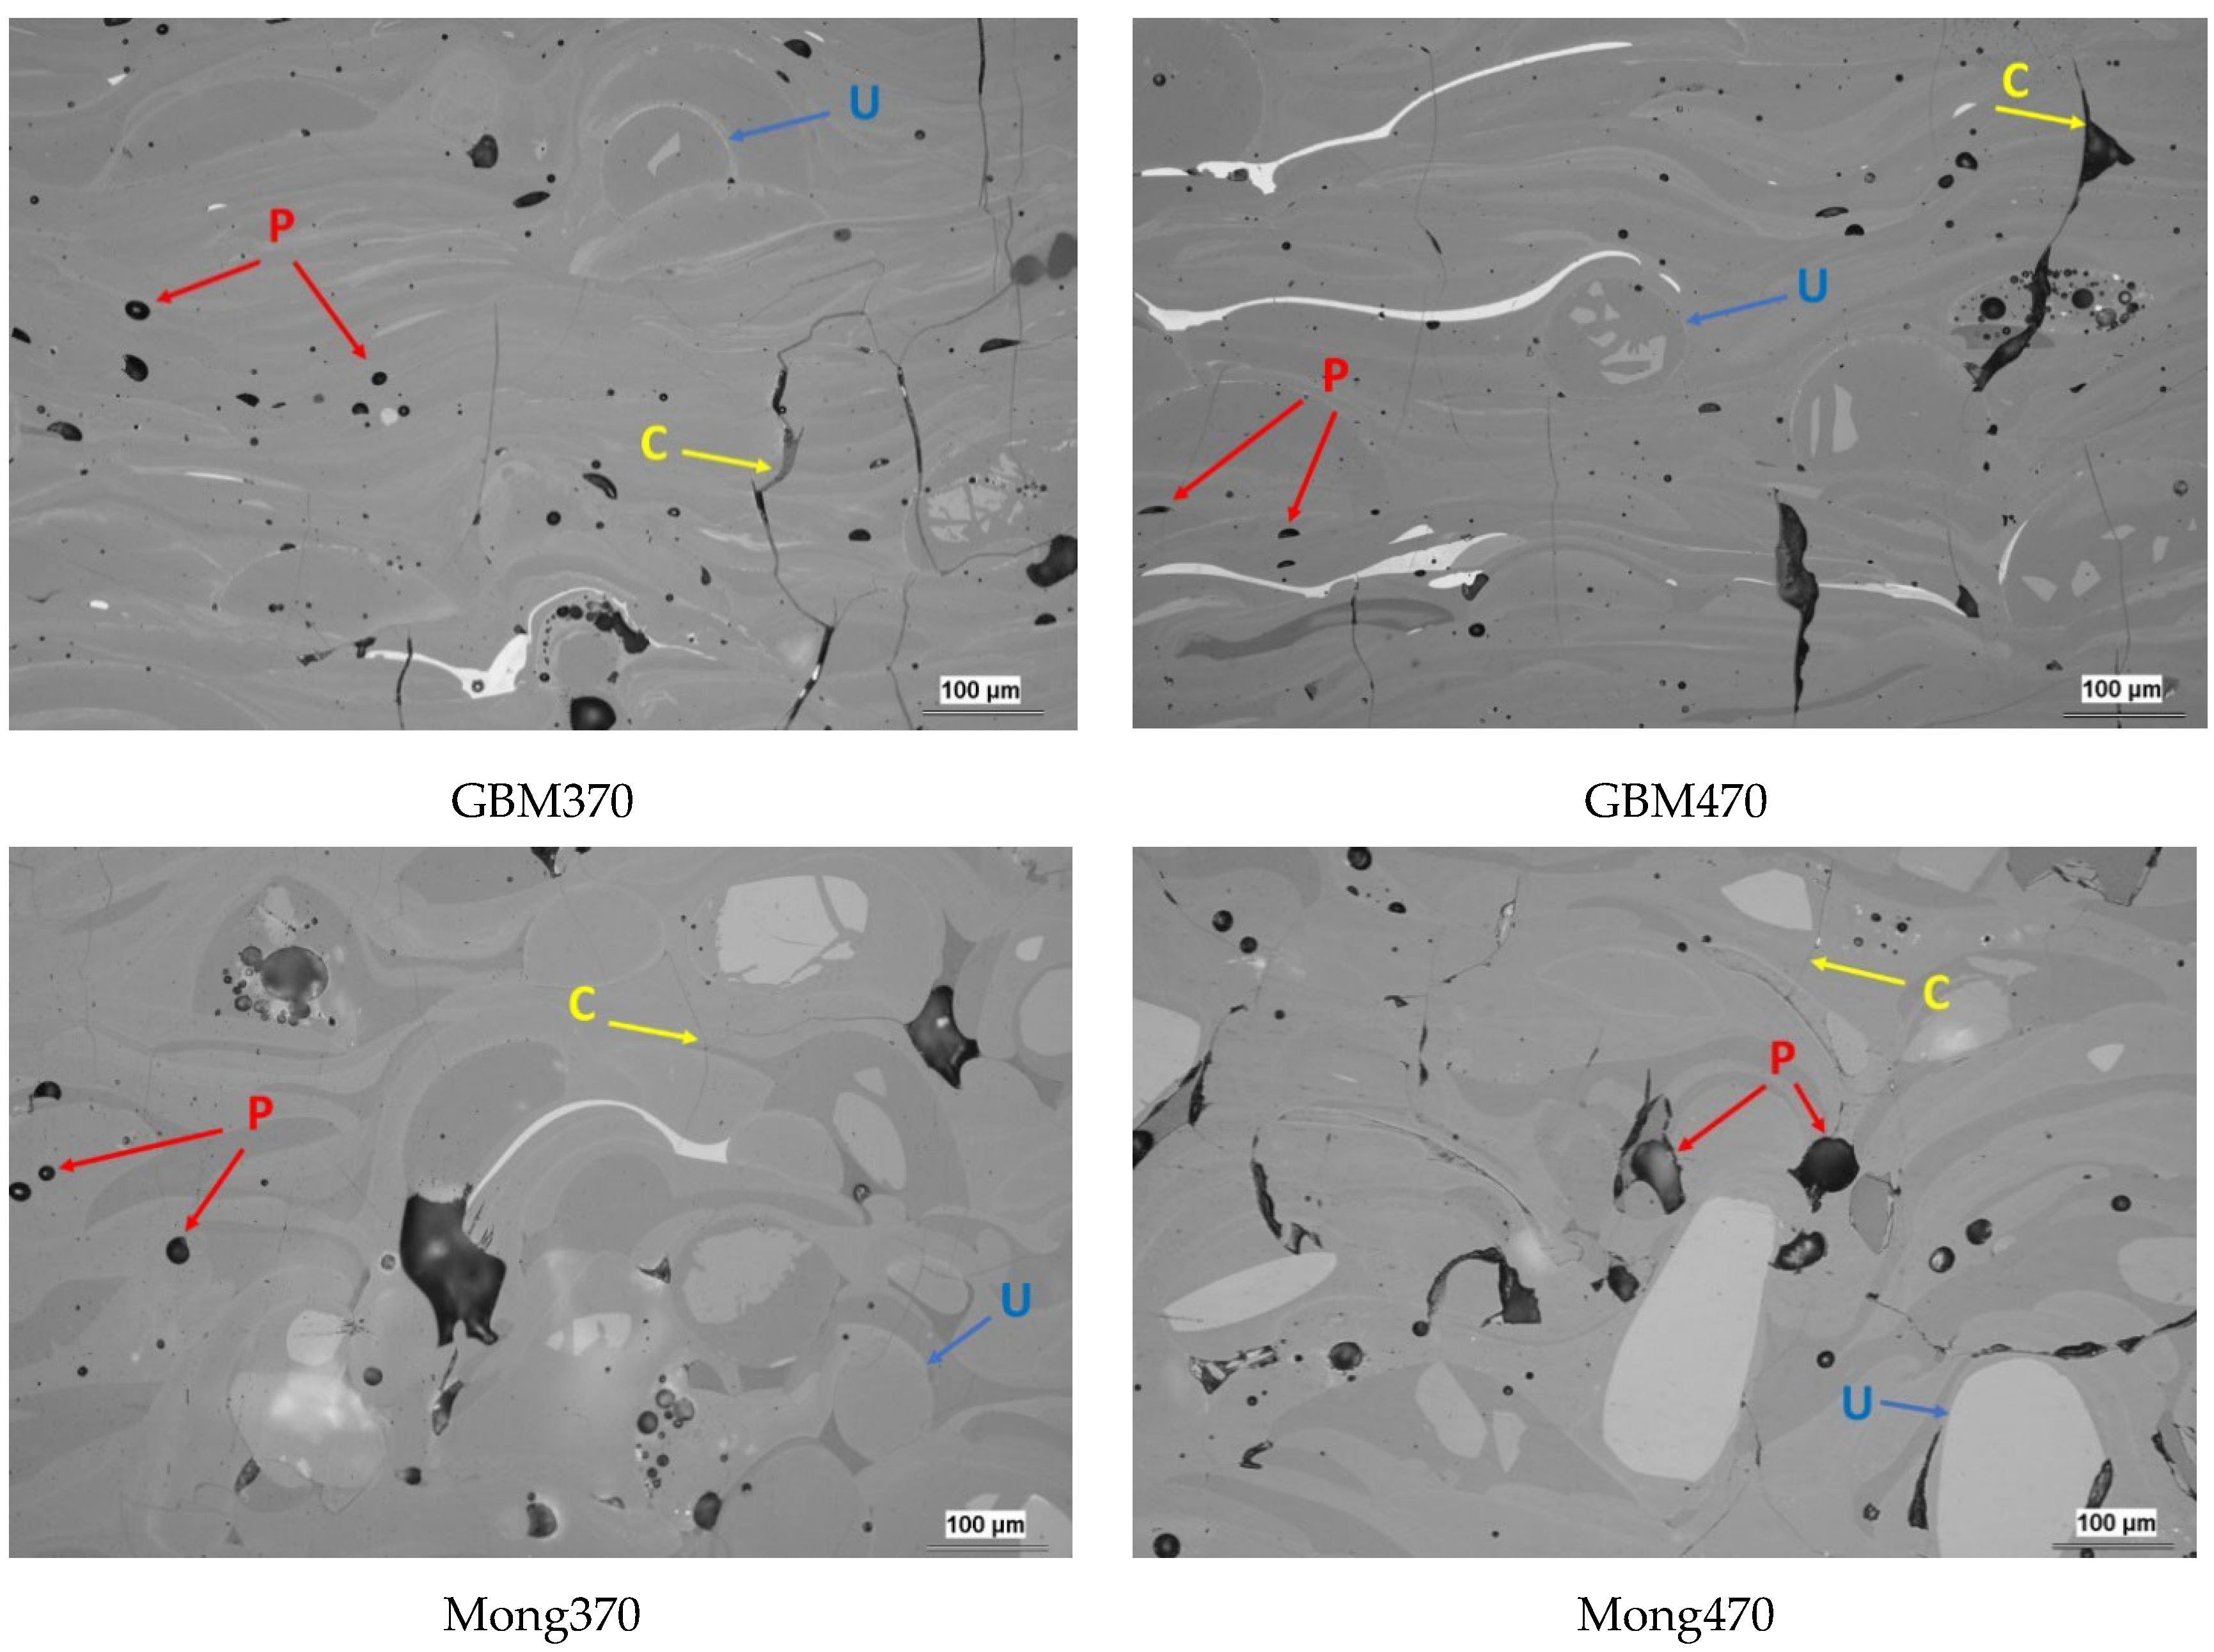
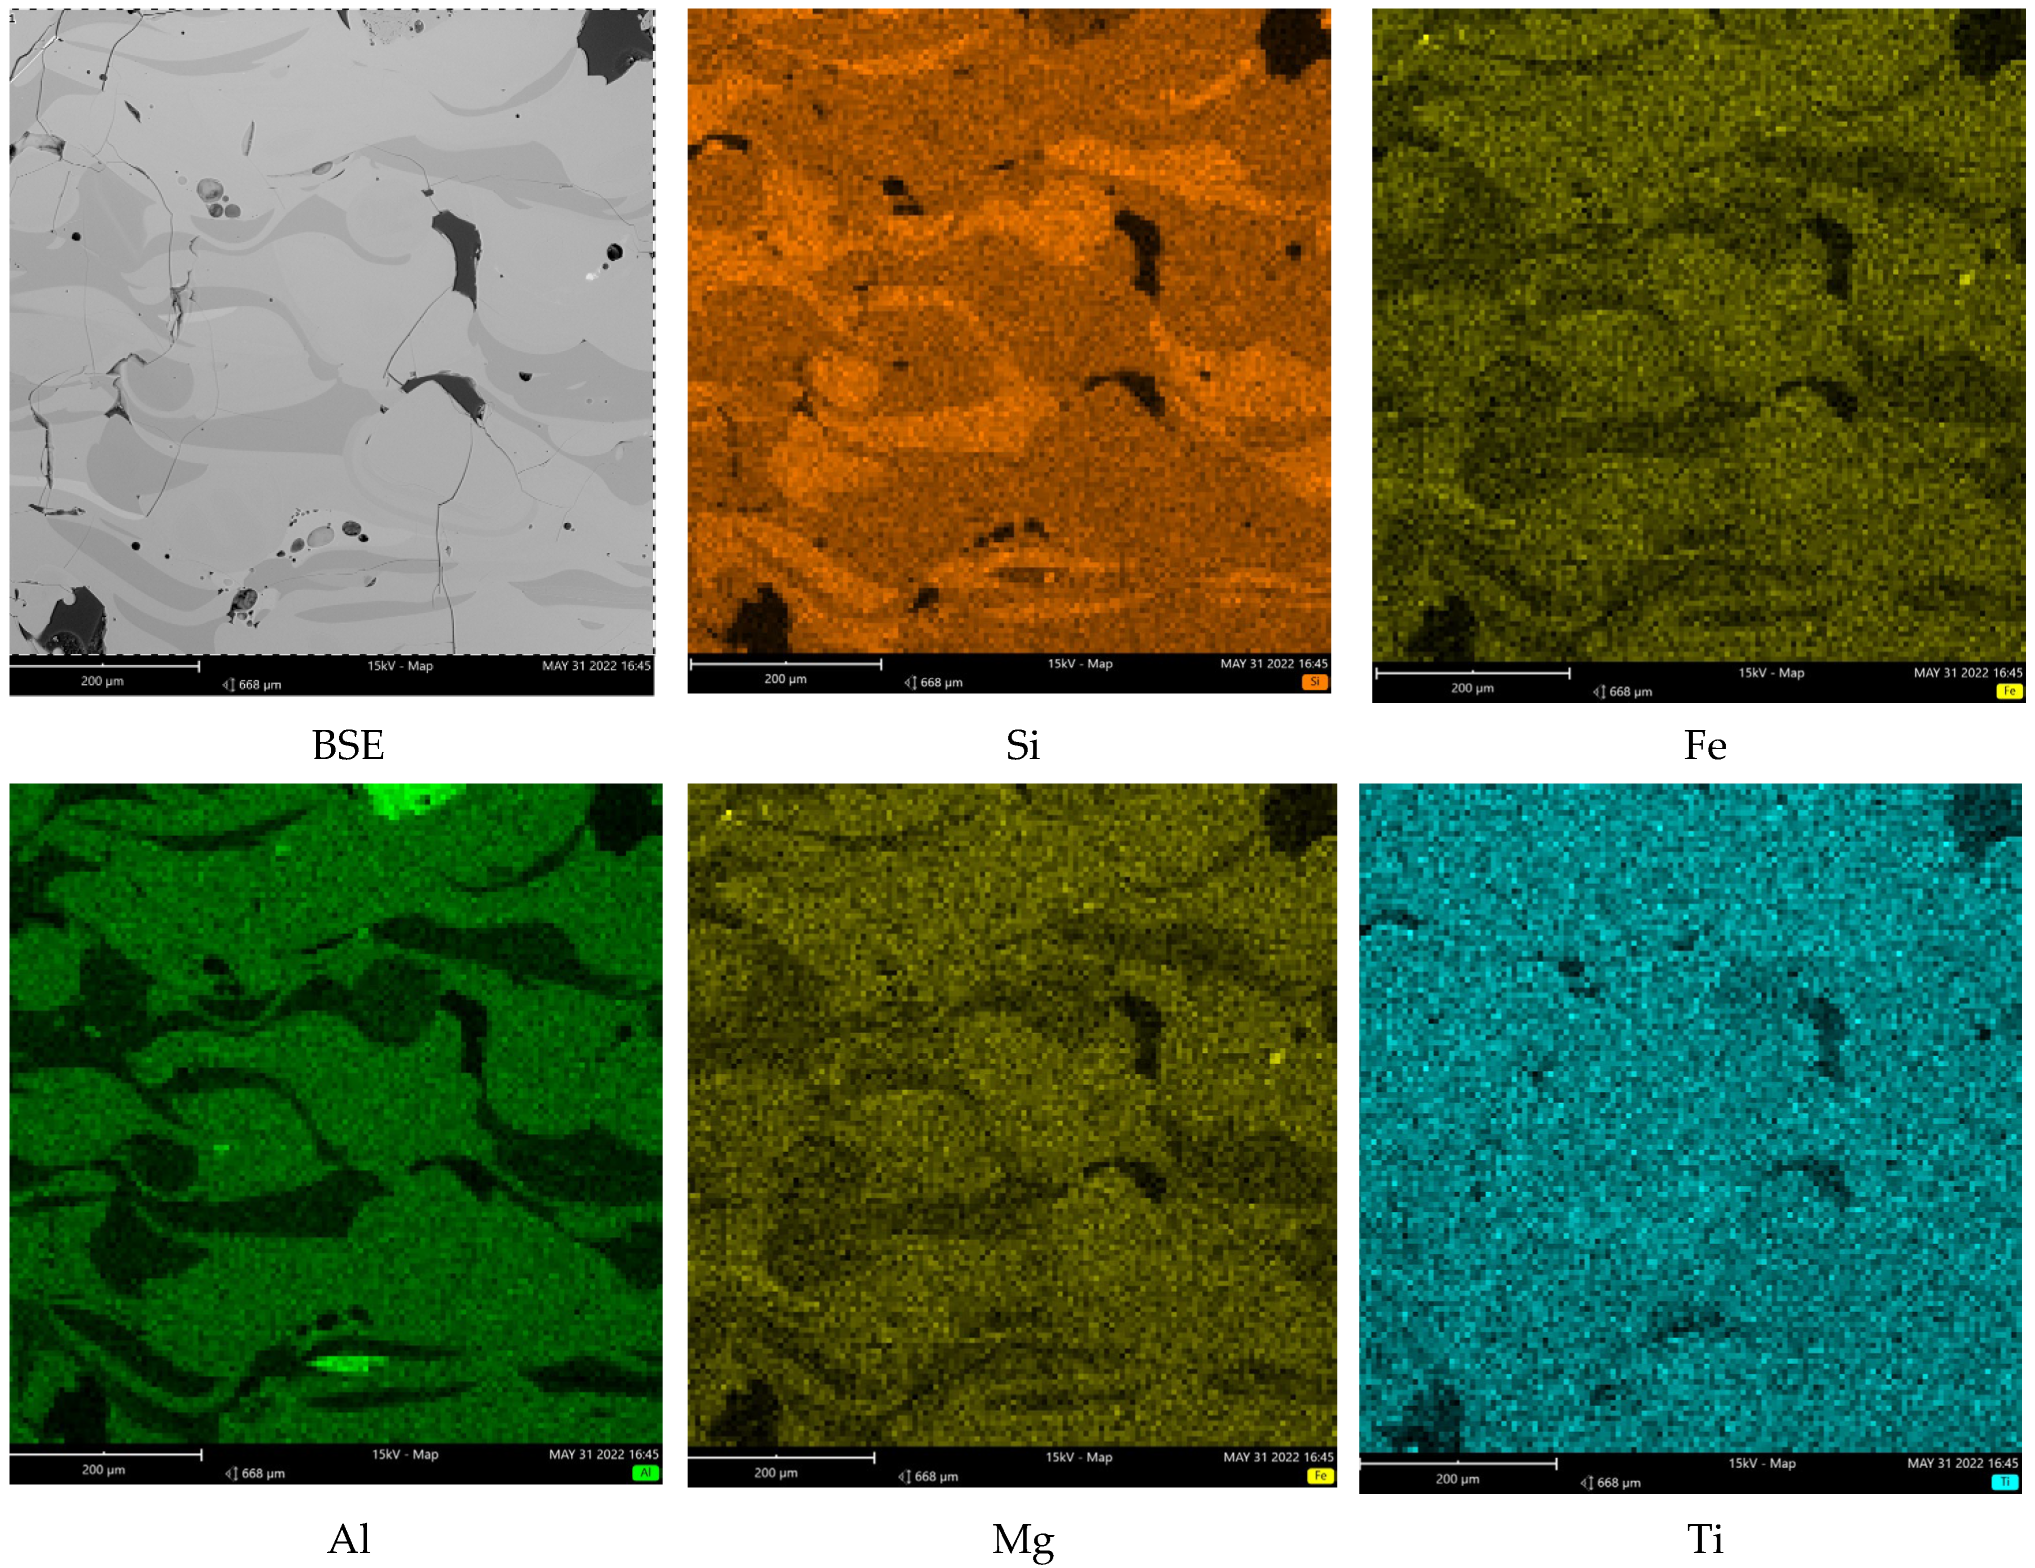
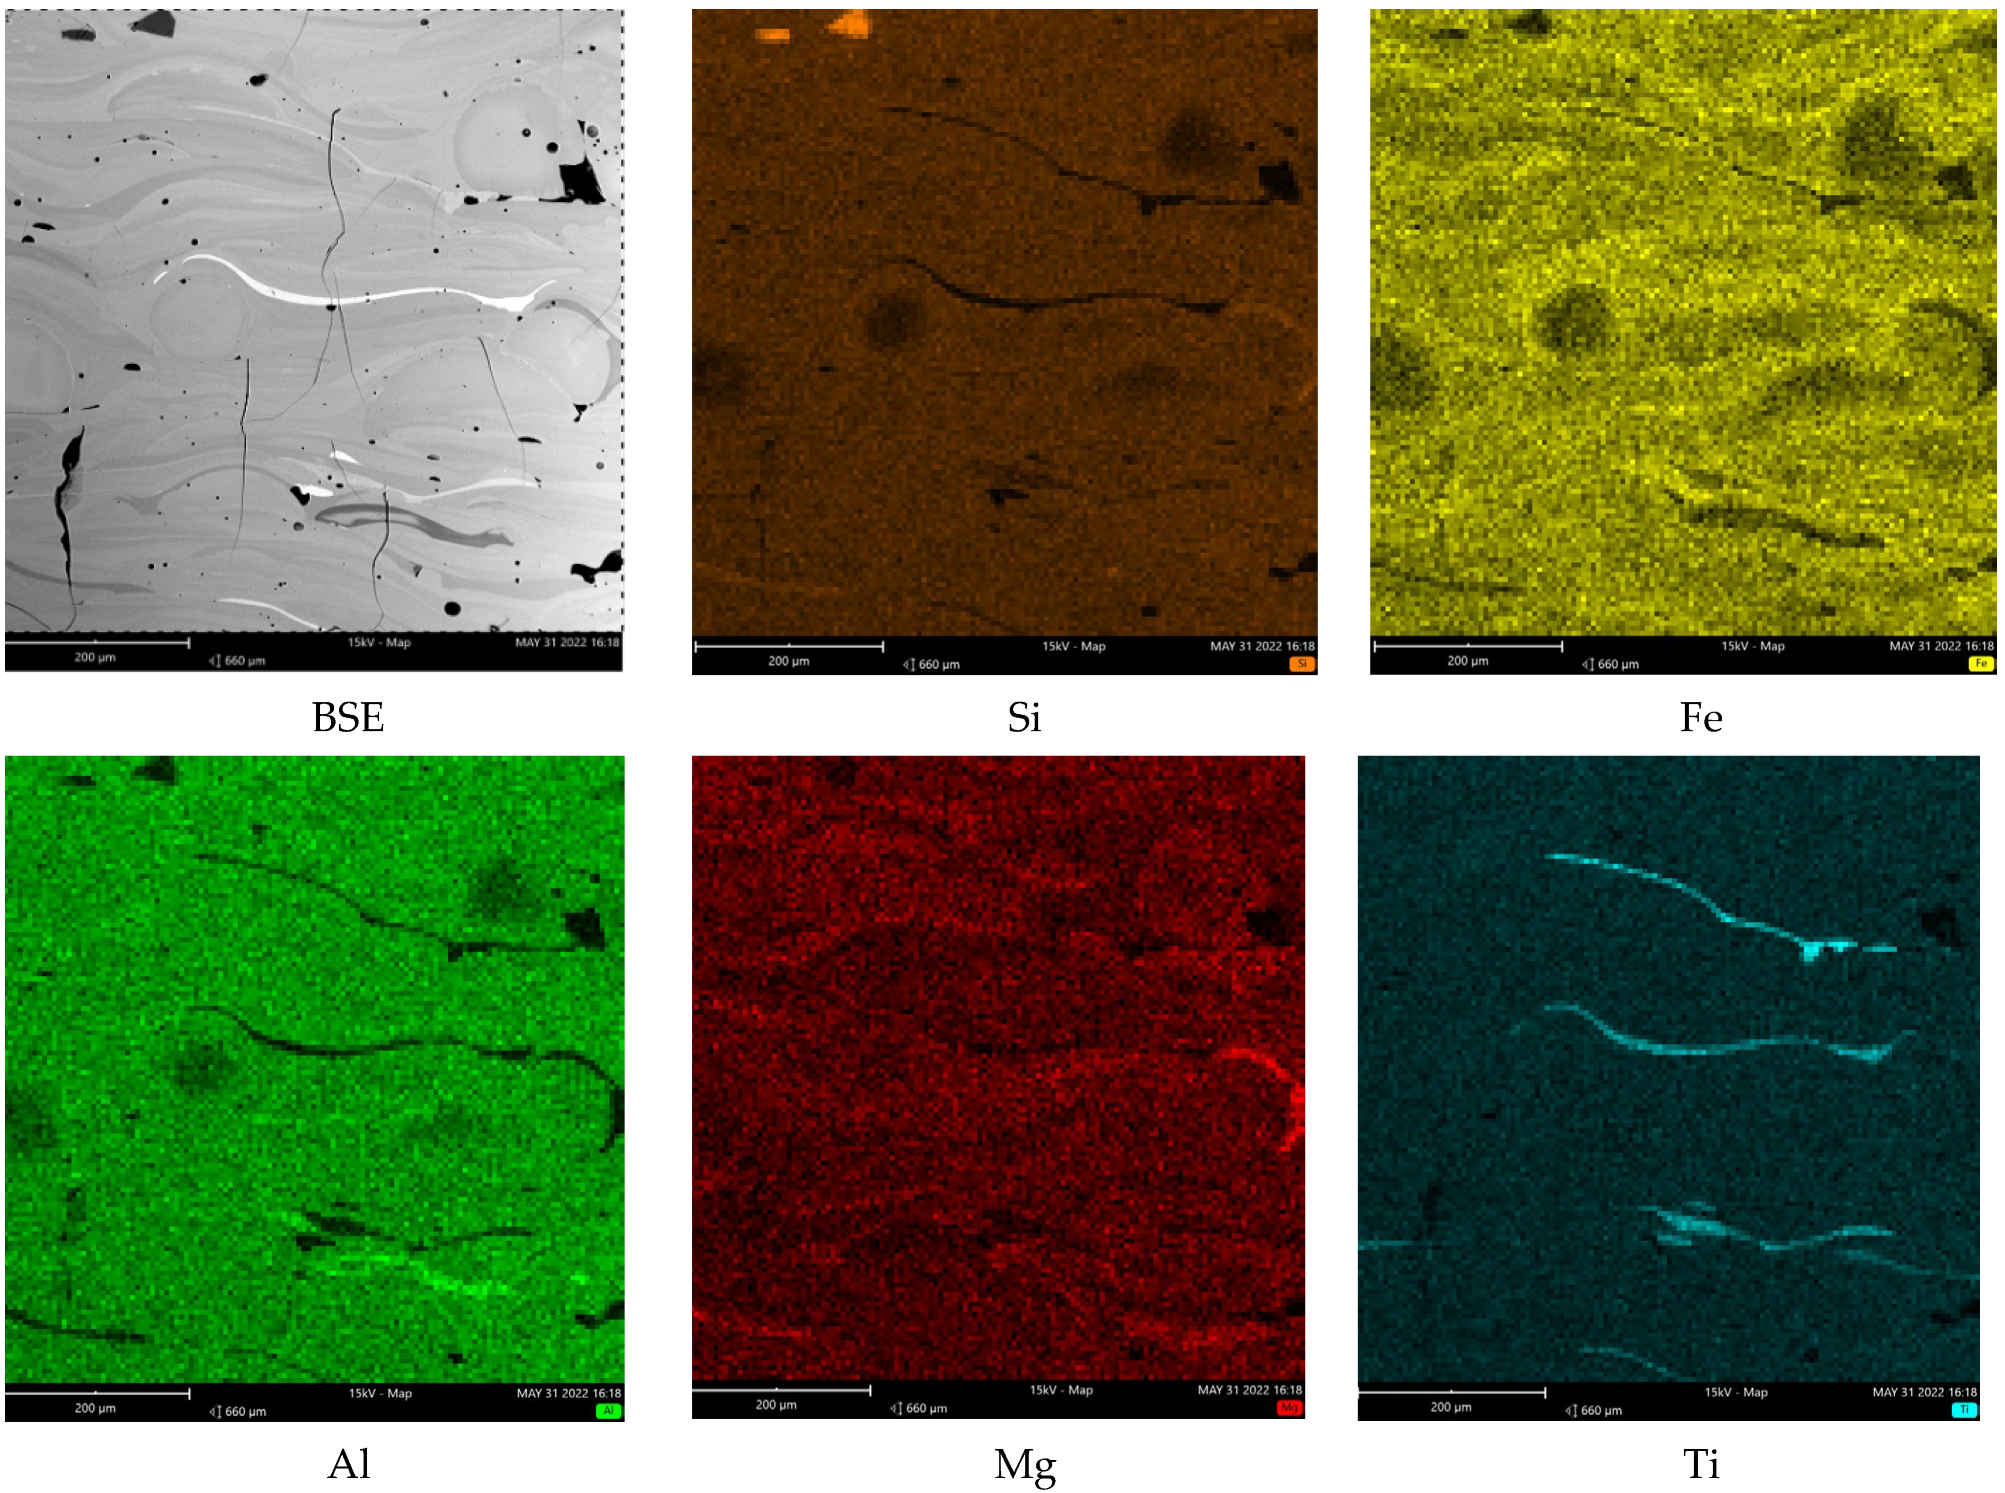
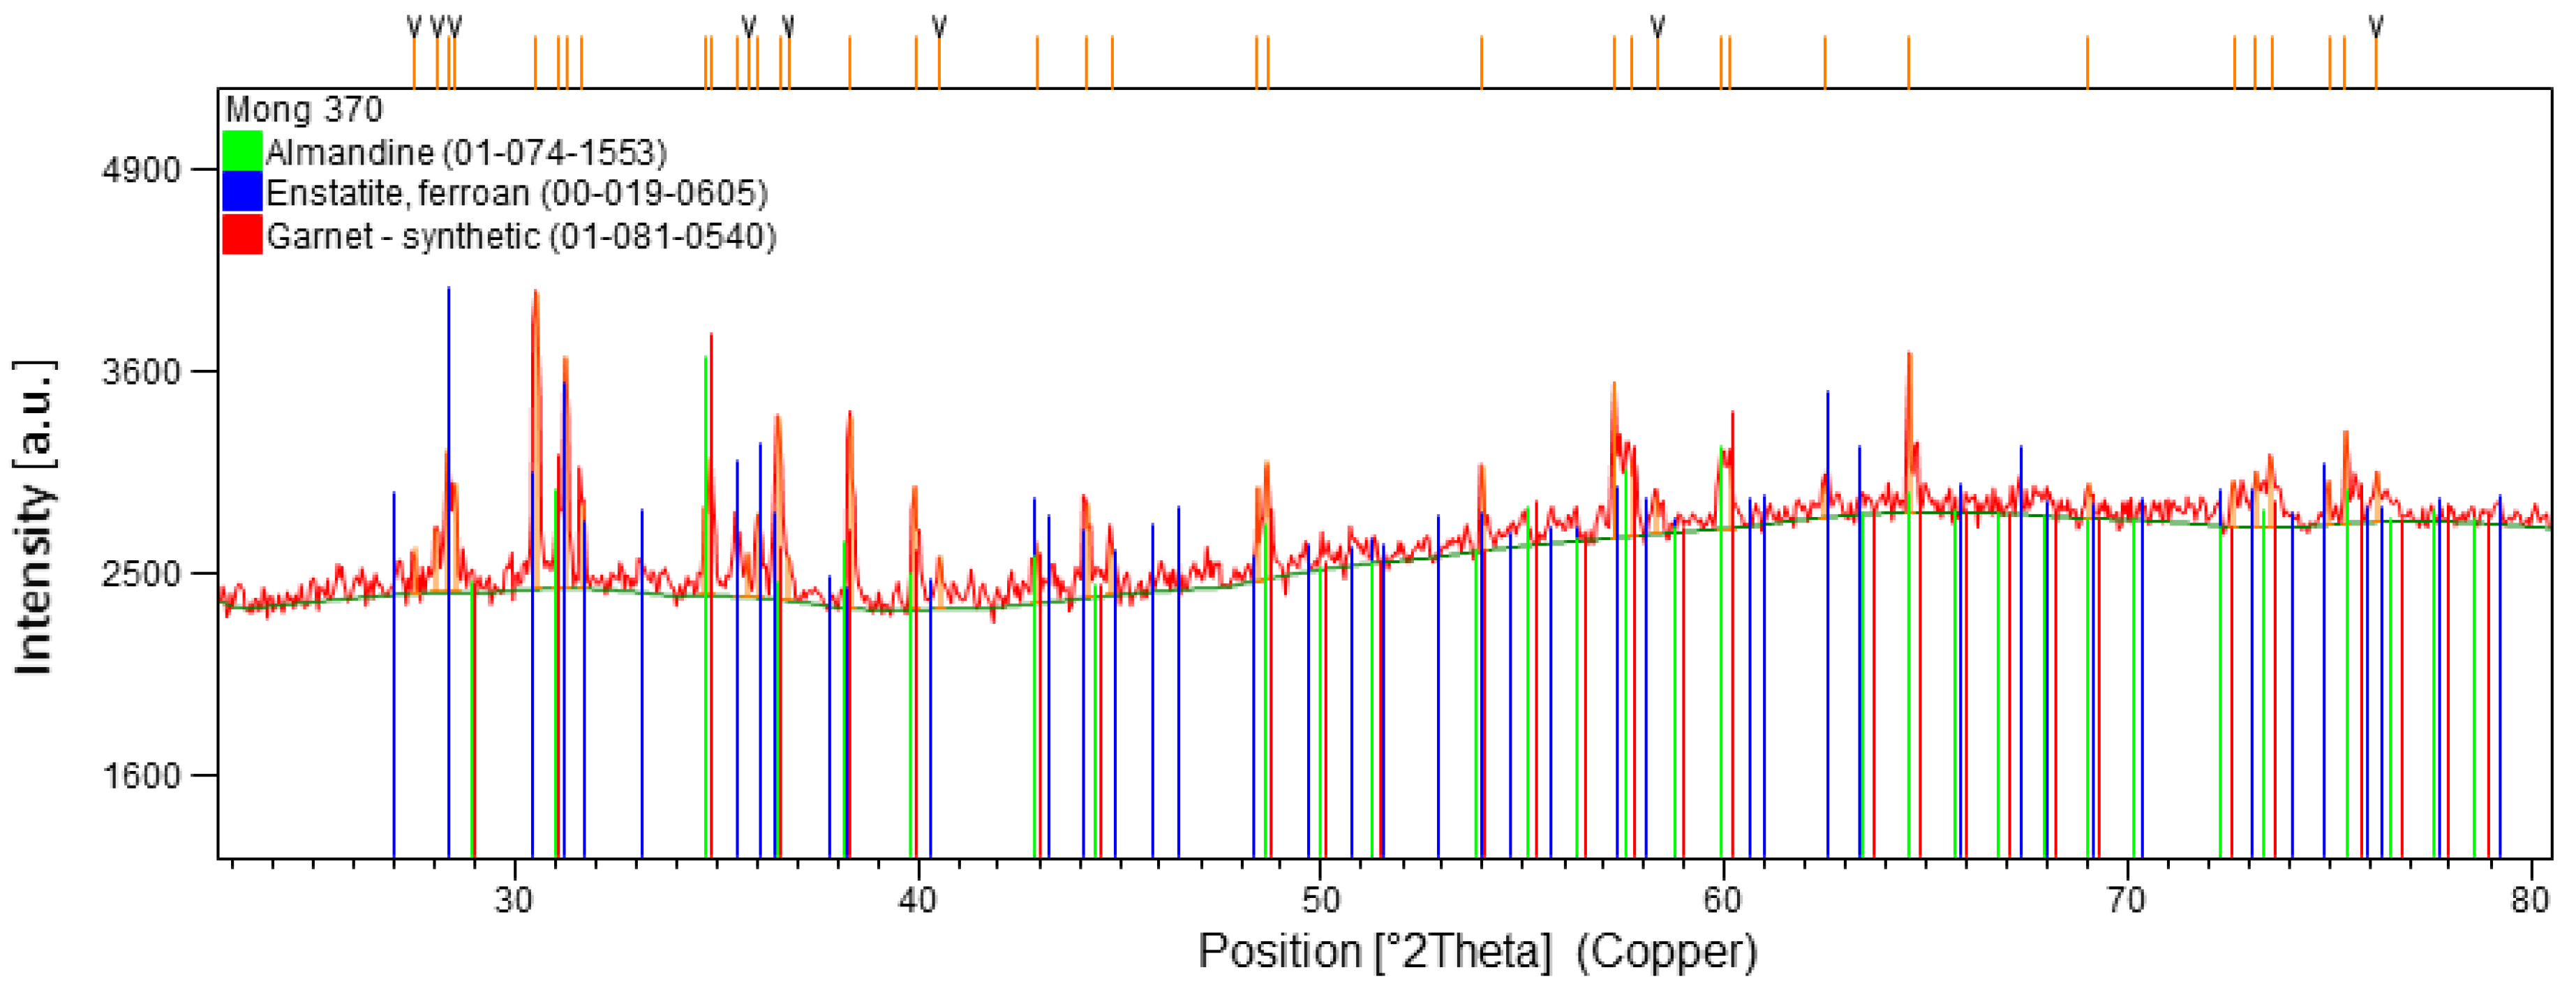
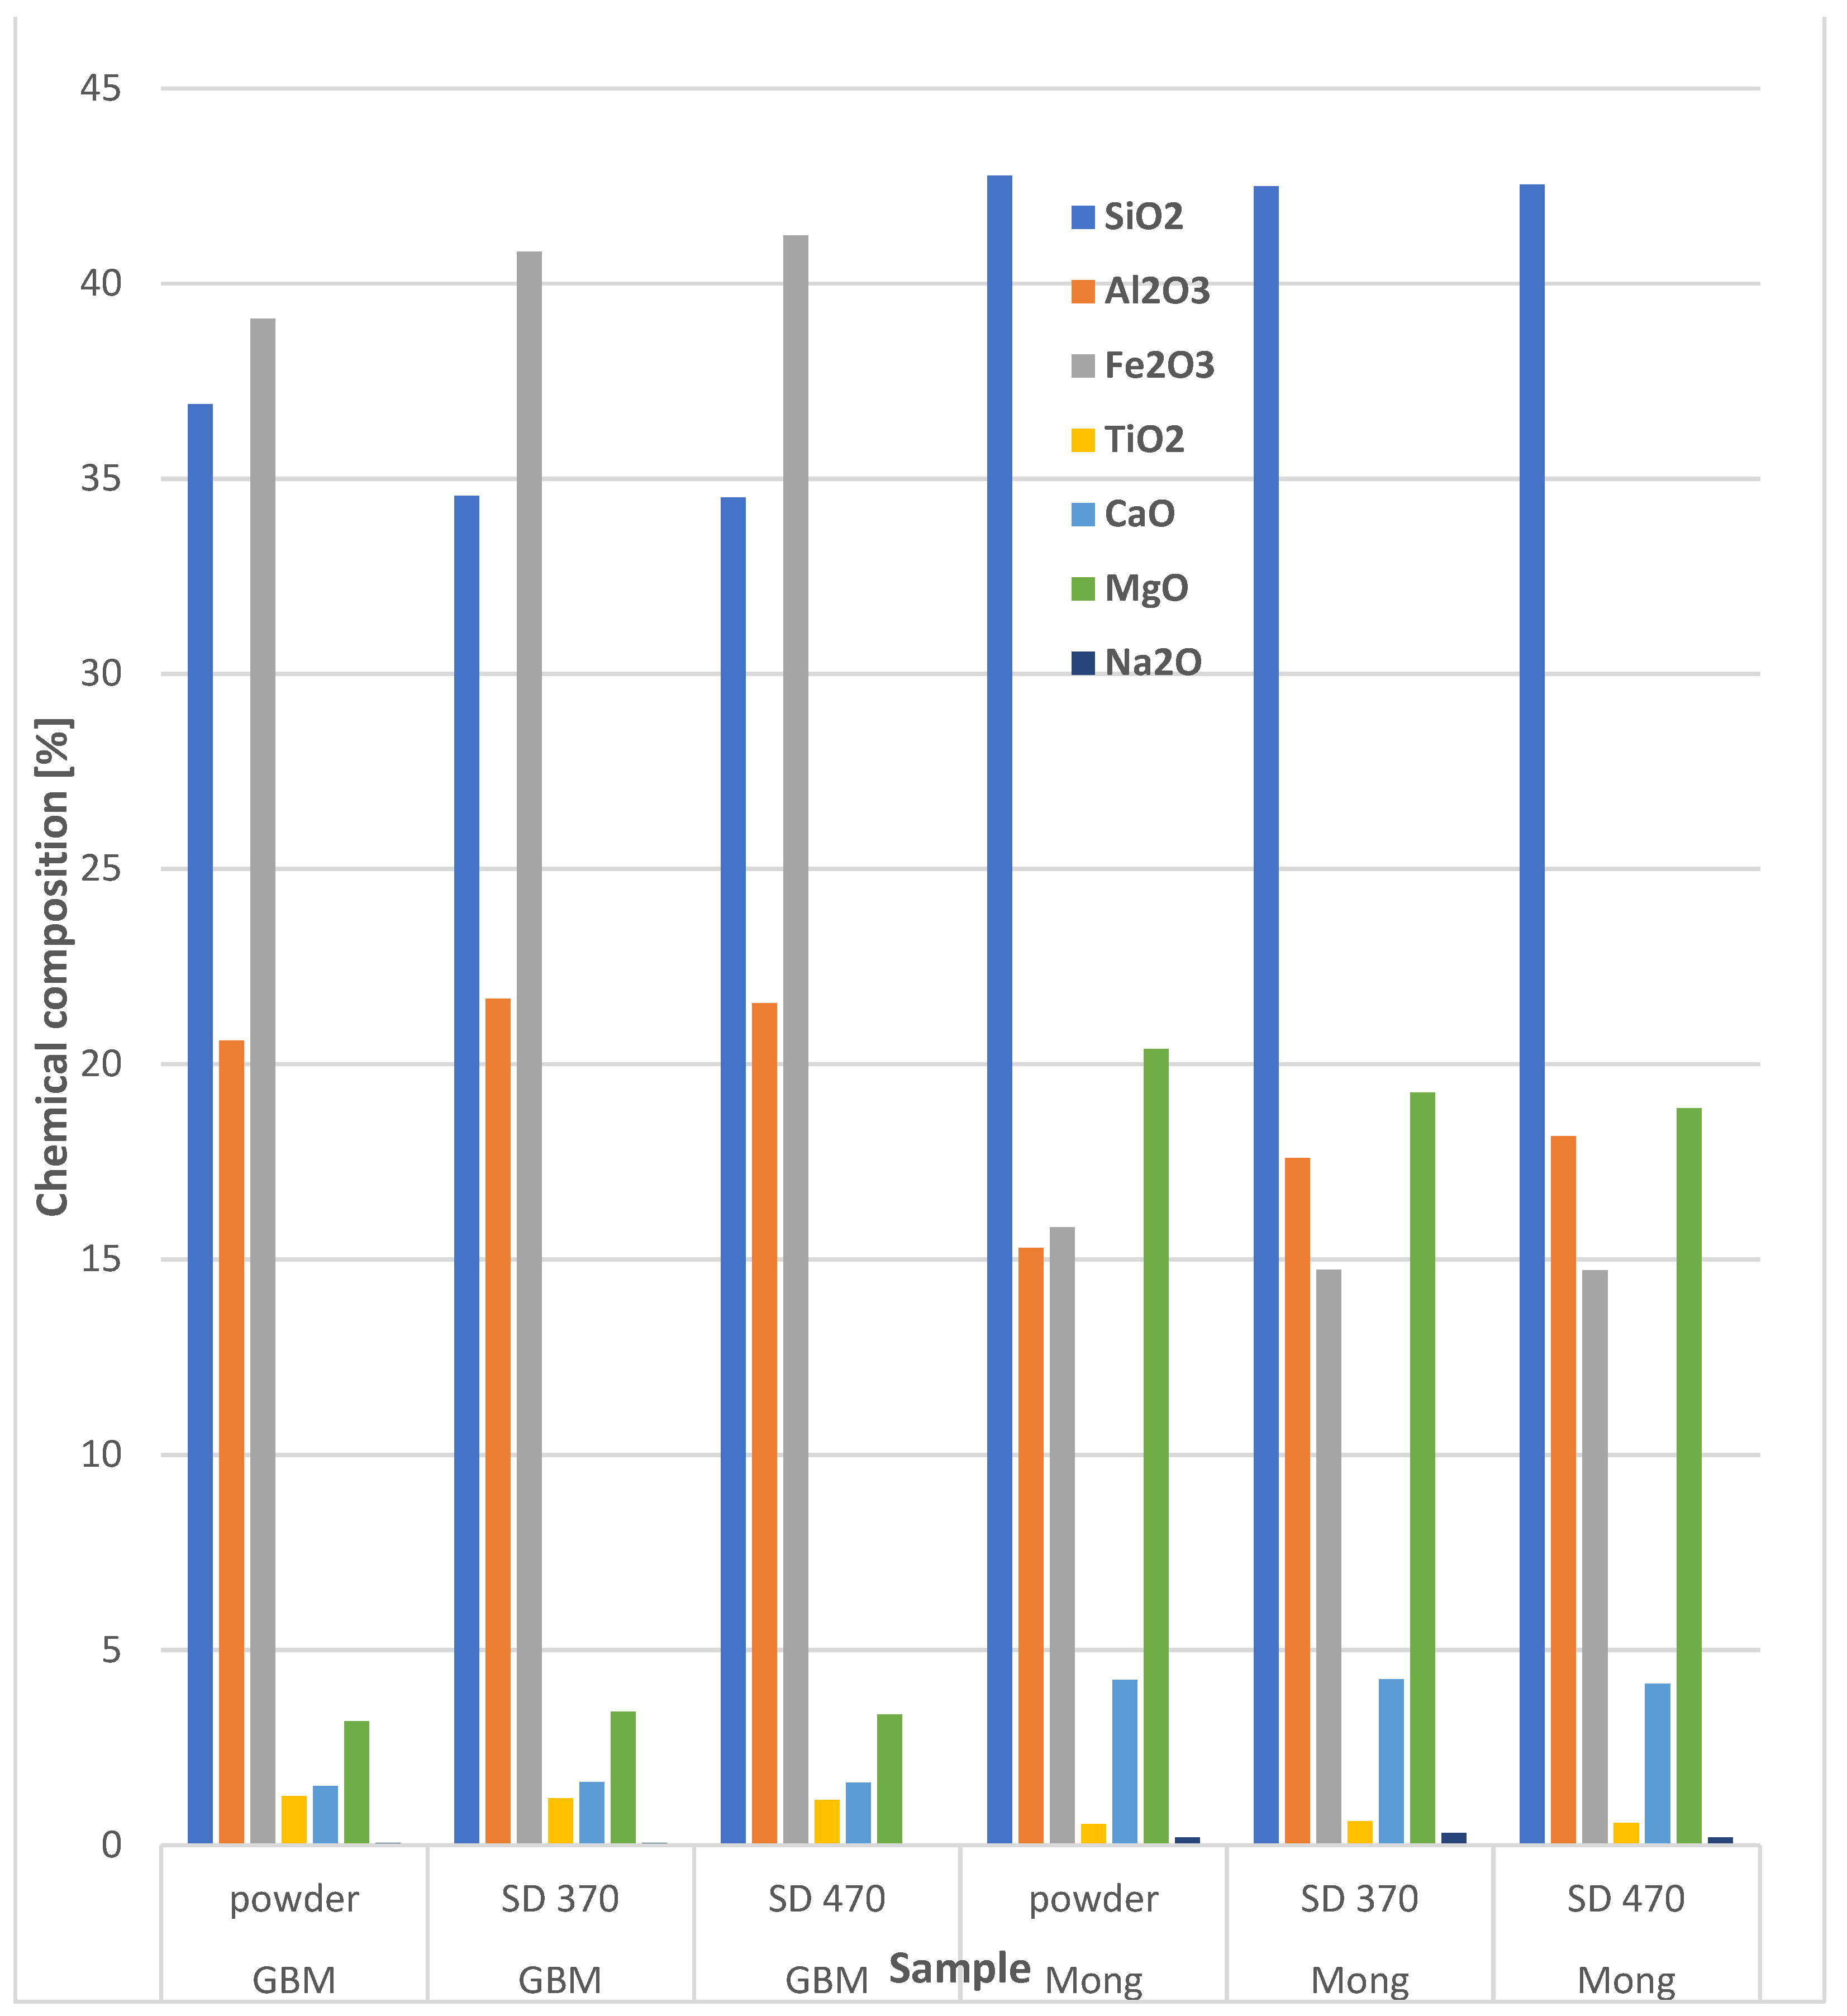
3.1. Microstructure and Phase Composition

The microstructure of coating cross sections is displayed on Figure 2 with main structural features indicated by arrows. Non-connected pores are labeled P, unmolten (or prematurely solidified) particles U and vertical cracks C.
The GBM garnet exhibited less porous structure, especially concerning the large pores. Also, its structural heterogeneities were finer and more flattened in the horizontal direction. On the other hand, GBM was more sensitive to vertical cracking. This is a sign of release of the quenching stress. The difference in colors should correspond to difference in chemical element concentration, which is why we conducted EDS element mapping.
Certain porosity is inherently present in plasma sprayed coatings. The reason for it is a turbulence of plasma flow, random character of the thermal history of each individual powder particle (its size, trajectory in plasma, actual substrate impact speed) and substrate roughness provided by grit blasting before the spray. Substrate preheating is one of the efficient ways to reduce porosity, due to slower cooling (i.e., mainly minimization of stress and limitation of cracks). Using powder with very uniform powder size distribution would also help. For certain materials, a proper thermal post-treatment of the as-sprayed coating serves as a sintering promotor and can decrease the porosity.
The porosity parameters, summarized in Figure 3a–c show that GBM370 was less porous (smaller AF) than Mong370. Its porosity was composed of a larger quantity (larger NV) of finer pores (smaller ED). The pores of GBM370 were also more circular. For nearly all criteria the standard deviation was smaller for GBM370, so porosity of this coating was more homogeneous. Microhardness is displayed in Figure 4 and commented later together with all mechanic aspects.
Concerning the influence of spray distance SD, for GBM this meant 470 versus 370, which was the same as Mong370 versus GBM370, but not to such a large extent. Among Mong coatings, the high SD sample was also more porous, as in the case of GBM.
The porosity of all coatings was under 3.5%, which is rather low in the field of plasma sprayed ceramics or minerals. Almandine garnet is among various natural powders one really good candidate to be sprayed routinely in the industry.
Figure 5 and Figure 6 display the element mapping. In the GBM sample, the elements were rather homogenously distributed, with nearly no islands with predominant content of a certain element. The only visible exceptions were unmolten particles (label U in Figure 2), where Si, Fe and Al were not so concentrated as in the surrounding coating mass. Furthermore, titanium was predominantly concentrated in white or pale grey lamellas; however, its concentration in the entire sample was well under 1%.
The unmolten particles could have had two origins: either they belonged to feedstock that was not completely melted or they prematurely solidified before the substrate impact. In both cases they were only embedded in the coating and contributed very weakly to its cohesion. Proper adjustment of FD and SD was a key factor for minimizing the unmolten particle content. However, more chemically complex feedstock often means more problems with these particles (separation of phases having different density in plasma, surface tension of the molten components, their different reduction/oxidation activity).
In the Mong sample, there existed separated (lighter) islands rich in silicon. These islands were, on the other hand, poor in Fe, Mg and especially Al. The role of Ti was less important. The Mong sample looked like a material that had more time for solidification after melting. The Mg element was much more important in this material than in GBM, according to the overall chemical composition (see below). This was partly in contradiction with the XRD analysis, which indicated the Mong470 sample as being Fe-rich almandine, Table 1. In a garnet group Fe is typical for almandine and Mg for pyrope [1]. Many natural garnets are between them, combining Fe and Mg with a high variability. However, to exactly distinguish each of them by XRD was difficult because of a lack of PDF cards and also due to the undercooled character of our plasma sprayed samples (which fixed several structural or chemical features as not expected at room temperature).
X-ray diffraction, Table 1 and Figure 7, showed that the GBM coating was fully amorphous, whereas the Mong coating was crystalline. The feedstock declared as Mongolian garnet was in fact not exactly garnet but was decomposed into phases like SiO2, albite, cordierite and mica-muscovite (alternatively enstatite-steatite). Such a multi-phase powder easily provided seeds for crystallization since the melting of such a complex system was not completely congruent. On the other hand, the almandine garnet, with minor content of SiO2 (i.e., GBM composition), tended to form amorphous matter after rapid cooling, since the glass forming ability of the phases was large.
Microhardness is summarized in Figure 4. The hardest coating was Mong370 with nearly 15 GPa. The larger standard deviation of the Mong coatings were because of their heterogeneity. All samples, with the exception of GBM470, exhibited certain unmolten particles, showing local extremes of microhardness between 25 and 45 GPa.

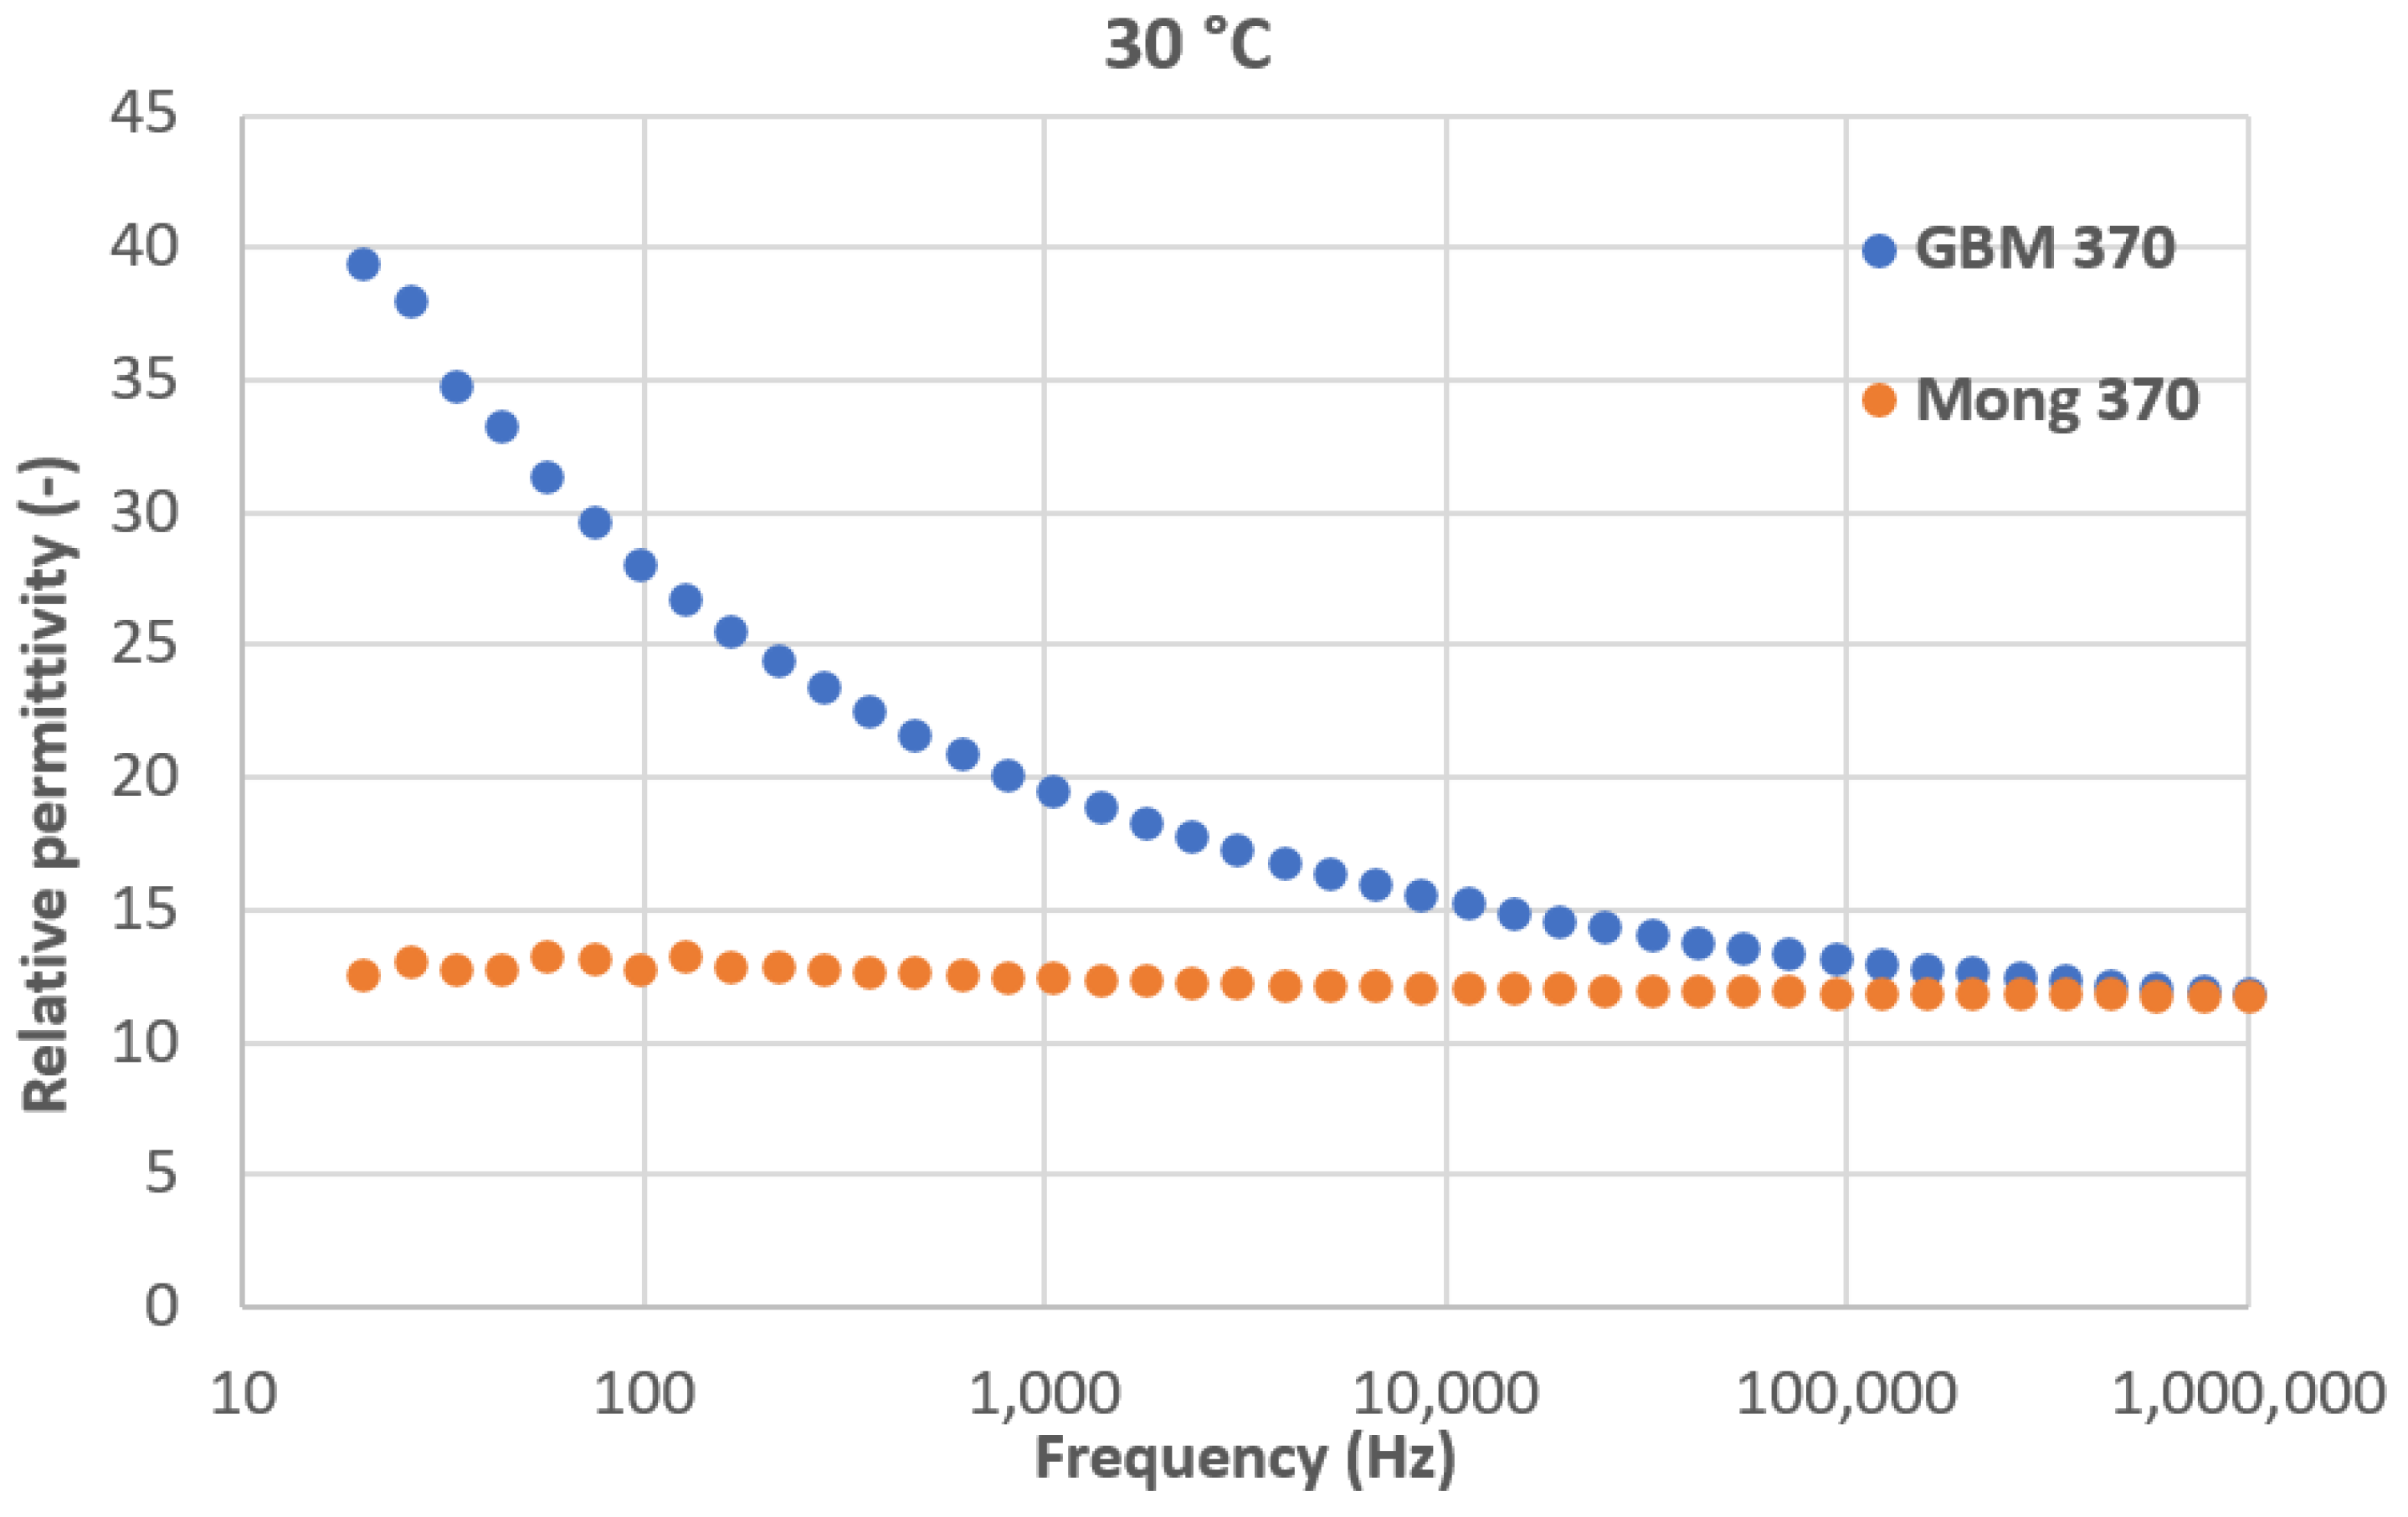
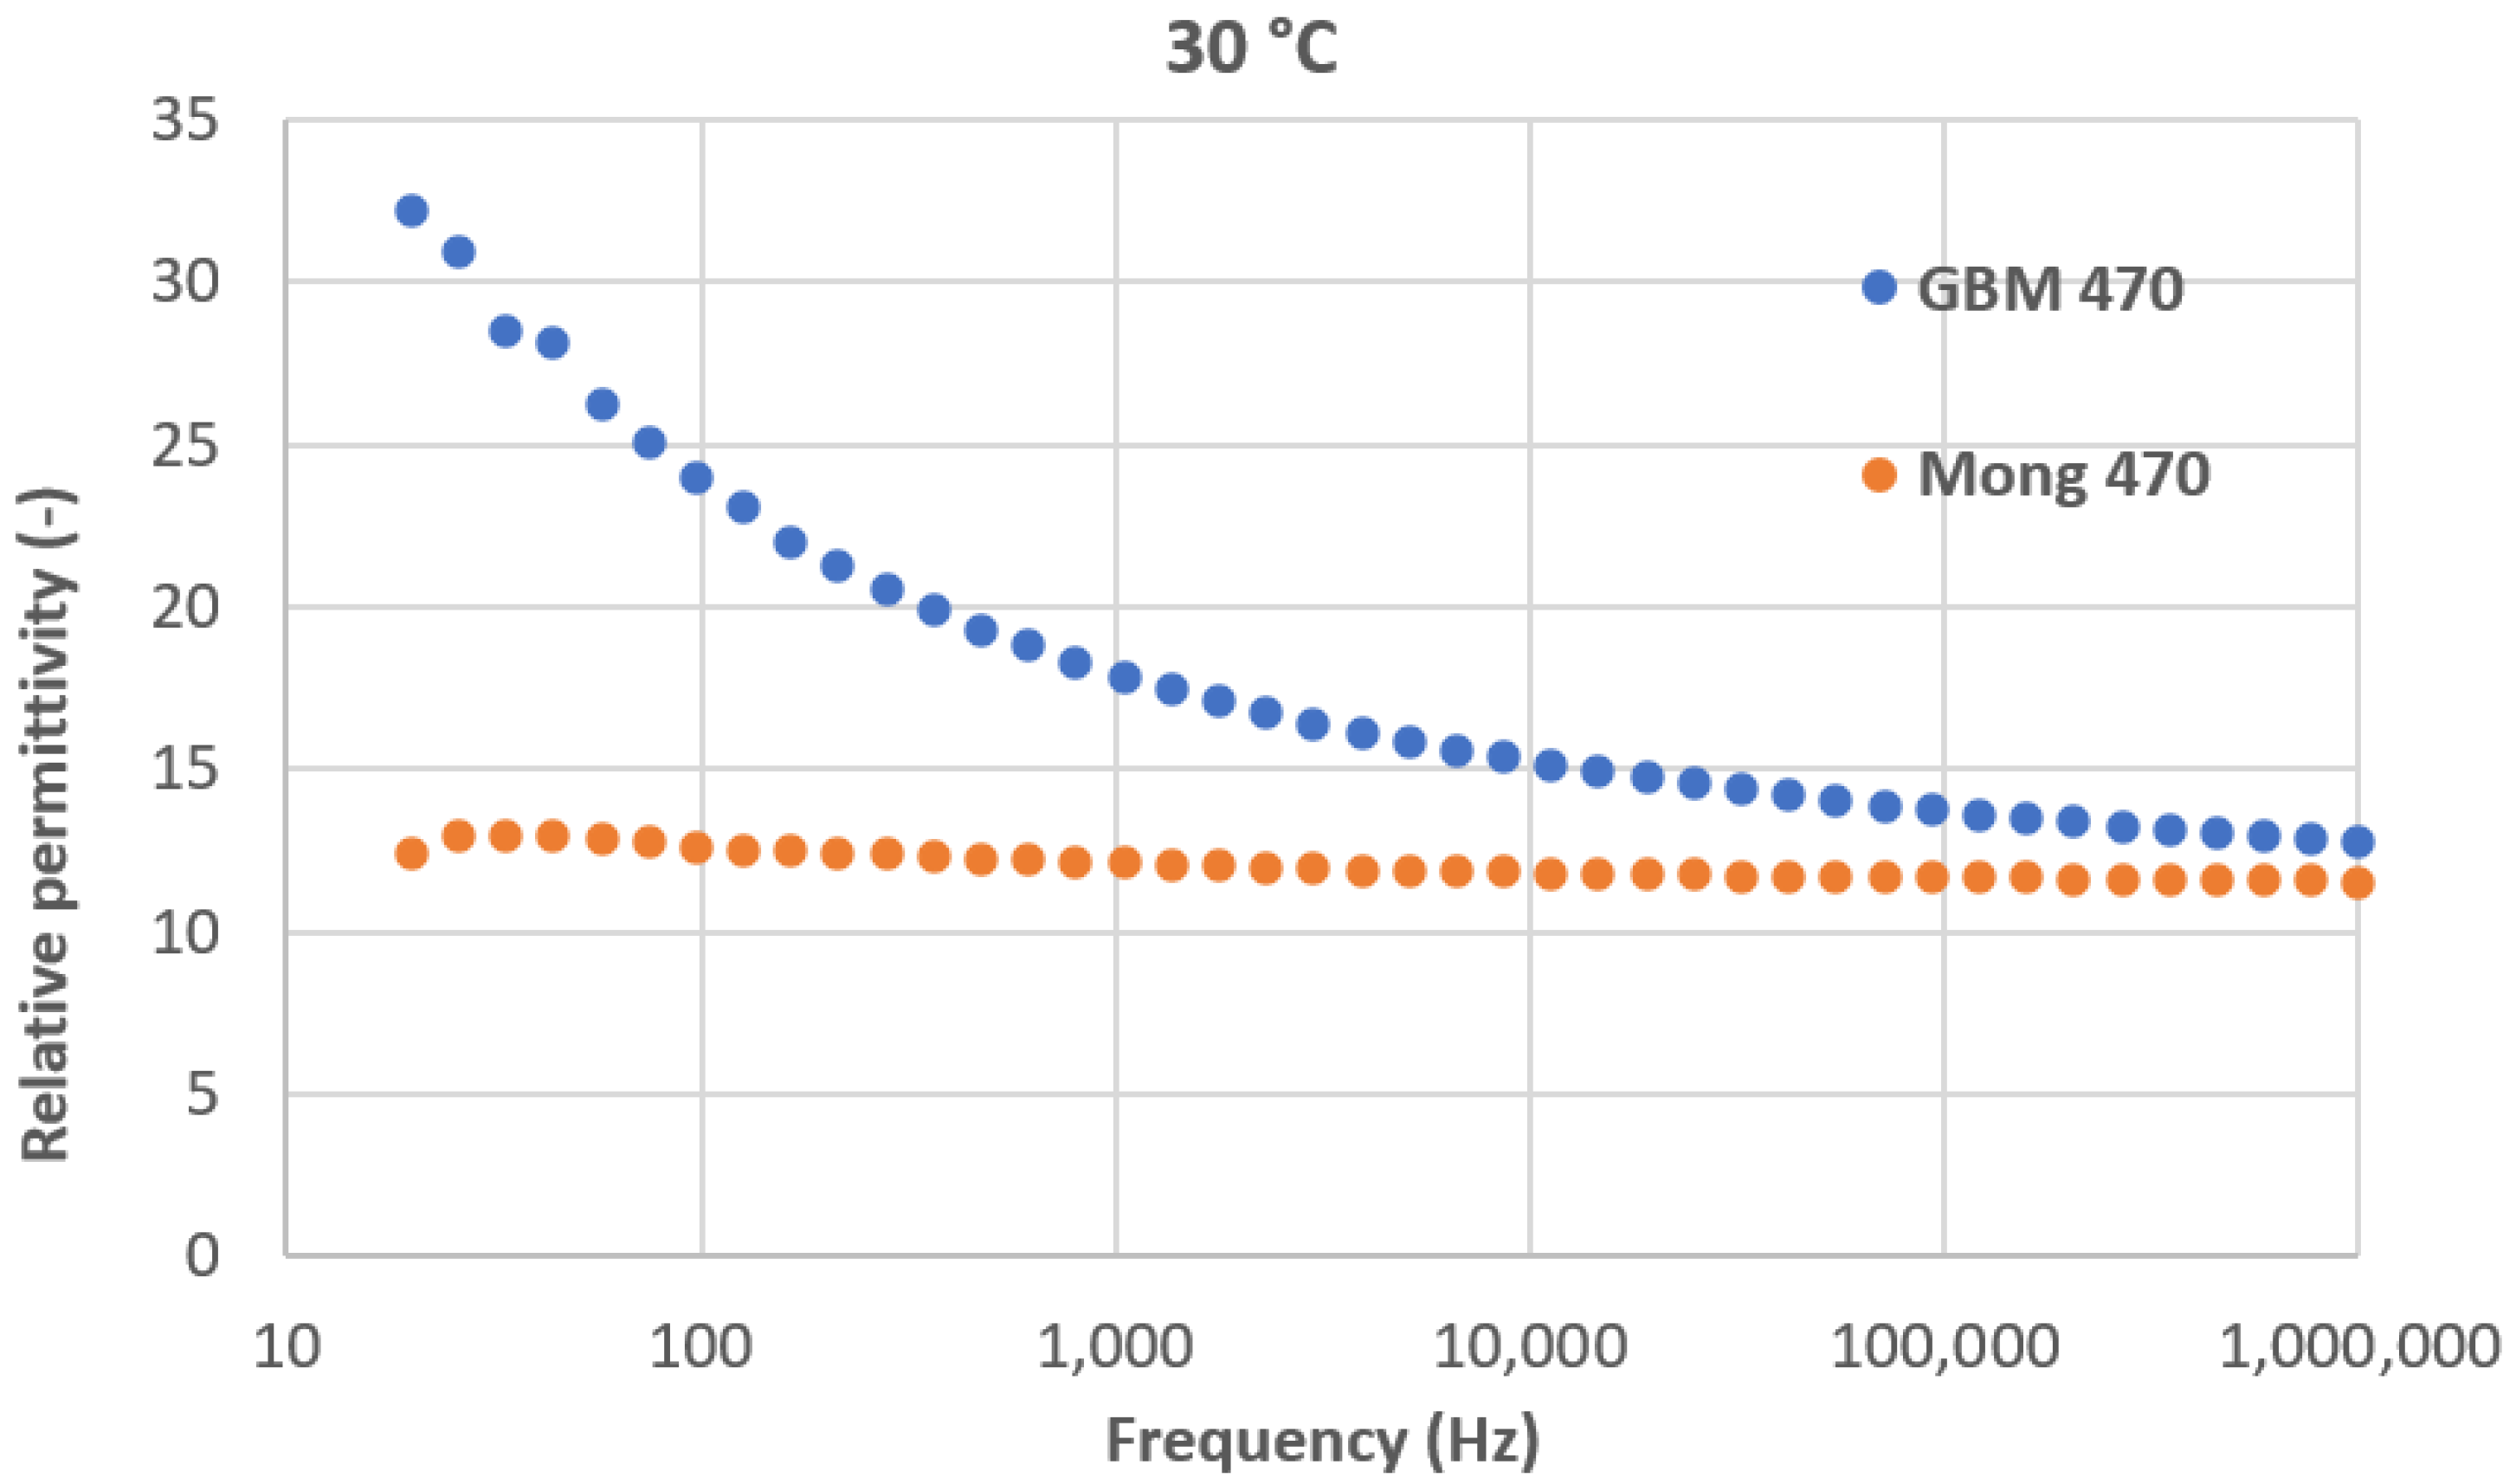
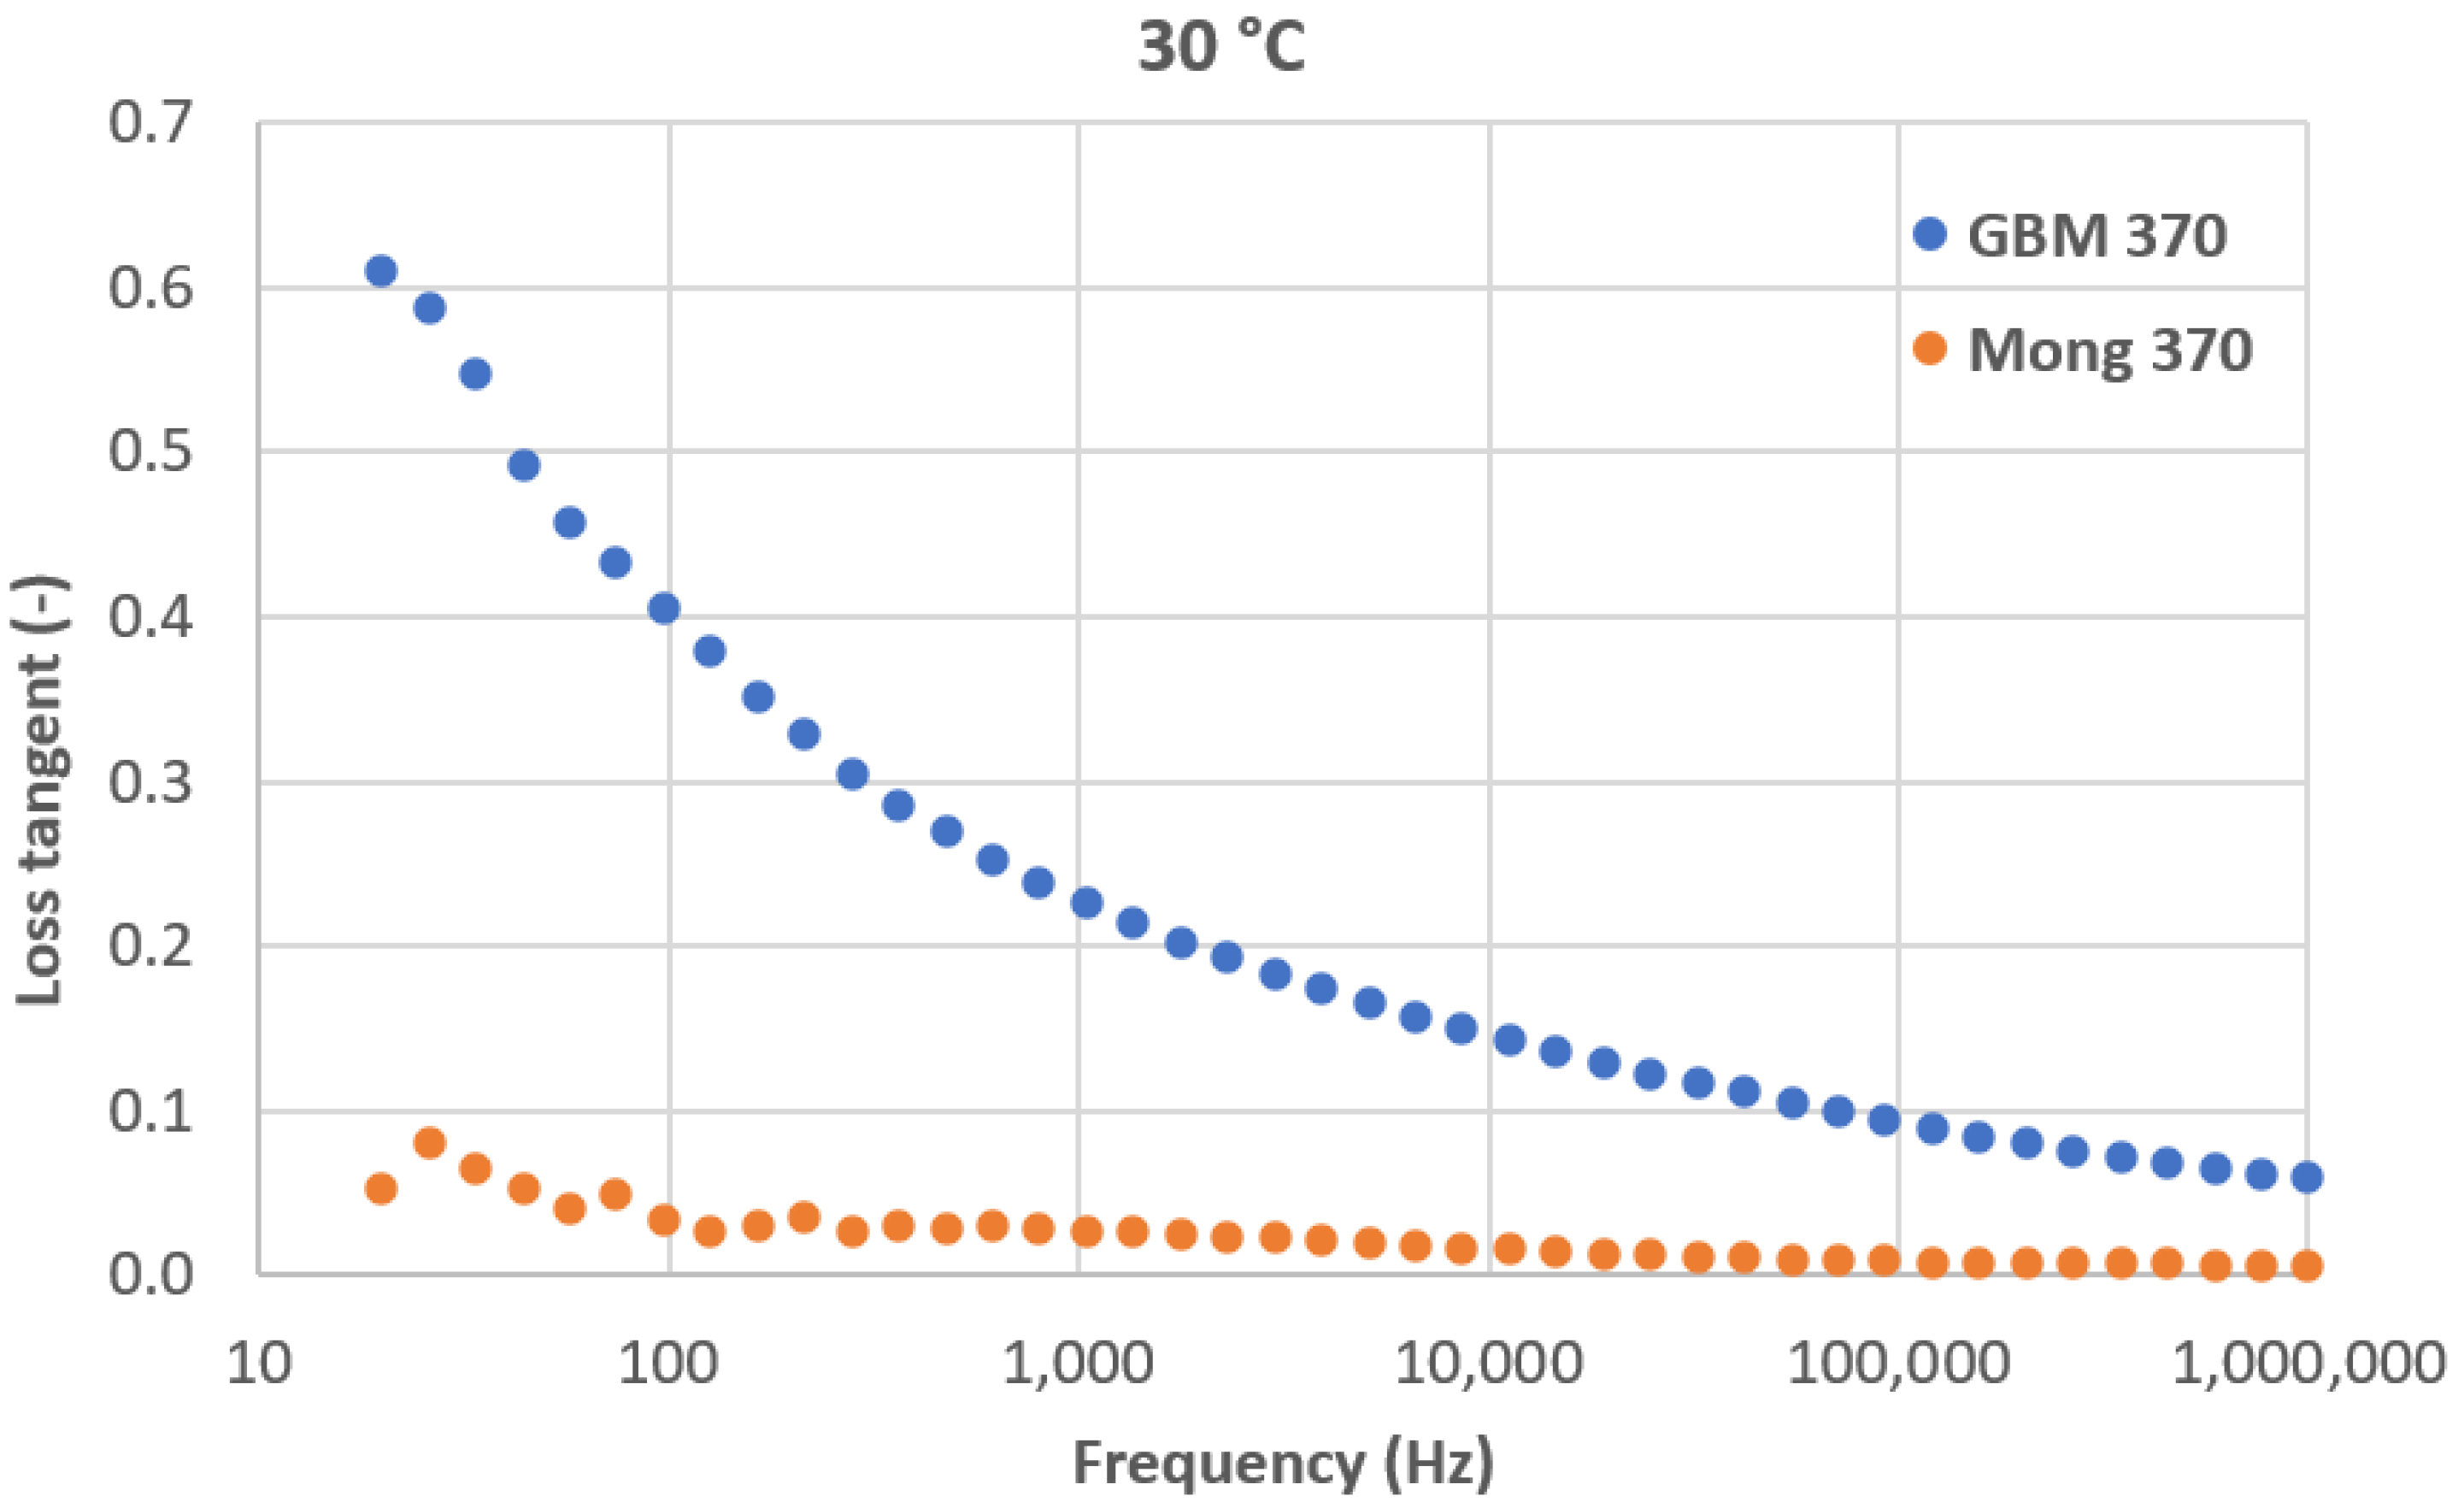
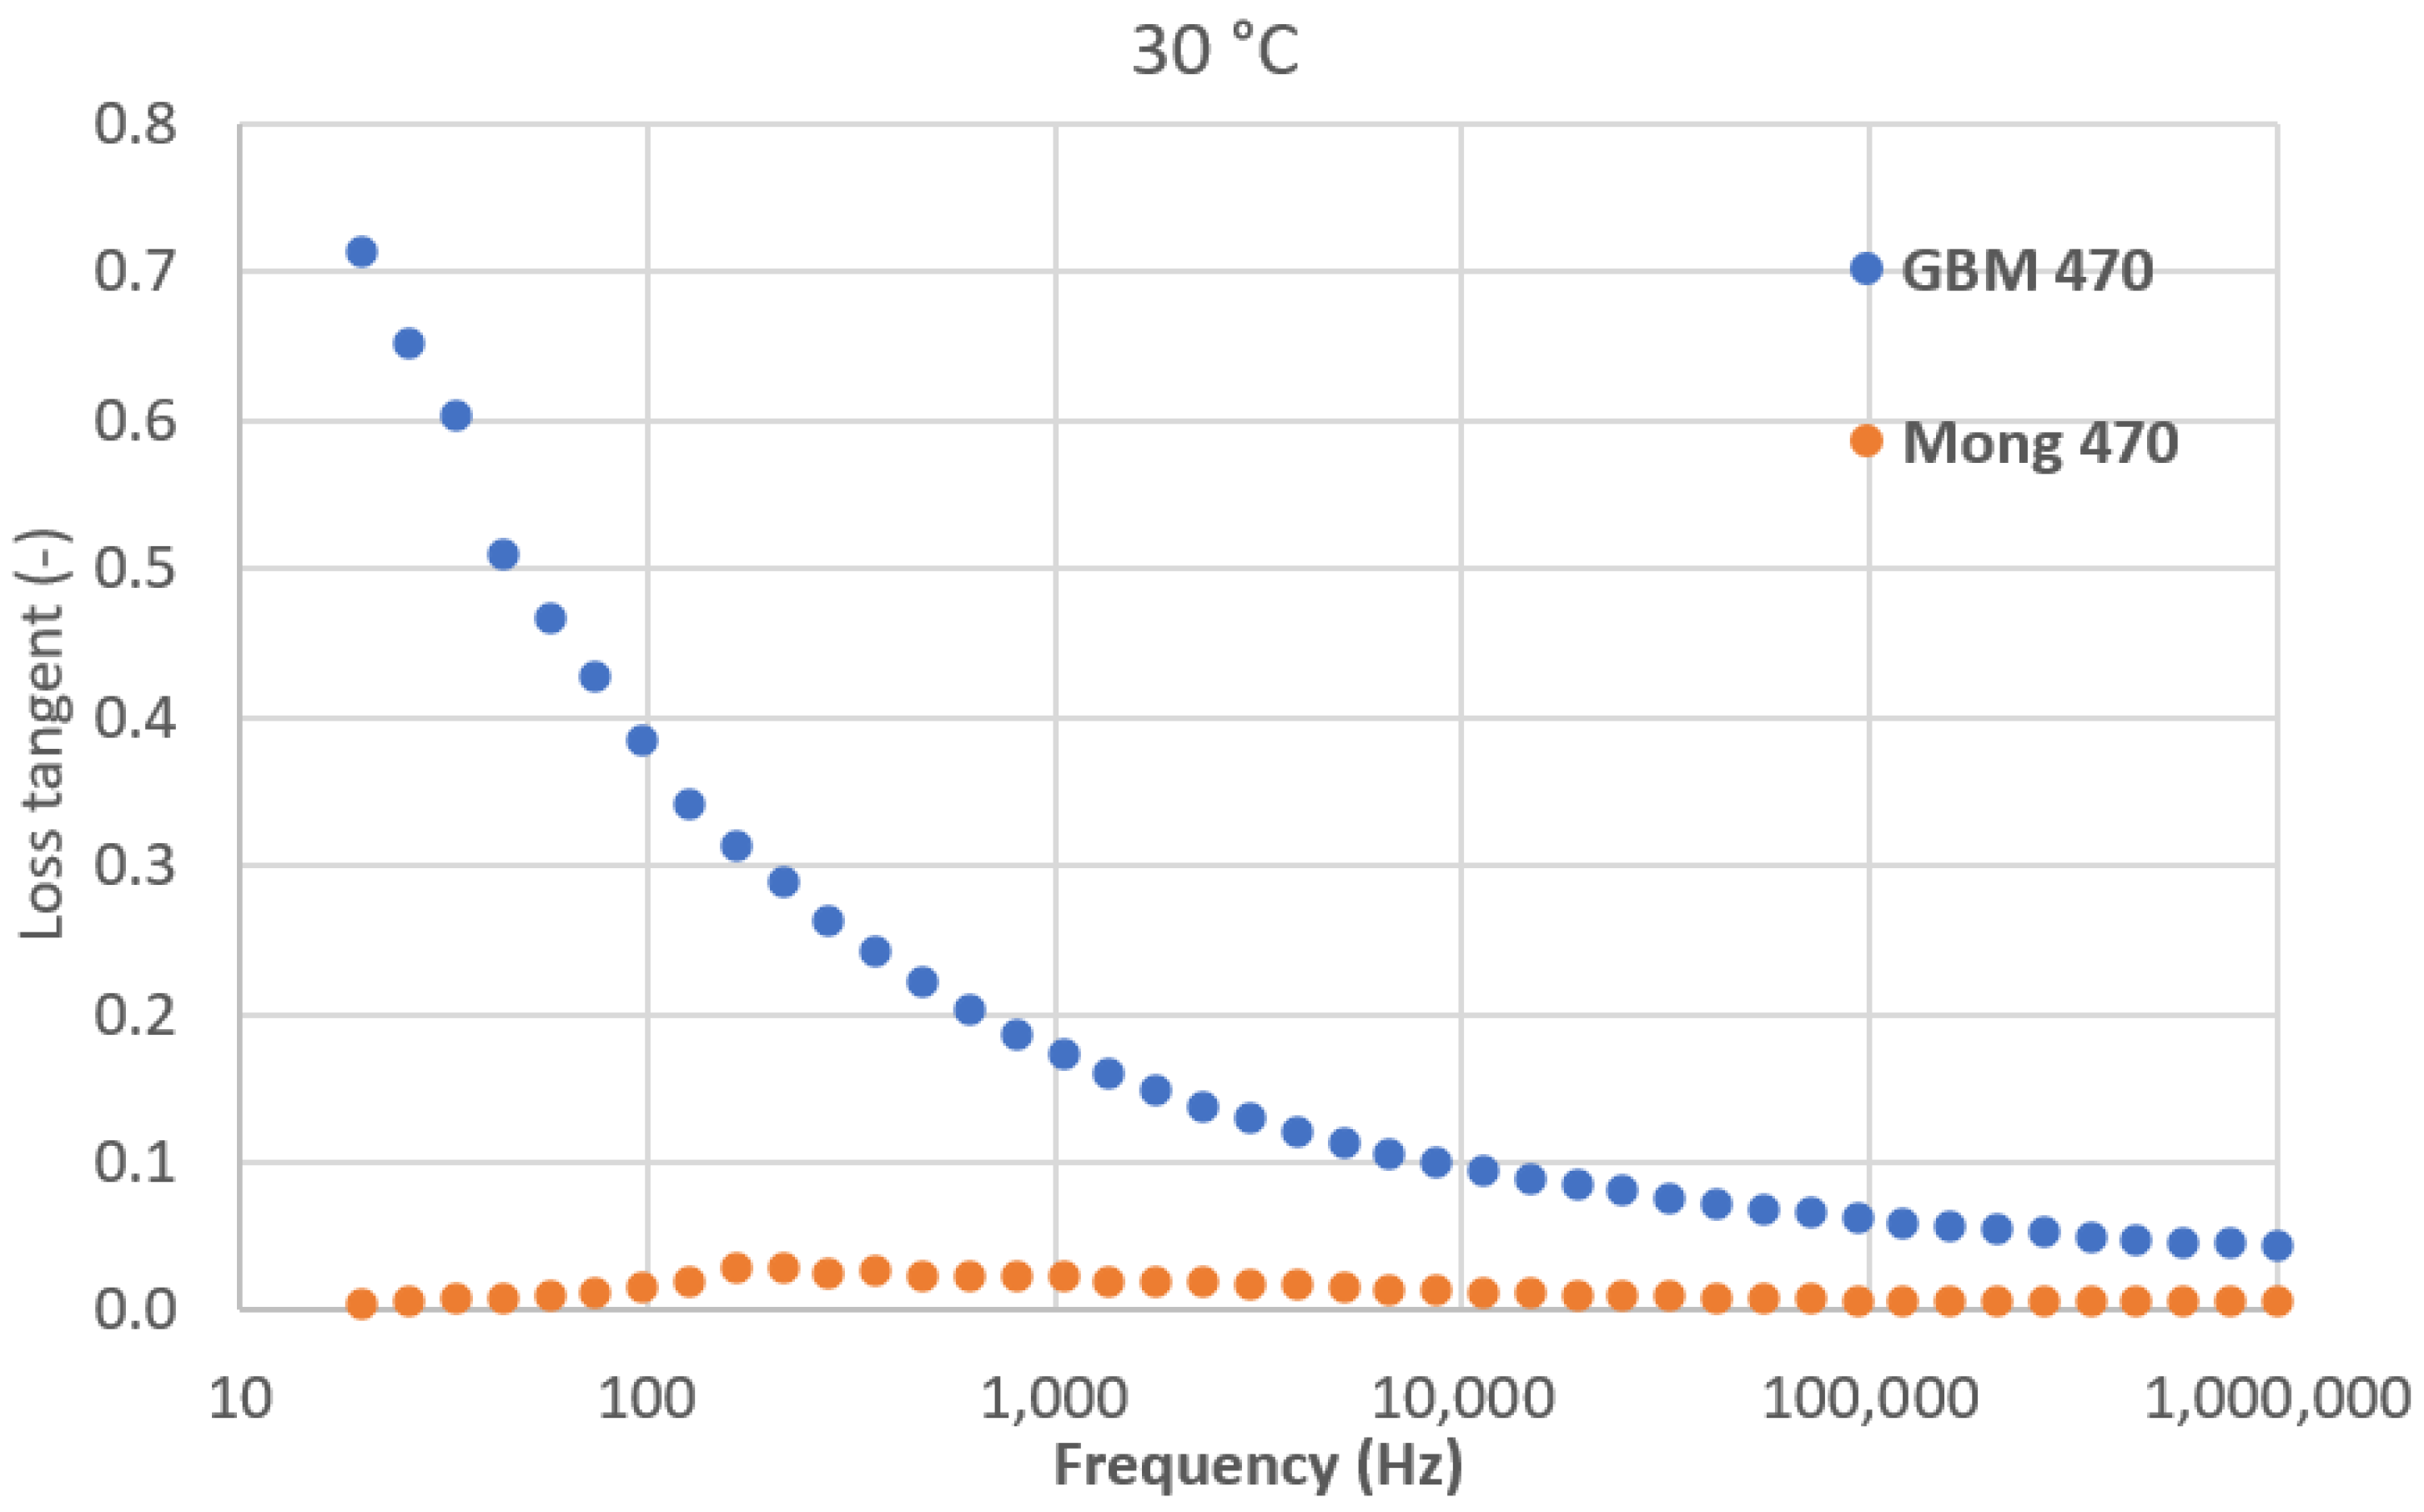
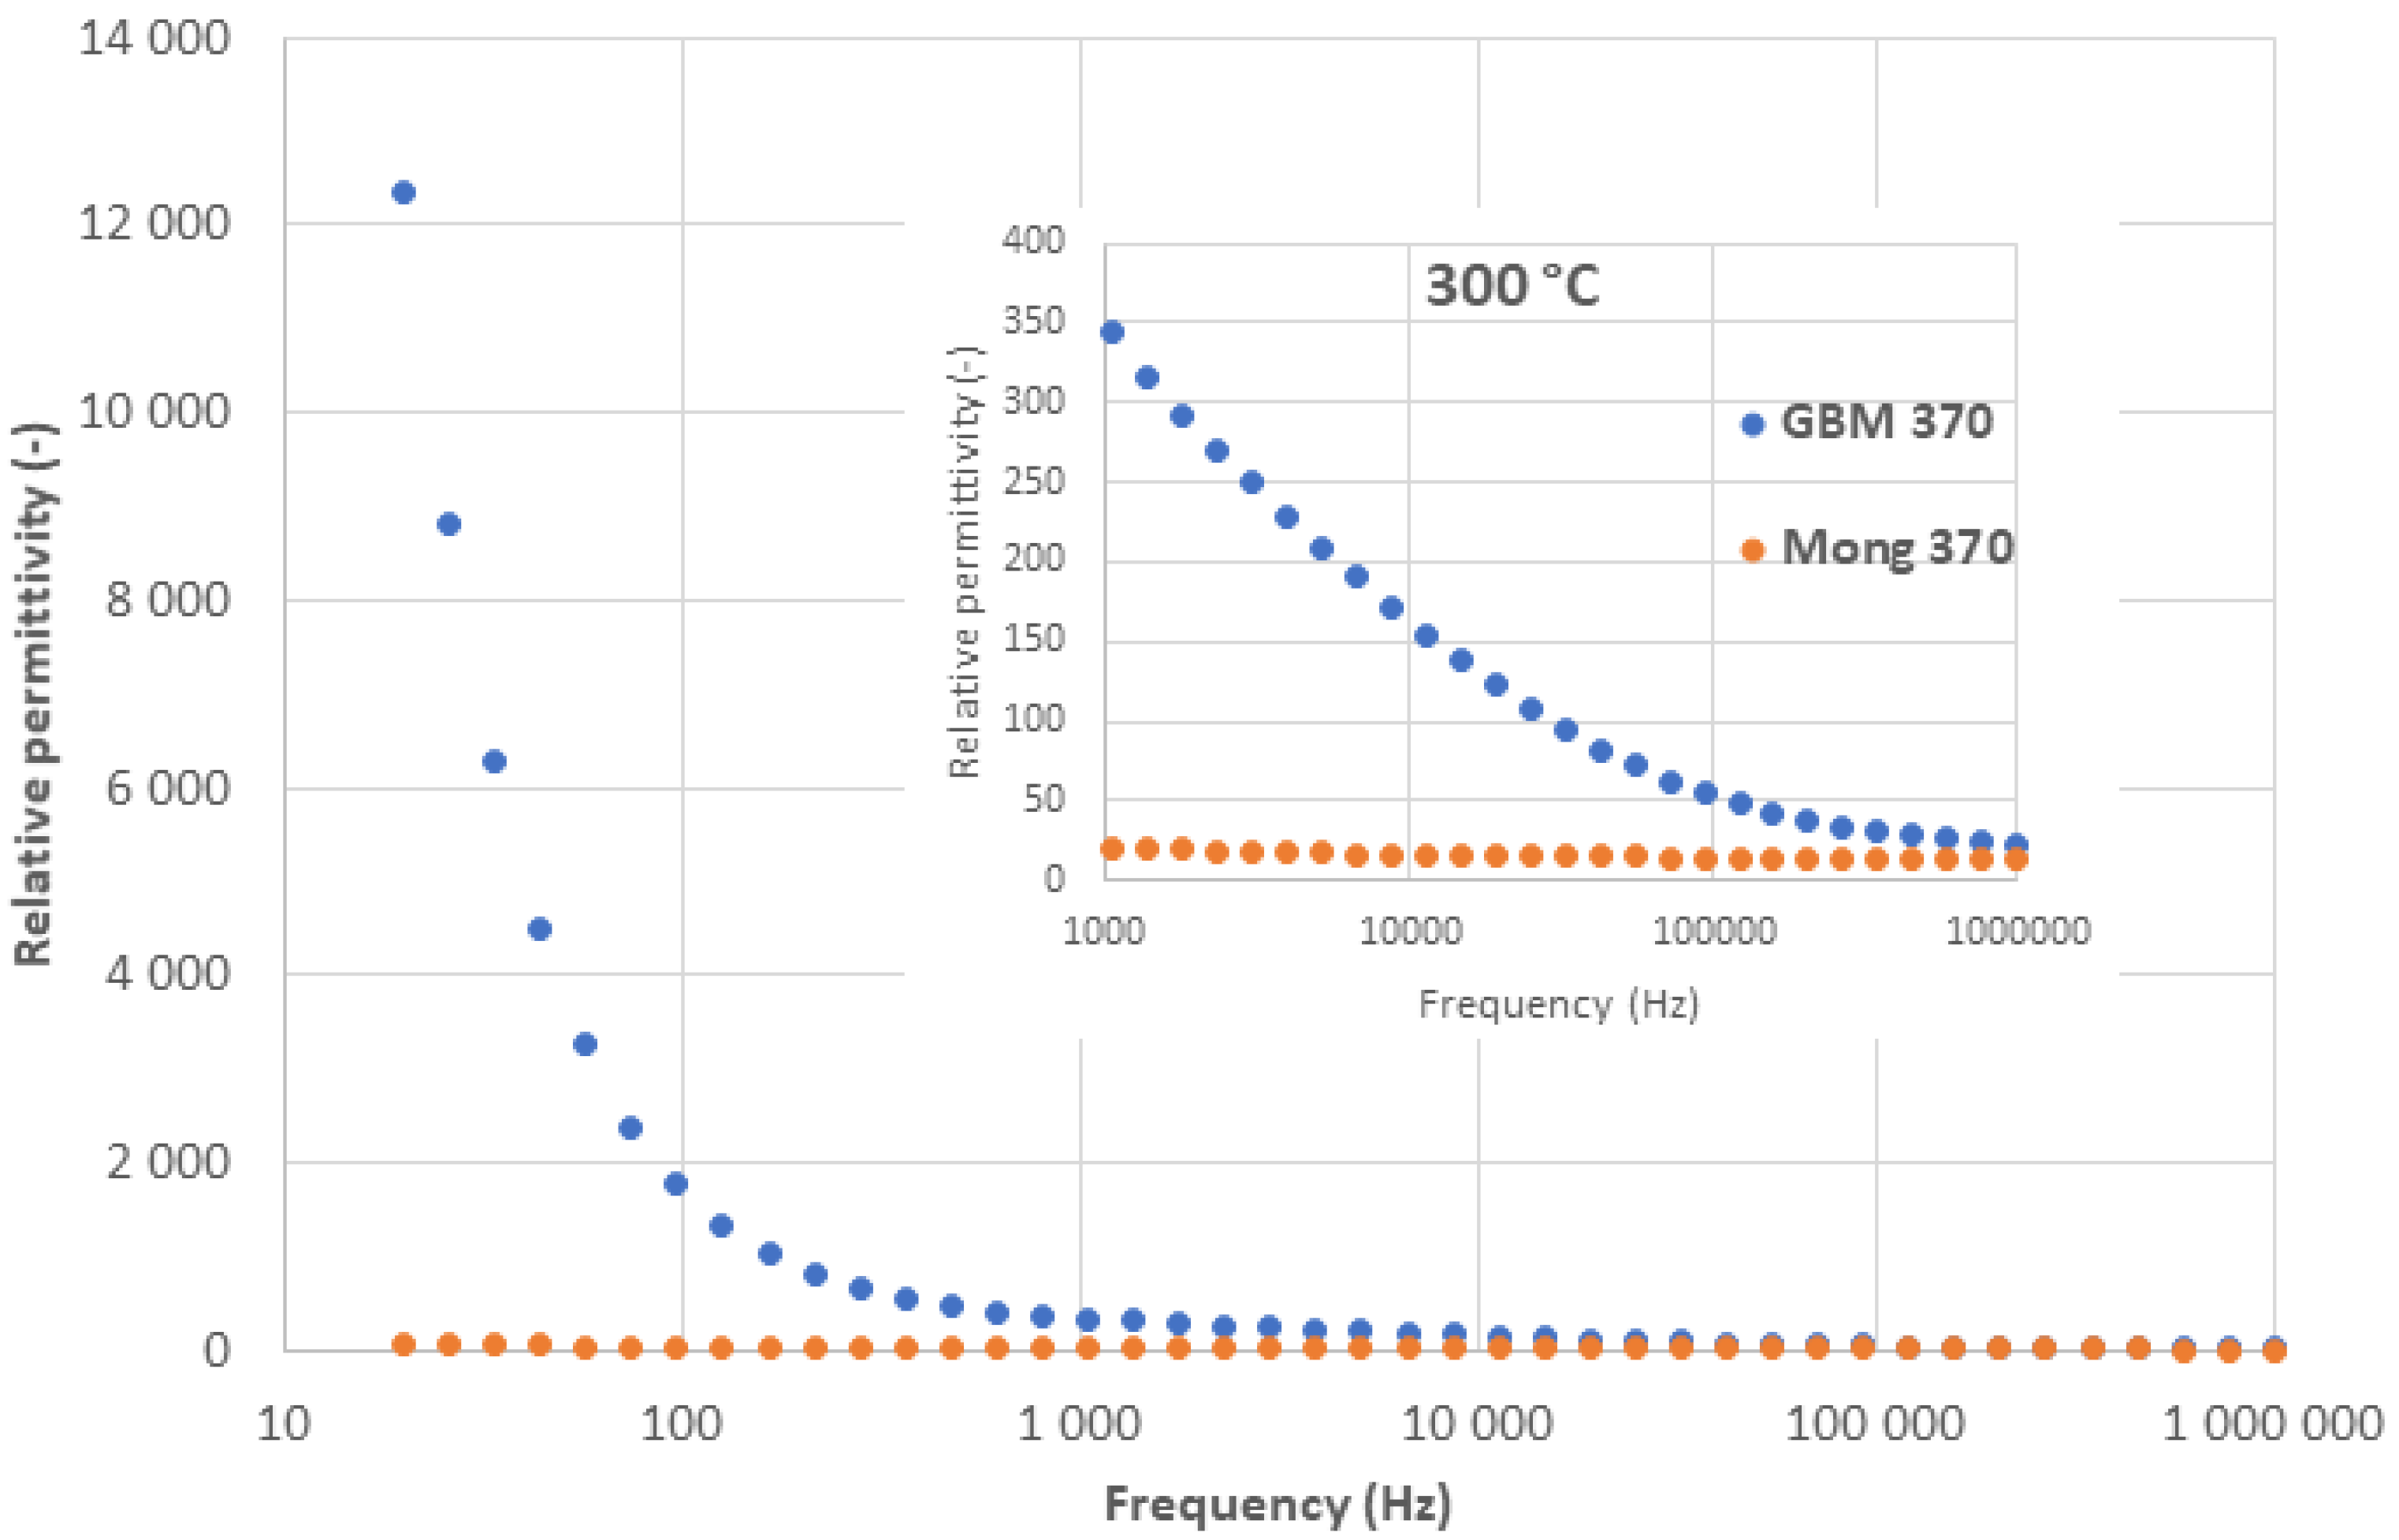
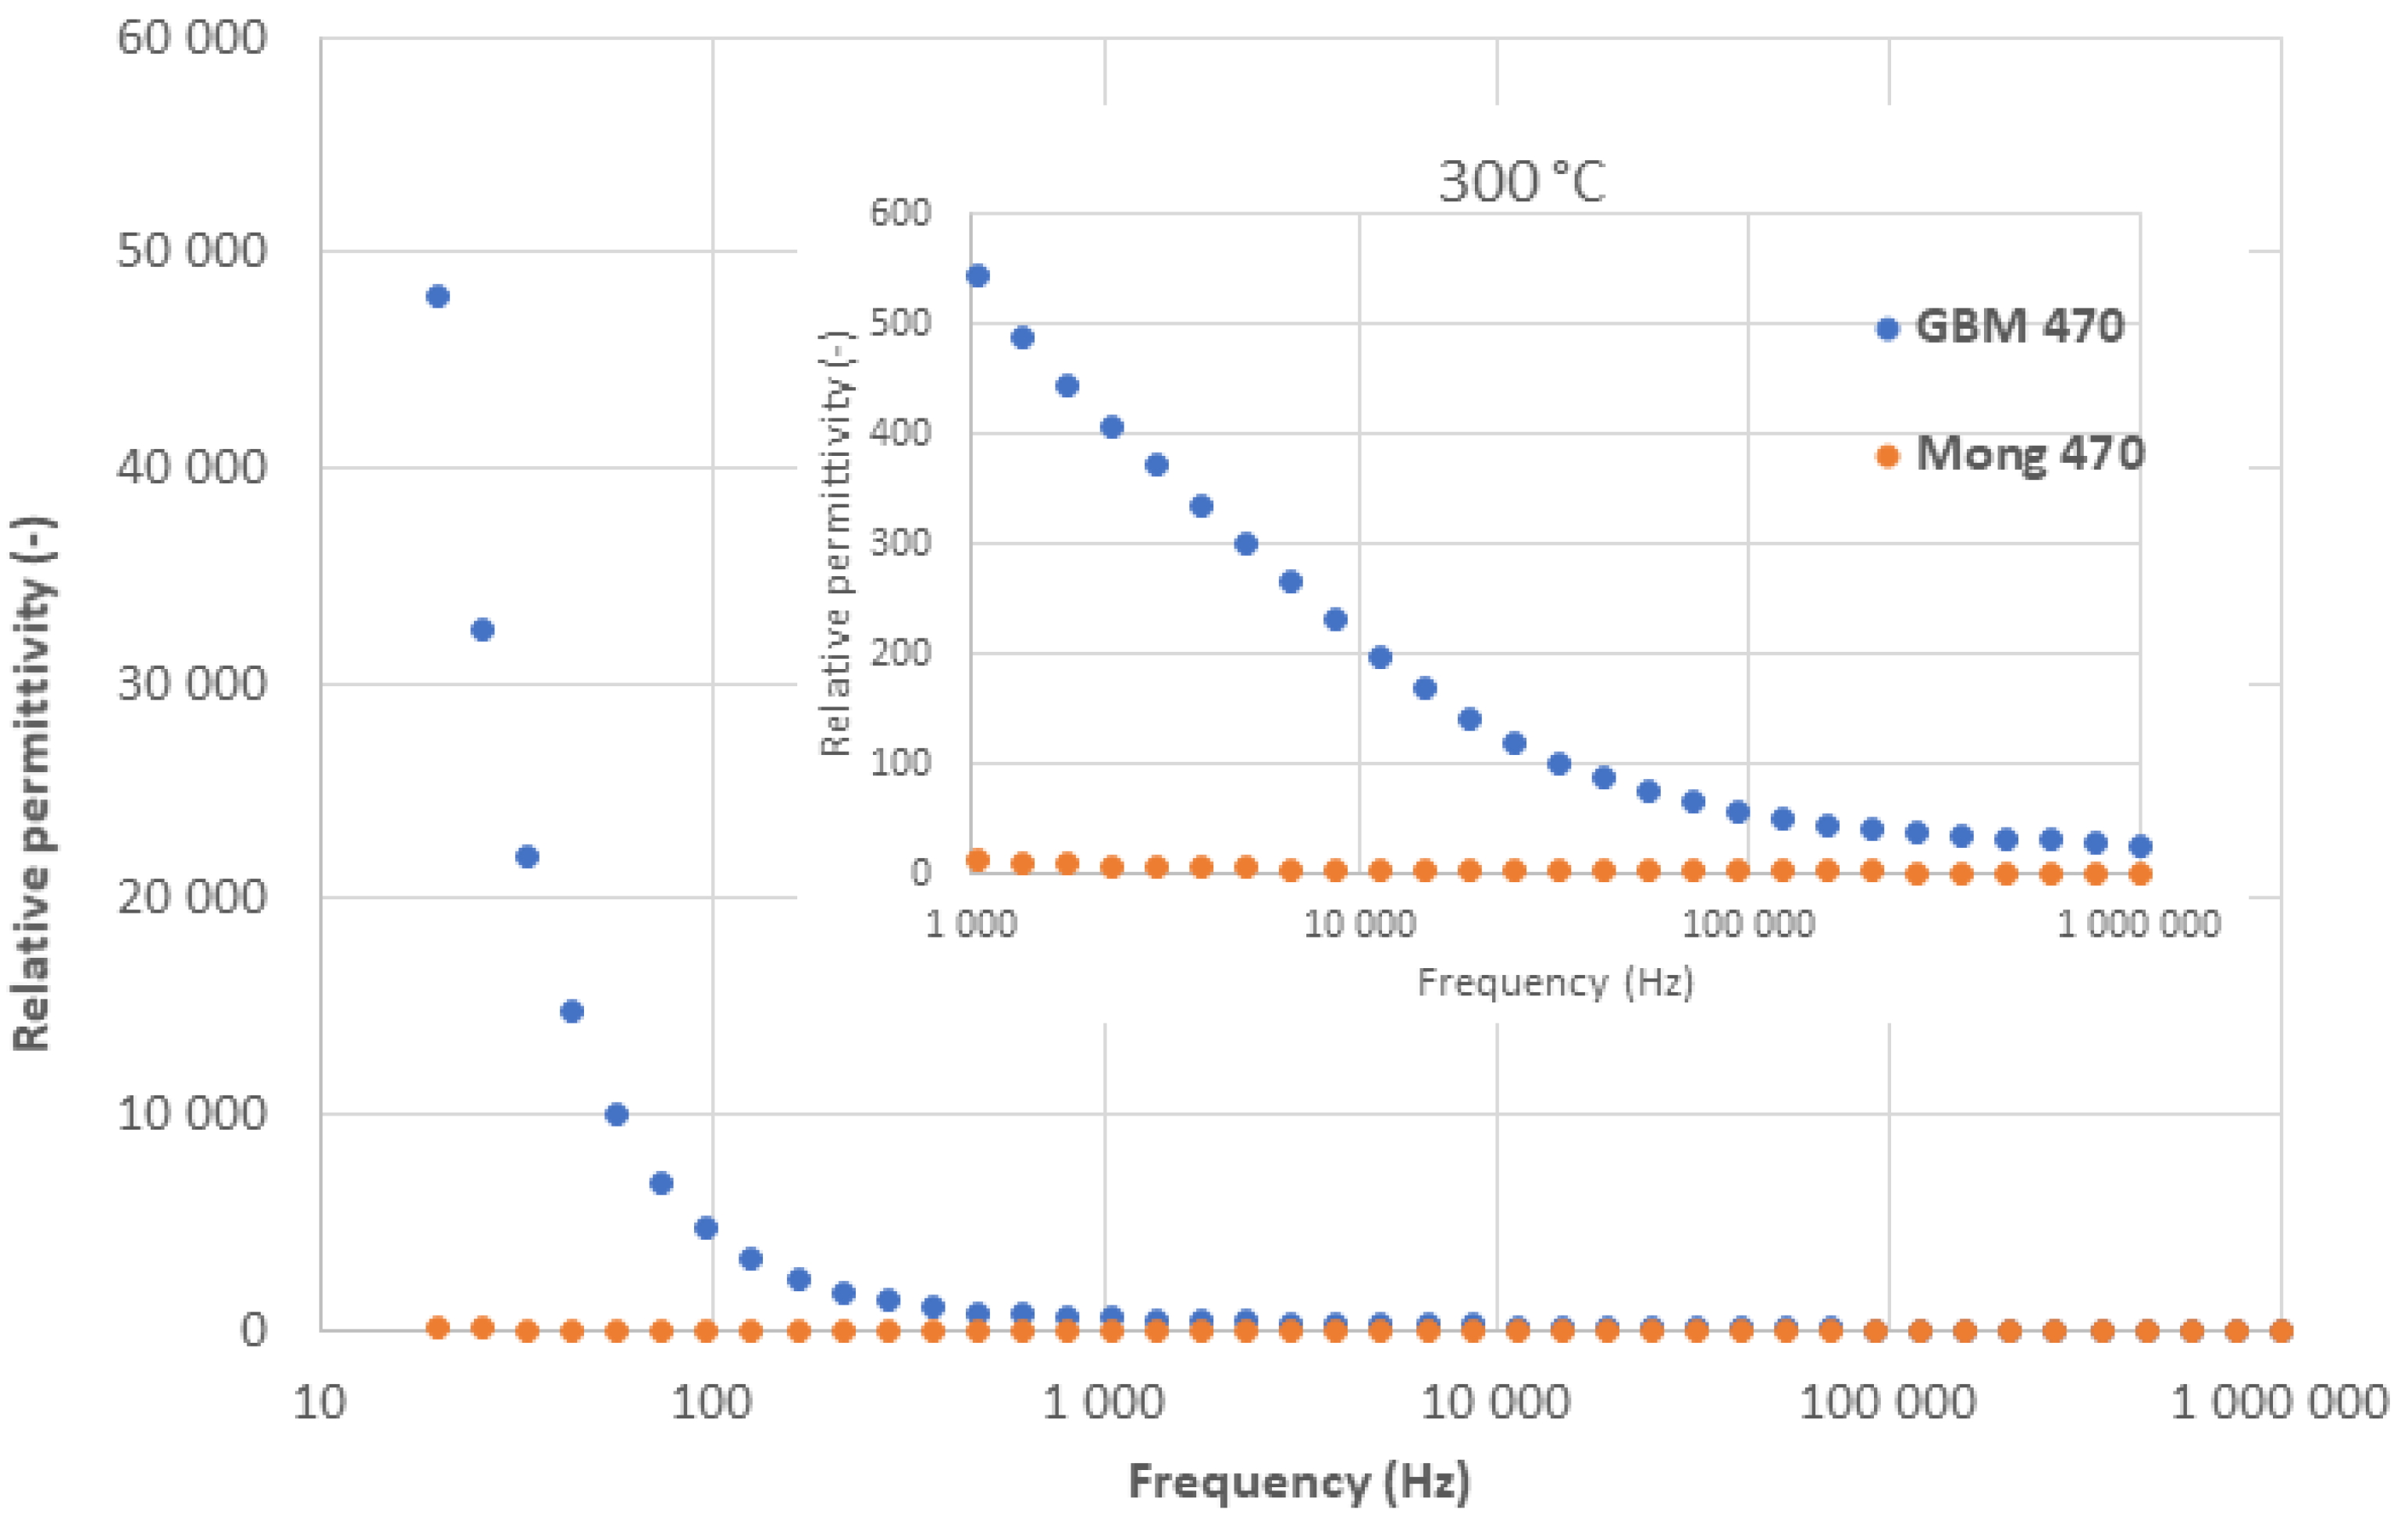
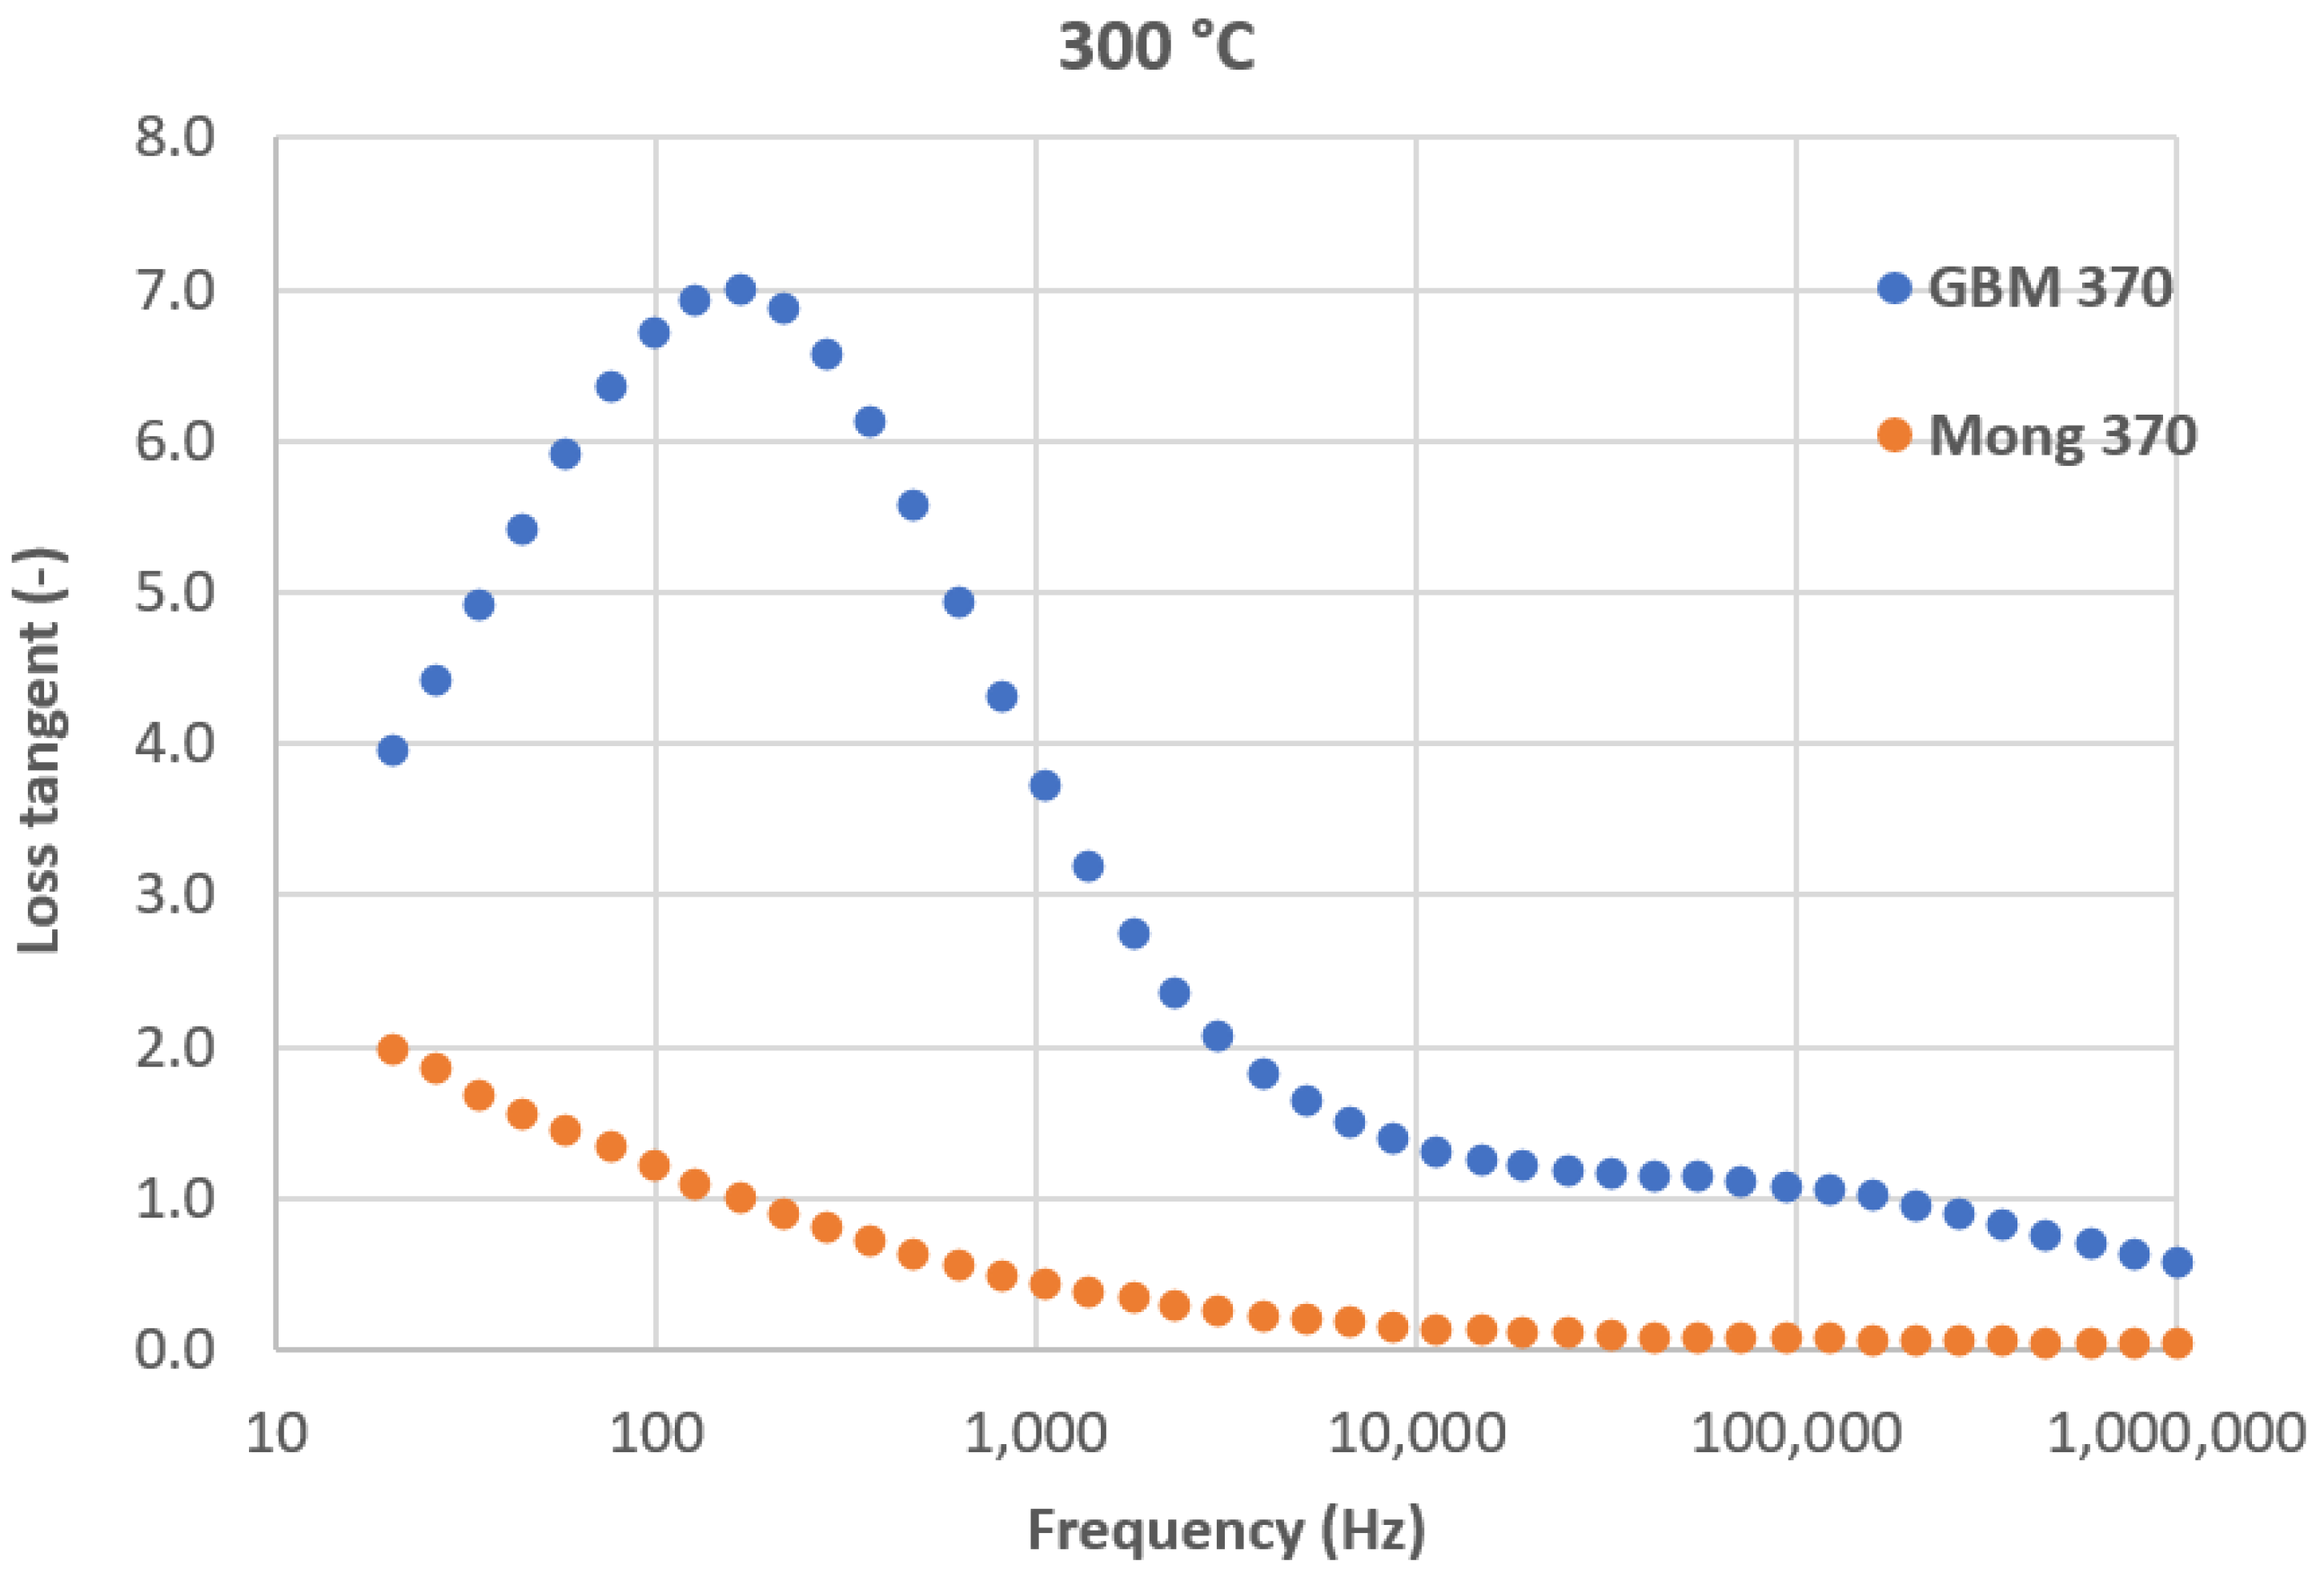
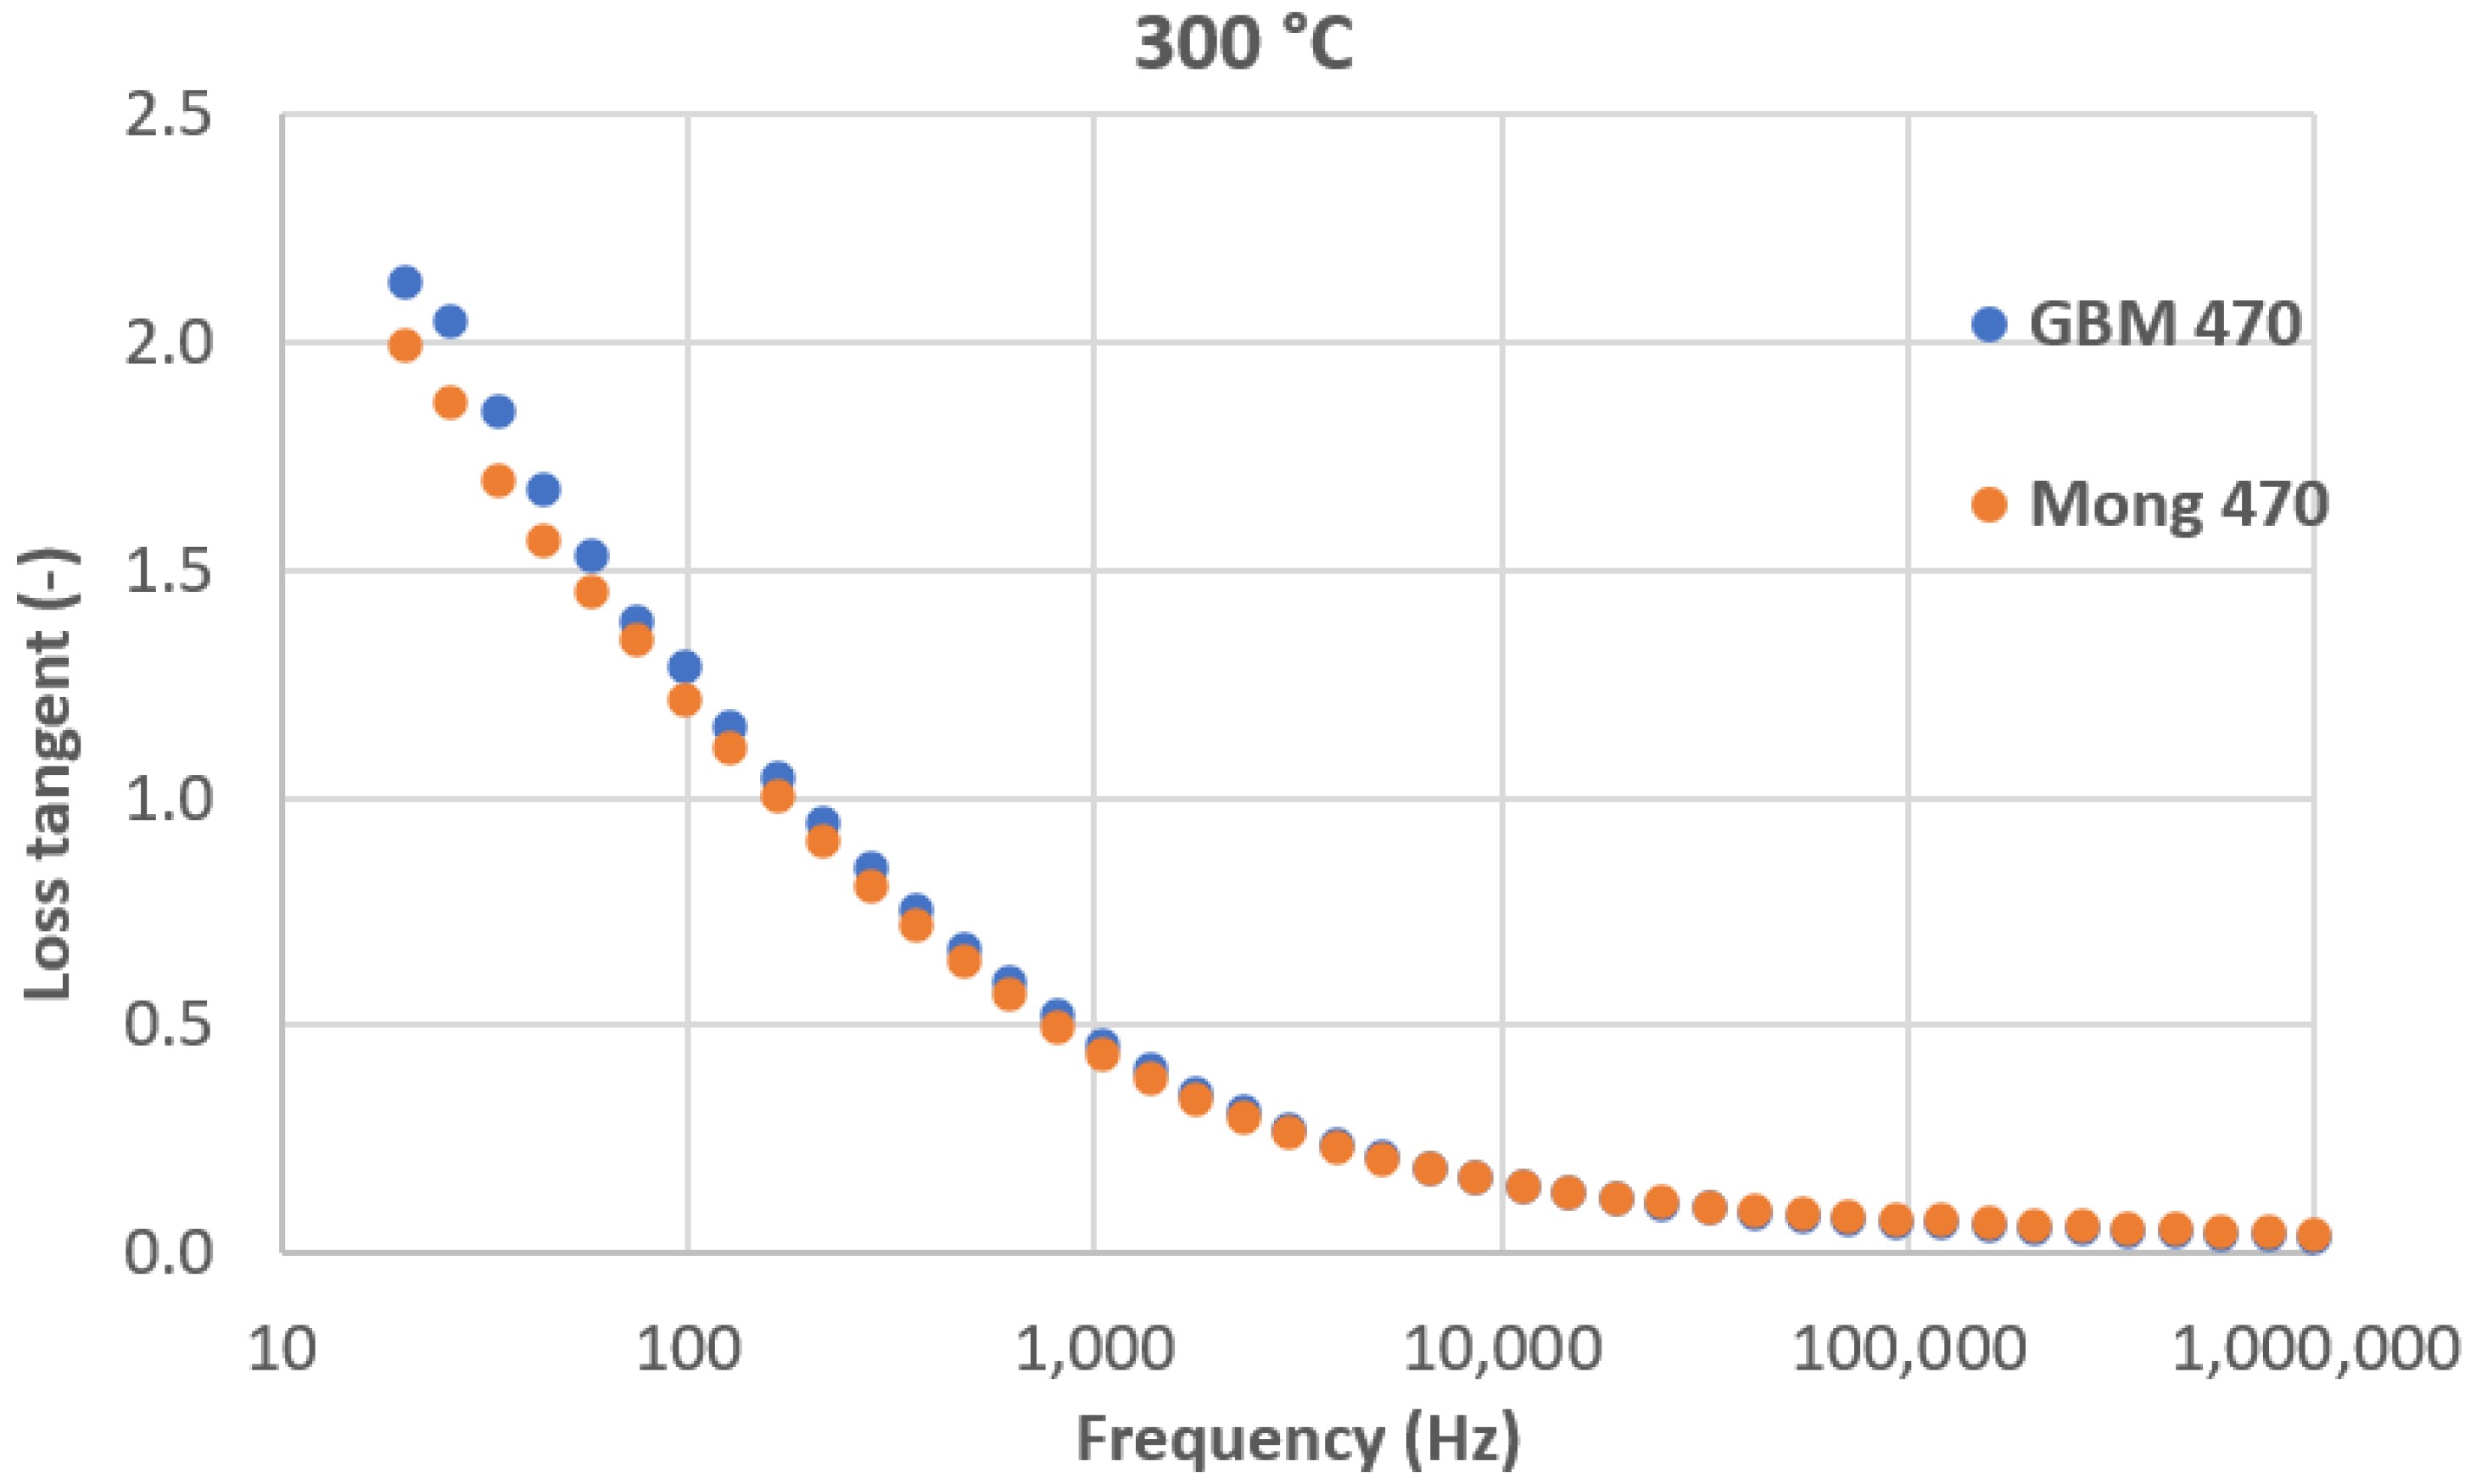
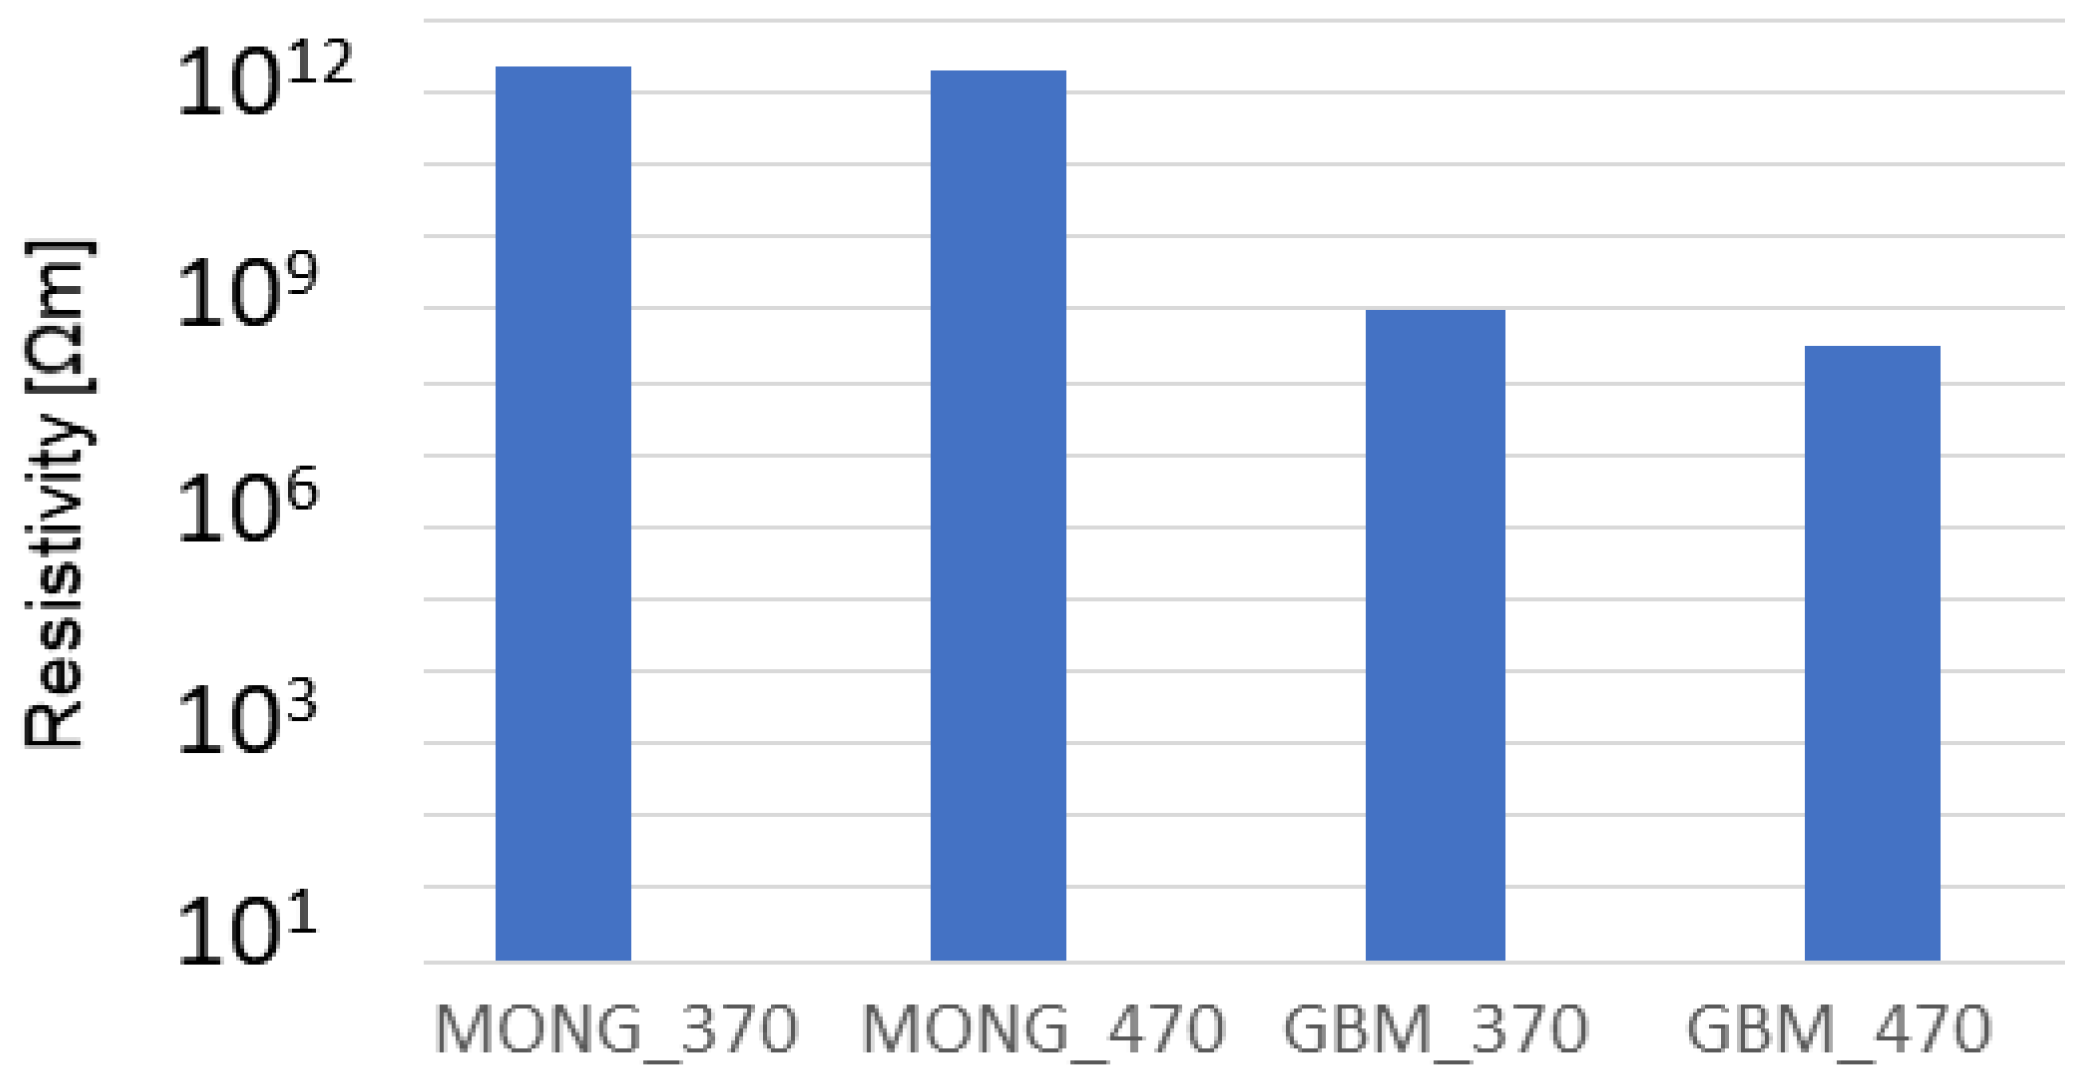
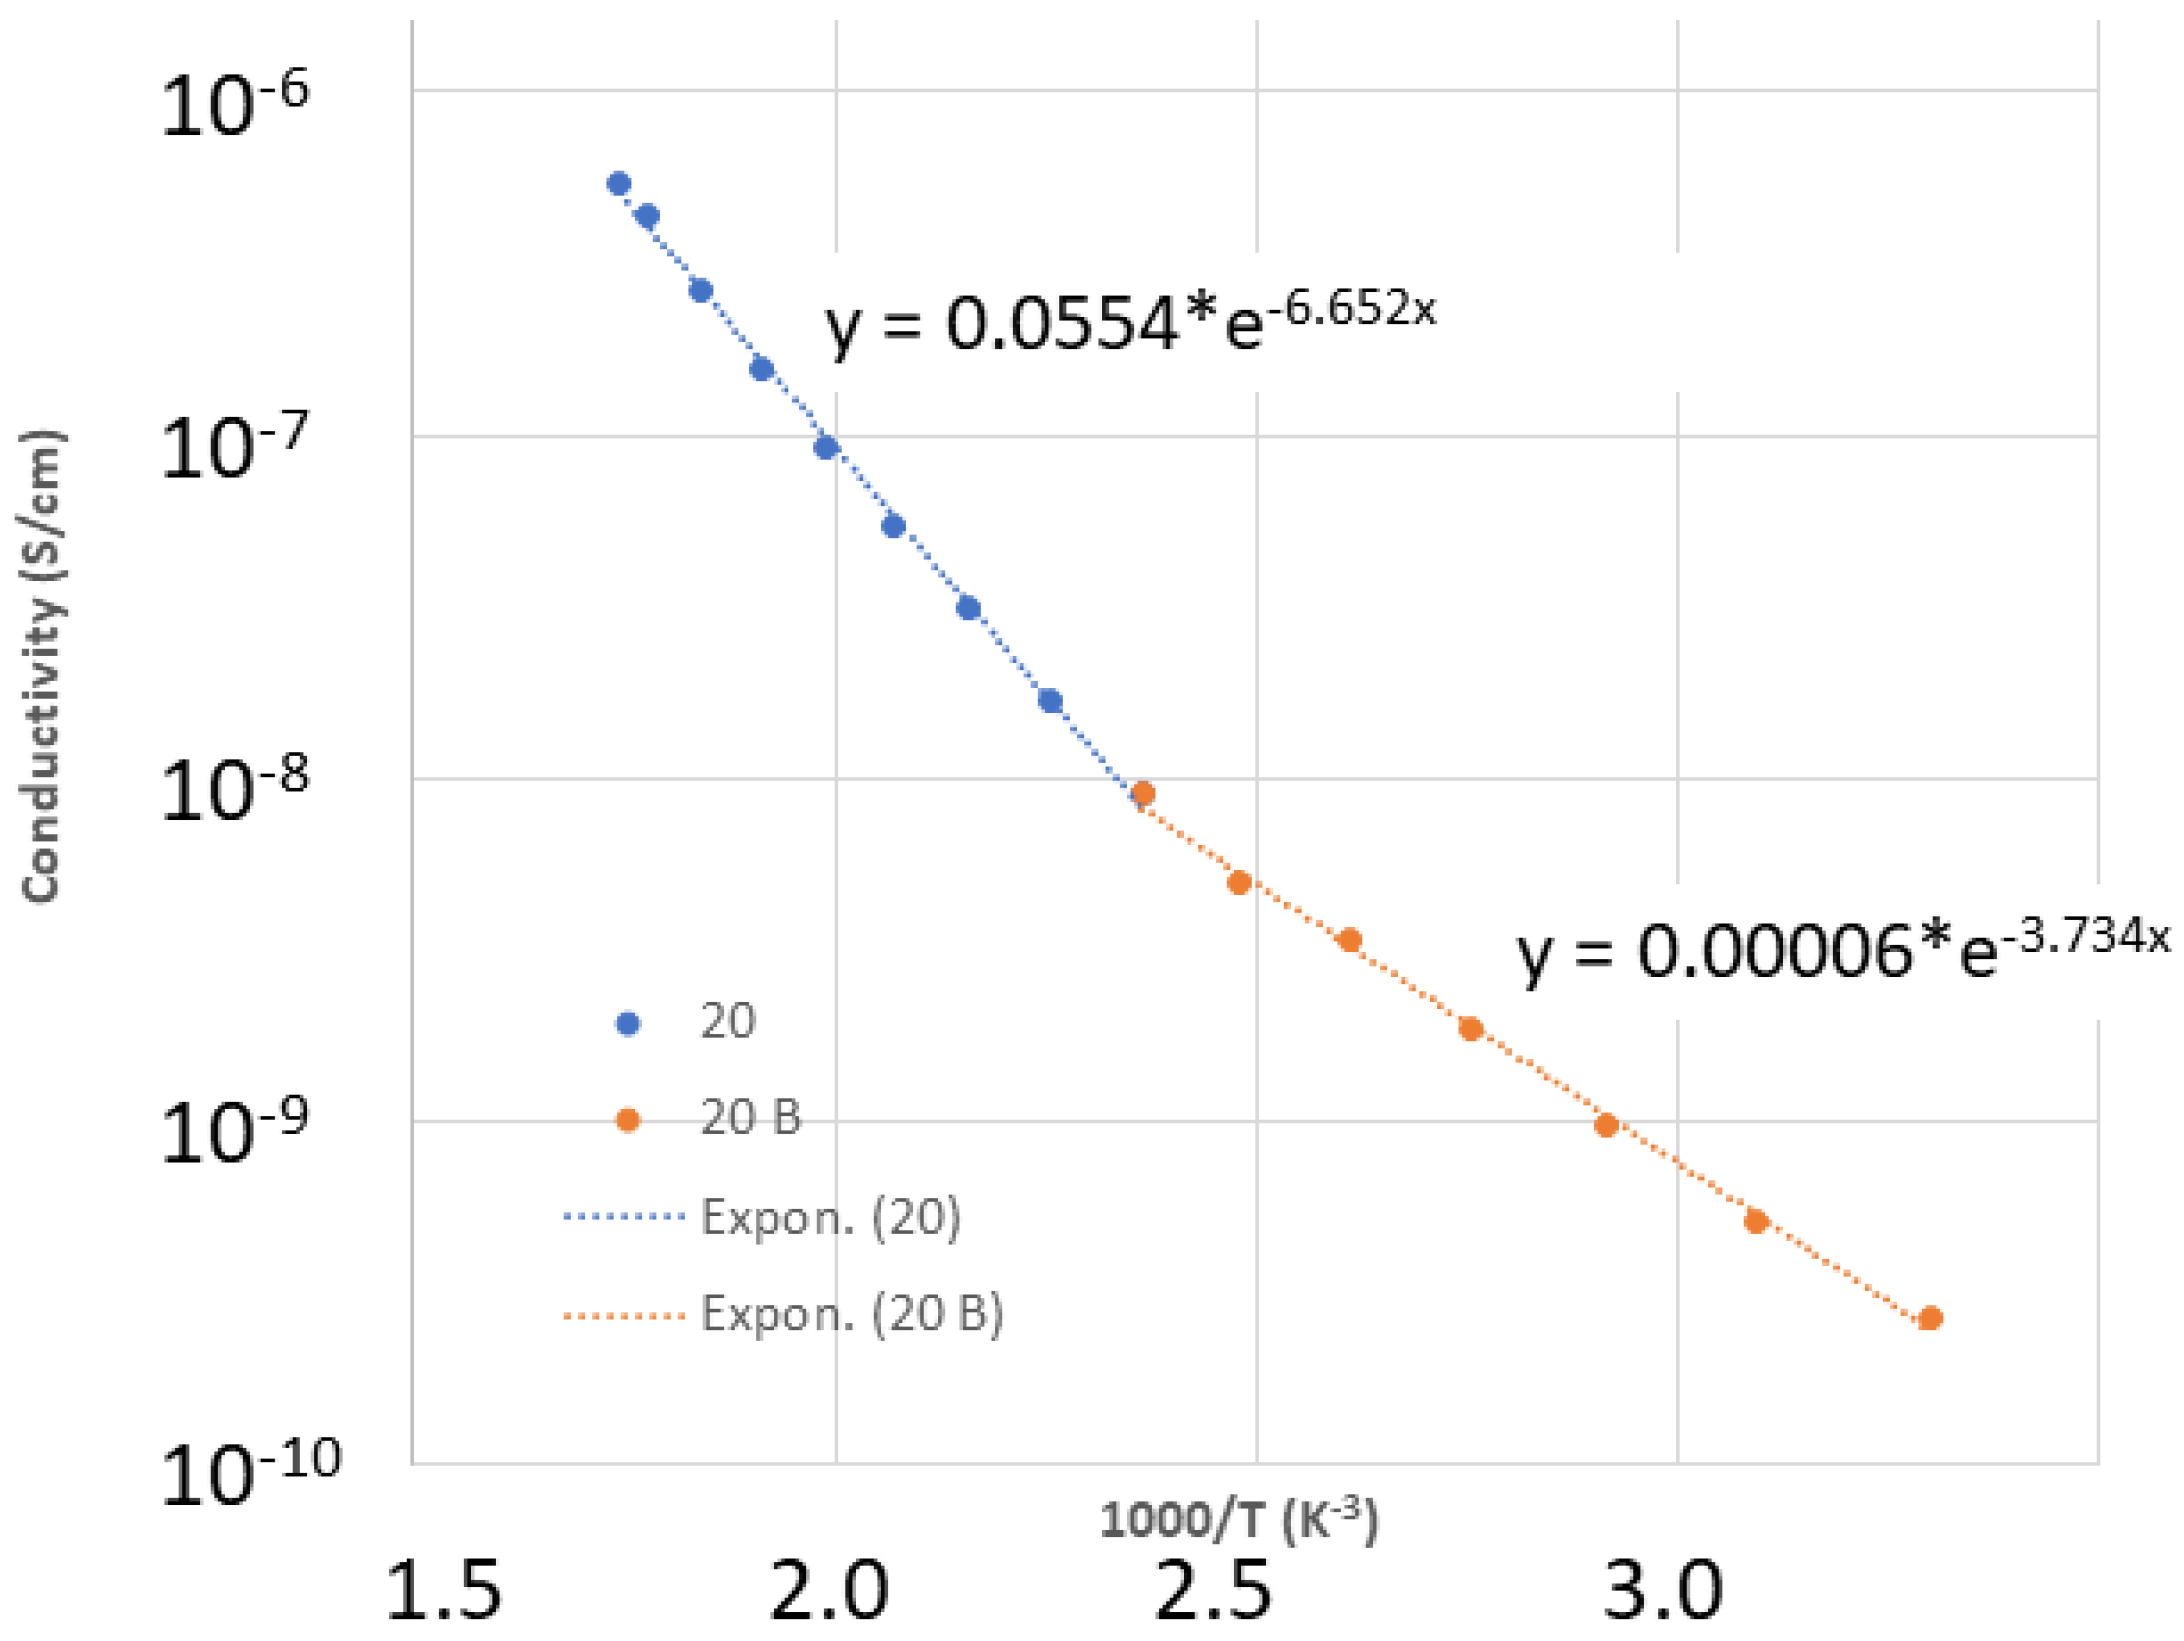
3.2. Dielectric Properties
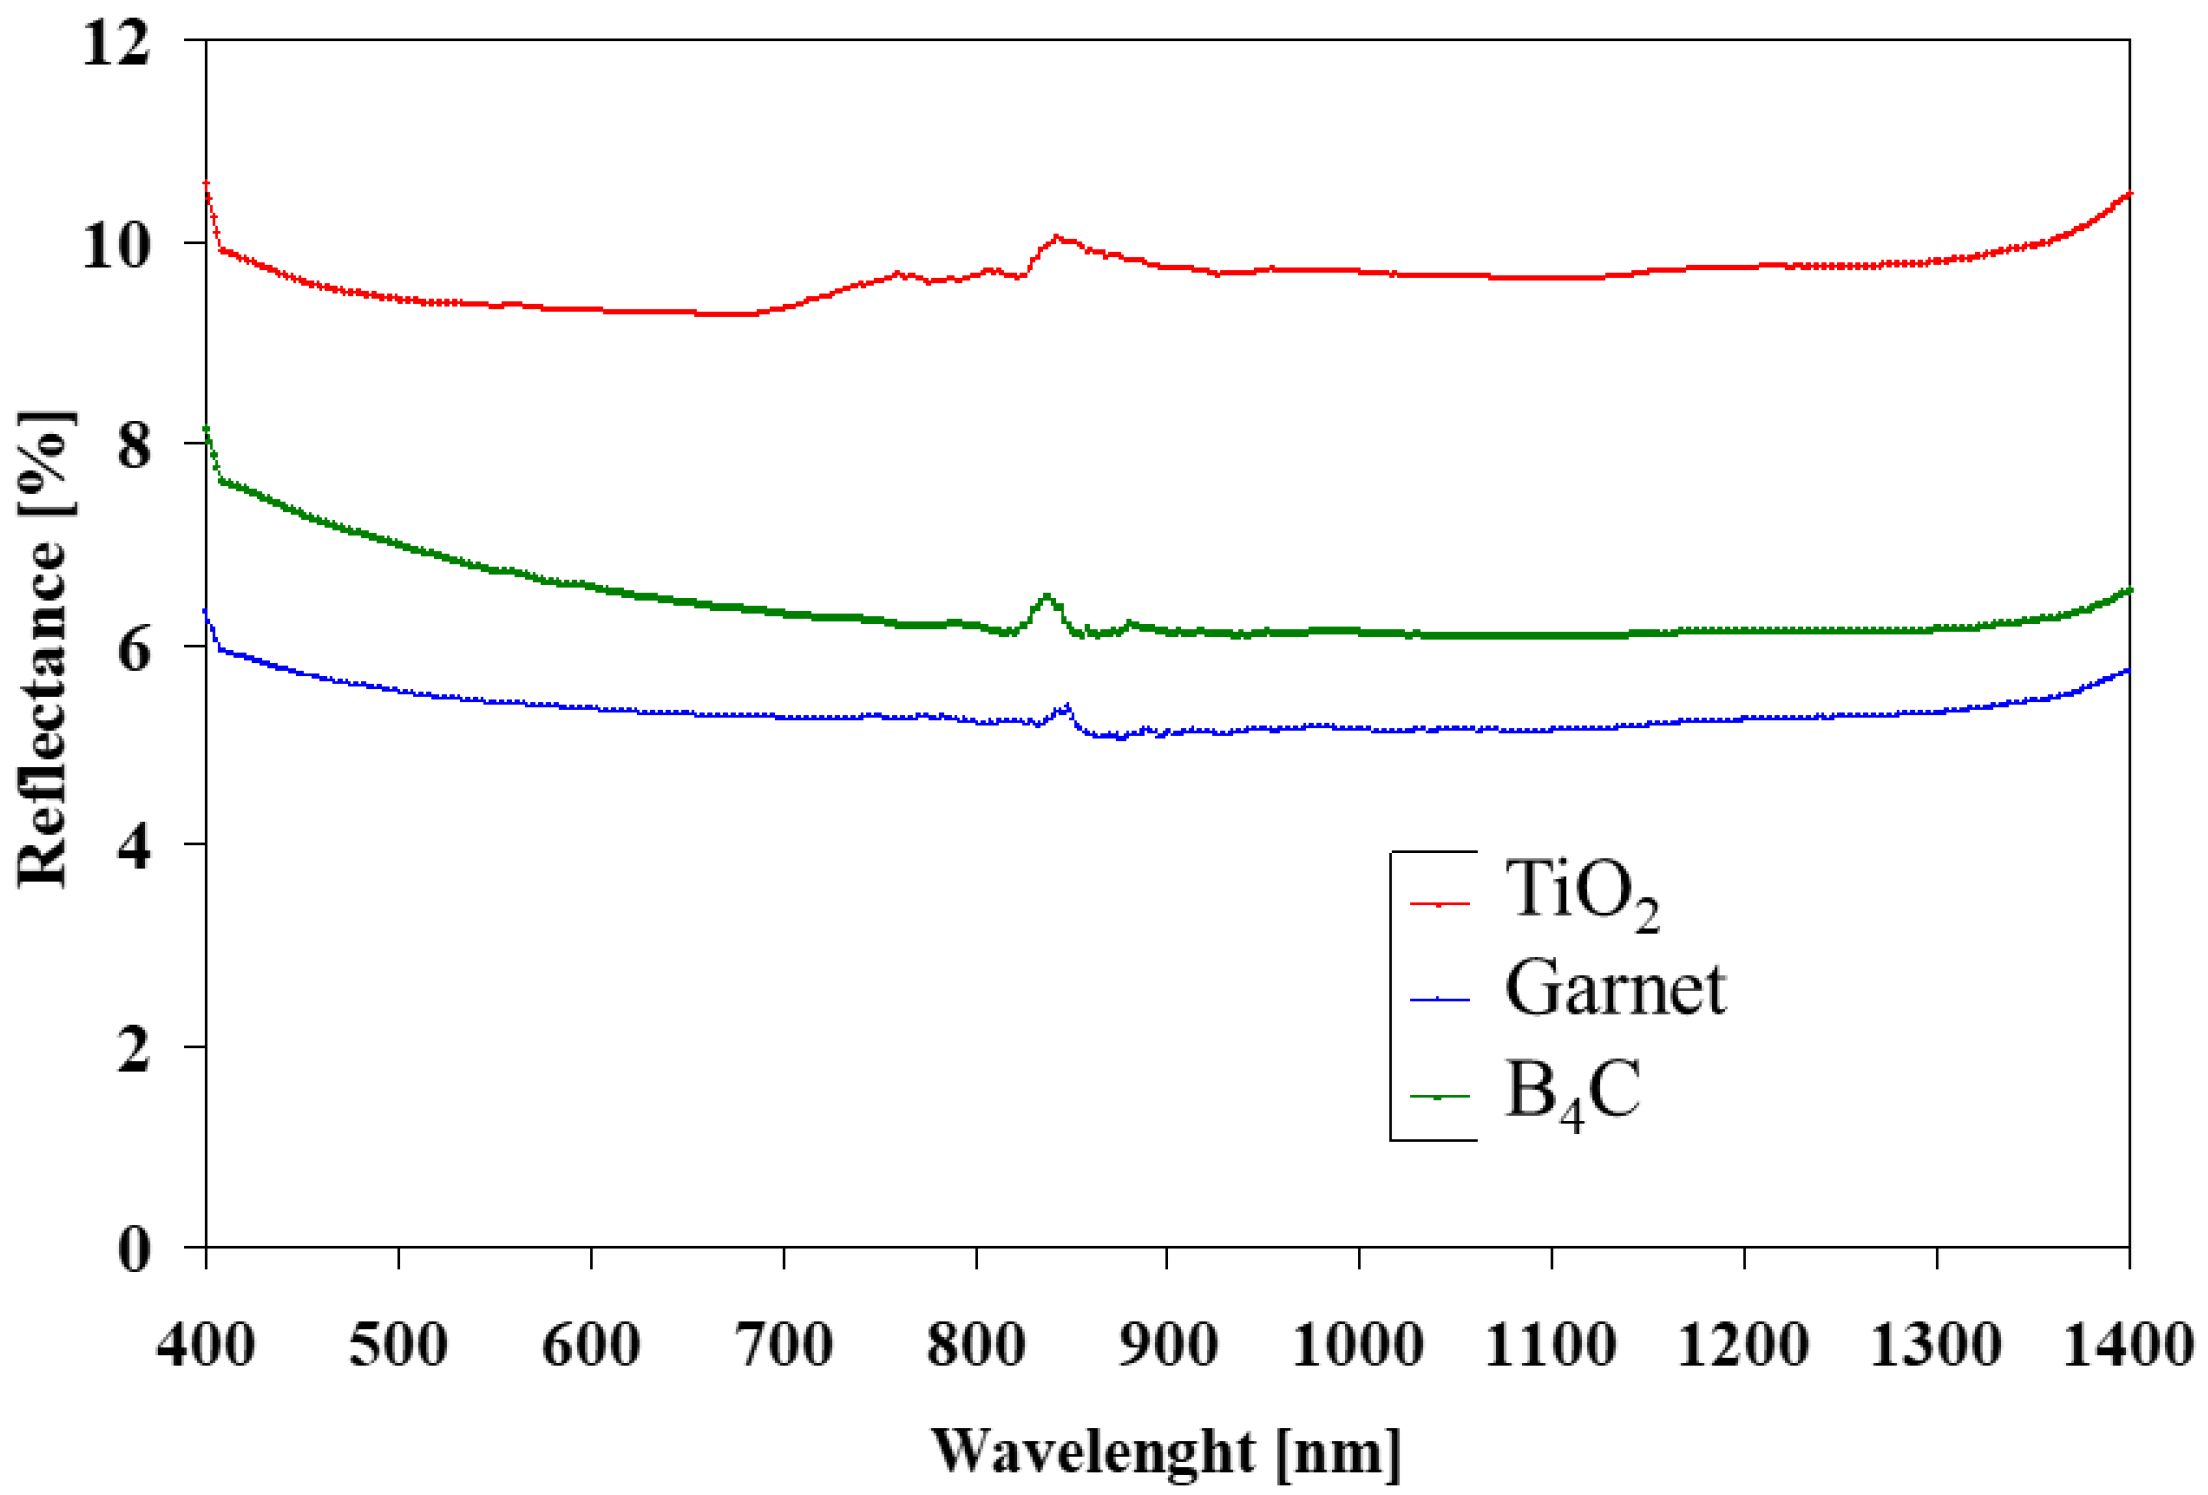
The response of the Mong garnet to the electric field was markedly better than that of the GBM garnet. At room temperature, and at low frequencies, GBM showed high permittivity (Figure 8 and Figure 9) but very high loss tangent (Figure 10 and Figure 11). The frequency characteristics of the Mong garnet coatings were rather flat. Both samples tended to similar values of so-called static permittivity, about 12, but GBM was able to reach it over 0.5 MHz and the Mongolian garnet at markedly lower frequencies.
Similarly, the loss tangent at high frequency was only about 0.05 for both coatings, but the Mong sample was able to reach it easily at low frequencies.
It is believed [8] that amorphous garnet should have much worse dielectric properties than the crystalline. We could confirm this because the coating of Mong was crystalline at the as-sprayed conditions, whereas the GBM coating was not (Table 1). Also, the GBM sample contained a much larger proportion of Fe2O3 (Figure 12), which, strictly viewed, was metallic Fe. Metallic Fe in amorphous matter strongly contributes to conductivity. Concerning the role of spraying distance SD, it had nearly no influence on dielectric properties at room temperature.
When we look on the dielectric behavior of samples at elevated temperature 300 °C (Figure 13 and Figure 14—permittivity and Figure 15 and Figure 16—losses), we see even more pronounced difference between the two coatings, especially because of the colossal values of GBM permittivity at low frequencies. Loss tangent of both coating became higher under 100 kHz frequency, which is in accordance with literature [6]. Concerning the influence of SD, the SD of 370 mm achieved the relaxing character of the GBM coating. The relaxation frequency was at 200 Hz, manifesting itself by a peak on the loss tangent dependence (Figure 15).
The volume DC resistivity, Figure 17, of the Mong garnet coating was markedly higher, whereas the short SD meant higher resistivity than long SD. The combination of stable permittivity and low loss tangent meant the coating of Mong 370 was the best one. The Mong coating showing a crystalline phase, Table 1, i.e., Fe3(Al1.7Fe0.3)(SiO4)3, was of a near-almandine composition (pure almandine is 3FeO·Al2O3·3SiO2).
The garnet mineral almandine-pyrope mixed type (Al70Py29) possessed low dielectric constant (εr), with values ranging from 6 to 8.9 [7]. The microstructure analysis showed that the sample was highly porous. As the porosity of the material increased, the dielectric constant decreased because of the low permittivity of air in pores. The values of dielectric loss tangent were reasonably good, even without optimal densification, exhibiting values of about 0.03 [7].
The AC conductivity dependence depicted in conventional coordinates for the Arrhenius relation is provided in Figure 18. The high temperature branch, further labeled HT, is in the graph under name 20B and drawn in red. Based on such graphs, for all samples we calculated the activation energy, as summarized in Table 2. The activation energy was lower at higher temperature. The point of change in the slope, i.e., change of a predominant activation mechanism, was at about 150 °C.

3.3. Reflectance

The diffused reflectance is displayed in Figure 19 in comparison with other very antireflective materials, B4C and oxygen-depleted (black) TiO2. We see that garnet coating was the most antireflective in the whole studied spectral range, with reflectance only about 6 percent (of the BaSO4 standard). The difference in reflectance between individual garnet samples was rather negligible. Literature describing reflectance (including only partly similar techniques, such as specular reflectance) is very scarce. Concerning the role of iron ions, Fe3+ should result in shorter wavelength sharp bands and broad/weak spectral features in the 0.6 and 0.8 µm regions [9]. Fe ions could also account for a reflectance drop-off toward shorter wavelengths. Fe2+, when present, was responsible for absorption features in the 1.3 and 1.6 µm spectral regions in [9]. The authors of [9] measured powders using calibration different than that of BaSO4 material, and did some software treatment for the background extraction, so the results were hardly comparable with ours. We believe that the peaks around 850 nm were instrumental artifacts of the grit position adjustment. Similar materials, i.e., plasma sprayed basalt [10], also had very flat reflectance characteristics at the observed wavelengths.

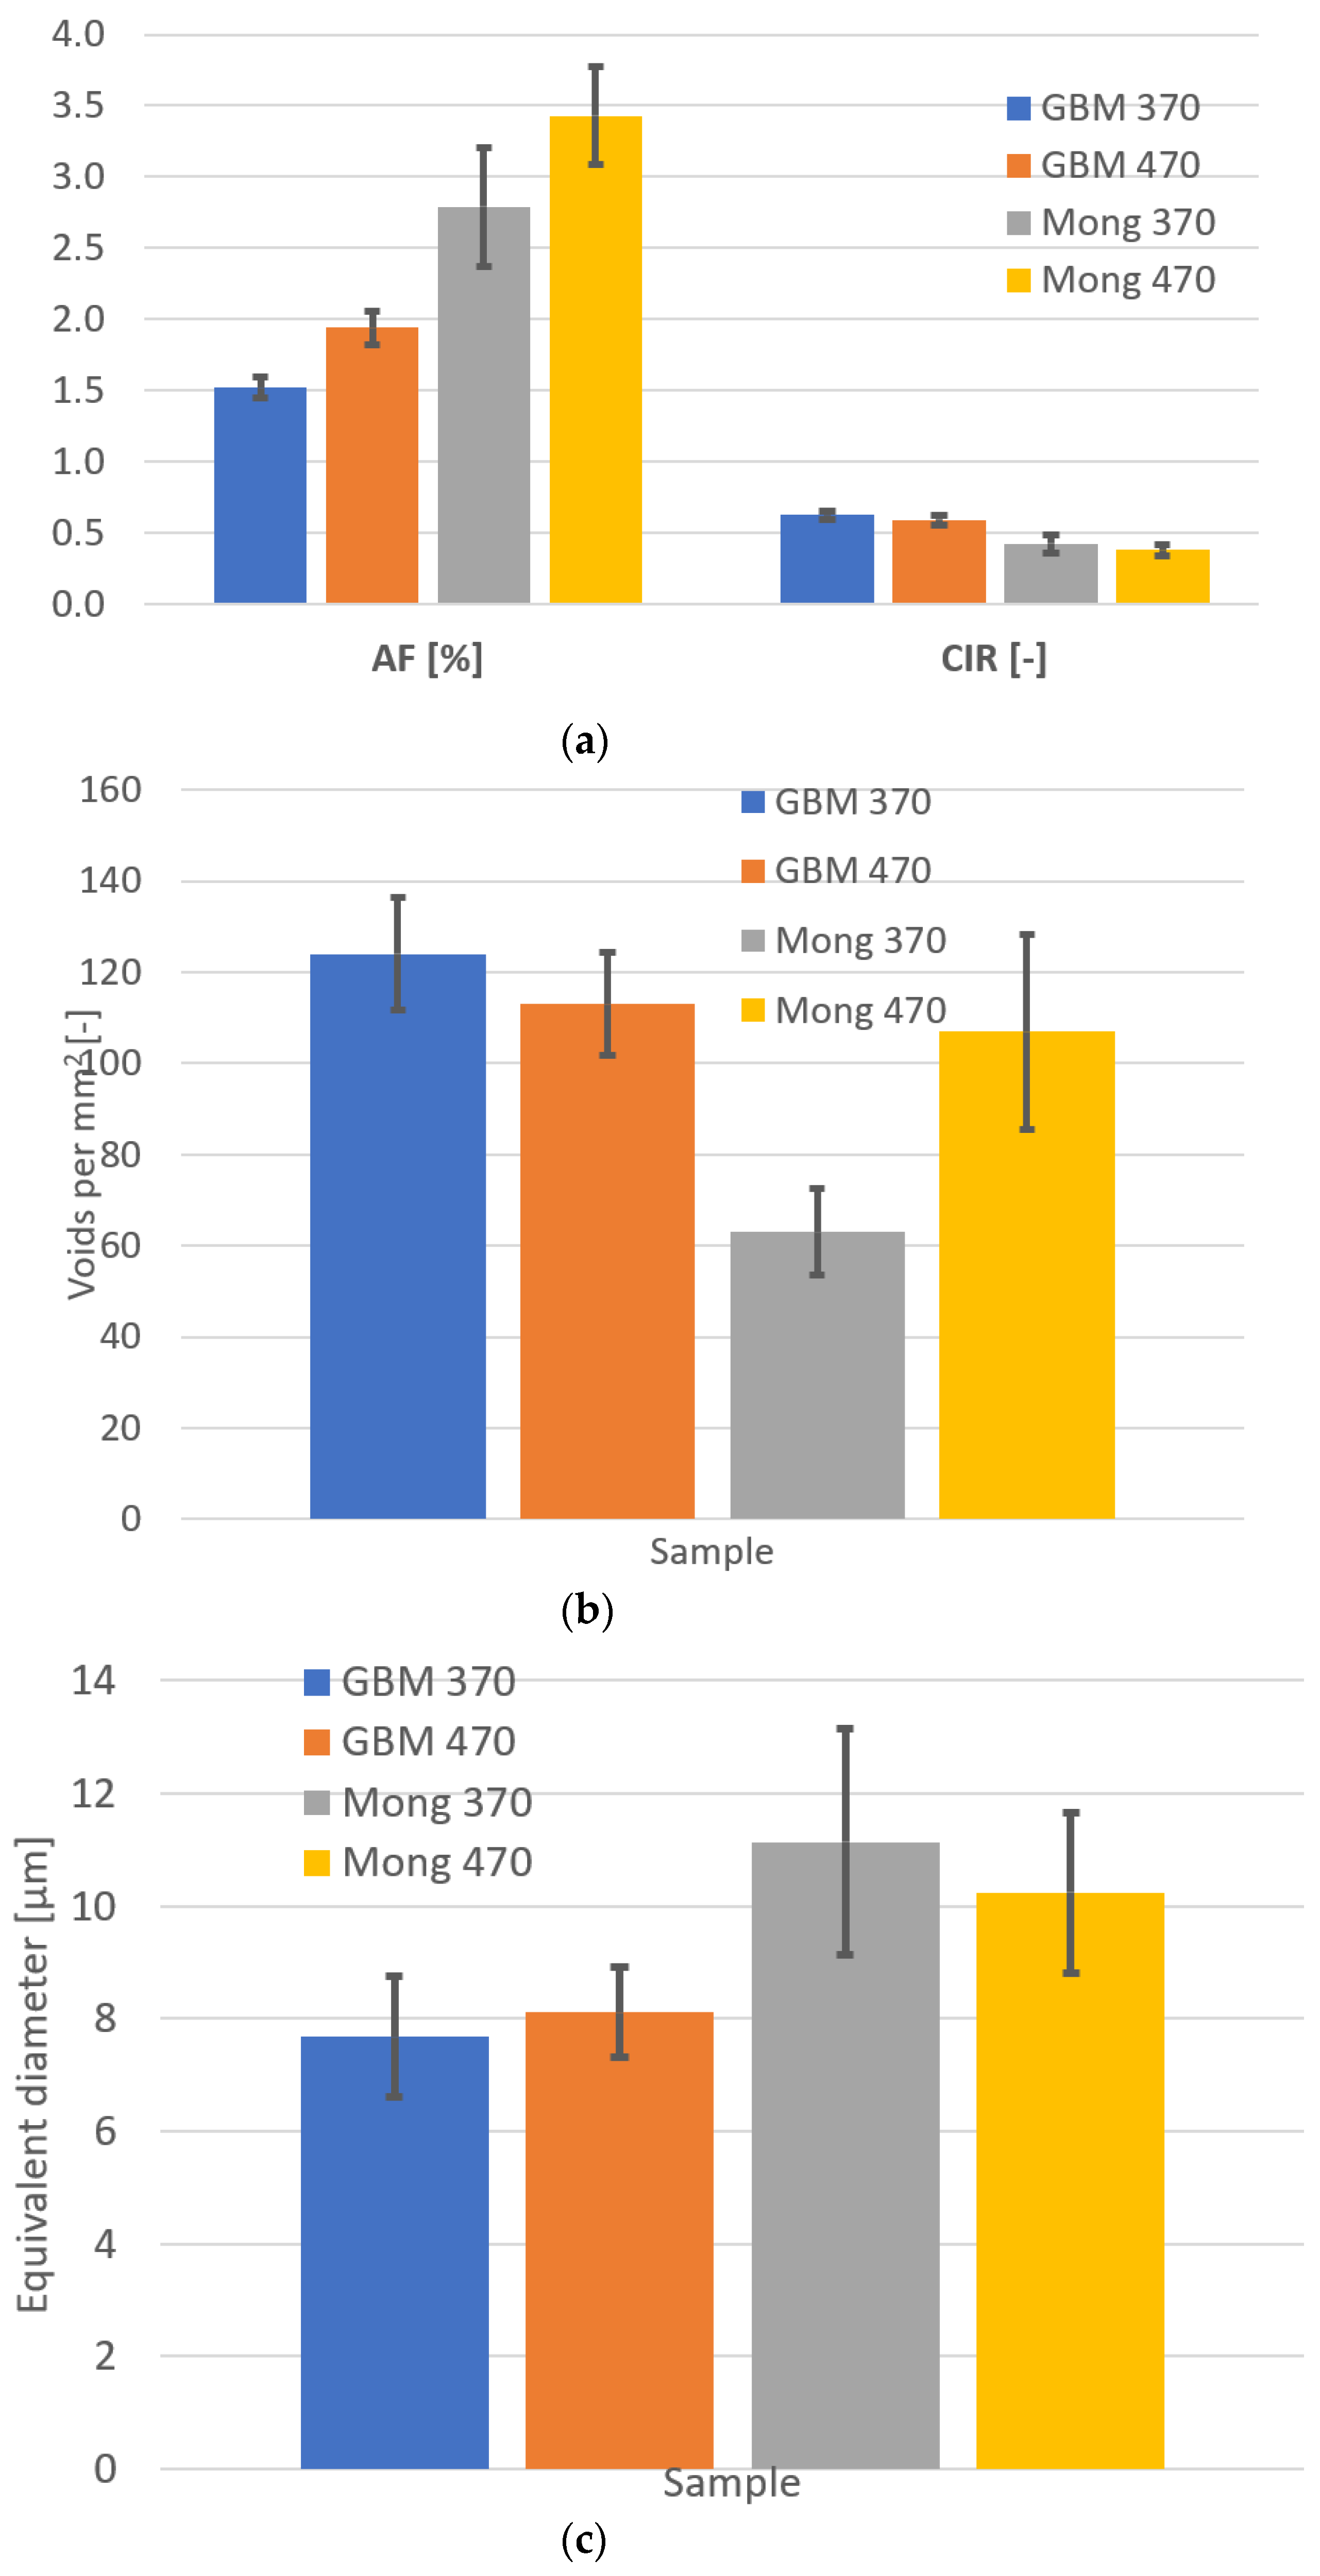
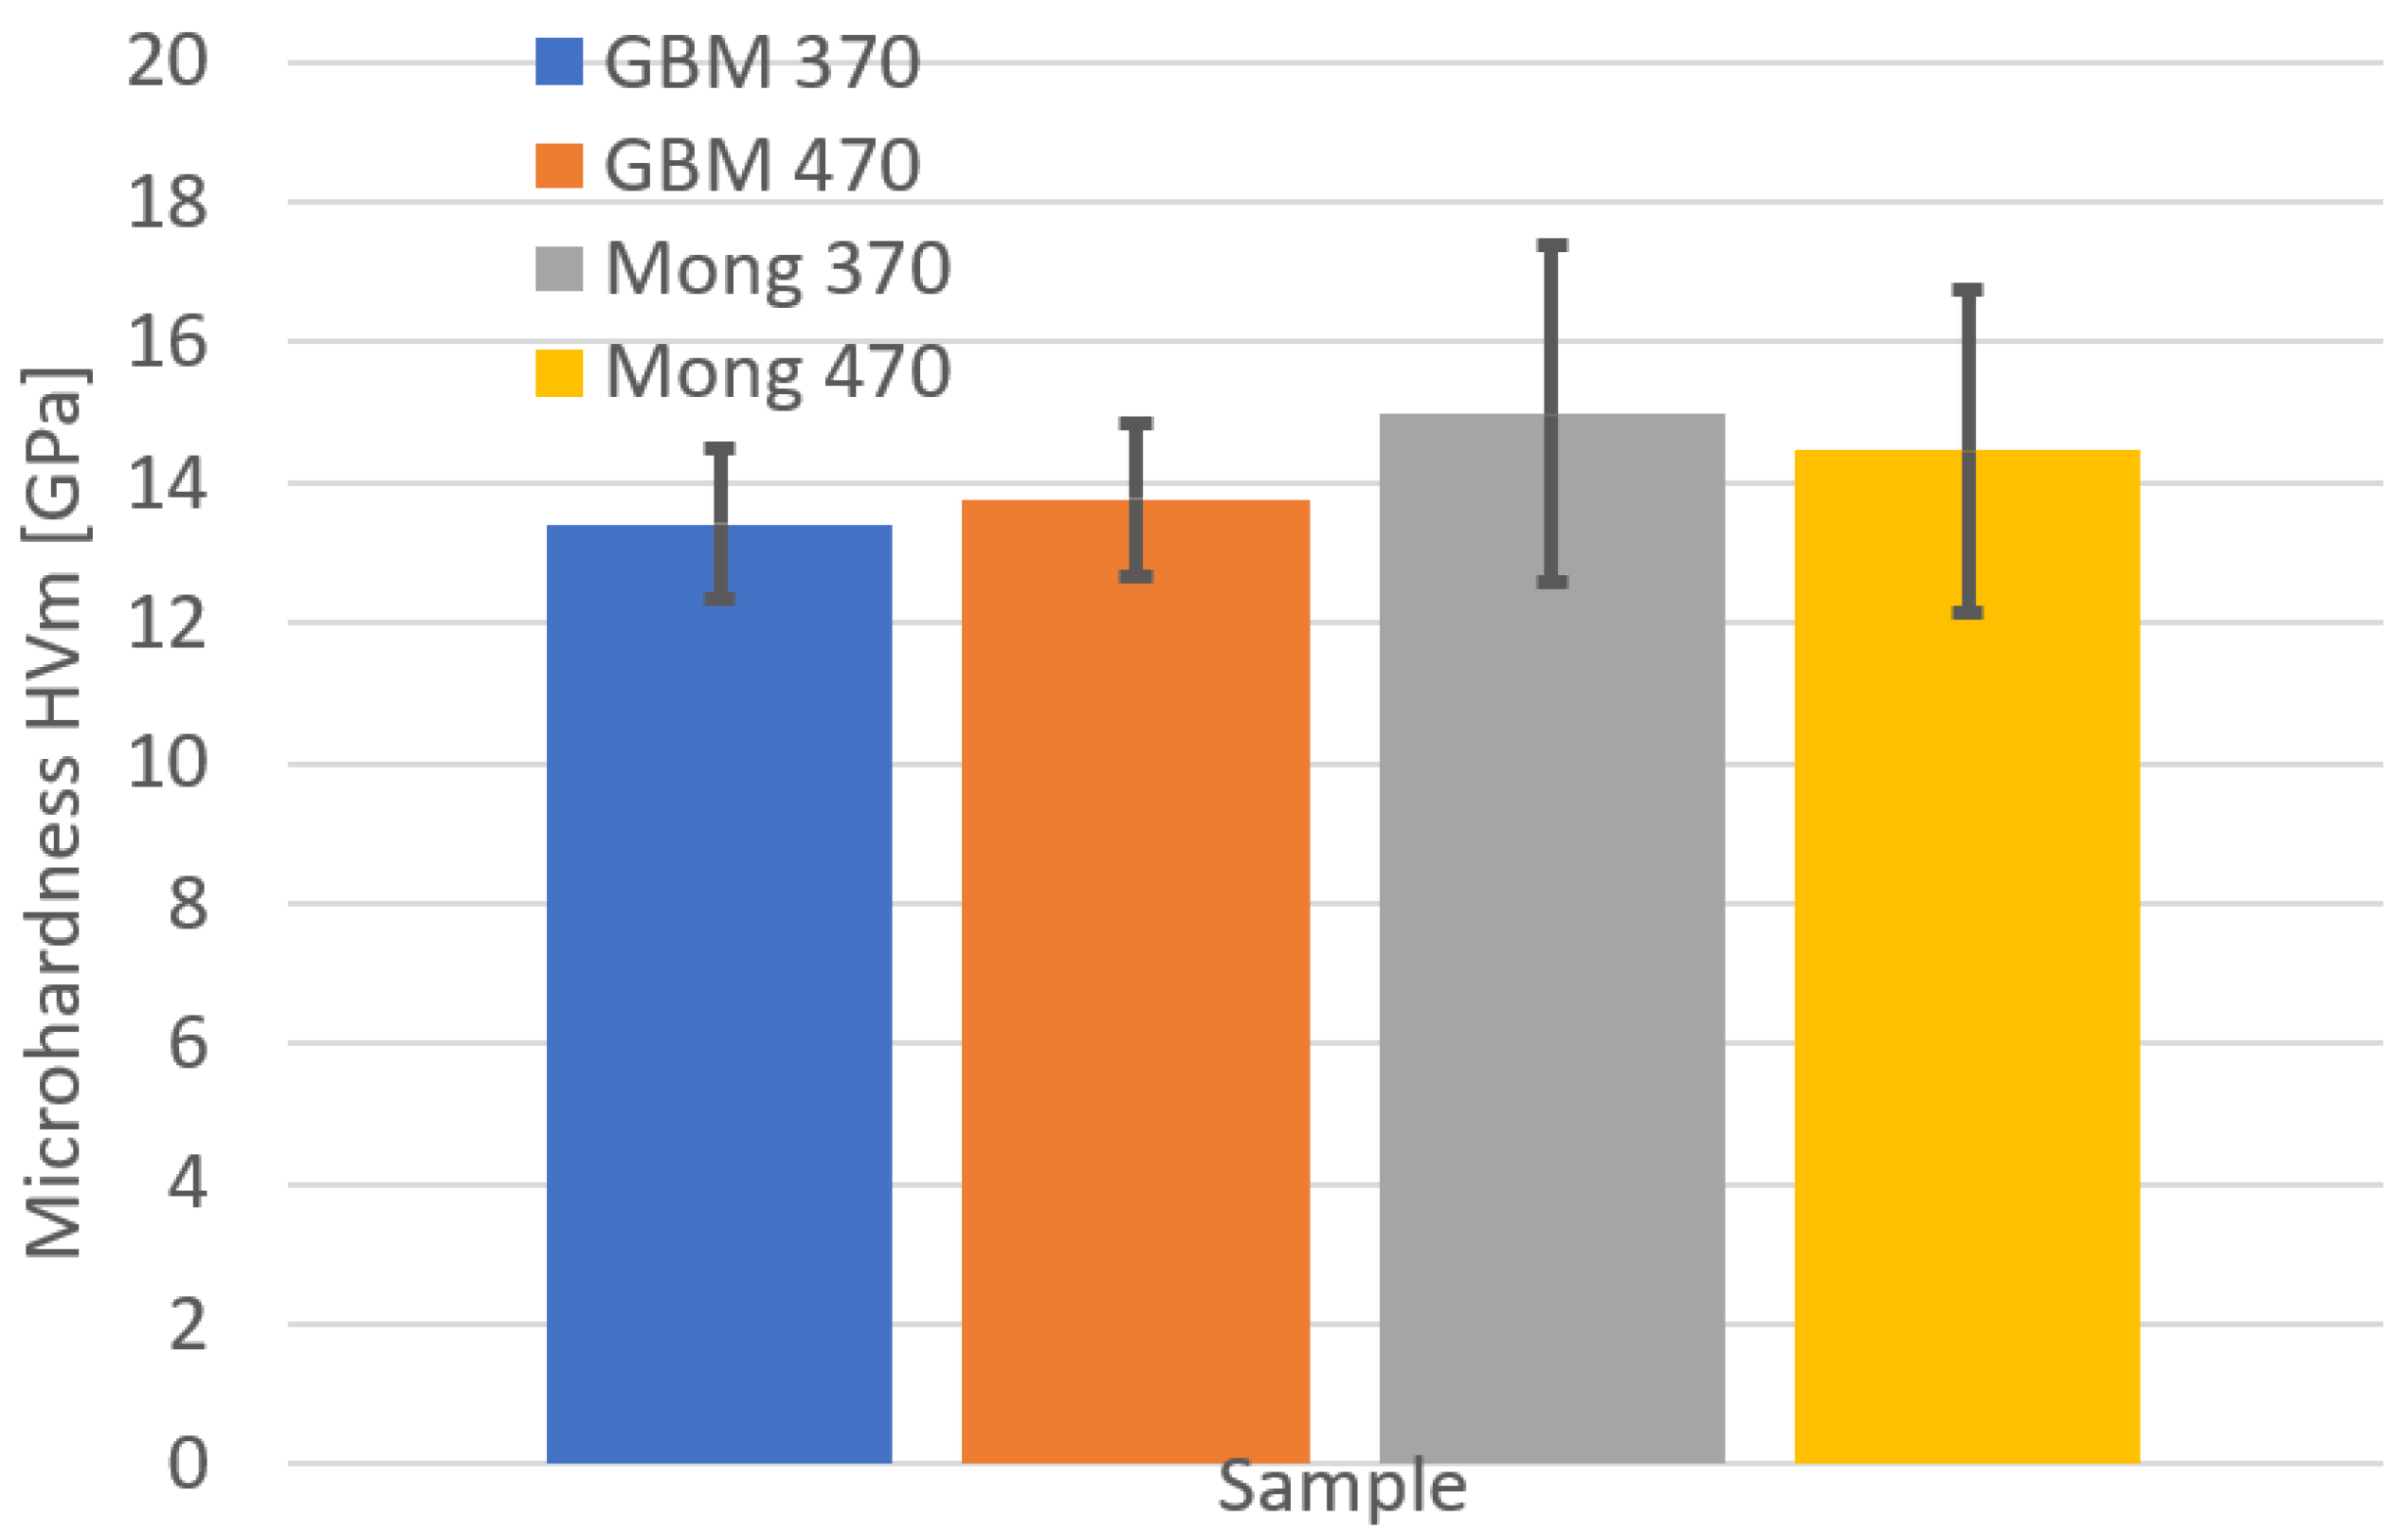
3.4. Mechanical Properties

The slurry abrasion response (SAR) expressed by an Inverse wear rate, i.e., how many meters of the run in a slurry are necessary to worn out 1 cubic millimeter of the tested material, was about 45 m. This was comparable with some other natural mineral-based plasma coatings, such as diopside or basalt [10]. The difference in SAR between individual garnet samples was rather negligible.
Microhardness is shown in Figure 4. The values were higher, but with a higher dispersion, for the Mong samples. This corresponded to their crystallinity (higher hardness) but more chaotic splats and individual component alignment (the higher hardness standard deviation). The influence of SD was not important, any differences were deeply lost in the size of standard deviation.
In summary, the garnet coatings were mechanically rather hard but brittle. Due to the structural imperfections and multiphase character their wear resistance was rather low.

4. Conclusions

The garnet coatings formed by plasma spraying of natural powders exhibited good dielectric properties. The best sample, the Mongolian almandine-based composition, processed using plasma spray distance 370 mm, had relative permittivity 12 and loss tangent 0.02 practically in the whole studied frequency range 20 Hz–1 MHz. In the studied temperature range 30–300 °C this coating was also the best one. The cause was its high DC resistivity, slightly above 1012 Ωm, three orders of magnitude above the resistivity of the Czech garnet GBM coatings. All garnet coatings were extraordinarily antireflective in visible and near-infrared bands. The plasma sprayed garnet coatings could, with their dielectric properties, replace sintered ceramics as a fine-grained porcelain, steatite or cordierite in the electric and power industry. The mechanical demands on the garnet-made components should be carefully monitored, since the material was hard and brittle, sensitive to cracking and possibly chipping.

Author Contributions

Conceptualization, P.C.; methodology, P.C.; writing—original draft preparation, P.C.; writing—review and editing, P.C.; SEM analyses were arranged externally as a barter service; dielectric measurements, L.S. and J.S.; optical and mechanical tests, P.C. All authors have read and agreed to the published version of the manuscript.

Funding

The core research received no external funding. Publication finalization sponsored with FEE CTU.

Institutional Review Board Statement

Not applicable.

Informed Consent Statement

Not applicable.

Data Availability Statement

Not applicable.

Acknowledgments

The author would like to thank P. Veselý (FEE CTU), SEM operator. Also, the XRD operator, Z. Pala (formerly IPP ASCR) is acknowledged.

Conflicts of Interest

The author declares no conflict of interest.

References

  1. Kolman, B.; Neufuss, K.; Ilavský, J.; Dubský, J.; Chráska, P. Chemical Inhomogeneity of Silicates Treated by Plasma Spraying. J. Anal. At. Spectrom. 1999, 14, 471–473. [Google Scholar] [CrossRef]
  2. Shannon, R.D.; Rossman, G.R. Dielectric Constants of Silicate Garnets and the Oxide Additivity Rule. Am. Mineral. 1992, 77, 94–100. [Google Scholar]
  3. Cao, X.Q.; Vassen, R.; Stoever, D. Ceramic Materials for Thermal Barrier Coatings. J. Europ. Ceram. Soc. 2004, 24, 1–10. [Google Scholar] [CrossRef]
  4. Lukeš, P.; Člupek, M.; Babický, V.; Šunka, P. The Role of Surface Chemistry at Ceramic/Electrolyte Interfaces in the Generation of Pulsed Corona Discharges in Water Using Porous Ceramic-coated Rod Electrodes. Plasma Processes Polym. 2009, 6, 719–728. [Google Scholar] [CrossRef]
  5. Aparicio, C.; Filip, J.; Skogby, H.; Marušák, Z.; Mashlan, M.; Zbořil, R. Thermal Behavior of Almandine at Temperatures up to 1200 °C in Hydrogen. Phys. Chem. Miner. 2012, 39, 311–318. [Google Scholar] [CrossRef]
  6. Kumar, K.K.; Balaram, V.; Sirdeshmukh, L. Characterization and Dielectric Properties of Almandine-Pyrope Garnet. Bull. Mater. Sci. 1992, 15, 279–284. [Google Scholar] [CrossRef] [Green Version]
  7. Sibi, N.; Subodh, G. Structural and Microstructural Correlations of Physical Properties in Natural Almandine-Pyrope Solid Solution: Al70Py29. J. Electron. Mater. 2017, 46, 6947–6956. [Google Scholar] [CrossRef] [Green Version]
  8. Sibi, N.; Athira, R.; Subodh, G. Garnet Mineral-based Composites Through Cold Sintering Process: Microstructure and Dielectric Properties. J. Europ. Ceram. Soc. 2020, 40, 371–375. [Google Scholar]
  9. Izawa, M.R.M.; Cloutis, E.A.; Rhind, T.; Mertzman, S.A.; Poitras, J.; Applin, D.M.; Mann, P. Spectral Reflectance (0.35–2.5 μm) Properties of Garnets: Implications for Remote Sensing Detection and Characterization. Icarus 2018, 300, 392–410. [Google Scholar] [CrossRef]
  10. Ctibor, P.; Nevrlá, B.; Neufuss, K.; Petrášek, J.; Sedláček, J. Plasma Spray Coatings of Natural Ores from Structural, Mechanical, Thermal, and Dielectric Viewpoints. Coatings 2020, 10, 3. [Google Scholar] [CrossRef] [Green Version]
Figure 1. WSP plasma spraying. 1—cathode; 2—water in and out for cathode cooling; 3 and 4—water in and out for plasma stabilization; 5—powder feeding tube; 6—water in and out for anode cooling; 7—anode rotation; 8—water vortex; 9—electric arc; 10—coating; 11—substrate; SD—spray distance; FD—feeding distance.
Coatings 12 01017 g001
Figure 2. Light micrographs on cross sections of coatings. The powders for spraying came from different mines in Mongolia (label Mong) and in the Czech Republic (label GBM). The number indicates spray distance in mm.
Coatings 12 01017 g002
Figure 3. (a) Porosity expressed as area fraction AF and circularity of pores CIR. (b) Porosity parameter Voids per mm2. (c) Porosity parameter Equivalent diameter of a pore.
Coatings 12 01017 g003
Figure 4. Microhardness of the coatings.
Coatings 12 01017 g004
Figure 5. Element mapping of the sample GBM470, polished cross section.
Coatings 12 01017 g005
Figure 6. Element mapping of the sample Mong470, polished cross section.
Coatings 12 01017 g006
Figure 7. XRD pattern of garnet coating Mong 370.
Coatings 12 01017 g007
Figure 8. Relative permittivity dependence on frequency at room temperature for coatings sprayed with SD 370.
Coatings 12 01017 g008
Figure 9. Relative permittivity dependence on frequency at room temperature for coatings sprayed with SD 470.
Coatings 12 01017 g009
Figure 10. Loss tangent dependence on frequency at room temperature for coatings sprayed with SD 370.
Coatings 12 01017 g010
Figure 11. Loss tangent dependence on frequency at room temperature for coatings sprayed with SD 470.
Coatings 12 01017 g011
Figure 12. Content of individual simple oxides, recalculated from XRF results.
Coatings 12 01017 g012
Figure 13. Relative permittivity dependence on frequency at 300 °C for coatings sprayed with SD 370.
Coatings 12 01017 g013
Figure 14. Relative permittivity dependence on frequency at 300 °C for coatings sprayed with SD 470.
Coatings 12 01017 g014
Figure 15. Loss tangent dependence on frequency at 300 °C for coatings sprayed with SD 370.
Coatings 12 01017 g015
Figure 16. Loss tangent dependence on frequency at 300 °C for coatings sprayed with SD 470.
Coatings 12 01017 g016
Figure 17. DC volume resistivity of the samples.
Coatings 12 01017 g017
Figure 18. AC conductivity on temperature for the sample GBM 370 at frequency 20 Hz.
Coatings 12 01017 g018
Figure 19. Optical reflectance of the plasma sprayed garnet.
Coatings 12 01017 g019
Table 1. Phase composition based on XRD.
CoatingPhase Composition
Garnet GBM, feedstock Almandine, quartz SiO2
Garnet GBM, SD 370amorphous
Garnet GBM, SD 470amorphous
Garnet Mong, SD 470crystalline: garnet Fe3(Al1.7Fe0.3)·(SiO4)3 (PDF 01-081-0540)
i.e., Fe3.3Al1.7Si3O12—Fe-rich almandine
Garnet Mong, feedstockSiO2, albite K0.2Na0.8AlSi3O8 (PDF 01-083-2215),
minor phases:
cordierite Mg2Al3(AlSi5)O18
(PDF 01-076-6039)
muscovite K0.8Na0.2Fe0.05Al2.95Si3.1O10(OH)2
(PDF04-012-1905)
Table 2. Activation energy.
CoatingEa [eV]Ea HT [eV]
Garnet Mong, SD 3700.02000.0010
Garnet Mong, SD 4700.00540.0056
Garnet GBM, SD 3700.06000.0008
Garnet GBM, SD 470n.a *0.0012
* Non-linear trend (the fit imprecise), too dispersed values.
Publisher’s Note: MDPI stays neutral with regard to jurisdictional claims in published maps and institutional affiliations.

