Article

The Correlation of Plasma Characteristics to the Deposition Rate of Plasma Polymerized Methyl Methacrylate Thin Films in an Inductively Coupled Plasma System

1
Materials Science and Engineering Program, University of California, Riverside, CA 92521, USA
2
Faculty of Mathematics and Physics, Charles University, 180 00 Prague, Czech Republic
3
Department of Physical Electronics, Faculty of Science, Masaryk University, 601 77 Brno, Czech Republic
4
Center for Plasma and Thin Film Technologies, Ming Chi University of Technology, New Taipei City 24301, Taiwan
5
Metals Research and Development Center, National Chung Hsing University, Taichung 402, Taiwan
6
Department of Biomedical Engineering, National Yang Ming Chiao Tung University, Taipei 300093, Taiwan
7
Department of Chemical and Materials Engineering, Center for Green Technology, Chang Gung University, Taoyuan City 33302, Taiwan
*
Authors to whom correspondence should be addressed.
Coatings 2022, 12(7), 1014; https://doi.org/10.3390/coatings12071014
Submission received: 27 June 2022 / Revised: 15 July 2022 / Accepted: 15 July 2022 / Published: 18 July 2022
(This article belongs to the Section Plasma Coatings, Surfaces & Interfaces)

Abstract

:
A plasma system attached with one internal coil (for generating inductively coupled plasma) and two sputtering carbon targets was set up to deposit PP-MMA (plasma polymerized methyl methacrylate) thin films. PP-MMA was used as a model material in the present study. In the experiment, the working pressure and Ar/MMA flow ratio were varied, which resulted in the change in plasma conditions as well as the deposition rates. The optical emission spectroscopy (OES) method was applied to identify the presence of the excited species related to the fragmented monomer. In addition, the electron temperature and electron density were determined using the modified Boltzmann plot and line-ratio method, according to the measured OES spectra. The deposition rate of the PMMA film was then correlated with the determined plasma characteristics. To determine the vibrational modes of the deposited PP-MMA films, Fourier transformed infrared spectrometry (FTIR) was used. The highest deposition rate of PP-MMA could be obtained with the optimized working pressure and Ar/MMA volume ratio. This could be related to the plasma characteristics that contribute to the fragmentation of the monomer in the plasma.

1. Introduction

Poly-methyl methacrylate (PMMA) is a transparent and chemically stable thermoplastic material. PMMA products can be easily made with a low production cost. Furthermore, plasma polymerized MMA (PP-MMA) films, free of pinholes, can be made and used in many applications. It is reported that these films can be used for encapsulations, biosensing, and as a part of electronic devices [1]. In biomedical applications, PP-MMA thin films can be applied in the fabrication of artificial corneas, micro-patterning for culturing cells, stents for growing tissues, etc. [1,2]. Among the various fabrication processes of PMMA including gelation and evaporation, plasma polymerization is the one that is capable of rapidly depositing uniform nano to milli-scale films on all kinds of substrates with a wide range of geometry [3]. Plasma polymerization [4] is a process for the synthesis of polymeric films that is carried out under low-temperature plasma, normally in a low-pressure regime (vacuum). In the presence of glow discharge, the monomer is fragmented, leading to many chemically reactive species. In this process, the fragmented monomers can be directly attached to the desired substrate surface, and then form complicated polymeric structures. The deposited PP-MMA thin films are known to be highly cross-linked, which derives directly from the fragments of the monomers due to collisions in the plasma. Such a highly cross-linked polymer has several physical and chemical advantages, which include high mechanical stiffness, low porosities, a smooth surface, high stability, good transparency, and even good electrical behaviors [5,6].
On the other hand, radio frequency (RF) ICP (inductively coupled plasma) has been widely studied for over 100 years. The fundamental concept for generating an ICP is based on Faraday’s law. In this plasma process, the RF current flows into an antenna coil and, subsequently, induces a time-varying magnetic field, and this magnetic field can produce an induction field that generates and then sustains the plasma. The ICP source may generate plasma at a very low pressure (~1 mTorr) and with high plasma density (1011~1012 cm−3). Moreover, owing to the flexibility of the antenna structure, the ICP source can be applied in various processes including PVD and CVD deposition, semiconductor etching, and surface treatment in lots of forms [7,8,9]. The advantages of the ICP process are attributable to it being electrodeless in nature as well as its low-pressure and high ionization characteristics. Due to these, the plasma contains a relatively small impurity content. In addition, in an ICP process, the energy of the ions arriving at a substrate may not be related to plasma density. With these good characteristics, however, there are only a few reports so far on plasma polymerization using an ICP source.
In this study, a hybrid system combining inductively coupled plasma and RF sputtering was set up to deposit PP-MMA thin films. The antenna coil was used to generate and sustain plasma density while not providing too much ion bombardment initiated from the plasma. PP-MMA was used as a model material to test this hybrid system for its ubiquity in plasma polymerization. In the experiment, working pressure and Ar/MMA flow ratios (volume ratios) were varied to obtain various plasma and deposition conditions. Optical emission spectroscopy (OES) was applied to examine the fragmentation during the deposition of PMMA films. OES was also used to obtain the electron density, ne, (plasma density) and electron temperature, Te, (electron kinetic energy). The approaches of the modified Boltzmann plot for calculating Te, and the line-ratio method for calculating ne, were adopted by utilizing the data extracted from OES spectra.
After the deposition process was finished, the PP-MMA thin films were characterized using attenuated total reflection Fourier transform infrared (ATR-FTIR) spectroscopy for the chemical bonding status. A surface profiler was used to check film thickness and, subsequently, the deposition rate.

2. Materials and Methods

2.1. Substrate, MMA Preparation

Corning 1737 glass plate was cut into 2 cm × 1 cm pieces and used as the substrates. These substrates were treated in KOH solution then immersed in de-ionized (DI) water and blown dry. The substrate was then cleaned by alcohol, acetone, and DI water in an ultrasound cleaner for 20 min, then blown dry again with nitrogen. For plasma polymerization using this hybrid ICP system, methyl methacrylate monomer (MMA, CH2 = C(CH3)COOCH3, purity 99.9%, M55909-500 ML, Aldrich, Burlington, MA, USA) was selected, which was in liquid form and ready to be used.

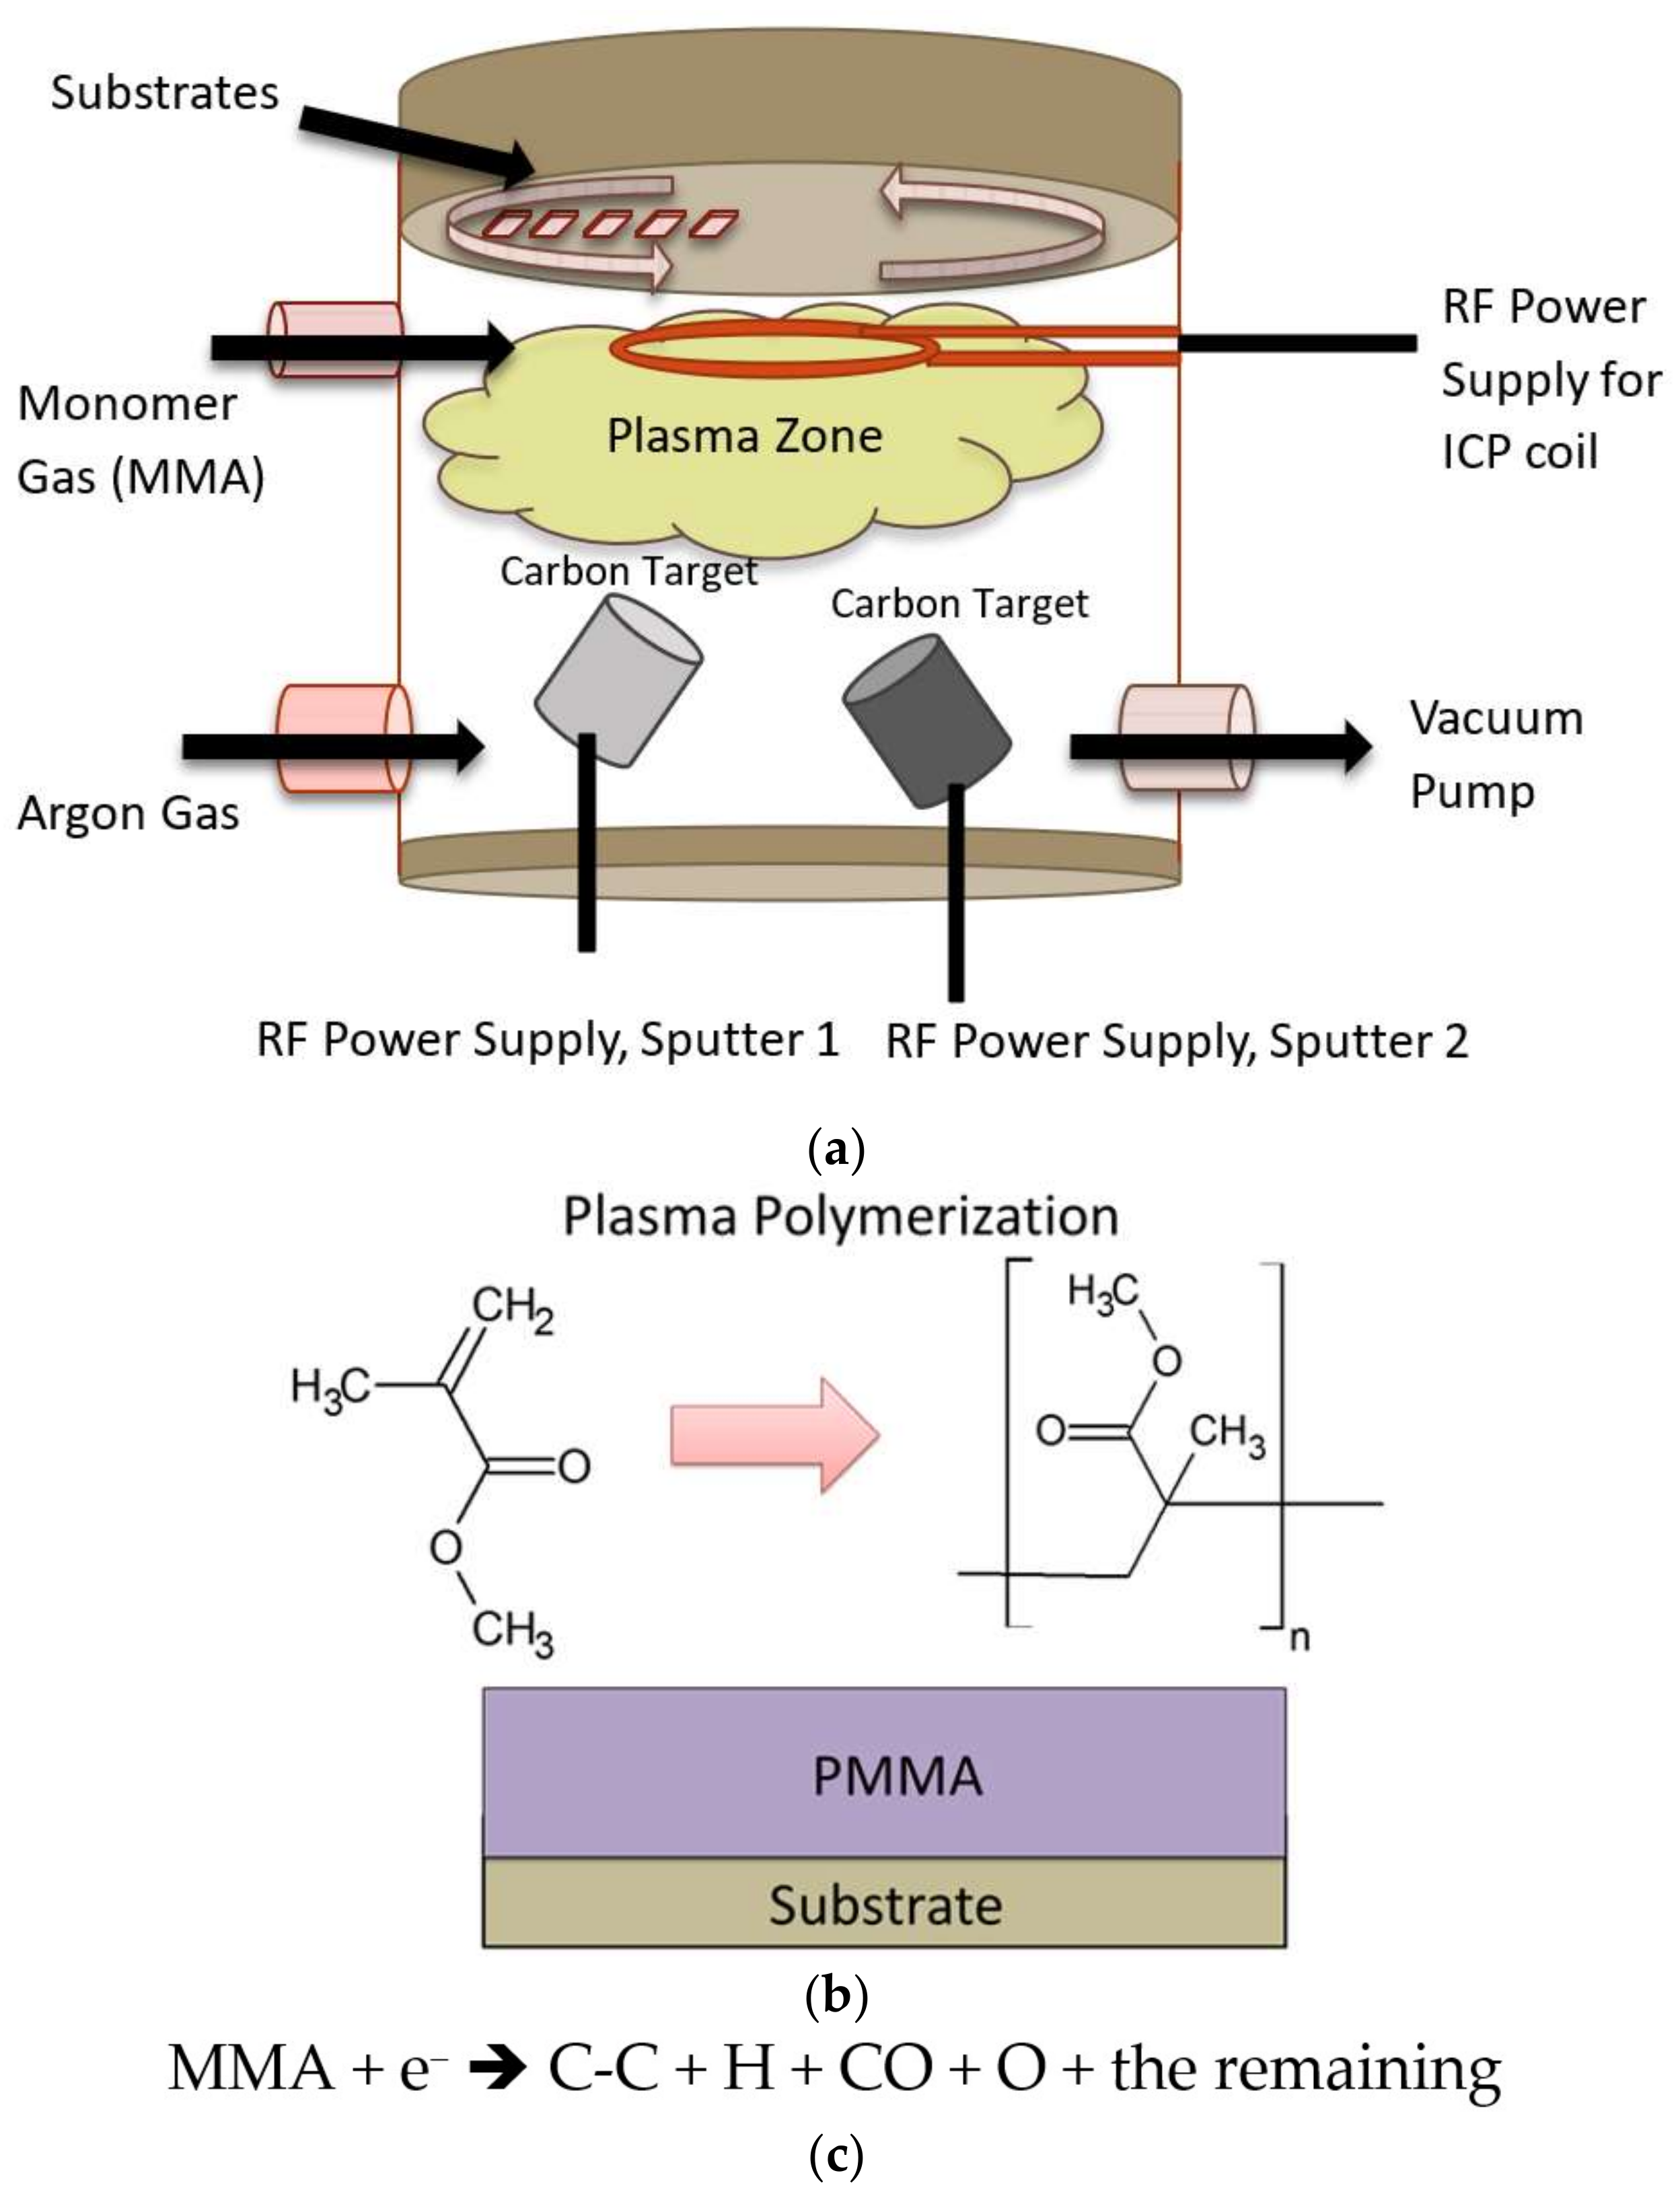
2.2. Plasma Reactor and Plasma Polymerization

The ICP sputtering chamber set up in this study as well as the description of the plasma polymerization process are shown in Figure 1a. In the chamber, an ICP coil was used to generate and sustain plasma with an RF power supply. The diameter of the coil was 200 mm. In addition, two sputtering guns were installed 30 cm below the coil. Carbon targets were attached to the guns and were aimed to enhance the plasma density without sputtering extra carbon atoms. This was carried out by applying only 15 W RF power to the guns. In the polymerization process, the chamber was pumped down to 7 × 10⁻⁴ Pa. Argon gas was set to fill the chamber up to 2.6 Pa, and the ICP RF power source (13.56 MHz) was turned on, together with carbon targets, for 10 min. This step was aimed at cleaning the substrates and the chamber. Subsequently, the power and argon gas flow were terminated and the chamber was pumped down again. Figure 1b shows the simplified process for plasma film deposition. Figure 1c illustrates the possible bond breakages during the plasma process. The breakages are assumed to be due to the collision with energetic electrons.
For deposition, argon was first introduced to the chamber according to deposition parameters listed in Table 1. In the process, the ICP coil power was selected not to cause overheating of the copper coil even it was water cooled. However, reaching the highest plasma intensity was the intention. The carbon target power was selected not to cause sputtering, while the plasma density could be enhanced. During the deposition process, at first, the desired argon pressure was reached; then, a valve connected to an air-tight flask containing MMA monomer was opened. The MMA monomer flowing into the chamber was driven by the pressure difference between the flask and chamber. The desired partial and total pressure were controlled by the valve opening. Once the desired pressures had stabilized, the RF power supplies for ICP coil and sputtering guns were turned on sequentially to start the deposition process following the parameters listed in Table 1. The deposition was 30 min. When the deposition was finished, the samples were removed and left in a dry cabinet with humidity control. Further description can be found elsewhere [10].

2.3. Plasma Characterization

The chamber was built with several viewports. In the experiment, the emitting lights generated by plasma can be captured by an optical emission spectrometer (OES) for plasma diagnostics. The Avantes ULS2048 L spectrometer (Avantes, Apeldoorn, The Netherlands) with a wavelength range of 200–1100 nm and a spectral resolution of 1.4 nm was selected in the present study. The viewport for the OES was made of quartz, which was transparent. The collecting lens was positioned to capture the emission spectra during plasma polymerization process. By using proper methodology, electron density (ne), and electron temperature (Te) could be calculated according to the obtained plasma emission spectra. The detailed approach can be found in Reference [6].

2.4. Thickness Measurement

The thicknesses of the deposited PMMA films were measured using a surface profiler (Surfcorder ET3000, Kosaka, Tokyo, Japan). To prepare the sample, the substrate was half-masked using thermal resistant tape before deposition. The film thickness can be determined by the step between masked and unmasked region.

2.5. Chemical Bonding Characterization

The chemical structures of the PP-MMA films were confirmed by examining their IR spectra. The Fourier transformed infrared spectrometer (FTIR, Perkin Elmer Pentagon 1005, Waltham, MA, USA) was used with an attenuated total reflectance (ATR) module in the range of 650–2100 cm−1 with a resolution of 1 cm−1 in transmission mode. An uncoated substrate was first examined, and was used as a reference.

3. Results and Discussion

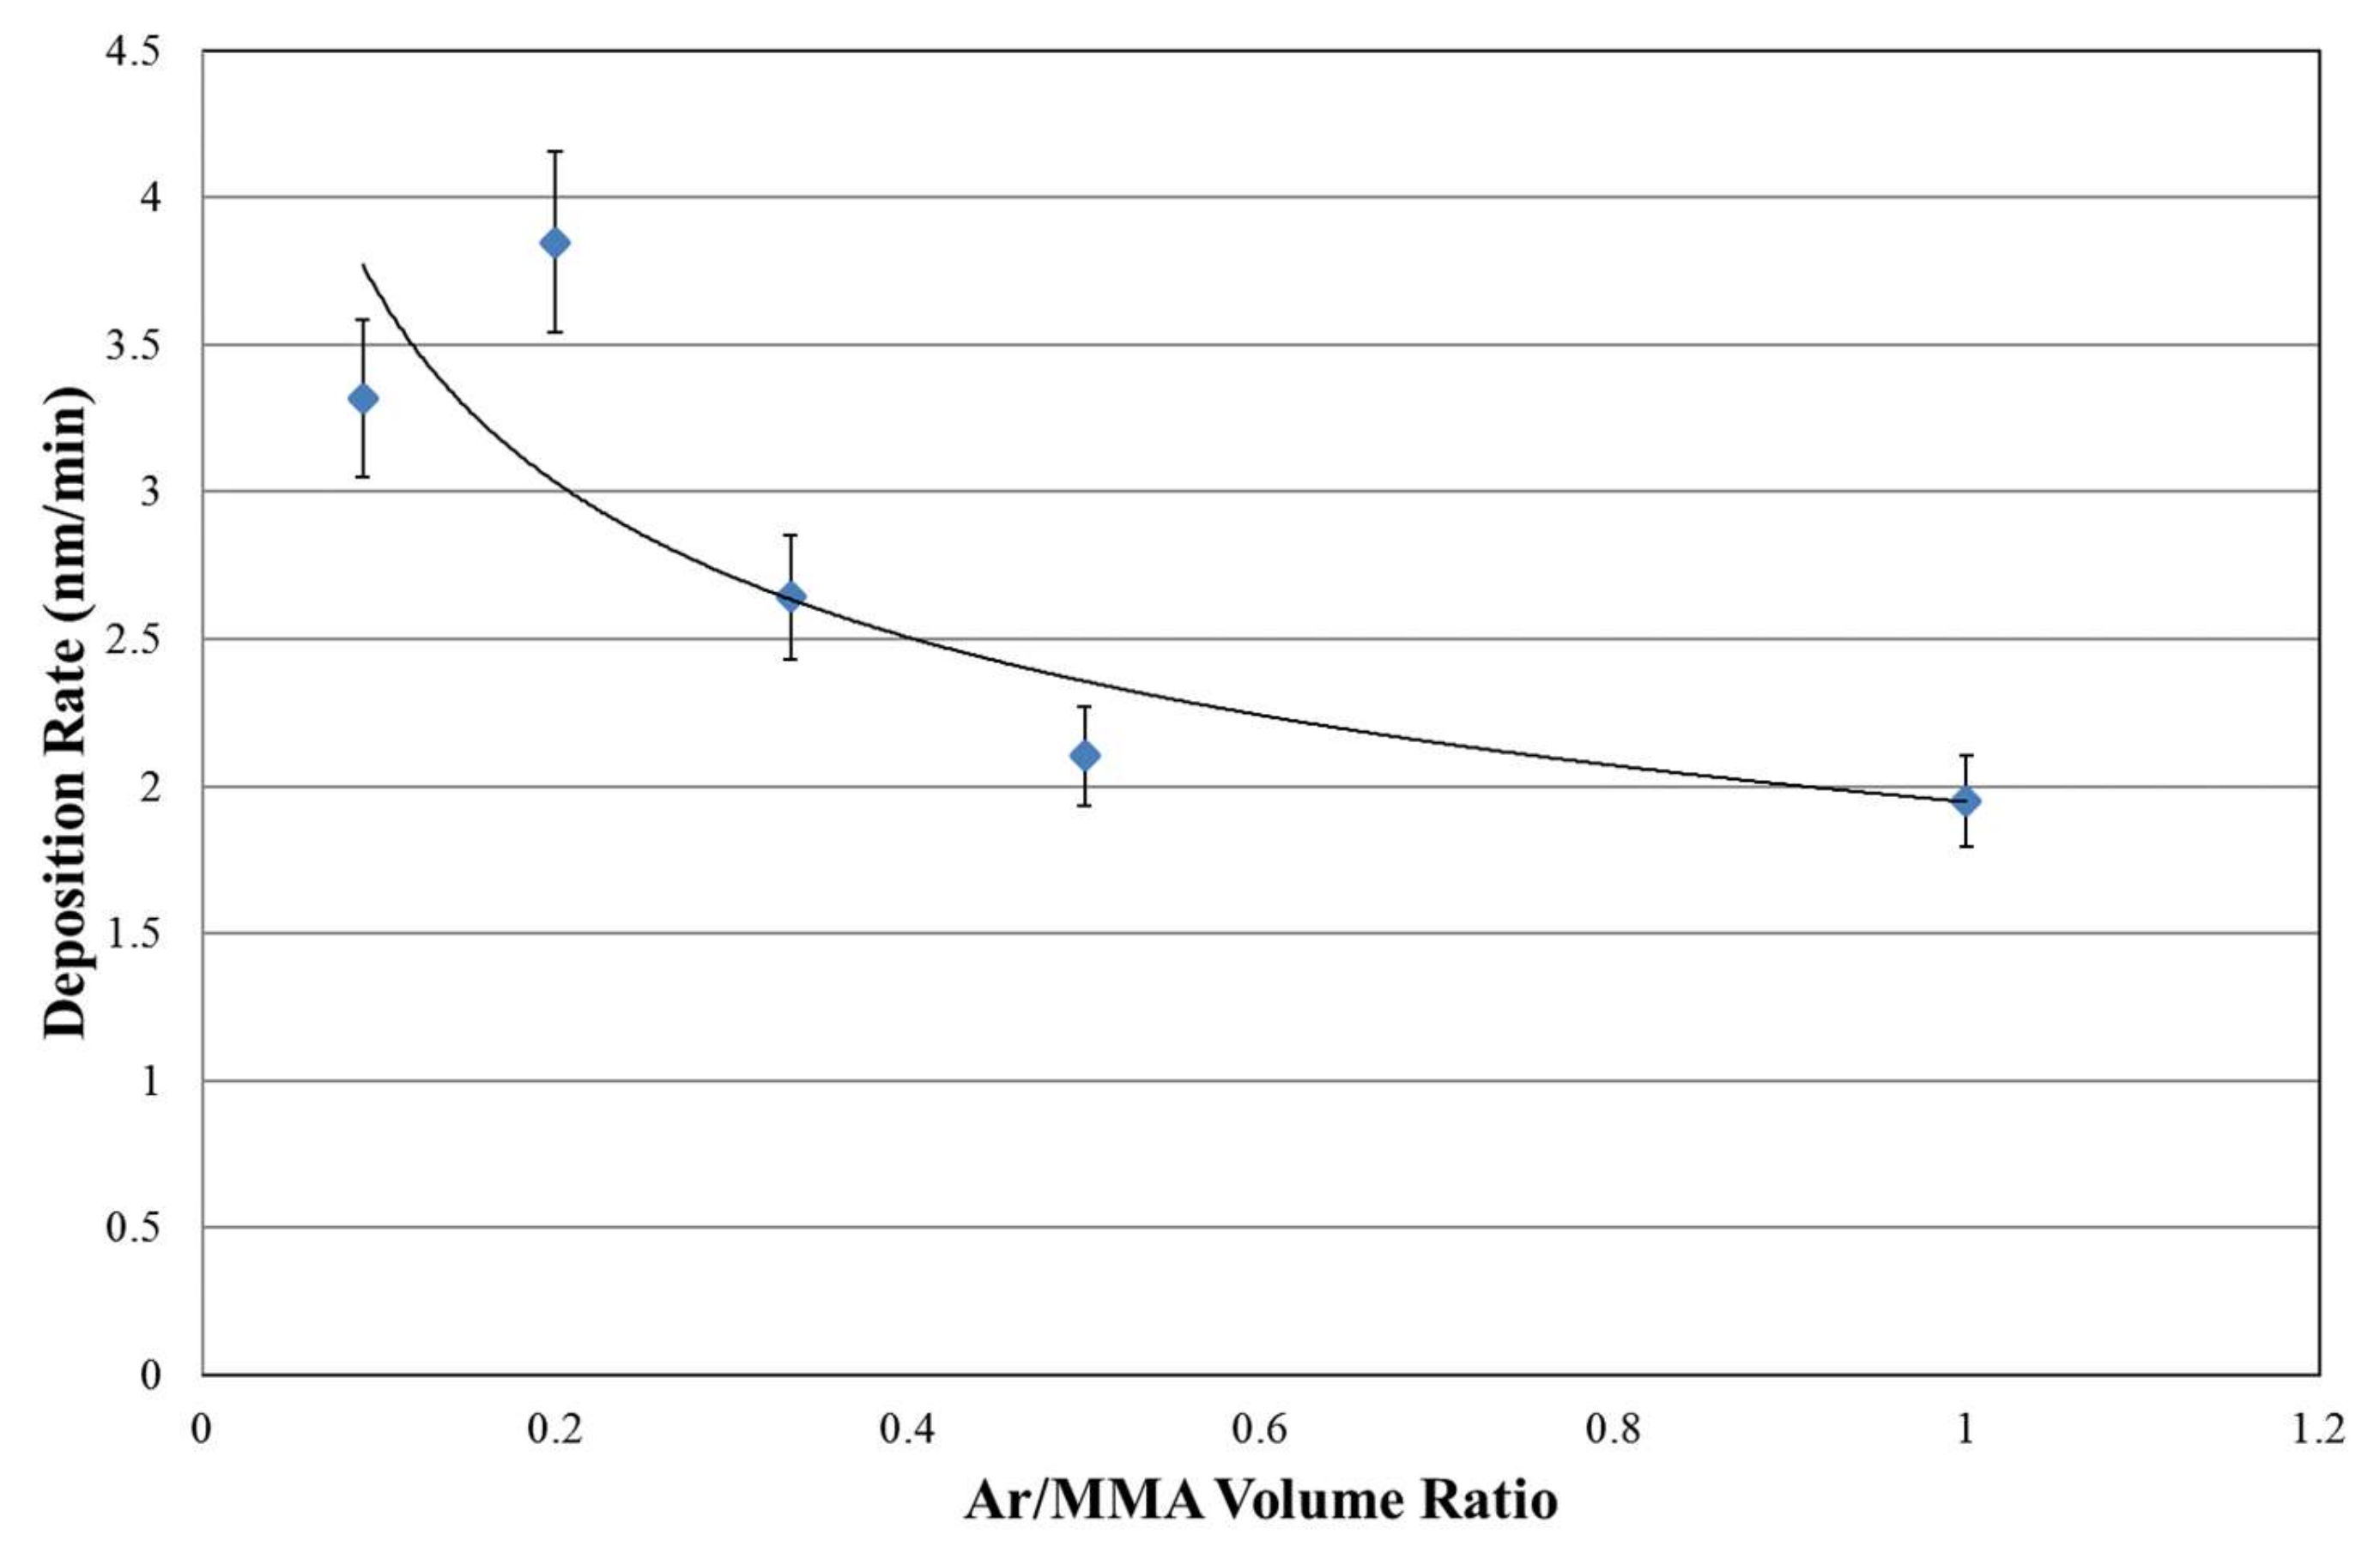
3.1. Effects of Ar/MMA Volume Ratio on Deposition Rate

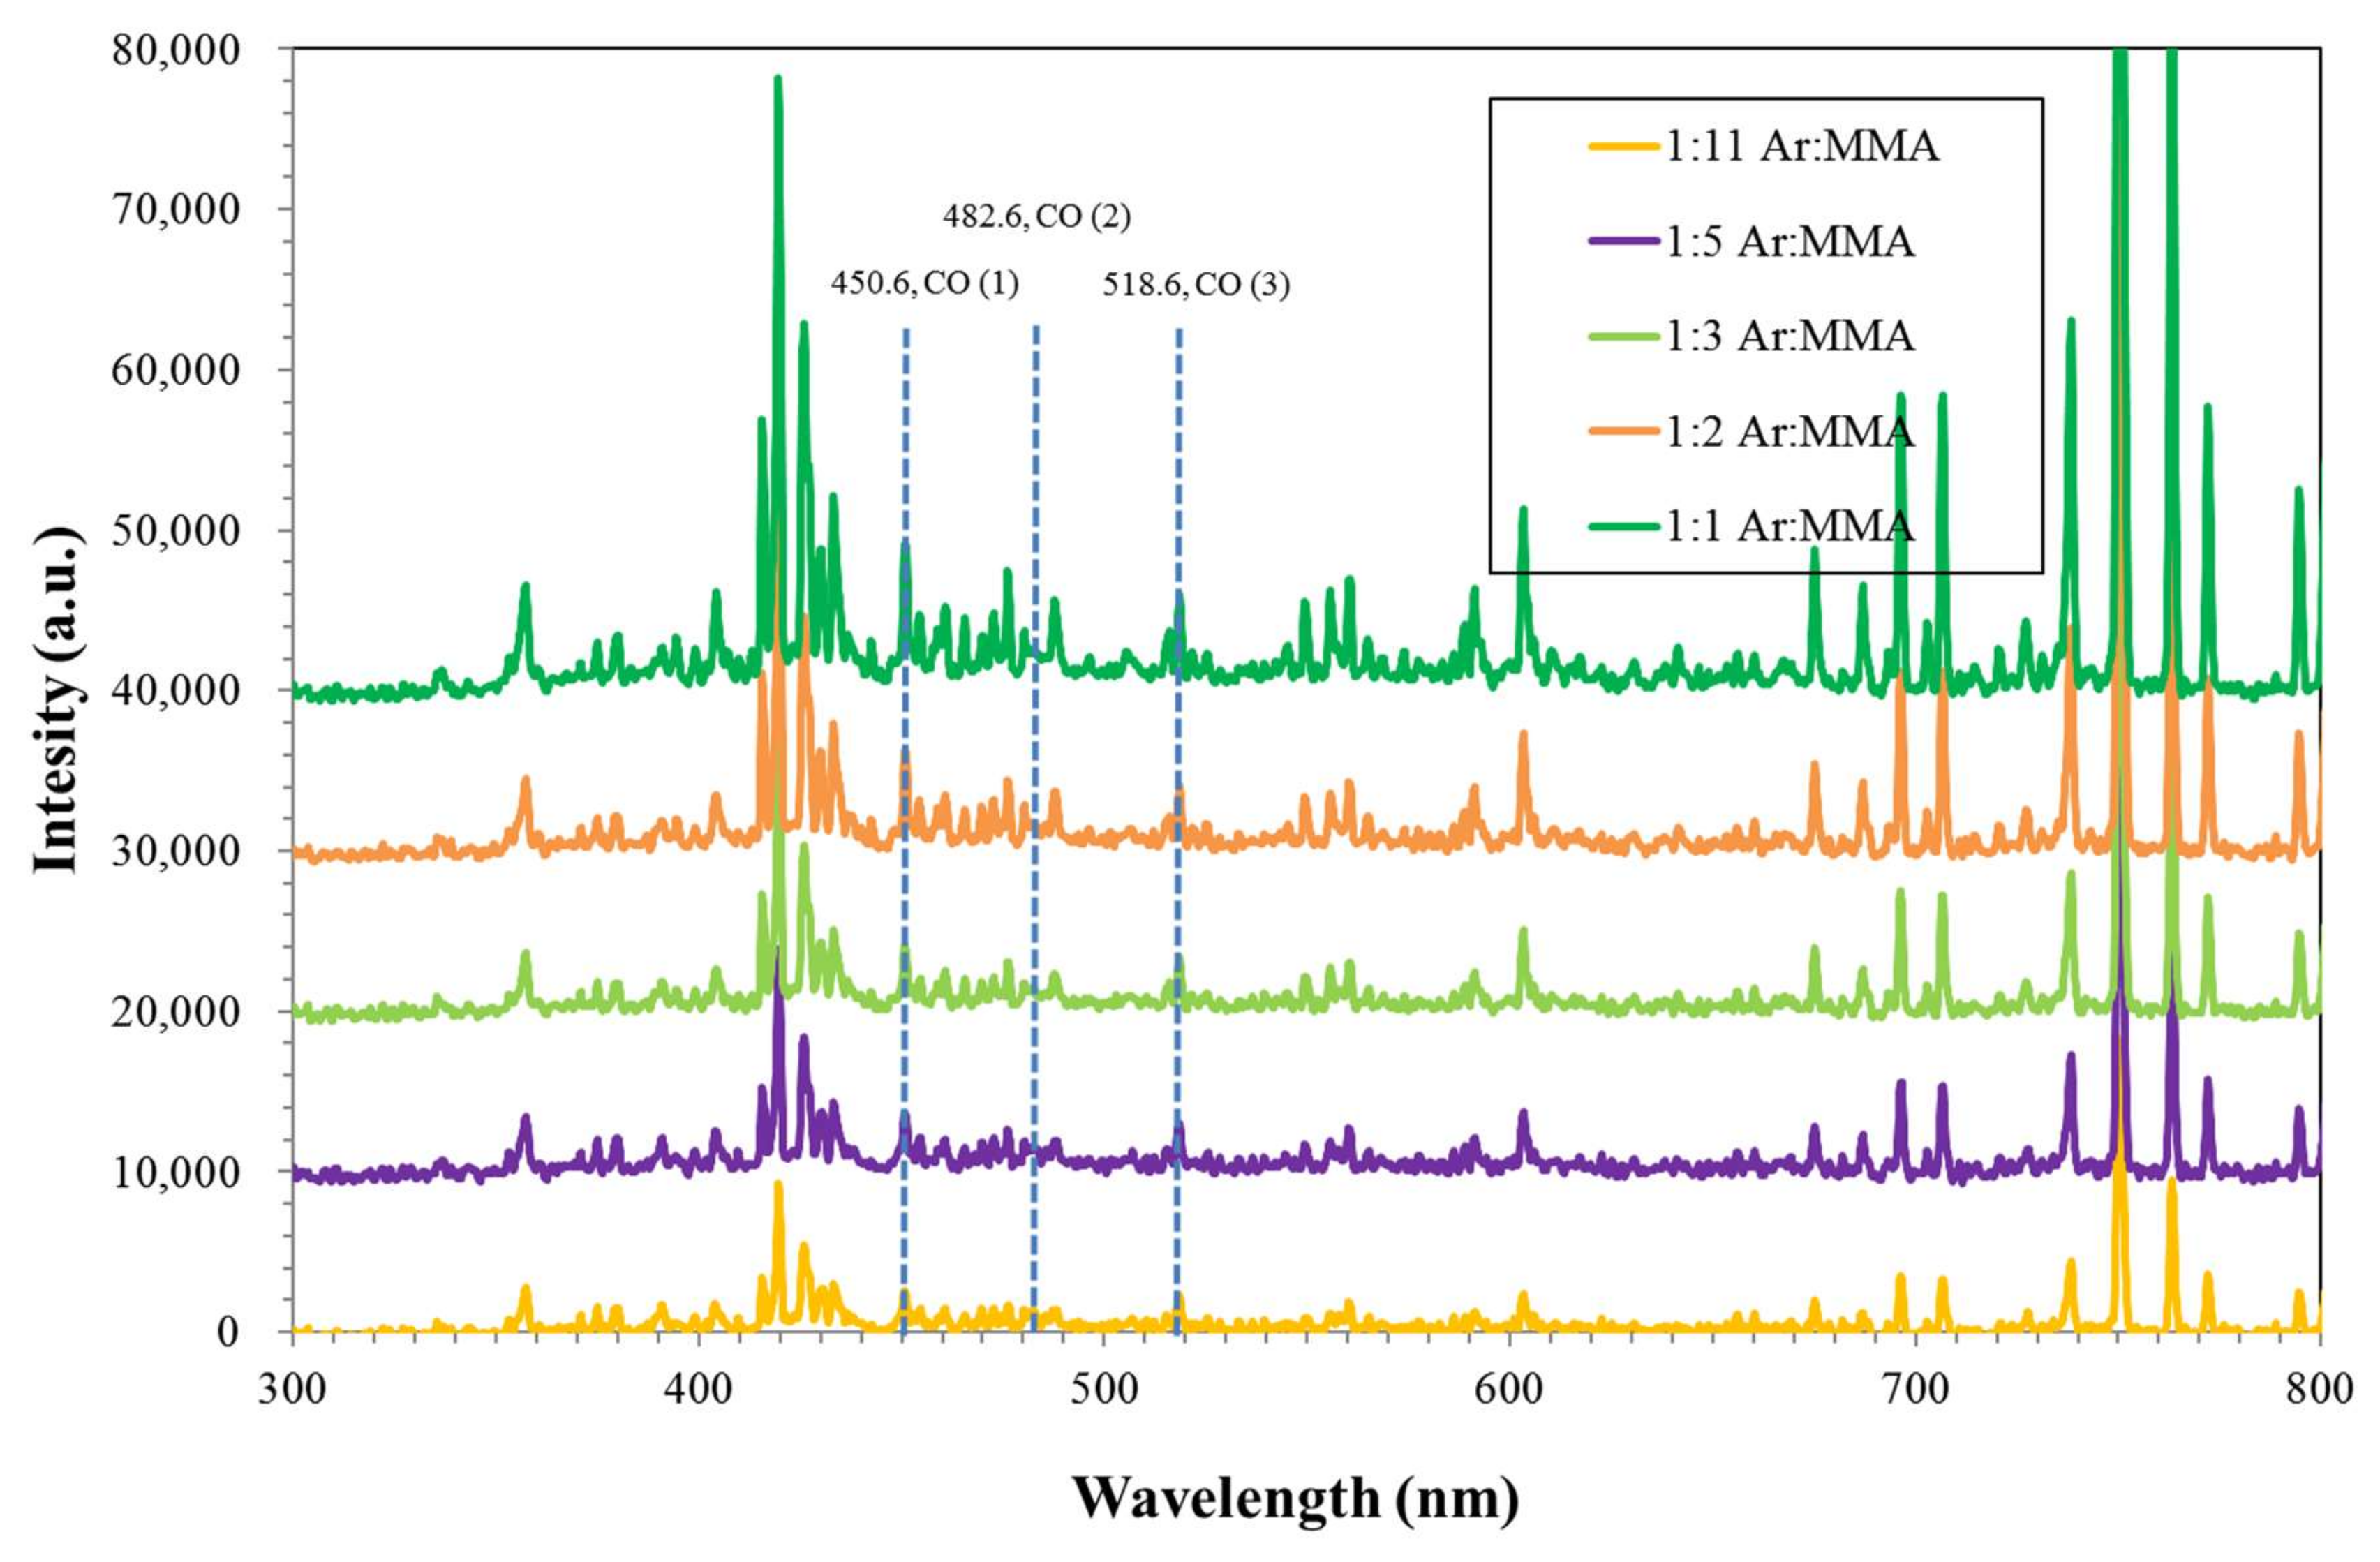
3.1.1. Plasma Characterization

As shown in Table 2, by increasing the Ar/MMA volume ratio from 0.009 to 1, the electron density increases, while the electron temperature decreases. It is known that the Debye length of plasma is proportional to the square root of the electron temperature and inversely proportional to the square root of the electron density [6]. Thus, the Debye length decreases with the increase in argon amount. This means that, with the increase in Ar partial pressure (volume), the plasma density would increase, as would the particle collision frequency. It is clearly observed that the increase in the Ar volume percentage can directly induce the excitation and ionization of argon atoms in the plasma. This result will be further discussed in the later sections. Overall, the increase in plasma intensity is mainly due to the electron’s impact on argon atoms. When the argon gas volume ratio (flow rate) increases, the ionization rate, which is affected by the impact of the energetic electrons with the argon atoms, is enhanced, and the plasma intensity is, hence, increased. In this case, the electron temperature will decrease due to the increase in collision frequency. As shown in Table 2, it can be observed that the electron density increases with the decrease in electron temperature when the argon percentage increases.

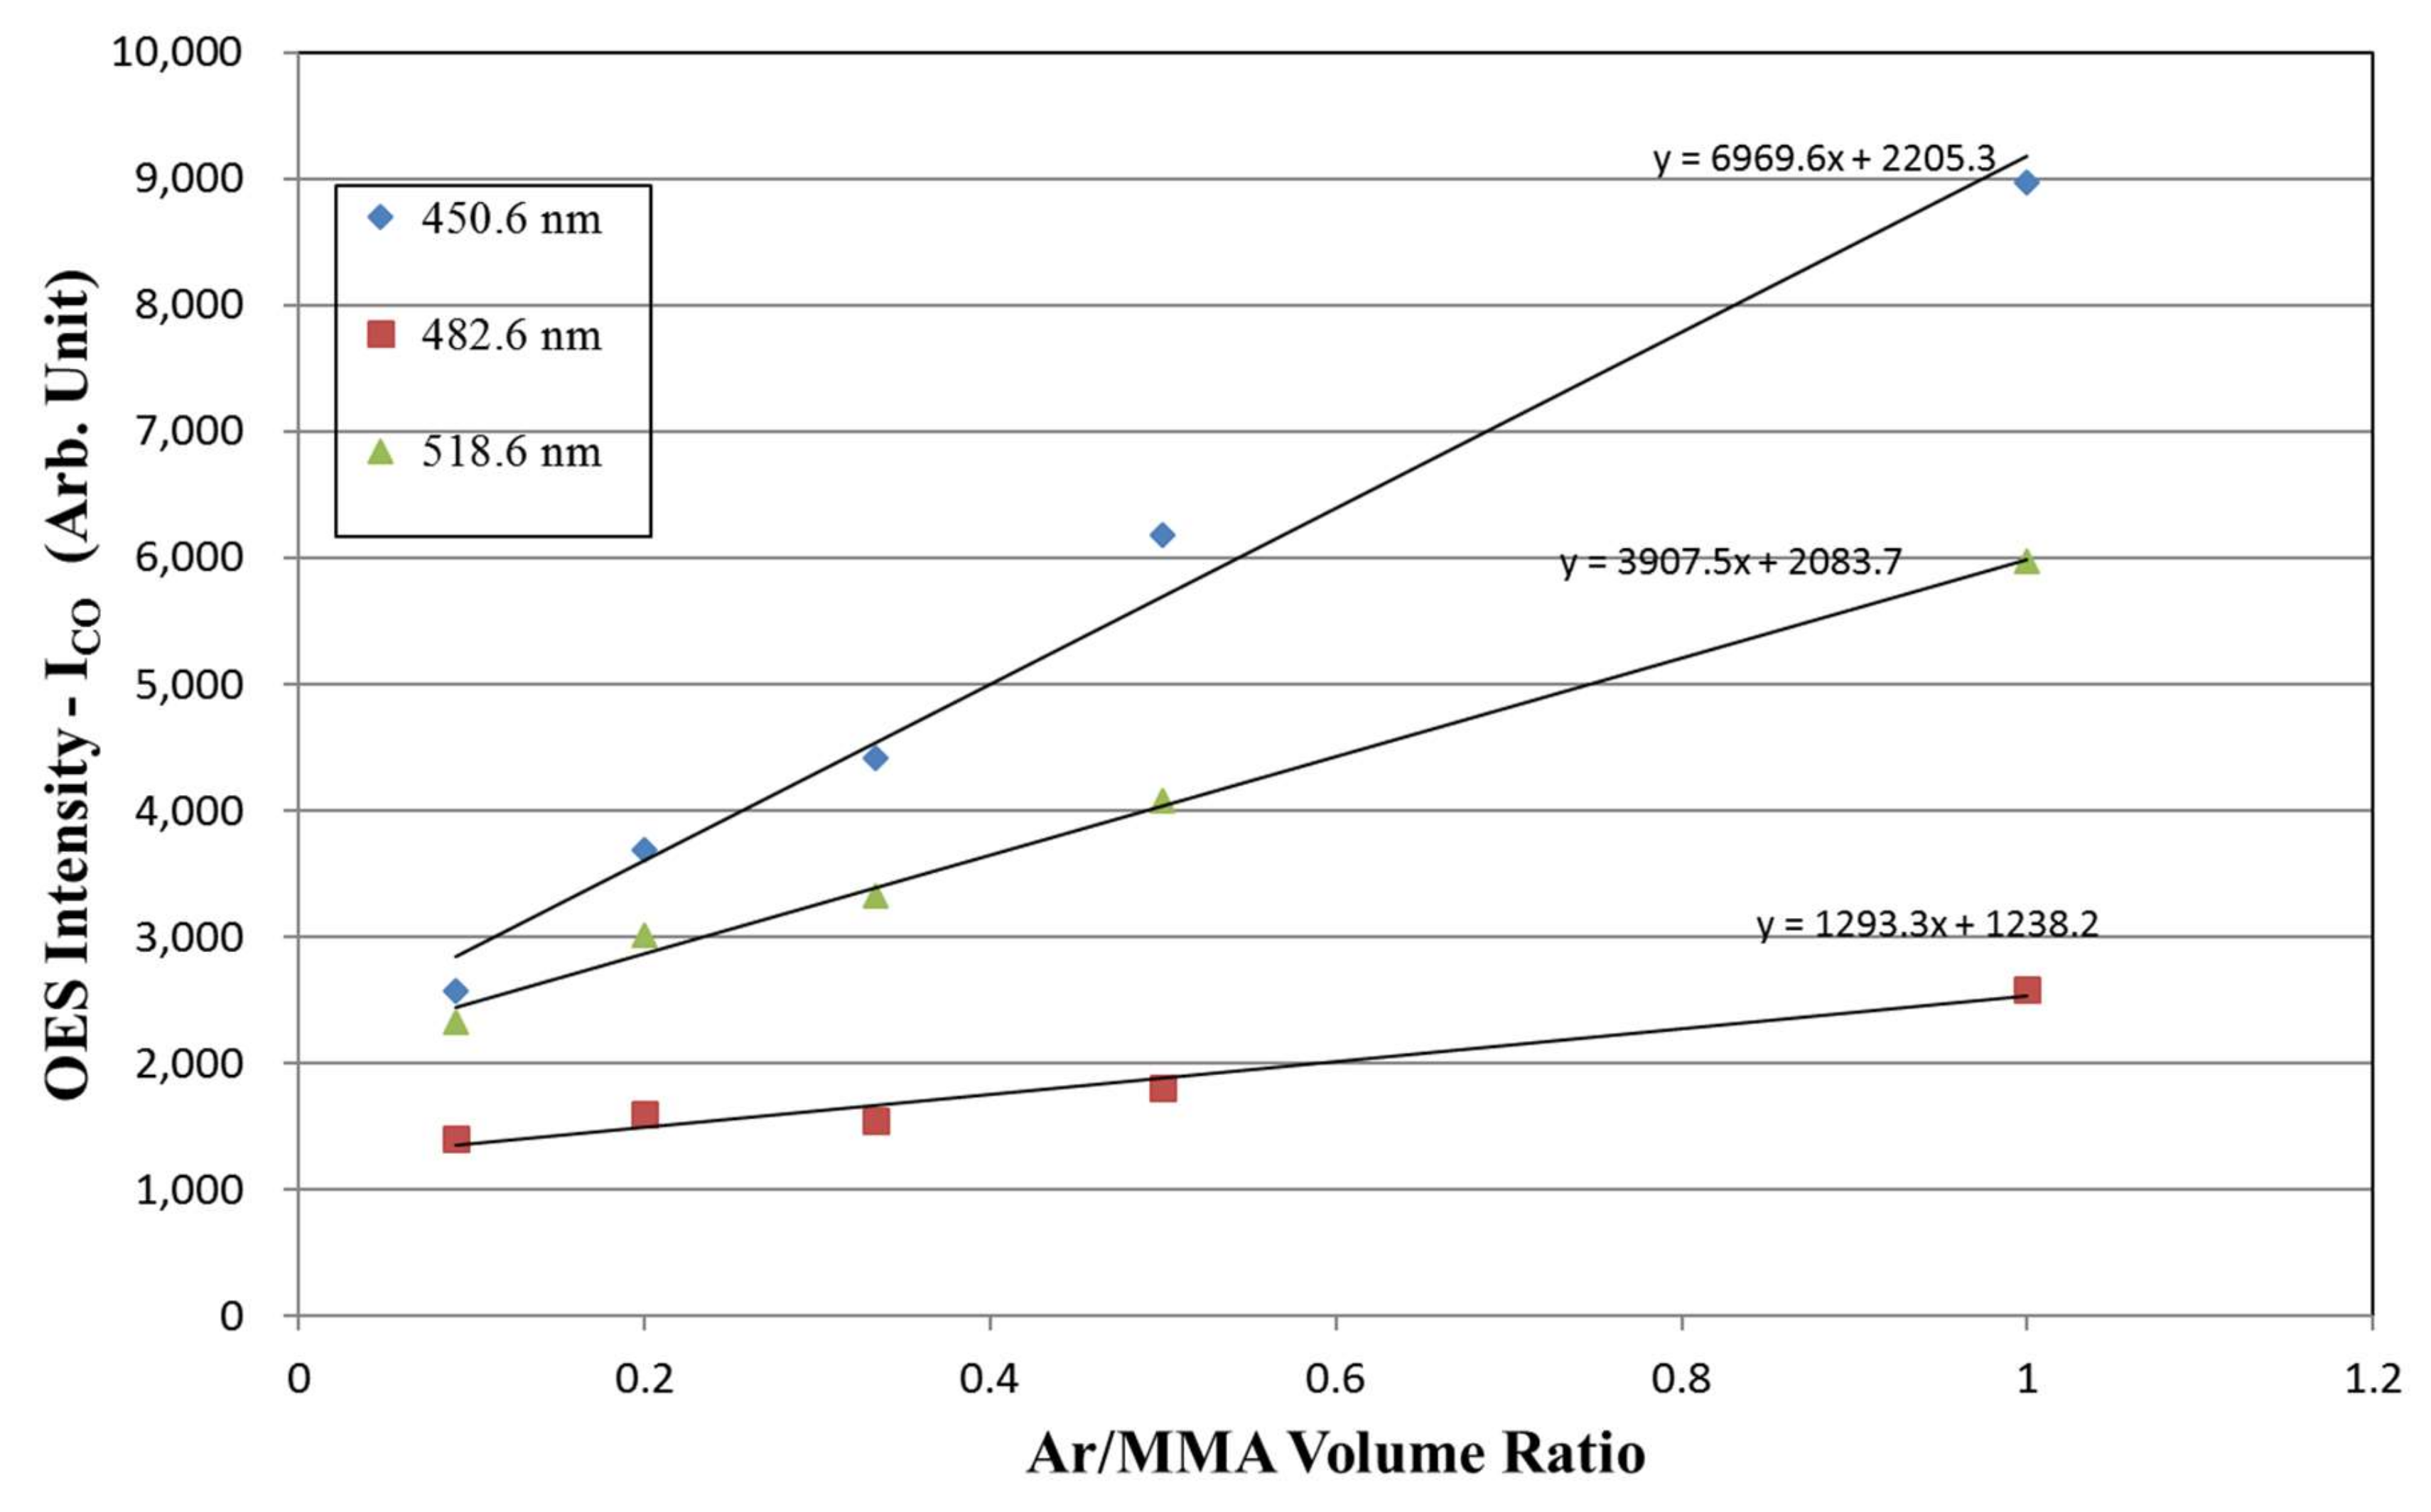
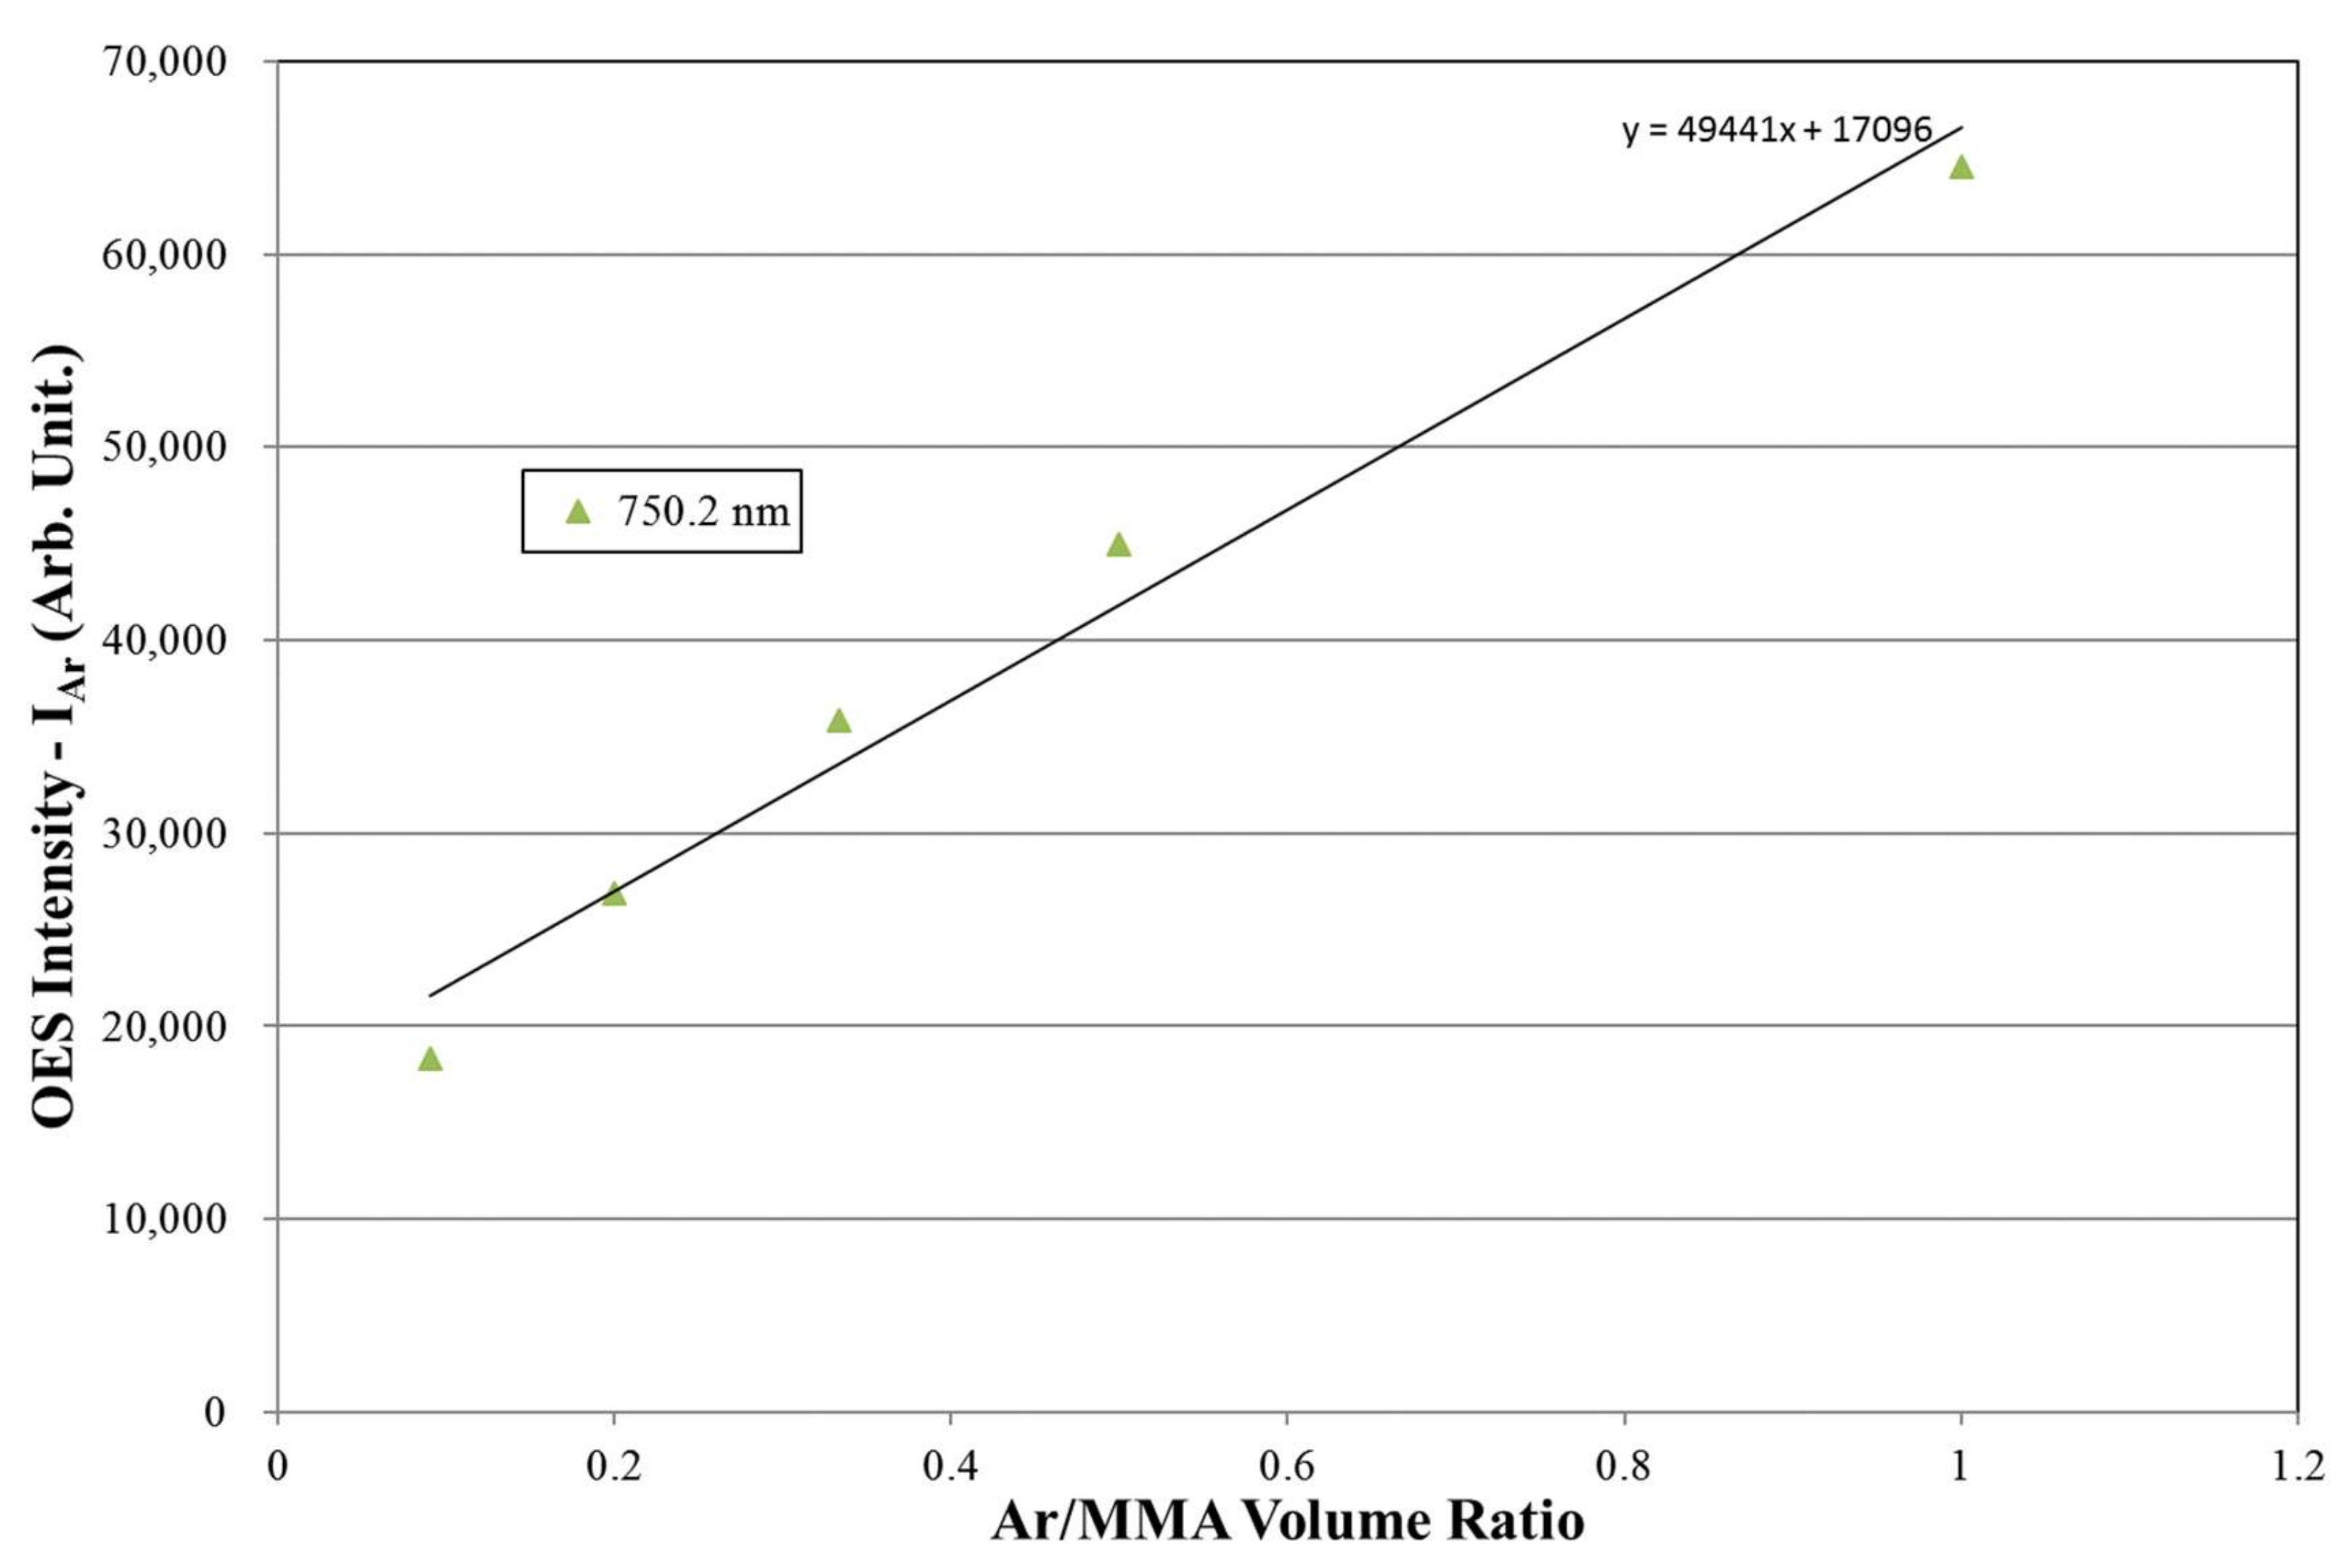
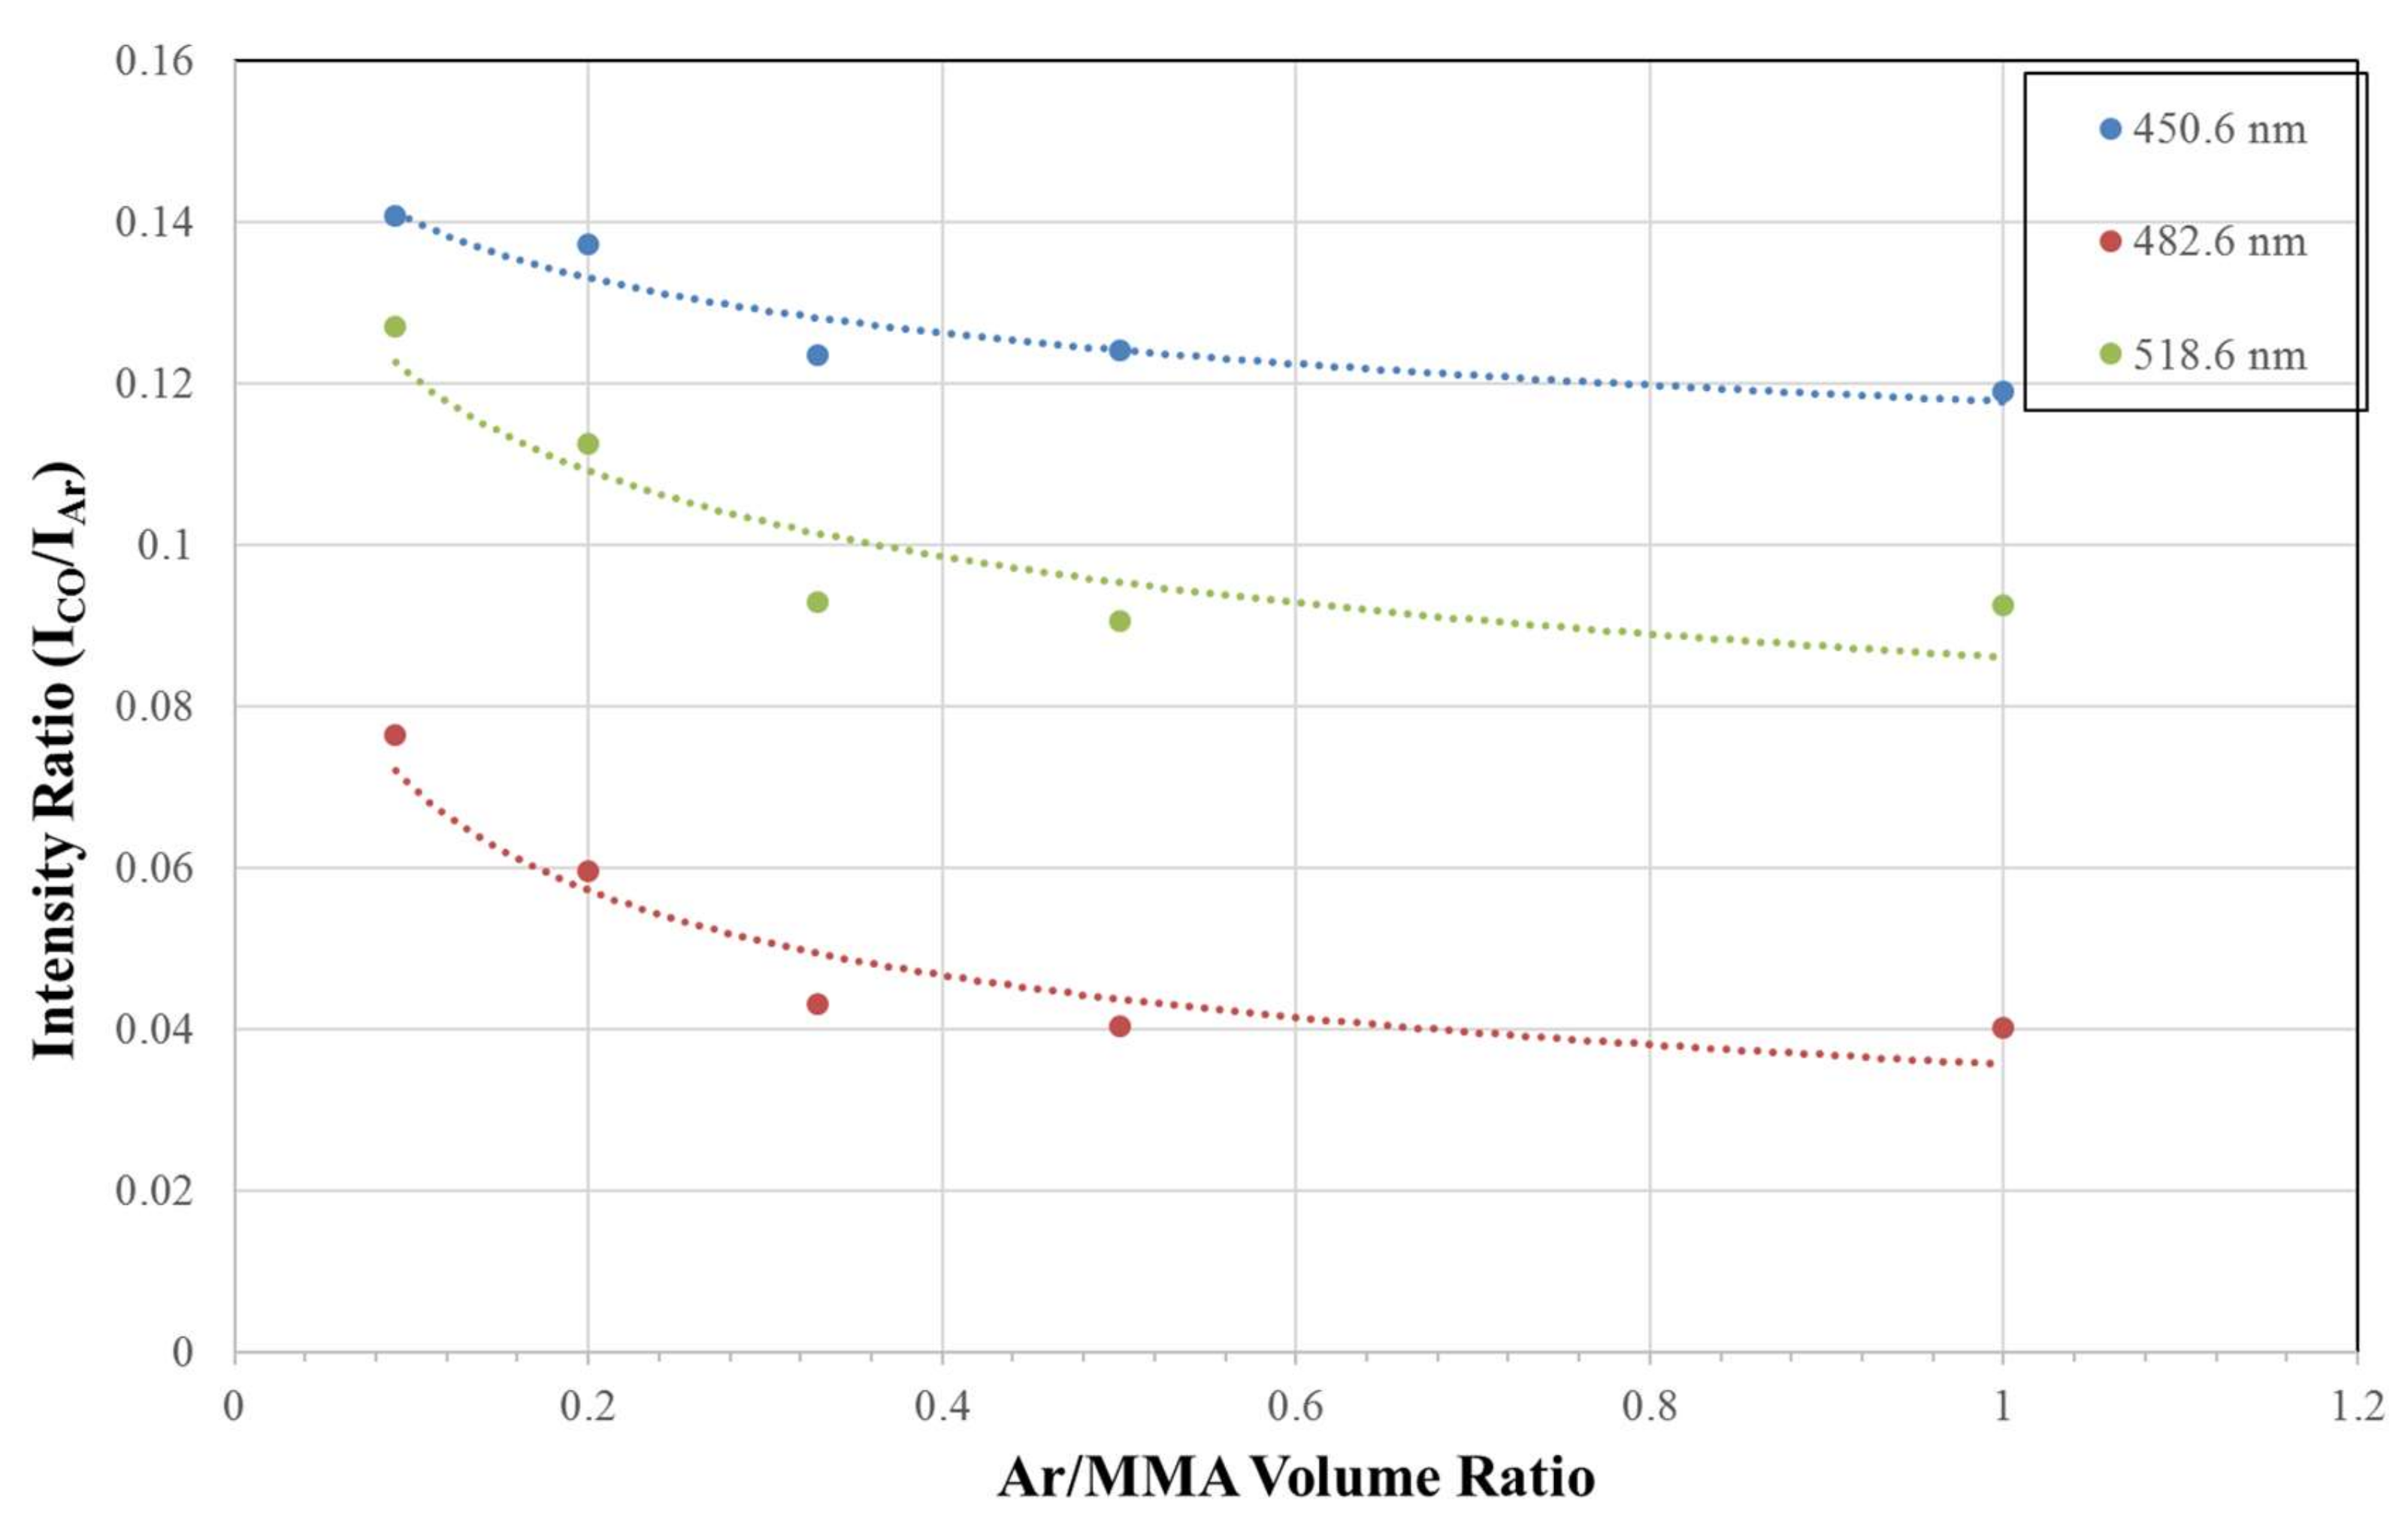
3.1.2. Correlation of Deposition Rate and OES Analysis

Figure 2 shows the relationship between deposition rate and Ar/MMA volume ratio. As seen in this figure, the deposition rate decreases with the increase in Ar/MMA volume ratio, although the plasma intensity is increased. This can be explained with the OES data analysis, as shown in Figure 3, Figure 4 and Figure 5. As the OES spectra show, apart from the argon lines, a group of CO, H, and O lines are seen due to CO (450.6, 482.6, and 518 nm) species, H species (486, 656 nm), as well as O species (777, 844 nm) in the region between 400 and 900 nm [11]. In the following, only the CO peaks are discussed as they represent the fragmentation of the monomers. According to the figures, it can be observed that the OES intensity of the Ar (750.2 nm) peak and CO peaks (450.6, 482.6, and 518.6 nm) increase linearly with the Ar volume percentage. In essence, the OES intensity (I) is known to be proportional to the collision cross-section (σ), electron density (ne), square root of electron temperature (Te), and gas concentration ([Ng]), according to the following Equation [12,13]:
I α σneTe1/2[Ng]
For Ar, it can be understood that the OES intensity is mainly controlled by the increased concentration of Ar, although part of it could be due to the increase in electron density, presuming the collision cross-section is constant. The increase in Ar intensity with the Ar volume ratio is shown in Figure 5. However, it is also observed that the peak intensity of the CO increases with the increase in the Ar volume percentage. In this case, only the increase in the electron density can be related to the increase in CO intensity. However, this does not seem to be convincing because the volume percentage of MMA is sharply decreased. Therefore, it is thought that Penning dissociation/fragmentation could play a critical role. In the Penning process, the metastable Ar atoms with energy of 11.5 eV [14] may collide with MMA and subsequently cause the enhanced fragmentation of the MMA molecules, although the increased intensity is not as significant as that of Ar. In order to explain the decrease in the deposition rate, the intensity ratio of the Ar peak to the CO peaks is shown in Figure 6, as a function of the Ar/MMA volume ratio. As observed in this figure, the trend is found to be similar to that of the deposition rate shown in Figure 2. In other words, it can be summarized that the monomer fragments are diluted with the increase in the Ar volume ratio, even though the plasma intensity is increased. This eventually causes the decrease in the deposition rate.

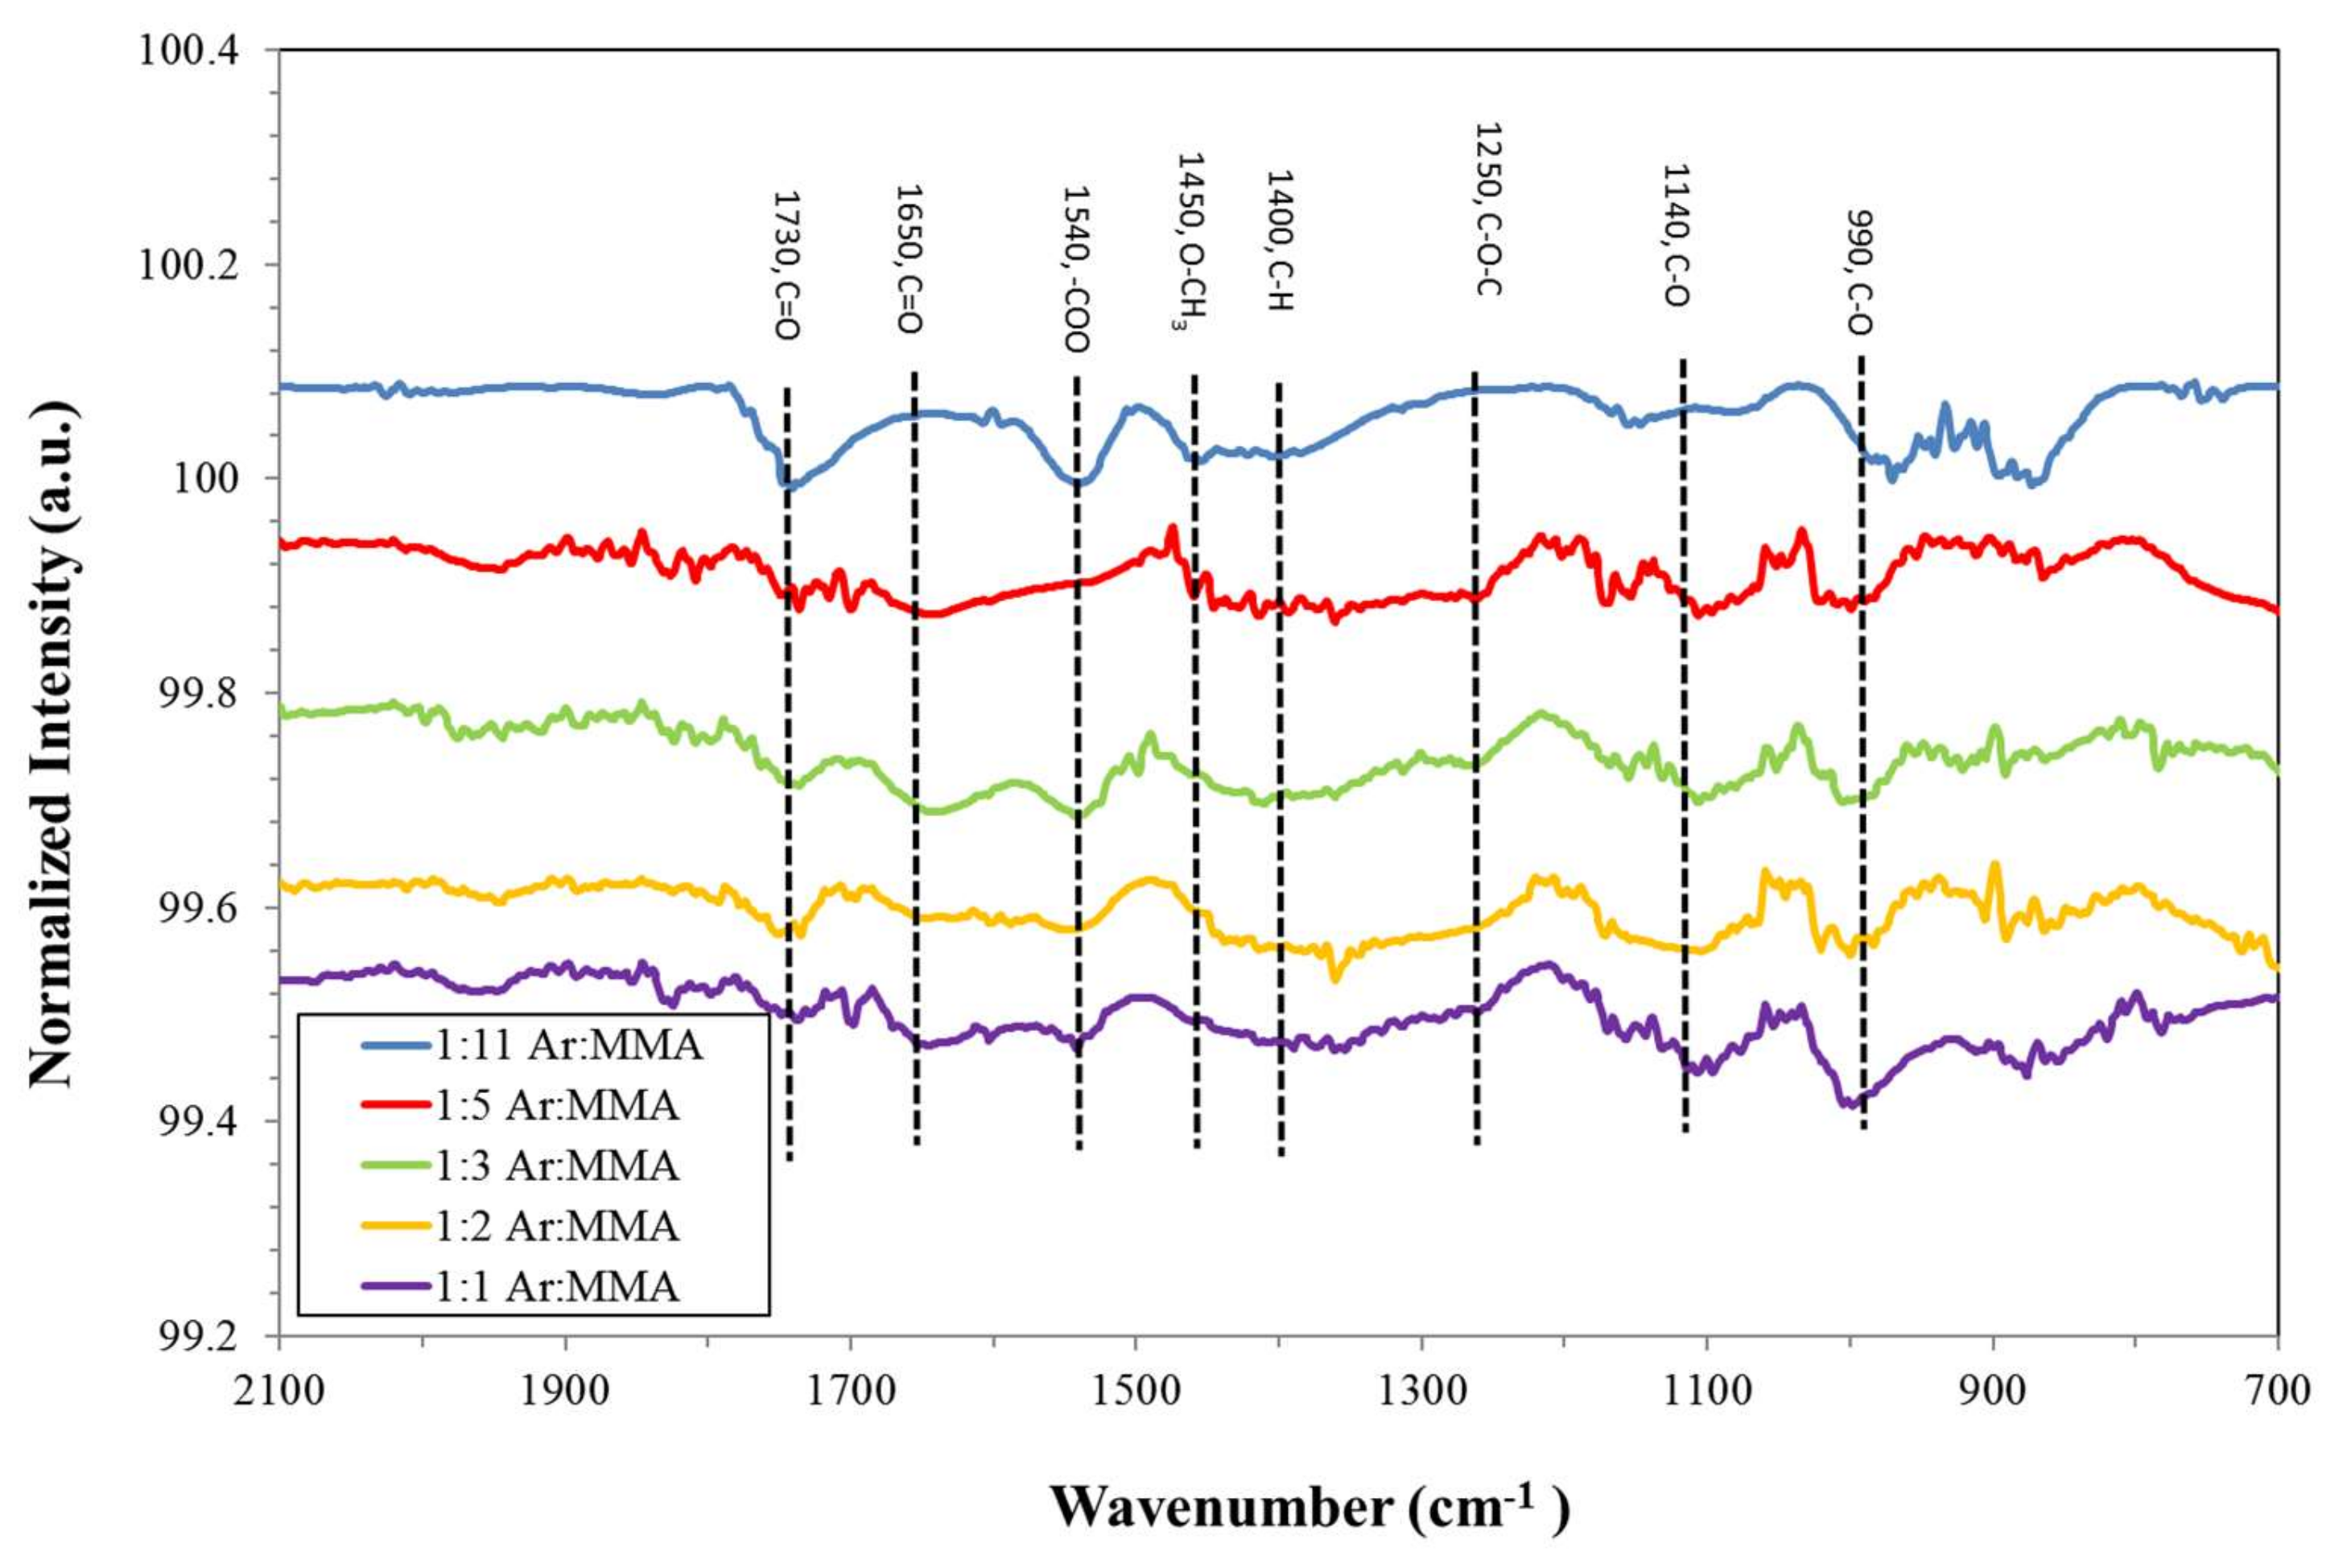
3.1.3. Chemical Bonding Characterization

The deposition of PP-MMA with the variation in the Ar/MMA volume ratio was characterized using ATR-FTIR with transmission mode. The FTIR spectra for these PP-MMA films is shown in Figure 7. The peaks identified are close to the reported wavenumbers that include: 1650 cm−1 (C=O stretching mode); 1730 cm−1 (C=O stretching mode); 1545 (–COO anti-stretching mode); 1450 (O–CH3 asymmetric bending mode); 1250, 11,400; and 990 (C–O vibration mode of C–O–C) [11,15,16,17,18]. The shifts from standard peaks may be attributed to the amorphous states of the plasma polymerized film in nature. This is not uncommon for films synthesized with the plasma process. In the films, the structure is normally highly cross-linked. This can be made clearer by comparing the difference between the absorption peaks of the plasma polymerized films and the chemically processed PMMA. It has been suggested that the condensation of a large amount of fragments and possible rearrangement cause the difference [15,17]. According to Figure 7, with the increase in the Ar/MMA volume ratio, it is observed that the absorption peaks of C=O (1650 cm−1) and C–O (990, 1140 cm−1) become more obvious. The formation of the C=O peak at 1650 cm−1 can be attributed to the weak electrostatic attraction between the cation (Ar+) and the carbonyl group, which can be related to the bombardment of the Ar ions [15]. The enhancement of the C–O peaks can also be attributed to the bombardment of the Ar ions. The ion bombardment comes with a combination of the larger atomic mass of argon and its relative abundance in the plasma, with an increase in its volume ratio. After bombardment, the oxygen radicals existing in the plasma are able to attach to carbon atoms. Similar results are found in the studies of plasma-treated PMMA substrates [1].

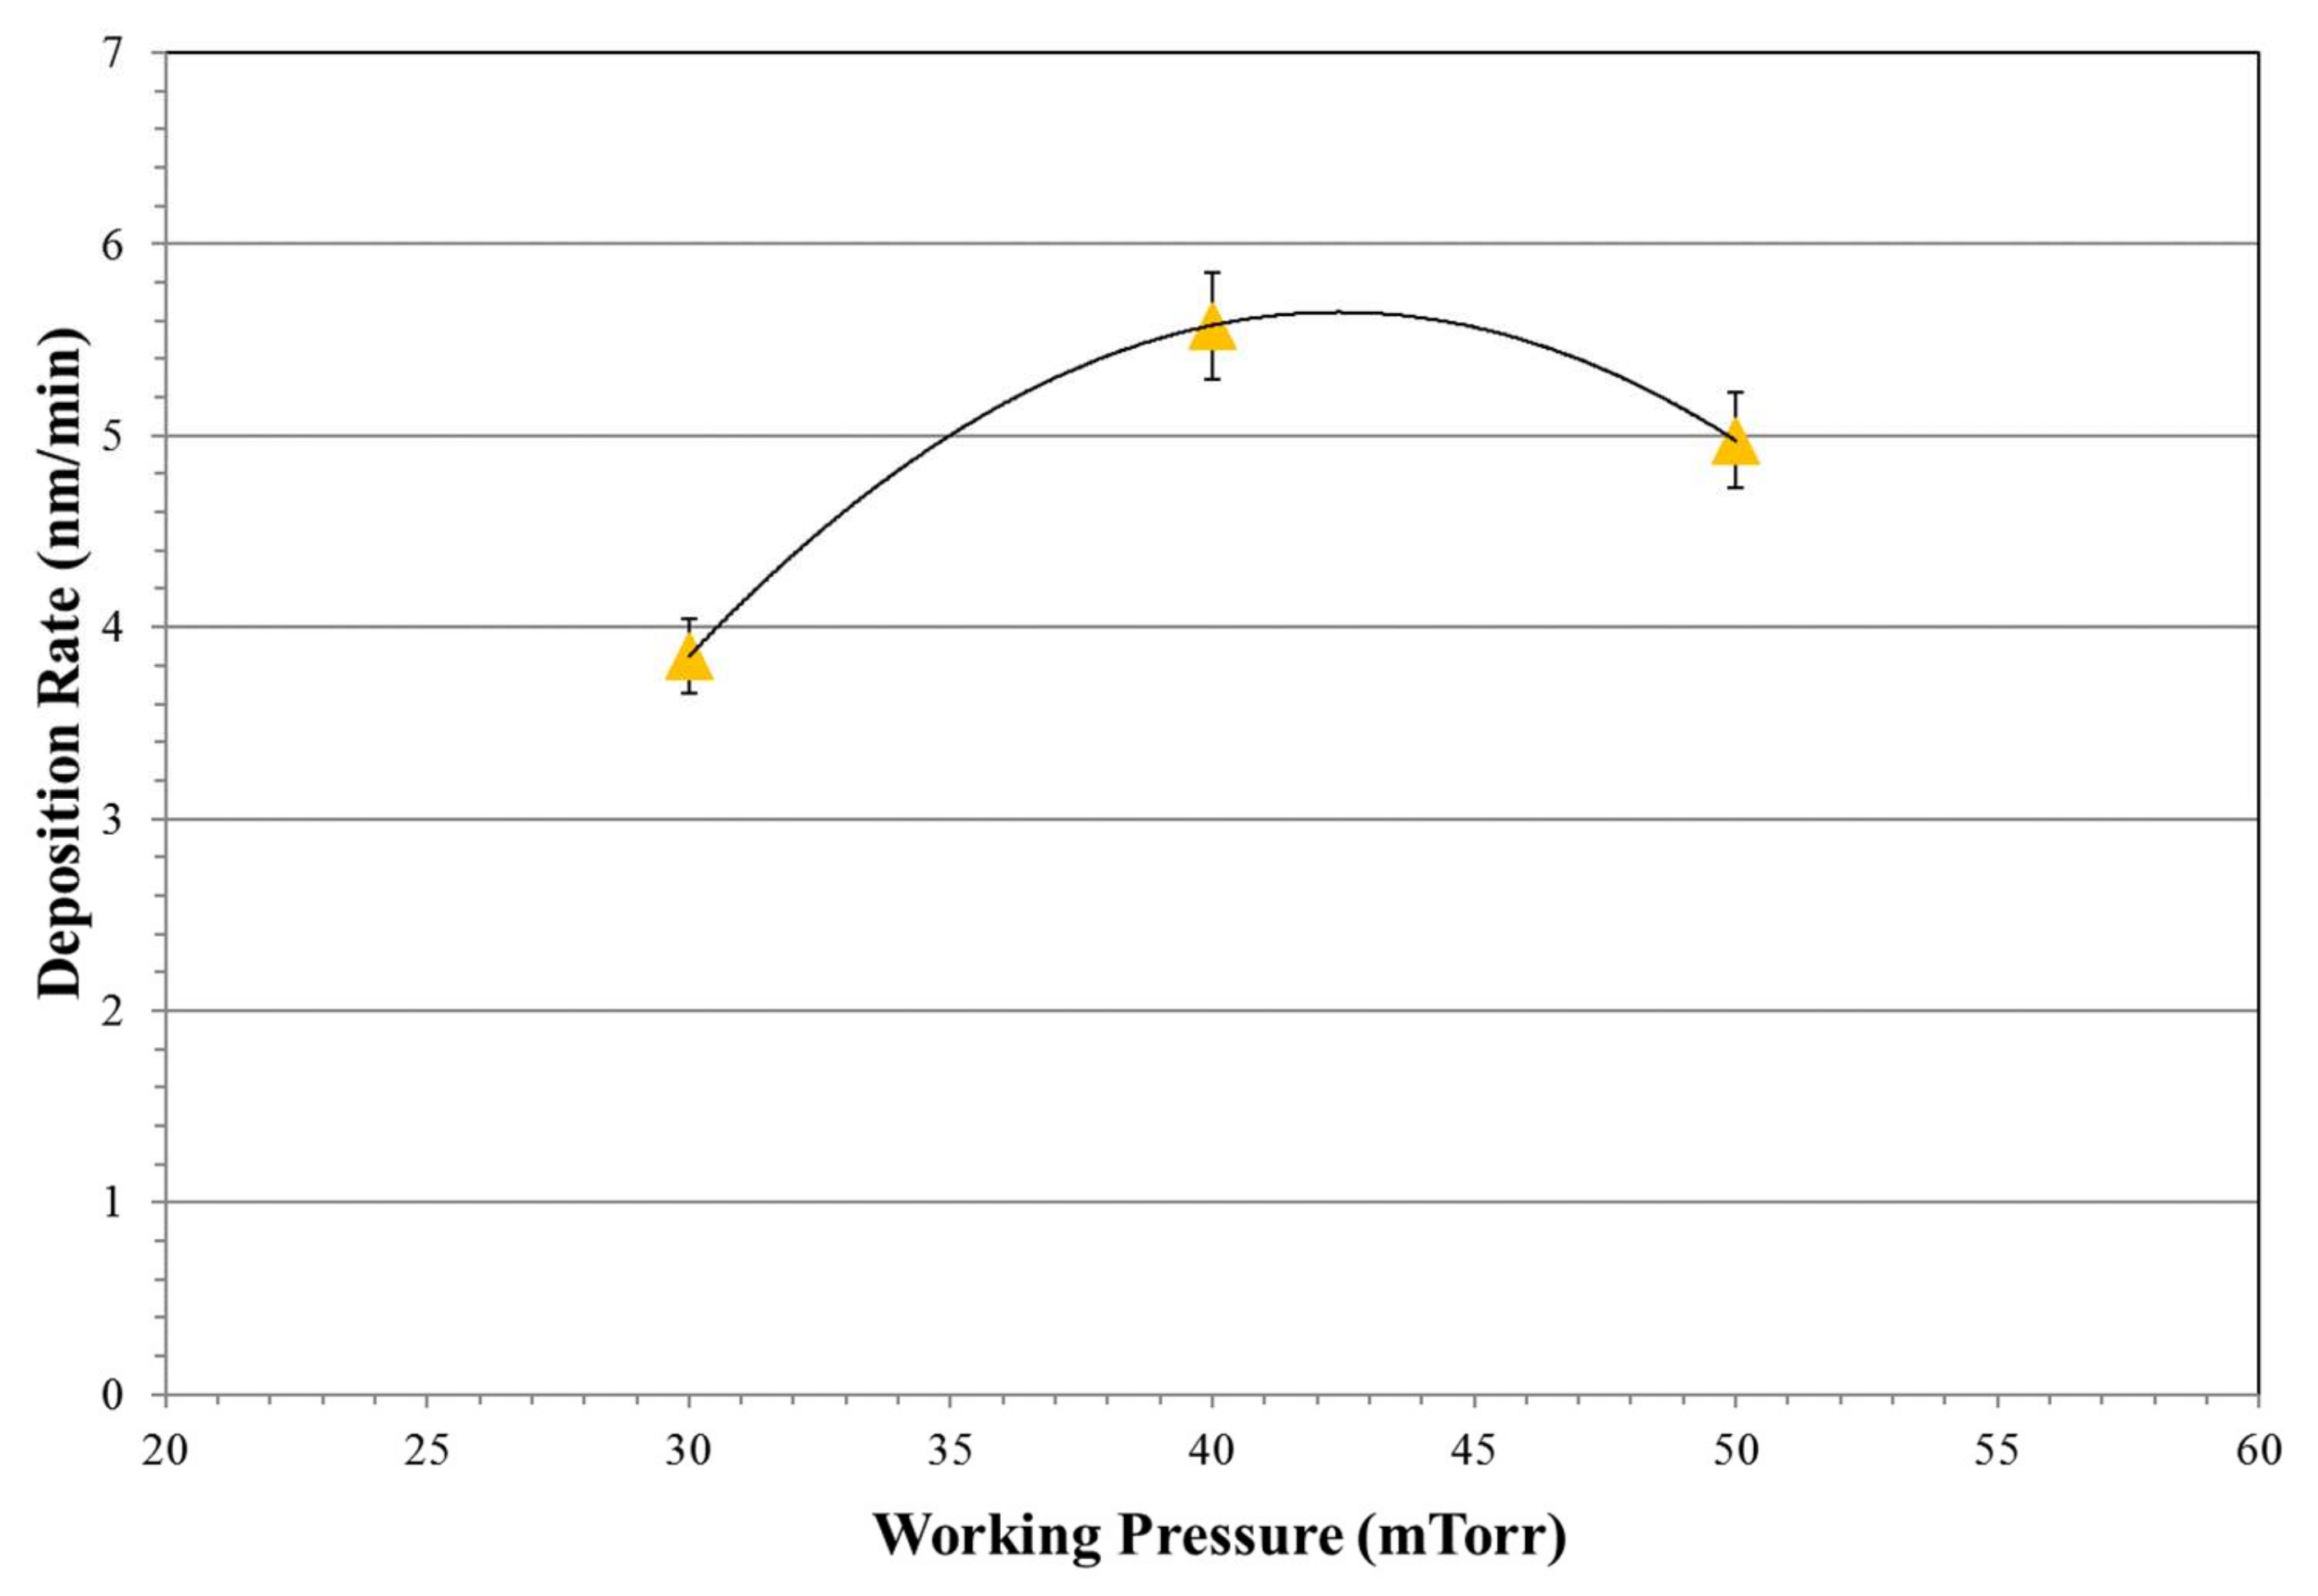
3.2. Effects of Working Pressure on Deposition Rate

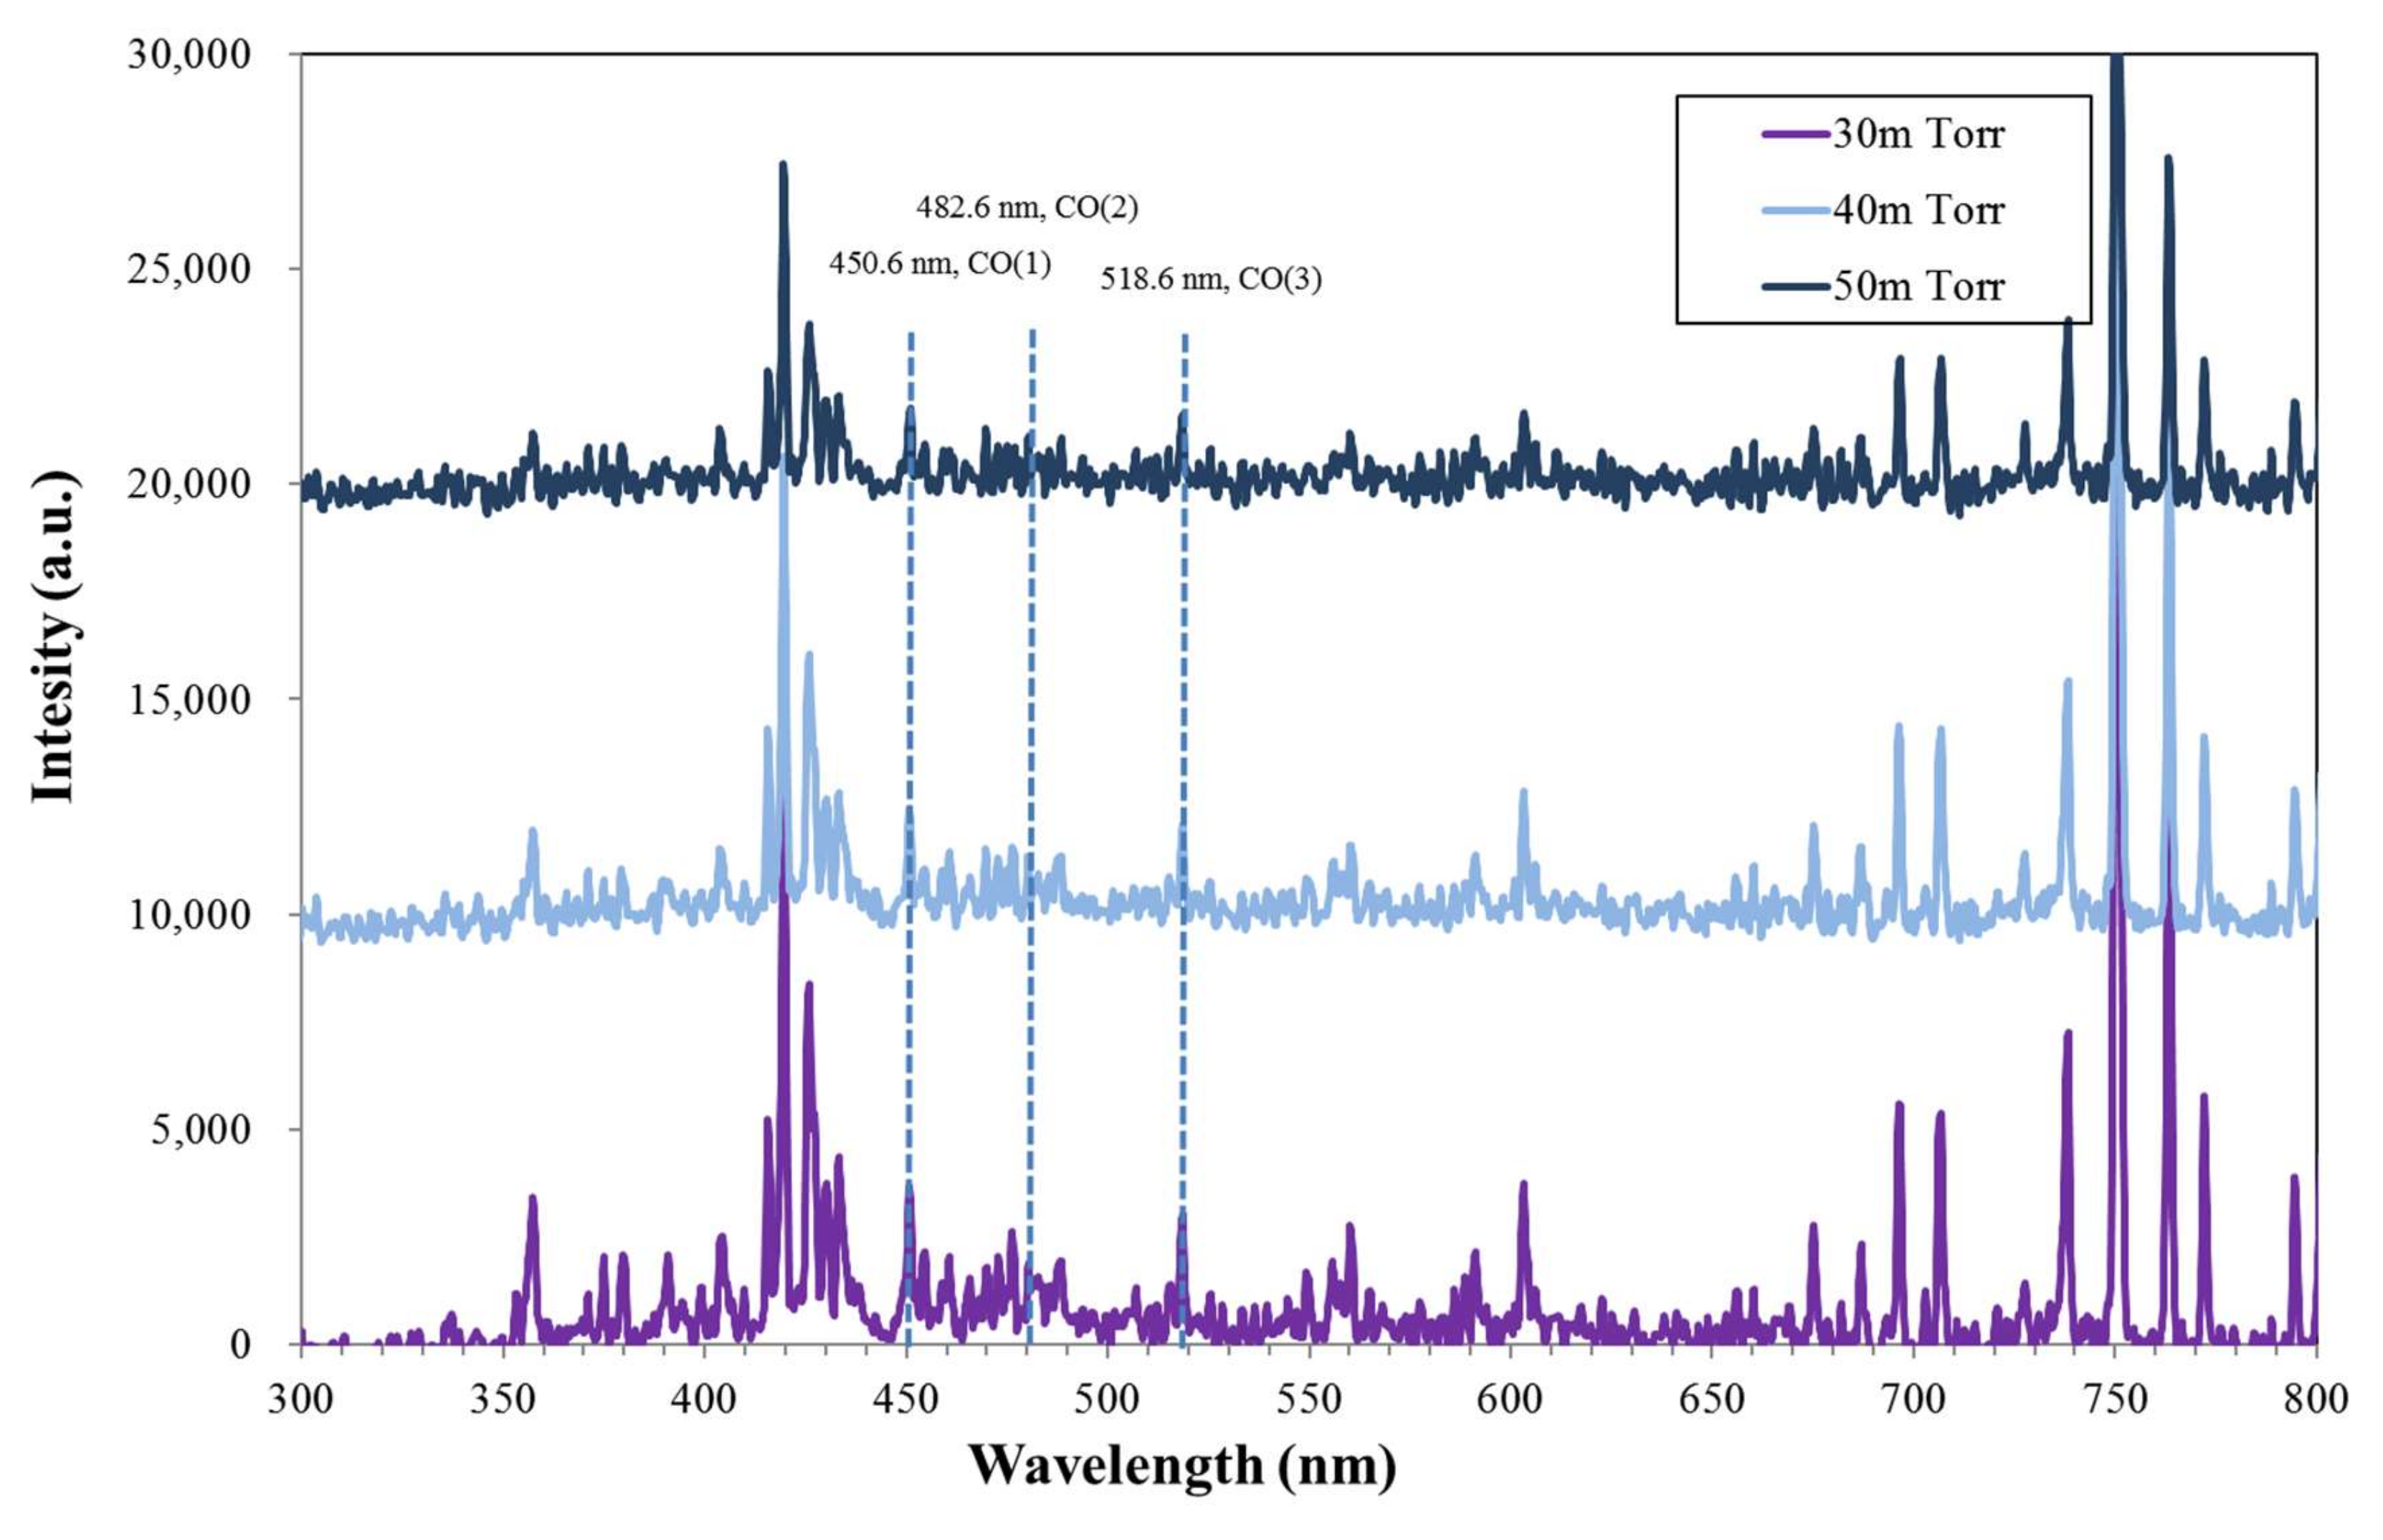
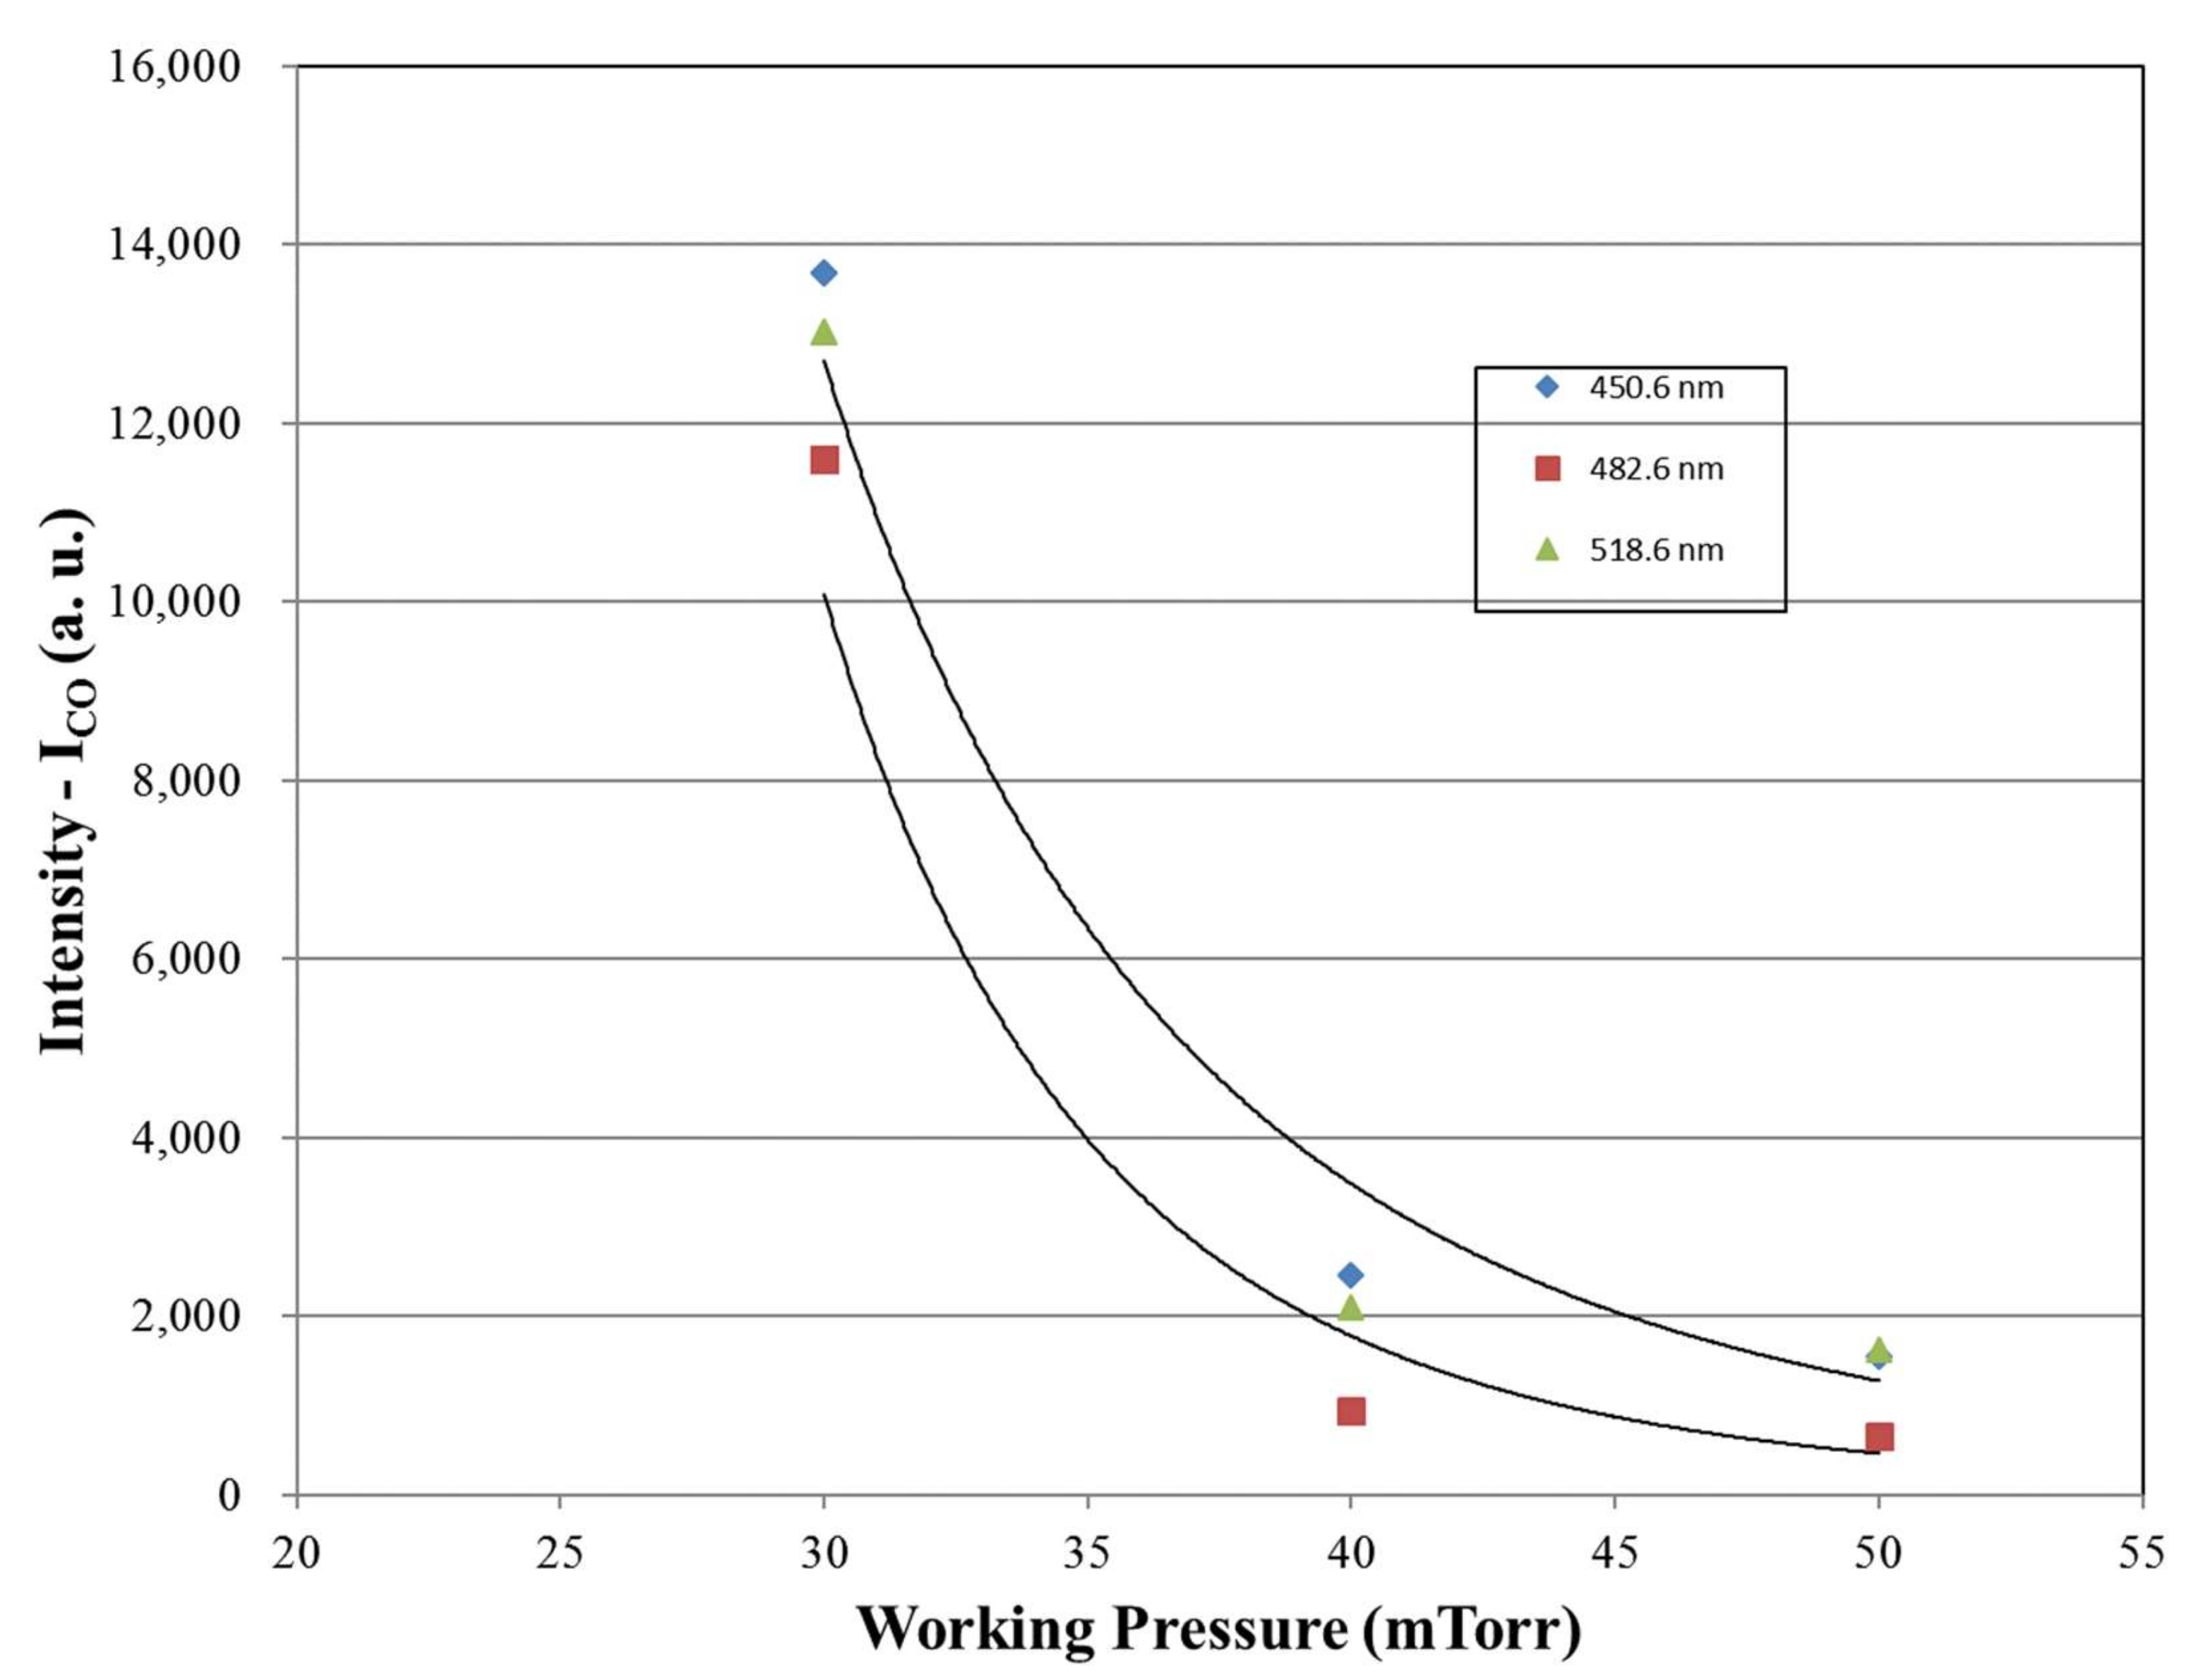
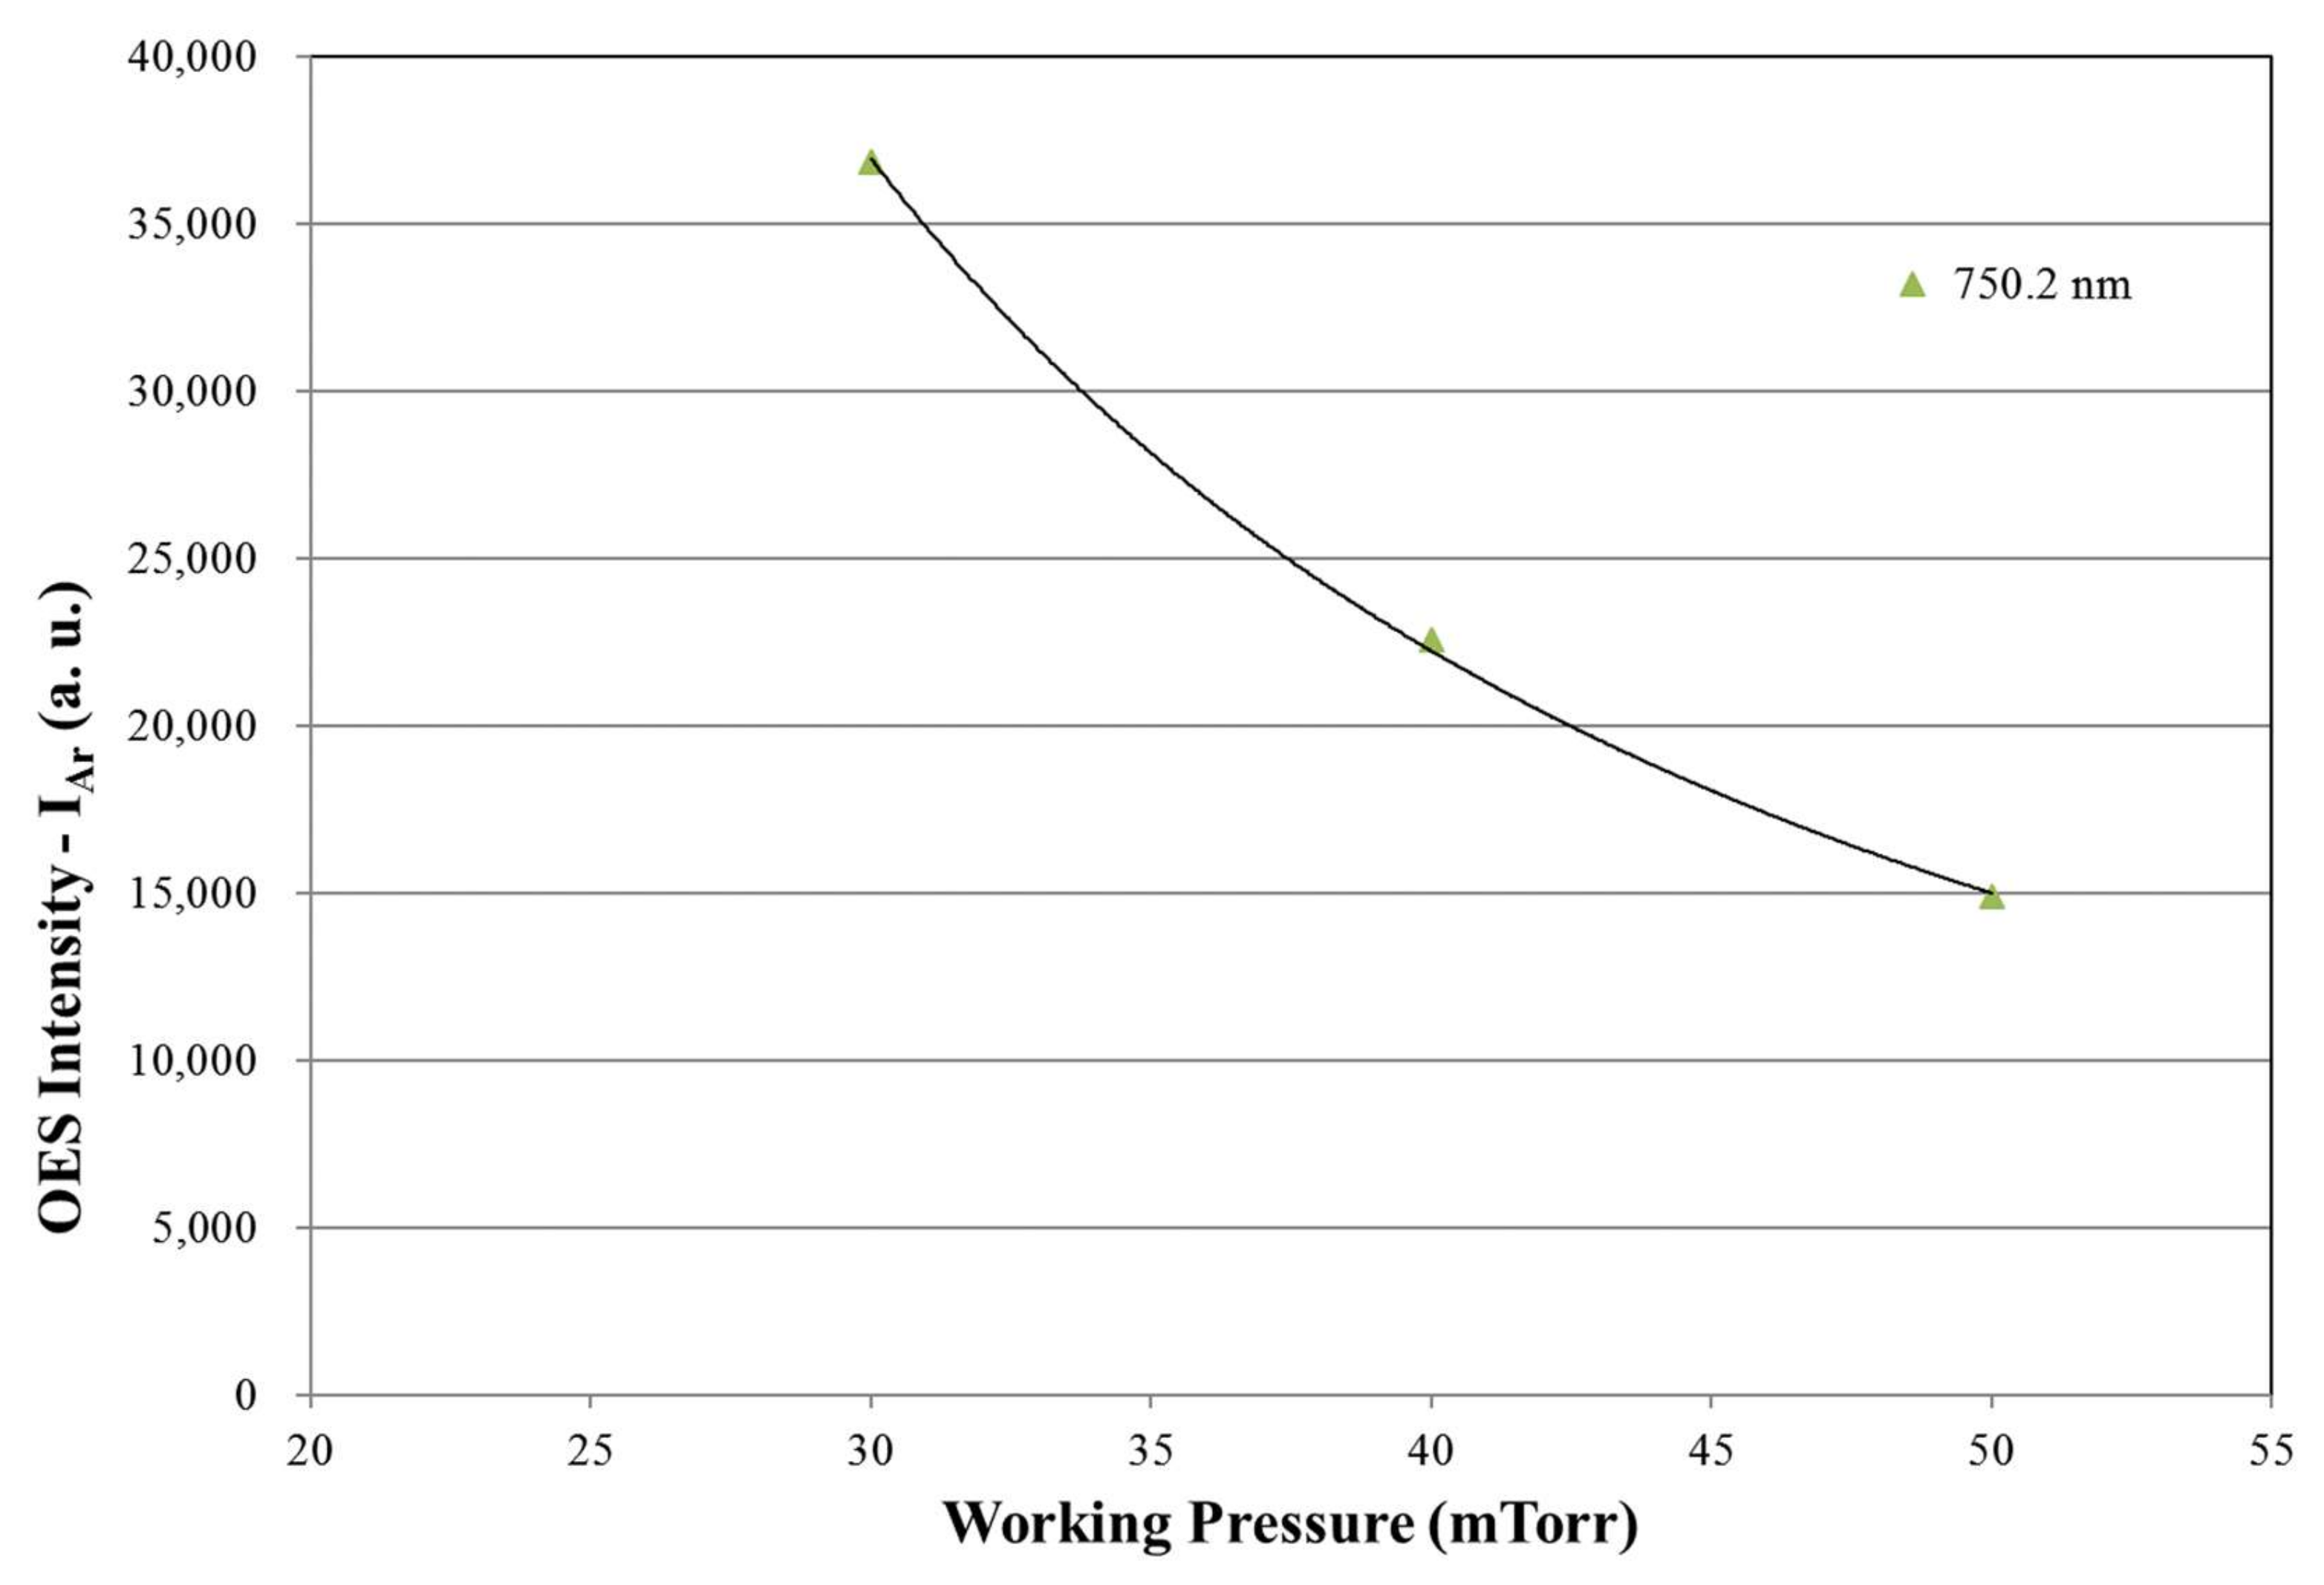
3.2.1. Plasma Characterization

As shown in Table 3, by increasing the working pressure from 30 to 50 mTorr, the electron density decreases, while the electron temperature goes the same way. This means that, with the decrease in working pressure, the degree of plasma ionization would increase. Such regimes with a high ionization degree are attractive for ICP plasma processing [19]. In this situation, the decrease in the particle collision mean free path (MFP) may be attributable for this trend with increasing working pressure. Recently, a review article by Racka-Szmidt et al. confirmed that the ICP system can generate high-density plasma much more easily under a low pressure regime than that of CCP (capacitively coupled plasma), and its density (~1010–1011 cm3) is over an order of magnitude higher than that of the CCP [20]. This is due to the fact that the power can be transferred to the charged particle inside and through the inductive coil or antenna for the ICP processes [7,21]. The effect will be further discussed in the later sections. Here, the decrease in intensity is due to the decrease in the ionization rate, which is caused by too many inefficient collisions. When the working pressure increases with the fixed Ar/MMA volume ratio, the ionization rate of argon, which is affected by the energetic electron’s impact with argon atoms, decreases. In this case, the electron temperature also decreases, as shown in Table 3.

3.2.2. Correlation of Deposition Rate and OES Data

Figure 8 shows the relationship between the deposition rate and working pressure, with the Ar/MMA volume ratio fixed at 0.2. As seen in this figure, the deposition rate first increases with the increase in working pressure, then decreases. This can be explained with the OES data analysis, as shown in Figure 9, Figure 10 and Figure 11. As the OES spectra show, apart from the argon lines, a group of CO, H, and O lines are seen, which is described in Section 3.1.2. According to the results, it can be observed that the OES intensity of the Ar (750.2 nm) peak and CO peaks (450.6, 482.6, and 518.6 nm) decrease inversely with the working pressure. This trend can be explained with the increase in collision frequency, which may not be advantageous with the increase in working pressure with the ICP system. The relationship between collision MFP (λ) and pressure can be expressed as [14]
λ = K/p
where K = a constant depending on the gas, and p = working pressure.
Furthermore, the collision frequency (ν) is expressed as
ν = v/λ
where v is the average velocity of a particle.
According to Figure 10 and Figure 11, the OES intensities of the CO and Ar peaks are clearly related to the collision frequency or MFP. In order to explain the variation in the deposition rate, as a function of working pressure, the intensity ratio of the Ar peak to the CO peaks is shown in Figure 12. As observed in this figure, the trend is found to be similar to that of the deposition rate shown in Figure 8. In other words, it can be summarized that the monomer fragmentation can be enhanced with an optimized working pressure (i.e., 40 mTorr in this study). Even though the plasma intensity is decreased with increased working pressure, the optimized deposition parameters can still be found. The reason for the increase in the deposition rate at the pressure of 40 mTorr may also be related to the Penning effect, as described before. Further study is required to clarify the detailed mechanism.

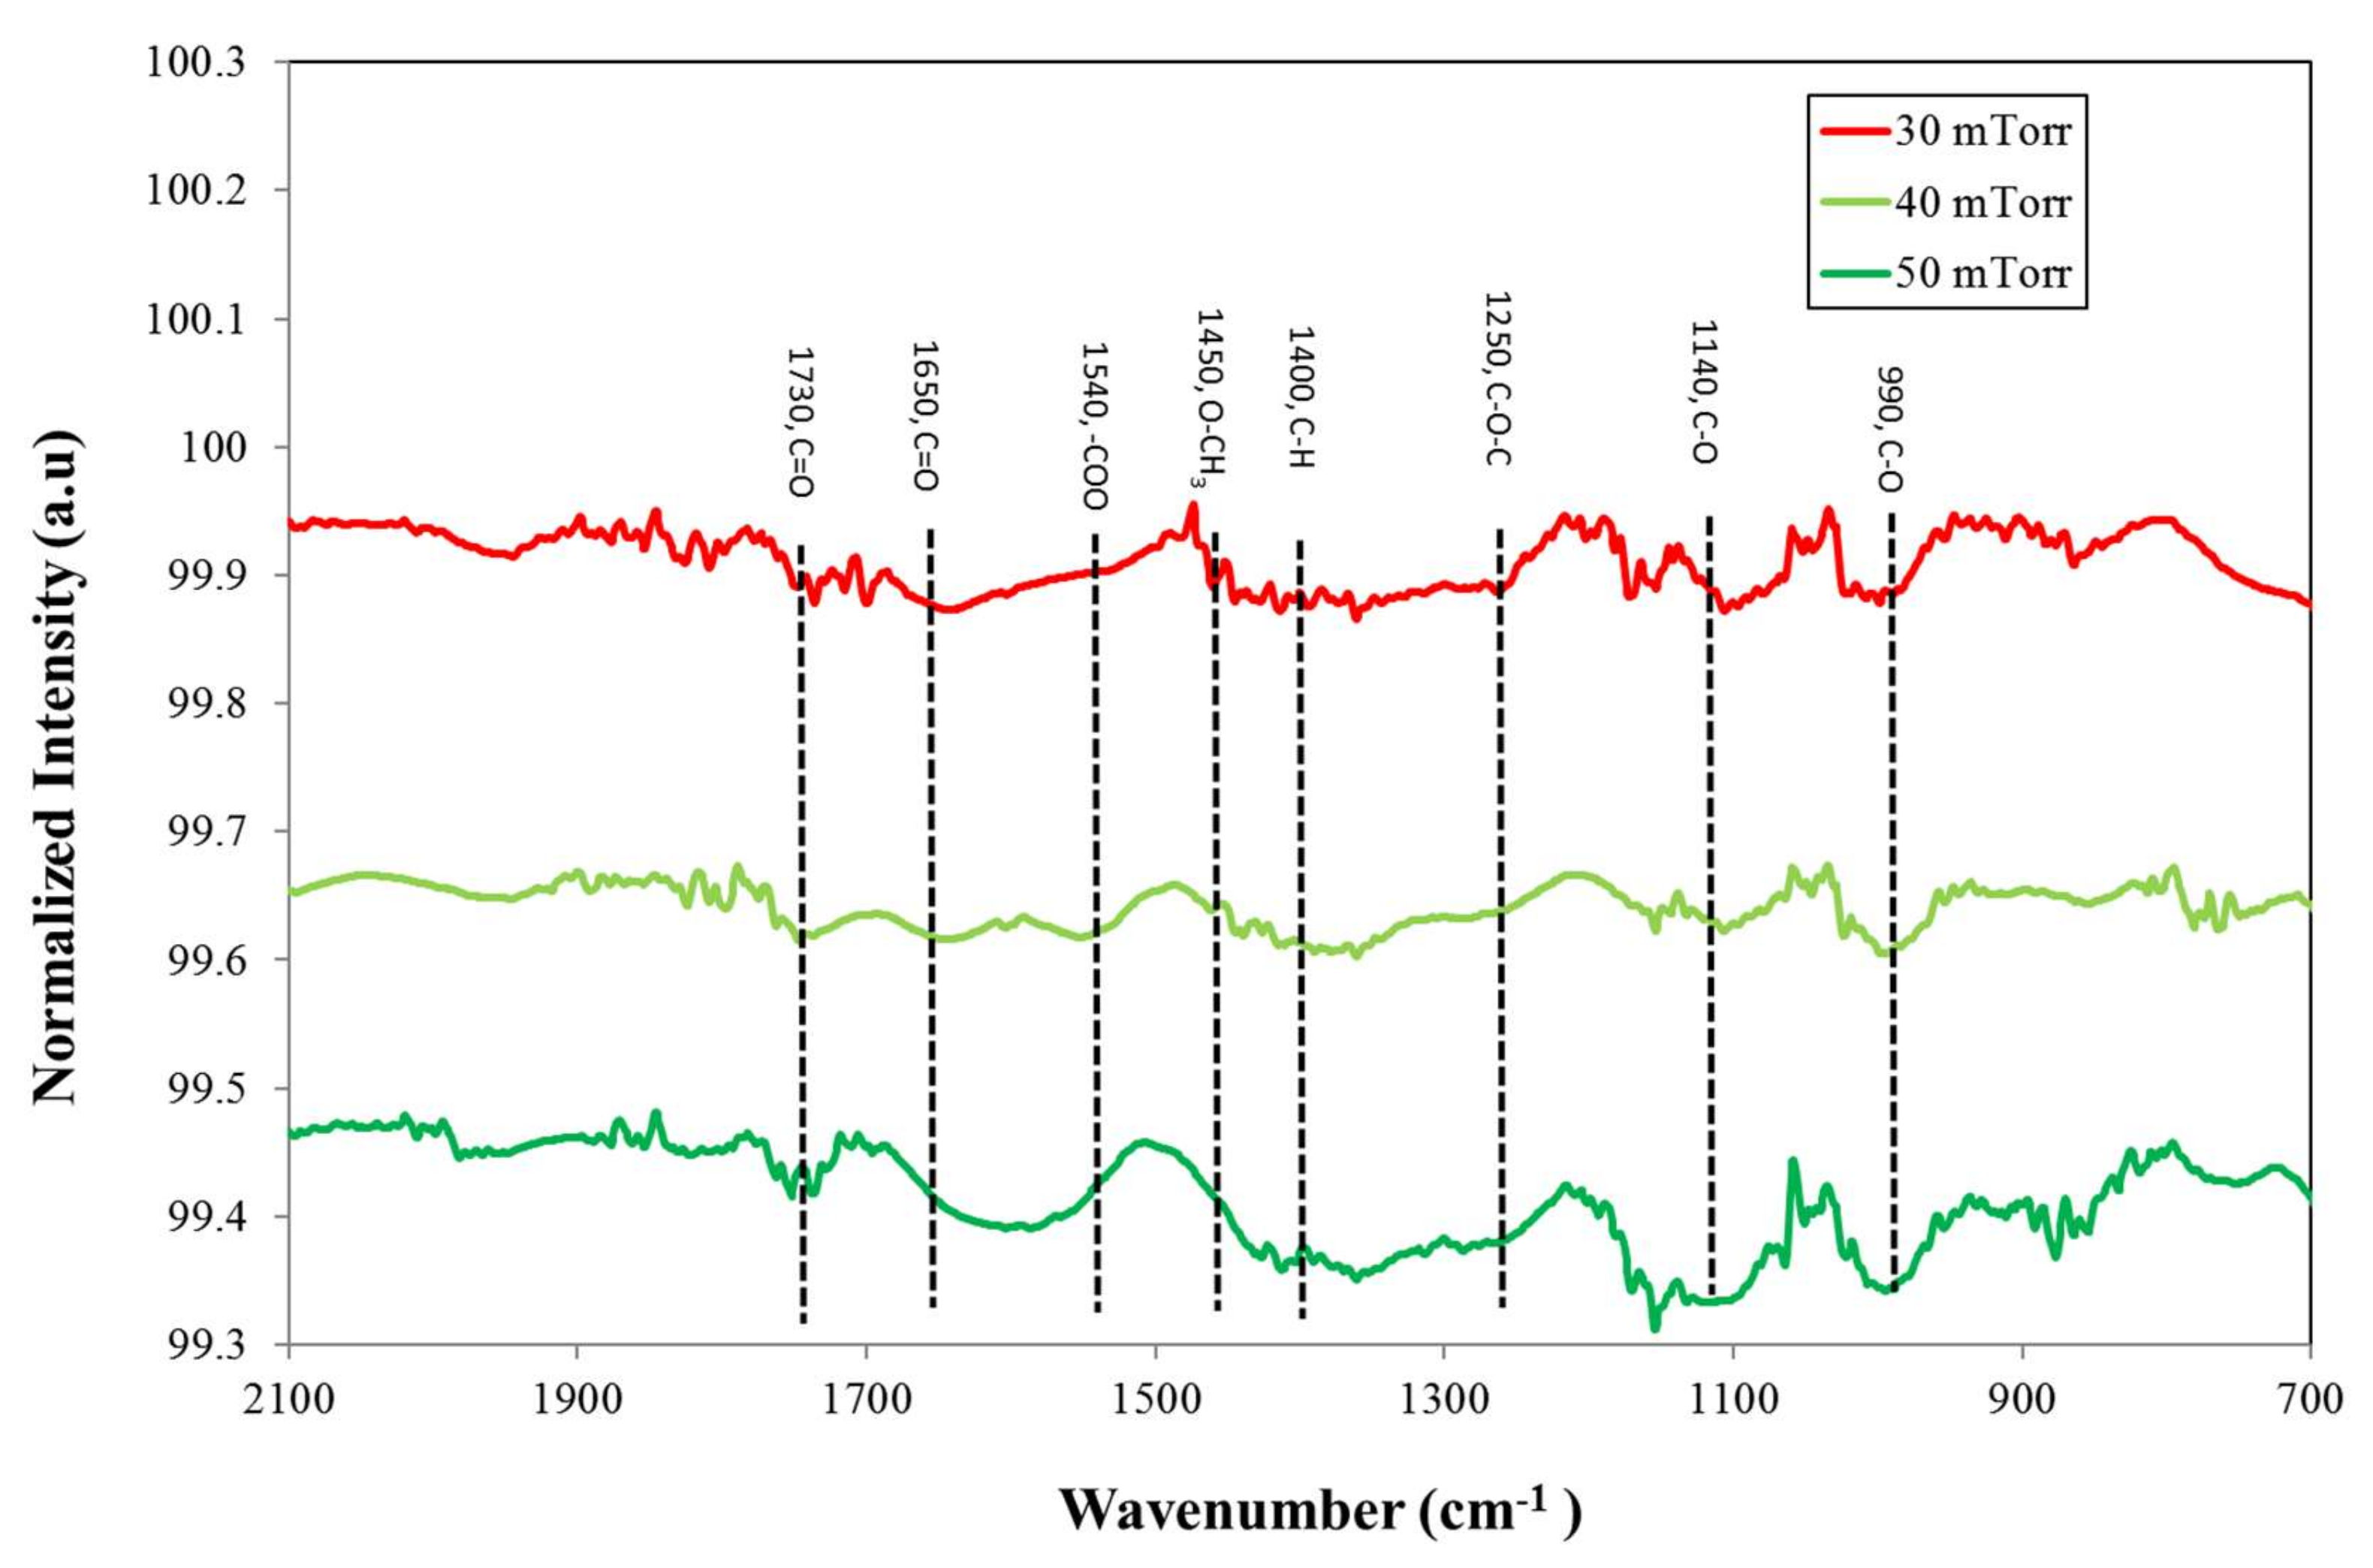
3.2.3. Chemical Bonding Characterization

The deposition of PP-MMA with the variation in working pressure, with the Ar/MMA volume ratio fixed at 0.2, was characterized using ATR-FTIR with transmission mode. The FTIR spectra for these PP-MMA films is shown in Figure 13. The peaks identified are close to those described in Section 3.1.3. According to the Figure, with the working pressure set at 40 mTorr, it is observed that the absorption peaks of C=O (1650 cm−1) and C–O (990, 1140 cm−1) become less obvious. Apparently, this is due to the reduced Ar ion concentration, as shown in Figure 12, which means less Ar ion bombardment at this particular working pressure.

4. Conclusions

The plasma polymerized methyl methacrylate (PP-MMA) films were deposited using internal inductively coupled plasma (ICP) with various Ar/MMA volume ratios (flow rates) and working pressure. The films had different deposition rates that varied with the Ar/MMA volume ratio and working pressure. With the increase in the Ar/MMA volume ratio, the OES intensities of Ar and CO both increase, although the Ar intensity increases much faster than that of CO. The increased CO emission intensity is caused by Penning dissociation/fragmentation due to the collision with metastable Ar atoms. Overall, the sharply increased Ar concentration causes the decrease in the deposition rate due to the dilution effect. With the increase in the working pressure from 30 to 50 mTorr, both the Ar and CO emission intensity decrease inversely with working pressure. However, the intensity ratio of CO to Ar reaches a peak at 40 mTorr, which explains the existence of an optimized working pressure of 40 mTorr for the highest deposition rate with the studied ICP system. This means that too many particle collisions may not be beneficial for high plasma intensity and, therefore, the high deposition rate.
According to FTIR analyses, the films’, C=O (1650 cm−1) and CO (990, 1140 cm−1), peaks changed with the different deposition parameters. The higher the Ar ion concentration is, the more obvious these peaks are. Apparently, Ar ion bombardment during the process plays a critical role.

Author Contributions

Conceptualization, J.-H.H. and C.L.; methodology, J.-H.H. and W.W.; validation, J.-H.H. and C.L.; investigation, S.T.H., H.M. and N.B.; writing—original draft preparation, S.T.H. and J.-H.H.; writing—review and editing, C.L.; supervision, C.L. and J.-H.H.; project administration, J.-H.H.; funding acquisition, J.-H.H. All authors have read and agreed to the published version of the manuscript.

Funding

This work was supported in part by the Ministry of Science and Technology, Taiwan under Grant MOST 105-2221-E-131-003-MY2.

Institutional Review Board Statement

Not applicable.

Informed Consent Statement

Not applicable.

Data Availability Statement

Not applicable.

Conflicts of Interest

The authors declare no conflict of interest.

References

  1. Park, C.S.; Jung, E.Y.; Jang, H.J.; Bae, G.T.; Shin, B.J.; Tae, H.S. Synthesis and properties of plasma-polymerized methyl methacrylate via the atmospheric pressure plasma polymerization technique. Polymers 2019, 11, 396. [Google Scholar] [CrossRef] [PubMed] [Green Version]
  2. Abdel–Fattah, E. Surface activation of poly(methyl methacrylate) with atmospheric pressure Ar + H2O plasma. Coatings 2019, 9, 228. [Google Scholar] [CrossRef] [Green Version]
  3. Faupel, F.; Zaporojtchenko, V.; Strunskus, T.; Elbahri, M. Metal-polymer nanocomposites for functional applications. Adv. Eng. Mater. 2010, 12, 1177–1190. [Google Scholar] [CrossRef]
  4. Friedrich, J. Mechanisms of plasma polymerization-reviewed from a chemical point of view. Plasma Process. Polym. 2011, 8, 783–802. [Google Scholar] [CrossRef]
  5. Rich, S.A.; Yedji, M.; Amadou, J.; Terwagne, G.; Felten, A.; Avril, L.; Pireaux, J.J. Polymer coatings to functionalize carbon nanotubes. Phys. E Low Dimens. Syst. Nanostruct. 2012, 44, 1012–1020. [Google Scholar] [CrossRef]
  6. Mishra, H.; Bolouki, N.; Hsieh, S.T.; Li, C.; Wu, W.; Hsieh, J.H. Application of spectroscopic analysis for plasma polymerization deposition onto the inner surfaces of silicone tubes. Coatings 2022, 12, 865. [Google Scholar] [CrossRef]
  7. Kim, T.H.; Yeom, G.Y. A review of inductively coupled plasma-assisted magnetron sputter system. Appl. Sci. Converg. Technol. 2019, 28, 131–138. [Google Scholar] [CrossRef]
  8. Lee, C.H.C. Review of inductively coupled plasmas: Nano-applications and bistable hysteresis physics. Appl. Phys. Rev. 2018, 5, 011108. [Google Scholar] [CrossRef]
  9. Setsuhara, Y.; Kamai, M.; Miyake, S.; Musil, J. Inductive-ly-coupled-plasma-assisted planar magnetron discharge for enhanced ionization of sputtered atoms. Jpn. J. Appl. Phys. 1997, 36, 4568. [Google Scholar] [CrossRef]
  10. Hsieh, S.T.; Hsieh, J.H.; Li, Y. PMMA and PMMA-Ag thin films deposited by a system combining inductively coupled plasma polymerization and RF sputtering. Int. J. Nanotechnol. 2017, 14, 977–991. [Google Scholar] [CrossRef]
  11. Li, C.; Hsieh, J.H.; Hu, W.W.; Lin, Y.H. Fabrication and characterization of polymethylmethacrylate (PMMA) thin film by plasma polymerization used for cell culture. Surf. Coat. Technol. 2014, 259, 20–26. [Google Scholar] [CrossRef]
  12. Fiebrandt, M.; Bibinov, N.; Awakowicz, P. Determination of atomic oxygen state densities in a double inductively coupled plasma using optical emission and absorption spectroscopy and probe measurements. Plasma Sources Sci. Technol. 2020, 29, 045018. [Google Scholar] [CrossRef]
  13. Boogaard, A.; Kovalgin, A.Y.; Aarnink, A.A.I.; Wolters, R.A.M.; Holleman, J.; Brunets, L.; Schmitz, J. Measurement of Electron Temperatures of Argon Plasmas in a High-Density Inductively-Coupled Remote Plasma System by Langmuir Probe and Optical-Emission Spectroscopy. In Proceedings of the 9th Annual Workshop on Semiconductor Advances for Future Electronics and Sensors, Veldhoven, The Netherlands, 23–24 November 2006; pp. 412–418. [Google Scholar]
  14. Grill, A. Cold Plasma in Materials Fabrication: From Fundamentals to Applications; Wiley-IEEE Press: Hoboken, NJ, USA, 1994; pp. 13–15. [Google Scholar]
  15. Singho, N.D.; Lah, N.A.C.; Johan, M.R.; Ahmad, R. FTIR studies on silver-poly(methylmethacrylate) nanocomposites via in-situ polymerization technique. Int. J. Electrochem. Sci. 2012, 7, 5596–5603. [Google Scholar]
  16. Duan, G.; Zhang, C.; Li, A.; Yan, X.; Lu, L.; Wang, X. Preparation and characterization of mesoporous zirconia made by using a poly (methyl methacrylate) template. Nanoscale Res. Lett. 2008, 3, 118–122. [Google Scholar] [CrossRef] [PubMed] [Green Version]
  17. Arulsankar, A.; Kulasekarapandian, K.; Jeya, S.; Jayanthi, S.; Sundaresan, B. Investigation of the structural, electrical and morphological properties of Mg2+ ion conducting nanocomposite solid polymer electrolytes based on PMMA. Int. J. Innov. Res. Sci. Eng. Technol. 2013, 2, 4883–4890. [Google Scholar]
  18. Aouachria, K.; Bensera, N.B. Miscibility of PVC/PMMA blends by vicat softening temperature, viscometry, DSC and FTIR analysis. Polym. Test. 2006, 25, 1101–1108. [Google Scholar] [CrossRef]
  19. Meshcheryakova, E.; Zibrov, M.; Kaziev, A.; Khodachenko, G.; Pisarev, A. Langmuir probe diagnostics of low-pressure inductively coupled argon plasmas in a magnetic field. Phys. Procedia 2015, 71, 121–126. [Google Scholar]
  20. Racka-Szmidt, K.; Stonio, B.; Zelazko, J.; Filipiak, M.; Sochacki, M. A review: Inductively coupled plasma reactive ion etching of silicon carbide. Materials 2022, 15, 123. [Google Scholar] [CrossRef] [PubMed]
  21. Chun, S.Y. Changes of crystal structure and microstructure of MoN coatings in accordance with inductively coupled plasma power. Coatings 2021, 11, 1351. [Google Scholar] [CrossRef]
Figure 1. (a) Schematic drawing of plasma chamber with ICP coil and two sputtering guns, (b) schematic representation of the plasma process to synthesize ICP PP-MMA films, (c) possible bond breakages of monomer.
Coatings 12 01014 g001
Figure 2. Deposition rates as a function of Ar/MMA volume ratio.
Coatings 12 01014 g002
Figure 3. OES spectra of plasma for various Ar/MAA volume ratios.
Coatings 12 01014 g003
Figure 4. OES intensity of CO (ICO) vs. Ar/MMA volume ratio. CO peaks appears at 450.6, 482.6, and 518.6 nm.
Coatings 12 01014 g004
Figure 5. OES intensity of Ar vs. Ar/MMA volume ratios. The Ar peak appears at 750.2 nm.
Coatings 12 01014 g005
Figure 6. OES intensity ratio of Ar peak to CO peaks vs. Ar/MMA volume ratios.
Coatings 12 01014 g006
Figure 7. The FTIR spectra for PP-MMA films deposited with the variation in Ar/MMA volume ratios.
Coatings 12 01014 g007
Figure 8. Deposition rates as a function of working pressure.
Coatings 12 01014 g008
Figure 9. OES spectra of plasma for various working pressures.
Coatings 12 01014 g009
Figure 10. OES intensity of CO (ICO) vs. working pressure. CO peaks appear at 450.6, 482.6, and 518.6 nm.
Coatings 12 01014 g010
Figure 11. OES intensity of Ar vs. working pressure. The Ar peak appears at 750.2 nm.
Coatings 12 01014 g011
Figure 12. OES intensity ratio of Ar peak to CO peaks vs. working pressure.
Coatings 12 01014 g012
Figure 13. The FTIR spectra for PP-MMA films deposited with the variation in working pressure.
Coatings 12 01014 g013
Table 1. Process parameters for MMA plasma polymerization. (varying Ar/MMA volume ratio and working pressure).
I. 
Deposition Process Parameters (Varying Ar–MMA Ratio)
ICP coil power (RF,W)30
Carbon target power (RF,W)15
RF frequency (MHz)13.56
Ar–MMA volume ratio1:11/1:5/1:3/1:2/1:1
Total working pressure (mTorr)30
Deposition time (min)30
II. 
Deposition Process Parameters (Varying Working Pressure)
ICP coil power (RF, W)30
Carbon target power (RF, W)15
RF frequency (MHz)13.56
Ar–MMA volume ratio1:5
Total working pressure (mTorr)30/40/50
Deposition time (min)30
Note: 1 mTorr = 0.133 Pa.
Table 2. Results of calculations for Te and ne, as well as Debye length, as a function of Ar and MMA volume ratio. (1 mTorr = 0.133 Pa).
Total Pressure (mTorr)Argon Partial Pressure (mTorr)MMA Partial Pressure
(mTorr)
Ar/MMA Volume RatioElectron Temperature (eV)Electron Density (cm−3) Debye Length (mm)
302.527.50.0091.23.3 × 10110.0141
305250.21.13.5 × 10110.0131
307.522.50.330.903.9 × 10110.0113
3010200.50.864.1 × 10110.0108
3015151.00.844.3 × 10110.0104
Table 3. Results of calculations for Te and ne, as well as Debye length, as a function of working pressure. (1 mTorr = 0.133 Pa).
Total Pressure (mTorr)Argon Partial Pressure (mTorr)MMA Partial Pressure
(mTorr)
Ar/MMA Volume RatioElectron Temperature (eV)Electron Density (cm−3)Debye Length (mm)
305.0250.21.13.5 × 10110.0131
406.733.30.21.063.2 × 10110.0134
508.441.60.21.012.8 × 10110.014
Publisher’s Note: MDPI stays neutral with regard to jurisdictional claims in published maps and institutional affiliations.

