Article

Application of Spectroscopic Analysis for Plasma Polymerization Deposition onto the Inner Surfaces of Silicone Tubes

1
Faculty of Mathematics and Physics, Charles University, 180 00 Prague, Czech Republic
2
Department of Physical Electronics, Faculty of Science, Masaryk University, 601 77 Brno, Czech Republic
3
Center for Plasma and Thin Film Technologies, Ming Chi University of Technology, New Taipei City 24301, Taiwan
4
Materials Science and Engineering Program, University of California, Riverside, CA 92521, USA
5
Department of Biomedical Engineering, National Yang Ming Chiao Tung University, Hsinchu 300093, Taiwan
6
Metals Research and Development Center, National Chung Hsing University, Taichung 402, Taiwan
7
Department of Chemical and Materials Engineering, Center for Green Technology, Chang Gung University, Taoyuan City 33302, Taiwan
*
Authors to whom correspondence should be addressed.
Coatings 2022, 12(6), 865; https://doi.org/10.3390/coatings12060865
Submission received: 9 May 2022 / Revised: 12 June 2022 / Accepted: 15 June 2022 / Published: 19 June 2022
(This article belongs to the Section Plasma Coatings, Surfaces & Interfaces)

Abstract

:
In the current study, plasma-polymerized methyl methacrylate (PP-MMA) generation on the inner surface of a silicone tube was performed in a capacitively coupled discharge reactor. The possibility of generating plasma inside the tube was analyzed and calculated by using optical emission spectroscopy (OES). A hollow cathode model was first proposed to determine whether plasma discharge would be generated inside the tube in the low-pressure regime. Since the ignition of plasma inside the tube is necessary for the initiation of polymerization processes, the sheath thickness was calculated analytically. To achieve the goal, the electron temperature and density of plasma should be determined beforehand. In this study, the electron temperature and plasma density were measured and calculated according to OES spectra using both the modified Boltzmann plot and the line-ratio method. The results reveal that the occurrence of plasma inside the tube can be achieved if the tube’s inner diameter is greater than two times the thickness of the sheath. The effect of methyl methacrylate (MMA) monomer concentration on sheath thickness, and, hence, plasma generation and deposition, was investigated in the presence of argon plasma and MMA monomer. According to the study, one could control the ignition of plasma discharges inside the tube followed by plasma polymerization deposition. The OES method was also applied to identify the presence of the excited species related to the fragmented monomer. The deposition of PP-MMA films on the inner surface of the tube was confirmed via attenuated total reflection Fourier transform infrared (ATR-FTIR) spectroscopy.

1. Introduction

Coatings and surface modifications are widely used for various purposes, such as surface protection [1], bioactivity [2], food processing [3], gas separation [4], water purification [5], microfluidic devices [6], and micro-/nano-molding processes [7]. However, regarding tubes’ inner surface coatings and/or modifications, few articles have been produced to date. In a previous study, the inner surface of a microporous alumina tube was coated with an alumina layer using the electrophoretic deposition process [8,9]. Other studies reported various coatings on the inner surface of a tubular sample by using grid enhancement [3], gas separation [4], and micro-/nano-molding processes [7]. To date, there is no report on carrying out a plasma polymerization process that resulted in a uniform coating on a tube’s inner surface.
Here, we employed the plasma polymerization process to coat the inner surface of a silicone tube. Silicone was chosen because it is a nontoxic, biocompatible, and highly elastic material [10,11]. Plasma polymerization [12] is a process applied for the formation of polymeric materials under low-temperature plasma. The process is capable of producing thin films with thicknesses that range from a nanometer to a micrometer. In the presence of glow discharge, the monomer is fragmented, which leads to many chemically reactive species. In this process, the fragmented monomers can be directly attached to the desired surface, thus forming polymeric chains. This is applicable to pinhole-free coatings with solvent insoluble polymers. The polymerization process is normally carried out in a low-pressure regime as it leads to good uniformity [13] and adhesion [14]. However, low-pressure plasma becomes challenging when attempting to produce a coating on the inner surface of tubes, because plasma may not be generated inside them, especially when they have small diameters in the order of several millimeters. This is attributed to the inherently formed plasma sheath (also called dark space) at the plasma–solid interface.
In the present study, a silicone tube was used as the model material. A hollow cathode model was first proposed in an attempt to determine plasma discharge can be generated in low-pressure plasma. It was found that a coating on the inner surface of a silicone tube can be achieved if the plasma discharge takes place inside the tube despite the presence of plasma in the reactor chamber. The occurrence of plasma inside the tube can be achieved under the condition that the plasma sheath thickness is smaller than the radius of the tube. In other words, the sheath thickness determines the possibility of plasma occurrence inside the tube. Hence, we were motivated to propose an analytical approach to calculating the sheath thickness inside a hollow cathode (tube) to judge the conditions for generating plasma inside the tube. It is known that the sheath thickness is related to plasma parameters such as electron density (ne), electron temperature (Te), and Debye length; thus, ne and Te were measured according to the plasma emission spectra obtained using optical emission spectroscopy (OES). The modified Boltzmann plot and line-ratio method were utilized to calculate Te and ne, respectively. Furthermore, the methyl methacrylate (MMA) monomer amount inside the chamber was used as a major variable, which provided the variation of plasma characteristics that occurred inside the chamber and the tube. In instances where plasma was generated inside the tube, plasma-polymerized-methyl methacrylate (PP-MMA) was deposited on the inner surface of the silicone tube. A PP-MMA coating was selected because it is a transparent, chemically stable thermoplastic material. It is suitable for many microelectronic and biomedical applications. For example, PP-MMA films can be used as photoresist masks in microelectronic processing. Recently, it has shown great potential in the growing field of biomedical research. The proved applications include patterned PP-MMA films for protein attachment and cell culturing, microfluidic devices, artificial cornea, and stents for growing osteoblast tissues [15,16].
After the deposition process was finished, the plasma-polymerized inner surface of the silicone tube was characterized via attenuated total reflection Fourier transform infrared (ATR-FTIR) spectroscopy used for binding. A surface profiler (Surfcoder, Kosaka) was used to determine surface thickness and, hence, the deposition rate.

2. Optical Emission Spectroscopic Analysis

2.1. Calculation of Electron Temperature and Density

The measurement and/or calculation of Te and ne can be typically performed using the Langmuir probe [17] and optical emission spectroscopy (OES) [18] in low-pressure plasma. However, in the case of applying the Langmuir probe, the probe tip is easily contaminated by the monomer during the polymerization process, resulting in inaccurate data. Moreover, inserting an external probe inside a vacuum chamber may cause possible perturbation. Therefore, OES as a nonintrusive method can be utilized to determine Te and ne for estimations of the sheath thickness. Here, the modified Boltzmann method [19] and the line-ratio method [20] were deployed for Te and ne measurements, respectively.
The Boltzmann plot technique is an established method used to estimate the electron temperature. However, in low-pressure plasma, this technique does not represent the estimation of the electron temperature. The excited species are not in Boltzmann equilibrium when in a vacuum condition, and, thus, excitation and de-excitation are not controlled by electron collisions. In this case, the excitation and electron temperatures are not assumed to be the same. To solve this issue, the estimation of electron temperature is proposed by using modified Boltzmann plot techniques, which are expressed mathematically in the following equation: [19]
  ln ( ( I i j Σ i > j   A i j )   / ( h v i j A i j   b 1 i ) ) = E 1 i k T e + D
where Iij is the relative intensity (arbitrary units) of the emission lines of argon in the energy levels i and j, and Aij is the transition probability for spontaneous radiative emission. hvij is the energy gap; Ei is the excitation energy (eV) corresponding to the wavelengths (λij) of 694.1, 714.8, 731.7, and 750.7 nm; k is the Boltzmann constant; and D is the constant value. By considering the left-hand side of the Equation (1) as a function of Ei, the inverse of the slope related to the best linear fitting of Equation (1) gives Te, as shown in Figure 1.
There are several OES techniques that can be used to determine the electron density by considering pressure and plasma density regimes. In the low-temperature and low-density argon plasma (less than 1013 cm−3), the relation between the electron density and emission line intensities was investigated and proposed by using the line-ratio method [20] as follows:
I 1   I 2 = Q a p p , 1 Q a p p , 2 .   1 + n e n e C , 2 1 + n e n e C , 1
where I1 and I2 are the intensities of the emission lines of argon related to the wavelengths of 357.2 nm and 750.4 nm, respectively. The subscripts of 1 and 2 present two different excitation levels associated with those wavelengths. Qapp,g is an excitation rate coefficient that is considered to be constant. nec,i is the electron density when the total rate of electron impact transition is equal to the rate of spontaneous radiation. This value is assumed to be constant and dependent on the excitation level and the discharge conditions. The parameters in Equation (2) are chosen by a proper pair of levels with nec values comparable to the electron density in order to employ the equation effectively.

2.2. Sheath Thickness

The word “sheath” in connection with plasma was proposed by Irving Langmuir [14] to describe a thin region formed by a space charge that joins the plasma bulk to a material surface. The material surface might be the metal walls of a vacuum chamber confining the plasma. Generally, the sheath thickness has the order of magnitude of a few Debye lengths (λD). λD depends on the square root ratio of electron temperature (Te) and electron density (ne) values. Therefore, as mentioned before, the calculation of ne and Te as the plasma parameters is required to evaluate the sheath thickness. λD is given by:
λD = (ε0kBTe/e2ne)1/2 = 743 (Te/ne)1/2 (cm)
Here, kB is the Boltzmann constant, ε0 is the permittivity of free space, e is the electron charge in the coulomb, Te is the electron temperature in eV, and ne is the electron density in cm−3.
The electron temperature and electron density measured via Equations (1) and (2) using the emission spectra can be used to estimate the sheath thickness that is related to the Debye length, as shown below in Equation (4) [21,22]. At a higher pressure, when the mean free path is much less than the thickness of the plasma sheath, the thickness of the plasma sheath can be calculated using Equation (4):
Ds ~ η2/3 λD
Here, Ds is the plasma sheath thickness in cm, λD is the Debye length in cm, and η is the coefficient whose value is expressed as follows in Equation (5):
η = e (Vp − Vb/k Te)
Vb = −(Vp (Ab/Ap)3.2)
where Vp is plasma potential in volt, k is the Boltzmann constant, e is the electron charge in coulomb, Vb is the biased potential in volt, Ab is the area of the ground electrode including the wall in cm2, and Ap is the area of the power electrode in cm2.

3. Materials and Methods

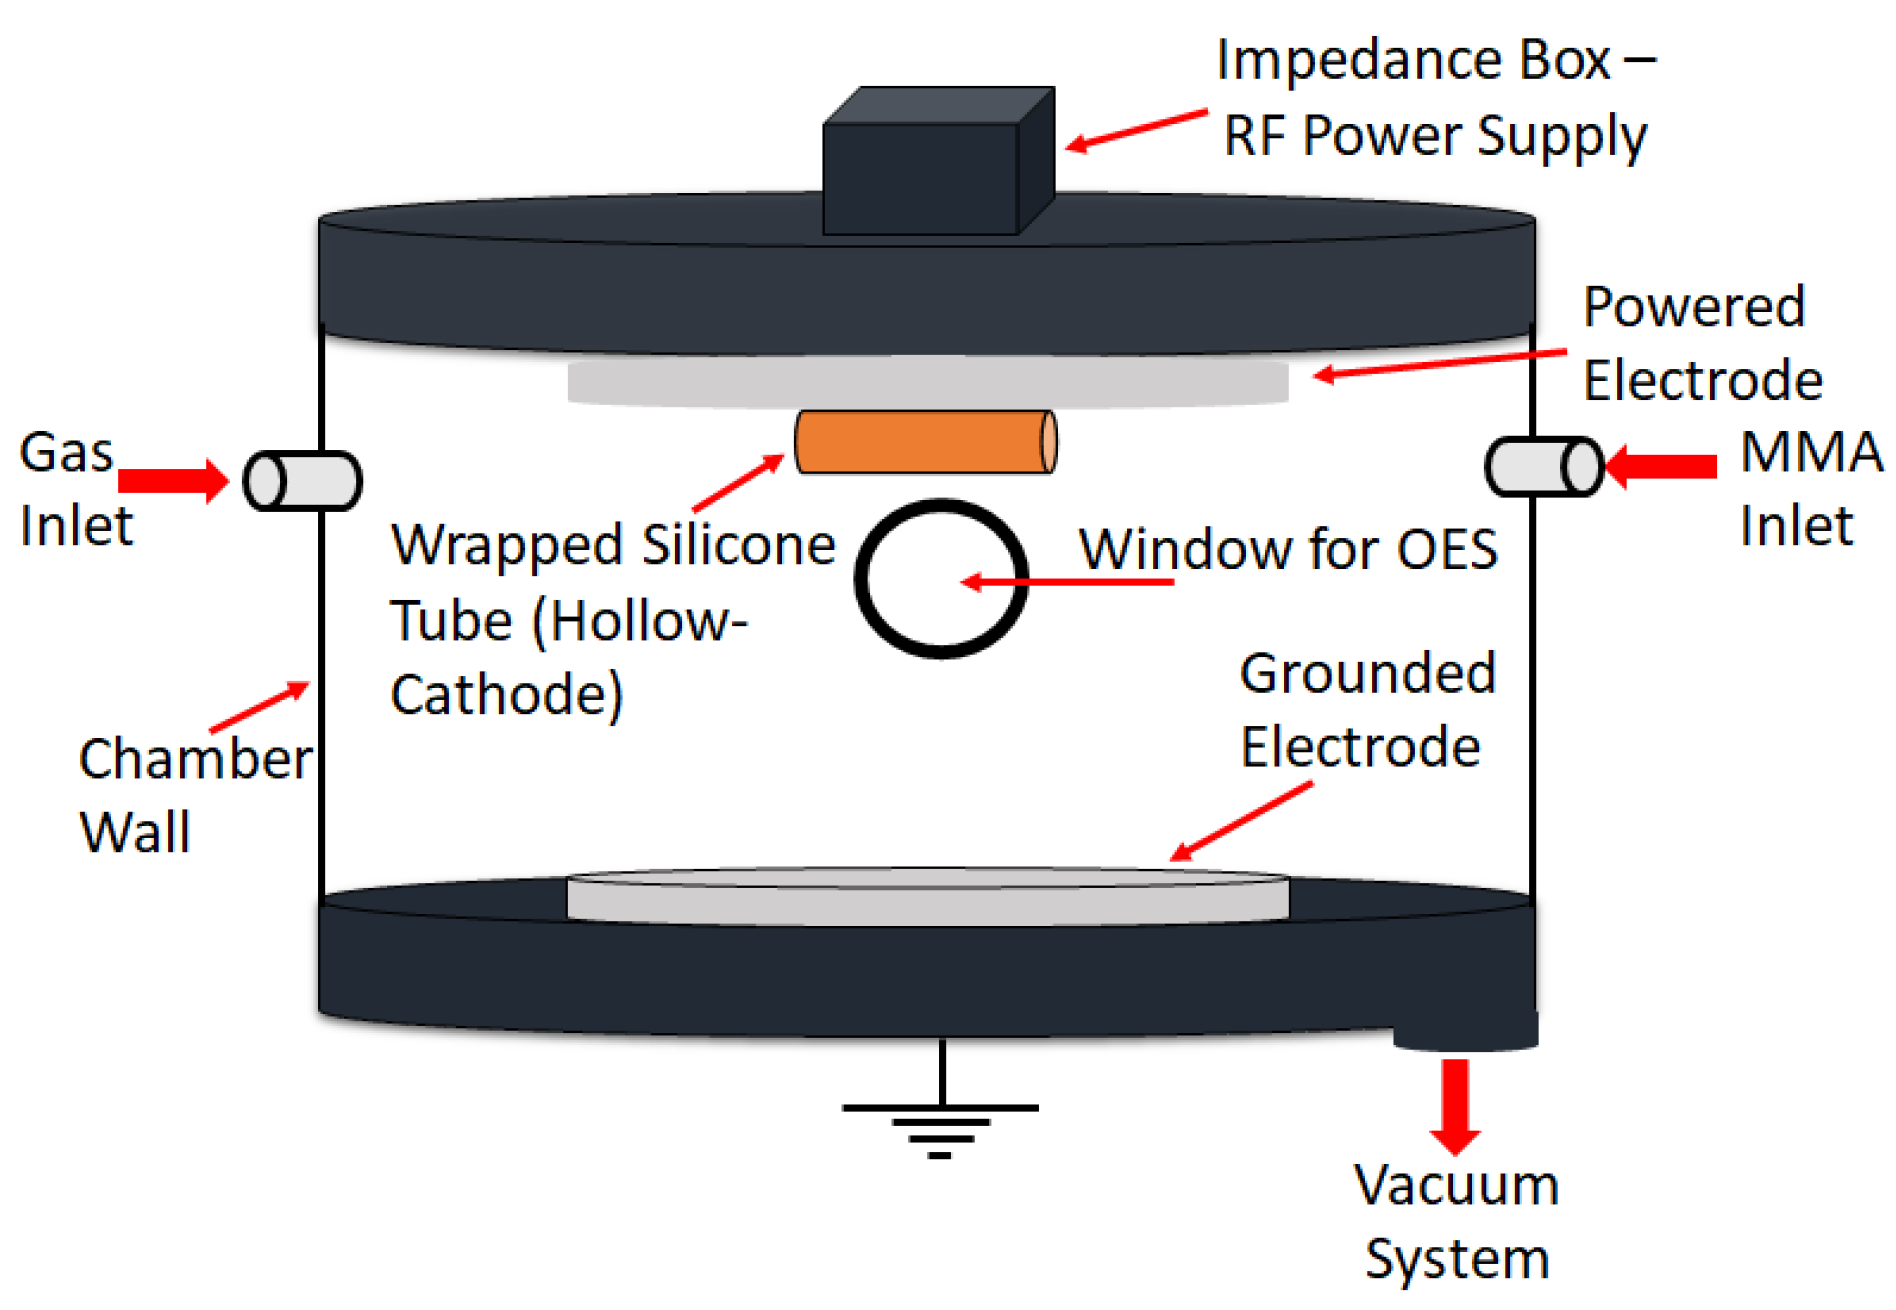
3.1. Plasma Source and Polymerization Process

The schematic diagram for the plasma polymerization of MMA was created using a capacitively coupled RF (radio frequency) plasma reactor, as shown in Figure 2. The setup consisted of a stainless steel chamber housing (30 cm in diameter), attached to powered and grounded electrodes, each 24.5 cm in diameter. The RF power supply operated with a reflected power below 1 W, which was achieved within 10 s after plasma ignition. The pressure inside the chamber was measured using a vacuum gauge (Convec Torr P-type with Multi-Gauge Controller, Varian, Fort Lauderdale, FL, USA). The chamber was thoroughly cleaned with acetone and alcohol using Kim-wipes paper to remove any possible containment before each process. The silicone tube with an inner diameter of 6 mm and a length of 8 cm (wrapped with copper foil) was attached to the powered electrode. Once the vacuum pressure was stabilized, the valve connecting the tubes to the MMA (99%, 30 ppm 4-methoxyphenol (MEHQ) as an inhibitor, ready-to-use form) monomer bottle and Ar gas chamber was opened until the chamber pressure reached the desired level indicated by the pressure gauge. The RF power source (13.56 MHz) was then turned on to start the process of polymerization. The deposition time was 30 min. The MMA monomer flew into the chamber driven by the pressure difference between the chamber and the container of monomers. After the polymerization process, the samples were wrapped in paraffin and stored in a Petri dish for material characterization. The process parameters for the experiment of PP-MMA plasma polymerization are shown in Table 1.

3.2. Material Characterization

The chemical bonding of the deposited polymer material was investigated using attenuated total reflection Fourier transform infrared spectrometry (ATR-FTIR, Perkin-Elmer Pentagon 1005, Washington, DC, USA) in the range of 600–2500 cm−1 with a resolution of 1 cm−1, in transmission mode with 20 scans. Figure 3a shows the tube with a length of 8 cm and an internal diameter of 6 mm. The tube was cut into 1 cm equal sections for ATR-FTIR analysis as shown in Figure 3b. These 1 cm sections were cut in half from the middle as shown in Figure 3c, and they were later manually made flat for our FTIR study as shown in Figure 3d. For the purpose of FTIR analysis, 8 sections out of a total of 16 equal-cut tube sections were selected. A surface profiler (Surfcoder, Kosaka, Tokyo, Japan) was used to determine PP-MMA film thickness.

3.3. Diagnostics of Plasma Using OES

The chamber was equipped with a quartz viewport, which allowed plasma-emitted lights, including those initiated inside and outside the tube, to pass through and be captured by the spectrometer. The captured OES spectra were later used for plasma diagnostics. An Avantes ULS2048L spectrometer with a wavelength range of 200–1100 nm and a spectral resolution of 1.4 nm was employed in our study. For all the OES experiments, the quartz viewport was transparent, and a collecting lens was attached to the quartz viewport to capture the emission spectra inside the chamber during the plasma polymerization process.

4. Results and Discussion

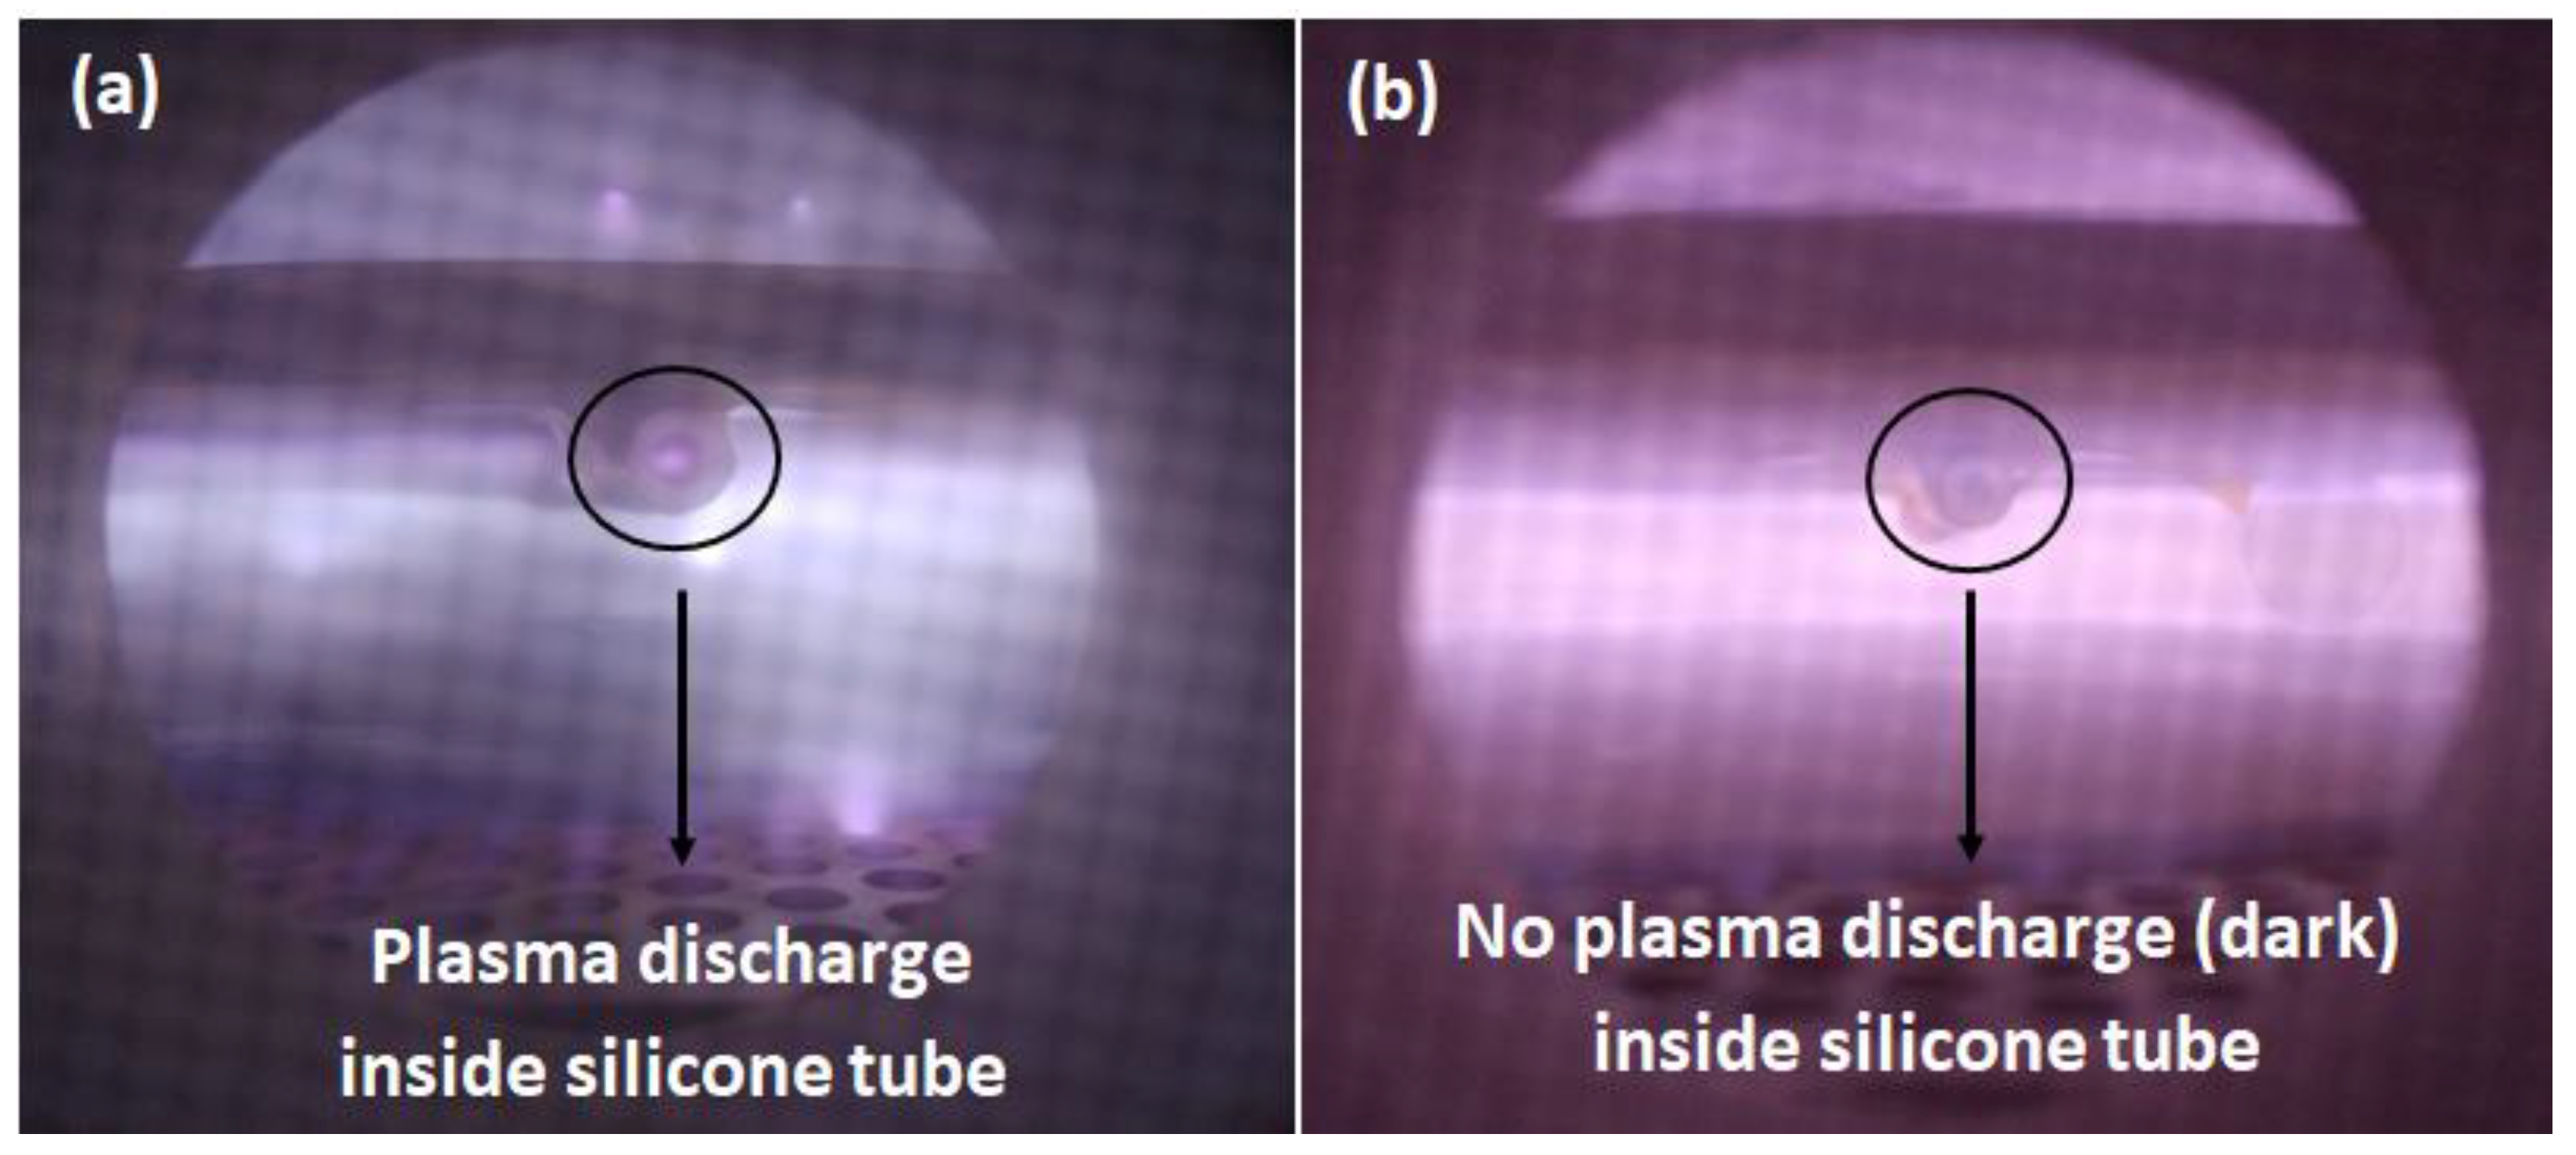
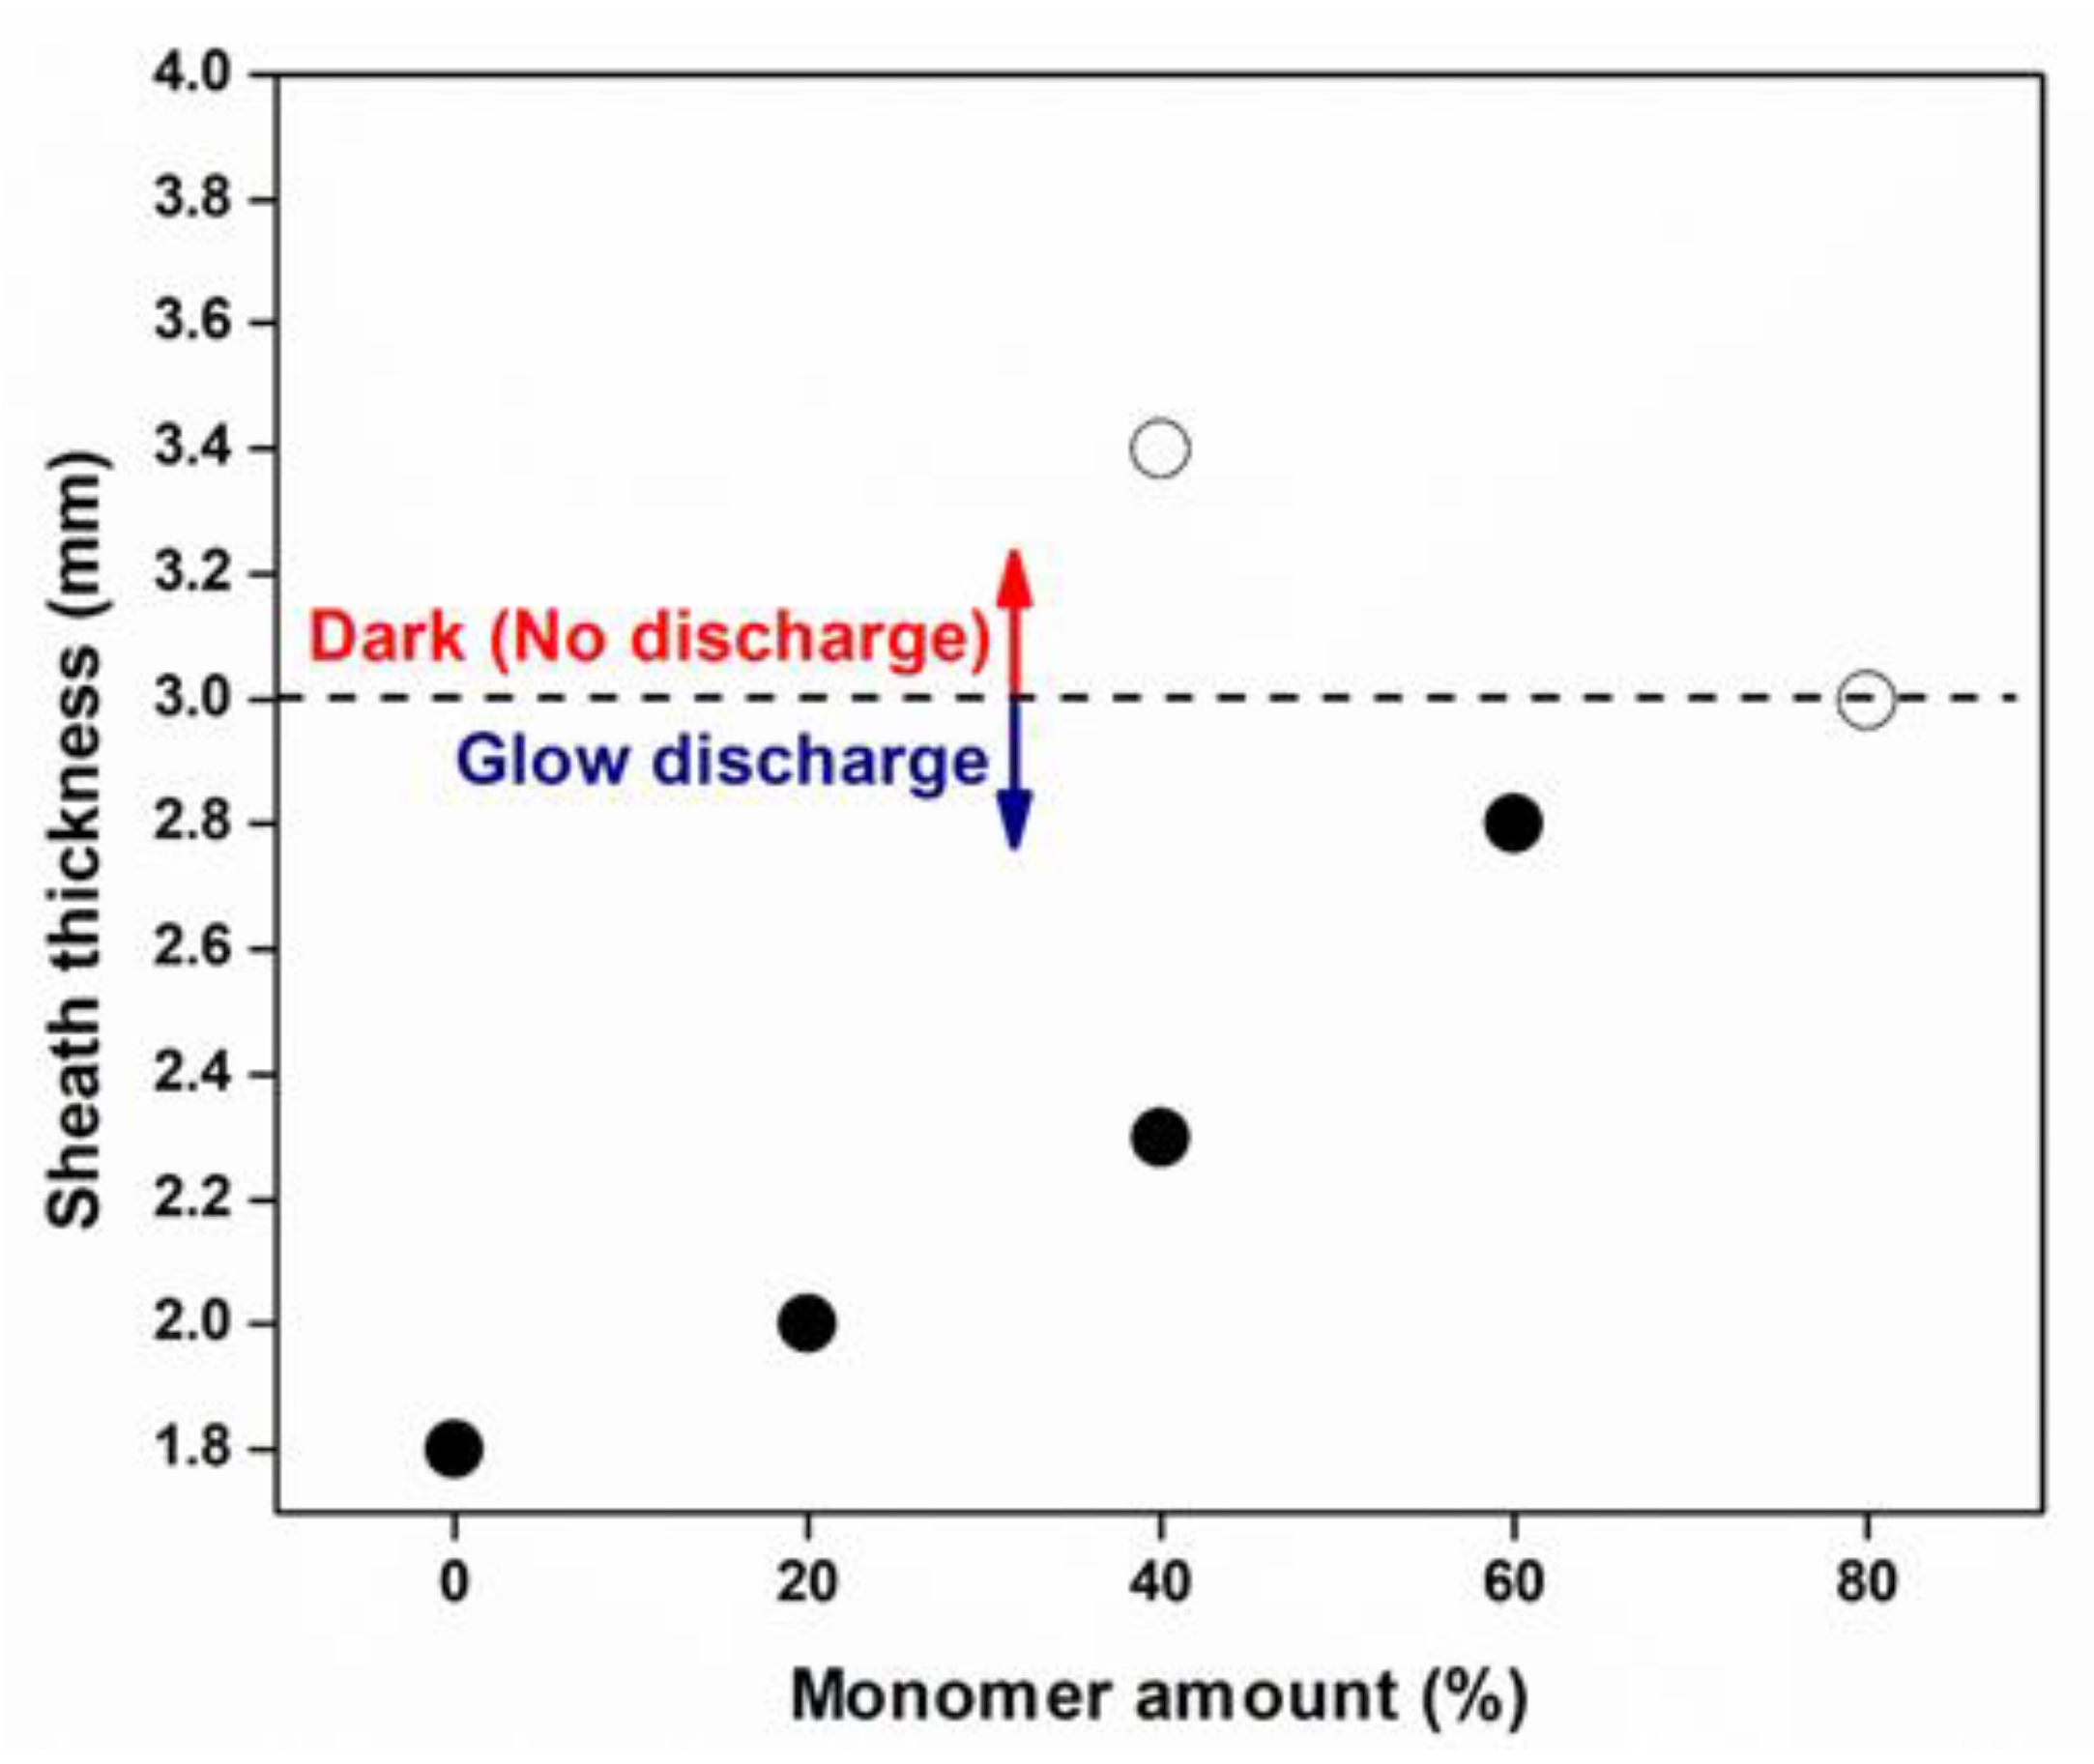
4.1. Plasma Generation with Respect to Sheath Thickness

As shown in Table 2 and Figure 4, by increasing the monomer amount from 0 to 80%, the electron density decreases, while the electron temperature increases. By considering Equation (3), it can be observed that the Debye length is proportional to the square root of the electron temperature and inversely proportional to the square root of the electron density. Thus, the Debye length increases with the increase in monomer amount, as shown in Table 2. Therefore, the sheath thickness should increase with the increase in monomer concentration, as sheath thickness is directly proportional to Debye length. As mentioned previously, Te and ne, along with the Debye length, provide vital information for the calculation of sheath thickness. The immediate effect of increasing the monomer percentage on plasma characteristics can be described as follows: the excitation and ionization of argon gas molecules in plasma (as the selected peaks for the calculations of Te and ne were all from the argon emission lines) are responsible for the immediate effect on the plasma characteristics. In plasma, the intensity is supposed to be affected mainly by electron impact on argon atoms. When the argon gas flow rate decreases, the ionization rate, which is affected by the energetic electron’s impact with argon atoms, is reduced, and the plasma intensity is therefore decreased. In this case, the electron temperature will increase due to the decrease in collision frequency. As shown in Figure 4, it can be observed that the value of electron density decreases with the increase in electron temperature when the argon percentage decreases.
As mentioned before, silicone tubes with an internal diameter of 6 mm were used for the inner glow discharge study. If the sheath thickness value is half the internal diameter of the tube (Table 2) or larger, the plasma inside the tube will not be initiated (i.e., no glow discharge). Figure 5 shows an image of the tube center with (Figure 5a) or without glow discharge (Figure 5b). The experiments demonstrated that a monomer concentration of 40% (with RF power set at 50 W) or 80% (with RF power set at 100 W) did not generate stable plasma inside the tube as the sheath thickness became greater than the internal radius of the tube. The results are presented in Figure 6. The increases in sheath thickness values resulted in the sudden drop of potential alongside the radial direction of the tube. Thus, no plasma initiation occurred inside the tube for the monomer concentration of 40% (50 W) and 80% (100 W). The sheath thickness was increased with increased monomer amount. As mentioned in the introduction section, if the sheath thickness value is greater than half of the internal diameter of the tube, there will be no plasma, which will be directly reflected in the possibility of deposition. Thus, at Ar/80% MMA, there was no discharge inside the tube. In this case, no coating was detected in the absence of visible discharge inside the tube.

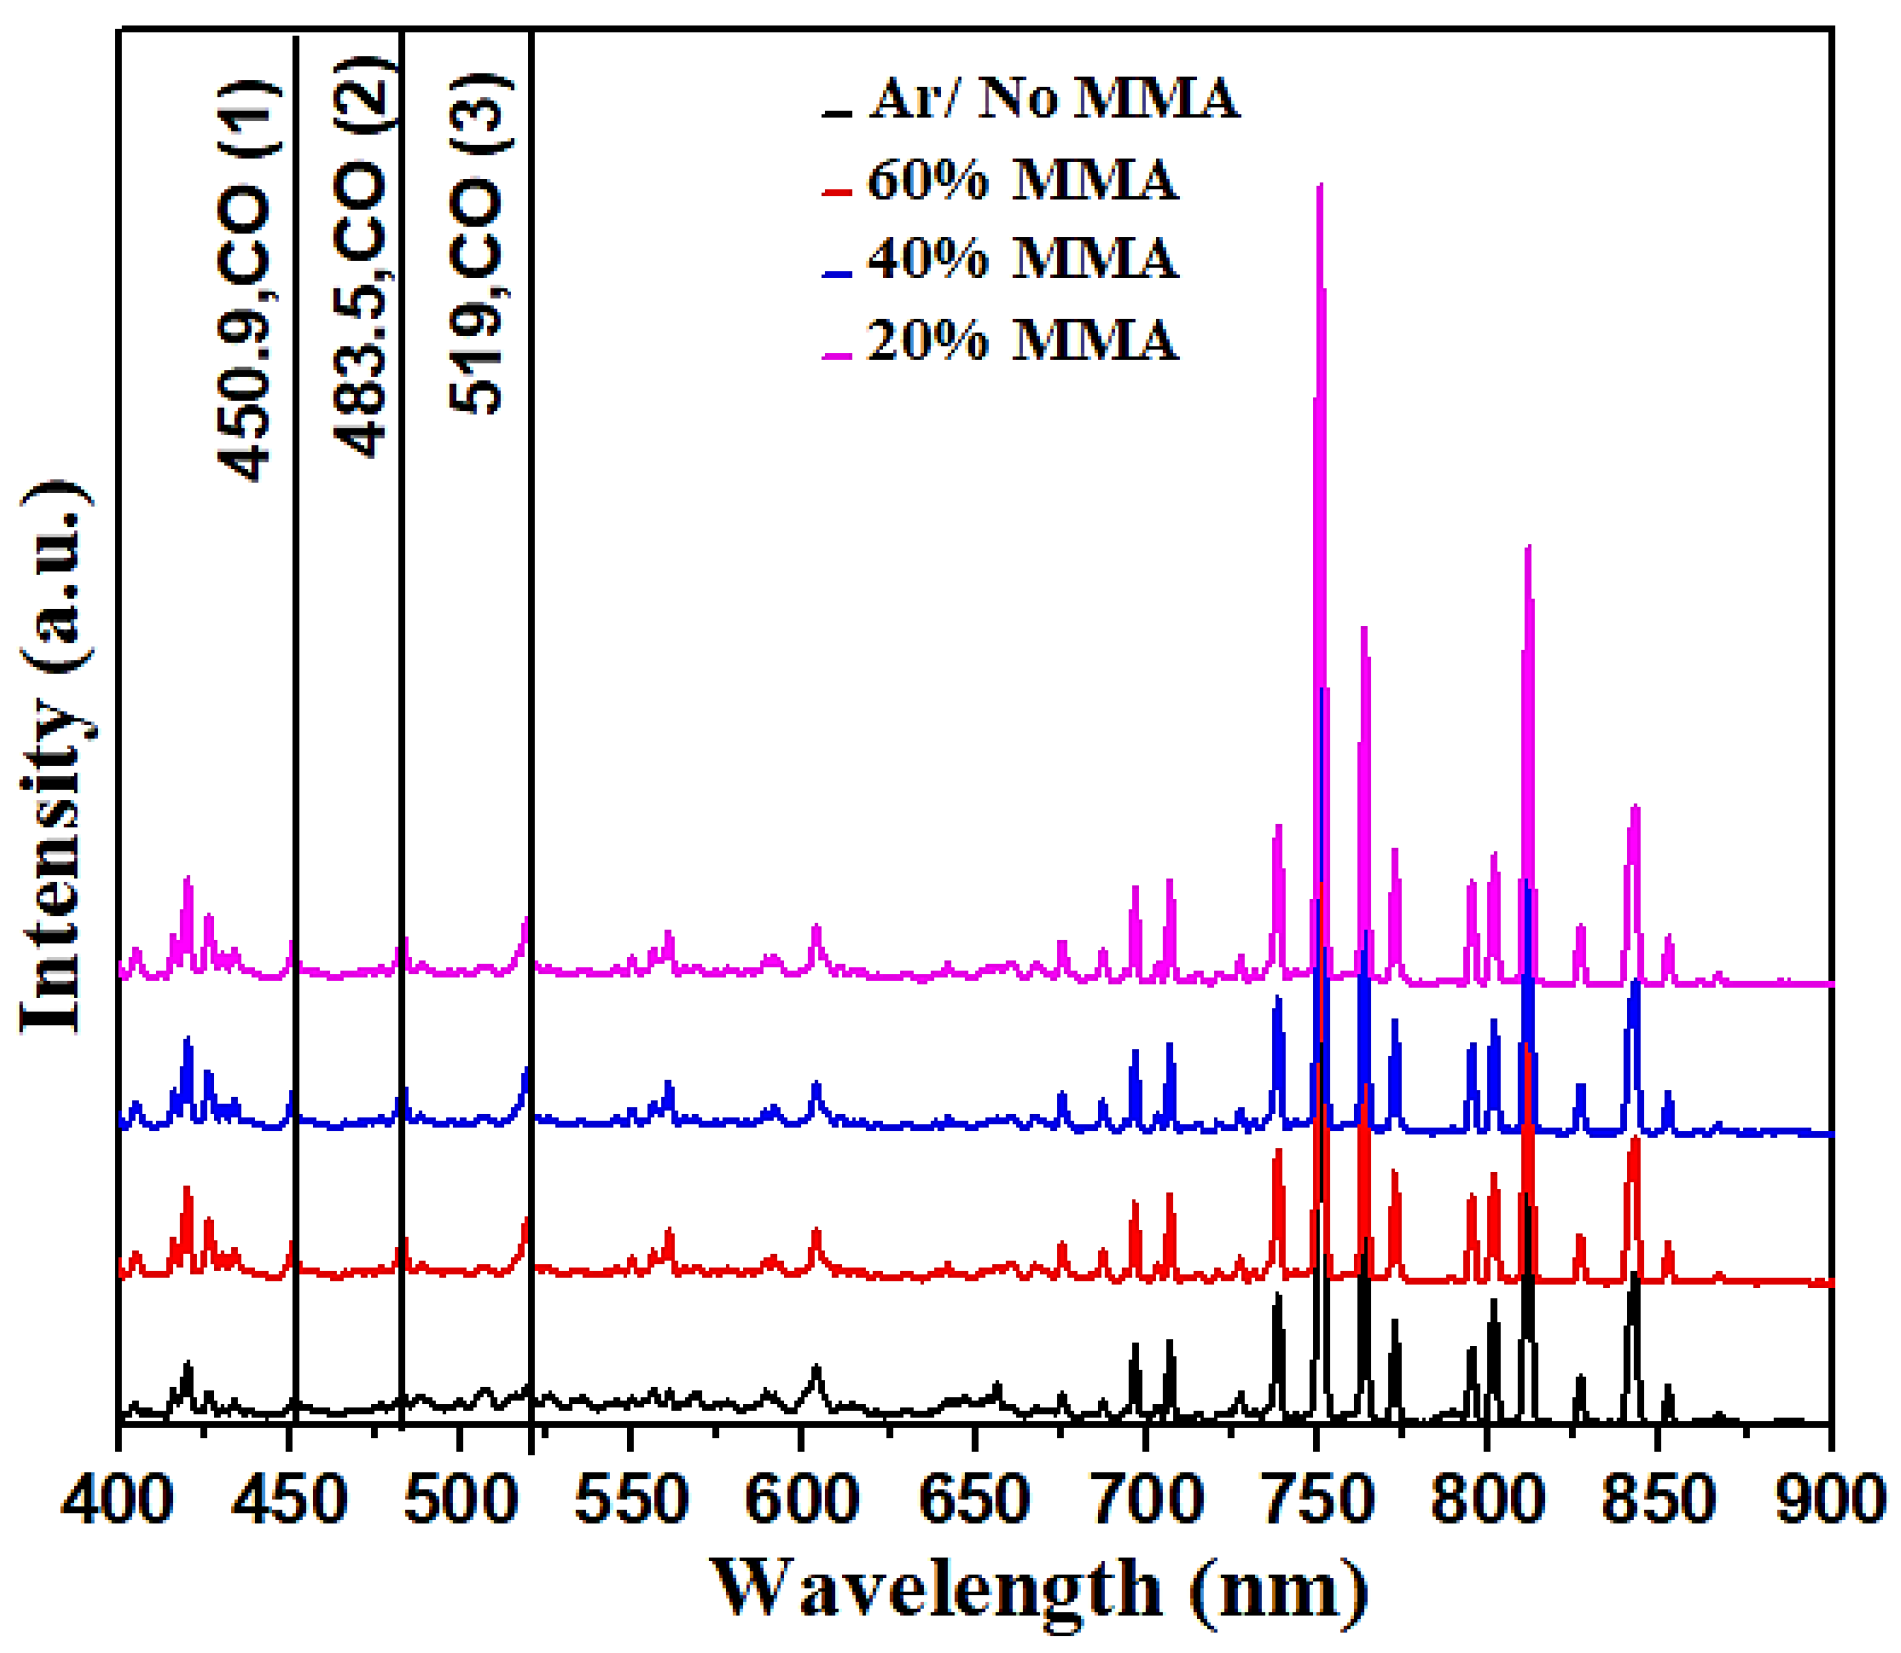
4.2. Plasma Characterization

Figure 7 presents the spectral lines obtained by using OES from argon plasma with and without various concentrations of MMA monomer, which were obtained by varying the flow rates of argon gas. It can be observed from the OES results that the spectral lines of the argon species appear strongly in the range of 600–900 nm. The lines are in agreement with the spectral argon lines detected in a plasma under 1 torr [23]. When the vaporized monomer was introduced, apart from the argon lines, a group of low-intensity lines due to CO (450.9, 483.1, and 519.8 nm) species [24] was found in the region between 400 and 520 nm. This indicates that MMA in argon gas did not provide a significant cooling effect on the electron inside the plasma. However, the electron–MMA impact that caused the fragmentation of monomers inevitably reduced the ionization and excitation rates of argon, which in turn reduced the plasma density. In other words, with the increase in MMA percentage, the plasma density, and, hence, the deposition rate of PP-MMA, will decrease.

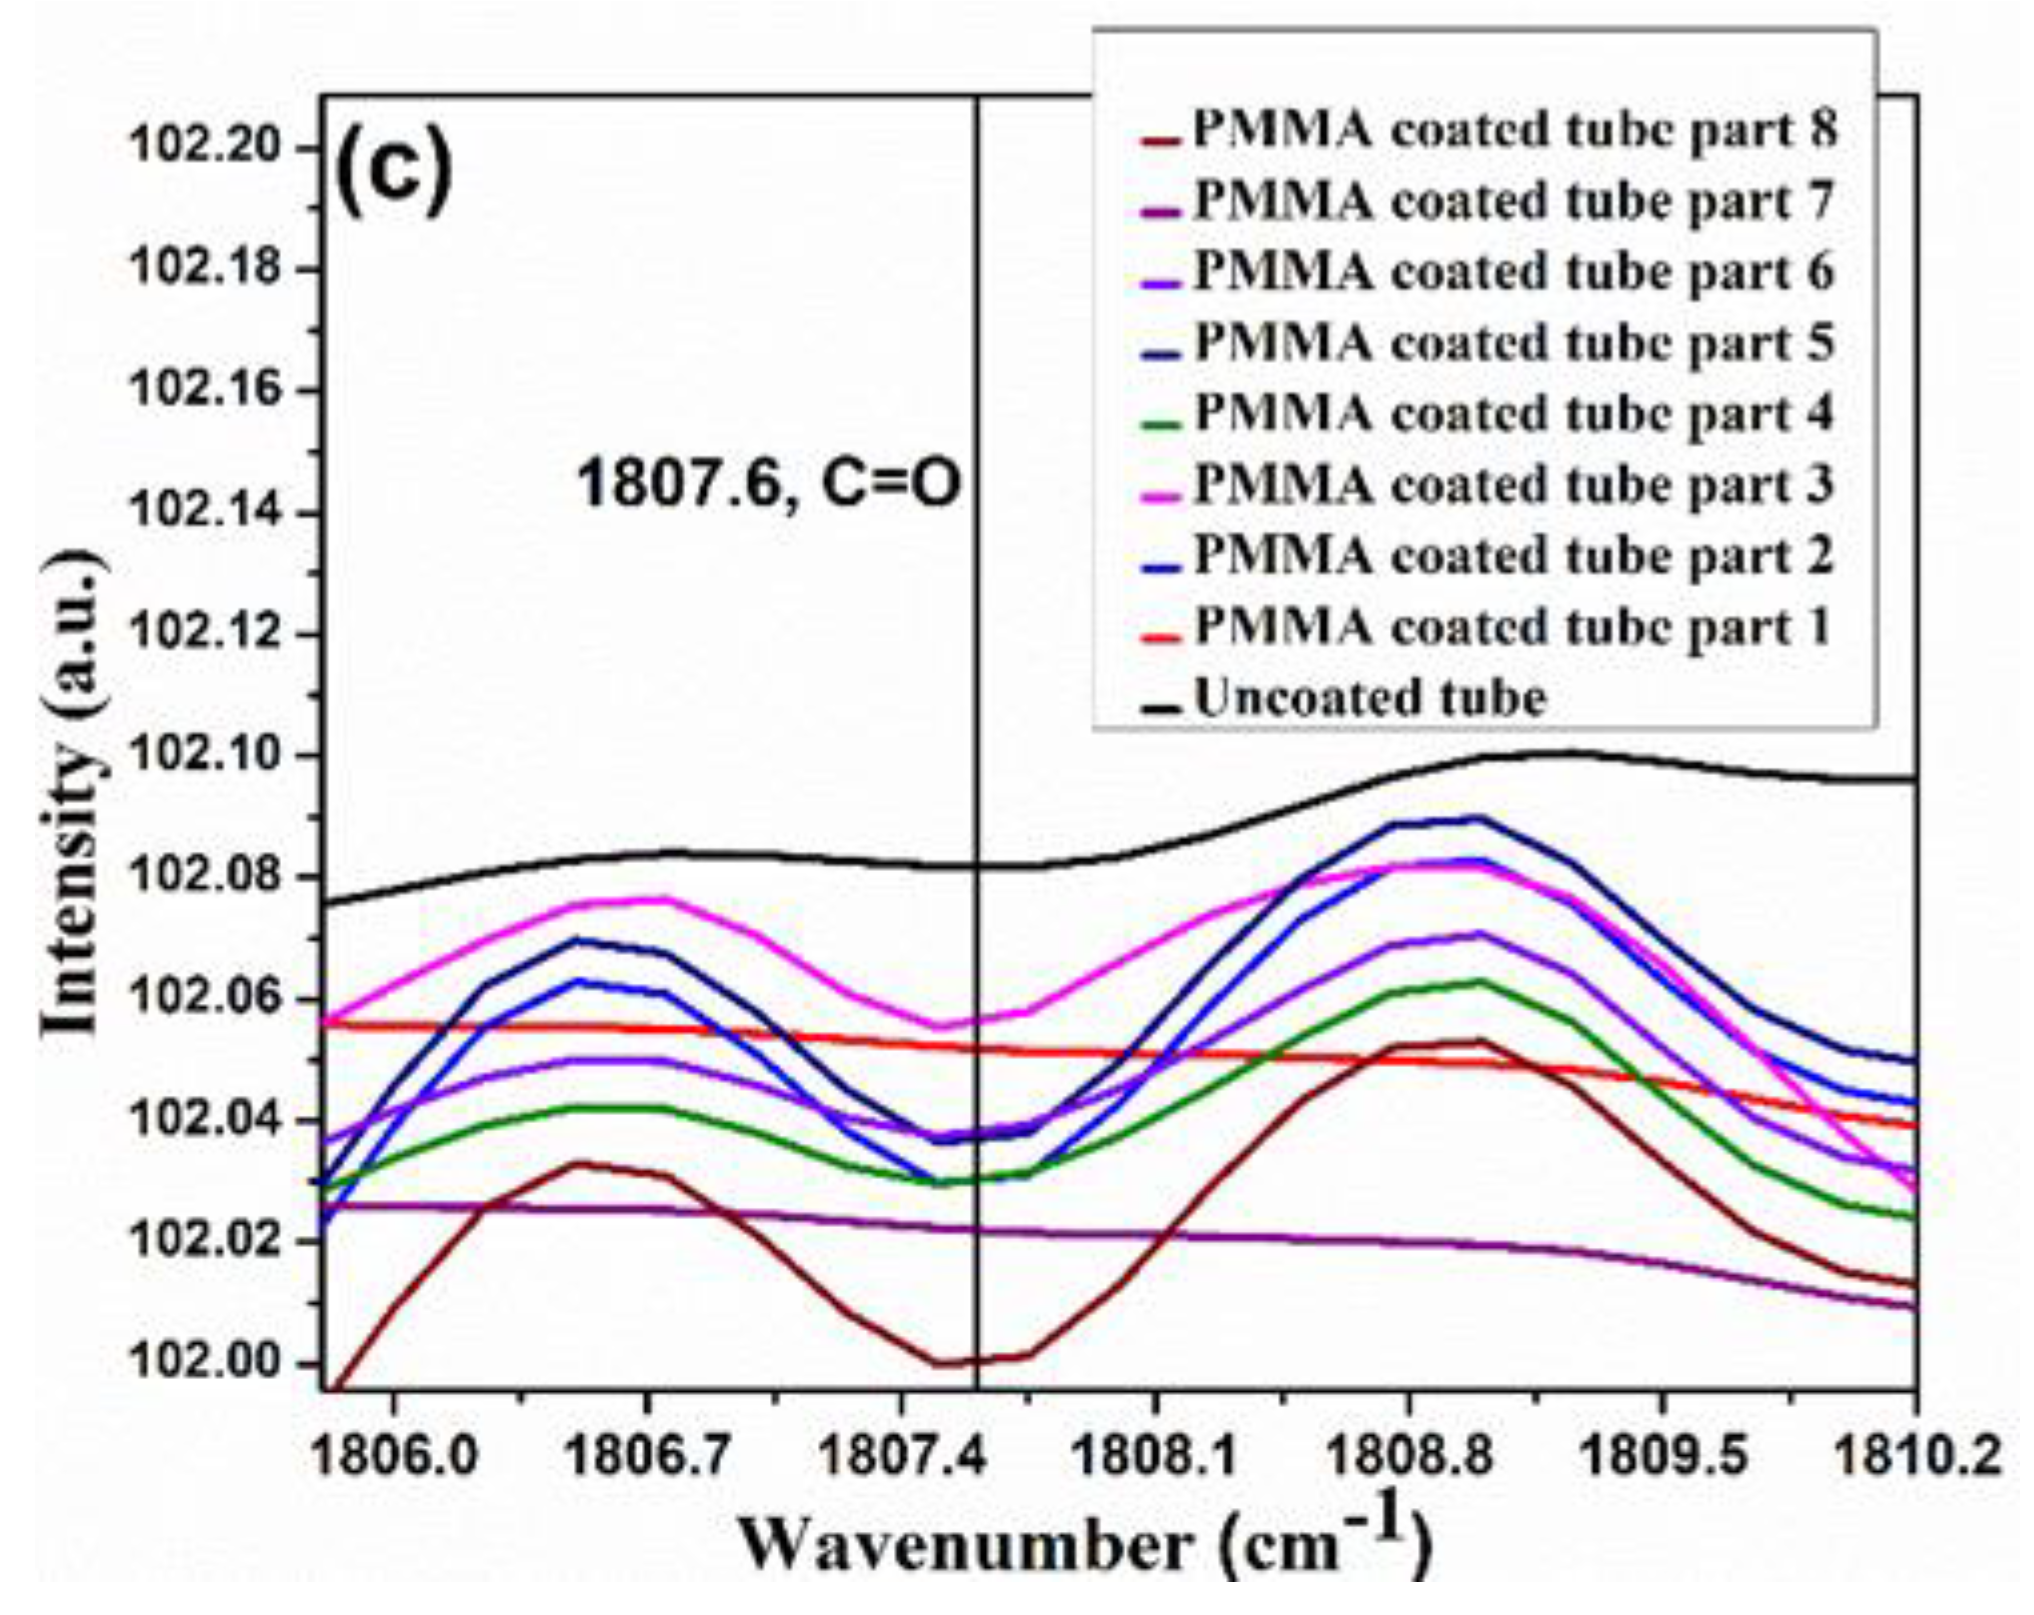
4.3. Chemical Analysis of the Deposited PP-MMA Polymer Films

The deposition of PP-MMA on the inner surface of the silicone tube was confirmed via the use of ATR-FTIR spectroscopy. The films observed using field emission scanning electron microscopy (FESEM) exhibited good adhesion with the substrates. The ATR-FTIR spectra for PP-MMA films deposited under different parameters are shown in Figure 8a, where the identified major peaks are close to those reported in previous studies. The shifts from standard peaks may be due to the amorphous characteristics of the films, which is not uncommon for films obtained from plasma polymerization. In an amorphous structure, a cross-linked 3D network is normally found, which may cause a shift in the absorption bands. Differences are often observed when comparing plasma-polymerized films and chemically processed PMMA. However, the wave numbers, including 810 cm−1 and 865 cm−1 (stretching mode of C–H and C–C), 1024.7 cm−1 and 1260 cm−1 (C–O asymmetric stretching modes of C–O–C), and 1405 cm−1 (bending mode of C–H) [15,25,26,27], were close to those originating from silicone. This makes PMMA film unidentified. In order to confirm the existence of PP-MMA film, some minor absorption peaks were identified and served as the fingerprints for PMMA. These fingerprints included C=O and O–CH3 [27,28]. Figure 8b,c show both bands within different wavelength ranges. The ATR-FTIR analysis shows these PP-MMA fingerprints (1807.6 cm−1, stretching mode of C=O; 1467.3 cm−1, bending vibration of O–CH3) appearing on the inner surface of the tube, which confirms the successful deposition of PP-MMA (besides the thickness measurement of condensed layers); thus, it is then proved that plasma generated inside the tube is critical.
The coating thicknesses of the samples presented in Figure 8 are presented in Figure 9 as a function of tube location. It can be seen that the coating thickness does not vary much inside the tube, except in the case of the samples taken from both ends. This can be attributed to the decrease in the hollow cathode effect on both of the open ends. As a result, the plasma density, and, therefore, the deposition rate, should decrease in the area near the open ends. However, further studies should be carried out in order to improve our understanding of the mechanisms, as well as the effect of tube length.

5. Conclusions

The plasma coating of MMA on the inner surface of a silicone tube was performed using plasma polymerization in low-pressure plasma. A hollow cathode model was proposed and proven to be able to generate plasma discharges inside the tube for the polymer deposition on the inner surfaces. It was found that plasma discharge can be generated inside the tube, provided that the internal diameter of the tube is greater than two times the thickness of the plasma sheath. The plasma sheath thickness increased with the increase in monomer percentage, which explains the disappearance of plasma inside the tube. In summary, sheath thickness estimation can provide valuable information about the selection of tube internal diameter and/or process parameters for the plasma polymerization coating on the internal surface of tubes. The spectroscopic investigation on plasma generation, in this study, put forward a method to optimize tube size and process parameters regarding the inner surface coating in a low-pressure plasma system. Finally, the successful coating of PP-MMA on the inner surface of the silicone tube was confirmed via spectral analysis using ATR-FTIR and thickness measurement. The detected bands correlated with the OES spectra confirm that the inner surface of the tube can be coated by using a plasma polymerization process. The coating is uniform, except the regions near both open ends.

Author Contributions

Conceptualization, J.-H.H. and C.L.; methodology, J.-H.H. and W.W.; validation, J.-H.H. and C.L.; investigation, H.M., N.B. and S.T.H.; writing—original draft preparation, H.M. and J.-H.H.; writing—review and editing, C.L.; supervision, N.B., C.L. and J.-H.H.; project administration, J.-H.H.; funding acquisition, C.L. and J.-H.H. All authors have read and agreed to the published version of the manuscript.

Funding

This work was supported in part by the Ministry of Science and Technology, Taiwan, under Grant MOST 105-2221-E-131-003-MY2.

Institutional Review Board Statement

Not applicable.

Informed Consent Statement

Not applicable.

Data Availability Statement

Not applicable.

Conflicts of Interest

The authors declare no conflict of interest.

References

  1. Fotovvati, B.; Namdari, N.; Dehghanghadikolaei, A. On Coating Techniques for Surface Protection: A Review. J. Manuf. Mater. Process. 2019, 3, 28. [Google Scholar] [CrossRef] [Green Version]
  2. Cho, Y.K.; Park, D.; Kim, H.; Lee, H.; Park, H.; Kim, H.J.; Jung, D. Bioactive surface modifications on inner walls of poly-tetra-fluoro-ethylene tubes using dielectric barrier discharge. Appl. Surf. Sci. 2014, 296, 79–85. [Google Scholar] [CrossRef]
  3. Awad, T.S.; Asker, D.; Hatton, B.D. Food-safe modification of stainless steel food processing surfaces to reduce bacterial biofilms. ACS Appl. Mater. Interfaces 2018, 10, 22902–22912. [Google Scholar] [CrossRef] [PubMed]
  4. Qu, Q.; Shen, Y.; Gu, C.; Gu, Z.; Gu, Q.; Wang, C.; Hu, X. Capillary column coated with graphene oxide as stationary phase for gas chromatography, Analytica. Chim. Acta 2012, 757, 83–87. [Google Scholar] [CrossRef] [PubMed]
  5. Klages, C.P.; Berger, C.; Eichler, M.; Thomas, M. Microplasma-based treatment of inner surfaces in microfluidic devices. Contrib. Plasma Phys. 2007, 47, 49–56. [Google Scholar] [CrossRef]
  6. Heidarpour, F.; Wan, W.A.; Ghani, K.; Bin Ahmadun, F.R.; Sobri, S.; Zargar, M.; Mozafari, M.R. Nano silver-coated polypropylene water filter: I. Manufacture by Electron Beam Gun Using a Modified Balzers 760 Machine. Dig. J. Nanomater. Biostruct. 2010, 5, 787–796. [Google Scholar]
  7. Saha, B.; Toh, W.Q.; Liu, E.; Tor, S.B.; Hardt, D.E.; Lee, J. A review on the importance of surface coating of micro/nano-mold in micro/nano-molding processes. J. Micromech. Microeng. 2016, 26, 013002. [Google Scholar] [CrossRef] [Green Version]
  8. Kreethawate, L.; Larpkiattaworn, S.; Jiemsirilers, S.; Uchikoshi, T. Inner Surface Coating of Non-Conductive Tubular Substrate Using Electrophoretic Deposition. IOP Conf. Ser. Mater. Sci. Eng. 2011, 18, 062012. [Google Scholar] [CrossRef]
  9. Kreethawate, L.; Larpkiattaworn, S.; Jiemsirilers, S.; Uchikoshi, T. Application of electrophoretic deposition for inner surface coating of porous ceramic tubes. Surf. Coat. Technol. 2010, 205, 1922–1928. [Google Scholar] [CrossRef]
  10. Sanchez-Hidalgo, R.; Blanco, C.; Menendez, R.; Verdejo, R.; Lopez-Manchado, M.A. Multifunctional Silicone Rubber Nanocomposites by Controlling the Structure and Morphology of Graphene Material. Polymers 2019, 11, 449. [Google Scholar] [CrossRef] [Green Version]
  11. Tucekova, Z.K.; Galmiz, O.; Kelar, J.; Kovacik, D.; Stupavska, M.; Sramkova, P.; Zemmnek, M.; Vallade, J.; Cernak, M. Adhesive Properties of Silicone-Coated Release Liner Paper Enhanced by Atmospheric Pressure Plasma Pre- and Post- Treatment. Coatings 2020, 10, 1102. [Google Scholar] [CrossRef]
  12. Friedrich, J. Mechanisms of plasma polymerization—Reviewed from a chemical point of view. Plasma Process. Polym. 2011, 8, 783–802. [Google Scholar]
  13. Lauer, L.J.; Shohet, J.L.; Albrecht, R.M.; Esnault, S.; Malter, J.S.; Von Andrian, U.H.; Shohet, S.B. Control of uniformity of plasma-surface modification inside of small-diameter polyethylene tubing using microplasma diagnostics. IEEE Trans. Plasma Sci. 2005, 33, 791–798. [Google Scholar] [CrossRef] [Green Version]
  14. Mandolfino, C. Polypropylene surface modification by low pressure plasma to increase adhesive bonding: Effect of process parameters. Surf. Coat. Technol. 2019, 366, 331–337. [Google Scholar] [CrossRef]
  15. Park, C.S.; Jung, E.Y.; Jang, H.J.; Bae, G.T.; Shin, B.J.; Tae, H.S. Synthesis and Properties of Plasma-Polymerized Methyl Methacrylate via the Atmospheric Pressure Plasma Polymerization Technique. Polymers 2019, 11, 396. [Google Scholar] [CrossRef] [Green Version]
  16. Abdel–Fattah, E. Surface Activation of Poly(Methyl Methacrylate) with Atmospheric Pressure Ar + H2O Plasma. Coatings 2019, 9, 228. [Google Scholar] [CrossRef] [Green Version]
  17. Langmuir, I. The Interactions of electrons and Positive ions in cathode sheaths. Phys. Rev. 1929, 33, 954–989. [Google Scholar] [CrossRef]
  18. Fantz, U. Basics of plasma spectroscopy. Plasma Sources Sci. Technol. 2006, 15, S137–S147. [Google Scholar] [CrossRef] [Green Version]
  19. Vazquez, F.J.G.; Camero, M.; Aleixandre, C.G. Spectroscopic measurements of the electron temperature in low pressure radiofrequency Ar/H2/C2H2 and Ar/H2/CH4 plasmas used for the synthesis of nanocarbon structures. Plasma Sources Sci. Technol. 2006, 15, 42–51. [Google Scholar] [CrossRef] [Green Version]
  20. Zhu, X.M.; Chen, W.C.; Li, J.; Pu, Y.K. Determining the electron temperature and the electron density by a simple collisional radiative model of Ar and xenon in low pressure discharge. J. Phys. D Appl. Phys. 2009, 42, 025203. [Google Scholar] [CrossRef]
  21. Grill, A. Cold Plasma in Materials Fabrication: From Fundamentals to Applications; Wiley-IEEE Press: Hoboken, NJ, USA, 1994; pp. 13–15. [Google Scholar]
  22. Auciello, O.; Flamm, D.L. Plasma-Materials Interactions; Academic Press, Inc.: Cambridge, MA, USA, 1990; pp. 5–7. ISBN 0-12-200430-2. [Google Scholar]
  23. Bogaerts, A.; Gijbels, R.; Vlcek, J. Modeling of glow discharge optical emission spectrometry: Calculation of the Ar atomic optical emission spectrum. Spectrochim. Acta Part B 1998, 53, 1517–1526. [Google Scholar] [CrossRef]
  24. Li, C.; Hsieh, J.H.; Hu, W.W.; Lin, Y.H. Fabrication and characterization of polymethylmethacrylate (PMMA) thin film by plasma polymerization used for cell culture. Surf. Coat. Technol. 2014, 66, 1–7. [Google Scholar] [CrossRef]
  25. Chan, V.; Li, C.; Tsai, Y.H.; Tseng, Y.H.; Chen, Y. Cyclopropylamine modified plasma polymerized poly (methyl methacrylate) thin films for cell culture. Int. J. Nanotechnol. 2017, 14, 1045–1065. [Google Scholar] [CrossRef]
  26. Li, X.; Wang, Z.; Sakib, S.; Mathews, R.; Zhitomirsky, I. Poly(Methyl Methacrylate) Coatings Containing Flame Retardant Additives from Suspensions in Water-2-Propanol. Molecules 2021, 26, 1974. [Google Scholar] [CrossRef] [PubMed]
  27. Wang, H.; Kumar, R.; Memon, H. Strongly Hydrophobic and Superoleophilic PMMA Based Nanocoated Cotton Fabrics. Coatings 2020, 10, 943. [Google Scholar] [CrossRef]
  28. Hosseini, S.; Azari, P.; Jimenez-Moreno, M.F.; Rodriguez-Garcia, A.; Pingguan-Murphy, B.; Madou, M.J.; Martínez-Chapa, S.O. Polymethacrylate Coated Electrospun PHB Fibers as a Functionalized Platform for Bio-Diagnostics: Confirmation Analysis on the Presence of Immobilized IgG Antibodies against Dengue Virus. Sensors 2017, 17, 2292. [Google Scholar] [CrossRef] [Green Version]
Figure 1. Modified Boltzmann method used to derive electron temperature.
Coatings 12 00865 g001
Figure 2. Schematic presentation of the capacitively coupled RF plasma reactor for plasma polymerization.
Coatings 12 00865 g002
Figure 3. Schematic methodology of PP-MMA-coated silicone tube for ATR-FTIR analysis. (a) The silicone tube is 8 cm in length with an internal radius of 3 mm. (b) Shows eight tube sections equally cut to be 1 cm in length. (c) Shows 1 cm tube section cut from the middle position to make a flat sample for ATR-FTIR analysis. (d) Shows flat silicone tube for ATR-FTIR analysis.
Coatings 12 00865 g003
Figure 4. Plot for electron temperature and electron density with respect to changing monomer amount. The unit of monomer amount indicates the volume percentage.
Coatings 12 00865 g004
Figure 5. Pictorial view: (a) presence of plasma discharge inside the tube for 40% monomer concentration with RF power at 100 W; (b) no discharge (dark) inside the tube for 40% monomer concentration with RF power at 50 W.
Coatings 12 00865 g005
Figure 6. Sheath thickness with variation in monomer percentage and with the possibility of losing glow discharge inside the tube. The unit of monomer amount indicates the volume percentage. Note: The conditions with monomer amount at 40%, power at 50 W, and pressure at 0.4 torr (sheath thickness = 3.42 mm) will not initiate a glow discharge inside the tube.
Coatings 12 00865 g006
Figure 7. Optical emission spectra with the change in monomer concentration.
Coatings 12 00865 g007
Figure 8. ATR–FTIR spectrum for PP-MMA coating inside the silicone tube corresponds to the 100 W (RF) plasma and 40 volume percentage of monomer. (a) The whole ATR-FTIR spectrum for PP-MMA-coated/-uncoated silicone tubes. (b) Band depiction of PP-MMA on the inner surface of the silicone tube in the range of 1460 to 1480 cm−1. (c) Band depiction of PP-MMA on the inner surface of the silicone tube in the range of 1800 to 1810 cm−1. The uncoated tube represents the condition in which there was no plasma initiation inside the tube.
Coatings 12 00865 g008aCoatings 12 00865 g008b
Figure 9. Coating thicknesses of the samples presented in Figure 8 as a function of tube length.
Coatings 12 00865 g009
Table 1. Process parameters (Working pressure: 0.4 torr).
Power (Watt)MMA Monomer Concentration (vol.%)
20406080
50
100
Table 2. Results of calculations for Te and ne, as well as sheath thickness, as a function of MMA concentrations, (RF power = 100 Watt).
Monomer Concentration
(Vol.%)
Electron Temperature (eV)Electron Density
(cm−3)
Debye Length (mm)Sheath Thickness (mm)Deposition Rate
(nm/min)
No Monomer
(100% Ar)
0.9 ± 0.090(3.0 ± 0.30) × 10110.012 ± 0.0011.8-
Ar/20% MMA0.86 ± 0.086(2.8 ± 0.28) × 10110.013 ± 0.0012.05.0
Ar/40% MMA0.98 ± 0.098(2.5 ± 0.25) × 10110.015 ± 0.0012.34.3
Ar/60% MMA1.14 ± 0.114(1.60 ± 0.16) × 10110.020 ± 0.0022.83.9
Ar/80% MMA1.1 ± 0.110(1.4 ± 0.14) × 10110.021 ± 0.0023.0(no deposition inside the tube)
Note: The sample powered with 50 W (RF) deposited with volume percentage of 40 MMA would not have generated plasma inside the tube.
Publisher’s Note: MDPI stays neutral with regard to jurisdictional claims in published maps and institutional affiliations.

