Article

Electrochemical and DFT Study of NaNO2/NaNO3 Corrosion Inhibitor Blends for Rebar in Simulated Concrete Pore Solution

National Center for Education and Research on Corrosion and Materials Performance, NCERCAMP-UA, Department Chemical, Biomolecular, and Corrosion Engineering, The University of Akron, Akron, OH 44325-3906, USA
*
Author to whom correspondence should be addressed.
Coatings 2022, 12(6), 861; https://doi.org/10.3390/coatings12060861
Submission received: 23 May 2022 / Revised: 13 June 2022 / Accepted: 16 June 2022 / Published: 18 June 2022

Abstract

:
The use of nitrite- and nitrate-based inhibitors provides corrosion protection by the development of passive oxide film on the metal surface in reinforced concrete applications. However, the impact of the nitrite and nitrate ratio in the mixture has not been widely studied. In this study, the corrosion protection provided by NaNO2:NaNO3 inhibitor blends with ratios of 0.5:1, 1:1, and 1:0.5 were studied to maximize corrosion inhibition efficiency. The nitrite species imparted higher corrosion protection, as shown by cyclic potentiodynamic polarization, with an icorr of 1.16 × 10⁻⁷ A/cm2 for the 1:0.5 mixture, lower than for both the 1:1 and 0.5:1 mixtures. Electrochemical impedance spectroscopy was also performed, with the 1:0.5 mixture consistently displaying high resistance values, showing an Rct of 1.31 × 10⁵ Ω cm2. The effect of temperature was also assessed; the Ea’s of the corrosion reaction were calculated to be 12.1, 9.2, and 4.9 kJ/mol for the 0.5:1, 1:1, and 1:0.5 (NO2:NO3) mixtures, respectively. Density functional theory was applied to analyze the molecular properties and to determine the relationship between the quantum properties and corrosion inhibition. The ΔE of NO2 was found to be −5.74 eV, lower than that of NO3 (−5.45 eV), corroborating the experimental results. Lastly, commercially available inhibitor mixtures were investigated and nitrite/nitrate concentrations determined to evaluate their corrosion protection performance; amongst the two inhibitor blends tested, Sika was found to outperform Yara due to its greater NO2 concentration.

1. Introduction

The economic impact of the corrosion of steel-reinforced concrete is significant globally, as concrete is one of the most widely used manufactured materials in construction and infrastructure [1]. Methods of corrosion protection and mitigation have been applied widely in the construction industry, including the use of stainless steel reinforcement [2,3], cathodic protection [4], protective coatings [5,6] and corrosion inhibitors [7,8,9,10]. Normally, in concrete, the alkaline environment conferred by the portlandite (Ca(OH)2) imparts passivity by the formation of stable iron oxide films of maghemite (Fe2O3), goethite (α-FeOOH), and lepidocrocite (γ-FeOOH) [11]. This passive state, however, is broken by the ingress of chloride ions [12], or by the destabilization of the passive film through carbonation of the concrete, decreasing the pH of the system [13].
Nitrites (NO2) have been widely used in the inhibition of corrosion of reinforced concrete and numerous studies have examined its use in both simulated concrete pore solutions and real concrete samples [14,15,16,17,18]. Nitrite has been shown to be a corrosion inhibitor for steel in neutral and alkaline pH but can accelerate corrosion in acidic media [19]. Usually, nitrite is added to the concrete admixture with a mixture of components and inhibitors [20]. The nitrite anodic inhibition mechanism for the passive layer development is governed by the electrochemical reactions shown in Equations (1) and (2) [21]:
2 Fe 2 + + 2 OH + 2 NO 2 2 NO + Fe 2 O 3 + H 2 O
Fe 2 + + OH + NO 2 NO +   γ FeOOH
The nitrite ions aid the formation of maghemite and lepidocrocite, which are insoluble oxides that adhere to the surface of the rebar, creating a protective passive layer [22,23]. Nitrates (NO3) have been shown to be viable corrosion inhibitors in reinforced concrete [24]. The mechanism of inhibition for nitrates is directly related to the mechanism for nitrites previously discussed. Nitrates are easily reduced by the ferrous ions present in the alkaline environment to nitrites (see Equation (3)) [25]:
2 Fe OH 2 +   NO 3 + H 2 O   2 Fe OH 3 + NO 2
It is hypothesized that, because more moles of ferrous ions are oxidized to ferric, nitrate would behave as a superior corrosion inhibitor. However, in practice, this is not the case, as nitrites perform equally well or surpass nitrate corrosion inhibitors [7,26]. This has been attributed to nitrates requiring prolonged time periods for effective inhibition. Bolzoni et al. concluded that, because nitrate acts as a set accelerator, the long-term efficiency may be due to a reduction in chloride diffusion [7].
In other studies, it has been shown that nitrites show superior corrosion inhibition compared to other inorganic corrosion inhibitors; however, due to their toxicity, the liberal use of nitrites presents environmental and health concerns [27]. Therefore, there is a need to minimize the risks associated with nitrite use. Some researchers have studied the effects of nitrite with organic inhibitors such as D-sodium gluconate, which was found to enhance the adsorption of the inhibitor and to compete with chlorides for adsorption sites [28]. As nitrate is seen as an environmentally friendly alternative to nitrite for corrosion inhibition in reinforced concrete, it is hypothesized that a mixture of nitrite and nitrate might effectively improve corrosion resistance while minimizing the amount of nitrite.
In this study, corrosion inhibition using mixtures of NaNO2 and NaNO3 in simulated concrete pore solution (SCPS) contaminated with 0.6 M NaCl was investigated at different temperatures and the activation energy of the corrosion reaction was determined. The results were compared with commercially available corrosion inhibitors containing both NO2 and NO3 inhibitors. From the results, an optimum ratio of NO2:NO3 was determined for acceptable corrosion inhibition while minimizing the concentration of toxic NO2.

2. Materials and Methods

Carbon steel rebars with composition shown in Table 1 were degreased and washed with deionized water and ethanol and air-dried. A copper wire was attached to the rebar and the test area was delimited by non-conductive red stopping lacquer. All chemicals used were of reagent grade with no further purification. Commercially available NO2/NO3 corrosion inhibitor blends were obtained from Sika and Yara. The chemical composition of NO2 and NO3 ions were obtained using UV-vis spectroscopy by the Griess reagent method [29,30]. First, a calibration curve was obtained with standard NO2 and an R-squared value of 0.998 was obtained. Then, the NO2 concentration was determined by reacting the inhibitor solution with Griess reagent (0.2 wt% N-(1-naphthyl)ethylenediamine dihydrochloride and 2 wt% sulfanilic in 5 wt% phosphoric acid) for 30 min, the resulting compound was observed by UV-vis at 548 nm. The Griess reaction makes nitrite concentration measurable by UV-vis spectroscopy by reacting nitrite to produce a larger azo dye. The reaction is achieved by reacting NO2 in acidic conditions with sulfanilic acid (C6H7NO3S). This forms the diazonium cation H5OSC6N≡N(+). This reacts with the aromatic 1-napthylamine (C10H9N) to form the water-soluble azo dye (HO3SC6H4-NN-C10H6NH2) which has a red-violet color. The NO3 content was determined by mixing the commercial inhibitors with Cd powder for 12 h at 30 °C, thus through redox reaction the NO3 ions are reduced to to NO2 ions after filtering the Cd, the concentration was measured by the Griess method. The known NO2 concentration in the original inhibitor solution was then subtracted from the measurements obtained after Cd reduction, providing the concentration of NO3 ions in the commercial corrosion inhibitors.
Electrochemical tests were conducted in a three-electrode configuration using a Gamry Series 600 potentiostat, a saturated calomel reference electrode, a graphite rod counter electrode, and the steel rebar as the working electrode. The test solution used was 250 mL saturated calcium hydroxide as the SCPS contaminated with 0.6 M NaCl. The corrosion inhibitors were added in molar ratios of 0.5:1, 1:1, and 1:0.5 (NaNO2:NaNO3) while maintaining a 1:1 molar ratio of total inhibitor to chloride ions; these were added directly to the solution and allowed to mix for at least 30 min prior to testing. First, the open circuit potential (OCP) was monitored until a steady state value was reached after about 1 h. Then electrochemical impedance spectroscopy (EIS) was recorded at OCP between frequency ranges of 105 Hz and 10−2 Hz with an applied 10 mV AC signal using 10 points per decade. Lastly, cyclic potentiodynamic polarization (CPP) was performed between −0.2 VOCP and +0.2 VOCP using a 0.1667 mV/s scan rate according to ASTM G61-86 [31]. Finally, adsorption isotherms were obtained using a constant temperature water bath maintained at 25, 35, and 45 °C. All tests were performed in triplicate.
After electrochemical testing, the rebar samples were rinsed with DI and dried with compressed air. Then, imaging and energy-dispersive X-ray spectroscopy (EDX) were performed on the rebar samples after electrochemical testing and exposure to the test solution for 3 h using a Tescan Lyra 3 scanning electron microscope (SEM) with an excitation voltage of 15 kV and a working distance of 8 μm.
Density functional theory (DFT) calculations were performed using Gaussian 16 revision A.03 software. The input files for the corrosion inhibitors were prepared with GausView 6.06.16. The molecules were fully optimized using DFT employing a B3LYP functional [32], and using a 6-31G (d,p) basis set to determine HOMO, LUMO, Mulliken charges, electron density mapping, and quantum properties for this study [33].

3. Results

The electrochemical resistance and capacitance values of the rebar-inhibitor interface were measured by EIS and the resulting Nyquist plots are shown in Figure 1. The results obtained in 25 °C in (Figure 1a) showed similar impedance values, of the order of 105 Ω cm2, between the corrosion inhibitor molar ratios of NO2:NO3 while maintaining a total inhibitor:chloride ratio of 1:1. The 1:1 and 1:0.5 NO2:NO3 ratios showed improved impedance with higher concentrations of NO2; similarly, the 35 and 45 °C conditions displayed a greater difference in impedance, with the inhibitor mixture with the highest NO2 concentration giving the best inhibitive performance.
The EIS results were fitted to an electrical equivalent circuit (EEC), as shown in Figure 2, with two relaxion processes, high frequencies revealing the development of a passive oxide film and lower frequencies modeling the electrochemical double layer. The EEC consisted of a solution resistance (Rs), and two R-CPE time constants indicating a passive film resistance (Rf) and film capacitance represented by a constant phase element (CPEf), in addition to charge transfer resistance (Rct) and electrochemical double-layer capacitance (CPEdl). The Rs values did not vary greatly with temperature, remaining around 20 Ω cm2 for all tests (see Table 2). The Rf values showed the greatest passive film resistance for the 1:0.5 and 1:1 NO2:NO3 inhibitor ratio tests, showing a higher passive film resistance with higher concentrations of NO2. Furthermore, the Rct values indicated that the 1:0.5 inhibitor ratio for NaNO2:NaNO3 provided the best corrosion inhibition, as it maintained the highest values. Moreover, the 1:1 ratio also provided higher Rct values that were similar to those found for 1:0.5, which were an order of magnitude higher than for the 0.5:1 inhibitor mixture.
A CPE was used to model the non-ideality of the capacitance. The effective capacitance of the film (Ceff,f) and the electrochemical double layer (Ceff,dl) were calculated using the relationship provided by Brug et al. [34], and Mansfeld et al. [35], respectively (see Equations (4) and (5)):
C eff , dl = Y dl 1 / n dl 1 R e + 1 R ct n dl 1 / n dl
C eff , f = Y f ω m n f 1
where Ydl and Yf are the admittance of the electrochemical double layer and passive film, respectively; ndl and nf are the exponents for the CPE of the double layer and passive film, respectively; and ωm” is the impedance at which the imaginary component of the impedance is maximized. The Ceff,f values calculated for each inhibitor mixture maintained the same order of magnitude for all the tests; however, the 1:0.5 NO2:NO3 inhibitor mixture showed the lowest capacitance values, indicating an improved passive oxide film. More significantly, by analyzing the calculated Ceff,dl, a clear distinction was able to be made as the 1:0.5 inhibitor ratio sample consistently displayed the lowest capacitance values of an order of magnitude less than the 0.5:1 sample, with the 1:1 sample showing middling values. The lower Ceff,dl values indicated improved passivity imparted by the NaNO2 through its ability to form a stable passive layer. The thickness of the passive film formed can be indirectly measured by EIS using the relationship in Equation (6):
d eff = ε   ε 0 C eff , f
where deff is the passive film thickness, ε is the dielectric constant of iron oxide (ε = 30) [36], and ε0 is the permittivity of the vacuum 8.85 × 10⁻¹⁴ F cm−1. The 1:0.5 samples showed the highest deff values for each temperature condition, while the 1:1 samples displayed passive film thickness values between that of the 1:0.5 and 0.5:1 NO2:NO3 corrosion inhibitor samples, corroborating the trend of greater nitrite concentrations imparting improved corrosion resistance by formation of a thicker passive film.
The CPP plots obtained for each ratio of inhibitors at 25, 35, and 45 °C are shown in Figure 3. The curves obtained for 25 °C in Figure 3a showed an increased Ecorr value with higher concentrations of NaNO2 inhibitor, demonstrating the most stable passive film formed on the rebar compared to the inhibitor mixtures with less NaNO2 and higher concentrations of NaNO3. Specifically, the 1:0.5 inhibitor ratio tests showed the most noble Ecorr value of –303 mVSCE, see Table 3, and a low icorr below 1 μA/cm2, the accepted limit for active corrosion to occur in simulated concrete pore solution. This passive Ecorr value, along with the highest calculated anodic Tafel slope (βa), indicated the lowest reaction kinetics of the anodic dissolution which govern the corrosion mechanism for rebar at alkaline pH with chlorides [37]. Furthermore, the hysteresis of the reverse scan for the 1:0.5 exposed sample showed high reversibility due to the stable passive film formed, showing very little change on the rebar surface compared to the 1:1 and 0.5:1 NO2:NO3 corrosion inhibitor samples. The CPP curves at 35 °C shown in Figure 3b displayed a similar trend. The 1:0.5 sample showed the most passive Ecorr of –299 mVSCE, for all the temperature ranges tested. The icorr values also indicated passivity for all the inhibitor ratios with values below 1 μA/cm2, with the 1:0.5 ratio showing the lowest icorr value of 2.07 × 10⁻⁷ A/cm2. The 1:0.5 sample showed the most reversible electrochemical reaction, with least changes in the passive film and surface of the rebar. Finally, for the 45 °C electrochemical results, the 1:0.5 exposed sample showed the most passive Ecorr value of all the tests with a value of –257 mVSCE and the lowest icorr value of 7.75 × 10⁻⁷ A/cm2. The reversibility of the CPP curves was the poorest under the 45 °C condition; however, the 1:0.5 sample reverse scan showed the least active surface, as the reverse scan had the most passive potentials and lower current density values. Overall, an improved inhibitive performance for Ecorr and icorr values with increased amount of NaNO2 corrosion inhibitor was found. Moreover, the effect of NO2 on the inhibited anodic reaction kinetics was evidenced by the Tafel slopes shown in Table 3; increased amounts of NaNO2 correlated with higher βa, thus, a lower electrochemical dissolution reaction.
Additionally, the corrosion inhibitor efficiency was calculated using Equation (7):
IE   % = i corr 0 i corr i i corr 0 × 100 %
where icorr(0) and icorr(i) are the corrosion current density for the control and inhibitor dosed samples, respectively.
The anodic scan of the CPP curves highlights the kinetics of the anodic reaction, as well as the state of the passive layer, since the carbon steel rebars are in alkaline solution that facilitate stable passive oxide film formation [38]. The area bounded by the forward and reverse scan indicates how active the surface is becoming, with a greater area indicating increased current densities relative to the icorr. This can be visualized in Figure 4a, where the areas are shown overlapping for the tests at 25 °C previously discussed. Here, it can clearly be seen that the control sample with no inhibitor had an area magnitude larger than for the inhibitor samples and that the 1:1 and 0.5:1 NO2:NO3 samples displayed similar anodic areas. The 1:0.5 samples showed negative hysteresis, implying that the samples became more passive after the polarization scan. This was caused by the polarization facilitating the formation of the passive film from the corrosion inhibitors. This trend was followed for the remaining temperatures tested; the 1:0.5 sample showed the lowest amount of positive hysteresis and the 0.5:1 samples showed the worst behavior of the mixtures tested.
The IE graph is plotted against temperature for each inhibitor ratio in Figure 4b. Again, the greater concentrations of nitrite in the 1:0.5 and 1:1 NO2:NO3 mixtures showed the best performance with the highest IE values for all temperatures, while the 0.5:1 mixture had the lowest. The contrast between the three mixtures increased with temperature, with the 0.5:1 inhibitor mixture having only 40% IE at 40 °C, almost half the IE measured at 25 °C. This was because the temperature increased the corrosion reaction rates and hindered the adsorption reaction of the inhibitors to provide a stable and protective passive oxide film [37]. The 1:0.5 and 1:1 NO2:NO3 mixtures, however, showed a slight increase in IE as the temperature increased, likely as a result of an increase in the rate of the nitrite inhibition mechanism, thus forming a stable passive oxide layer.
The activation energy for the corrosion reaction for each corrosion inhibitor solution was calculated using the Arrhenius equation shown in Equation (8):
ln   i corr = ln A E a RT
where R is the universal gas constant, T is the absolute temperature, and A is the pre-exponential factor. The icorr values were obtained from the Tafel analysis of the polarization curves for the varying inhibitor ratios at different temperatures.
According to the Arrhenius plot in Figure 5, the slope of the regression line has a slope equal to −Ea/RT, thus Ea can be calculated. The Ea values were calculated to be 12.1 kJ/mol, 9.2 kJ/mol, and 4.9 kJ/mol for the 1:0.5, 1:1, and 0.5:1 ratios of NO2:NO3, respectively. The trend for Ea followed the results from both EIS and CPP, which confirmed that higher concentrations of NO2 improved corrosion resistance, as a higher Ea indicates a higher energy barrier for the corrosion reaction to occur. The 1:0.5 sample displayed the highest Ea, with the most efficient corrosion inhibition of the tested NO2:NO3 mixtures.
The corrosion products on the steel rebar were examined by SEM; images for the 0.5:1, 1:1, and 1:0.5 NaNO2:NaNO3 inhibitor mixture samples are shown in Figure 6a–c, respectively. The areas examined were near the corrugated section of the rebar, where the presence of corrosion products was seen, as these areas experienced the highest residual stress after cold working, and were thus the most active areas [39,40]. The amount of corrosion products observed was found to decrease with increasing concentrations of NO2, in agreement with the electrochemical results. EDX spectra were obtained to analyze the atomic composition and are shown below the SEM images. The 1:1 and 1:0.5 NO2:NO3 ratios showed measurements of approximately 63% Fe and 36% O; this ratio is consistent with the occurrence of protective γ-FeOOH oxides facilitated by the NO2 inhibitor mechanism [15]. The 0.5:1 inhibitor ratio produced detectable amounts of Cl, while the other mixtures did not show detectable amounts of Cl, evidencing increased corrosion through the process of chloride attack. Photographs of the rebars after testing at 45 °C are shown in Figure 7. The most notable corrosion products were found for the control, which contained no corrosion inhibitors. The 0.5:1 rebar showed some corrosion products near the corrugated section, where small pits were observed, and some discoloration of the test solution was observed due to the formation of soluble oxides. The 1:1 and 1:0.5 NO2:NO3 exposed rebar samples did not show noticeable corrosion products on the surface due to their significantly improved corrosion inhibition and the formation of protective oxide films.
The commercially available corrosion inhibitors, Sika and Yara, were tested in SCPS containing 0.6 M NaCl with carbon steel rebar at 25 °C [41]. The concentrations of commercial inhibitor were determined from a 1:1 ratio of total inhibitor (NO2 and NO3) to chloride ions in solution. The Nyquist plot in Figure 8 shows the EIS results of the two commercial inhibitors and a control sample with no inhibitor present. The Sika inhibitor showed larger corrosion resistance values than the Yara inhibitor, as the Sika inhibitor contained a two-fold higher weight fraction of NO2 inhibitor than Yara. Additionally, the parameters obtained from the EIS test and fitting of the values to the EEC in Figure 2 are shown in Table 4.
The Rf values obtained showed the higher development of the Sika compared to the Yara commercial corrosion inhibitor blend; however, both inhibitors showed Rf values nearly one order of magnitude higher than those for the control sample. The Rct values showed a greater difference between the inhibitors with Sika measuring 1.25 × 10⁷ Ω cm2, while the Yara inhibitor measured 2.44 × 10⁵ Ω cm2. The Sika inhibitor also displayed the lowest capacitance for the film and the electrochemical double layer, indicating improved passive film formation and the greatest corrosion resistance of the two mixtures.
The CPP curves of the commercial corrosion inhibitor blends tested are shown in Figure 9. The Sika and Yara samples showed similar trends with increased Ecorr values (see Table 5), negative hysteresis and decreased current values. The Sika sample showed the most noble Ecorr with a value of −292 mVSCE and the Yara with a value of −337 mVSCE; both values were more noble than the control, indicating less susceptibility of the surface to corrosion. Furthermore, the icorr values calculated by Tafel analysis showed the same trend, with the Sika sample having an icorr value of 9.38 × 10⁻⁷ A/cm2, above that of the Yara sample of 5.83 × 10⁻⁷ A/cm2.
Finally, both commercial corrosion inhibitors blends displayed negative hysteresis during the reverse scan, indicating less active surfaces after polarization and stable passive film formation. Both commercial NO2:NO3 blends imparted corrosion inhibition to steel rebars in SCPS; however, the Sika blend enabled an improved stable passive film with decreased dissolution kinetics.
The optimized structures and molecular electrostatic potential mapping, shown in Figure 10, enabled elucidation of the Mulliken atomic charges (MAC) (see Figure 10a,b). It was observed that the electron density did not vary greatly over the molecules, leading to flat adsorption on the metal surface with contact of each atom. However, for the NO3, the charge difference was greater, with a positive MAC located on the central N atom due to the resonance of the π-bonding between the N and the O atoms which have a higher electron affinity [42].
The highest occupied molecular orbital (HOMO) and lowest unoccupied molecular orbital (LUMO) surfaces are shown in Figure 11. The HOMO surfaces provide information on the sites of the molecule in which the most loosely bound electrons are likely to be donated to the metal, while the LUMO surfaces show the regions in which electrons from the metal are likely to be back-donated to the inhibitor [41,43]. For NO2, the largest portion of the HOMO concentrated around the π-bonds of the oxygen bonding where resonance occurs. The LUMO of the NO2 was concentrated near the nitrogen end of the molecule. The HOMO of the NO3 showed outer oxygen molecules, while the LUMO was symmetrical and evenly spread across the molecule.
The computed quantum properties of the HOMO and LUMO electronic state energies EHOMO and ELUMO, respectively, and the energy gap (ΔE), and dipole moment (µD) are listed in Table 6. Higher values of EHOMO were associated with enhanced ability of the inhibitor to donate electrons to the vacant metal atom orbitals, and lower values of ELUMO indicated an increased tendency of the inhibitor to accept back-donated electrons from the metal atoms [44]. The ΔE value can be used to assess the relative reactivity of the inhibitor molecule to the metal atom; lower ΔE values may indicate better inhibition efficiency [45,46]. From these DFT calculations and the trends described, it was determined that NO2 behaved as a superior corrosion inhibitor relative to NO3 due to its higher EHOMO and lower ΔE. Additionally, the µD values of the inhibitors were close in value; however, the higher µD of the NO2 may also have contributed to its increased corrosion inhibition [47].

4. Conclusions

The corrosion protection of inhibitor mixtures of NaNO2 and NaNO3 were studied in SCPS contaminated with 0.6 M NaCl using CPP and EIS electrochemical techniques. The results were correlated with quantum calculation results from DFT analysis. The following conclusions can be drawn:
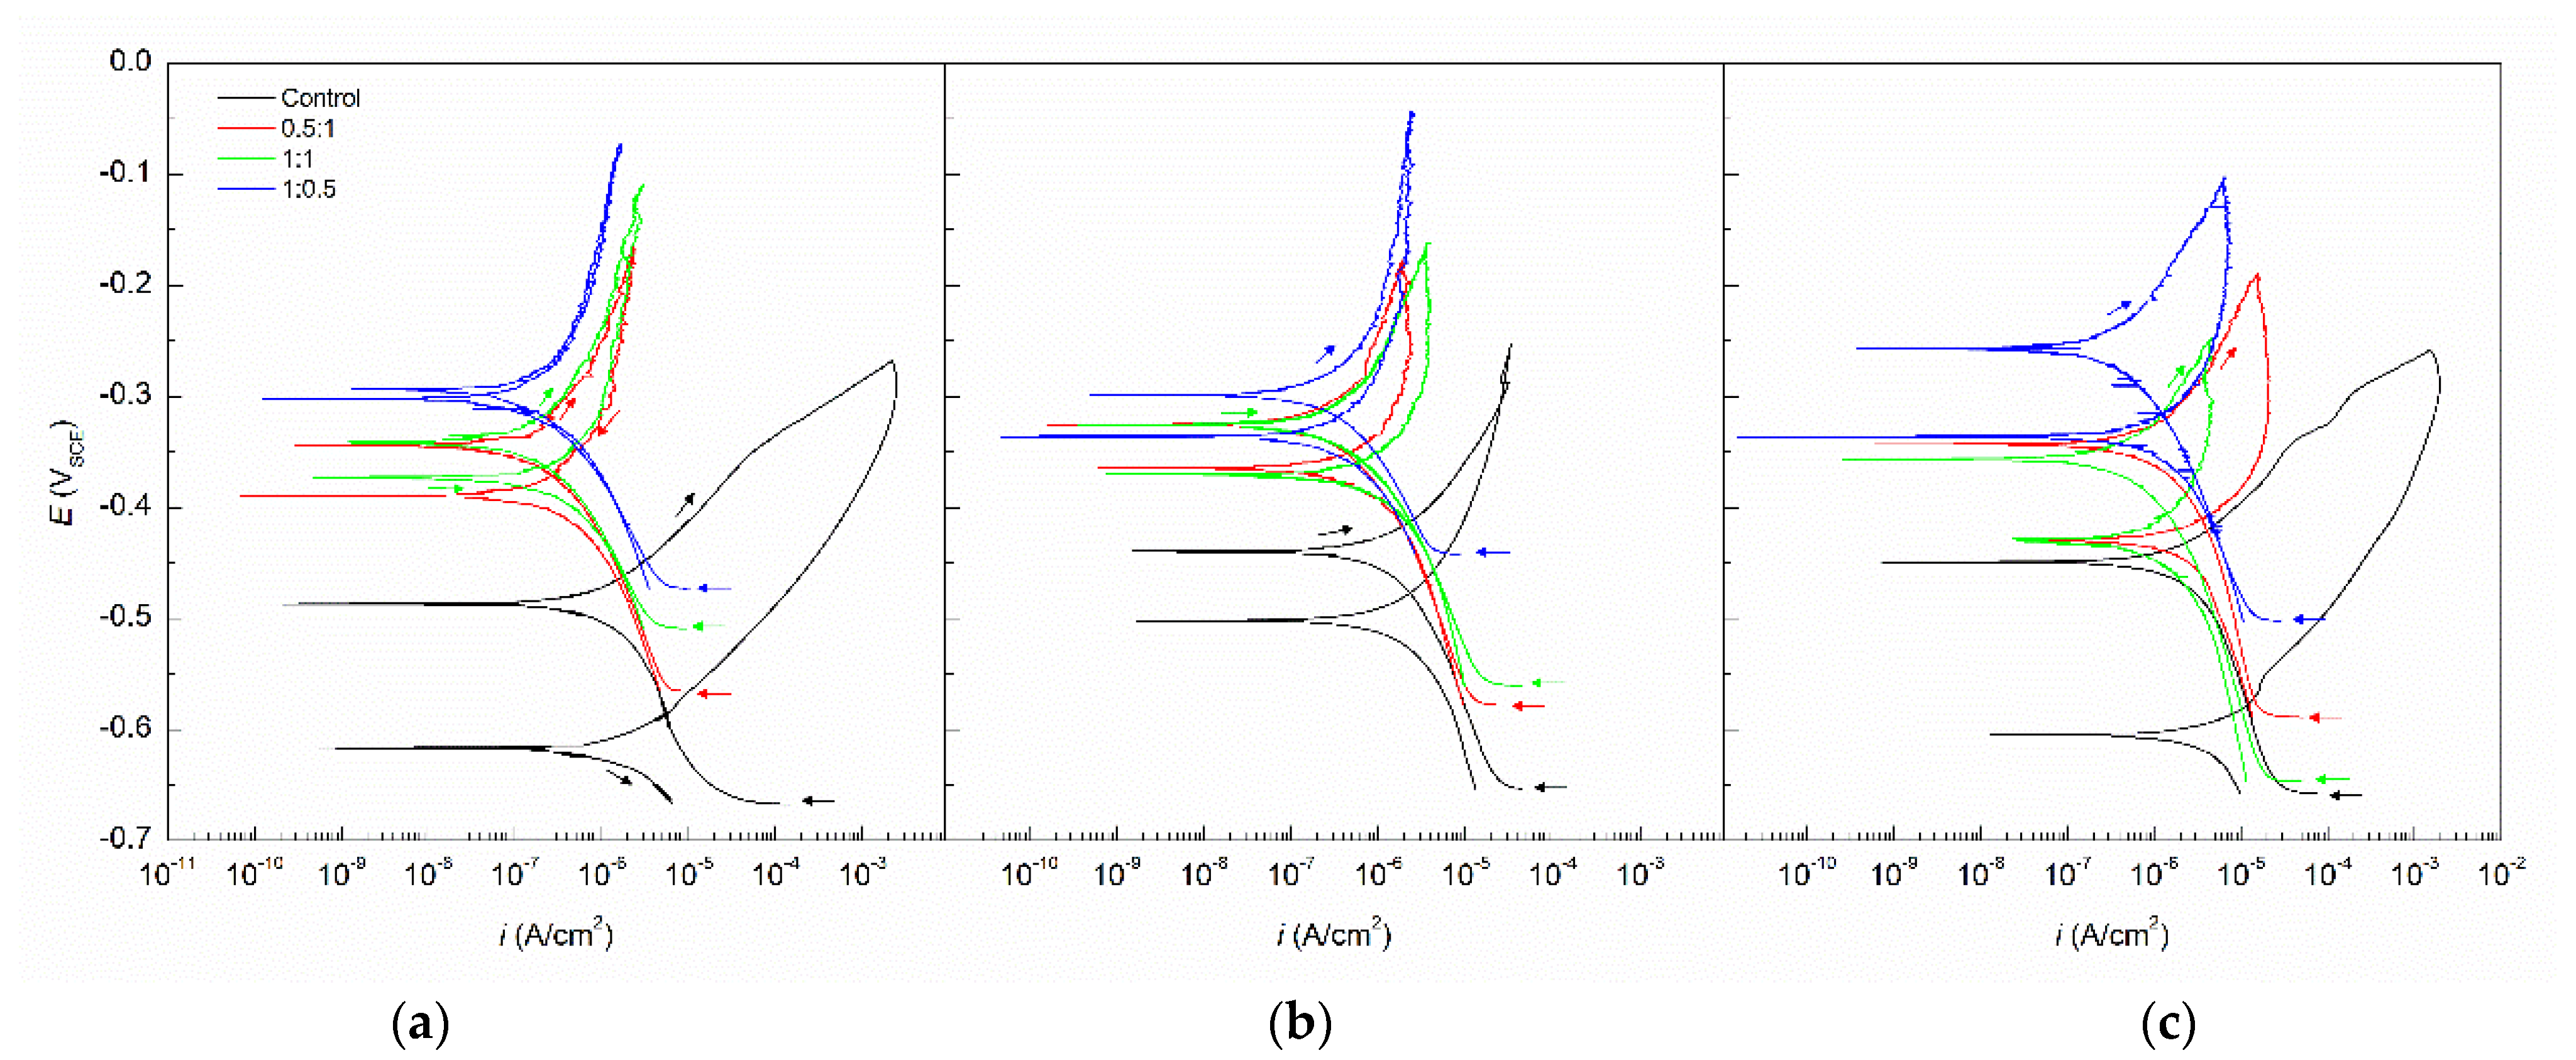
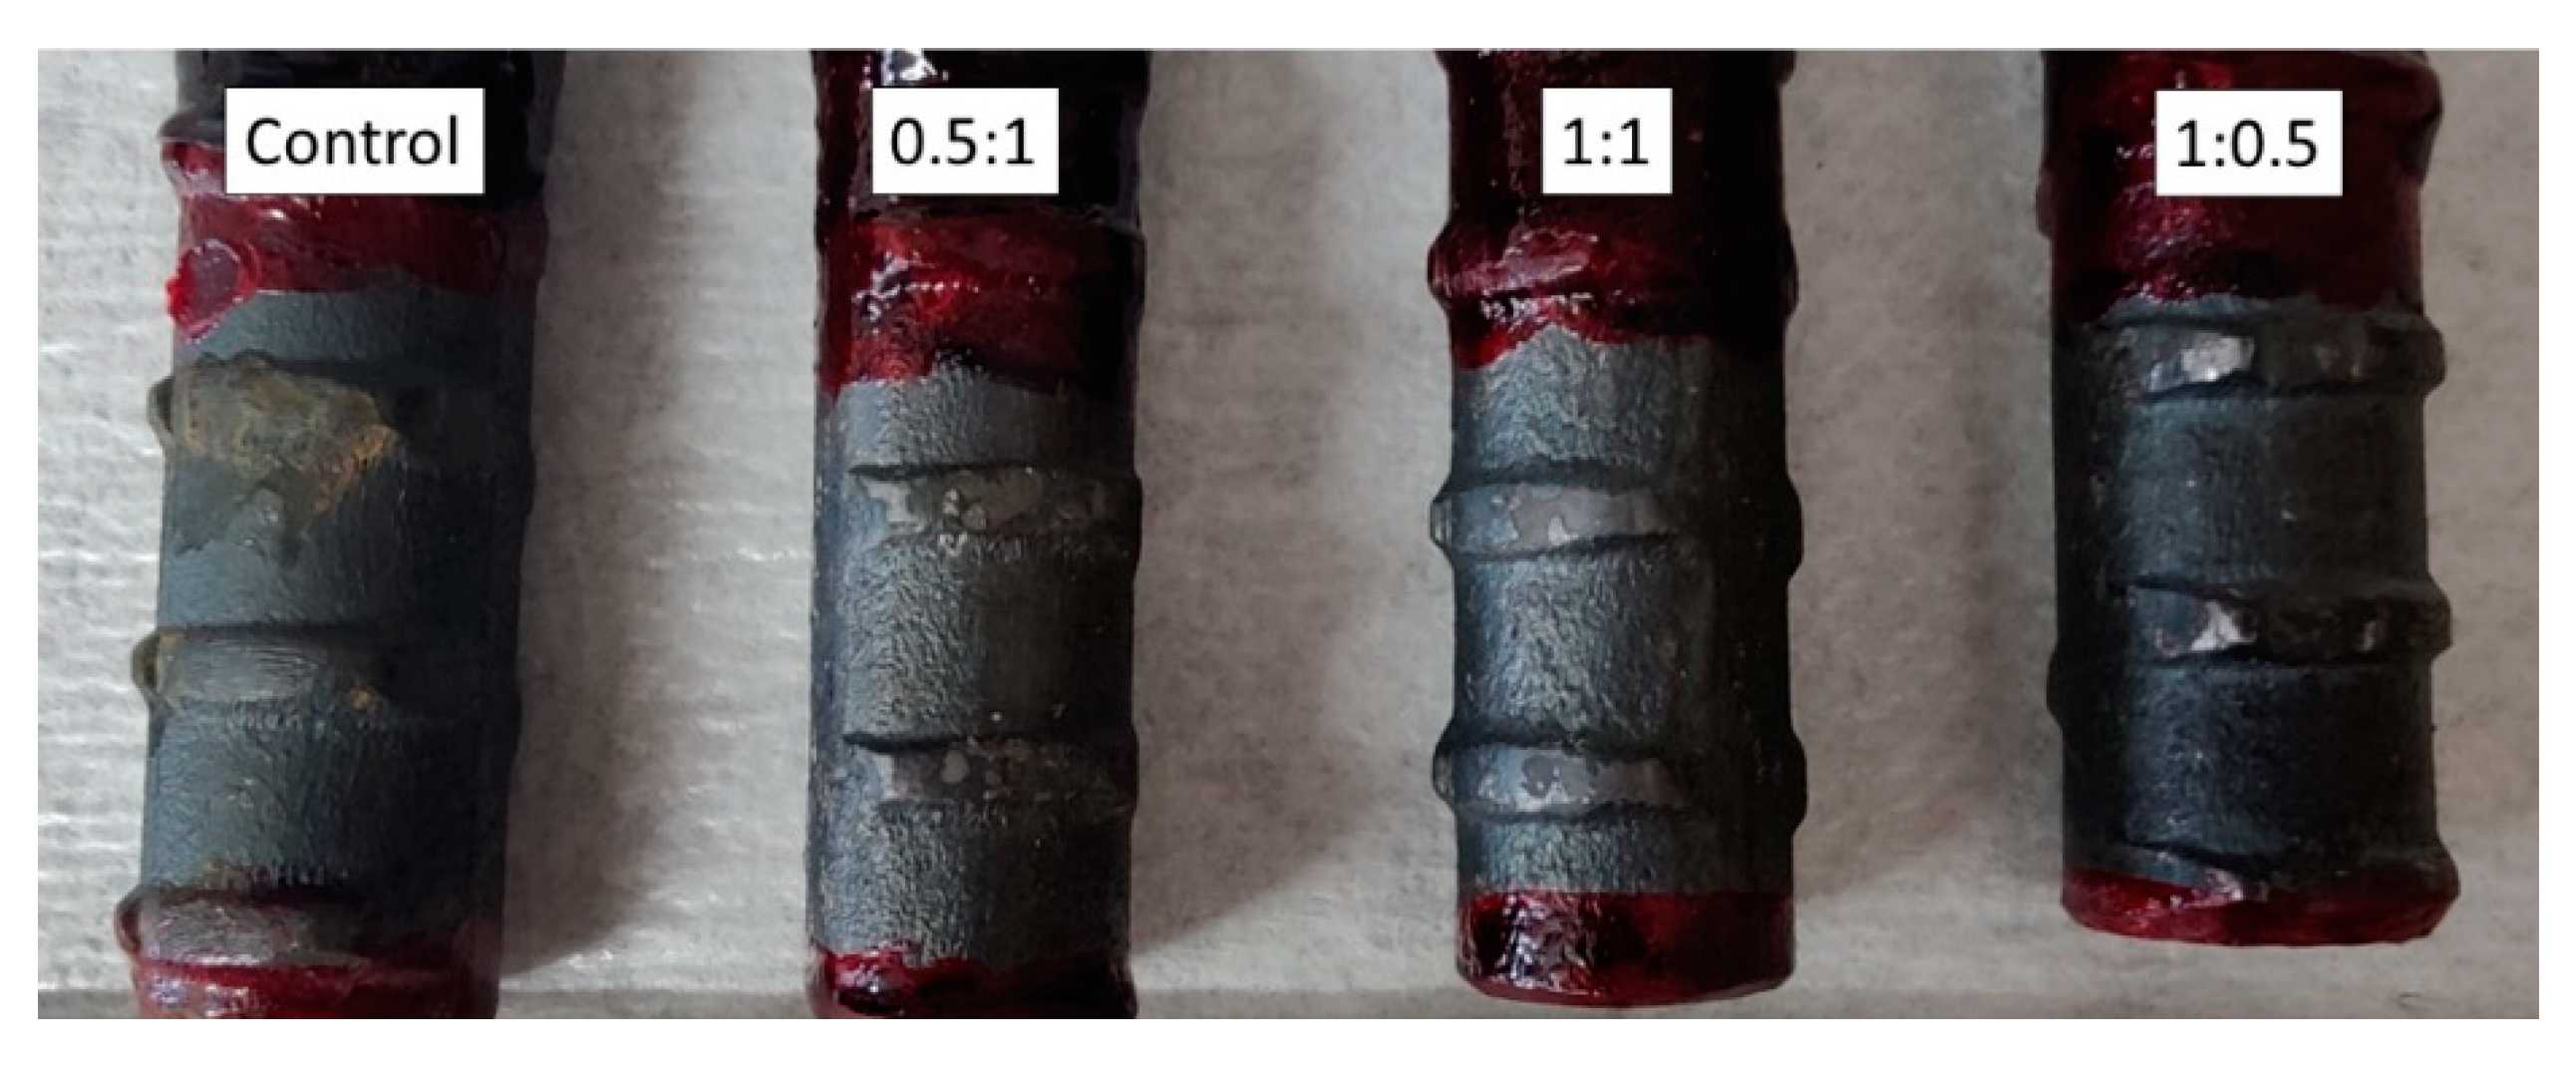
  • A mixture of NaNO2 and NaNO3 corrosion inhibitors can successfully protect carbon steel rebar in simulated concrete pore solution with 0.6 M NaCl. All mixtures tested, including 1:0.5, 1:1, and 0.5:1 NO2:NO3 ratios, showed improvement in the corrosion properties compared to the control test with no inhibitors. The best performing inhibitor mixture was the 1:0.5 ratio, showing an icorr of 1.16 × 10⁻⁷ A/cm2 at 25 °C.
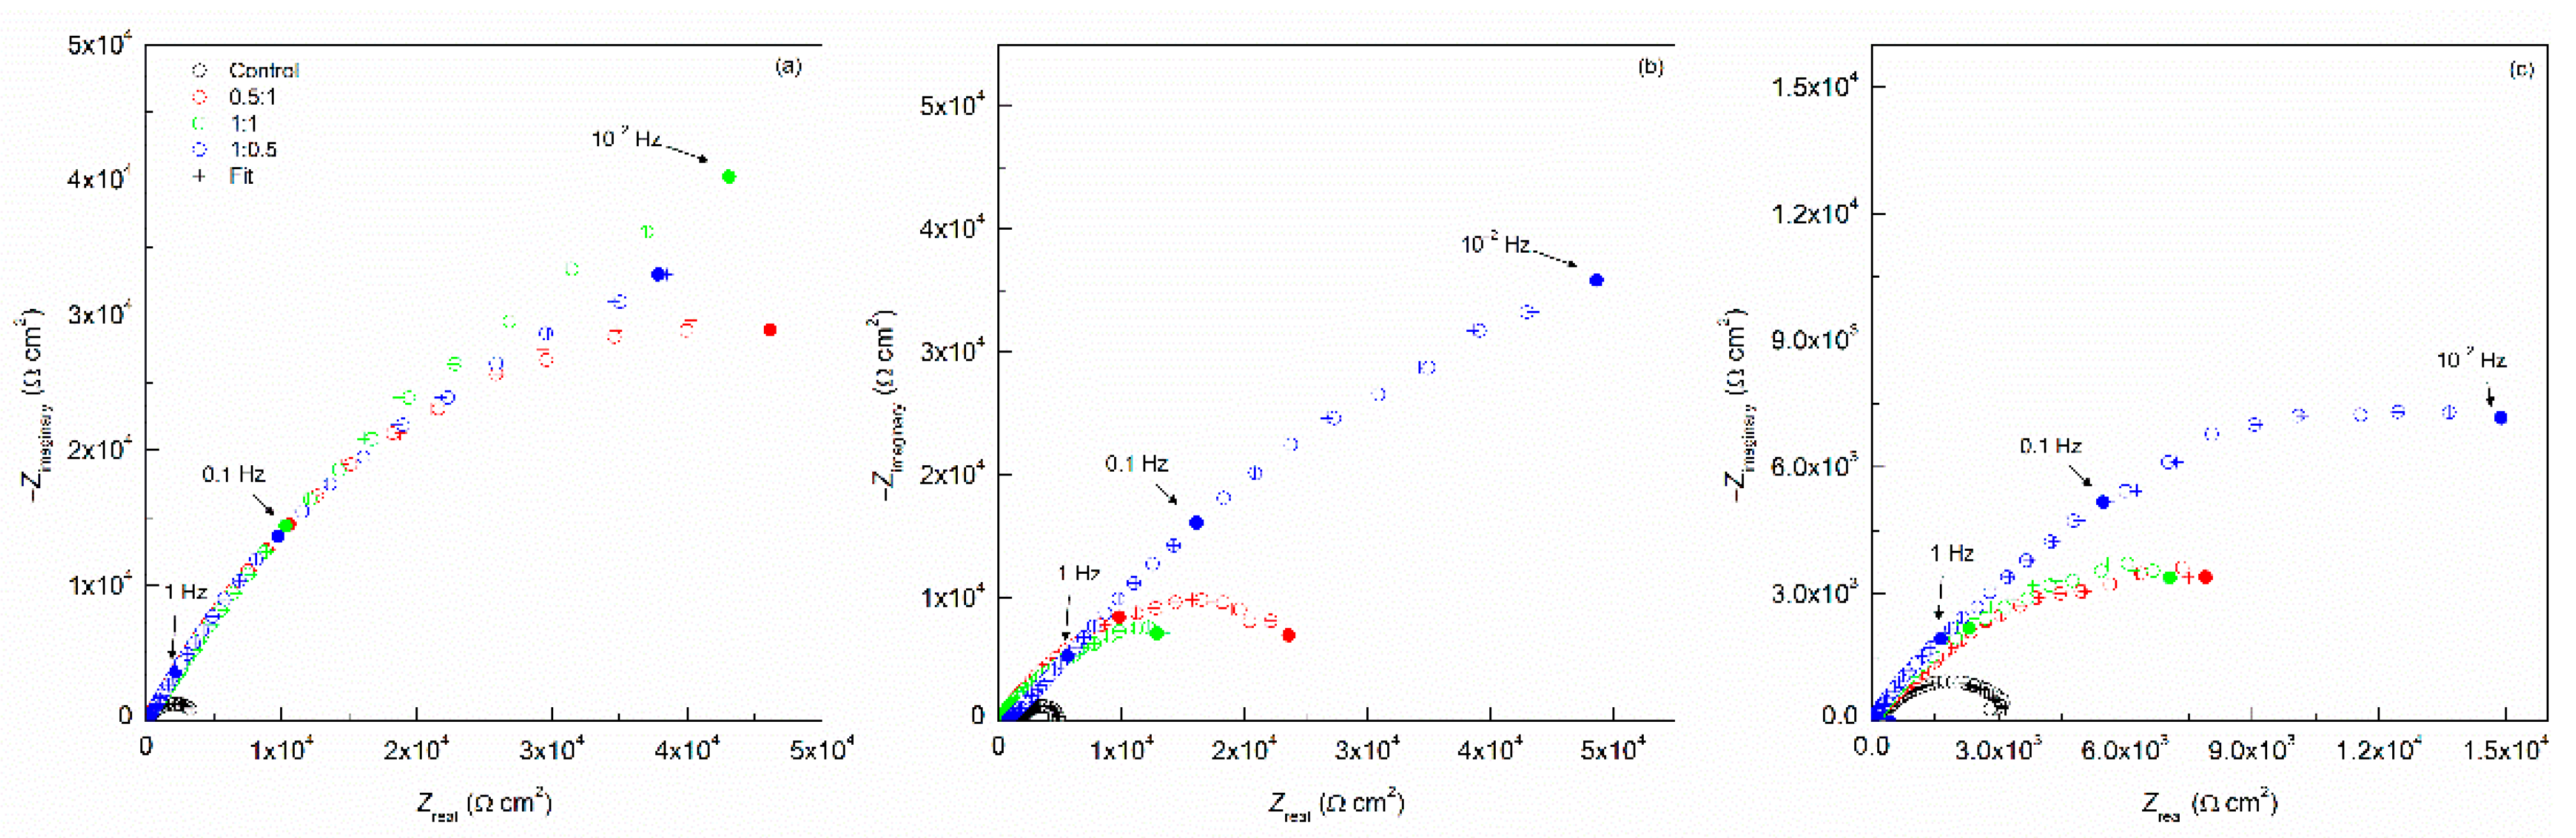
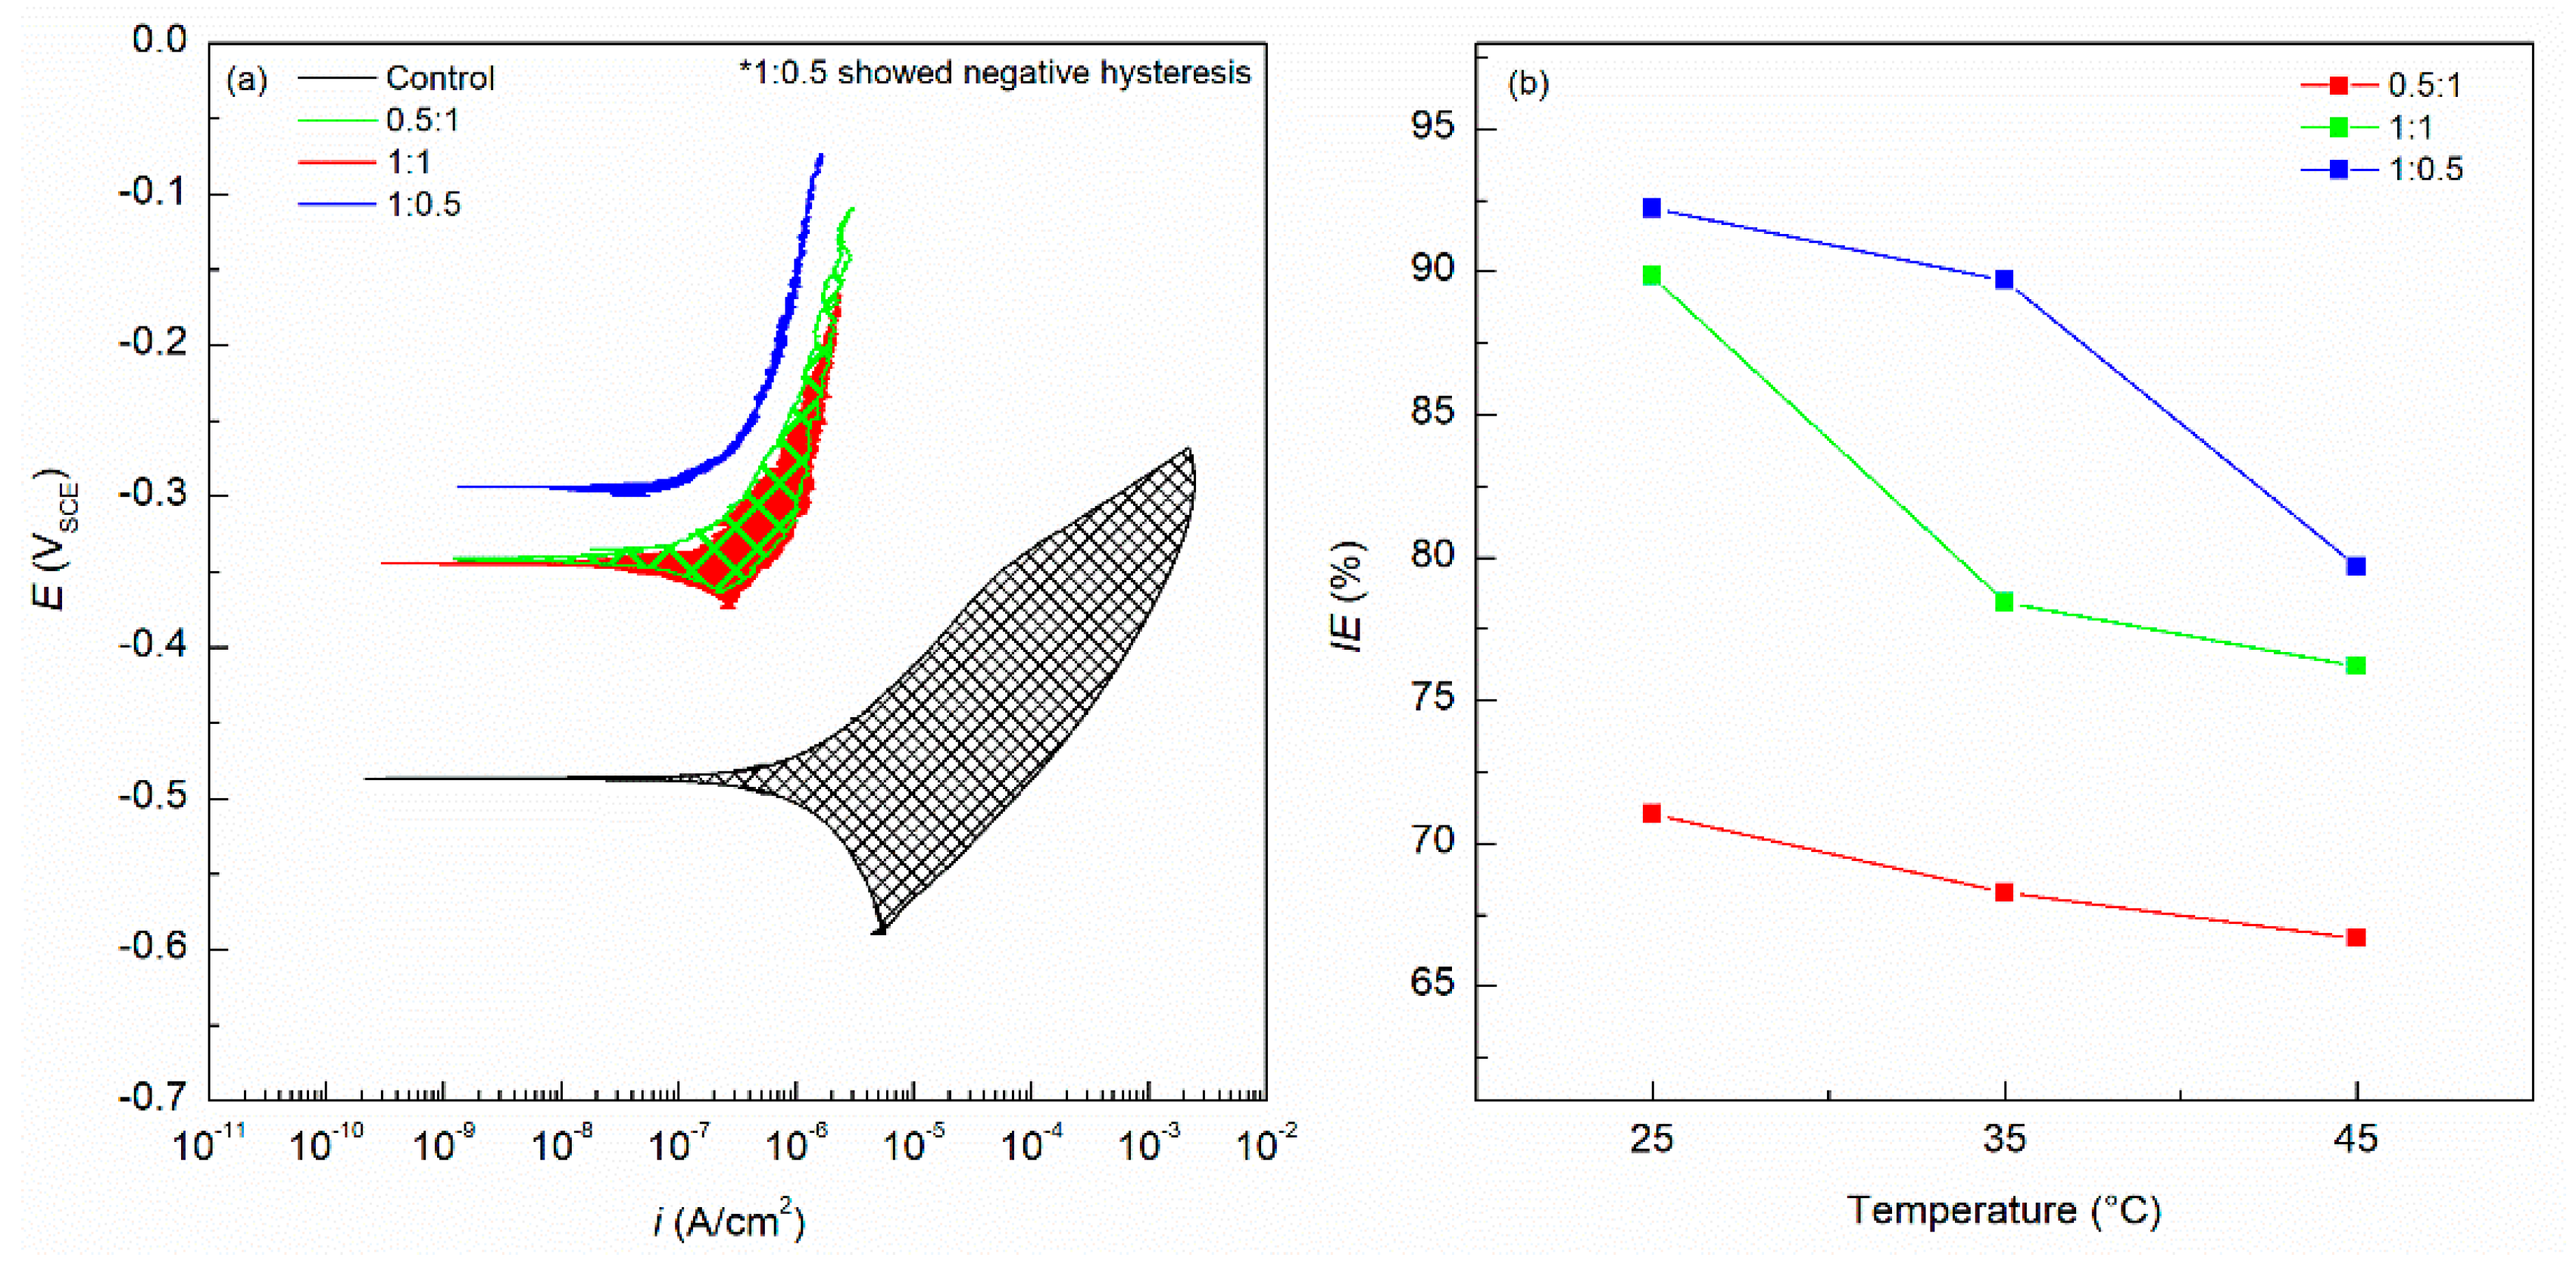
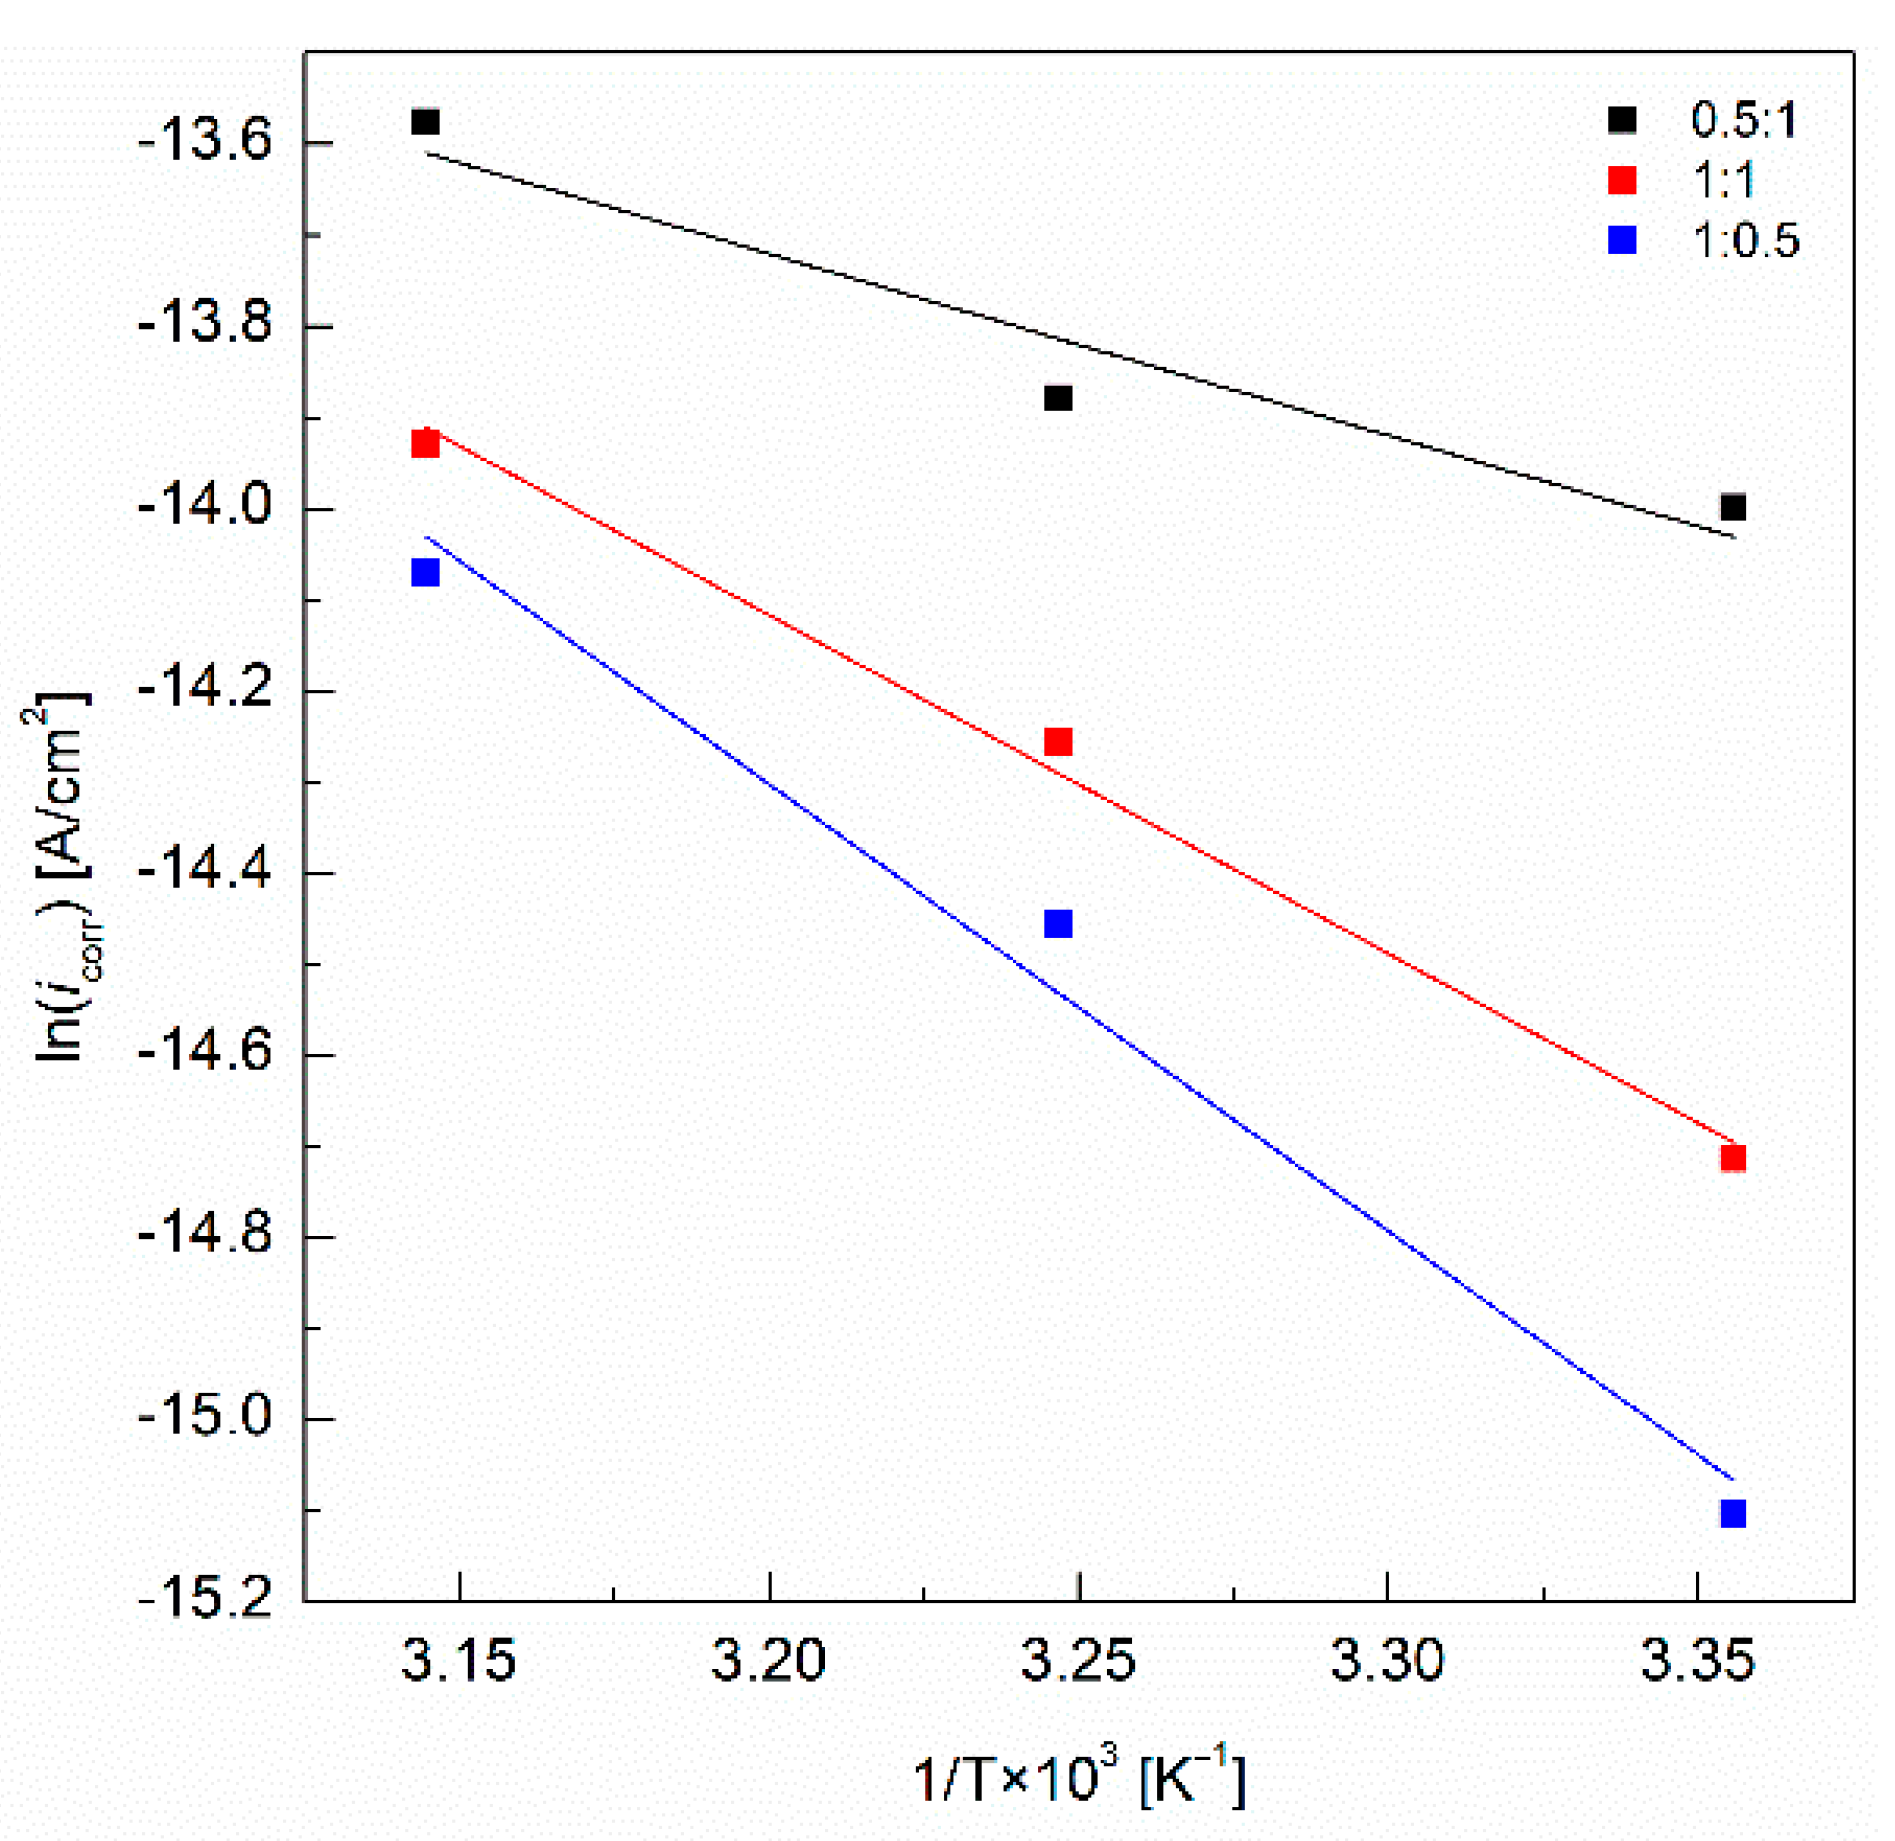
  • Greater concentrations of NO2 were associated with higher corrosion inhibition; specifically, the 1:0.5 and 1:1 NO2:NO3 solutions showed the lowest icorr and highest resistance values associated with passive film (Rf) values of 1.67 × 10³ and 1.60 × 10³ Ω cm2, respectively, and corrosion process (Rct) values of 1.31 × 10⁵ and 2.39 × 10⁵ Ω cm2, respectively. The activation energy (Ea) also followed this trend, the 1:0.5 inhibitor mixture showing the highest activation energy of 12.1 kJ/mol, indicating that a greater energy barrier needed to be overcome for the corrosion process to be initiated with higher amounts of nitrite compared to nitrate inhibitors. Therefore, the dominating inhibitor in the mixture was found to be NO2. The inhibitor blends of 1:0.5 and 1:1 NaNO2:NaNO3 showed the best corrosion inhibition; thus, the optimal ratio is 1:1 to maximize inhibition efficiency while minimizing NO2, as it is toxic and can be harmful to the environment.
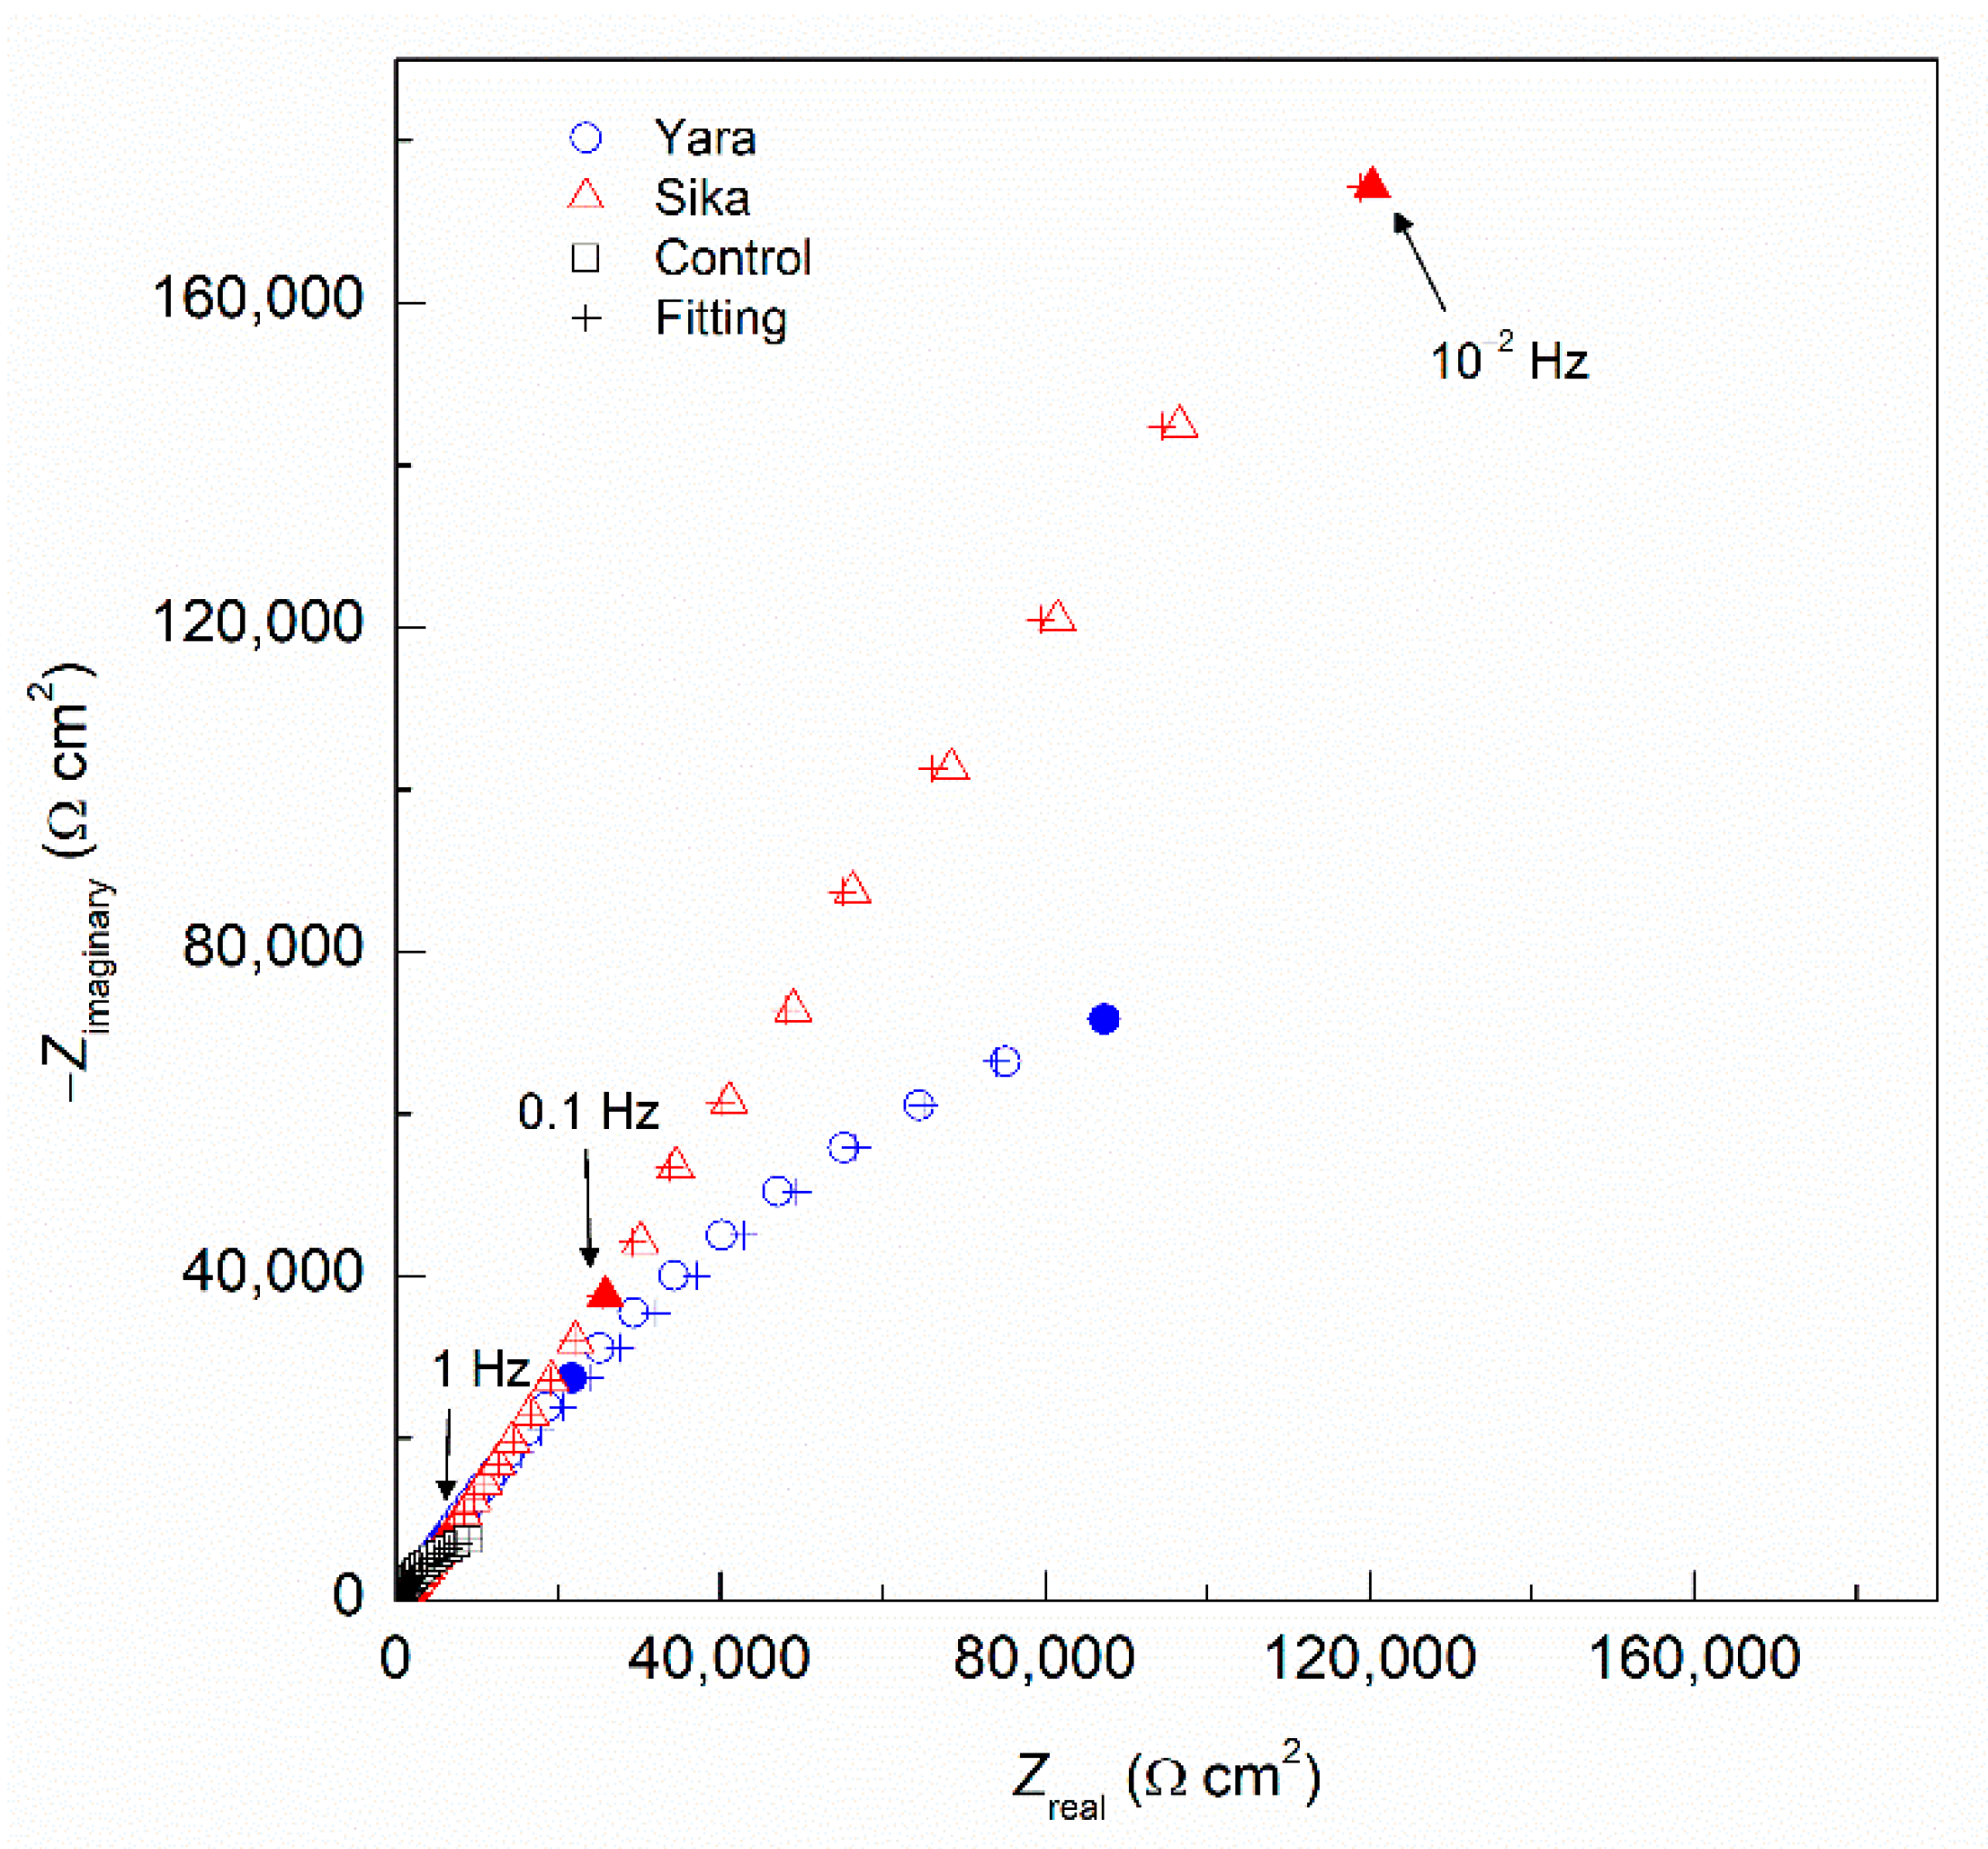
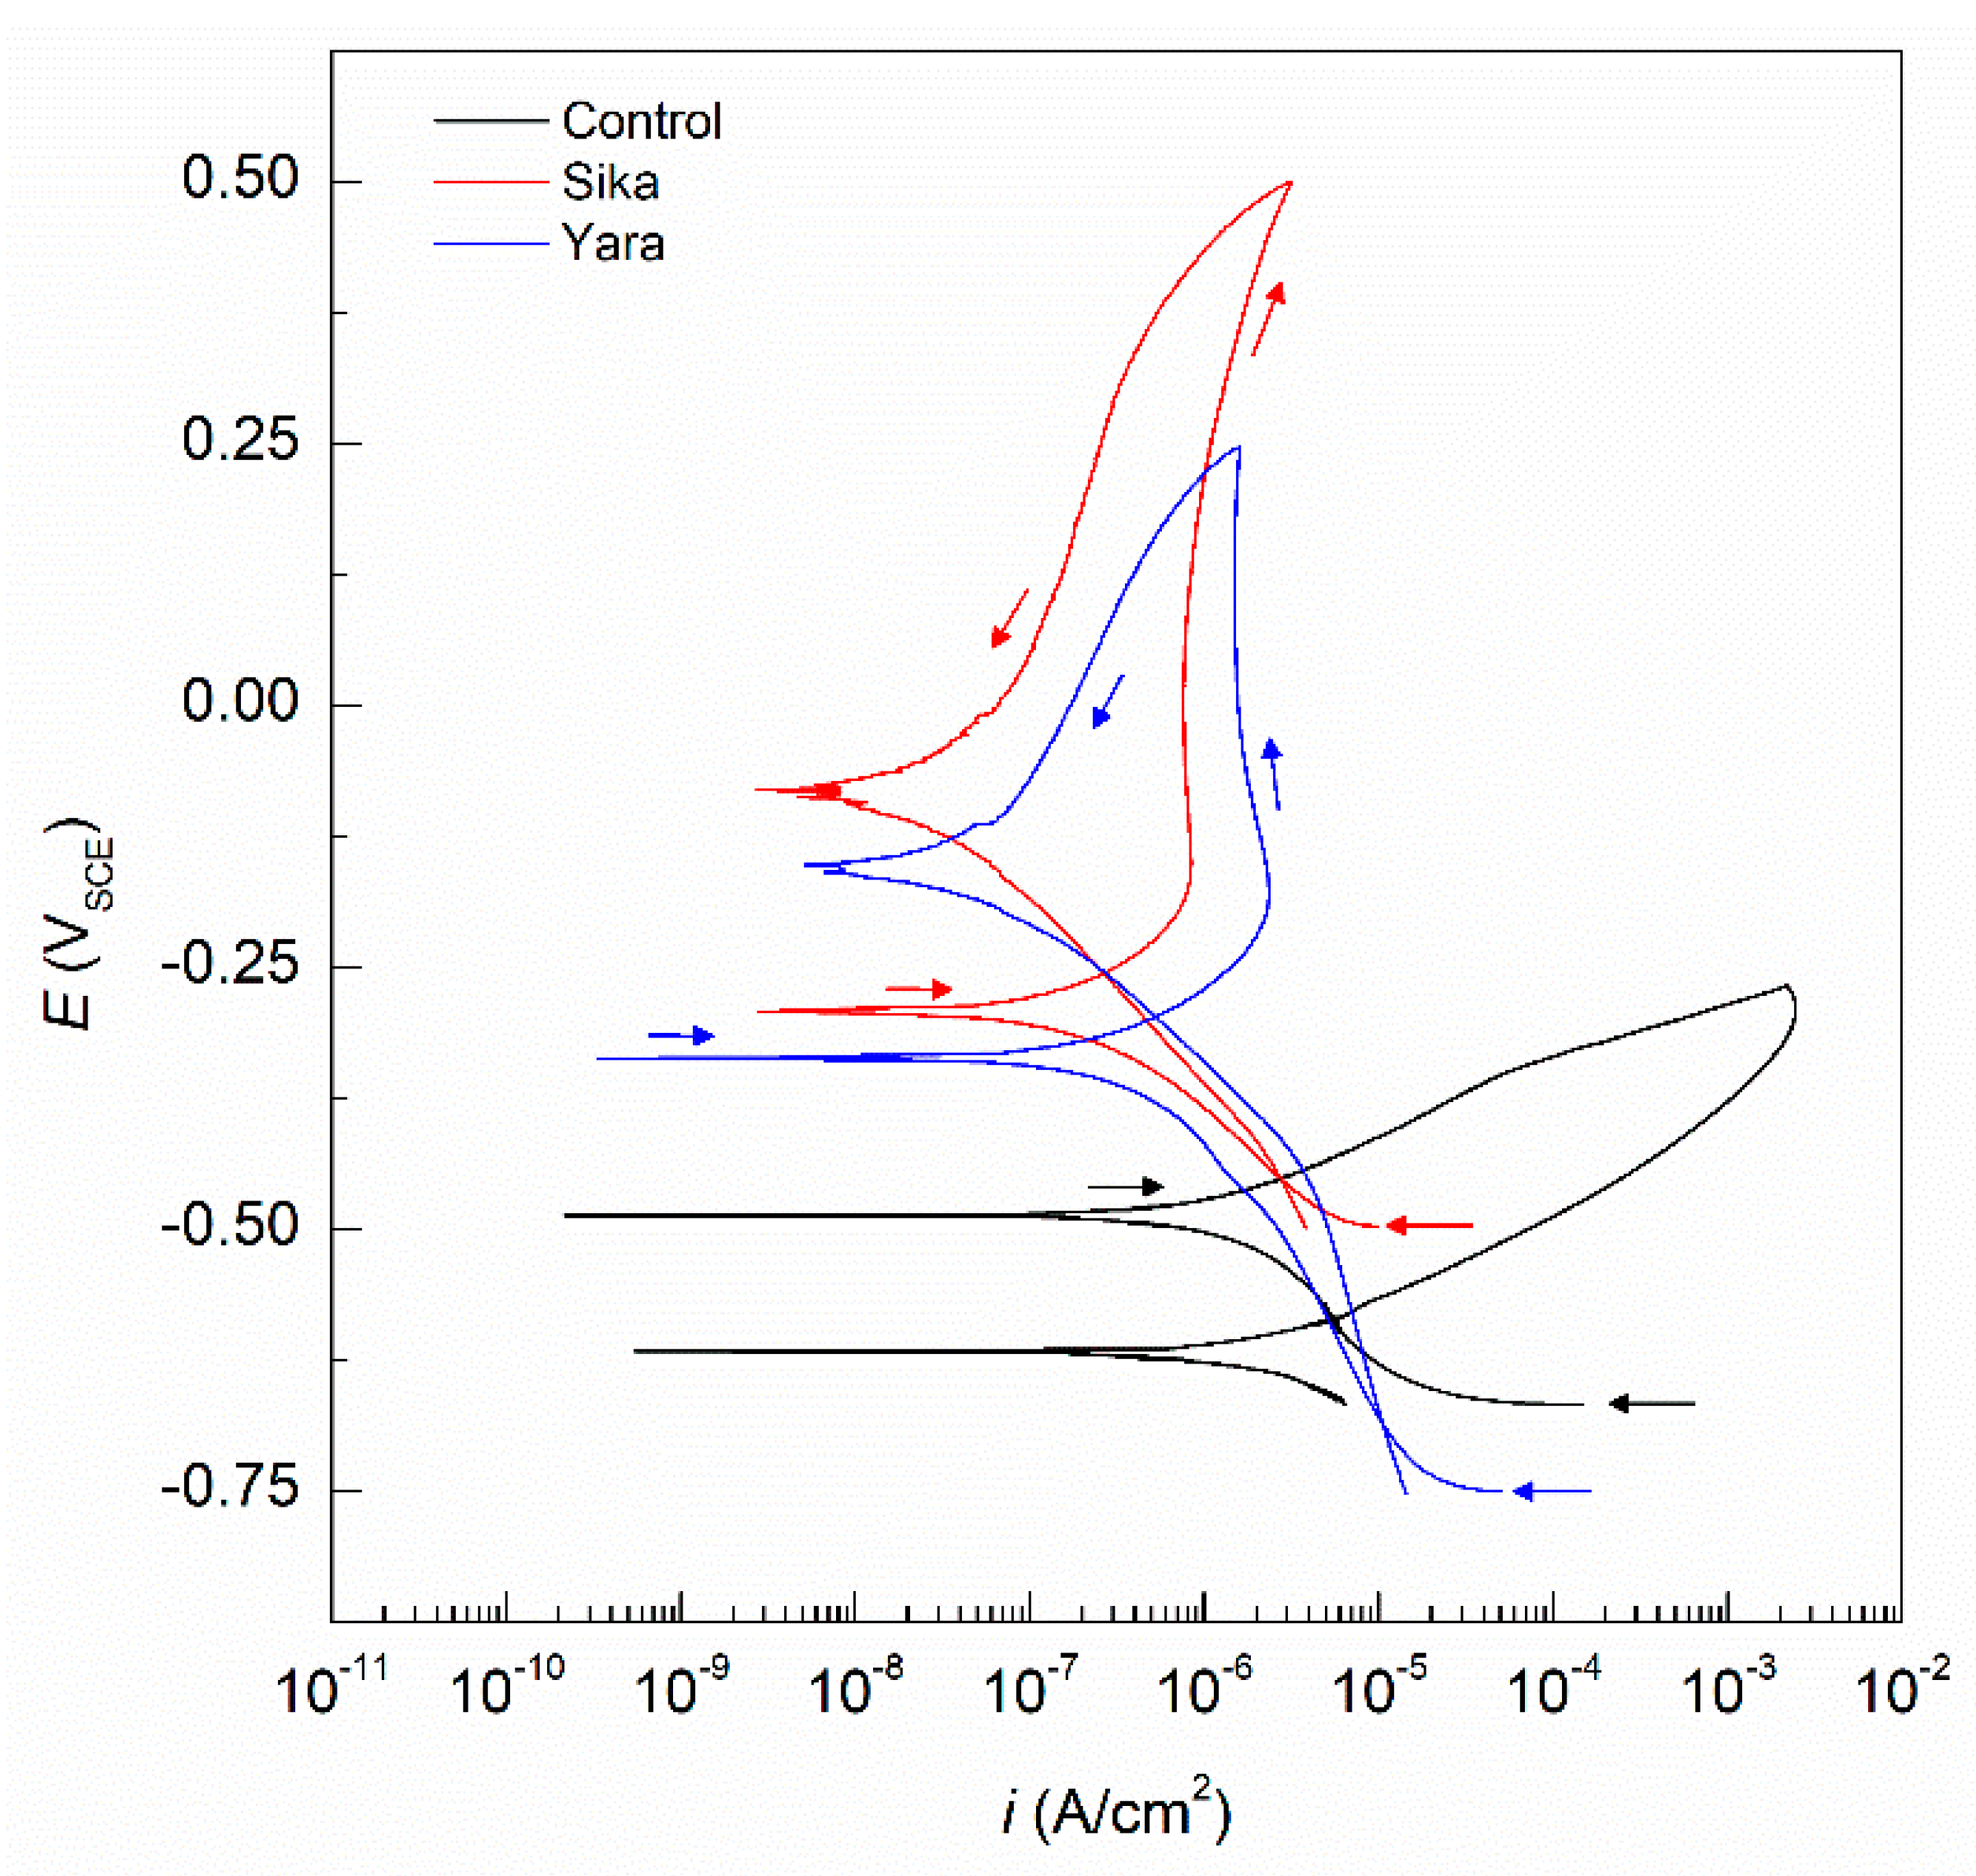
  • Finally, by comparison of two commercially available mixtures, the inhibitor mixture with the higher nitrite concentration (Sika) showed the most passive Ecorr of −292 mVSCE and a lower icorr of 4.27 × 10⁻⁷ A/cm2, corroborating the hypothesis that nitrite dominated the inhibition process of the NO2:NO3 mixture.
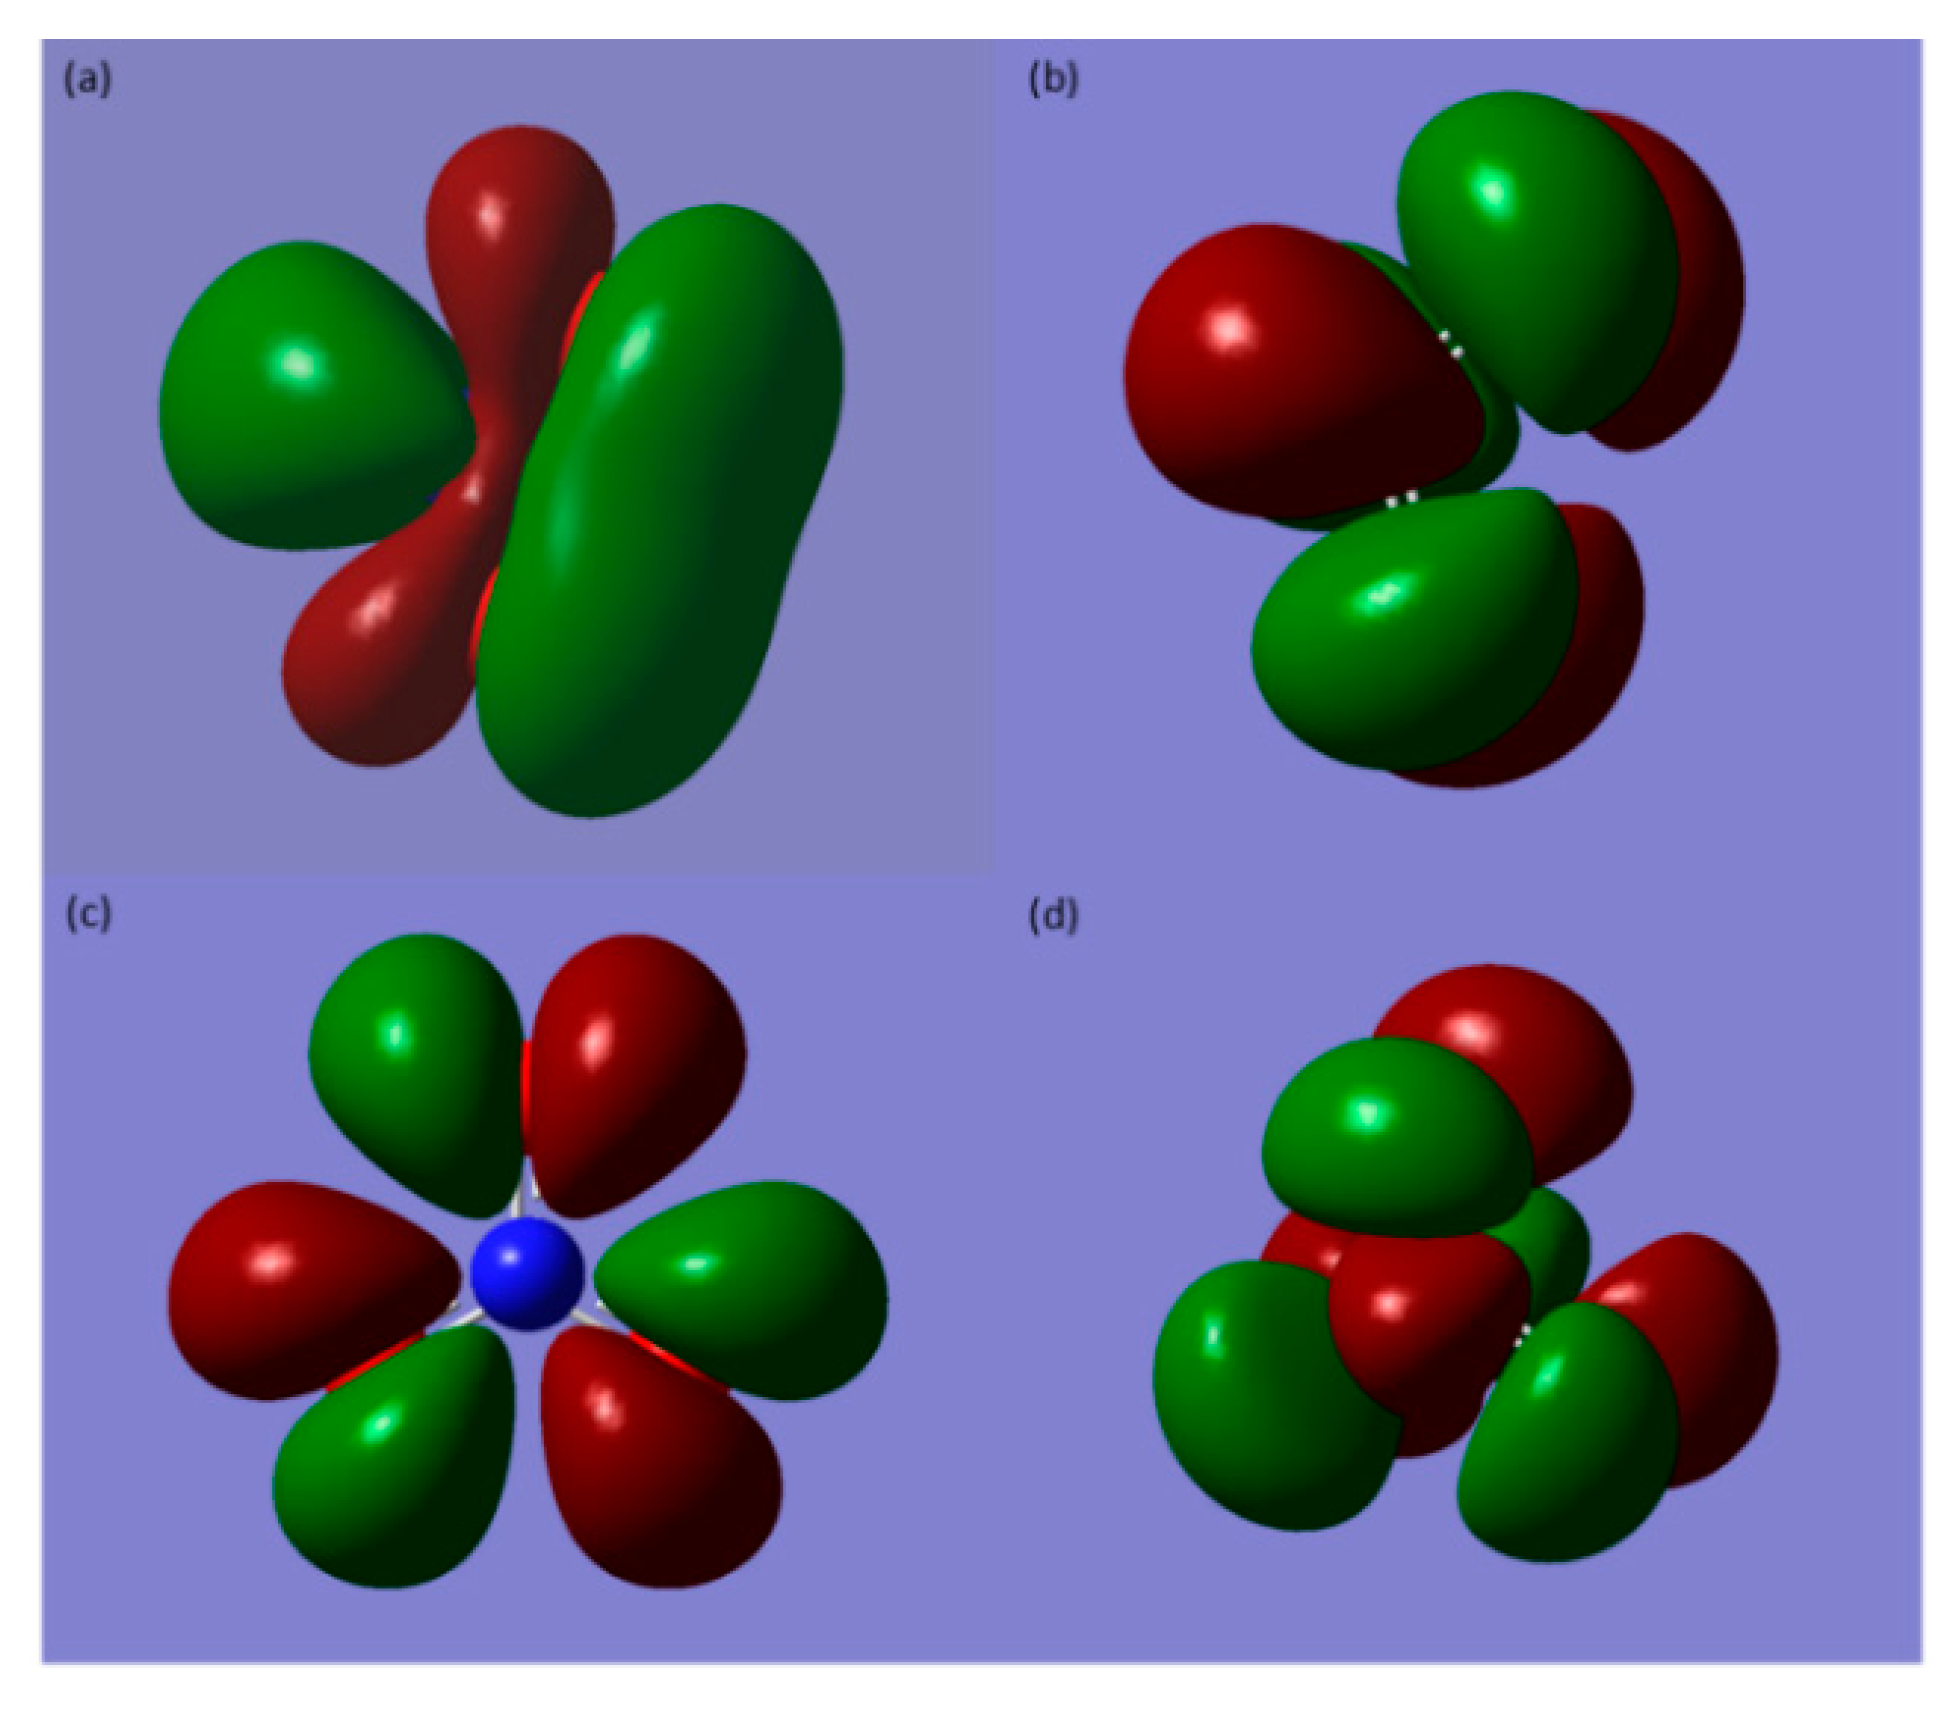
  • By DFT analysis of the inhibitors, the EHOMO, ELUMO, ΔE, and dipole moment values obtained were found to be consistent with the experimental results. The EHOMO values indicated that nitrite more readily donated its electrons to the metal atoms and that the ΔE was lower, −5.74 eV, for the higher nitrite mixture (1:0.5), which has been correlated with better corrosion inhibition in the literature.

Author Contributions

Conceptualization, D.M.B.; methodology, J.R., U.M., K.B. and D.M.B.; formal analysis, J.R., U.M., K.B. and D.M.B.; investigation, J.R., U.M., K.B. and D.M.B.; resources, D.M.B.; data curation, J.R., U.M., K.B. and D.M.B.; writing—original draft preparation, J.R., U.M., K.B. and D.M.B.; writing—review and editing, J.R. and D.M.B.; visualization, D.M.B.; supervision, D.M.B.; project administration, D.M.B.; funding acquisition, D.M.B. All authors have read and agreed to the published version of the manuscript.

Funding

This research was funded by Firestone Research, grant number 639430, and The University of Akron Fellowship, grant numbers FRC-207160 and FRC-207865.

Institutional Review Board Statement

Not applicable.

Informed Consent Statement

Not applicable.

Data Availability Statement

The raw/processed data required to reproduce these findings cannot be shared at this time as the data also forms part of an ongoing study.

Acknowledgments

The authors acknowledge the technical support and facilities from The National Center for Education and Research on Corrosion and Materials Performance (NCERCAMP-UA), The College of Engineering and Polymer Science and The University of Akron.

Conflicts of Interest

The authors declare no conflict of interest.

References

  1. Bastidas, D.M.; Cobo, A.; Otero, E.; González, J.A. Electrochemical rehabilitation methods for reinforced concrete structures: Advantages and pitfalls. Corros. Eng. Sci. Technol. 2008, 43, 248–255. [Google Scholar] [CrossRef] [Green Version]
  2. Martin, U.; Ress, J.; Bosch, J.; Bastidas, D.M. Stress corrosion cracking mechanism of AISI 316LN stainless steel rebars in chloride contaminated concrete pore solution using the slow strain rate technique. Electrochimica Acta 2019, 335, 135565. [Google Scholar] [CrossRef]
  3. Bastidas, D.M.; González, J.A.; Feliu, S.; Cobo, A.; Miranda, J.M. A quantitative study of concrete-embedded steel corrosion using potentiostatic pulses. Corrosion 2007, 63, 1094–1100. [Google Scholar] [CrossRef]
  4. Prasad, N.K.; Pathak, A.; Kundu, S.; Panchal, P.; Mondal, K. On the novel approach of sacrificial cathodic protection of mild steel in simulated concrete pore solution and concrete mortar by high phosphorus pig iron anodes. J. Mater. Res. Technol. 2021, 14, 582–608. [Google Scholar] [CrossRef]
  5. Ress, J.; Martin, U.; Bosch, J.; Bastidas, D.M. Protection of carbon steel rebars by epoxy coating with smart environmentally friendly microcapsules. Coatings 2021, 11, 113. [Google Scholar] [CrossRef]
  6. Ress, J.; Martin, U.; Bastidas, D.M. Improved corrosion protection of acrylic waterborne coating by doping with microencapsulated corrosion inhibitors. Coatings 2021, 11, 1134. [Google Scholar] [CrossRef]
  7. Bolzoni, F.; Brenna, A.; Ormellese, M. Recent advances in the use of inhibitors to prevent chloride-induced corrosion in reinforced concrete. Cem. Concr. Res. 2022, 154, 106719. [Google Scholar] [CrossRef]
  8. Ress, J.; Martin, U.; Bosch, J.; Bastidas, D.M. pH-triggered release of NaNO2 corrosion inhibitors from novel colophony microcapsules in simulated concrete pore solution. ACS Appl. Mater. Interfaces 2020, 12, 46686–46700. [Google Scholar] [CrossRef]
  9. Bastidas, D.M.; Martin, U.; Bastidas, J.M.; Ress, J. Corrosion inhibition mechanism of steel reinforcements in mortar using soluble phosphates: A critical review. Materials 2021, 14, 6168. [Google Scholar] [CrossRef]
  10. Bastidas, D.M.; La Iglesia, V.; Criado, M.; Fajardo, S.; La Iglesia, A.; Bastidas, J.M. A prediction study of hydroxyapatite entrapment ability in concrete. Constr. Build. Mater. 2010, 24, 2646–2649. [Google Scholar] [CrossRef]
  11. Leek, D.S. The passivity of steel in concrete. Q. J. Eng. Geol. Hydrogeol. 1991, 24, 55–66. [Google Scholar] [CrossRef]
  12. Feng, W.; Tarakbay, A.; Memon, S.A.; Tang, W.; Cui, H. Methods of accelerating chloride-induced corrosion in steel-reinforced concrete: A comparative review. Constr. Build. Mater. 2021, 289, 123165. [Google Scholar] [CrossRef]
  13. Andrade, C. Evaluation of the degree of carbonation of concretes in three environments. Constr. Build. Mater. 2019, 230, 116804. [Google Scholar] [CrossRef]
  14. Das, J.K.; Pradhan, B. Study on influence of nitrite and phosphate based inhibiting admixtures on chloride interaction, rebar corrosion, and microstructure of concrete subjected to different chloride exposures. J. Build. Eng. 2022, 50. [Google Scholar] [CrossRef]
  15. Das, J.K.; Pradhan, B. Effect of sodium nitrite on chloride-induced corrosion of steel in concrete. Mater. Today Proc. 2022. [Google Scholar] [CrossRef]
  16. Zuo, J.; Wu, B.; Luo, C.; Dong, B.; Xing, F. Preparation of MgAl layered double hydroxides intercalated with nitrite ions and corrosion protection of steel bars in simulated carbonated concrete pore solution. Corros. Sci. 2019, 152, 120–129. [Google Scholar] [CrossRef]
  17. Zhou, Y.; Oehmen, A.; Lim, M.; Vadivelu, V.; Ng, W.J. The role of nitrite and free nitrous acid (FNA) in wastewater treatment plants. Water Res. 2011, 45, 4672–4682. [Google Scholar] [CrossRef]
  18. Khani, H.; Arefinia, R. Inhibition mechanism of nitrite on the corrosion of carbon steel in simulated cooling water systems. Mater. Corros. 2017, 69, 337–347. [Google Scholar] [CrossRef]
  19. Karim, S.; Mustafa, C.M.; Assaduzzaman, M.; Islam, M. Effect of nitrate ion on corrosion inhibition of mild steel in simulated cooling water. Chem. Eng. Res. Bull. 2010, 14, 87–91. [Google Scholar] [CrossRef] [Green Version]
  20. Maliekkal, B.P.; Kakkassery, J.T.; Palayoor, V.R. Efficacies of sodium nitrite and sodium citrate–zinc acetate mixture to inhibit steel rebar corrosion in simulated concrete interstitial solution contaminated with NaCl. Int. J. Ind. Chem. 2018, 9, 105–114. [Google Scholar] [CrossRef] [Green Version]
  21. Ramasubramanian, M.; Haran, B.S.; Popova, S.; Popov, B.N.; Petrou, M.; White, R.E. Inhibiting action of calcium nitrite on carbon steel rebars. J. Mater. Civ. Eng. 2001, 13, 10–17. [Google Scholar] [CrossRef] [Green Version]
  22. Saricimen, H.; Mohammad, M.; Quddus, A.; Shameem, M.; Barry, M. Effectiveness of concrete inhibitors in retarding rebar corrosion. Cem. Concr. Compos. 2002, 24, 89–100. [Google Scholar] [CrossRef]
  23. Tommaselli, M.; Mariano, N.; Kuri, S. Effectiveness of corrosion inhibitors in saturated calcium hydroxide solutions acidified by acid rain components. Constr. Build. Mater. 2009, 23, 328–333. [Google Scholar] [CrossRef]
  24. Dhouibi, L.; Triki, E.; Raharinaivo, A. The application of electrochemical impedance spectroscopy to determine the long-term effectiveness of corrosion inhibitors for steel in concrete. Cem. Concr. Compos. 2002, 24, 35–43. [Google Scholar] [CrossRef]
  25. Xu, W.; Zhang, B.; Deng, Y.; Yang, L.; Zhang, J. Nitrate on localized corrosion of carbon steel and stainless steel in aqueous solutions. Electrochim. Acta 2020, 369, 137660. [Google Scholar] [CrossRef]
  26. Lee, H.-S.; Shin, S.-W. Evaluation on the effect of lithium nitrite corrosion inhibitor by the corrosion sensors embedded in mortar. Constr. Build. Mater. 2007, 21, 1–6. [Google Scholar] [CrossRef]
  27. Pradhan, B. A study on effectiveness of inorganic and organic corrosion inhibitors on rebar corrosion in concrete: A review. Mater. Today Proc. 2022. [Google Scholar] [CrossRef]
  28. Xu, P.; Zhou, J.; Li, G.; Wang, P.; Wang, P.; Li, F.; Zhang, B.; Chi, H. Corrosion inhibition efficiency of compound nitrite with D-sodium gluconate on carbon steel in simulated concrete pore solution. Constr. Build. Mater. 2021, 288, 123101. [Google Scholar] [CrossRef]
  29. Tsikas, D. Analysis of nitrite and nitrate in biological fluids by assays based on the Griess reaction: Appraisal of the Griess reaction in the l-arginine/nitric oxide area of research. J. Chromatogr. B 2007, 851, 51–70. [Google Scholar] [CrossRef]
  30. Griess, P. On a new series of bodies in which nitrogen substituted for hydrogen. Philos. Trans. R. Soc. Lond. 1864, 154, 667–731. [Google Scholar] [CrossRef] [Green Version]
  31. Çopuroğlu, O.; Fraaij, A.; Bijen, J. Effect of sodium monofluorophosphate treatment on microstructure and frost salt scaling durability of slag cement paste. Cem. Concr. Res. 2006, 36, 1475–1482. [Google Scholar] [CrossRef]
  32. Becke, A.D. Density-functional exchange-energy approximation with correct asymptotic behavior. Phys. Rev. A 1988, 38, 3098–3100. [Google Scholar] [CrossRef] [PubMed]
  33. Ditchfield, R.; Hehre, W.J.; Pople, J.A. Self-consistent molecular-orbital methods. IX. An extended Gaussian-type basis for molecular-orbital studies of organic molecules. J. Chem. Phys. 1971, 54, 724–728. [Google Scholar] [CrossRef]
  34. Brug, G.J.; Van Den Eeden, A.L.G.; Sluyters-Rehbach, M.; Sluyters, J.H. The analysis of electrode impedances complicated by the presence of a constant phase element. J. Electroanal. Chem. Interfacial Electrochem. 1984, 176, 275–295. [Google Scholar] [CrossRef]
  35. Mansfeld, F.; Shih, H.; Greene, H.; Tsai, C.H. Analysis of EIS Data for Common Corrosion Processes; Scully, J.R., Silverman, C., Kendig, M.W., Eds.; ASTM International: West Conshohocken, PA, USA, 1993; pp. 37–53. [Google Scholar]
  36. Liu, J.; Macdonald, D.D. The passivity of iron in the presence of ethylenediaminetetraacetic acid. II. The defect and electronic structures of the barrier layer. J. Electrochem. Soc. 2001, 148, B425–B430. [Google Scholar] [CrossRef]
  37. Garcés, P.; Saura, P.; Zornoza, E.; Andrade, C. Influence of pH on the nitrite corrosion inhibition of reinforcing steel in simulated concrete pore solution. Corros. Sci. 2011, 53, 3991–4000. [Google Scholar] [CrossRef]
  38. Montemor, M.F.; Simoes, A.; Ferreira, M. Analytical characterization of the passive film formed on steel in solutions simulating the concrete interstitial electrolyte. Corrosion 1998, 54, 347–353. [Google Scholar] [CrossRef]
  39. Paredes, C.; Bautista, M.A.; Alvarez, S.; Velasco, F.J. Influence of the forming process of corrugated stainless steels on their corrosion behaviour in simulated pore solutions. Corros. Sci. 2012, 58, 52–61. [Google Scholar] [CrossRef] [Green Version]
  40. Ellobody, E. Chapter 2—Nonlinear Material Behavior of the Bridge Components. In Finite Element Analysis and Design of Steel and Steel-Concrete Composite Bridges; Butterworth-Heinemann: Oxford, UK, 2014; pp. 47–111. [Google Scholar]
  41. Sayed, A.; El-Lateef, H. Thiocarbohydrazones based on adamantane and ferrocene as efficient corrosion inhibitors for hydrochloric acid pickling of C-steel. Coatings 2020, 10, 1068. [Google Scholar] [CrossRef]
  42. Mohamed, A.; Visco, D.P.; Bastidas, D.M. Significance of π–electrons in the design of corrosion inhibitors for carbon steel in simulated concrete pore solution. Corrosion 2021, 77, 976–990. [Google Scholar] [CrossRef]
  43. Hadisaputra, S.; Purwoko, A.; Savalas, L.; Prasetyo, N.; Yuanita, E.; Hamdiani, S. Quantum chemical and Monte Carlo simulation studies on inhibition performance of caffeine and its derivatives against corrosion of copper. Coatings 2020, 10, 1086. [Google Scholar] [CrossRef]
  44. Hamani, H.; Daoud, D.; Benabid, S.; Douadi, T. Electrochemical, density functional theory (DFT) and molecular dynamic (MD) simulations studies of synthesized three news Schiff bases as corrosion inhibitors on mild steel in the acidic environment. J. Indian Chem. Soc. 2022, 99, 100492. [Google Scholar] [CrossRef]
  45. Obi-Egbedi, N.; Obot, I.; El-Khaiary, M.I. Quantum chemical investigation and statistical analysis of the relationship between corrosion inhibition efficiency and molecular structure of xanthene and its derivatives on mild steel in sulphuric acid. J. Mol. Struct. 2011, 1002, 86–96. [Google Scholar] [CrossRef]
  46. Niamien, P.; Essy, K.F.; Trokourey, A.; Yapi, A.; Aka, H.; Diabate, D. Correlation between the molecular structure and the inhibiting effect of some benzimidazole derivatives. Mater. Chem. Phys. 2012, 136, 59–65. [Google Scholar] [CrossRef]
  47. Ebenso, E.E.; Isabirye, D.A.; Eddy, N.O. Adsorption and quantum chemical studies on the inhibition potentials of some thiosemicarbazides for the corrosion of mild steel in acidic medium. Int. J. Mol. Sci. 2010, 11, 2473–2498. [Google Scholar] [CrossRef]
Figure 1. Nyquist plots of NaNO2 and NaNO3 obtained in simulated concrete pore solution contaminated with 0.6 M NaCl under constant temperature of (a) 25 °C, (b) 35 °C, and (c) 45 °C.
Coatings 12 00861 g001
Figure 2. The electrochemical equivalent circuit model of the EIS data for carbon steel rebar in SCPS contaminated with 0.6 M Cl in the presence of both NaNO2 and NaNO3 corrosion inhibitors.
Coatings 12 00861 g002
Figure 3. CPP plots of NaNO2 and NaNO3 obtained in SCPS contaminated with 0.6 M NaCl under constant temperature of (a) 25 °C, (b) 35 °C, and (c) 45 °C.
Coatings 12 00861 g003
Figure 4. The representation of (a) the anodic areas of the CPP curves at 25 °C in SCPS with 0.6 M NaCl, and (b) the IE obtained from SCPS with 0.6M NaCl at 25, 35, and 45 °C.
Coatings 12 00861 g004
Figure 5. Arrhenius plots for the corrosion inhibitor mixtures of 0.5:1, 1:1, and 1:0.5 NaNO2:NO3 in 0.6 M NaCl.
Coatings 12 00861 g005
Figure 6. SEM and EDX images for steel rebar exposed to (a,d) 0.5:1, (b,e) 1:1, and (c,f) 1:0.5 molar ratios of NO2:NO3 in SCPS contaminated with 0.6 M NaCl.
Coatings 12 00861 g006
Figure 7. Photographs of the rebars after exposure to SCPS with 0.6 M NaCl and inhibitor blends of 0.5:1, 1:1, and 1:0.5 NaNO2:NaNO3 at 45 °C.
Coatings 12 00861 g007
Figure 8. Nyquist plots for steel rebar exposed to commercial corrosion inhibitors blends (Sika and Yara) in 0.6 M NaCl SCPS.
Coatings 12 00861 g008
Figure 9. CPP curves obtained for steel rebars exposed to commercial corrosion inhibitor blends (Sika and Yara) in SCPS with 0.6 NaCl.
Coatings 12 00861 g009
Figure 10. The optimized molecular structure with Mulliken charges for (a) NO2, and (b) NO3; and the electron density mapping for (c) NO2, and (d) NO3.
Coatings 12 00861 g010
Figure 11. The distribution of electron density for (a) NO2 HOMO, (b) NO2 LUMO, (c) NO3 HOMO, and (d) NO3 LUMO using DFT/B3LYP/6-31G (d, p).
Coatings 12 00861 g011
Table 1. Elemental composition of carbon steel rebar specimens (wt%).
CMnPSSiCuNiCrMoVFe
0.281.080.0190.0430.200.370.160.160.0500.0379Bal.
Table 2. EIS parameters obtained from steel rebars immersed in SCPS with 0.6 M NaCl with and without corrosion inhibitors in molar ratios of 0.5:1, 1:1, and 1:0.5 for NaNO2:NaNO3 at 25, 35, and 45 °C.
Temp.
°C
Molar Ratio
NO2:NO3
Rs
Ω cm2
Rf
Ω cm2
Rct
Ω cm2
Yf
S cm2 snf
nfYdl
S cm2 sndl
ndlχ2Ceff,f
F cm2
Ceff,dl
F cm2
deff
nm
251:0.5191.67 × 1031.31 × 1057.50 × 1050.751.66 × 1060.779.18 × 1043.03 × 1049.40 × 1089
0.5:1181.31 × 1031.09 × 1056.07 × 1050.759.61 × 1060.792.26 × 1034.29 × 1044.18 × 1076
1:1181.60 × 1032.39 × 1057.69 × 1050.728.87 × 1060.729.40 × 1043.74 × 1041.40 × 1077
351:0.5211.92 × 1031.76 × 1055.54 × 1050.763.76 × 1060.803.90 × 1043.78 × 1043.54 × 1077
0.5:1221.61 × 1031.66 × 1048.35 × 1060.764.01 × 1050.789.61 × 1044.98 × 1043.95 × 1055
1:1211.80 × 1031.04 × 1052.28 × 1050.714.44 × 1060.701.70 × 1034.60 × 1044.58 × 1076
451:0.5235.15 × 1031.98 × 1042.44 × 1040.811.40 × 1040.722.04 × 1034.47 × 1047.90 × 1066
0.5:1222.27 × 1039.28 × 1031.89 × 1040.755.83 × 1040.714.69 × 1046.05 × 1041.81 × 1054
1:1243.59 × 1031.34 × 1042.08 × 1040.751.44 × 1040.886.94 × 1045.07 × 1046.16 × 1055
Table 3. Corrosion kinetic parameters obtained from steel rebars immersed in SCPS with 0.6 M NaCl with and without corrosion inhibitors in molar ratios of 0.5:1, 1:1, and 1:0.5 for NaNO2:NaNO3 at 25, 35, and 45 °C.
Temperature
°C
Molar Ratio NO2:NO3Ecorr
mVSCE
icorr
A/cm2
βa
V/dec
βc
V/dec
IE
%
Rp
Ω cm2
25Control−4871.49 × 10−60.0820.126--
0.5:1−3454.32 × 10−70.2290.185711.33 × 105
1:1−3411.51 × 10−70.2570.159901.11 × 105
1:0.5−3031.16 × 10−70.5030.187932.41 × 105
35Control−4402.01 × 10−60.1100.191--
0.5:1−3256.38 × 10−70.1150.096681.78 × 105
1:1−3264.34 × 10−70.2110.142781.82 × 104
1:0.5−2992.07 × 10−70.4120.354901.05 × 105
45Control−4493.81 × 10−60.0980.208--
0.5:1−3431.27 × 10−60.1830.229672.50 × 104
1:1−3059.07 × 10−70.1910.191761.16 × 104
1:0.5−2577.75 × 10−70.2040.201801.72 × 104
Table 4. The EIS parameters obtained for rebar exposed to commercial corrosion inhibitor blends (Sika and Yara) in simulated concrete pore solution with 0.6 M NaCl.
Corrosion
Inhibitor Blend
Rs
Ω cm2
Rf
Ω cm2
Rct
Ω cm2
Yf
S cm–2 snf
nfYdl
S cm–2 sndl
ndlχ2
Yara169692.44 × 1053.02 × 10−50.716.12 × 10−60.752.99 × 10−3
Sika1612301.25 × 1072.82 × 10−50.702.14 × 10−60.784.68 × 10−3
Control21204.72 × 1035.46 × 10−40.849.15 × 10−60.712.74 × 10−3
Table 5. CPP parameters obtained for steel rebars exposed to commercial corrosion inhibitor blends (Sika and Yara) in SCPS with 0.6 NaCl.
Corrosion
Inhibitor Blend
Ecorr
mVSCE
icorr
A/cm2
IE
%
Sika−2924.27 × 10−771
Yara−3365.62 × 10−762
Control−4871.49 × 10−6-
Table 6. Quantum chemical parameters for NO2 and NO3 in aqueous phase calculated using DFT/B3LYP/6-31G (d, p).
InhibitorEHOMO
eV
ELUMO
eV
ΔE
eV
µD
eV
NO2−5.55−0.55−5.74121.91
NO3−6.49−0.78−5.45199.55
Publisher’s Note: MDPI stays neutral with regard to jurisdictional claims in published maps and institutional affiliations.

