3.1. Characterization of the Surfaces
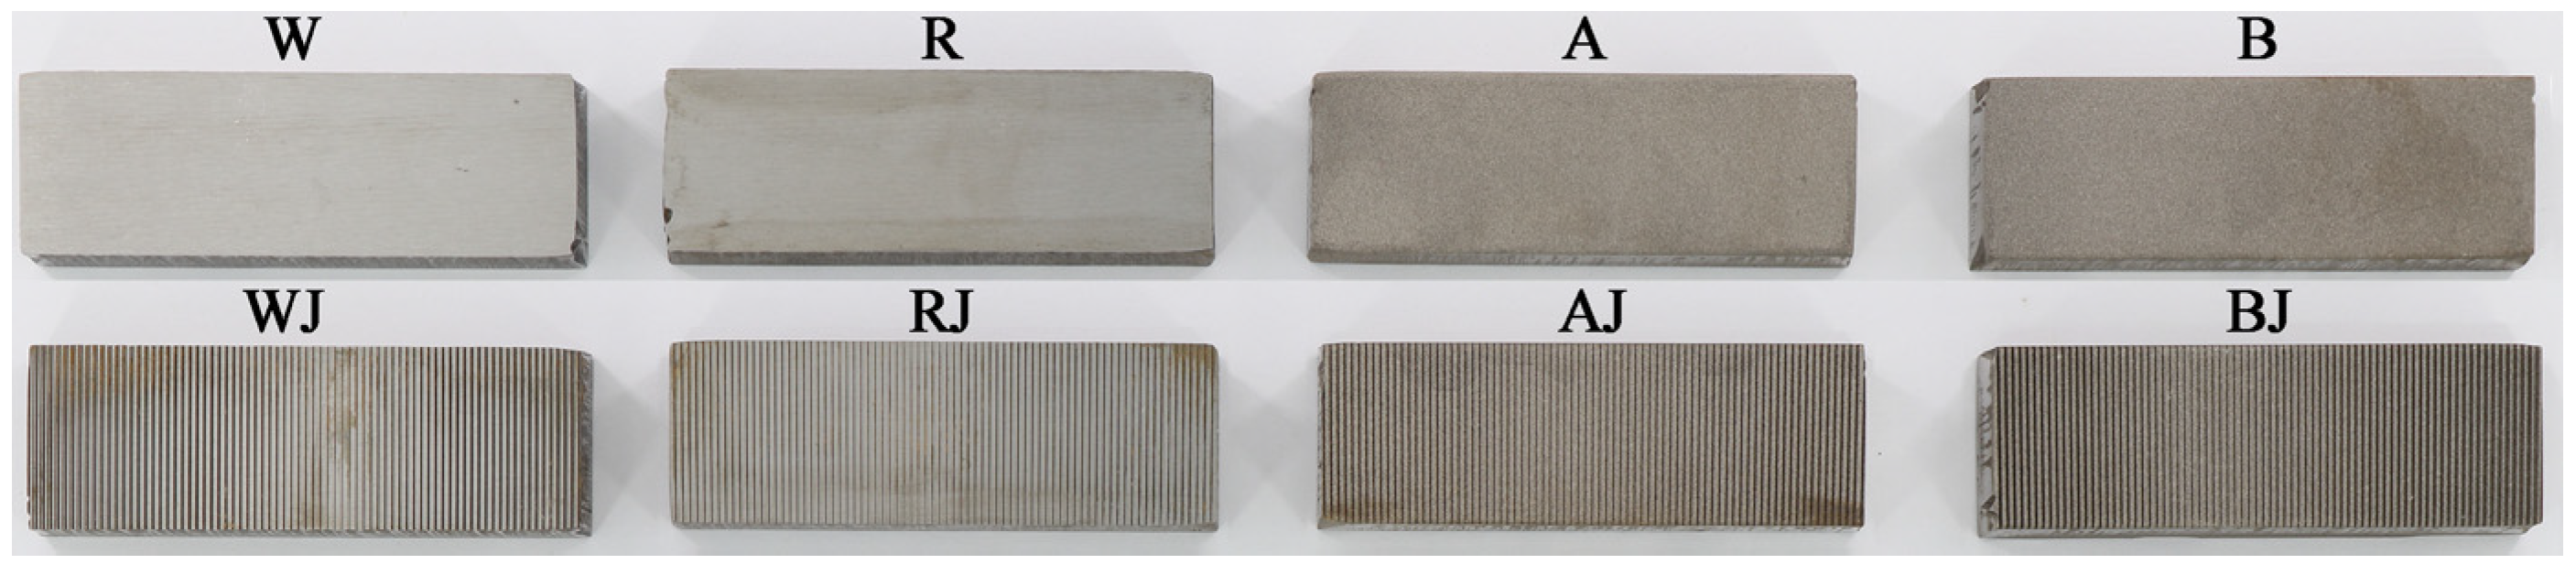
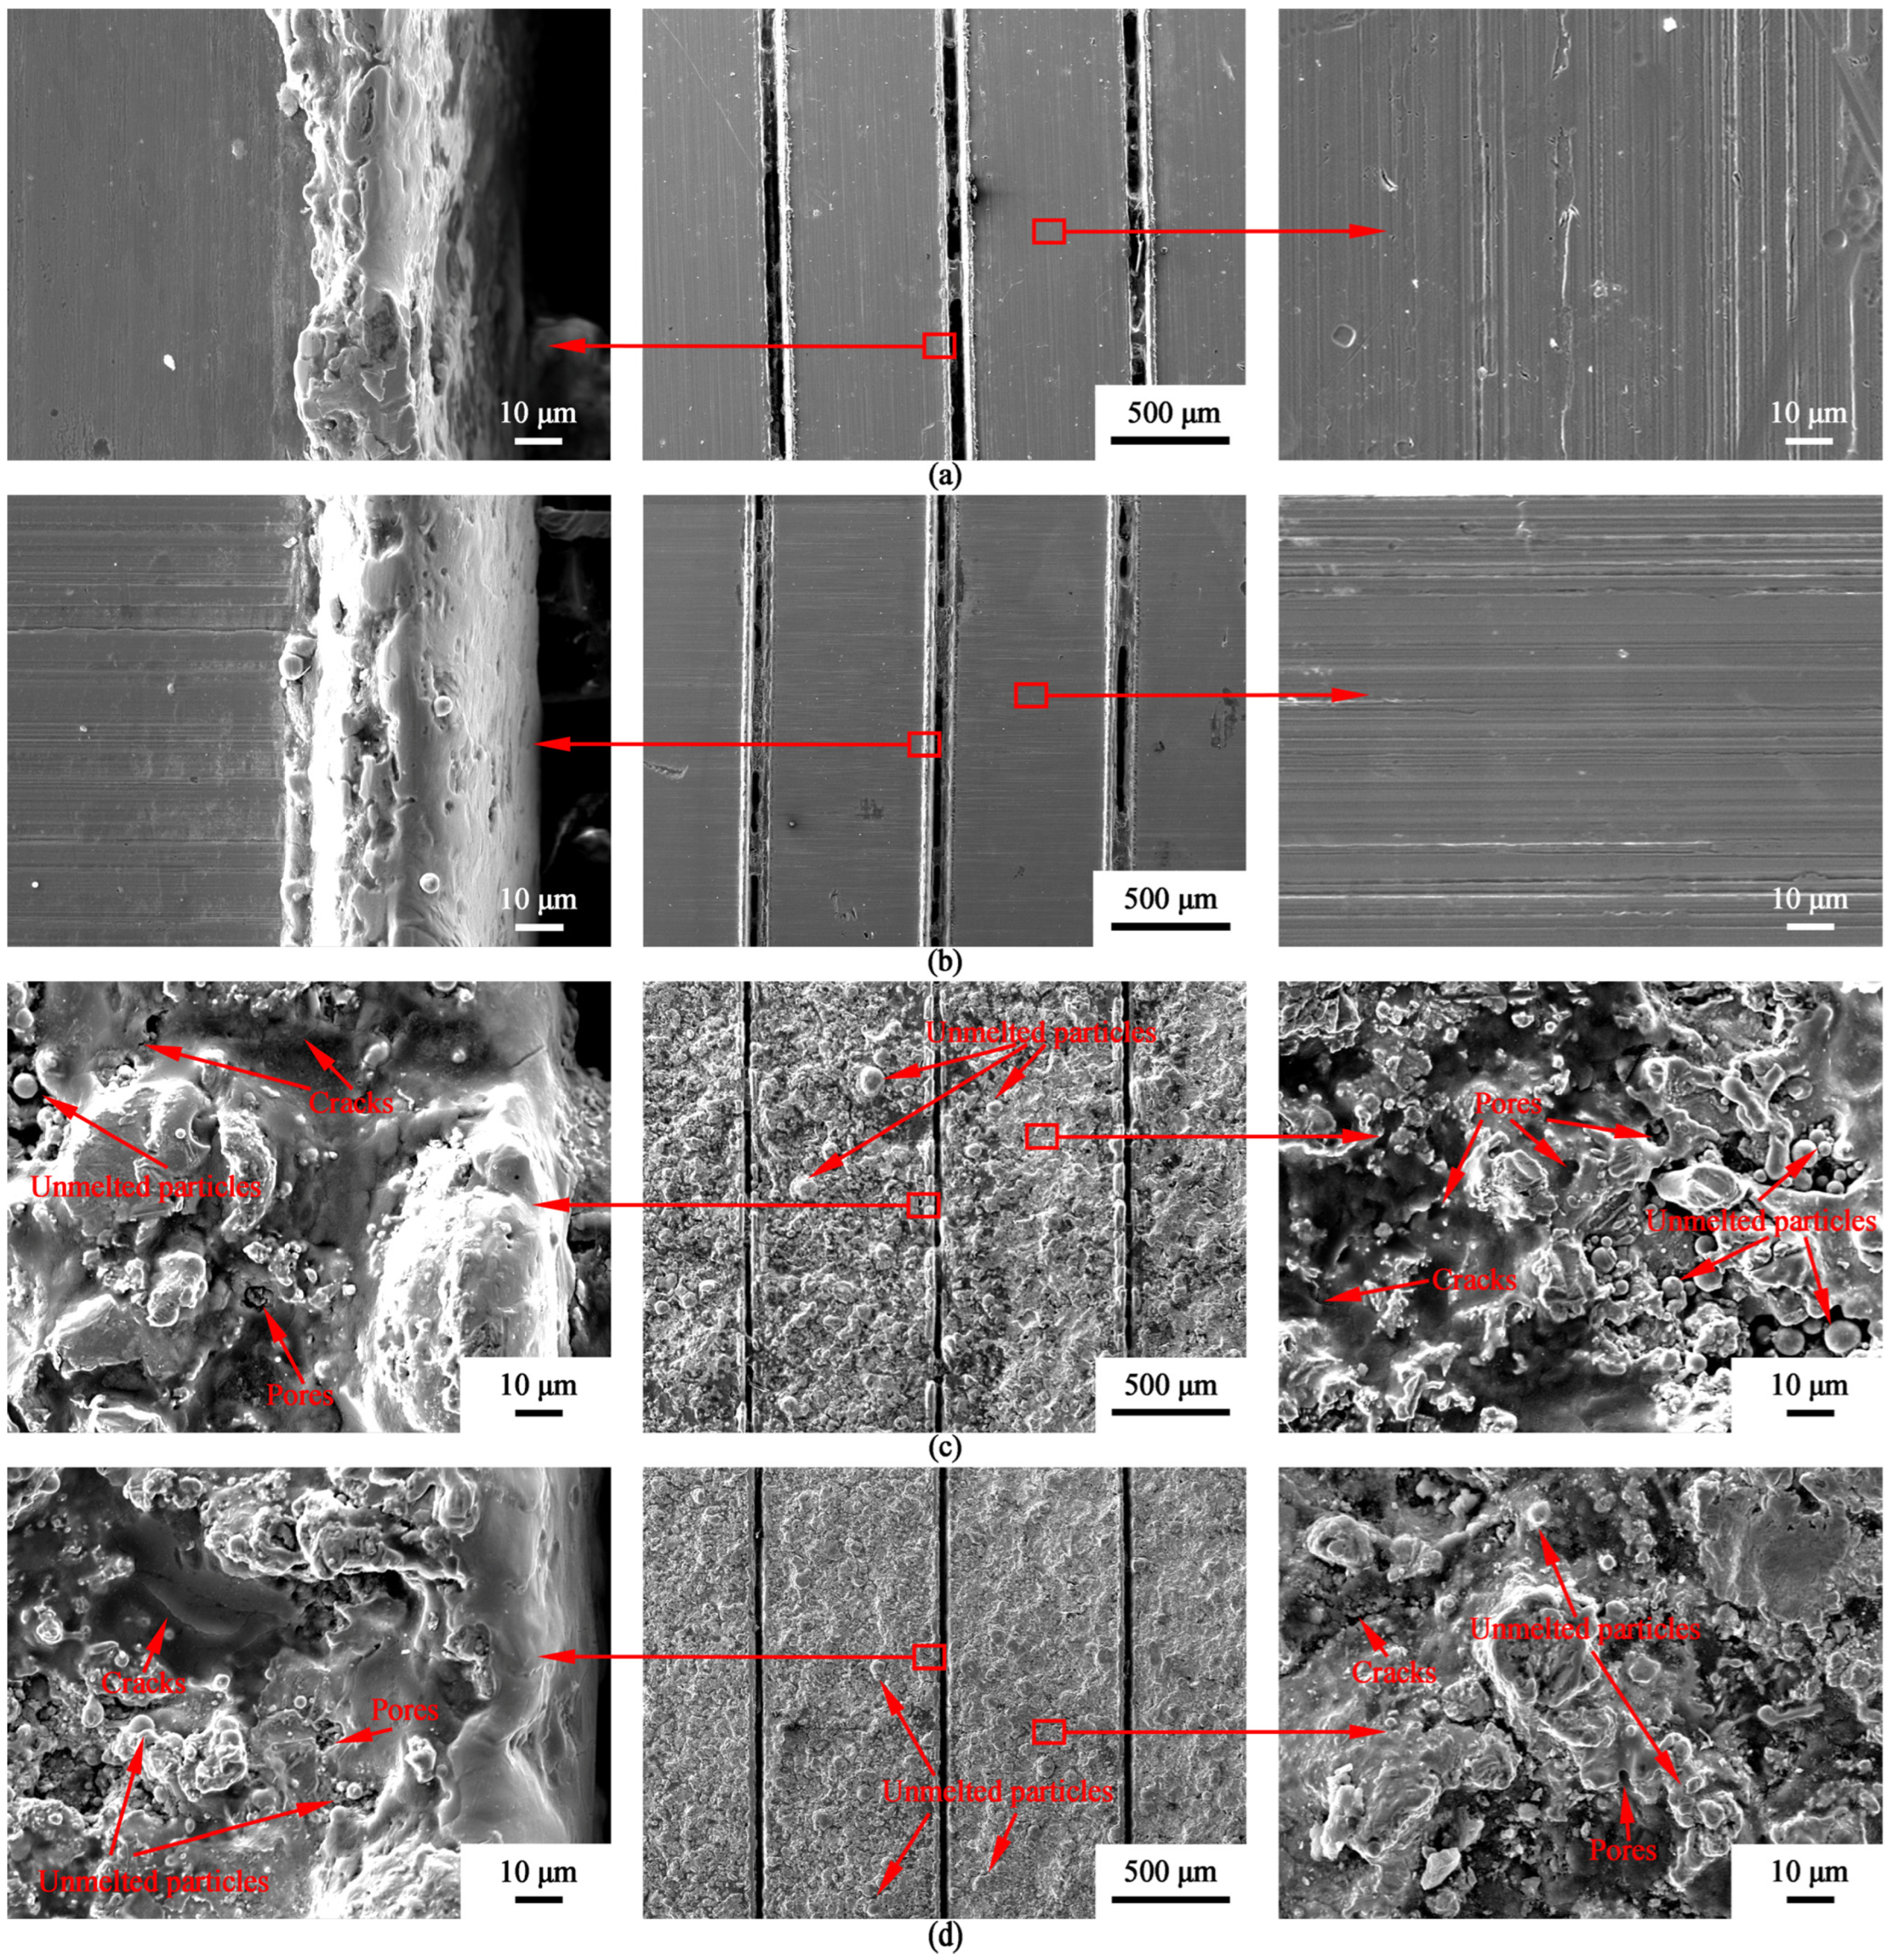
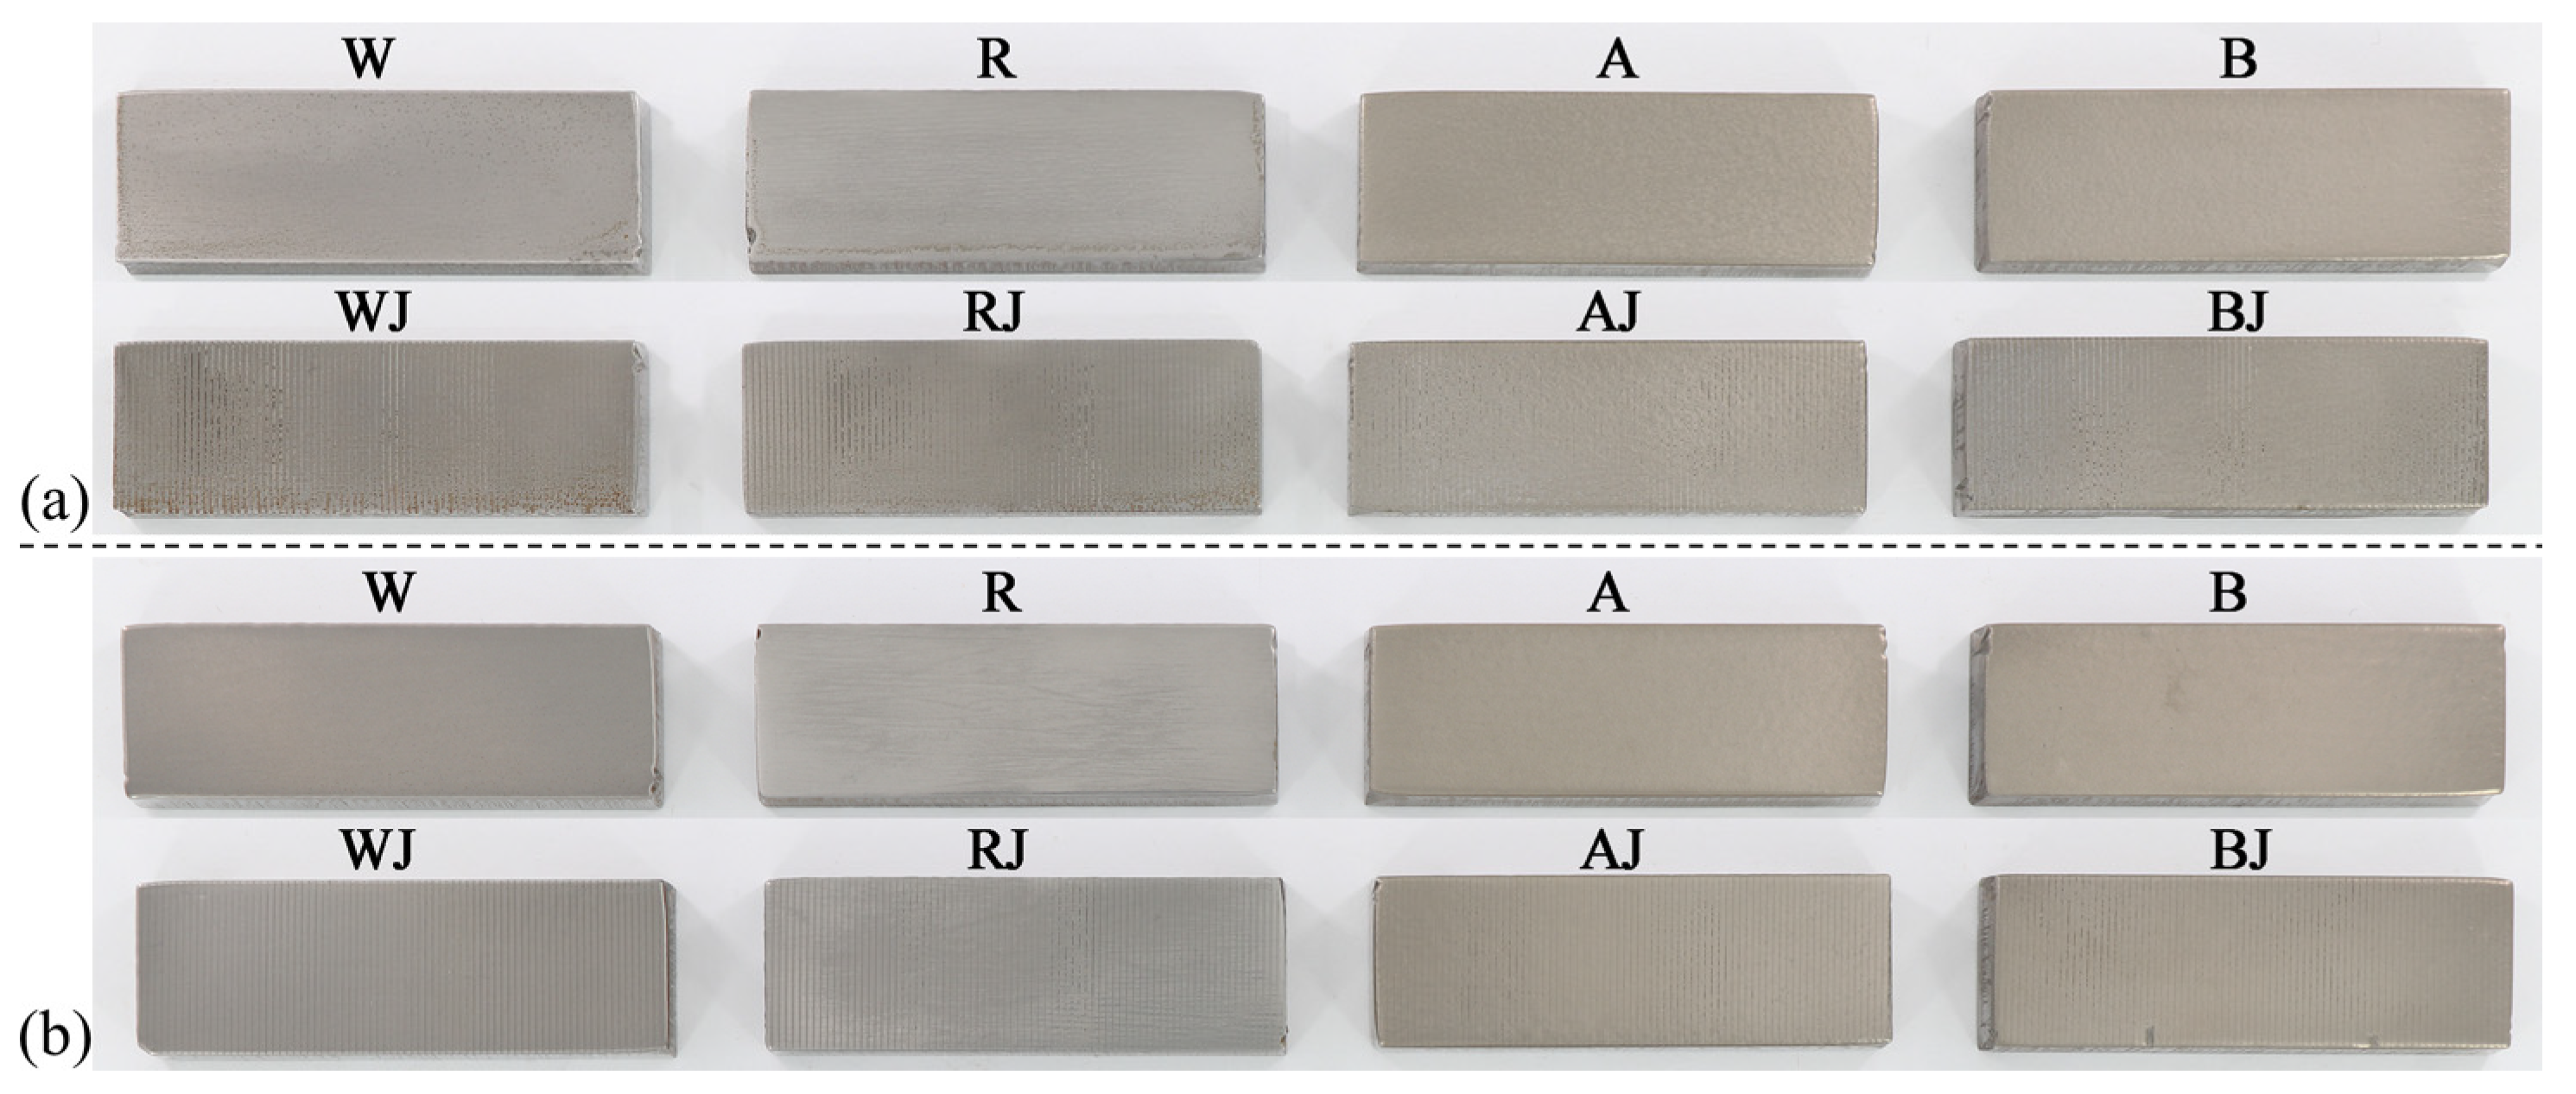
Figure 3 shows the photo of specimens before the abrasion while the SEM images of specimen WJ, specimen RJ, specimen AJ and specimen BJ are shown in
Figure 4. The grooves fabricated via the laser surface texturing (LST) process are clearly visible on the surface of these four kinds of specimens. Owing to the relatively higher and uneven cooling rate, there were some unavoidable pores and cracks on the coating surface of specimen AJ and specimen BJ, and then the melted and deformed materials influenced by laser flowed and filled into these pores and cracks; as a result, compared with those of specimen WJ and specimen RJ, there were less upward and outward accumulated materials on the sides of the grooves. Compared with specimen AJ (see
Figure 4c), there are less unmelted particles, cracks and pores on the surface of specimen BJ; hence coating B has a higher quality than coating A. Referring to the reports from other researchers, rare earth oxides, such as CeO
2 and Y
2O
3, can provide surface-active elements that are able to improve the fluidity of melted coating materials, promote the emission of harmful gas, and form stable compounds with harmful elements (e.g., S, P) and emit out of the coating so as to reduce the harmful inclusions [
29,
30]; consequently, cracks and pores decrease.
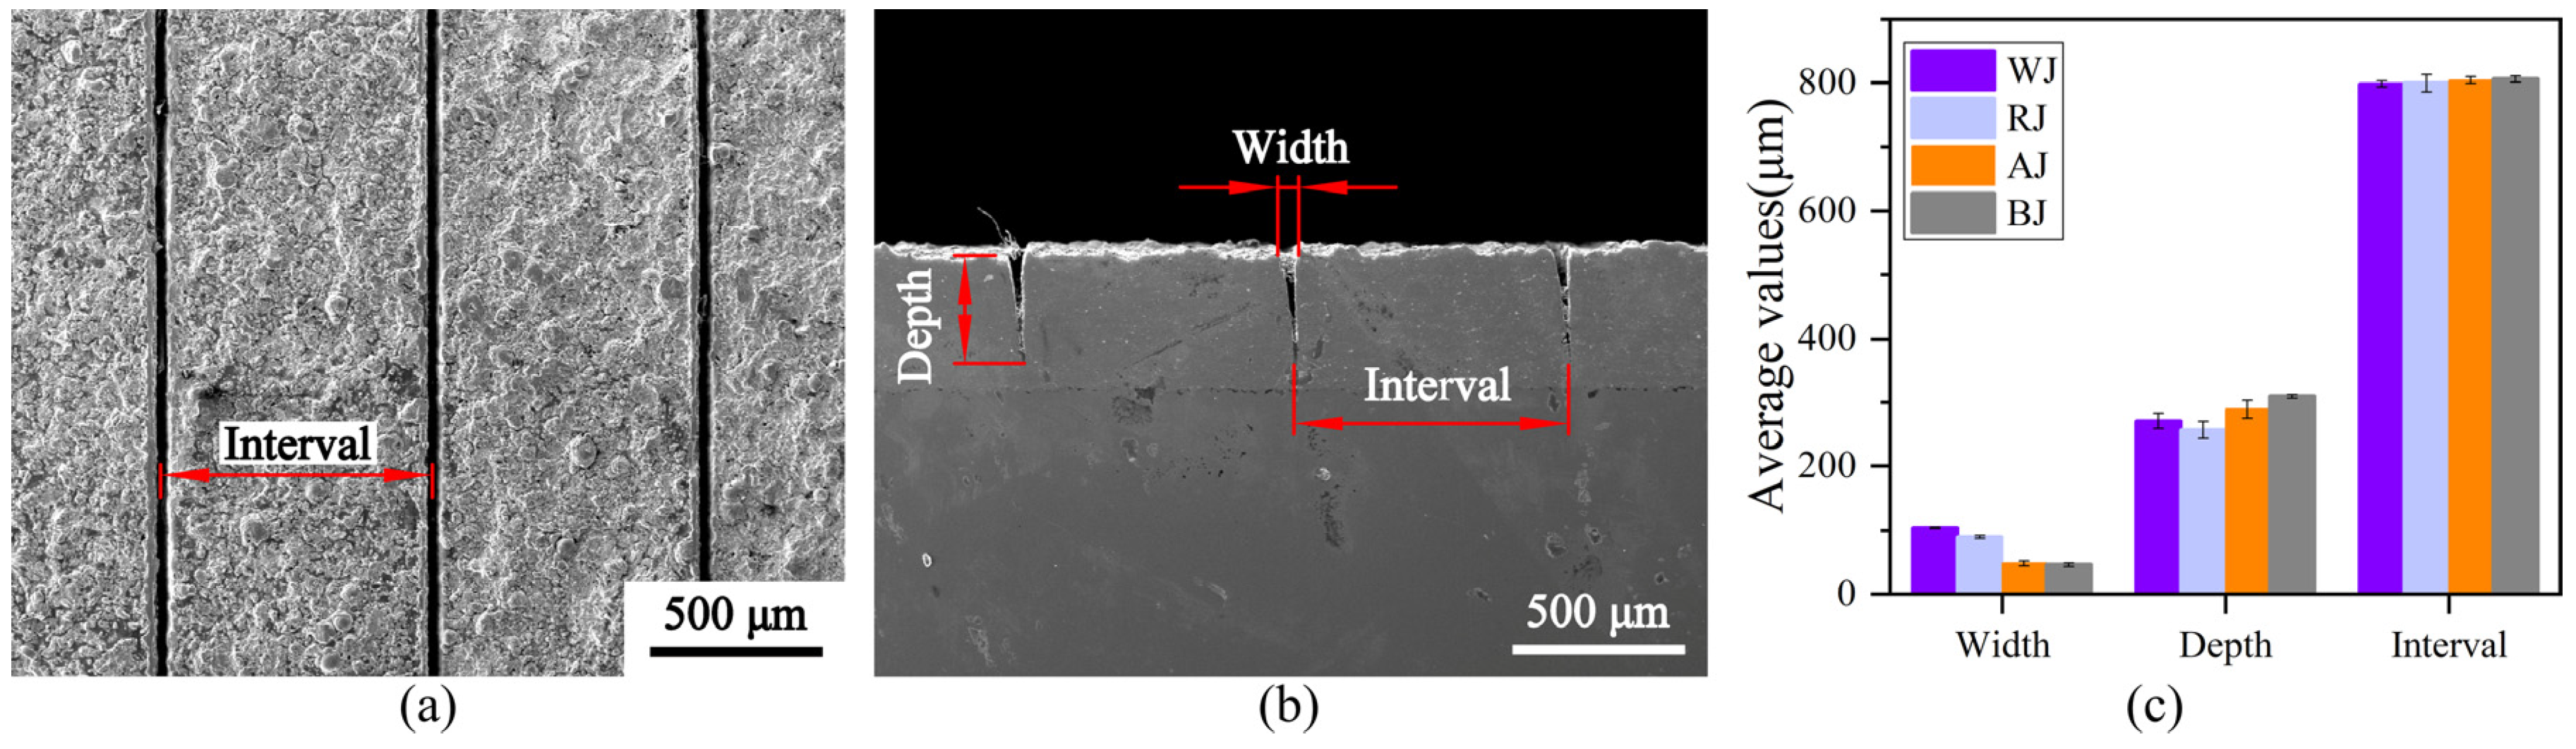
As shown in
Figure 4 and
Figure 5a,b, the grooves with a triangular cross-section were fabricated on the surfaces of specimens (i.e., WJ, RJ, AJ and BJ) via LST process, and the dimensions of the grooves measured in the cross-section are illustrated in
Figure 5c. It is clear that the intervals between neighbouring grooves are about 800 μm and there is no significant difference among these four kind of samples. However, things differ when it comes to the widths and depths. The grooves of specimen WJ (about 104 μm wide) and specimen RJ (about 90 μm wide) are much wider than those of specimen AJ (about 49 μm wide) and specimen BJ (about 47 μm wide), but the depths of specimen AJ (about 290 μm deep) and specimen BJ (about 310 μm deep) are slightly higher than those of specimen WJ (about 272 μm deep) and specimen RJ (about 257 μm deep).
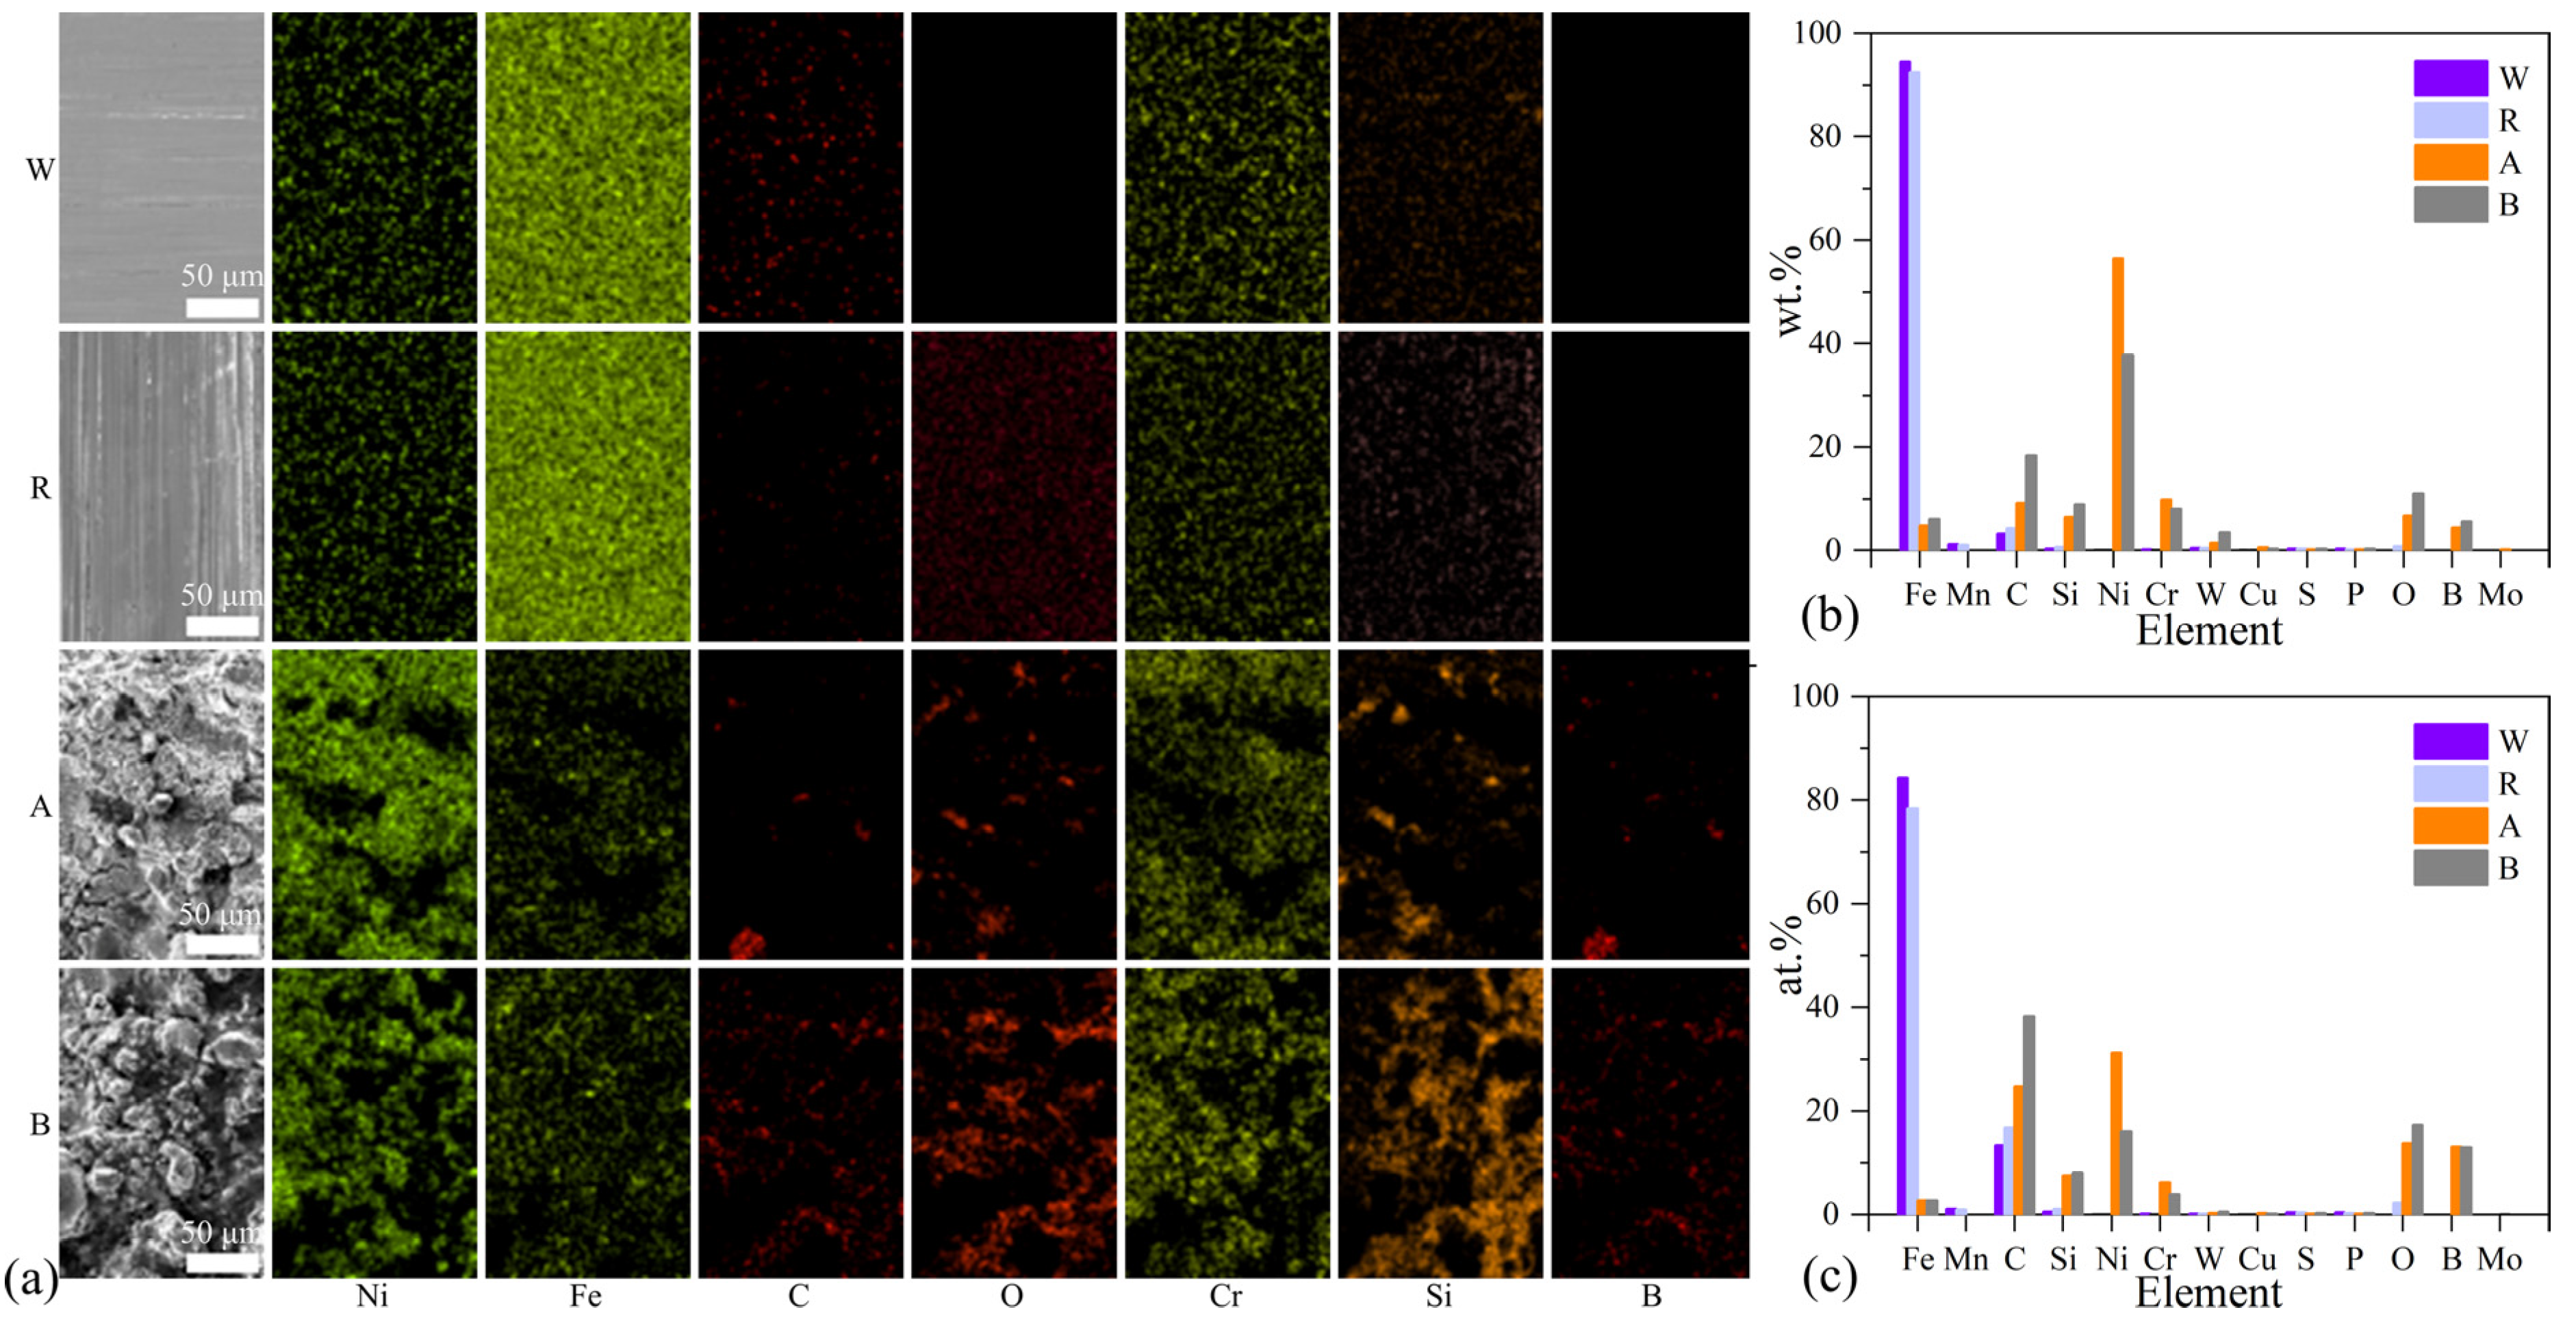
The EDS analyses of the surface of specimen W, specimen R, specimen A and specimen B were conducted as shown in
Figure 6. It is clear that (1) the Ni-based coatings were successfully prepared on the surface of Fe-based substrates; (2) compared with specimen W, more O was detected on the surface of specimen R because of the oxidation in heat treatment process, and the Si content also increased; (3) compared with specimen W and specimen R, more convergently distributed elements (e.g., C, O, Cr, Si and B) were detected on the surface of specimen A and specimen B at some specific locations, and these elements mainly came from the Ni65 powders, while it is also inferred that hard phases may exist at these locations because these detected elements are the typical elements of hard phases; (4) compared with specimen A, the proportions of C, O, Si and B in coating B increased; (5) finally, Ce and Y were not detected in coating B because of the low additions of CeO
2 and Y
2O
3.
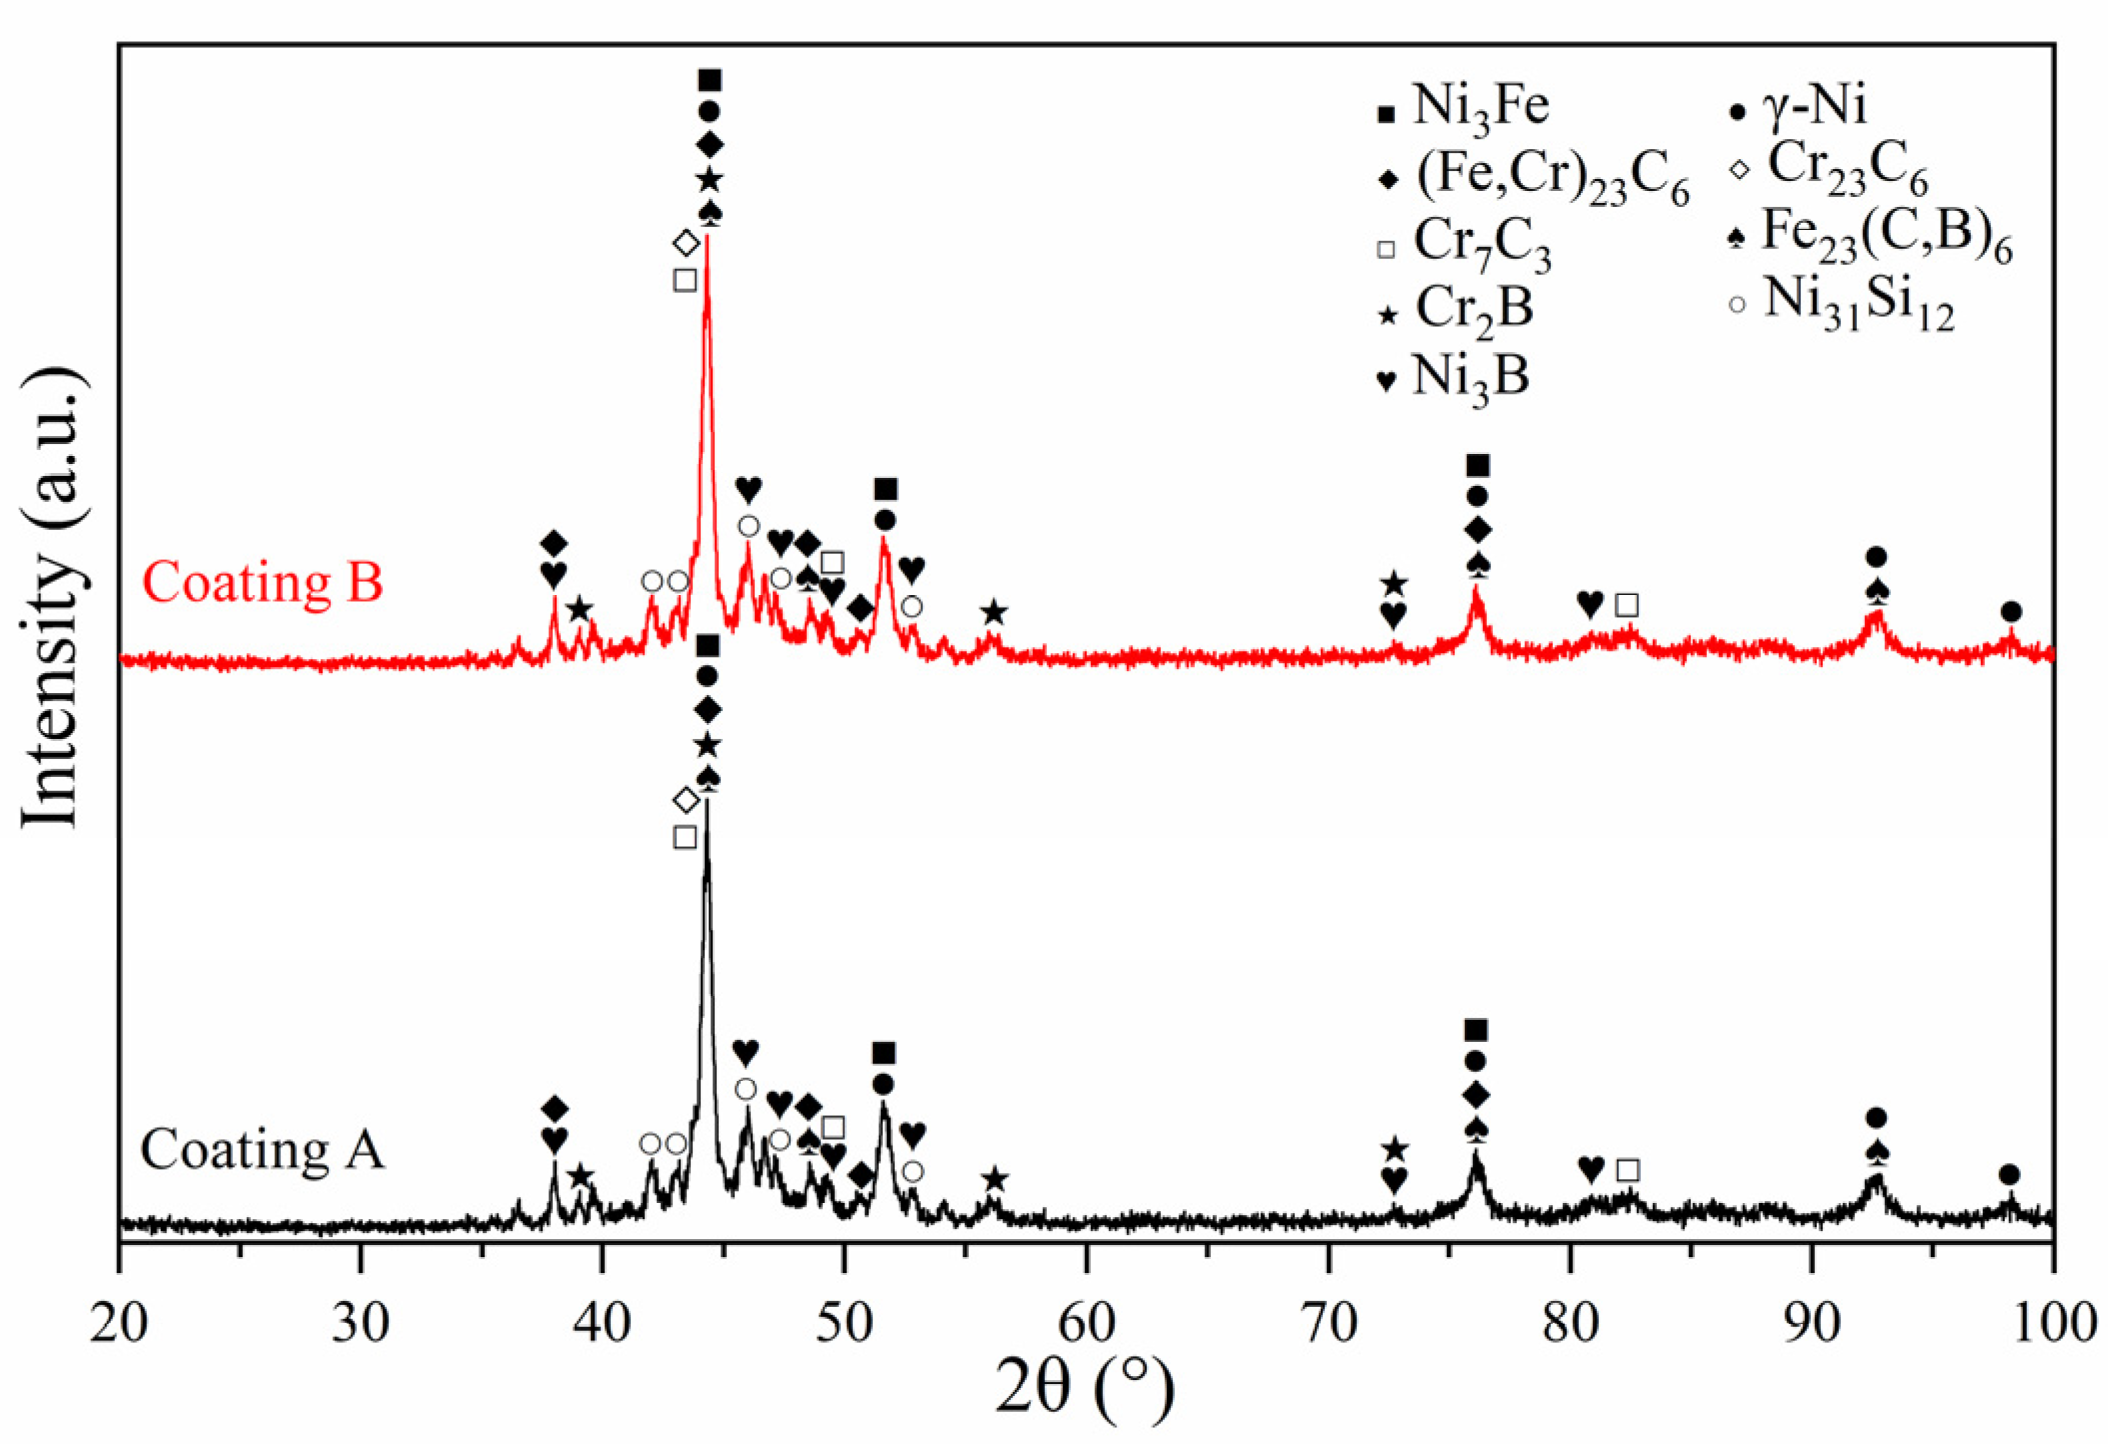
The XRD analysis results for coating A and coating B are shown in
Figure 7. It clearly demonstrates that the main phases in the two kinds of coatings both included γ-Ni, Ni
3Fe, (Fe,Cr)
23C
6, Cr
23C
6, Cr
7C
3, Cr
2B, Fe
23 (C,B)
6, Ni
3B and Ni
31Si
12 that have also been reported by other researchers [
31,
32]; however, Chen et al. [
31] also detected CrB phases in the coatings that may result from the high B content and fabrication technique of the coatings. Accordingly, γ-Ni is the matrix phase while the left phases are typical strengthening phases of Ni-based self-fluxing alloy, and these strengthening phases can provide good hardness and wear resistance for coatings. However, the phases related to Y and Ce were also not detected in the XRD analysis because of the low content and tiny particle size of these rare earth additions, which is similar to the reports from Ghadami et al. [
33]. Compared with coating A, the addition of CeO
2 and Y
2O
3 did not significantly affect the phase composition of the coating, but some broad diffused diffraction peaks with relatively lower intensity (e.g., the diffraction peak at a 2θ of about 44.5°) were observed in coating B, which means the formation of more amorphous phases and lattice distortion [
11,
34], but Ai et al. [
32] reported that the addition of Y
2O
3 increased the peak strength of some reinforcement phases. In addition, more Cr
7C
3 phases were detected in coating B, which may result from the increase of C content in coatings, as has been mentioned in the EDS analysis of specimen surface.
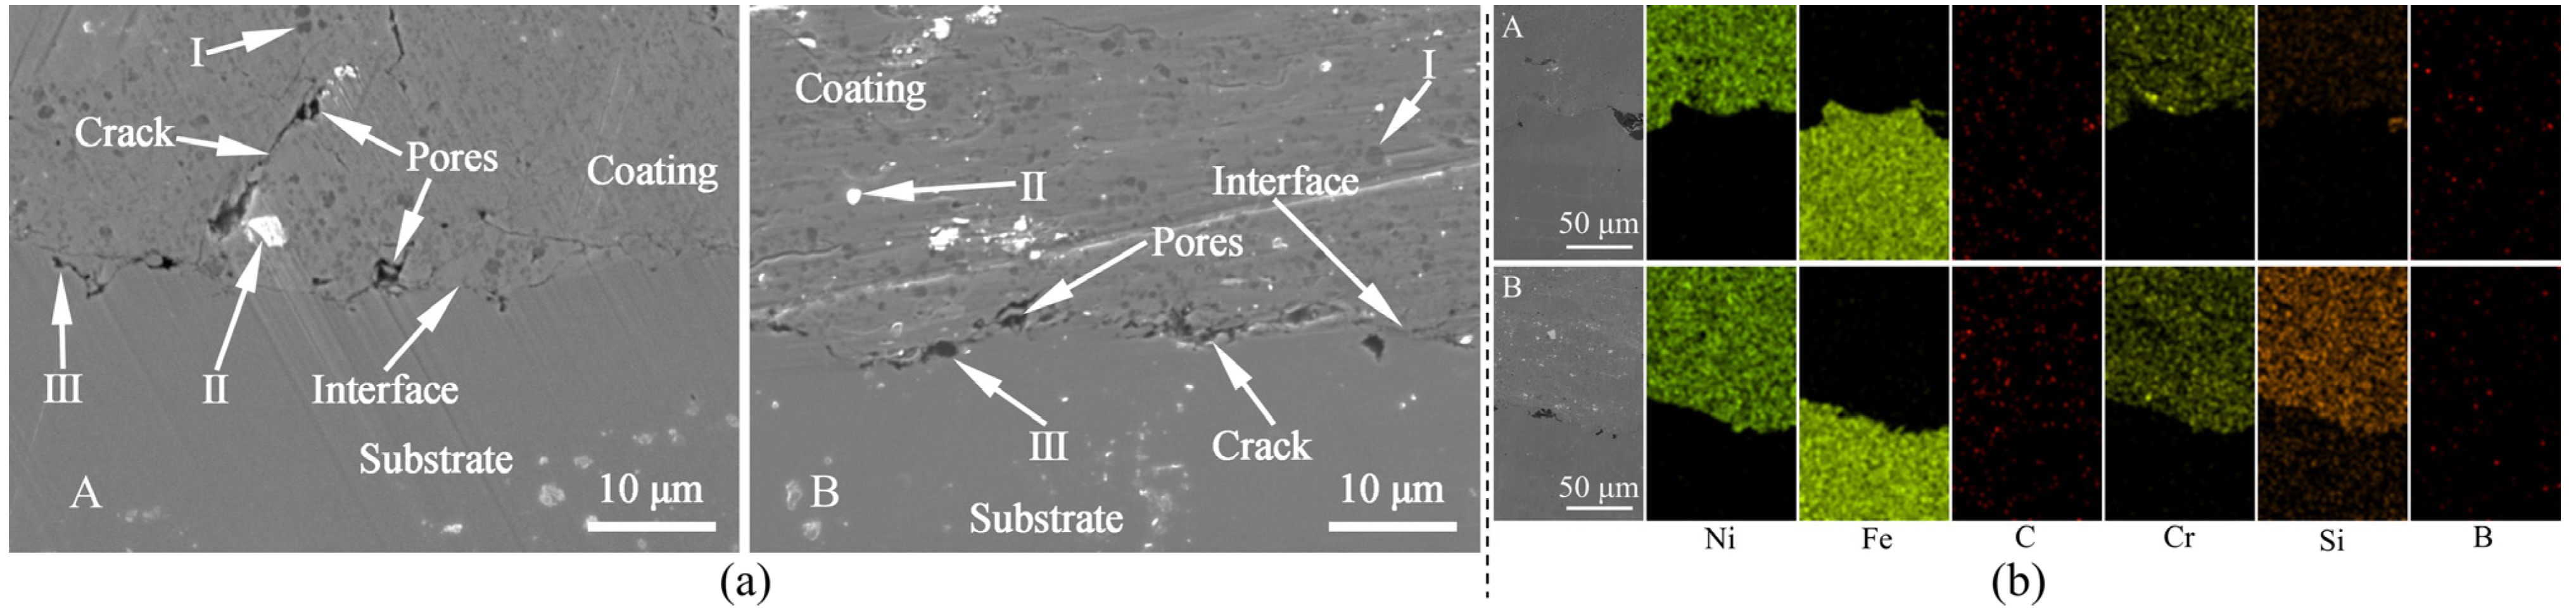
Figure 8 shows the cross-sectional images of specimen A and specimen B, and
Table 6 lists the chemical elements of point Ⅰ, point Ⅱ and point Ⅲ in
Figure 8a via EDS analyses. An obvious interface can be seen between coatings and substrates, and there are also some cracks and pores at the interface or in the coatings that are harmful to the properties and service life of coatings. According to the reports from Liu et al. [
35], the formation of these cracks and pores is usually the result of the overheating of the molten pool, gas entrapment, surface impurities, etc. In coating A, vertical cracks perpendicular to the interface were also observed. By contrast, the pores and cracks were significantly less in coating B, which have also been observed on the surface of coatings. In addition, the figure also illustrates that there are many black phases (see point Ⅰ in
Figure 8a) and white phases (see point Ⅱ in
Figure 8a) scattering in both coating A and coating B, which were also reported by other studies on Ni-based coatings [
9,
33]. According to the EDS analysis results in
Figure 8c that correspond to the XRD analysis results in
Figure 7, these phases are mainly hard phases formed by Cr, Fe and Ni with B, C and Si, and a small amount of W-based phases were also detected where white phases are. Compared with coating A, more refined hard phases were observed in coating B. For the phases at point Ⅲ (see
Figure 8a), a large proportion of Al and O were detected, but the coatings and substrates do not contain any Al, so these phases may be the sand particles inlaid on the surface of substrates in the sandblasting process.
Studies have shown that surface-active elements provided by CeO
2 and Y
2O
3 are able to form stable compounds that have a high melting point with the elements in the coatings [
32,
36], and these stable compounds will become the core of heterogeneous phase nucleation so as to form more hard phases. In addition, these surface-active elements will also gather at the grain boundary to inhibit the growth of grains, and finally the microstructure is refined and hard phases are distributed more uniformly, which has been reported by Ai et al. [
32]. Therefore, the decrease of pores and cracks as well as the increase of hard phases in coating B can be contributed to the positive effect of the addition of rare earth oxides, as has been mentioned above.
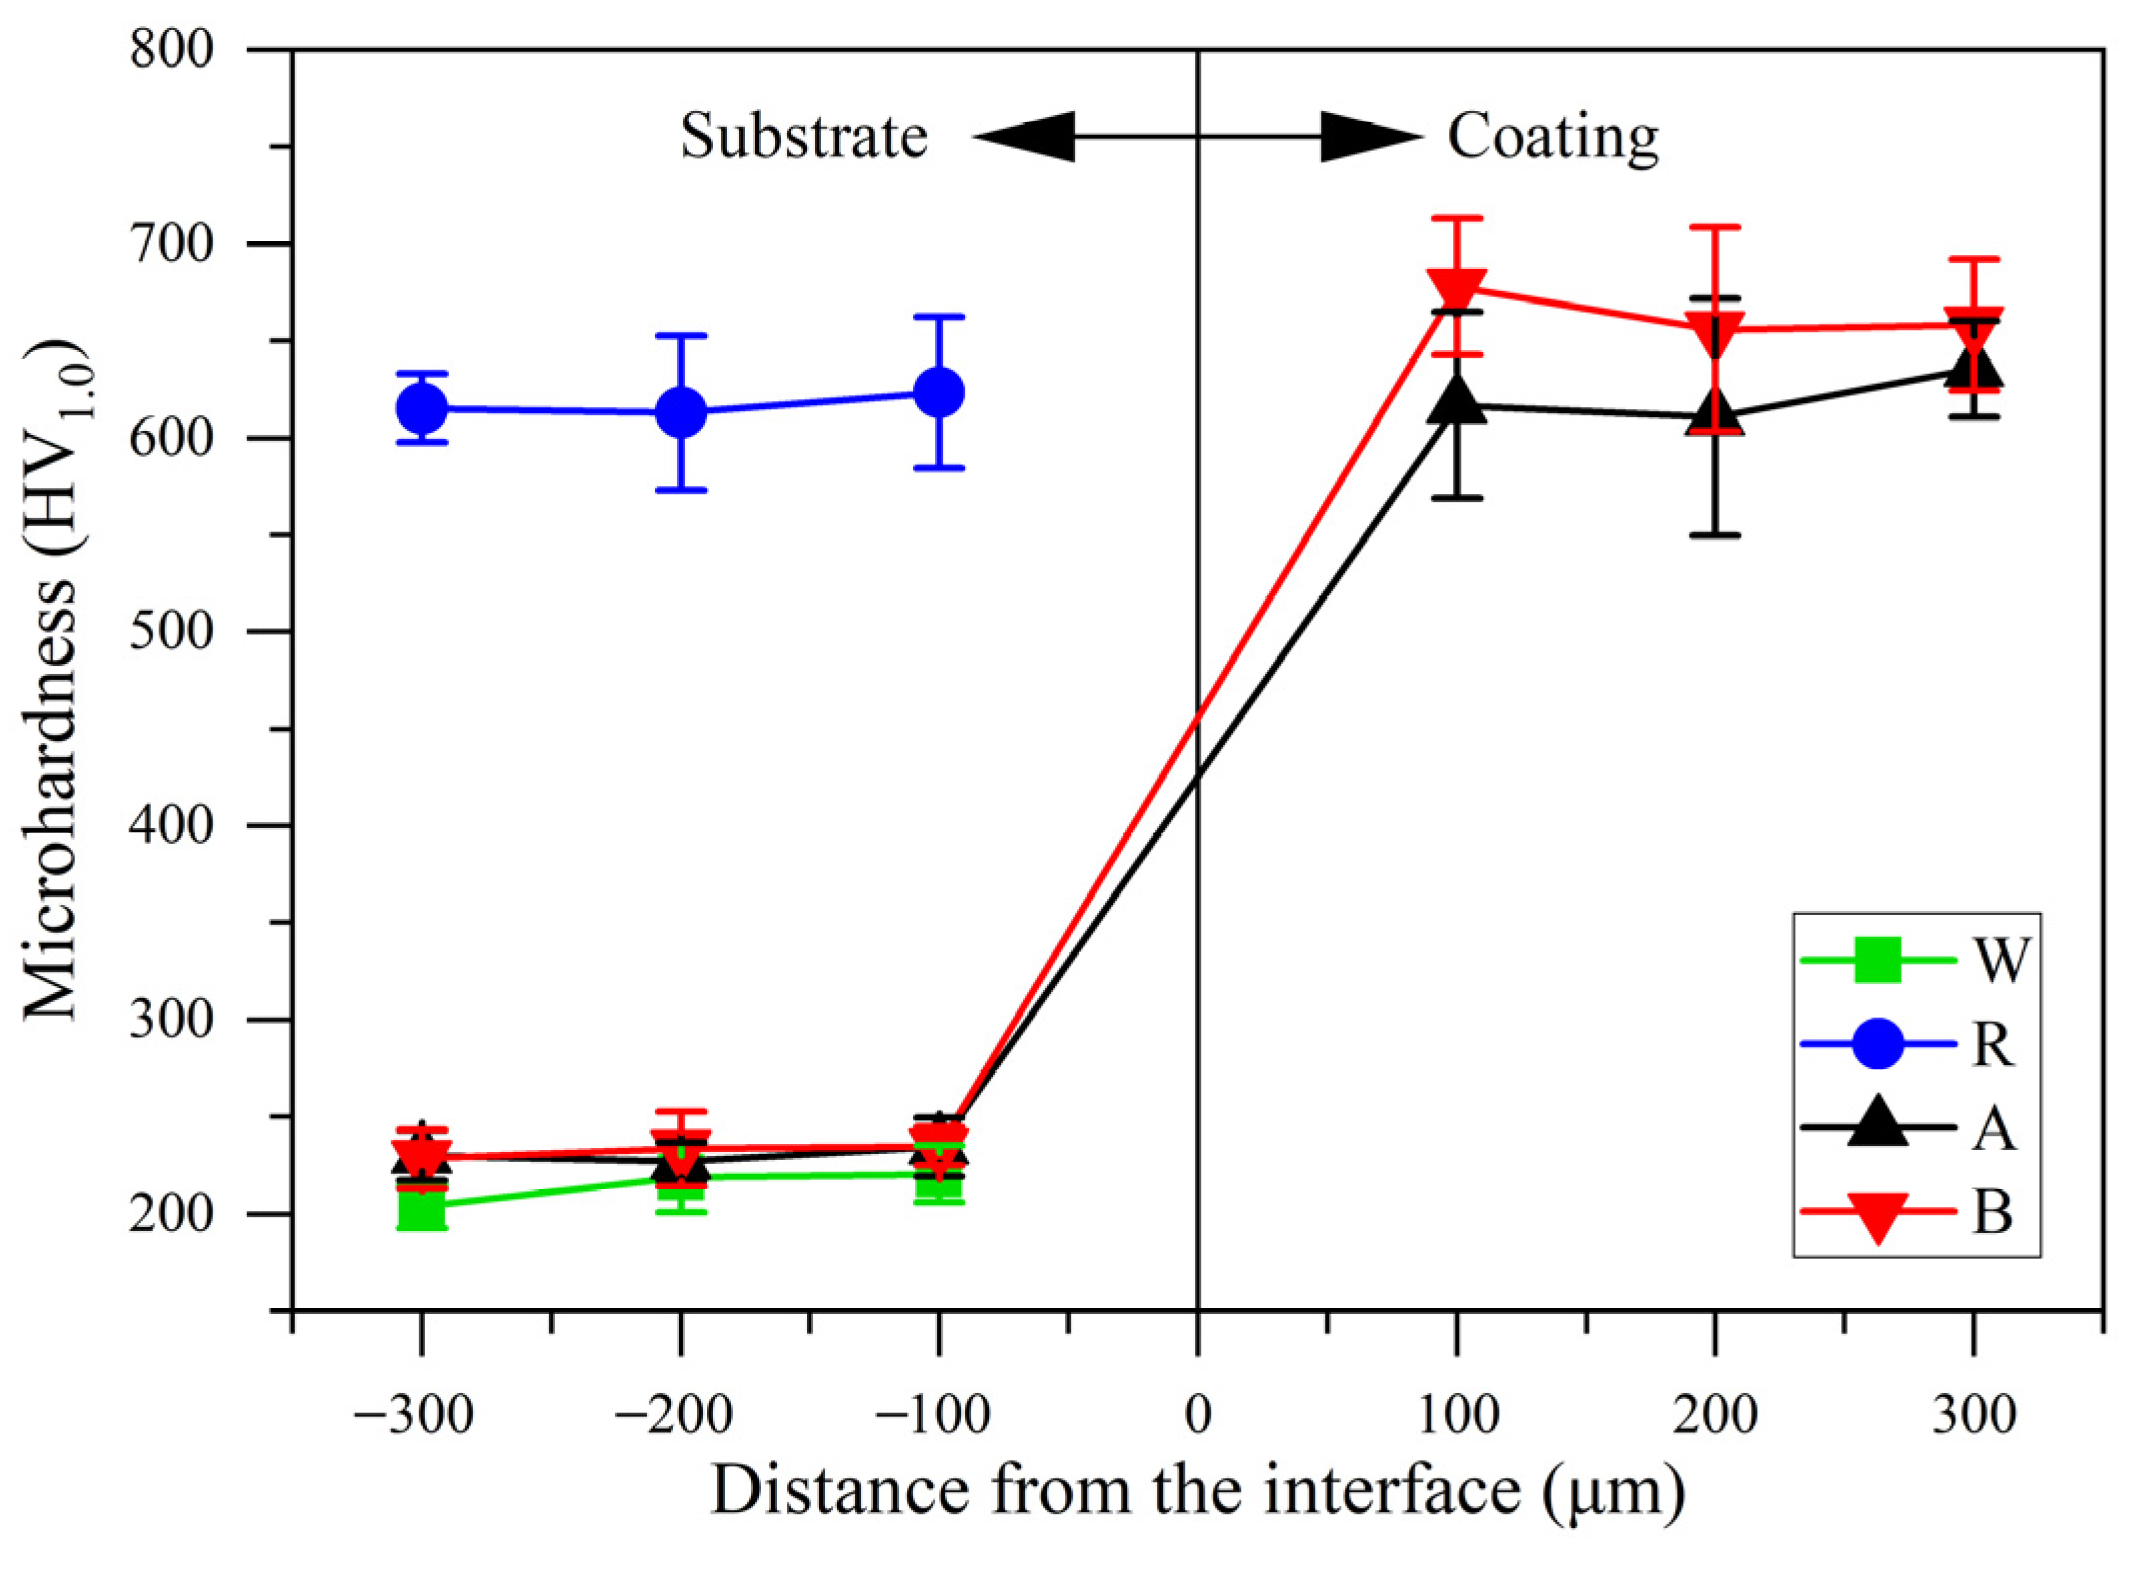
Figure 9 shows the microhardness of substrates and coatings as well as that of specimen W and specimen R, which was measured in the cross-section. As can be observed, the microhardness of specimen W as well as the substrates of specimen A and specimen B varies in a range of 200–240 HV
1.0, and both the heat treatment (HT) and the HVOF spraying process significantly contribute to the improvement of the microhardness. Meanwhile, the average microhardness of coating A is 621HV1.0, which is similar to that of specimen R (617HV
1.0), while that of coating B is 664HV1.0; thus, the addition of CeO
2 and Y
2O
3 is conducive to further improving the microhardness of the Ni65 coating. The decrease of pores and cracks as well as the increase of refined and more uniformly distributed hard phases resulting from the addition of rare earth oxides serve as the key contributors for the increase of the hardness of coating B; in addition, as has been reported by Fan et al. [
37], the increase of the content of harder Cr
7C
3 phases also plays a catalytic role.
3.3. Abrasive Wear Behavior
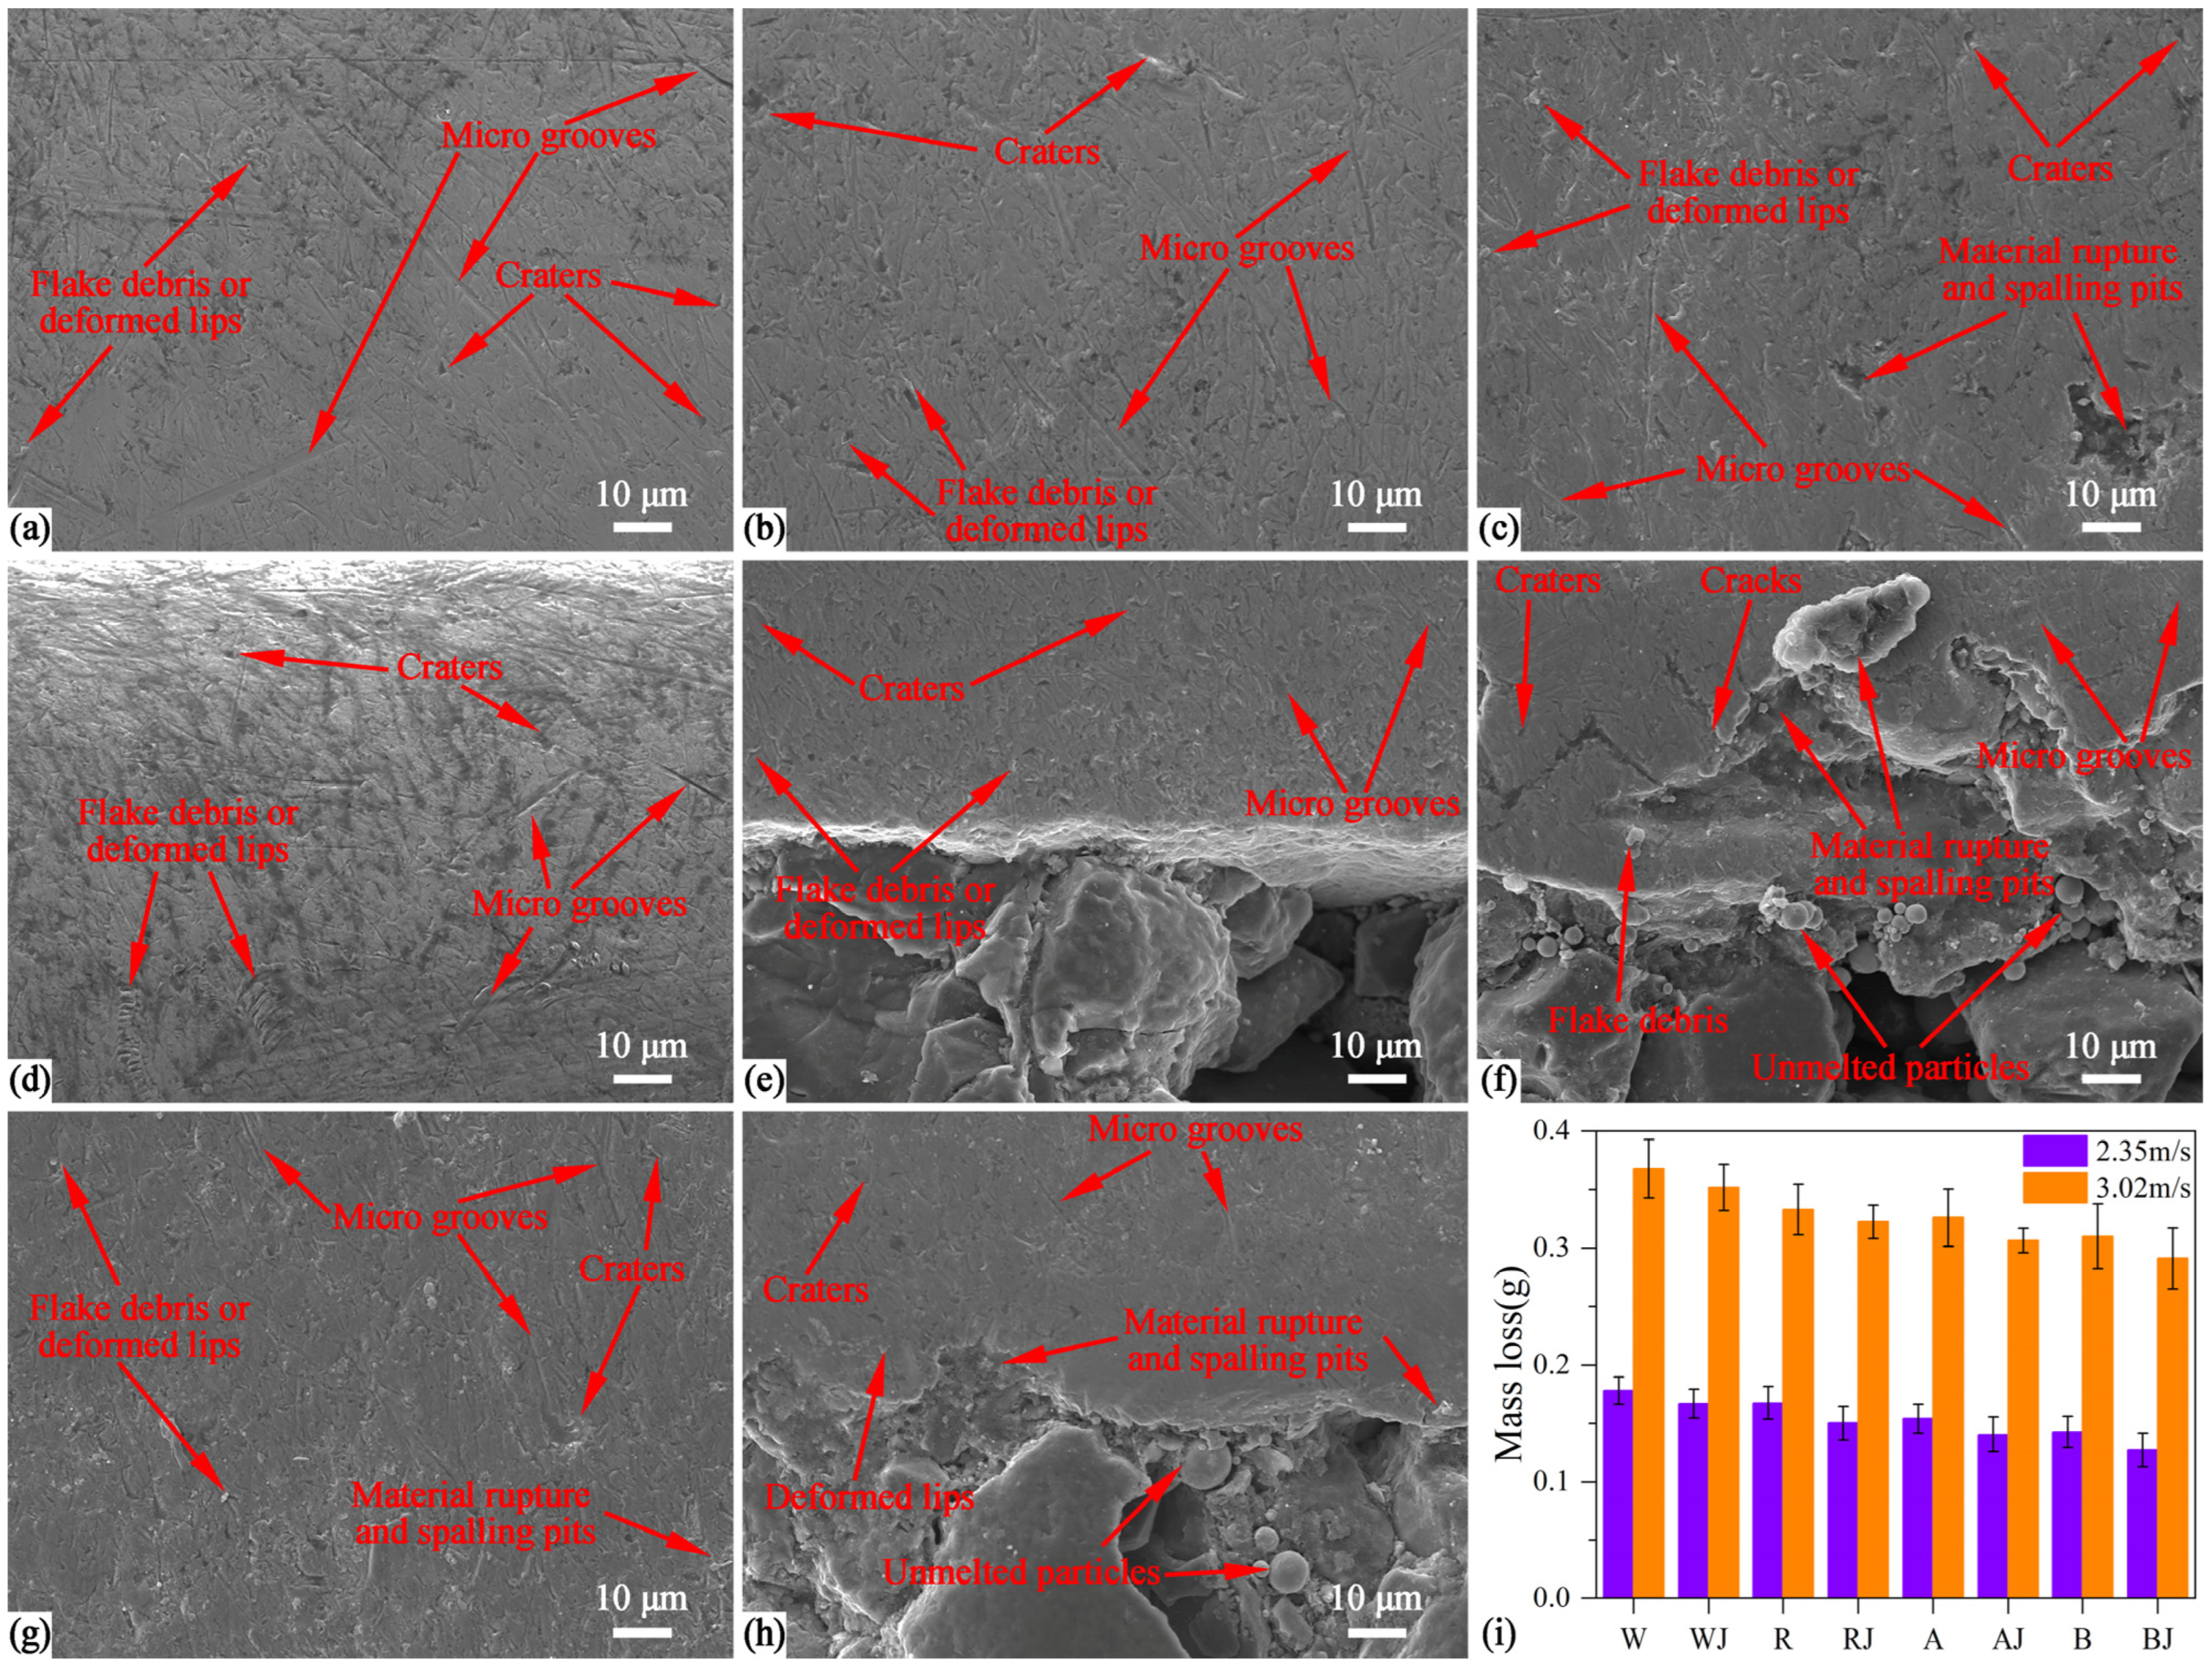
Figure 11 shows the specimens after the abrasion. Meanwhile, the SEM images of worn surfaces and mass loss of specimens at different speeds after the abrasive wear examinations are shown in
Figure 12. It is very clear that the major surface damage types on the surface of the specimens represented as micro grooves produced by the micro cutting or micro ploughing of abrasive particles and craters produced by the high speed impact of abrasive particles. These phenomena are the typical characteristics of abrasive wear as reported by Li and Kong [
39] and Singh et al. [
40]. The amount and size of micro grooves and craters depend on the surface hardness, and so larger amounts of longer, wider and deeper micro grooves or craters were observed on the surface of specimen W because of its low hardness. In addition, there existed some flake debris or deformed lips with different sizes and amounts along the grooves and craters, which is the severe plastic deformation of coating materials resulting from the repeated interactions with abrasive particles. These observations were similar to the reports by Nath and Kumar [
41] in their studies on the erosion behavior of HVOF sprayed WC–10Co–4Cr cermet in slurry wear tests. For the HVOF flame sprayed coatings, owing to their high hardness, fatigue fracture occurred and bigger spalling pits were observed, especially along the LST structures, which resulted from the spallation or brittle fracture of the hard phases in coatings as reported by Singh et al. [
40] as well as Nath and Kumar [
41]. Moreover, some unmelted particles became visible after the material ruptures beside the LST structures. Therefore, the major wear mechanism of tested specimens was abrasive wear.
As shown in
Figure 12i, compared with specimen W/R/A/B, the mass loss of specimen WJ/RJ/AJ/BJ decreased, which indicates that the LST structures were conducive for improving the abrasion resistance of specimens. On the one hand, similar to the studies on the wear behavior of LST treated cemented carbide reported by Tong et al. [
42], nonsmooth structures, such as grooves and pits, are able to store up or excrete the abrasive particles and wear debris; on the other hand, these nonsmooth structures can change the motion state of abrasive particles and even form a vortex layer, which stimulates more sliding abrasive particles to roll on the surface; thus, the contact probability and intensity between abrasive particles and surfaces decrease, and finally the surface damages and abrasions decrease.
Figure 12i also illustrates that the increase of the relative sliding speed of abrasive materials against specimens resulted in the significant increase of the mass loss of specimens, according to the studies by Halila et al. [
43] and Mattetti et al. [
44]. The main reason for this phenomenon is that the contact stress between surfaces and abrasive particles increases as the relative sliding speed increases [
44,
45]. At these two different relative sliding speeds, the mass loss of coating B was lower, which indicates that the abrasion-resistant coatings were fabricated on substrates and the addition of rare earth oxides helped to further improve the abrasion resistance of the Ni65 coating, and these are corresponding to the SEM observations. As has been mentioned above, compared with coating A, the addition of rare earth oxides helped to form more hard phases, refine the microstructure, reduce the defects in coatings, make hard phases distributed more uniformly and finally improve the dislocation slip resistance, which decreased the severe deformation of materials [
32,
45]. Thus less abrasion signs were observed on coating B. The specimen with the best abrasion resistance was specimen BJ, and compared with specimen W, the mass loss of specimen BJ at relative sliding speeds of 2.35 m/s and 3.02 m/s decreased by 28.56% and 20.83%, respectively. However, considering the negative effect of LST structures on the corrosion resistance of specimens, the process techniques for specimen BJ were not recommended in this study. Comparatively, the mass loss of specimen B at relative sliding speeds of 2.35 m/s and 3.02 m/s decreased by 19.96% and 15.66%, respectively, while the mass loss of specimen A at relative sliding speeds of 2.35 m/s and 3.02 m/s decreased by 13.32% and 11.34%, respectively, which also exhibited great abrasion resistance. However, the wear loss reduction rates in this paper are lower than those in the studies on the abrasion behavior of Fe-based overlaid ploughshares in field tests by Singh et al. [
40], which may result from the discrepancy in coating contents and fabrication techniques. Considering the different application situations, however, the process techniques for specimen B and specimen A without LST structures were applied to PDSs afterwards.
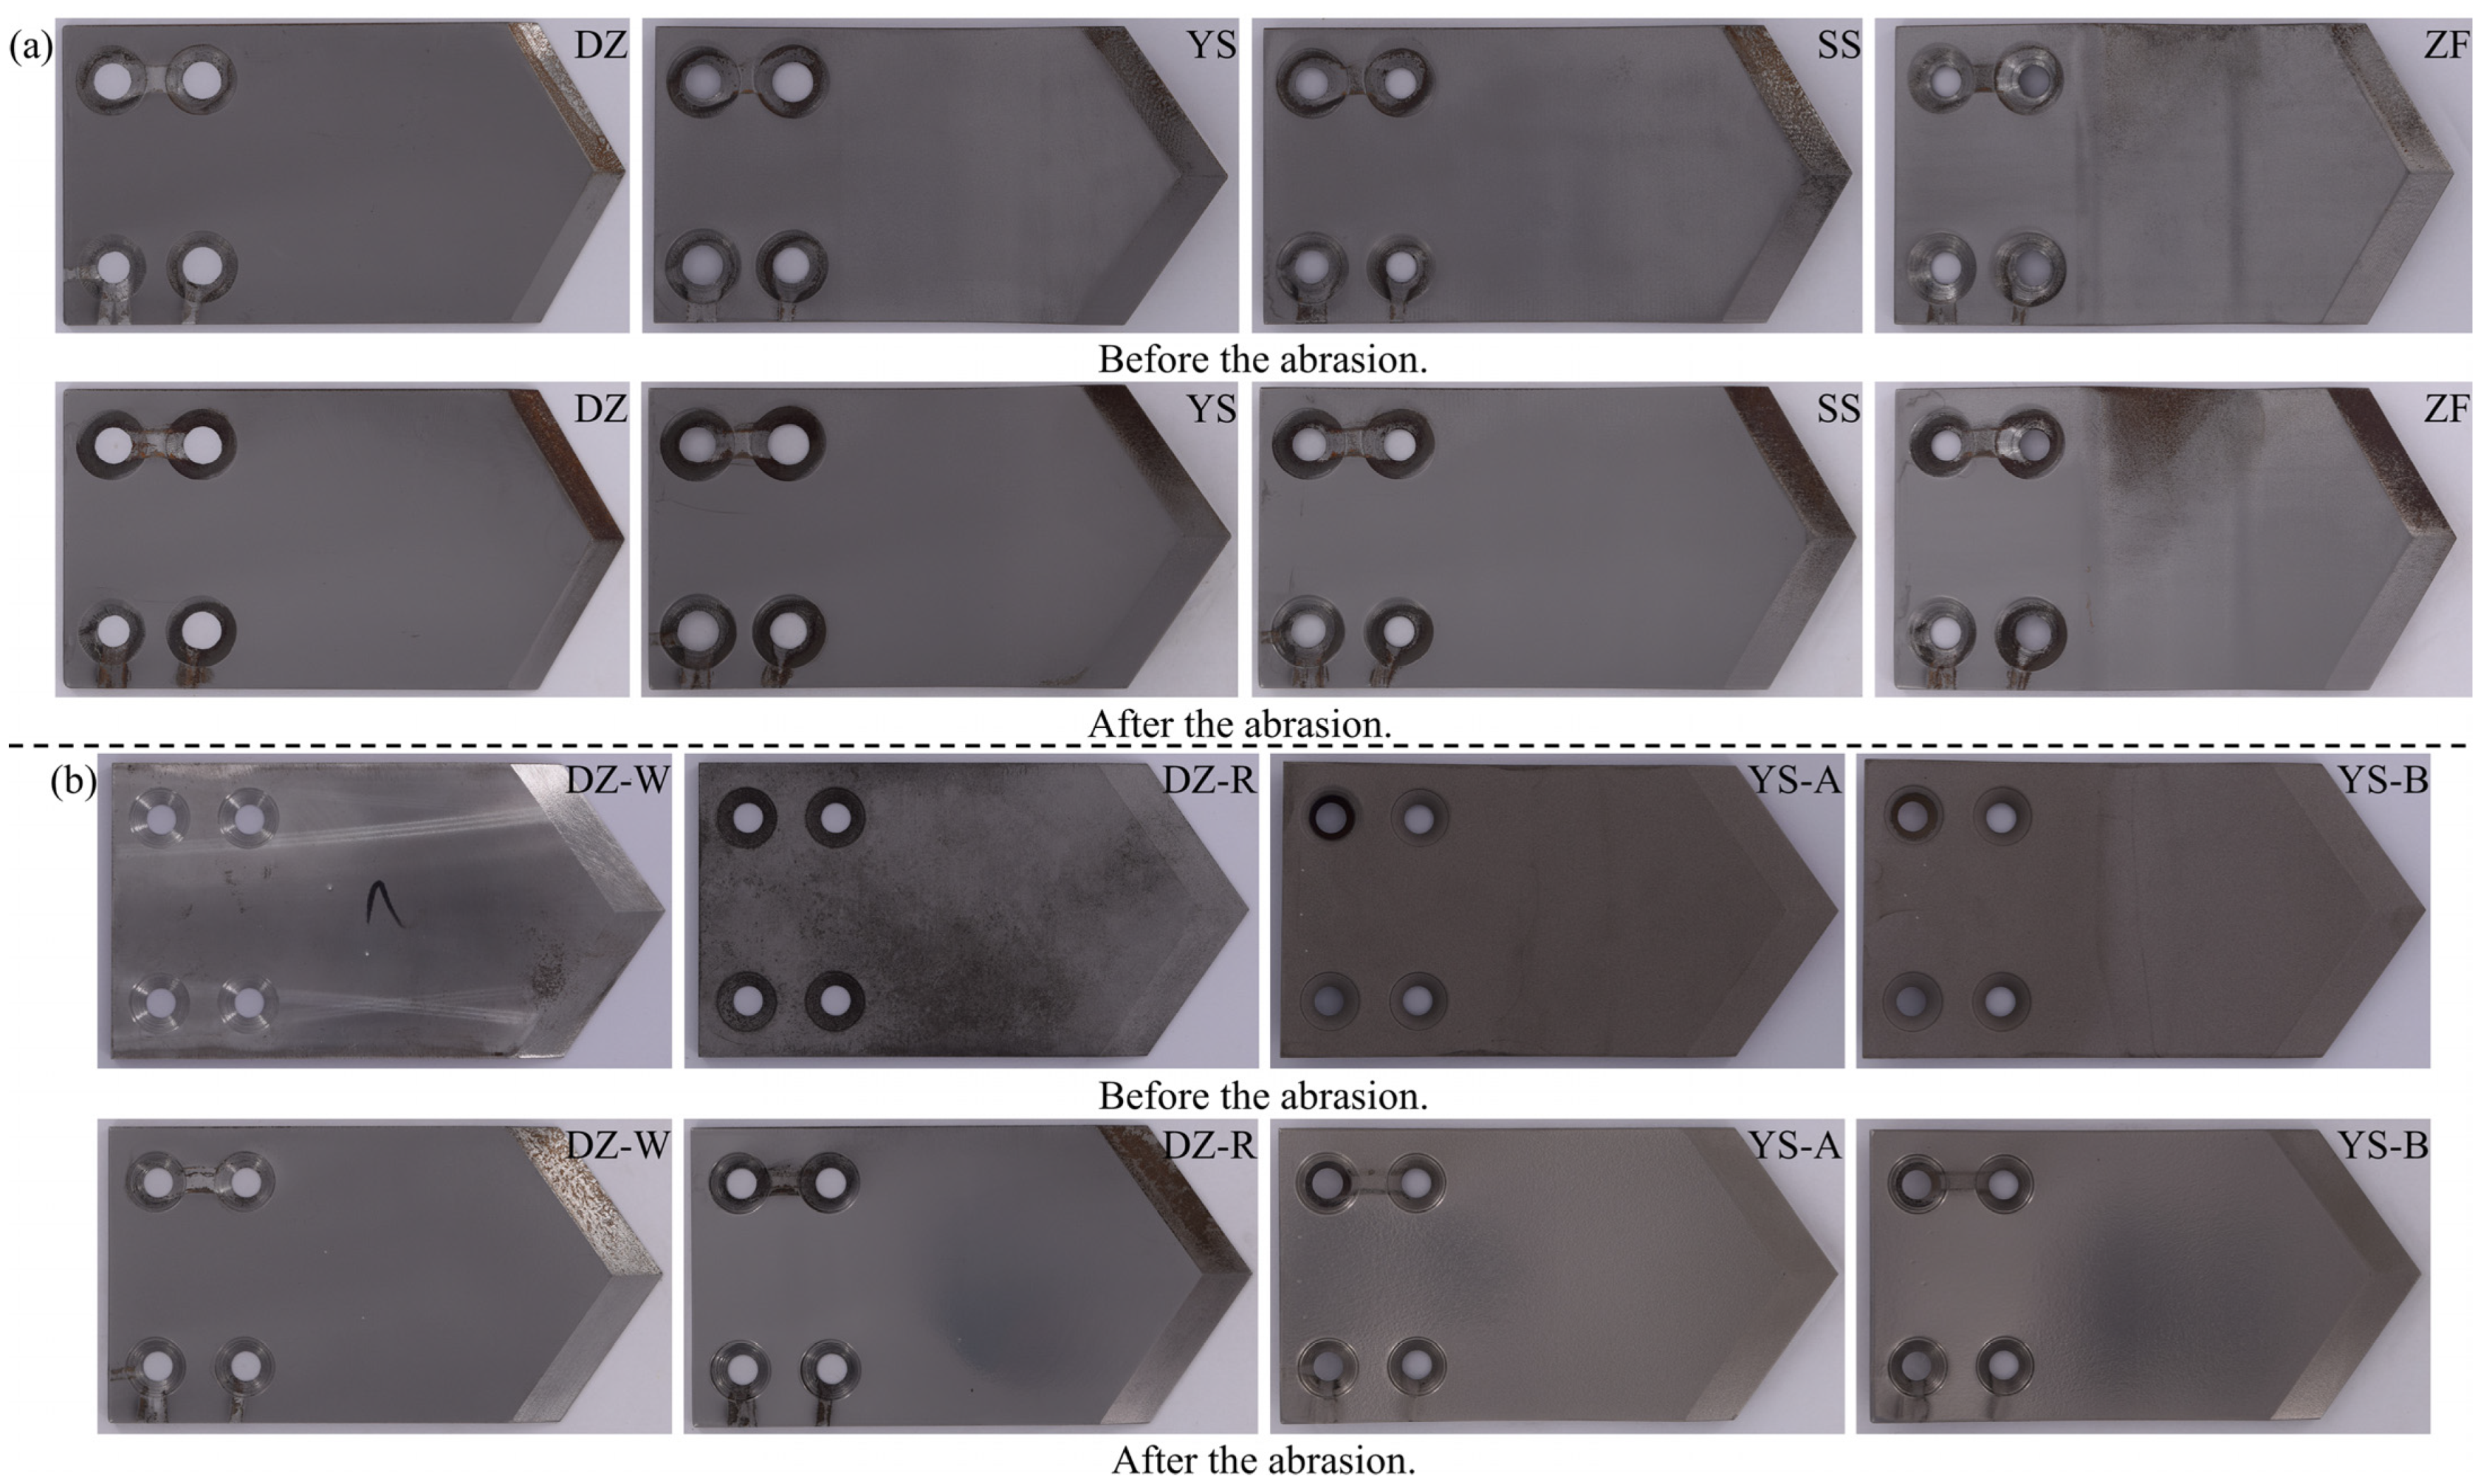
Figure 13 shows the comparison of PDSs before and after the abrasion. It can be seen from
Figure 13a that the macroscopic surface shapes have an influence on the abrasion resistance of PDSs. The change of the macroscopic surface shapes of PDSs made soil mass easier to be broken and prevented some positions of PDSs from being seriously abraded, which reduced the abrasion intensity and thus reduced the wear loss of PDSs. Meanwhile, after the abrasion, the surface of DZ-W (DZ without heat treatment) became darker while the surfaces of DZ-R (DZ with heat treatment), YS-A (YS with coating A) and YS-B (YS with coating B) became brighter after the removing of surface materials (see
Figure 13b). In addition, some positions of PDSs in
Figure 13a as well as DZ-W and DZ-R in
Figure 13b were slightly corroded because of their weak corrosion resistance.
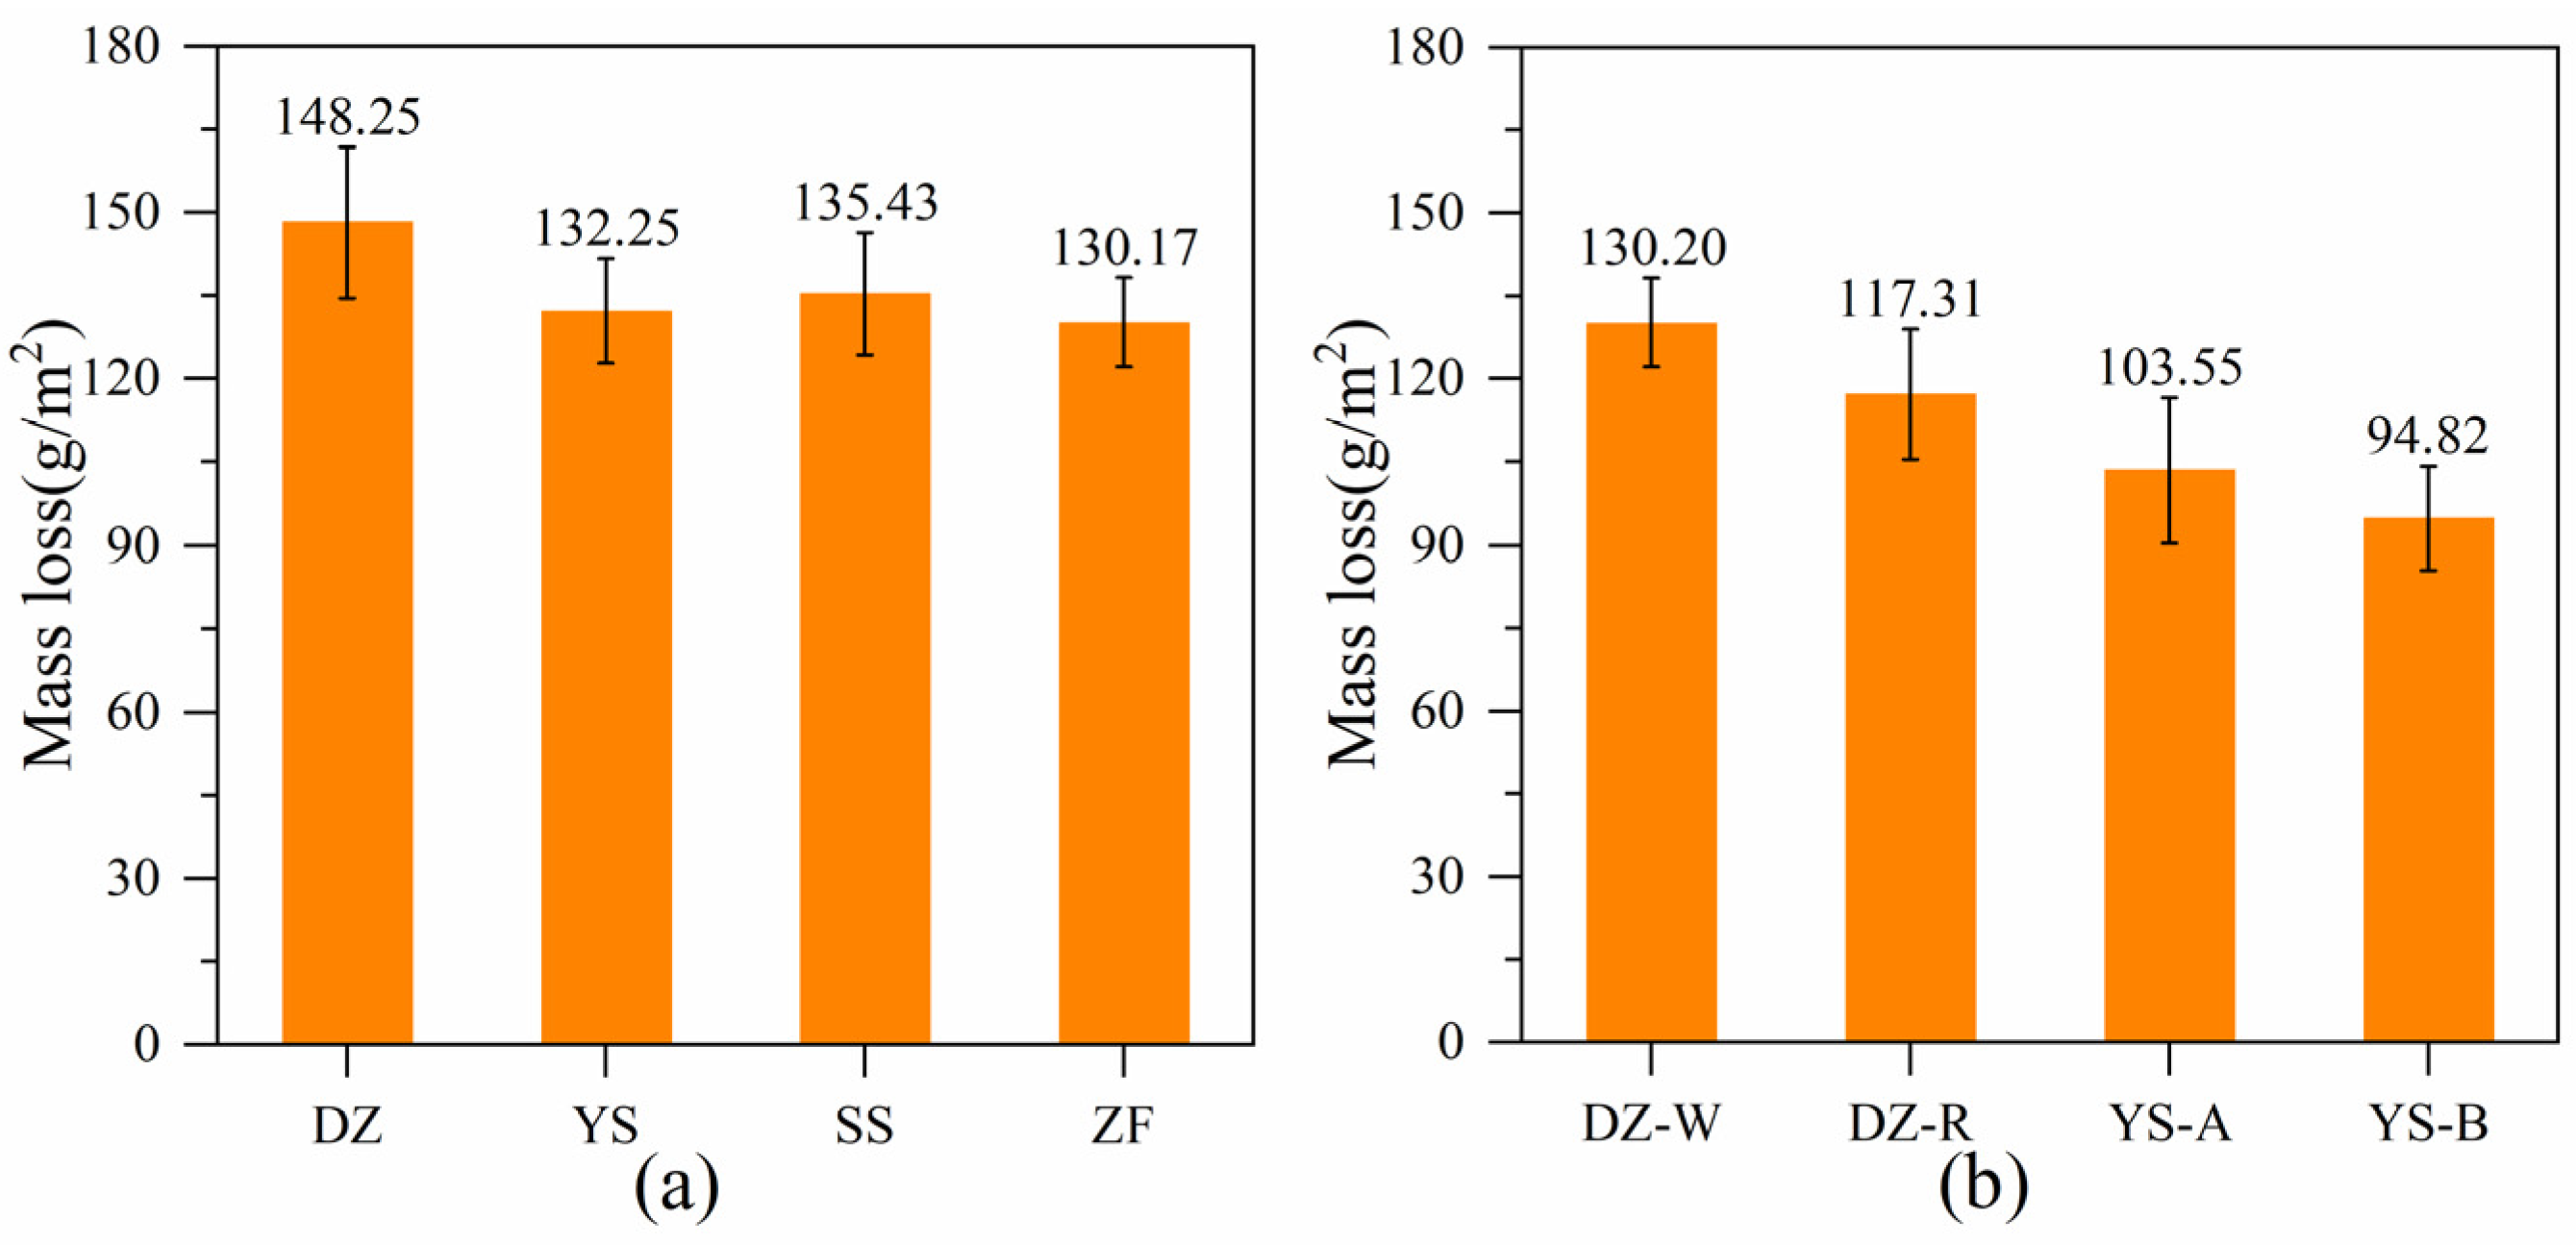
It can be seen from
Figure 14a that the mass loss of PDSs follows the order: DZ > SS > YS > ZF, and thus ZF has a macroscopic surface shape that enables it to possess the best abrasion resistance. However, a good PDS should also be characterized by low draught force, and so the working process of these four kinds of PDSs was simulated using the analysis model reported in our previous study [
25]. The simulation results showed that the draught force of DZ, YS, SS and ZF was 7.99 kN, 6.40 kN, 6.65 kN and 8.58 kN, respectively. Thus the abrasion resistance of YS with coating A (YS-A) and coating B (YS-B) as well as DZ with (DZ-R) and without (DZ-W) heat treatment were compared. As shown in
Figure 14b, YS with coating B (YS-B) exhibited the best abrasion resistance, and compared with DZ, the mass loss of YS-B decreased by more than 27.17%. Nath and Kumar [
41] fabricated HVOF sprayed WC–10Co–4Cr cermet on the plane martensitic stainless steel, but only reduced the wear loss by not more than 25%, which is slightly smaller than the data in this paper. Hence macroscopic surface modification will further improve the wear resistance of tools. Consequently, the process techniques for YS-B were recommended for adoption in practice.


 ,
, 


