1. Introduction
The tire is the only part of an automobile in contact with the pavement. The forces exerted by the vehicle on the pavement are transmitted through the tires; therefore, the tire force is an important parameter in the study of pavement mechanical behavior and has always been a research hotspot in pavement engineering, vehicle engineering, tire science, and other related fields. Many high-grade asphalt pavements do not reach their designed service life due to pavement functional failures such as rutting, cracking, pitting, and raveling. Moreover, adverse weather conditions, in particular rain and snow, can exacerbate pavement damage and cause vehicle slippage, which can affect the driver’s behavioral response and increase the number of road traffic accidents [
1,
2].
Tire–pavement contact stress is influenced by the tire tread pattern, pavement texture, vehicle load, and many other factors. Simplified models are often adopted in simulations. For instance, the continuum theory of elastic layers under double circular uniform vertical load has long been used as the gold standard in the design and construction of asphalt pavement structures [
3]. However, as highlighted repeatedly in the literature [
4], circular contact surfaces and uniformly distributed loads do not match the actual situation.
A tire–road contact patch can be obtained using the thermal paper method or paint footprint method [
5]. The effective tire contact area should be further corrected for various tread patterns [
6]. The contact patches of special tires, such as tractor tires, are more complex [
7]. Tire type [
8], tire inflation, and tire load directly affect the mechanical properties of the contact patch [
9]. When the load is small, the contact patch is elliptical, but it becomes closer to a rectangle after a certain load is reached, and the characteristics of an approximate rectangle become more obvious as the load increases [
10,
11]. Different contact patch shapes lead to different stress distributions, and the various resulting damage phenomena are difficult to explain or predict. Therefore, an accurate tri-axial stress distribution cannot be obtained using only simulation methods. A sensor that measures actual stress distributions could be used to better analyze the mechanical characteristics of tire–pavement interaction.
The pavement materials determine the design method of sensors. The typical flexible base asphalt pavement structure in the middle section of the Sui-Yue Expressway is taken as an example [
12]. As shown in
Figure 1, the pavement consists of three layers of compacted materials. The total thickness of the pavement is 62 cm, comprised of the following structure: an upper layer of SMA-13 modified asphalt concrete with a thickness of 4 cm, a middle layer of AC-20I medium-grained asphalt concrete with a thickness of 6 cm, and a lower layer of AC-25 coarse-grained asphalt concrete with a thickness of 8 cm. The pavement sits atop a base layer of ATB-25 asphalt-stabilized gravel with a thickness of 24 cm and a bottom base layer of cement-stabilized gravel with a thickness of 20 cm. Soil and natural subgrade are located further below. The mechanical properties of asphalt pavements are completely different from those of concrete- and soil-based pavement structures. Under the tire rolling condition, in addition to the vertical force
applied to the pavement surface, the tire also creates lateral forces
, longitudinal forces
, and vibration impacts.
The dynamic vehicle load is transmitted downward through each structural layer and decomposed. Due to an incomplete understanding of pavement disease mechanisms, in earlier studies, structural deformation under traffic loads was believed to be the main cause of the rutting and cracking of pavements, while wheel wear, compaction deformation, and plastic shear flow deformation were ignored [
13]. Asphalt pavement is not only elastic but also clearly exhibits viscosity [
14,
15]. Non-uniform tri-axial forces exerted through the tires in the tire–pavement contact area lead to strain concentrations, which can lead to the top-down cracking of pavements [
16,
17].
Many factors influence tire–pavement tri-axial contact stress. To better determine the true stress distribution, in addition to modeling and simulation methods, many scholars have designed various types of sensors to directly measure tri-axial stresses through experiments. Howell et al. [
18] measured the static contact stress of aircraft tires. Lippmann [
19] studied contact patch stress based on tire deformation. To obtain better measurement results, new measurement methods were introduced. Marshek [
20] used a photocell sensor that can measure the intensity of small grease stains left by ink bubbles after bursting due to tire pressure, which was used to determine the static contact stress. Smith et al. [
21] used a water-pressure sensor to measure static stress in the tire–ground contact area. Cheli [
22] used a thin polyvinylidene fluoride (PVDF) piezoelectric film as a sensor to dynamically measure contact stress, and many other scholars used the pressure plate method to study contact stresses.
Certain methods can only be used for static measurements, and others can only be used for vertical measurements. Owing to recent research developments, pressure sensors with a wide measuring range that can be used to dynamically measure force distributions in three directions have emerged. Anghelache [
23] designed an L-shaped structure sensor. De Beer [
24] introduced the stress-in-motion (SIM) system for the quantification of tri-axial (3D) tire contact force (or stress) distributions. Yi Xie and Qun Yang [
25] embedded pressure sensors in rectangular asphalt concrete to measure the vertical pressure distribution of tires with a reduced diameter. The matrix array method uses multiple sensors and has the advantages of a wide measuring range and the ability to simultaneously measure large weights along multiple axes.
In this paper, the design of a new sensor array for measuring tri-axial stresses in the tire–pavement contact patch is presented. The sensor element considers several different factors, including the pavement texture, temperature compensation, and top-down crack mechanism. An array of sensor elements was designed, and the sensors were used to measure changes in the tri-axial stress distribution in the pavement throughout the whole tire rolling process; the test data are helpful for exploring the cause of road damage.
The remainder of this article is organized as follows. In
Section 2, the sensor design and details of the finite element analysis are introduced. Zero-point temperature drift and temperature compensation were performed. In
Section 3, we calibrate the sensor performance, verify the effectiveness of the sensor using the tire loading test platform, and discuss the results of the sensor performance. In
Section 4, the main conclusions of this study and future directions are summarized.
2. Stress Sensor Design
2.1. Mechanical Structure
In China, most expressways have been designed with a high bearing capacity using semi-rigid base asphalt pavement. However, the shrinkage and cracking of the semi-rigid base material can lead to the reflection cracking of the asphalt overlay. Rigid watertight pavement with poor permeability can promote water damage. Moreover, wet–dry cycles, freeze–thaw cycles, thermal expansion, and cold weather contraction, as well as repeat loading, can reduce the strength of the base material. Thus, pavement surface defects cannot be avoided, and many pavements do not reach their designed lifespan [
26].
Newly built high-grade expressways typically adopt an asphalt-mixed graded gravel or non-bonded graded gravel filling base. This flexible base asphalt pavement has been gradually replacing semi-rigid pavements. Despite the obvious advantages, top-down cracking can still occur in flexible pavements during service. Cracks can be divided into three main types [
27]. Type I cracks are V-shaped fractures that arise due to external tensile stress. Fractures typically expand in the direction orthogonal to the fracture plane, and temperature change is an important factor. Type II cracks are caused by the sliding mode of fracture. Uneven vertical shear stress can trigger mutual slip, resulting in the formation concave and convex surface cracks. Type III cracks are caused by the tearing mode of fracture. Under the joint action of uneven parallel tensile stress and vertical shear stress, dislocation phenomena occur.
Type I cracks, mainly caused by temperature change, are the most dangerous and have the greatest possibility of breaking the pavement surface. Samples were taken by drilling cores into the pavement where cracks appeared. Top-down cracks mostly appeared on the surface pavement and extended a distance of 2 cm to 4 cm into the pavement. Early crack widths were between 6.25 and 12.5 mm. Throughout most of China’s high-grade expressways, AC-13 coarse- and dense-graded asphalt concrete or SMA-13 modified asphalt concrete is used in the upper layer, with a particle size of about 13 mm and an average texture depth of 1 mm. The asphalt parameters are the key to designing a suitable transducer structure.
Tires are not in perfect contact with pavement surfaces, and the pavement texture and the tire pattern are the most important factors that contribute to the non-uniform distribution of tri-axial force. As shown in
Figure 2, the tire and pavement are not in smooth contact; therefore, the tire is not perfectly parallel with the pavement surface, and surface gravel will enter the grooves in the tire pattern. In addition, the load on the contact surface is complex due to uneven vehicle loads, pavement slope, wheel steering, and other factors.
Existing commercial sensors cannot meet the test requirements in terms of size, strain gauge position, and measurement range. Taking these factors into consideration, a basic finite element model of the sensor was established. The upper surface area of the sensor was 12 mm × 12 mm = 144 mm2, which is slightly smaller than the particle size of the upper surface of asphalt concrete. The sensor surface was roughened to increase the friction force and to ensure adequate contact with the rough pavement surface. The sensor had a cuboidal geometry at a distance of 5 mm from the top to match the tire pattern and the local wedging of the pavement surface. When the sensor was partially wedged into the tire pattern, the tire rotated, and the forces acting on the wedged area of the sensor were more complicated, especially when the tire pressure was low, which created a larger contact area. The main part of the sensor was 8 × 8 × 15 . Compared with the upper surface, this section was slenderer, with obvious changes in stress distribution. A strain gauge was attached to obtain more accurate measurements. The strain gauge and measuring circuit were better protected by the concave structure of the sensor. The cable of the strain gauge circuit was fed into a through-hole directly below the sensor. The cylindrical pile head was fixed at the bottom, the side face was cut with a semicircular chamfer with a diameter of 3 mm, and the chamfer was fitted to the base bolt to ensure the sensor remained fixed to the base, with the ability to bear a certain impact without rotating or sliding.
2.2. Finite Element Analysis
Finite element analysis was performed in ANSYS 19.0 [
28] using an elastomer, a sensor that did not have to be assembled, as the stainless steel structure was the elastic body. Stress and strain values were calculated, and the optimal patch position was obtained. The sensor and bottom plate were tightly fixed and seamless. To simplify the analysis, a fixed-constraint mode was used for the bottom of a single transducer. Static conditions were adopted, meshing included 13227 nodes and 7337 elements, and the analysis was carried out within the linear interval. The tire pressure, tire contact area, maximum load, and material strength of the sensor were considered. The sensor was also used to measure the contact stress of heavy vehicles and special equipment. The calibration forces in three directions were determined as 740 N, which is relatively conservative compared with the maximum sensor measurement limit. The sensor was made of 17-4PH martensitic stainless steel, which exhibits high strength, high hardness, good corrosion resistance, and excellent mechanical properties after heat treatment.
Since the transducer was symmetrical,
and
were equivalent. As shown in
Figure 3a, a lateral force
of 740 N horizontal force was applied to the left side of the top of the sensor. The compressive strain in the orange region was about 0.0013869, and an equivalent tensile strain was generated in the symmetric region. Thus, the strain gauge measured strain in the sensitive area of the sensor to realize force measurements in the X or Y direction.
A vertical downward force
of 740 N was applied in the Z direction at the center of the top surface, and the strains were found to be highest at the four vertices in the middle of the transducer; therefore, the transducer was most sensitive in this area. As shown in
Figure 3b, the strain was approximately 0.00011321. An XY strain gauge was attached to the lower regions of the sensor, and a Z strain gauge was attached to the upper region; then, a modal analysis of orders 1 to 5 was performed, as shown in
Figure 3c. The sensor frequency ranged from 7362.7 Hz to 34911 Hz and increased with the increasing tire crushing speed. Based on experience, for a 0.2 m contact length and a speed of 30 m/s (108 km/h), an excitation frequency of 75 Hz is much lower than the basic natural frequency. In this paper, quasi-static measurements were performed, and the natural frequency of the sensor was shown to easily meet the sensing requirements.
2.3. Strain Gauge Arrangement and Measuring Circuit
A strain gauge is a highly sensitive device. When attached to the surface of an elastomer, the strain gauge will produce the same strain as the component. As the strain gauge is stretched or compressed, the resistance value changes and can be converted into a voltage or current. Based on a stress and strain analysis of the elastic element, the appropriate strain gauge arrangement to form the measuring bridge was determined. The sensitivity of the sensor was improved, and the cross-link effect was reduced.
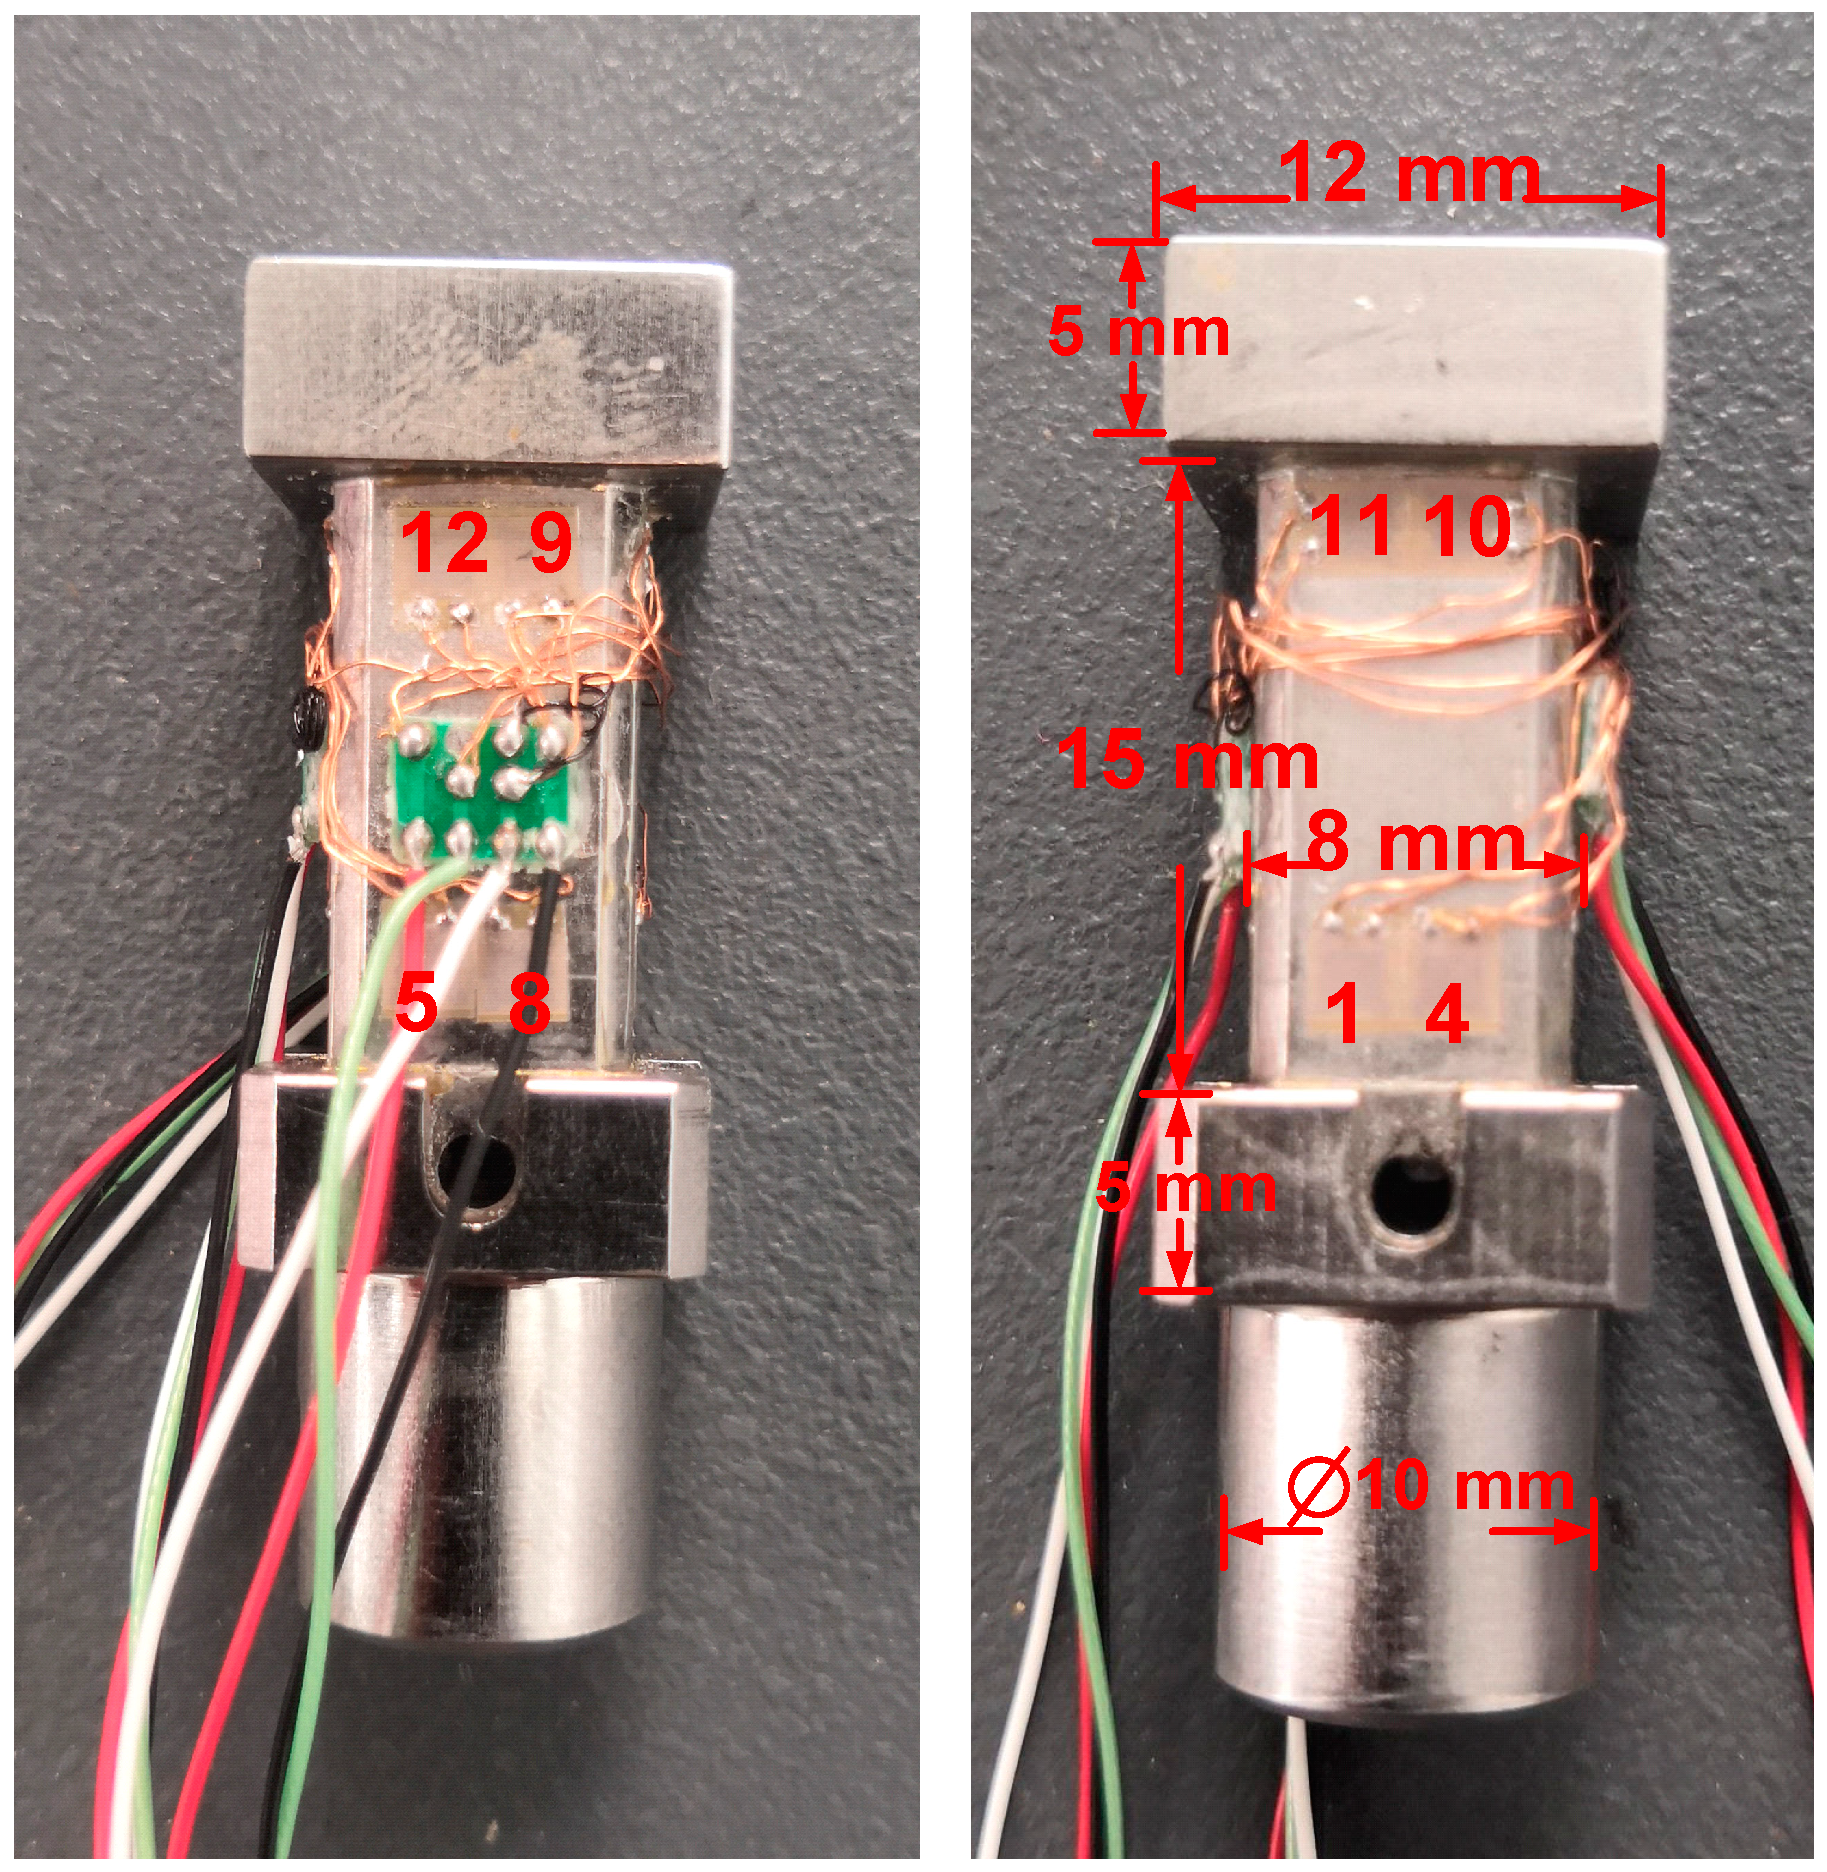
The results of the finite element analysis suggested that the proposed sensor structure had sufficient sensitivity. To test the strain gauge arrangement, strain gauges were arranged on the elastomer, as shown in
Figure 4. The specific sticking position of the strain gauge is shown in
Figure 5. R1 and R4 were on the same side, and R2 and R3 were on the opposite side. The other strain gauges were also arranged in the same way.
Strain gauges R1 and R4 produced positive strains when stretched, and R2 and R3 produced negative strains when compressed, thus forming a Wheatstone bridge, which was used to measure strain in the X direction. Similarly, the same Wheatstone bridge could be used to measure strains in the Y direction. In this case, R5 and R8 produced positive strains when stretched, and R6 and R7 produced negative strains when compressed; however, the direction was orthogonal to the X direction. Two groups of strain gauges in series were selected to measure strains in the Z direction, forming a set of bridge arms: R9, R13, R12, and R14 were arranged vertically and compressed when stress was applied; R10, R11, R14, and R15 were arranged laterally and were stretched when stress was applied. Altogether, eight strain gauges were used to measure strain in the Z direction. The dimensions of the sensor structure are illustrated in
Figure 5. After forming the bridge, the outer end of the sensor was sealed with silica gel to protect the circuit. We used a BEK 350 series strain gauge, thickness 2.5 μm, sensitive grid size 1.5 mm × 2.5 mm, base size 4.6 mm × 3.6 mm, resistance 350 Ω ± 0.5%.
2.4. Zero-Drift and Temperature Compensation
As mentioned above, temperature drift is an important factor in pavement diseases; therefore, sensor designs should consider temperature changes and ensure measurement accuracy under different temperature conditions. Zero-drift and temperature compensation are crucial. For a Wheatstone bridge composed of four strain gauges, the initial zero of a transducer will not be zero, due to differences between the strain gauge resistance and the resistance of the wire. The transducer signal is poor at zero resistance. The zero-point signal error is
When
S , the difference in resistance must be compensated:
where
is the bridge supply voltage,
is the strain gauge resistance, and
is the output voltage.
To rebalance the bridge, equivalent Constantan wire must be connected to the bridge arm using a reverse change for compensation. After zero compensation, since the printed circuit board (PCB) and bridge are connected by copper wire, the zero point will also change at high and low temperatures and the zero-point temperature coefficient
must be compensated to zero. The sensor zero-point change due to temperature change is
The unit is .
Thus, the following resistance must be compensated:
where
is the sensor signal at a high temperature (greater than 40 °C) with zero output,
is the sensor signal at room temperature (around 20 °C) with zero output,
is the sensitivity of the sensor at room temperature (around 20 °C), and
is the sensor from room temperature to high temperature.
The sensor was an elastomer made of stainless steel. The elastic modulus (E) of stainless steel decreases as the temperature increases. When the temperature rises, the material softens; therefore, when the sensor was subjected to the same load, the strain would increase and the signal output would be larger. To compensate for the sensitivity to temperature increase, two nickel (Ni) resistors with resistance values that increased with increasing temperature were connected in series in the positive and negative electrodes of the power supply. Compensating resistors reduce the supply bridge voltage to offset the increase in signal caused by changes in the modulus of the elastomer. Since the resistance of Ni does not change linearly with temperature, a precision resistor of about four times the resistance of the resistor also had to be added in parallel to linearize the Ni resistor.
3. Results and Discussion of Sensor Performance
3.1. Calibration Test
The range, sensitivity, repeatability, creep, and other performance indicators directly affect measurement accuracy. For a tri-axial force transducer, calibration is a critical step. The sensors are fabricated by cutting and processing the elastomer, and cross-coupling or interference may arise between the tri-axial channels. Since the relationship between the deformation of the elastomer and the circuit measurement is almost linear, partial cross-links can be eliminated by using a decoupling matrix.
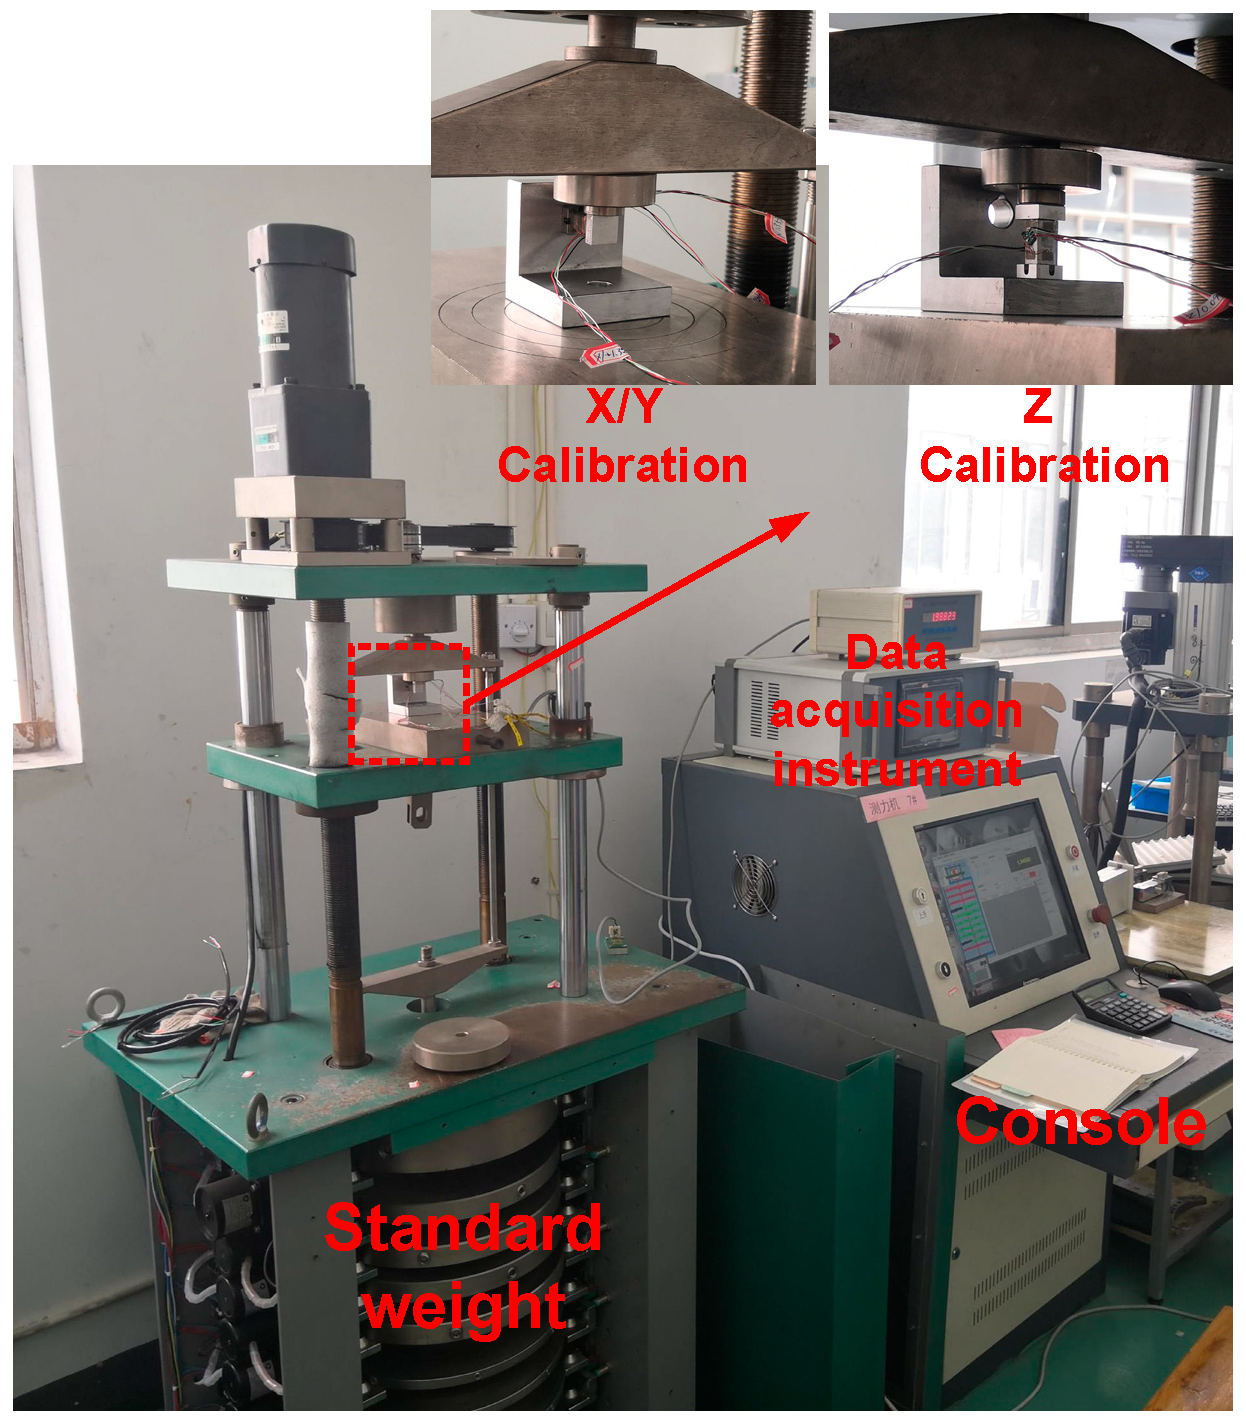
The gravitational acceleration in the laboratory was 9.7941
. As shown in
Figure 6, calibration tests were carried out on the calibration test bench, which was comprised of a weight-loading table, control system, and data-acquisition system. The sensor was fixed on the bracket and placed directly below the loading hook to ensure close contact and no sliding. Then, weight was gradually added up to the maximum design weight. The inset in
Figure 6 shows the calibration of the sensor in the X direction on the left, which was rotated 90 degrees for the calibration, and the vertical Z-direction calibration is shown on the right. From the A/D data-acquisition circuit, the relationship between loading force and output voltage could be derived. The test results are presented in
Figure 7.
The X direction and Y direction were mutually perpendicular and symmetric, and the loading curves and output voltages were similar. The measurements were approximately linear over the tested range. The performance of the sensor was determined through multiple loading and unloading tests from 0 to 800 N in the three directions (
Table 1). From the third column in
Table 1, it can be seen that the maximum error value of repeatability was less than or equal to 0.356%. This indicates that the sensor has good repeatability in three directions.
Creep is another factor that should be considered in the practical application of sensors, particularly those used for slow-loading and quasi-static measurements. The creep values of the sensor were recorded for 900 s as the constant load limit in the range was applied. The creep results are presented in (
Table 2). The results suggest that the real-time tri-axial force output remained relatively stable, indicating good creep resistance.
3.2. Tire Loading Measurements
Although the sensors met the actual tri-axial stress measurement demands for tire–pavement contact, based on the calibration test results, there are differences between actual engineering applications and the theoretical test environment. To verify the effectiveness and stability of the sensor, the sensor was further tested in simulated tire–pavement contact load experiments. The test platform is shown in
Figure 8.
The simulated loading platform was mainly comprised of an experimental bench, control cabinet, and data-acquisition system. A program was used to control the hydraulic push rod point dynamic loading or constant loading via the control cabinet, and the vertical force was the output. The bottom plate of the test bench could be moved left and right on the slide by manually rotating a screw, which simulated traction force in the driving direction. The tire could move up and down within a certain range, and stress distributions at different positions on the tire could be obtained by moving the tire latterly. The movement of a vehicle tire was studied under light load conditions, and the interaction between the tire and pavement was simulated more accurately. By setting certain tri-axial loading parameters, a constant load or reciprocating load with a frequency of 0 to 3 Hz was applied in the Z direction. The tires used in the experiment were 205/55R16 radial car tires with an air pressure of 240 kPa.
The measuring surface in contact with the tire was composed of a cross-shaped array with the same transverse width as the tire and could measure the changes in the tire contact stress across the entire cross-section. The longitudinal sensor measured the influence of the tire tread pattern on the stress distribution, and its longitudinal length met at least two pattern periods. Since only the sensor performance was tested here, the sensors were not used in an array. Instead, three sensors were tested in an L-shaped arrangement in the center of the array—sensors 1, 2, and 3, as shown in
Figure 8. Sensor 4 and other surrounding bolts of equivalent volume were substituted with metal blocks. The sensors and replacement blocks were close to the gravel size of pavement, resulting in measured values closer to the real situation. Nonetheless, the pressure produced by the tires of actual trucks and cars would be far greater than those generated by the simulated test platform. To have a better sensing effect, the sensor and an equivalent metal block were used to construct a cross-array plane, which was slightly higher (0.3 mm) than the bottom plane. In this way, the tire and the sensor were in closer contact, and the force was greater, which overcame the problem of insufficient pressure on the test platform.
In the first step, the sensor was fixed to an area above the tread center and
was slowly applied up to 4000 N, then held constant. An upward thrust was applied in the vertical direction, while ensuring no relative sliding between the tire and the sensor. Then, the handle was slowly rotated at a uniform speed along the needle, moving the entire bottom plate to the right as the tire rolled from the right edge of sensors 2 and 3 toward sensor 1. At this point, the tire was in contact with approximately 12 sensors and equivalent replacement blocks. From
Figure 9d, it can be seen that the stress distributions of the three sensors in the three directions were not uniform. Sensor 2 was located at a gap in the tire pattern. During the rolling process, sensor 1 had a delay of about 0.5 s; however, the measured values of all three sensors showed similar trends, with a maximum value of 23 kPa in the X direction, 41 kPa in the Y direction, and 208 kPa in the Z direction. It can be seen from
Figure 9a that, as the tire rolled in the X direction and approached the sensor, the forward thrust of the tire was exerted on the sensors. After the tire had completely rolled over the top of the sensor, the force tended to zero. During the second half of the tire rolling process, the direction of the force changed and the magnitude rapidly declined after reaching a peak value. The variation of force during a single rolling cycle resembled a sine function. This trend was almost the same in the Z and Y directions. However, the force in the Z direction was five times larger. It should be noted that there was a certain difference between the magnitude of the force in the Y direction and the real measured force of the tire in the direction perpendicular to the ground obtained from the loading experiment, but the simulated test rig met the preliminary test of the sensor performance in the early stage.
After completing the test in the upper tire region (left edge of the tire in the longitudinal view), the tire position was changed to ensure contact with sensors located in the middle and lower regions. The handle was reset to the initial position, the bottom plate was reversed, and the tire was returned to its initial position. Stress values in the middle and lower regions were subsequently determined. The strain signals from sensors 1 and 2 were obtained through the A/D data-acquisition system and converted into equivalent stresses. In order to improve the repeatability of the test, all equipment was reset to its original position in each test. However, the vibration of the electric motor and hydraulic push rod, as well as the irregularity of the tire pattern, would have had a certain influence on the test results. Nevertheless, the overall trend of the measured curve was consistent.
Sensors 1 and 2 were in the same plane, which allowed trends in the stress distribution to be obtained at the same horizontal position. The test was performed three times to determine changes in stress distributions in the upper, middle, and lower regions of the tire during a complete rolling process. In
Figure 10, the horizontal axis is the tire width and the vertical axis is the tire rolling length.
Figure 10 is a heat map composed of three test results using the test method in
Figure 9. This figure can clearly reflect the stress change of the contact patch between the tire and pavement surface in a complete rolling process. The stress distribution between the tire and the sensor was not uniform during the contact process. Under a small force, the stress was greater in the middle compared with the surrounding areas, regardless of the direction (X, Y, or Z). The tire pattern and pavement texture were important factors leading to the uneven distribution of stress. The stresses in the X direction in
Figure 10a are consistent with those in
Figure 9a, exhibiting a typical sinusoidal trend. The stresses in the Y and Z directions shown in
Figure 10b,c are also consistent with those in
Figure 9b,c. There is only one peak, and the stresses decrease rapidly after reaching the maximum value.


