Article

Nondestructive Evaluation of Thermal Barrier Coatings Thickness Using Terahertz Technique Combined with PCA–GA–ELM Algorithm

1
Key Laboratory of Pressure System and Safety, Ministry of Education, School of Mechanical and Power Engineering, East China University of Science and Technology, No.130 Meilong Road, Shanghai 200237, China
2
School of Artificial Intelligence, Anhui Polytechnic University, Wuhu 241000, China
3
Laboratory of Optics, Terahertz and Non-Destructive Testing, School of Mechanical Engineering and Automation, Fuzhou University, Fuzhou 350108, China
*
Authors to whom correspondence should be addressed.
Coatings 2022, 12(3), 390; https://doi.org/10.3390/coatings12030390
Submission received: 30 January 2022 / Revised: 5 March 2022 / Accepted: 14 March 2022 / Published: 15 March 2022

Abstract

:
Thermal barrier coatings (TBCs) are usually used in high temperature and harsh environment, resulting in thinning or even spalling off. Hence, it is vital to detect the thickness of the TBCs. In this study, a hybrid machine learning model combined with terahertz time-domain spectroscopy technology was designed to predict the thickness of TBCs. The terahertz signals were obtained from the samples prepared in laboratory and actual turbine blade. The principal component analysis (PCA) method was used to decrease the data dimensions. Finally, an extreme learning machine (ELM) was proposed to establish the thickness of TBCs prediction model. Genetic algorithm (GA) was selected to optimize the model to make it more accurate. The results showed that the root correlation coefficient (R2) exceeded 0.97 and the errors (root mean square error and mean absolute percentage error) were less than 2.57. This study proposes that terahertz time-domain technology combined with PCA–GA–ELM model is accurate and feasible for evaluating the thickness of the TBCs.

1. Introduction

The increasing thrust-weight-ratio of an aeroengine increases the demand for the high temperature resistance of the hot-section components of aero-engines. Thermal barrier coatings (TBCs) have become an important means to protect the hot-end components of aero-engines from high temperature because of their good high temperature resistance, low thermal conductivity, and good corrosion resistance. The typical TBCs systems prepared by atmospheric-plasma-sprayed (APS) consist of four layers: a ceramic top coat (TC)—the material is usually 6–8 wt% Y2O3-stabilized-ZrO2 (YSZ)—acting as thermal insulator; a metallic bond coat (BC)—the material is usually MCrAlY—providing the oxidation protection; and a superalloy substrate and thermal grown oxides (TGO), which are generated owing to the high temperature oxidation of the metal in BC at the interface of BC/TC [1,2,3,4,5]. The hot-section components are used in high temperature and severe environment for a long time. The factors of high temperature oxidation, high thermal fatigue, erosion impact, CMAS (calcium–magnesium–aluminum–silicate) attack, and the difference of thermal expansion coefficient between alloy substrate and ceramic top coat weaken the performance of TBCs, eventually leading to coatings spallation. The TBCs thickness has a great influence on thermal insulation performance. The premature failure of the coating directly exposes the superalloy to the high temperature environment, resulting in a detrimental effect on the performances of aero-engine [6,7,8,9,10,11]. Therefore, in order to guarantee the structural integrity and service performance of aero-engine blades, it is necessary to effectively monitor the structural integrity of TBCs.
At present, there are many different nondestructive testing (NDT) techniques, including ultrasonic waves, eddy current, X-rays, thermography, and infrared—used to assess the structural integrity of TBCs. All these methods and technologies have their own advantages and disadvantages. For example, due to the requirement of liquid couplants and the existence of edge effects, ultrasound waves are limited by sample size and volume; eddy current cannot act on dielectric materials; X-ray can do harm to human body and may cause defects inside TBCs; thermography technology is greatly affected by the depth and size of defects, which makes it unable to be applied in near surface defect; and the accuracy of the infrared thermal imaging technology changes with the change of coating thickness and the thermal conductivity [12,13,14,15,16,17]. Recently, terahertz (THz) NDT techniques have achieved remarkable things in the nondestructive testing field, such as integrated circuit packages, glass-fiber-reinforced plastic materials, composite materials, biomedicine, and biopharmaceuticals [18,19,20,21,22,23,24,25]. Compared with traditional DNT methods, terahertz time-domain spectroscopy (THz–TDS) technology has the advantages of having strong penetrability and high accuracy while being non-contact, without coupling, and having low radiation impact on the human body and materials [26]. In terms of thermal barrier coatings, the research of THz–TDS technology focuses on TC thickness evaluation [27,28,29], TGO inspection [30,31], porosity estimation [32,33], interface delamination [34], and erosion morphology characterization [35]. In previous research, White et al. [29] measured the thickness of TBCs by reflective terahertz time domain spectroscopy, when the refractive index of ceramic layer was 3.73. However, the TBCs have a porous microstructure, and the refractive index changes with the spraying process and service time. Fukuchi et al. [27,28] proposed to extract the first three reflection peaks, respectively, for Fourier transform and calculate the refractive index combined with Fresnel formula and Lambert Beer theorem. However, it is found in our study that with the thinning of the coating thickness, the overlap of reflection peaks would occur, resulting in the inability to extract the three reflection peaks alone. Thus, it makes this method ineffective. Dook van Mechelen et al. modeled the structure as a stratified system through the physical process of light–matter interaction, which improved the measurement accuracy of multilayer materials [36,37].
In this work, we propose a THz–TDS method for measuring the TC thickness with higher accuracy and wider range than the traditional method. The terahertz time domain spectral signals are obtained by engine blades and thermal barrier coatings with different thicknesses prepared in the laboratory. The principal component analysis (PCA) is used to extract signals features and decrease the dimension of these terahertz time-domain spectral signals. The processed signals were used as the input variable of extreme learning machine (ELM) to predict TC thickness. Genetic algorithm (GA) was selected to optimize the weight and threshold to make the model more reliable.

2. Experimental Methods and Procedures

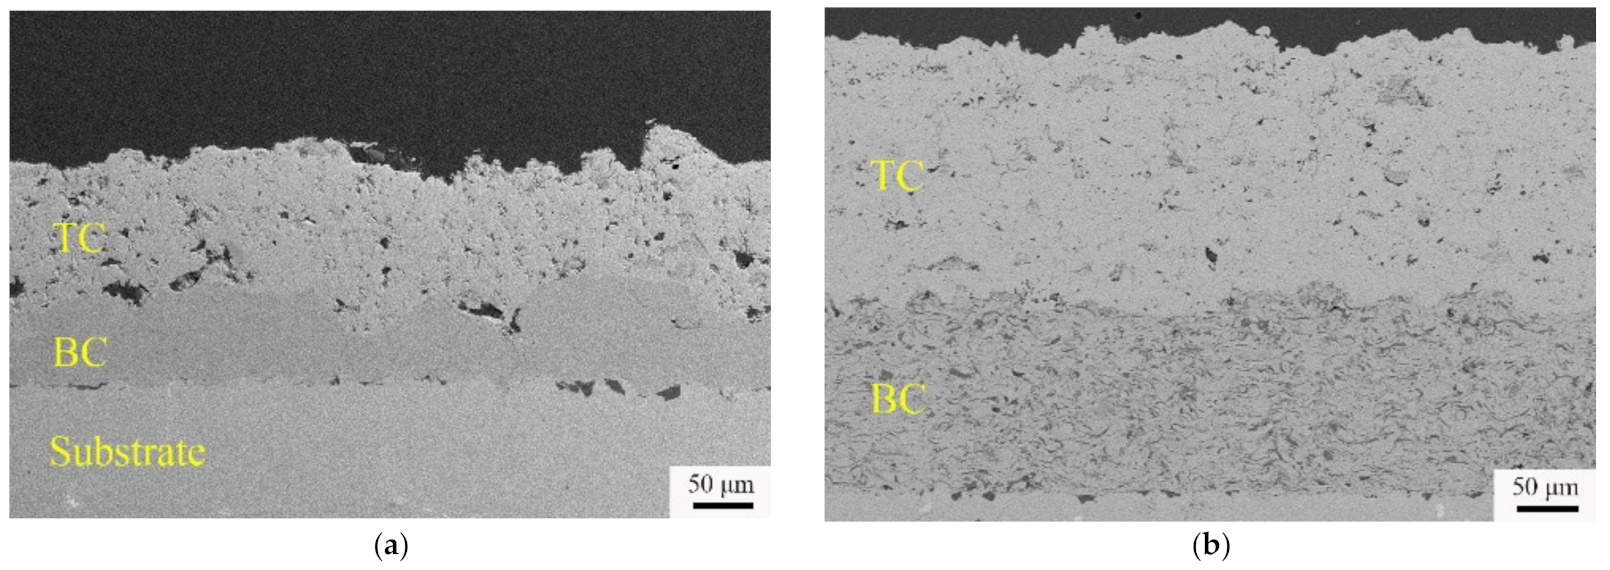
2.1. Sample Preparation and Microstructural Characteristics

In this work, all thermal barrier coatings were deposited by atmospheric plasma spraying (F4-MB, Oerlikon Metco, Pfäffikon, Switzerland). Prior to deposition, carbon steel substrate with the thickness of 3 mm were subject to sand blasting and ultrasonic cleaning by alcohol. Commercially available 8 wt.%Y2O3-stabilized ZrO2 (8YSZ) powders with particle sizes in the ranges of 15–45 μm were used to deposit the TC. Argon and hydrogen were used as the main plasma gas and auxiliary gas in the spraying process, respectively. The gas flow rates of argon and hydrogen were maintained at 40 l/min and 9 l/min, respectively. Argon was also used as the powder feed gas, and the powder feeding rate was 1.5 r/min. The plasma power was controlled at 41.6 kW during coating deposition. The spray gun was controlled by the manipulator at a speed of 500 mm/s, and spray distance was 100 mm. The mental bonding layer was prepared with metallic NiCrAlY powder (45–106 µm). Since the terahertz wave cannot pass through the bond layer, we do not explain the process parameters of the bonding layer. The plasma spraying parameters of TBCs are summarized in Table 1. The TC thicknesses are between 30 and 330 μm (per-interval thickness was about 30 μm).
The true TC thicknesses were obtained by scanning electron microscopy (SEM) after a metallographic polishing procedure was employed.

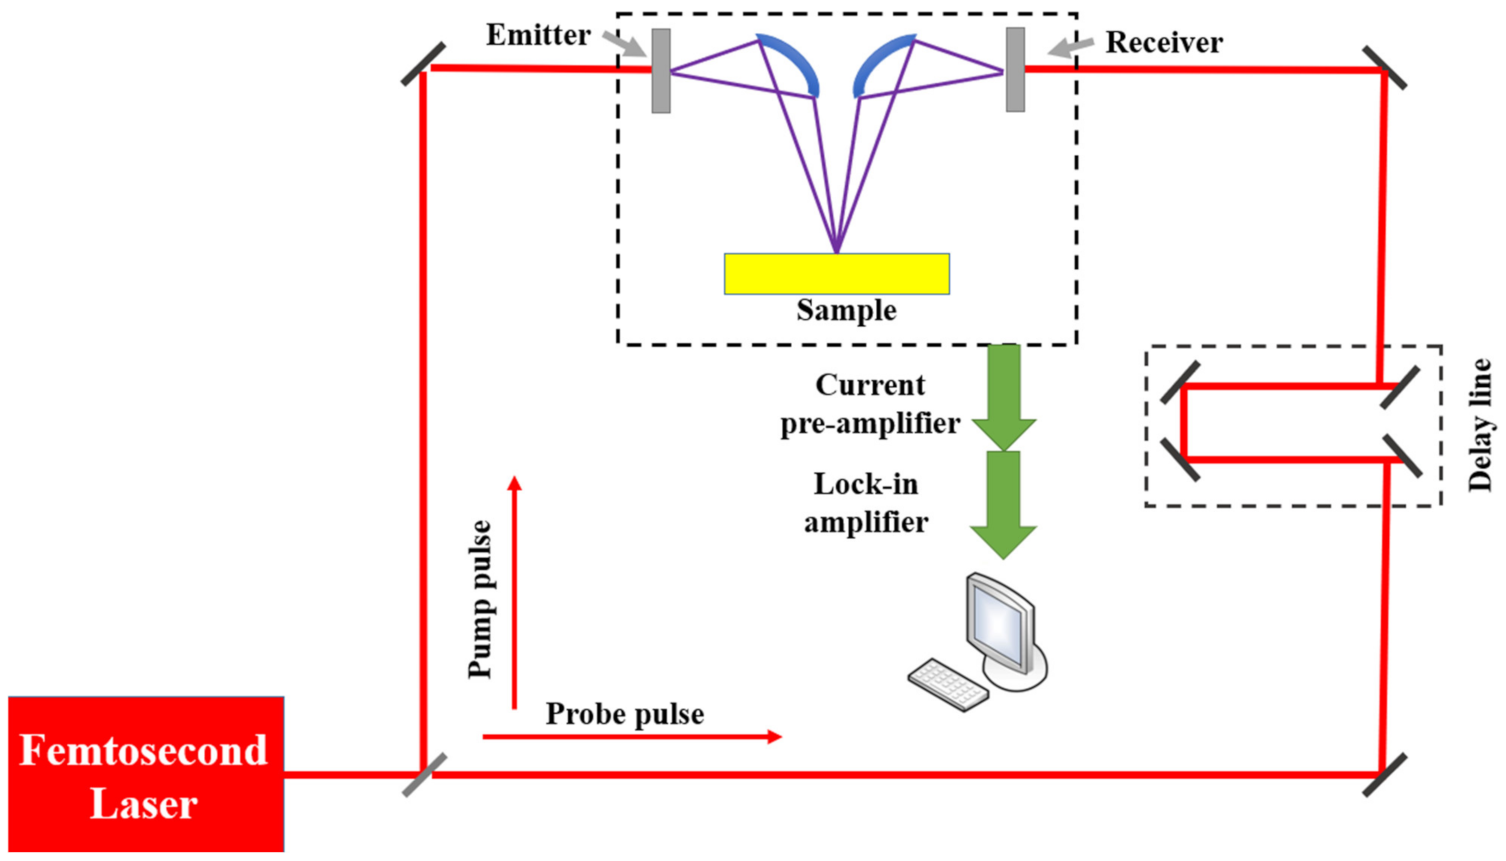
2.2. Terahertz Experimental Setup and Sample Testing Method

In this research, the terahertz signals of all samples are obtained by THz time-domain system (TeraPulse 4000, TeraView, Cambridge, UK). This system is mainly composed of a femtosecond laser module, delay line module, emitter, and receiver module. Figure 1. shows the composition of this system. Terahertz pulses are generated by a photoconductive antenna excited by a femtosecond laser. The laser provides a pulse with a wavelength of 780 nm and an average power of 1.1 W. The repetition frequency of the pulse is 76 MHz, and the duration time is 80 fs. The spectrum range is 0.06~4.5 THz. Off-axis paraboloid mirror is used to focus, collimate, and collect the THz radiation. Step size of the delay unit is 100 ps/s. Frequency resolution is 1.2 cm−1. The total acquisition time of each point is 33.18 ps. Herein, the THz–TDS system adopts 15° incidence in the reflection mode. To avoid the influence of polar molecules such as water vapor in the air, nitrogen with relative humidity of less than 1% will be filled into the system before the experiment. The ambient temperature during the test was 20 °C. Each sample point will be measured three times, and the average value will be taken to eliminate the influence of environmental noise. Before measuring the coating sample, a metal sheet will be measured to obtain the complete reference reflection signal.
As shown in Figure 2, when the incident terahertz wave reaches the coating surface, some will be reflected at the Air–TC interface, and the other will pass through the Air–TC interface and be reflected multiple times at the TC–BC interface. Since the terahertz wave cannot pass through the metal bond layer, we can obtain the relevant information of the top coat from the reflected wave. The frequency domain signal of the samples E s a m p l e ω can be obtained by fast Fourier transform (FFT) of the time domain signal. Accordingly, the refractive index of YSZ coating and the thickness of TC can be deduced from the frequency domain information using the methods proposed in references [27,28]. However, as shown in Figure 3, when we measure the TBC on high-pressure turbine, we found that with the decrease of the thickness, the time delay (Δt) between multiple reflection peaks will be reduced and the signals of multiple reflection peaks will overlap, so it is difficult to extract the reflection peaks, respectively.

3. Modeling Methods

Machine learning methods have strong data-processing and regression ability, and are widely used in the field of nondestructive testing [32,38,39]. In this study, PCA was used to compress data and extract the characteristics of terahertz signals. ELM algorithm was used to establish models. Three evaluation indicators—root correlation coefficient (R2), mean absolute percentage error (MAPE) and root mean square error (RMSE)—were used to evaluate the prediction results [34,40]. They can be estimated as follows:
R 2 = ( i = 1 a Y ^ i Y ^ ¯ Y i Y ¯ / i = 1 a Y ^ i Y ^ ¯ 2 i = 1 a Y i Y ¯ 2 ) 2
R M S E = i = 1 a Y i Y ^ i 2 / a
M A P E = i = 1 a Y i Y ^ i Y i / a
Here, a is the number of TC thickness signals used in this experiment, Y ¯ represented the average of Y i , and Y i and Y ^ i represent the true thickness and predicted thickness of the a i sample.

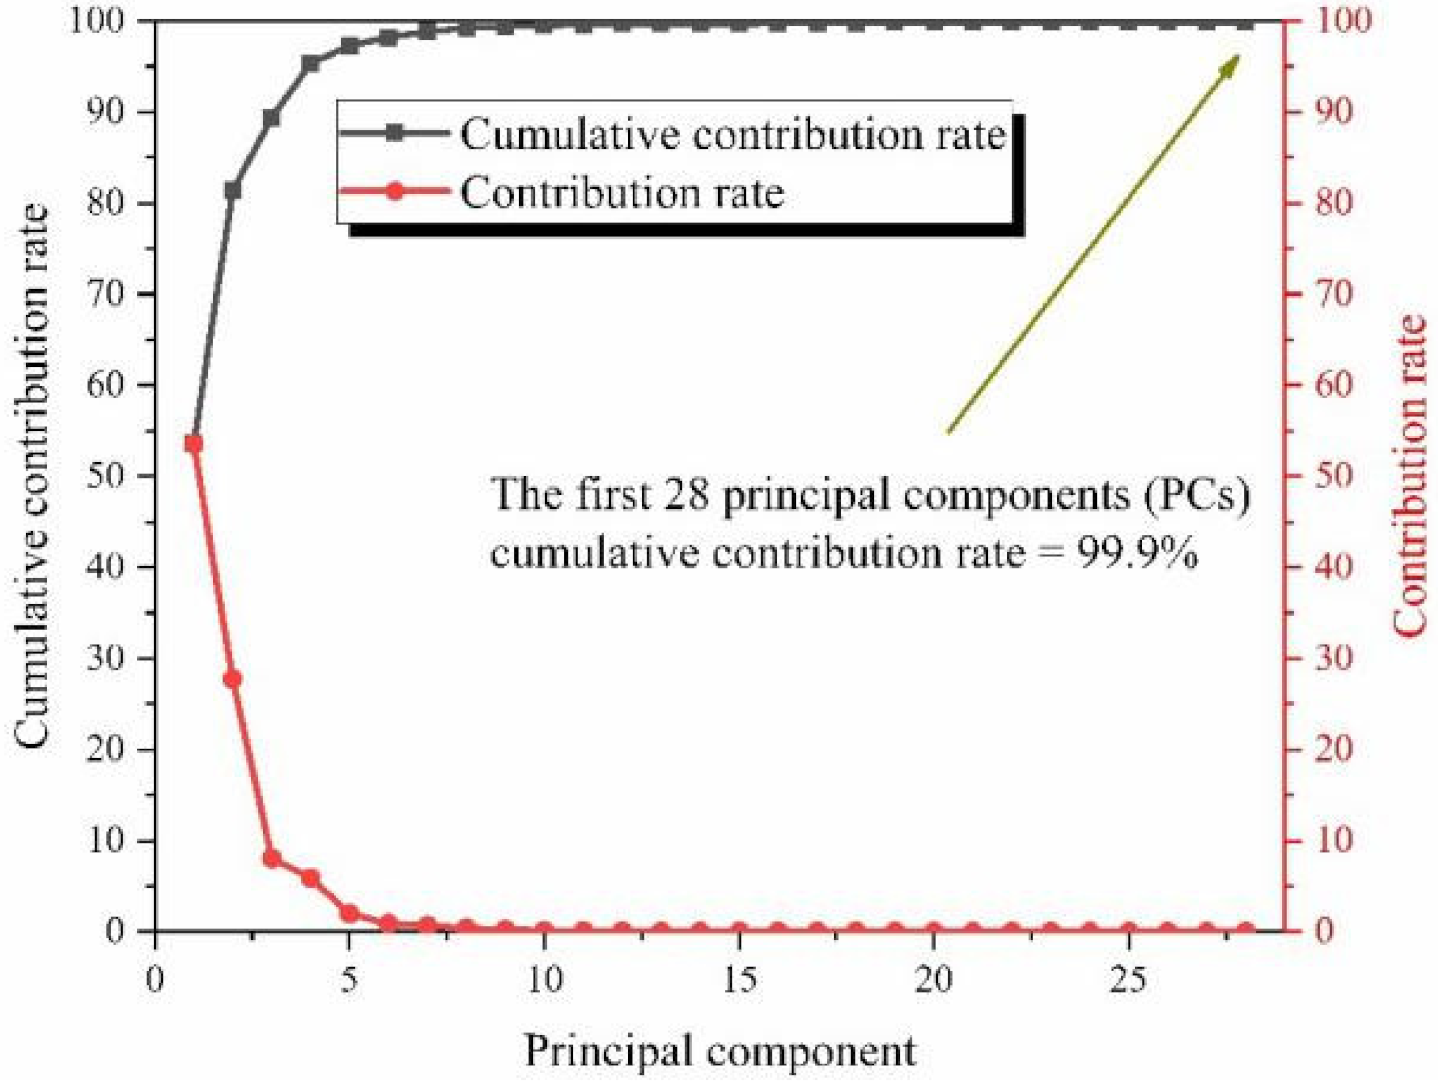
3.1. Principal Component Analysis

Since the dimension of the unprocessed single terahertz signal is 4096, if they are directly modeled as input parameters, the model will become too complex and consume more time. At the same time, simplifying the redundant terahertz data is conducive to improving the accuracy of model prediction. Principal component analysis is a general statistical analysis approach to decrease the dimension of data. It can replace the original signals with fewer principal components (PCs) on the basis of retaining as much original information as possible, to reduce the data dimension and simplify the model [41,42].
Firstly, there are a samples to be tested, and the observed data of each sample has b values. So, the original data of the samples could be expressed as
X = X 11 X 12 X 1 b X 21 X 22 X 2 b X a 1 X a 2 X a b = ( x 1 , x 2 , , x b )
Standardize the original data matrix X to eliminate the influence of dimension according to
x i j ˜ = x i j x ˜ j τ j i = 1 , 2 , , a ; j = 1 , 2 , b
here, τ j represents standard deviation and x ˜ j represents the average.
The correlation coefficient matrix of the variables can be calculated by the standardized data matrix according to
r i j = m = 1 a x m i x i ¯ x m j x j ¯ m = 1 a x m i x i ¯ 2 m = 1 a x m j x j ¯ 2
The standardized correlation coefficient matrix can be expressed as
R i j = r i j b × b
Secondly, the characteristic roots λj (λ1, λ2, , λj), and the corresponding feature vector l ( l 1 , l 2 , , l j ) of R i j can be obtained.
Thirdly, the principal component can be expressed as
Z i = X l i = j = 1 b l i j x j   i = 1 , 2 , b
Calculate the contribution ratio of each principal component (PC) separately:
P n = λ n / k = 1 b λ k   ( n = 1 , 2 , , b )
Calculate the cumulative contribution rate of the first n PCs:
i = 1 n λ i / i = 1 b λ i   ( n = 1 , 2 , , b )
The contribution rate of principal components will decrease in turn, so the top n (nb) data with the highest contribution rate and cumulative contribution rate of more than 85% will be selected.

3.2. Extreme Learning Machine

Extreme learning machine (ELM) is a new type of feedforward network. Compared with conventional back-propagation (BP) neural network, ELM has the advantage of the faster training rate and stronger generalization ability. The principle of the algorithm are as follows [43,44].
Suppose that there are n training samples with input vector x i and output vector t i , where x i = x i 1 , x i 2 , , x i k T and t i = t i 1 , t i 2 , , t i j T , i = 1 , 2 , , n . When there are m hidden layers, the weight connecting the input layers to hidden layers, and the weight connecting hidden layers to output layers, can be expressed as follows:
w = w 1 w 2 w l = w 11 w 12 w 1 k w 21 w 22 w 2 k w l 1 w l 2 w l k
β = β 1 j , β 2 j , , β m j T
Here, l = 1 , 2 , , m . The ELM regression model can be expressed as follows:
D β = C
D = f w 1 x 1 + b 1 f w 2 x 1 + b 2 f w m x 1 + b m f w 1 x 2 + b 1 f w 2 x 2 + b 2 f w m x 2 + b m f w 1 x n + b 1 f w 2 x n + b 2 f w m x n + b m n × m
Herein, D represents the output matrix of the hidden layer of the modeling; C is the output vector; b m is the hidden layer threshold; and f x is the activation function. So, the output weights β can be calculated according to β ^ = D + C , where D + is Moore–Penrose generalized inverse of the matrix D . The β solved based on Moore–Penrose is one of the least-square solutions of the general linear system D β = C ; thus, the ELM model will not fall into local minimum such as gradient descent algorithm. However, ELM model also has some disadvantages, for example, the input weights and the thresholds of the model are generated randomly, which leads to the lack of adjustment ability of hidden layer neurons. Therefore, genetic algorithm (GA) is selected to find the best weights and thresholds of the model. GA is a method to search the optimal result by imitating the process of chromosome gene crossover and mutation in the process of biological evolution [45,46,47]. The ELM model optimized by GA has both the global optimization ability of GA and the powerful learning capacity of ELM. Therefore, GA–ELM has high accuracy and stability. The flow chart and specific working steps of the algorithm are shown in Figure 4 [48,49]:
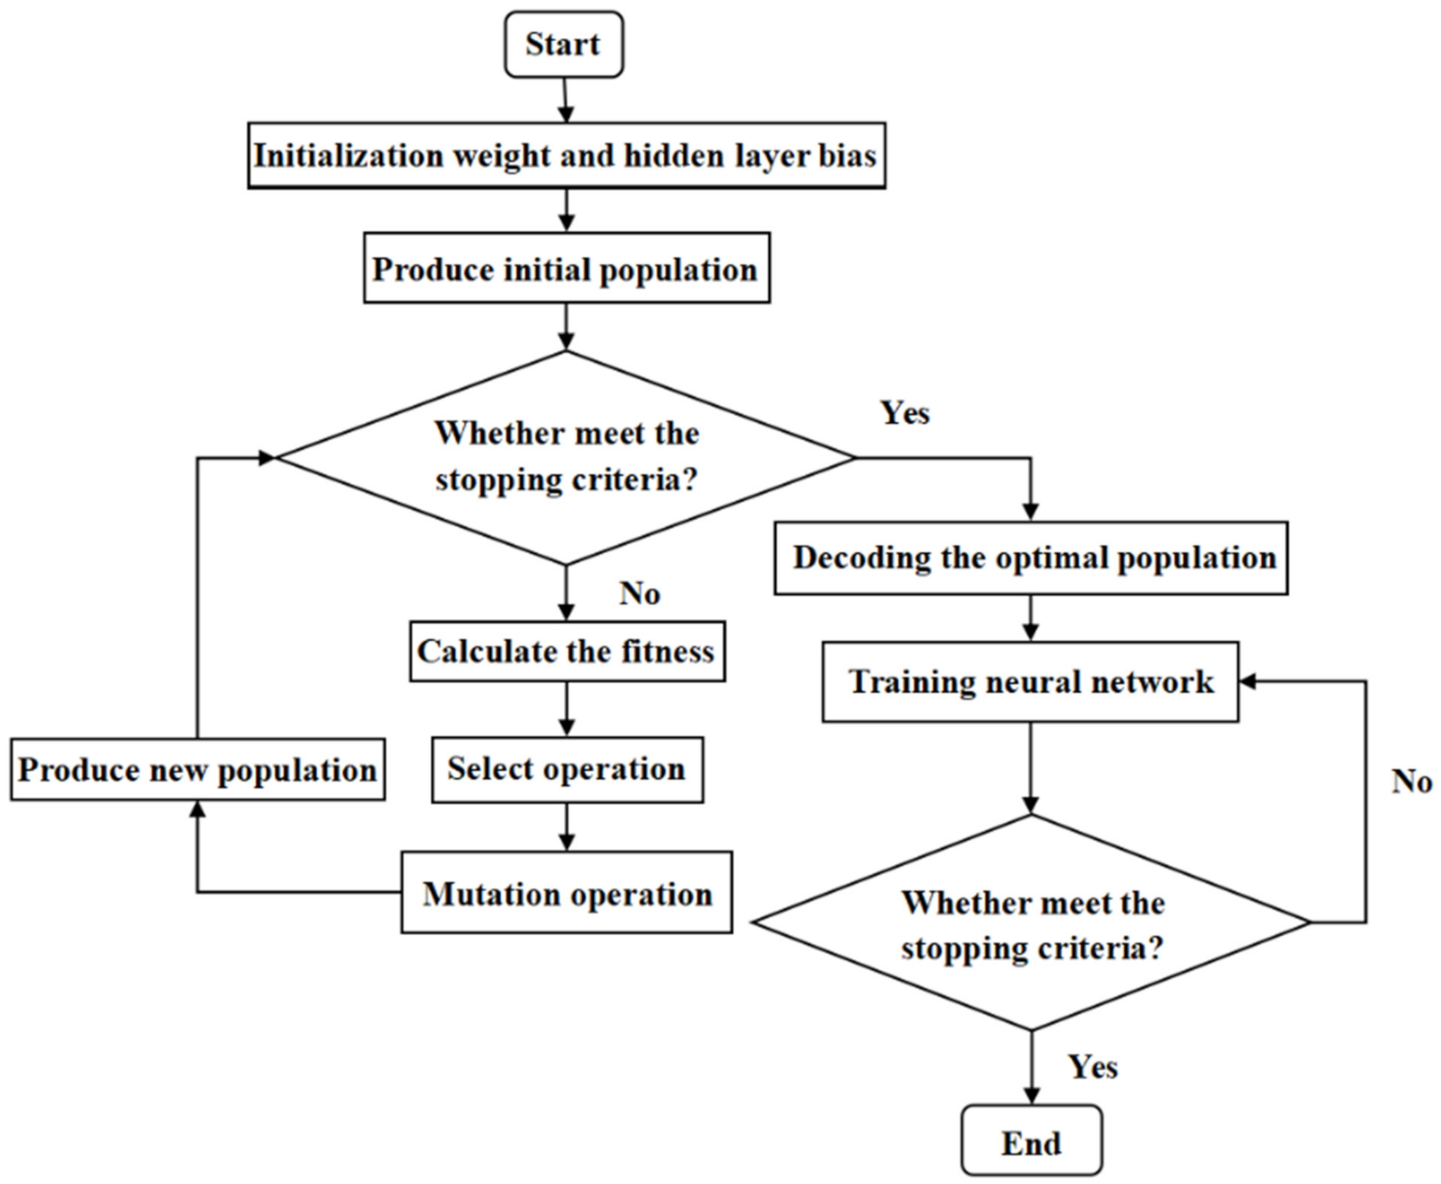
  • Parameter setting. Set the number of neurons of ELM model according to the dimension of input and output data, generate a batch of weights and thresholds randomly; set the maximum evolutionary iterations G, the population size, the crossover probability, the mutation probability, and the generation gap of GA and generate the initial population; and use D to represent the length of individual, where D = n + 1 L , n represents the input vector dimension and L represents the number of hidden layer nodes.
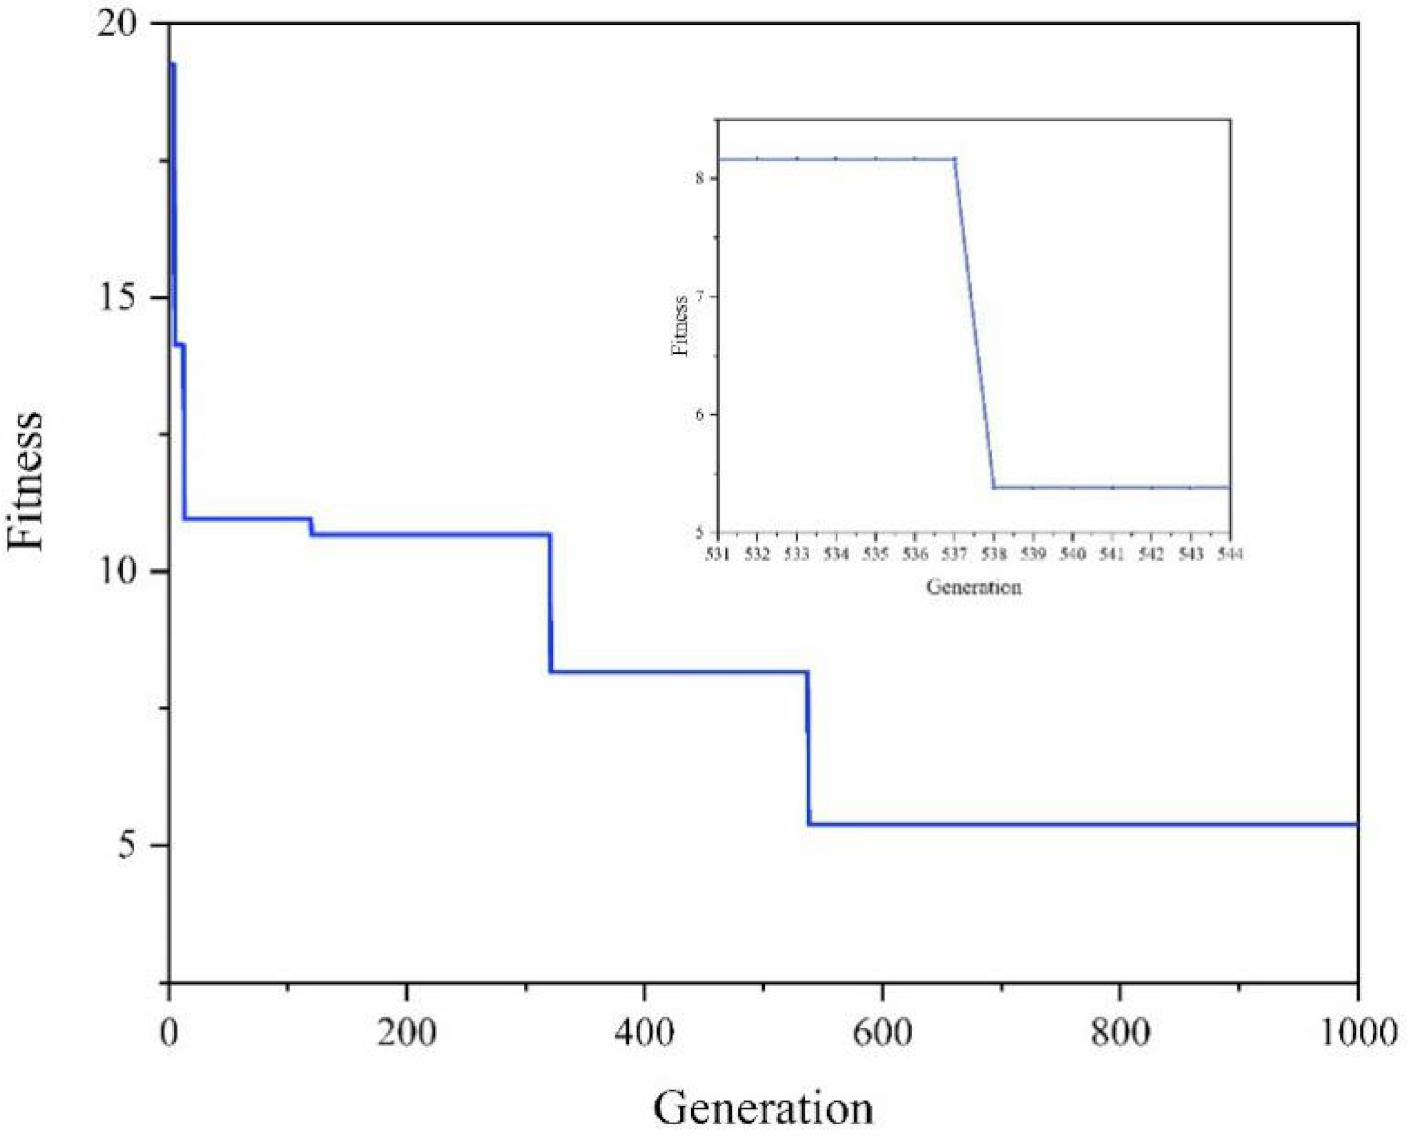
  • Calculate the fitness of the population. The root mean square error between the actual output and the expected output is used to measure the merit degree. In each generation of the population, the chromosomes will continue to crossover and mutate to form new populations until restraint conditions are met or the maximum number of iterations is met.
  • ELM model training, prediction, and verification. Decode the optimal population and get the input weights and thresholds. Train the ELM model and then use the test samples to verify the accuracy of the prediction.
In this study, parameter settings of the GA–ELM model are shown in Table 2. To avoid over fitting, K-fold cross-validation is also applied to verify the accuracy and robustness of the PCA–GA–ELM model. According to the number of samples in this study, all the data were divided into eight folds, with each fold having 10 data. Among them, seven folds were for training and one fold was for verification. Each subset was used as a verification set for verification once, taking the average accuracy as the overall prediction accuracy of the PCA–GA–ELM model after eight verifications [50,51,52].

4. Result and Discussion

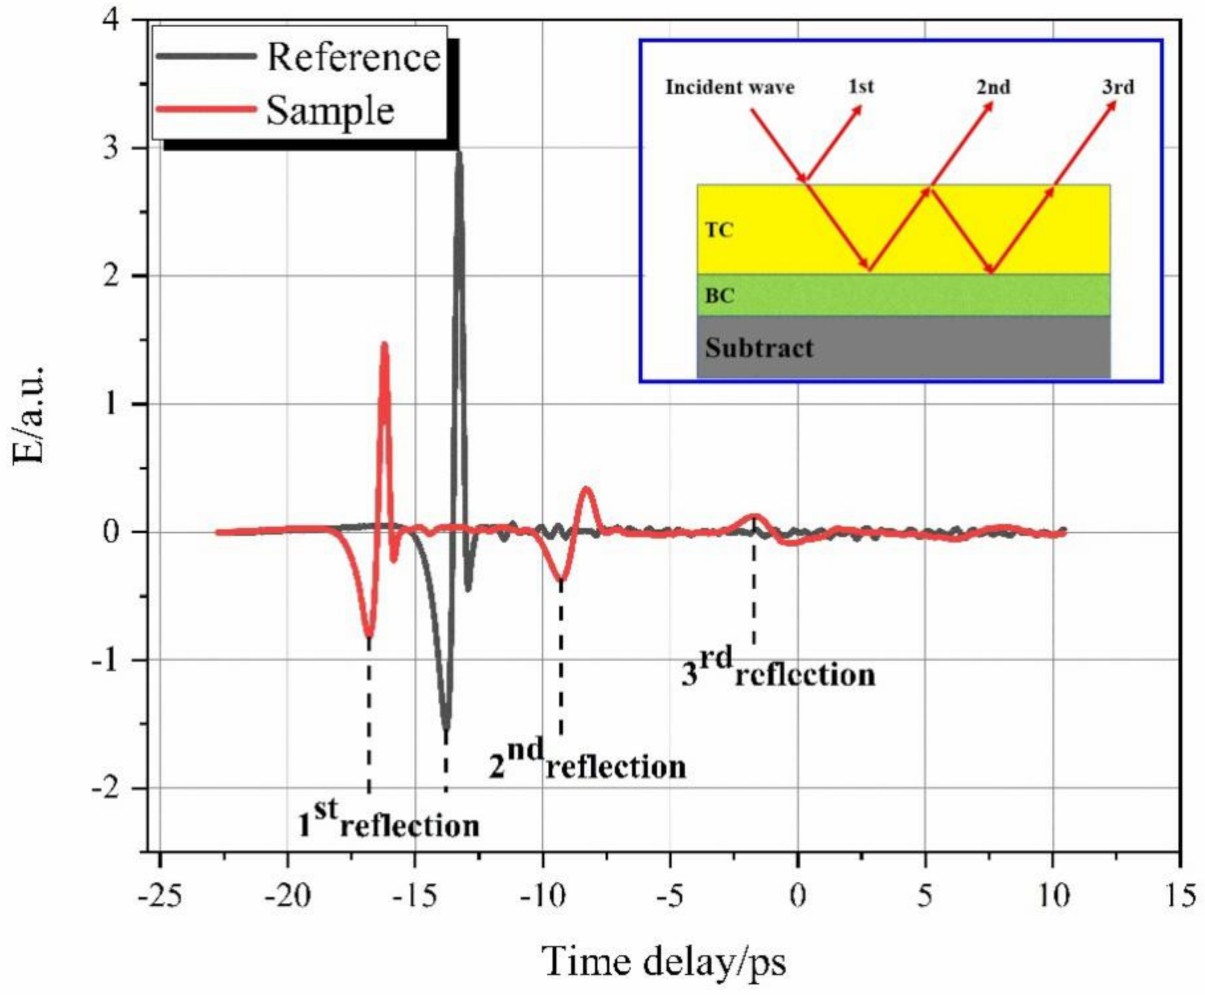
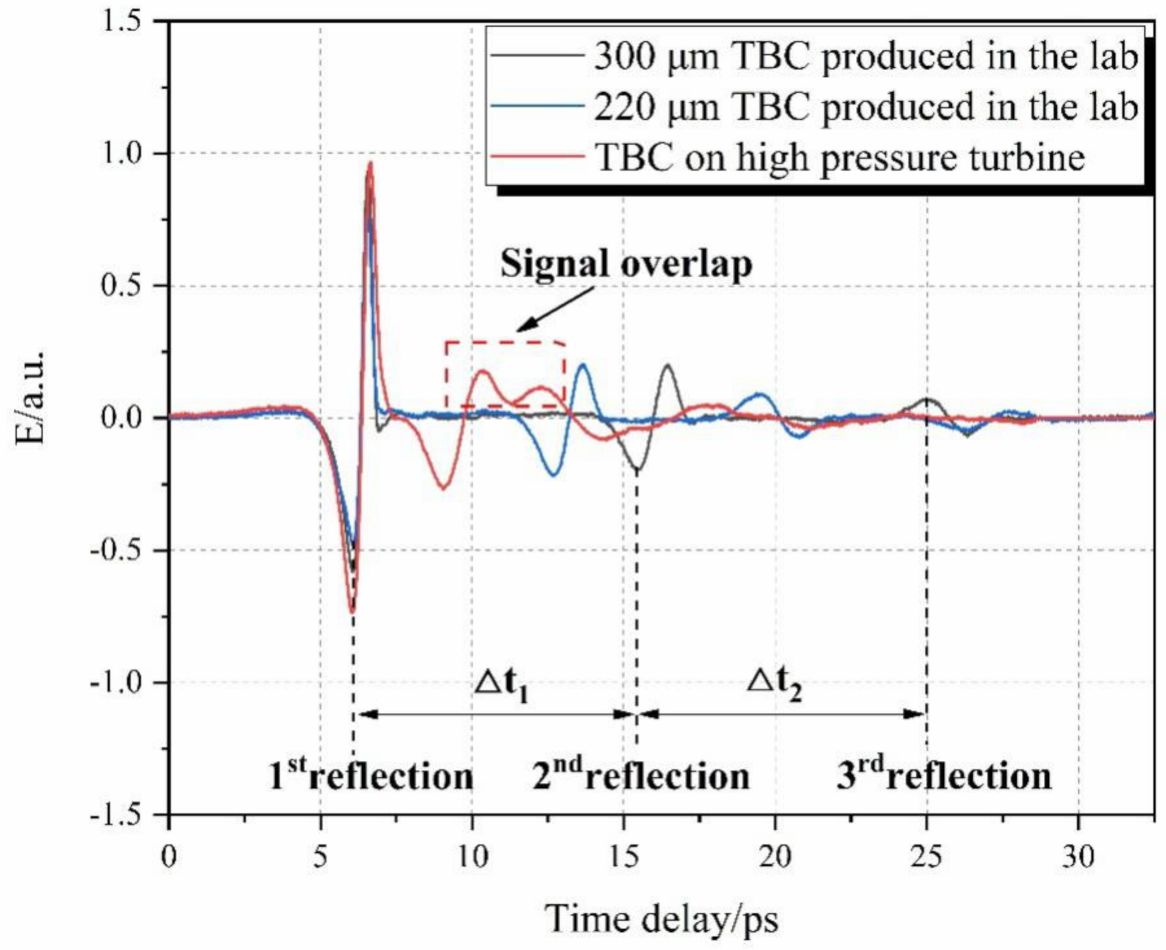
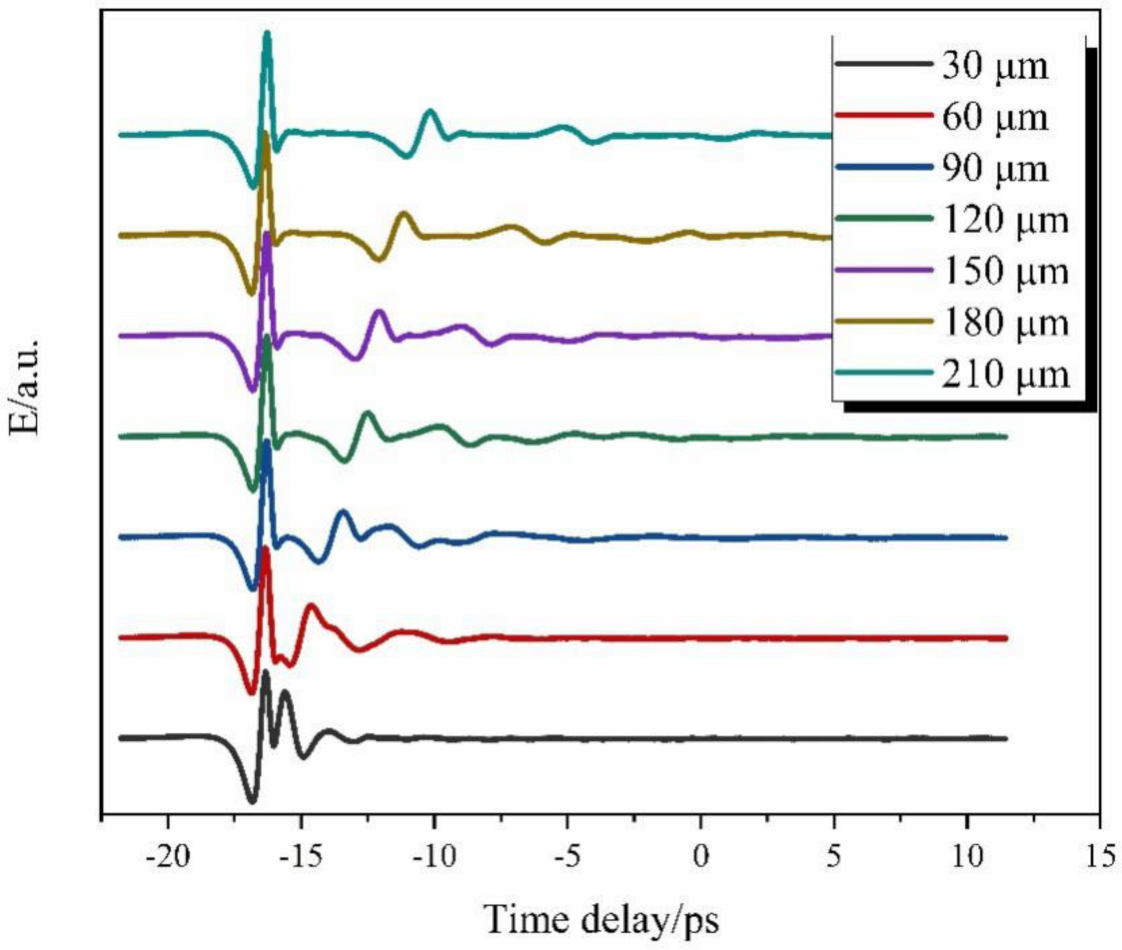
4.1. THz Signals and Thickness of TBCs

Figure 5 shows the terahertz time-domain signals of different TC thicknesses. The time interval ( Δ t ) decreases with the decrease of coating thickness. Due to the change of phase caused by multiple reflections, the second and third reflection peaks overlap with the thinning of thickness. The smaller the thickness of the coating, the more serious the signals overlap. When the thickness continues to decrease, the first and second reflection peaks also overlap. Therefore, the method of calculating thickness by separating reflection peaks fails. We propose PCA–GA–ELM model to predict the TC thickness.
Figure 6a,b shows the SEM morphology of the TBCs with different TC thicknesses. Through the SEM, we can accurately obtain the real thickness of the coating, which can be used to train and verify the model. Because the coating is not completely uniform, we can obtain different THz thickness signals at different positions of an engine blade. Therefore, these terahertz signals containing coating thickness information can be used to characterize the thickness of YSZ ceramic layer, to obtain the model input.

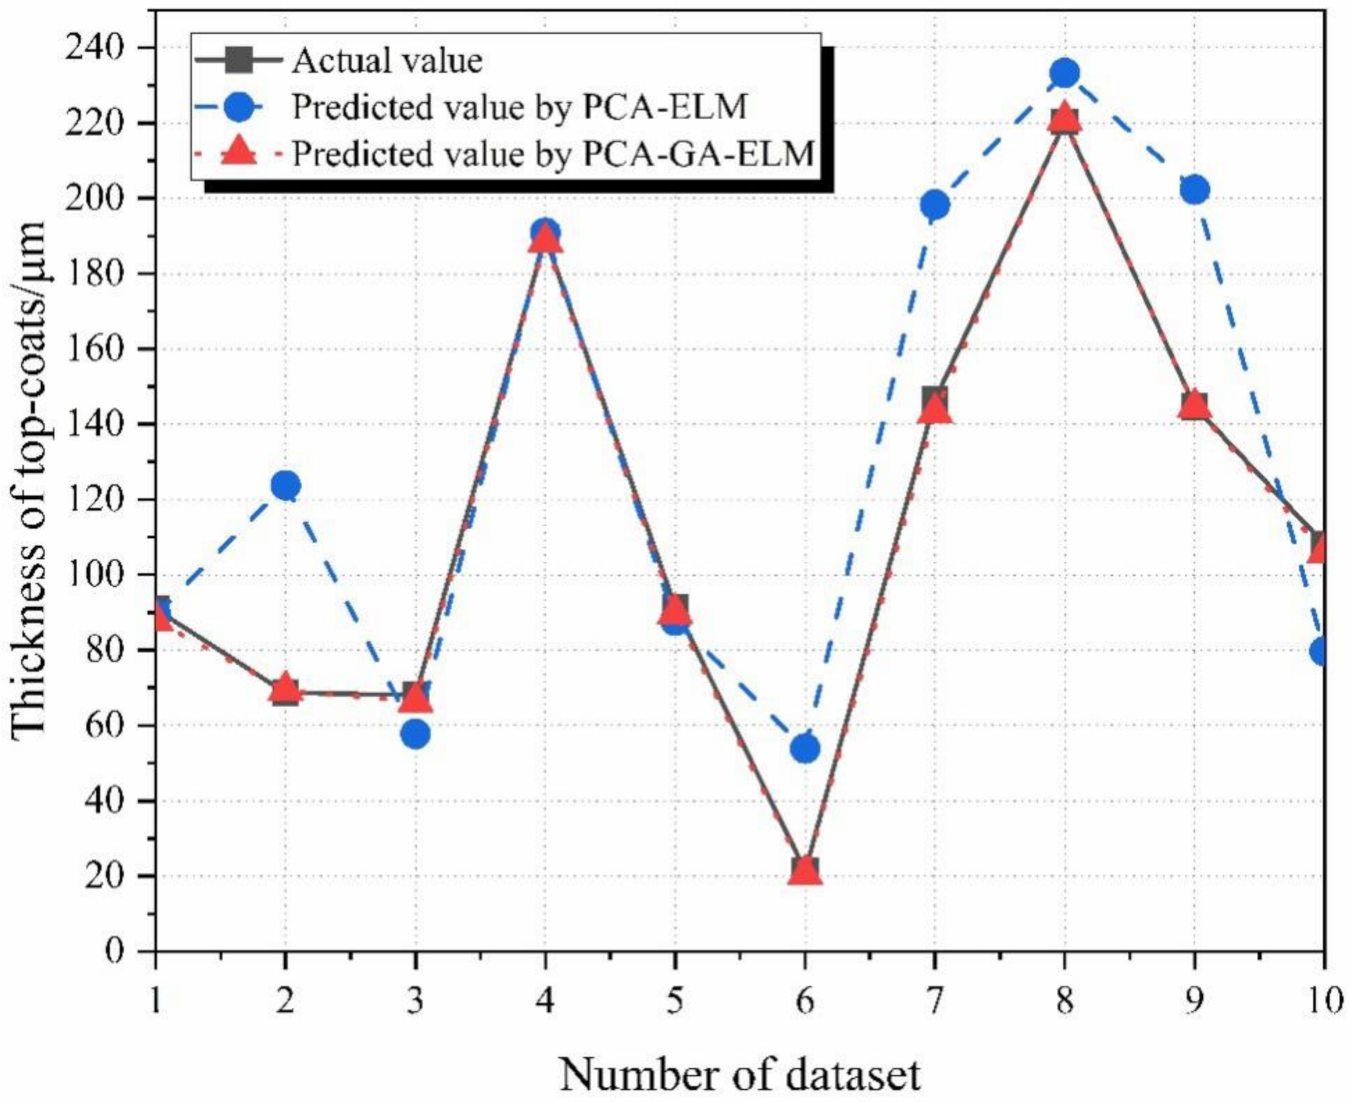
4.2. Comparison of the Prediction Performance

In this study, to avoid over fitting caused by too little data, we tested the terahertz data of 80 TBCs with different thicknesses, of which 70 were from the laboratory and 10 were from actual blades. In order to decrease the dimension of terahertz signals and redundant data, principal component analysis method was used to decrease the size of original data. As show in Figure 7, the contribution rate of each principal component decreases gradually. By accumulating the contribution rate, we can know that the first 28 data can reach the cumulative contribution rate of 99.9%, therefore, these data are picked as the input parameters of the model. Eventually, the size of the original data was reduced from 80 × 4096 to 80 × 28.
The ELM and GA–ELM model were trained by selecting 70 random data from the time-domain data after dimensionally reduction. As shown in Figure 8, the fitness evolution curves indicate that when the models evolved to 538 generations, the training error reached to the smallest values and fulfilled the requirement.
The remaining ten samples were used to compare and verify the prediction accuracy of the models. In Figure 9, the blue, red, and black marks indicate the ELM predicted, GA–ELM predicted, and actual values of the TC thickness of TBCs, respectively. The predicted and actual values are recorded in Table 3. The weights and thresholds of PCA–ELM model are randomly generated, so its prediction results are not optimal. The prediction results of the PCA–GA–ELM optimized by genetic algorithm are more accurate and more reliable than PCA–ELM.
To further test and compare the accuracy and robustness of the models, the prediction results of 8-fold CV were compared. As can be seem from Table 4, the prediction error of PCA–GA–ELM works well, where the value of R2 has reached over 0.98, which is greater than PCA–ELM model; the values of other error performance indicators (RMSE, MAPE) of PCA–GA–ELM were kept low (≤2.57), while the various errors of the PCA–ELM model were relatively large (≥15.01). All these indicated that the PCA–GA–ELM model can accurately predict the thickness of TBCs. Therefore, the hybrid PAC–GA–ELM model could meet the evaluation requirements of different coatings thickness. In this study, we discussed the single-layer structural ceramic layer. With the gradual complexity of coating structure and materials, different samples are needed to train the model. In our next research, we will discuss multi-layer coatings and coatings of other materials, as well as coatings with different applications.

5. Conclusions

In this study, a hybrid machine learning algorithm based on terahertz time domain spectroscopy was proposed to predict the thickness of TC layer of thermal barrier coatings. Firstly, the research showed that with the thinning of the coating, the terahertz signals would overlap. The degree of signal overlap is related to the coating thickness. Therefore, a hybrid machine learning model was proposed because the reflection peak cannot be extracted separately and completely. Secondly, the terahertz signals of 80 TBCs with different thicknesses were used to train the model. To improve training speed, the principal component analysis approach was used to decrease the original signals dimension form 80 × 4096 to 80 × 28 since these 28 PCs contribute 99.9% of the information of the original signal. Thirdly, three indications R2, MAPE, and RMSE, were used to evaluate the predict results of the models, and 8-fold cross validation was also used to detect the accuracy and robustness of the models. The results indicate that the optimized PCA–GA–ELM model has higher R2 (>0.98) and lower error values (≤2.57) than PCA–ELM model and the PCA–GA–ELM model, showing excellent accuracy and dependability in predicting the thickness of TC layer of TBCs. Therefore, the PCA–GA–ELM model could meet the accuracy requirements in actual testing.

Author Contributions

Conceptualization, B.Y., W.W. and D.Y.; Data curation, B.Y., Z.Z., H.F., T.Y., Y.W. and S.Z.; Formal analysis, B.Y.; Funding acquisition, W.W.; Methodology, B.Y., W.W. and D.Y.; Software, B.Y. and D.Y.; Supervision, W.W.; Validation, B.Y., W.W. and D.Y.; Visualization, B.Y.; Writing–original draft, B.Y. All authors have read and agreed to the published version of the manuscript.

Funding

This research was funded by the National Natural Science Foundation of China (Grant No. 52175136), Science Center for Gas Turbine Project (P2021-A-IV-002-002), and Shanghai Joint Innovation Program in the Field of Commercial Aviation Engines.

Institutional Review Board Statement

Not applicable.

Informed Consent Statement

Not applicable.

Conflicts of Interest

The authors declare no conflict of interest.

References

  1. Padture, N.P.; Gell, M.; Jordan, E.H. Materials science—Thermal barrier coatings for gas-turbine engine applications. Science 2002, 296, 280–284. [Google Scholar] [CrossRef] [PubMed]
  2. Sampath, S.; Schulz, U.; Jarligo, M.O.; Kuroda, S. Processing science of advanced thermal-barrier systems. Mrs Bull. 2012, 37, 903–910. [Google Scholar] [CrossRef]
  3. Padture, N.P. Advanced structural ceramics in aerospace propulsion. Nat. Mater. 2016, 15, 804–809. [Google Scholar] [CrossRef] [PubMed]
  4. Evans, A.G.; Mumm, D.R.; Hutchinson, J.W.; Meier, G.H.; Pettit, F.S. Mechanisms controlling the durability of thermal barrier coatings. Prog. Mater. Sci. 2001, 46, 505–553. [Google Scholar] [CrossRef]
  5. Daroonparvar, M.; Yajid, M.A.M.; Yusof, N.M.; Hussain, M.S. Improved Thermally Grown Oxide Scale in Air Plasma Sprayed NiCrAlY/Nano-YSZ Coatings. J. Nanomater. 2013, 2013. [Google Scholar] [CrossRef] [Green Version]
  6. Chen, W.R.; Wu, X.; Marple, B.R.; Patnaik, P.C. Oxidation and crack nucleation/growth in an air-plasma-sprayed thermal barrier coating with NiCrAlY bond coat. Surf. Coat. Technol. 2005, 197, 109–115. [Google Scholar] [CrossRef] [Green Version]
  7. Zulkifli, I.S.M.; Yajid, M.A.M.; Idris, M.H.; Uday, M.B.; Daroonparvar, M.; Emadzadeh, A.; Arshad, A. Microstructural evaluation and thermal oxidation behaviors of YSZ/NiCoCrAlYTa coatings deposited by different thermal techniques. Ceram. Int. 2020, 46, 22438–22451. [Google Scholar] [CrossRef]
  8. Giolli, C.; Scrivani, A.; Rizzi, G.; Borgioli, F.; Bolelli, G.; Lusvarghi, L. Failure Mechanism for Thermal Fatigue of Thermal Barrier Coating Systems. J. Therm. Spray Technol. 2009, 18, 223–230. [Google Scholar] [CrossRef]
  9. Kumar, V.; Balasubramanian, K. Progress update on failure mechanisms of advanced thermal barrier coatings: A review. Progress in Organic Coatings 2016, 90, 54–82. [Google Scholar] [CrossRef]
  10. Lee, D.H.; Jang, B.; Kim, C.; Lee, K.S. Effect of coating thickness on contact fatigue and wear behavior of thermal barrier coatings. J. Ceram. Process. Res. 2019, 20, 499–504. [Google Scholar] [CrossRef]
  11. Lv, J.; Fan, X.; Li, Q. The impact of the growth of thermally grown oxide layer on the propagation of surface cracks within thermal barrier coatings. Surf. Coat. Technol. 2017, 309, 1033–1044. [Google Scholar] [CrossRef]
  12. Li, Y.; Chen, Z.; Mao, Y.; Qi, Y. Quantitative evaluation of thermal barrier coating based on eddy current technique. NDT E Int. 2012, 50, 29–35. [Google Scholar] [CrossRef]
  13. Ma, Z.; Zhao, Y.; Luo, Z.; Lin, L. Ultrasonic characterization of thermally grown oxide in thermal barrier coating by reflection coefficient amplitude spectrum. Ultrasonics 2014, 54, 1005–1009. [Google Scholar] [CrossRef]
  14. Newaz, G.; Chen, X.Q. Progressive damage assessment in thermal barrier coatings using thermal wave imaging technique. Surf. Coat. Technol. 2005, 190, 7–14. [Google Scholar] [CrossRef]
  15. Queralt, I.; Ibañez, J.; Marguí, E.; Pujol, J. Thickness measurement of semiconductor thin films by energy dispersive X-ray fluorescence benchtop instrumentation: Application to GaN epilayers grown by molecular beam epitaxy. Spectrochim. Acta Part B At. Spectrosc. 2010, 65, 583–586. [Google Scholar] [CrossRef]
  16. Avdelidis, N.P.; Hawtin, B.C.; Almond, D.P. Transient thermography in the assessment of defects of aircraft composites. NDT E Int. 2003, 36, 433–439. [Google Scholar] [CrossRef]
  17. Hung, Y.Y.; Chen, Y.S.; Ng, S.P.; Liu, L.; Huang, Y.H.; Luk, B.L.; Ip, R.W.L.; Wu, C.M.L.; Chung, P.S. Review and comparison of shearography and active thermography for nondestructive evaluation. Mater. Sci. Eng. R-Rep. 2009, 64, 73–112. [Google Scholar] [CrossRef] [Green Version]
  18. Park, S.-H.; Jang, J.-W.; Kim, H.-S. Non-destructive evaluation of the hidden voids in integrated circuit packages using terahertz time-domain spectroscopy. J. Micromech. Microeng. 2015, 25. [Google Scholar] [CrossRef]
  19. Ryu, C.-H.; Park, S.-H.; Kim, D.-H.; Jhang, K.-Y.; Kim, H.-S. Nondestructive evaluation of hidden multi-delamination in a glass-fiber-reinforced plastic composite using terahertz spectroscopy. Compos. Struct. 2016, 156, 338–347. [Google Scholar] [CrossRef]
  20. Moradi, A.; Lindsjo, M.; Stake, J.; Folestad, S.; Rodilla, H. Non-Destructive Characterization of Pharmaceutical Tablets Using Terahertz Frequency Domain Spectroscopy. In Proceedings of the 44th International Conference on Infrared, Millimeter, and Terahertz Waves (IRMMW-THz), Paris, France, 1–6 September 2019. [Google Scholar]
  21. Balbekin, N.S.; Novoselov, E.V.; Pavlov, P.V.; Bespalov, V.G.; Petrov, N.V. Nondestructive monitoring of aircraft composites using terahertz radiation. In Proceedings of the 2nd International Symposium on Optics and Biophotonics/Saratov Fall Meeting (SFM), Saratov, Russia, 23–26 September 2014. [Google Scholar]
  22. Stoik, C.D.; Bohn, M.J.; Blackshire, J.L. Nondestructive evaluation of aircraft composites using transmissive terahertz time domain spectroscopy. Opt. Express 2008, 16, 17039–17051. [Google Scholar] [CrossRef]
  23. Baranova, A.; Lykina, A.; Antonova, D.; Smolyanskaya, O. Optical Properties of Crystalline Lactose Fluidized with Dilutions of Various Substances in the Terahertz Frequency Range. Pharmaceutics 2022, 14, 32. [Google Scholar] [CrossRef] [PubMed]
  24. Lykina, A.A.; Nazarov, M.M.; Konnikova, M.R.; Mustafin, I.A.; Vaks, V.L.; Anfertev, V.A.; Domracheva, E.G.; Chernyaeva, M.B.; Kistenev, Y.V.; Vrazhnov, D.A.; et al. Terahertz spectroscopy of diabetic and non-diabetic human blood plasma pellets. J. Biomed. Opt. 2021, 26. [Google Scholar] [CrossRef] [PubMed]
  25. Smolyanskaya, O.A.; Schelkanova, I.J.; Kulya, M.S.; Odlyanitskiy, E.L.; Goryachev, I.S.; Tcypkin, A.N.; Grachev, Y.V.; Toropova, Y.G.; Tuchin, V.V. Glycerol dehydration of native and diabetic animal tissues studied by THz-TDS and NMR methods. Biomed. Opt. Express 2018, 9, 1198–1215. [Google Scholar] [CrossRef] [Green Version]
  26. Zhong, S. Progress in terahertz nondestructive testing: A review. Front. Mech. Eng. 2019, 14, 273–281. [Google Scholar] [CrossRef]
  27. Fukuchi, T.; Fuse, N.; Okada, M.; Fujii, T.; Mizuno, M.; Fukunaga, K. Measurement of Refractive Index and Thickness of Topcoat of Thermal Barrier Coating by Reflection Measurement of Terahertz Waves. Electron. Commun. Jpn. 2013, 96, 37–45. [Google Scholar] [CrossRef]
  28. Fukuchi, T.; Fuse, N.; Okada, M.; Ozeki, T.; Fujii, T.; Mizuno, M.; Fukunaga, K. Topcoat Thickness Measurement of Thermal Barrier Coating of Gas Turbine Blade Using Terahertz Wave. Electr. Eng. Jpn. 2014, 189, 1–8. [Google Scholar] [CrossRef]
  29. White, J.; Fichter, G.; Chernovsky, A.; Whitaker, J.F.; Das, D.; Pollock, T.M.; Zimdars, D. Time domain terahertz non-destructive evaluation of aeroturbine blade thermal barrier coatings. In Proceedings of the 35th Annual Review of Progress in Quantitative Nondestructive Evaluation, Chicago, IL, USA, 20–25 July 2009; p. 434. [Google Scholar]
  30. Chen, C.C.; Lee, D.J.; Pollock, T.; Whitaker, J.F. Pulsed-terahertz reflectometry for health monitoring of ceramic thermal barrier coatings. Opt. Express 2010, 18, 3477–3486. [Google Scholar] [CrossRef] [PubMed]
  31. Luo, M.; Zhong, S.; Yao, L.; Tu, W.; Nsengiyumva, W.; Chen, W. Thin thermally grown oxide thickness detection in thermal barrier coatings based on SWT-BP neural network algorithm and terahertz technology. Appl. Opt. 2020, 59, 4097–4104. [Google Scholar] [CrossRef]
  32. Ye, D.; Wang, W.; Zhou, H.; Fang, H.; Huang, J.; Li, Y.; Gong, H.; Li, Z. Characterization of thermal barrier coatings microstructural features using terahertz spectroscopy. Surf. Coat. Technol. 2020, 394, 125836. [Google Scholar] [CrossRef]
  33. Dongdong, Y.; Weize, W.; Haiting, Z.; Jibo, H.; Wenchao, W.; Hanhong, G.; Zhen, L. In-situ evaluation of porosity in thermal barrier coatings based on the broadening of terahertz time-domain pulses: Simulation and experimental investigations. Opt. Express 2019, 27, 28150–28165. [Google Scholar] [CrossRef]
  34. Dongdong, Y.; Weize, W.; Changdong, Y.; Zhou, X.; Huanjie, F.; Jibo, H.; Yuanjun, L. Nondestructive Evaluation of Thermal Barrier Coatings Interface Delamination Using Terahertz Technique Combined with SWT-PCA-GA-BP Algorithm. Coatings 2020, 10, 859. [Google Scholar] [CrossRef]
  35. Ye, D.; Wang, W.; Huang, J.; Lu, X.; Zhou, H. Nondestructive Interface Morphology Characterization of Thermal Barrier Coatings Using Terahertz Time-Domain Spectroscopy. Coatings 2019, 9, 89. [Google Scholar] [CrossRef] [Green Version]
  36. van Mechelen, J.L.M.; Kuzmenko, A.B.; Merbold, H. Stratified dispersive model for material characterization using terahertz time-domain spectroscopy. Opt. Lett. 2014, 39, 3853–3856. [Google Scholar] [CrossRef] [PubMed] [Green Version]
  37. Krimi, S.; Klier, J.; Ellrich, F.; Jonuscheit, J.; Urbansky, R.; Beigang, R.; von Freymann, G. An evolutionary algorithm based approach to improve the limits of minimum thickness measurements of multilayered automotive paints. In Proceedings of the 2015 40th International Conference on Infrared, Millimeter, and Terahertz waves (IRMMW-THz), Hong Kong, China, 23–28 August 2015; p. 1. [Google Scholar]
  38. Ge, H.; Jiang, Y.; Xu, Z.; Lian, F.; Zhang, Y.; Xia, S. Identification of wheat quality using THz spectrum. Opt. Express 2014, 22, 12533–12544. [Google Scholar] [CrossRef]
  39. Peng, Y.; Shi, C.; Xu, M.; Kou, T.; Wu, X.; Song, B.; Ma, H.; Guo, S.; Liu, L.; Zhu, Y. Qualitative and Quantitative Identification of Components in Mixture by Terahertz Spectroscopy. IEEE Trans. Terahertz Sci. Technol. 2018, 8, 696–701. [Google Scholar] [CrossRef]
  40. Ye, D.D.; Wang, W.Z.; Yin, C.D.; Xu, Z.; Zhou, H.T.; Fang, H.J.; Li, Y.J.; Huang, J.B. Pulsed terahertz spectroscopy combined with hybrid machine learning approaches for structural health monitoring of multilayer thermal barrier coatings. Opt. Express 2020, 28, 34875–34893. [Google Scholar] [CrossRef] [PubMed]
  41. Katrin, S.; Philippe, C.C.; Reinald, B.; Bert, M.; Cora, H.; Jacqueline, R. Automatic selection of a representative trial from multiple measurements using Principle Component Analysis. J. Biomech. 2012, 45, 2306–2309. [Google Scholar] [CrossRef]
  42. Cardot, H.; Degras, D. Online Principal Component Analysis in High Dimension: Which Algorithm to Choose? Int. Stat. Rev. 2018, 86, 29–50. [Google Scholar] [CrossRef] [Green Version]
  43. Castano, A.; Fernandez-Navarro, F.; Hervas-Martinez, C. PCA-ELM: A Robust and Pruned Extreme Learning Machine Approach Based on Principal Component Analysis. Neural Process. Lett. 2013, 37, 377–392. [Google Scholar] [CrossRef]
  44. Figueiredo, E.M.N.; Ludermir, T.B. Investigating the use of alternative topologies on performance of the PSO-ELM. Neurocomputing 2014, 127, 4–12. [Google Scholar] [CrossRef]
  45. Gokul, S.K.; Sowmya, K.S. A novel GA-ELM model for patient-specific mortality prediction over large-scale lab event data. Appl. Soft Comput. J. 2019, 80, 525–533. [Google Scholar] [CrossRef]
  46. Mei, Y.; Sun, Q.; Yu, L.; Wang, C.; Xiao, H. Grain Size Prediction of Aluminum Alloy Dies Castings Based on GA-ELM. Jinshu Xuebao/Acta Metall. Sin. 2017, 53, 1125–1132. [Google Scholar] [CrossRef]
  47. Bouktif, S.; Fiaz, A.; Ouni, A.; Serhani, M.A. Optimal Deep Learning LSTM Model for Electric Load Forecasting using Feature Selection and Genetic Algorithm: Comparison with Machine Learning Approaches. Energies 2018, 11, 1636. [Google Scholar] [CrossRef] [Green Version]
  48. Mehta, R.; Rajpal, N.; Vishwakarma, V.P. Adaptive Image Watermarking Scheme Using Fuzzy Entropy and GA-ELM Hybridization in DCT Domain for Copyright Protection. J. Signal Process. Syst. 2016, 84, 265–281. [Google Scholar] [CrossRef]
  49. Cao, Z.; Xia, J.; Zhang, M.; Jin, J.; Deng, L.; Wang, X.; Qu, J. Optimization of gear blank preforms based on a new R-GPLVM model utilizing GA-ELM. Knowl. Based Syst. 2015, 83, 66–80. [Google Scholar] [CrossRef]
  50. Rodriguez, J.D.; Perez, A.; Lozano, J.A. Sensitivity analysis of k-fold cross validation in prediction error estimation. IEEE Trans. Pattern Anal. Mach. Intell. 2009, 32, 569–575. [Google Scholar] [CrossRef]
  51. Fushiki, T. Estimation of prediction error by using K-fold cross-validation. Stat. Comput. 2011, 21, 137–146. [Google Scholar] [CrossRef]
  52. An, S.; Liu, W.; Venkatesh, S. Fast cross-validation algorithms for least squares support vector machine and kernel ridge regression. Pattern Recognit. 2007, 40, 2154–2162. [Google Scholar] [CrossRef]
Figure 1. Schematic diagram of reflective terahertz TDS system module and optical path.
Coatings 12 00390 g001
Figure 2. Schematic diagram of terahertz wave reflection when measuring TBCs.
Coatings 12 00390 g002
Figure 3. Overlapping terahertz time domain spectral signals.
Coatings 12 00390 g003
Figure 4. Algorithm flow chart of GA–ELM model.
Coatings 12 00390 g004
Figure 5. Terahertz signals of TBCs with different TC thicknesses.
Coatings 12 00390 g005
Figure 6. SEM morphology of different top coat thickness: (a) TBC on high pressure turbine; (b) TBC produced in the lab.
Coatings 12 00390 g006
Figure 7. Contribution proportion of each principal component and their cumulative sum.
Coatings 12 00390 g007
Figure 8. Relationship curve between fitness and evolution generation.
Coatings 12 00390 g008
Figure 9. The prediction results of TC thickness of the ELM and GA–ELM model.
Coatings 12 00390 g009
Table 1. Process parameters of TBC preparation.
ParametersYSZ LayerBond Coat
Current, A600550
Power, kW41.636.0
Argon flow rate, slpm4050
Hydrogen flow rate, slpm97
Spray distance, mm100120
Moving speed of spray gun, mm/s500900
Powder feeding rate, %2010
Table 2. Parameter settings of the GA–ELM model.
ParameterValue
Hidden layer neurons40
Maximum genetic generation number1000
Crossover probability0.7
Mutation probability0.01
Generation gap0.95
Table 3. The actual value of SEM observation of TC layer and the predicted value of the two models.
No.Actual Value (μm)Predicted Value by PCA–ELM (μm)Predicted Value by PCA–GA–ELM (μm)
190.989.487.8
268.7123.869.3
368.157.866.4
4189.5190.9188.4
591.587.989.8
621.453.920.4
7146.5198.3143.1
8220.2233.3220.9
9144.7202.3144.5
10108.179.7105.9
Table 4. Prediction error of the PCA–ELM and PCA–GA–ELM models.
Prediction ResultsR2RMSEMAPE
PCA–ELM0.607615.00800.0957
PCA–GA–ELM0.98712.56730.0205
Publisher’s Note: MDPI stays neutral with regard to jurisdictional claims in published maps and institutional affiliations.

