1. Introduction
An emulsion can be defined as a system consisting of two immiscible liquids, in which one of the liquids is dispersed as small spherical droplets in the other liquid [
1]. The size and distribution of droplets depend upon the energy input and temperature during homogenization, the characteristics and ratios of the two phases (dispersed and continuous), and the type and concentration of the emulsifier [
2]. It is well known that the size and distribution of droplets have a great impact on emulsion stability, optical properties, rheology, and sensorial characteristics [
1]. The distribution of droplets in emulsion systems can be monodispersed or polydispersed. If all droplets in an emulsion are the same size, the emulsion is referred to as “monodisperse” and can be characterized by the size of a single droplet (the radius or diameter of the droplet). However, the vast majority of emulsions, such as food emulsions, are polydisperse systems containing droplets with a range of different sizes. Therefore, they should be characterized by the particle or droplet size distribution, which represents the concentration of droplets in different size classes [
1]. The droplet size distribution of an emulsion is one of the important factors that control aggregation, coalescence, and resistance to sedimentation or creaming. The size distribution can also be used as a representative of stability if measured as a function of time. It is well known that the smaller and more uniform the droplets, the more stable the emulsions, provided that all other conditions are the same [
3]. Therefore, determining the size distribution of the droplets in the continuous phase in a precise and accurate manner is essential for studies in emulsion science.
In the literature, considerable work has been carried out for the development of analytical techniques to obtain information about the droplet size distribution, such as light scattering, electrical conductivity, acoustics/electroacoustics, near-infrared spectroscopy, nuclear magnetic resonance, and various kinds of microscopic measurements (optical microscopy, transmission electron microscopy, and scanning electron microscopy) [
4,
5,
6,
7]. Several particle size analyzers have been designed and are commercially available for the determination of particle size distribution based on several physical principles, such as the scattering of light, the velocity of particles in a field, scattering, or absorption of ultrasonic waves [
1,
4]. In general, these analyzers are automated, rapid, and reliable systems with high installation costs. On the other hand, among all of these measurement techniques, microscopic measurement methods differ from other techniques, as they rely directly on the visual measurement of droplets [
3]. Optical microscopy stands out in particular, as it is an inexpensive, relatively easy-to-use instrument available in most laboratories. However, droplet size determination by optical microscopy is generally time-consuming and laborious [
3,
4,
6,
8,
9]. These weaknesses of microscopic analysis techniques become especially apparent when considering the necessity of observing thousands of droplets and quantifying their sizes to obtain meaningful results in droplet size distribution analysis.
Optical microscopes can be coupled with a digital camera, and in this way, images can be recorded and digitalized. It is possible to utilize these digitalized data with the aid of image processing techniques to reduce the time and workload required for the analysis [
10]. Microscopy and image processing techniques have been used in combination to determine the droplet size distribution of emulsions [
2,
3,
10,
11,
12]. Jokela et al. (1990) used a computerized microscope image analysis technique to determine the droplet size distribution of an oil-in-water emulsion [
10]. The threshold method was used for the discrimination of droplets from the background. They found that the computerized microscope image analysis results were satisfactory and in agreement with “Coulter counting” and “laser diffraction” methods. Moradi et al. (2011) used optical microscopy and image analysis to determine the droplet size distribution of water-in-crude oil emulsions by using image enhancement techniques. They noted that applying general enhancement techniques such as brightness and contrast adjustment, sharpening, and open filters improved the detection of droplets [
3]. Maaref and Ayatollahi (2018) also utilized some of the general enhancement techniques, including brightness, smoothing, and sharpening, for distinguishing emulsion droplets from the surroundings to evaluate the droplet size distribution of water-in-oil emulsions [
11].
Digital image analysis with the assistance of microscopy consists of four basic steps: (i) image acquisition, (ii) image restoration, (iii) segmentation and filtering, and (iv) measurement [
13]. First, the appropriate image is transferred from the microscope to the computer via the image transmitter and a Charge-Coupled Device (CCD) or Complementary Metal-Oxide-Semiconductor (CMOS) camera. In this step, proper focusing is crucial, as the droplets should not have overlapping structures and should not cause any disturbances during the analysis [
3]. After image acquisition, imaging defects, noise, or disturbances can be reduced, and the brightness and contrast of the images can also be adjusted. Then, segmentation and filtering processes are performed [
13]. After the segmentation is completed and the images are converted to binary form, particle size analysis is performed. In addition, obtaining reproducible, highly accurate results that reflect the sample requires creating a protocol to perform as much automated or semi-automated particle size analysis as possible. Moreover, an adequate number of droplets representing the system are necessary to conduct a meaningful statistical analysis. Moradi et al. (2011) reported that reliable results that guarantee convergence of the distribution were produced with 2000 or more droplets [
3].
The other challenge is the poor contrast between components of emulsions. Hu et al. (2018) stated that this could be due to the close refractive indices of water and oil, which are the two major components of the emulsions, under an optical microscope. This can cause difficulties in segmentation during the image analysis of emulsions [
8]. Although visual separation of water and oil phases is possible with the use of dyes, there are limitations, as they show interfacial activity and change the physical properties (pH, electrical conductivity, density, etc.) that have an impact on the emulsion character [
1,
14]. Most traditional segmentation methods rely on the density and spatial relationships of pixels or constrained patterns, such as pixel-based, edge-based, texture-based, or region-based methods. Each of these methods has various advantages and disadvantages. Compliance with the subsequent processing and the obtained dataset can only be achieved by determining the threshold appropriately. As a result, the application of these techniques is not suitable for all situations. However, machine learning techniques overcome the problem based on the manual calibration of parameters by applying optimization techniques to a given set of training images [
15]. Therefore, in recent years, the use of trainable machine learning methods, which enable more dynamic and accurate results to be obtained, has come to the fore [
16,
17]. The Trainable Weka Segmentation (TWS) is one of the plugins of Fiji, which is an open-source image processing package based on ImageJ [
16,
18]. It uses Waikato Environment for Knowledge Analysis, which was developed at Waikato University in New Zealand, for data mining tasks [
16,
19]. It is a combination of image segmentation and machine learning algorithms [
17].
This study aimed to develop a protocol for the determination of droplet size of an emulsion with a microscopy-assisted digital image analysis technique using TWS for the segmentation step. For this purpose, emulsions (O/W) were prepared with different oil/water phase ratios and homogenization times, and their droplet size parameters were determined. For verification of the method, instrumental measurements of the same emulsion samples were also performed with the laser diffraction method and the results were compared. Moreover, the relationships between the droplet size and the physical properties of emulsions (turbidity and viscosity) were investigated. To the best of the authors’ knowledge, this is the first time in the literature that TWS was used for the segmentation of emulsion oil droplets from the background in digital image analysis of emulsion micrographs.
2. Materials and Methods
2.1. Emulsion Preparation
Oil-in-water (O/W) emulsions were prepared in the present study. Commercial sunflower seed oil was purchased and used as the oil phase. Polysorbate 80 (Crillet 4™) was kindly provided by Croda (Croda International Plc, Snaith, UK) and used as an emulsifier at a constant ratio of 2% (
w/
w) in all emulsions. The experiment was designed with the aim of obtaining emulsions with different droplet sizes. For this purpose, the oil/water phase ratios of emulsions (5%, 10%, 20%, 30%, 40%, and 50%) and homogenization times (3, 6, and 9 min) were varied and are presented in
Table 1.
In the emulsion preparation, the total weight of each emulsion was kept constant at 30 g. Firstly, Crillet 4™ was dissolved in distilled water in a 50 mL Falcon tube. Then, sunflower oil was added to the tube and mixed. The mixture was homogenized with Ultra-Turrax (T-18 Digital Package, IKA, Staufen, Germany) at 10,000 rpm. The preparations were carried out in two repetitions, and the measurements were performed in triplicate.
2.2. Determination of Particle Size Distribution
The particle size distributions of the emulsions were measured with two different techniques, using a laser diffraction particle size analyzer and microscopy-assisted digital image analysis. For this purpose, D(10), D(50), D(90), span, D[3,2], and D[4,3] values were determined with both methods. D(10), D(50), and D(90) are the equivalent volume diameters at 10%, 50%, and 90% cumulative volume, respectively, while D[3,2] and D[4,3] values represent the area- and volume-weighted mean diameters, respectively. The span value is a measure of distribution width:
where
ni is the number of particles of diameter
di.
2.2.1. Determination of Particle Size Distribution by Laser Diffraction
A Mastersizer (Mastersizer 3000, Malvern Instruments Ltd., Malvern, Worcestershire, UK) was used as the laser diffraction particle size analyzer. The emulsions were prepared according to the formulation listed in
Table 1, and they were cooled to room temperature before measurements. The refractive index ratios of sunflower oil and distilled water were assumed to be 1.472 and 1.333, respectively. The stirring speed was adjusted to 2100 rpm, and emulsions (approximately 50–100 μL) were added to 500 mL of aqueous dispersant (distilled water) until a laser obscuration value of 10–14% was obtained [
20,
21,
22].
2.2.2. Determination of Particle Size Distribution by Microscopy-Assisted Digital Image Analysis
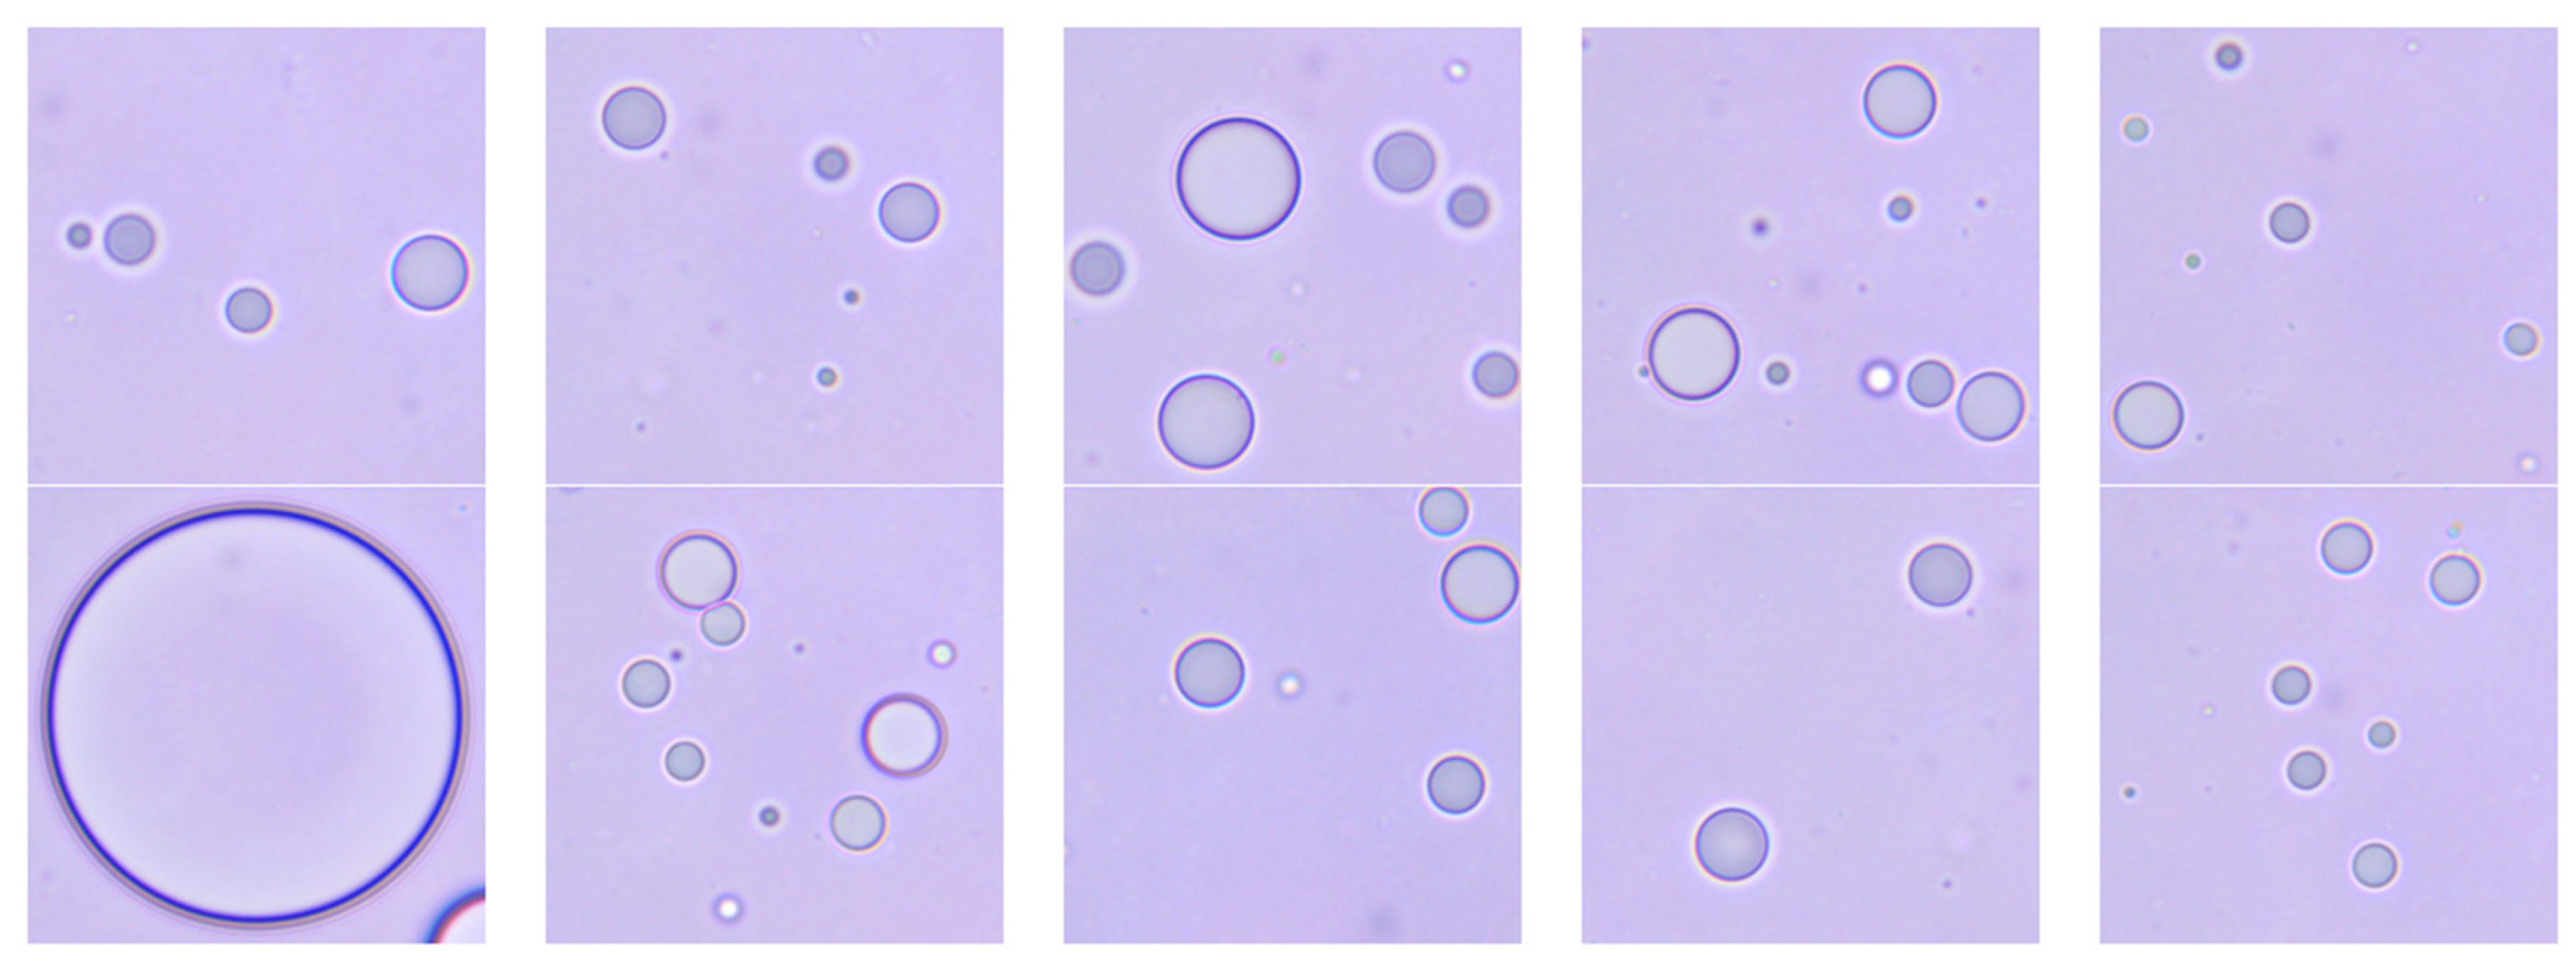
A total of 50 µL of distilled water was dropped onto the microscope slide, and 5 µL of the emulsion was spread over the slide with a syringe needle. It was carefully covered with a coverslip, and then immersion oil was dripped onto the coverslip. For imaging, 100×/1.25 oil, 160/0.17 objective lenses were used. Micrographs were obtained by a compound microscope (M83EZ, OMAX Microscopes, Kent, WA, USA) combined with a 5-megapixel CMOS camera (A3550U, OMAX Microscopes, Kent, WA, USA). The camera was located at the trinocular head, and micrographs were taken under transparent light conditions. At least 100 photographs were taken from 5 separate slides for each sample. The analysis was carried out immediately after the emulsion preparation and simultaneously with the other analyses. The light intensity, field, and condenser diaphragm apertures of the microscope were adjusted carefully for reproducible results. No pre-correction was applied to the images. ImageJ/Fiji (ver.1.53c.) was used as the software, and Trainable Weka Segmentation (TWS) (ver.3.2.35) was used for the segmentation of the images.
For the training of TWS, 10 images with different droplet densities were selected. As these images were used in the training, they were not included in the droplet particle size analysis. Since the processing of individual images slows the training process, they were converted into a stack of a single image and then used in the training (Image > Stacks > Images to Stack). Then, 800 × 800 sized regions were duplicated from the center of these images (
Figure 1). Afterwards, TWS was activated from the plugins (Plugins > Segmentation > Trainable Weka Segmentation). Droplets and background were drawn manually on each image and defined as different “Classes”. After the first training, minor corrections were made to the images based on the responses obtained from TWS, and the training process was repeated until the results for the images were obtained from TWS (
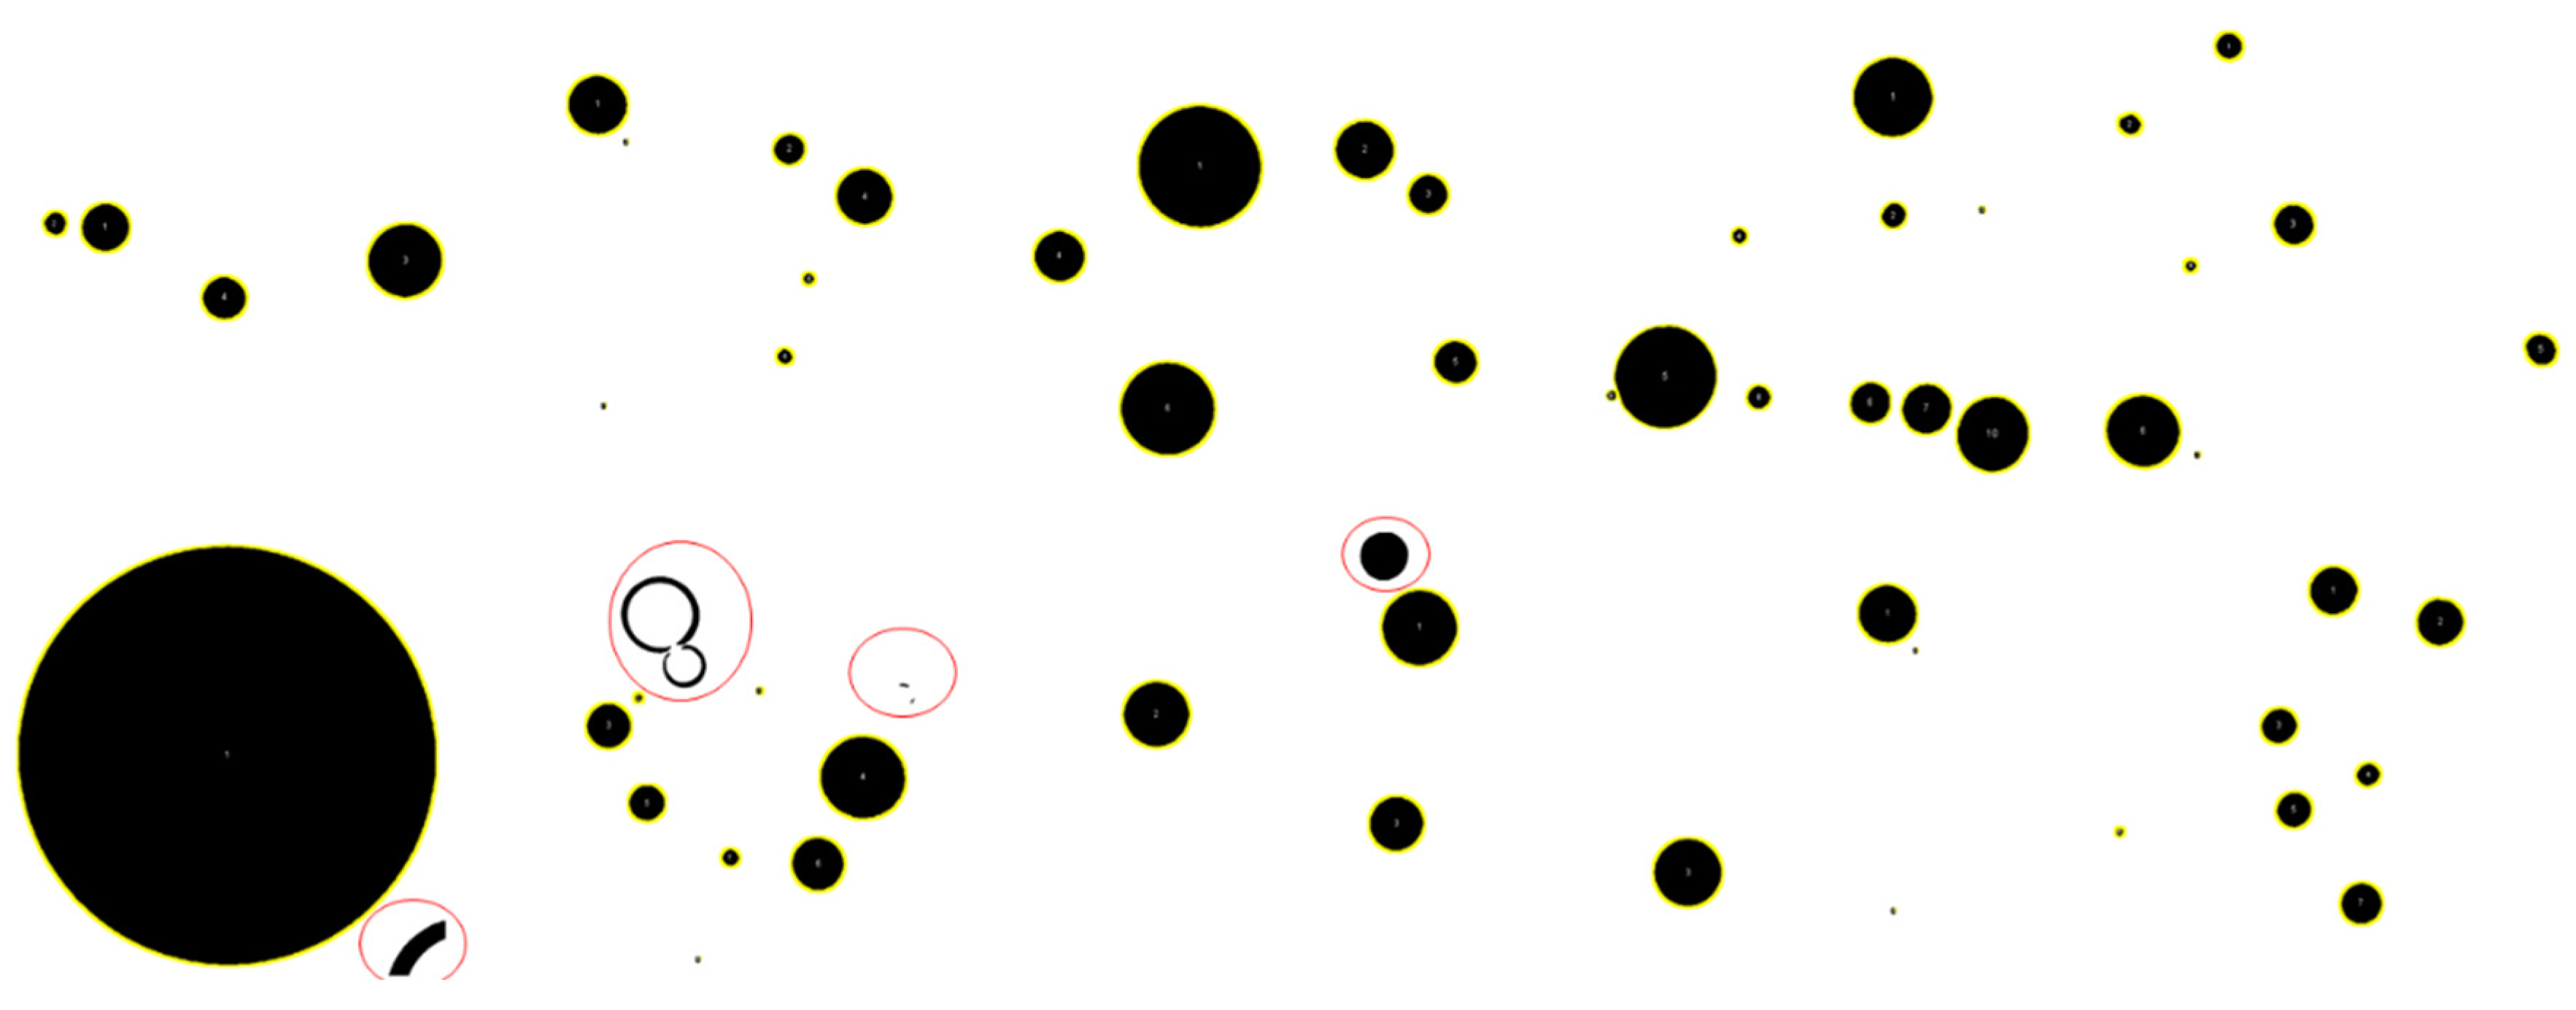
Figure 2). After training of TWS, segmentations of the micrographs of the samples were performed using the trained classifier on TWS. The images obtained as a result of TWS segmentation were turned into a single stack, and further operations were performed on this stack. Firstly, this stack was converted to 8 bits and then transformed into the binary format (Image > Type > 8-Bit, Process > Binary > Make Binary). After the empty droplets were filled with the “Fill holes” command, the “Open” command was applied to clear the pixels from the droplets (Process > Binary > Fill Holes-Open). Eventually, the particle sizes of these images were calculated (Analyze > Analyze particles).
The calculation was applied to objects with a circularity value greater than 0.85 to exclude composite or half-droplet images, which are illustrated in the regions marked in red circles in
Figure 3. A scale of 1 mm (100 × 10 μm) was used for the size calibration. The top of the scale was covered with a coverslip, and then immersion oil was dripped onto it. The number of pixels corresponding to the distance between two points with known distances was determined on the micrograph of the calibration slide. The measured distance was defined as global scale in ImageJ/Fiji (Analyze > Set Scale).
2.3. Determination of Turbidity
The turbidity of emulsions was measured with both a portable turbidity meter (MI 415, Milwaukee Instruments, Rocky Mount, NC, USA) and UV spectrophotometer (Carry 60, Agilent Technologies, Santa Clara, CA, USA) at different wavelengths, such as 450 and 850 nm. A 150 µL emulsion sample was diluted with 15 mL of distilled water, and the mixture was homogenized by shaking before measurements. The method of measurement with the turbidity meter is based on the detection of scattered light according to ISO 7027 [
23]. Before analysis, calibration of the device was performed with the 10 and 500 Formazin Nephelometric Unit (FNU) standards provided by the manufacturer. The wavelengths were set to 450 and 800 nm for the spectrophotometric determination of turbidity.
2.4. Determination of Viscosity
Flow properties of the emulsions were determined at 35 °C by using a viscometer (DV-II+ Pro Viscometer, Brookfield Engineering, Middleborough, MA, USA) and an SC4-18 spindle. A small sample adapter (SSA-13RD, Brookfield Engineering, Middleborough, MA, USA) was used in the measurements, and the temperatures of the samples were adjusted by a water circulation system (ICC Basic Eco 8, IKA, Staufen, Germany). Samples were analyzed immediately after the emulsion preparation. The sample cup was filled with 6.7 mL of the emulsion, and temperature equilibration was obtained in approximately 15 min. Experiments were duplicated and the average results were determined.
2.5. Statistical Analysis
The linear relations between the results of the microscopic measurements, laser diffraction particle size measurements, and other emulsion stability tests were investigated with bivariate correlation. For this purpose, SPSS statistical package program (SPSS ver. 13.0 for Windows, SPSS Inc., Chicago, IL, USA) was used, and Pearson’s correlation coefficients were calculated. It was assumed that when the variables were continuous and approximately normally distributed without significant outliers, there was a linear relationship between the variables. The linear correlation was assumed to be significant at p < 0.05, and a high correlation was determined at p < 0.01.
3. Results and Discussion
In this study, 10 emulsions with different formulations and/or homogenization times were prepared. Immediately after the production of these emulsions, analyses of the droplet size distribution were carried out with the laser diffraction technique, and simultaneously, microscope images of the emulsions were taken. The microscope images were processed with the help of TWS. In addition, the same analyses were repeated for six of the emulsions after one day of storage. The results of analyses performed with two different methods for the droplet size distribution are shown in
Table 2. On the other hand, it is known that emulsion stability and viscosity properties are related to emulsion droplet sizes in emulsions [
24,
25]. Therefore, the stability and viscosity of the produced emulsions were analyzed, and the results are presented in
Table 3.
For a realistic evaluation of droplet size distribution in emulsions, the largest possible number of droplets must be analyzed. It is stated in the literature that at least 2000 droplets should be analyzed to obtain reliable results in studies carried out with microscopic measurements [
3]. The present study was conducted to determine the droplet size distribution with microscopy-assisted digital image analysis, and more than 2000 droplets (droplets between 3836–7850) were analyzed for each emulsion sample. Moreover, the Pearson correlation test was used to determine the relationship between the results obtained (
Table 4).
The results of both droplet size distribution analyses showed similar trends (
Table 2 and
Table 4). However, the nominal values calculated by microscopy-assisted digital image analysis were slightly higher than the values obtained from the laser diffraction particle sizer. While D(90) and D[4,3] values calculated by microscopic measurements were in the range of 29.67–40.74 μm and 12.12–24.06 μm, the same parameters obtained by the laser diffraction technique were in the range of 20.90–34.10 μm and 8.46–20.70 μm, respectively (
Table 2). It is known that measurement conditions (sample dilution, mixing speed, ultrasound application, etc.) have important effects on the nominal values obtained from measurements taken with a laser diffraction particle size analyzer.
The dilution and stirring processes may lead to floc disruption and result in smaller particle size values [
13,
26]. In this study, ultrasound was not applied during the sample injection, whereas a mixing speed of 2100 rpm was used. Although this may be the reason for the difference in nominal values between the microscopic and laser diffraction measurement results, especially for the stored emulsions, this effect seemed to be insignificant, as the other emulsion analyses showed similar trends to those observed with particle size analysis (
Table 3). In general, the measured values of D(90) and D[4,3] slightly fluctuated with the storage time. According to the results, droplet size data determined by microscopy-assisted digital image analysis and droplet size analysis determined by laser diffraction were positively correlated in all parameters (
p < 0.05). Notably, D[4,3], D[3,2], and D(90) values had higher positive correlations (
p < 0.01). It is known that D(90) is less affected by the obscuration ratio than other particle size parameters, such as D(10) and D(50), in the laser diffraction technique and yields more stable results. It is reported in the literature that D[4,3] is more sensitive to the presence of large particles in an emulsion system than the other parameters, and the differences between D[4,3] and D[3,2] generally indicate a broad or multimodal particle size distribution [
1]. In the present study, the difference between D[4,3] and D[3,2] was significant according to the results of both measurement techniques and varied in the range of 4.7–10.8 μm and 5.8–13.5 μm for microscopic and laser diffraction measurements, respectively (
Table 2).
Moreover, all of the parameters calculated from the microscopic measurements were highly correlated with the emulsion stability and viscosity results, and these relationships were even stronger than those between laser diffraction measurements and emulsion properties (
Table 4). It was observed that the viscosity of the emulsions did not change significantly with storage (
p > 0.05) (
Table 3). When the effect of homogenization time was evaluated, the smallest droplet size was achieved with a 6 min process at a 10% oil ratio and with a 9 min process for an emulsion with a 30% oil ratio. These results are in agreement with the turbidity results (measurements made with both the turbidimeter and spectrophotometer), and turbidity values are high in samples with a small droplet size [
2].
With the increase in the oil ratio in the produced emulsion formulation, increases in viscosity, turbidity, and droplet size values, especially those measured with the microscope (mainly D[3,2] and D[4,3] parameters), were observed (
Table 2 and
Table 3). While no significant changes were detected in the laser diffraction measurements of turbidity, viscosity, or droplet size values of emulsions after storage, some fluctuations in the variation of droplet sizes measured with the microscope were observed (
Table 2 and
Table 3).
4. Conclusions
The results of the present study showed that the same trends and similar particle size values were obtained by microscopy-assisted digital image analysis and laser diffraction particle size analysis for the determination of particle size in emulsions. Considering the installation costs of devices for measuring laser diffraction, microscopy-assisted digital image analysis seems to be a very useful and effective alternative. On the other hand, if sample characterization is to be performed, it should be noted that there are certain differences in the measured values, and slightly larger droplet sizes are calculated with the microscopy-assisted digital image analysis technique. In addition, while the results can be obtained in about 5 min when taking measurements with laser diffraction devices (total time for analysis), the analysis and calculation process may take one or several days per sample with the procedure developed in the present study, unless working with high-capacity workstations. It was observed that comparable results were obtained for D(90), D[3,2], and D[4,3], which were correlated with the physical properties of the emulsions.
In summary, the microscopy-assisted digital image analysis procedure developed in this study can provide very reasonable results when it is impossible to obtain/use laser diffraction particle size analyzers. However, it should be noted that performing this method is labor- and time-intensive.


