
Electrochemical Deposition of Fe–Co–Ni Samples with Different Co Contents and Characterization of Their Microstructural and Magnetic Properties

 , , , ,
  and
and 
Abstract
:1. Introduction
2. Materials and Method
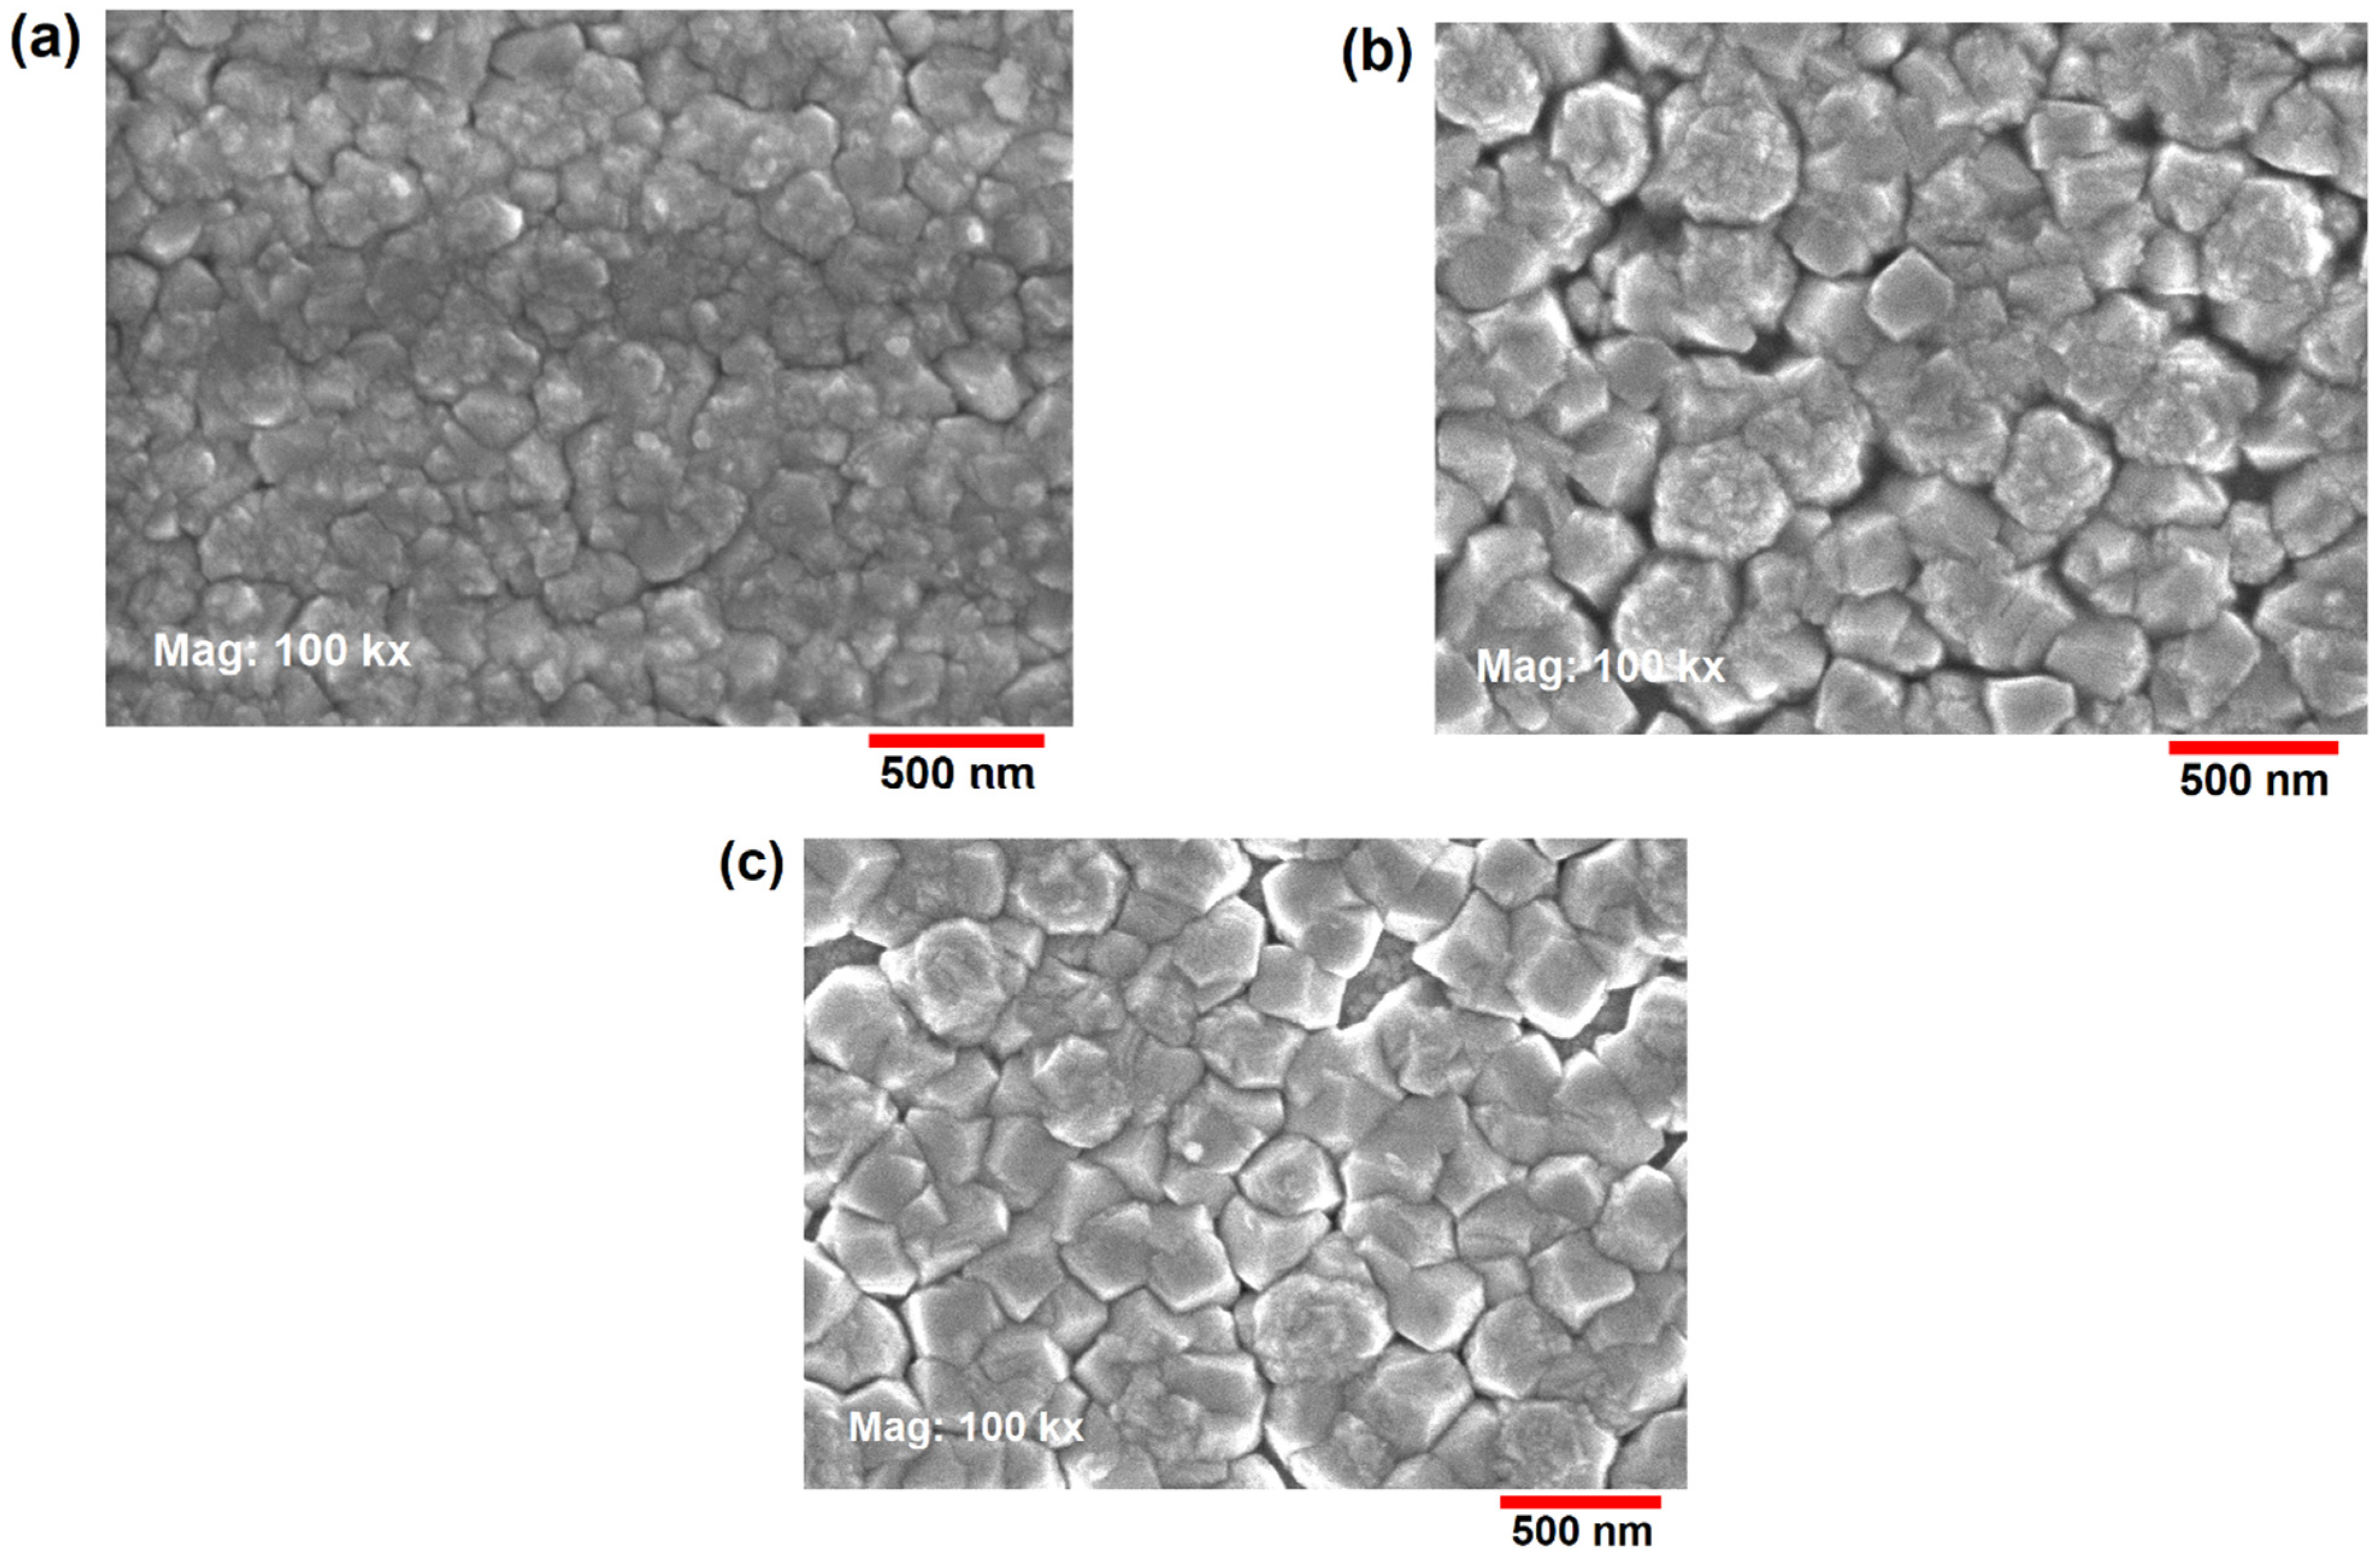
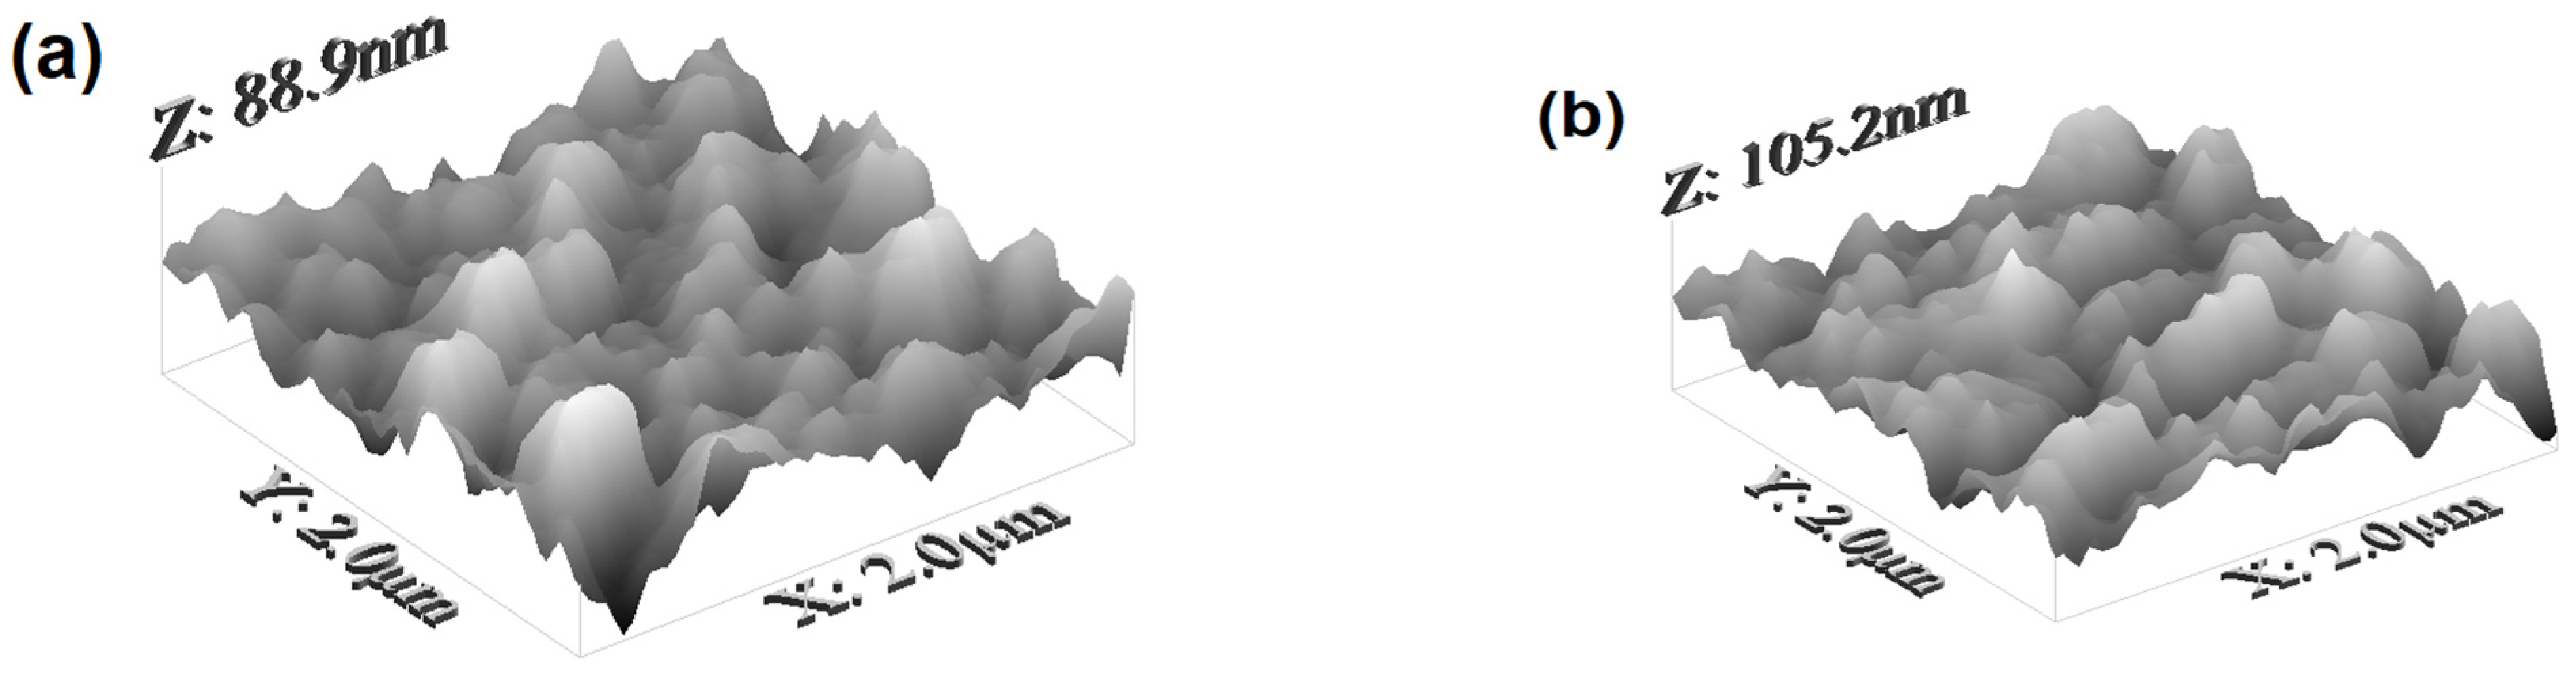
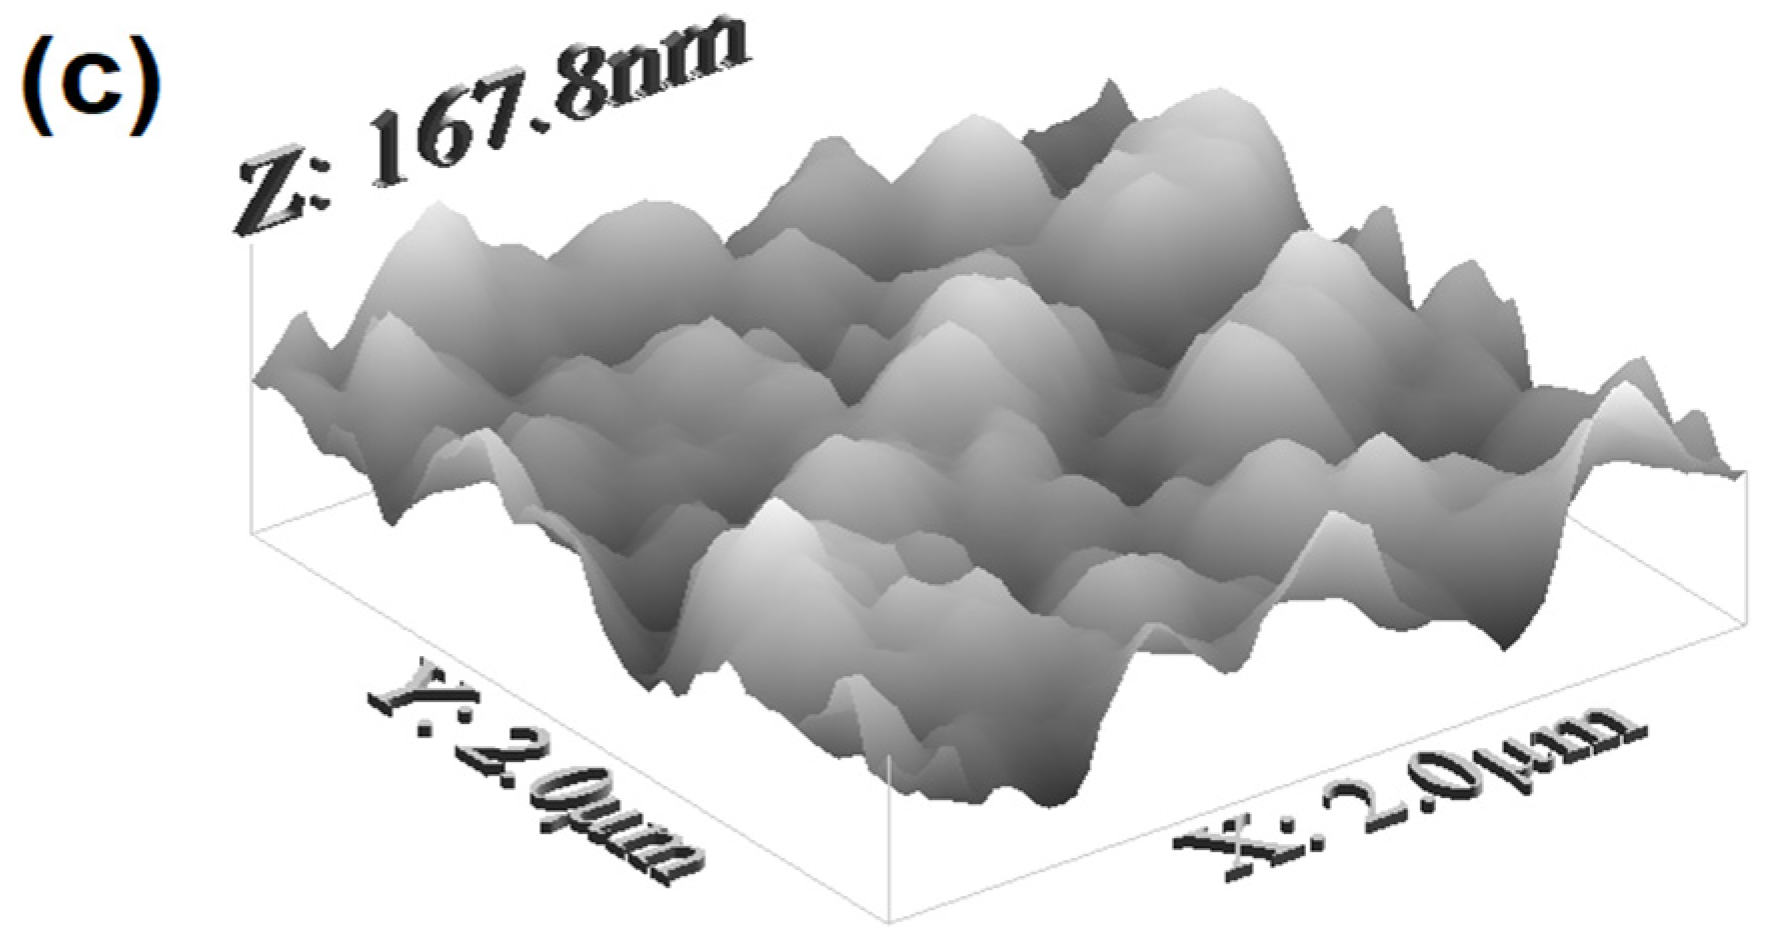
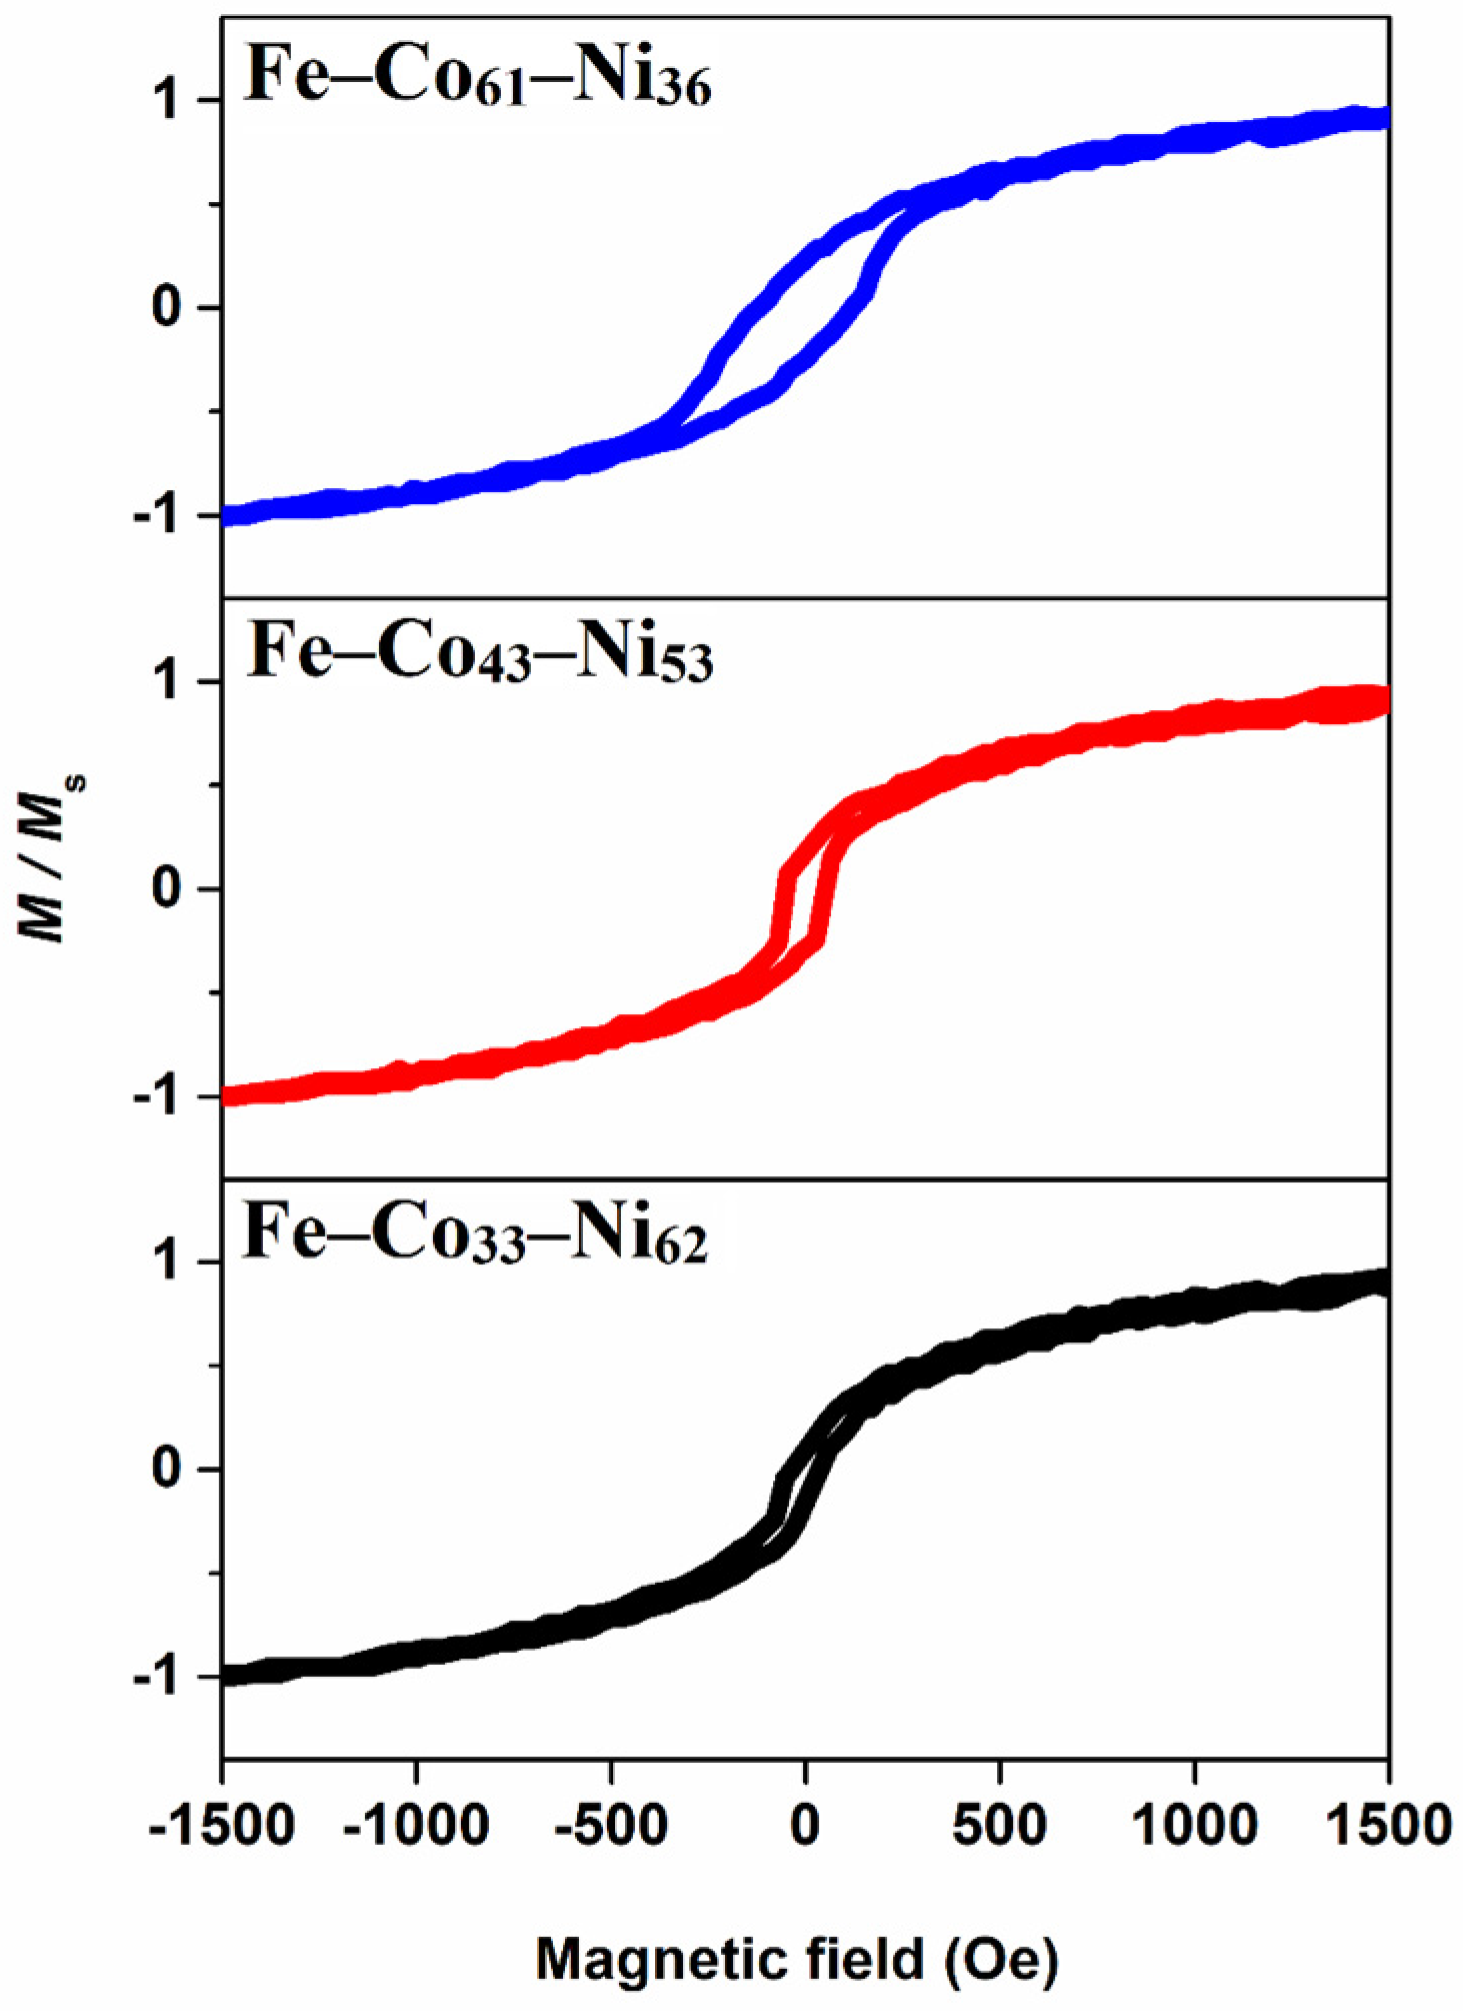
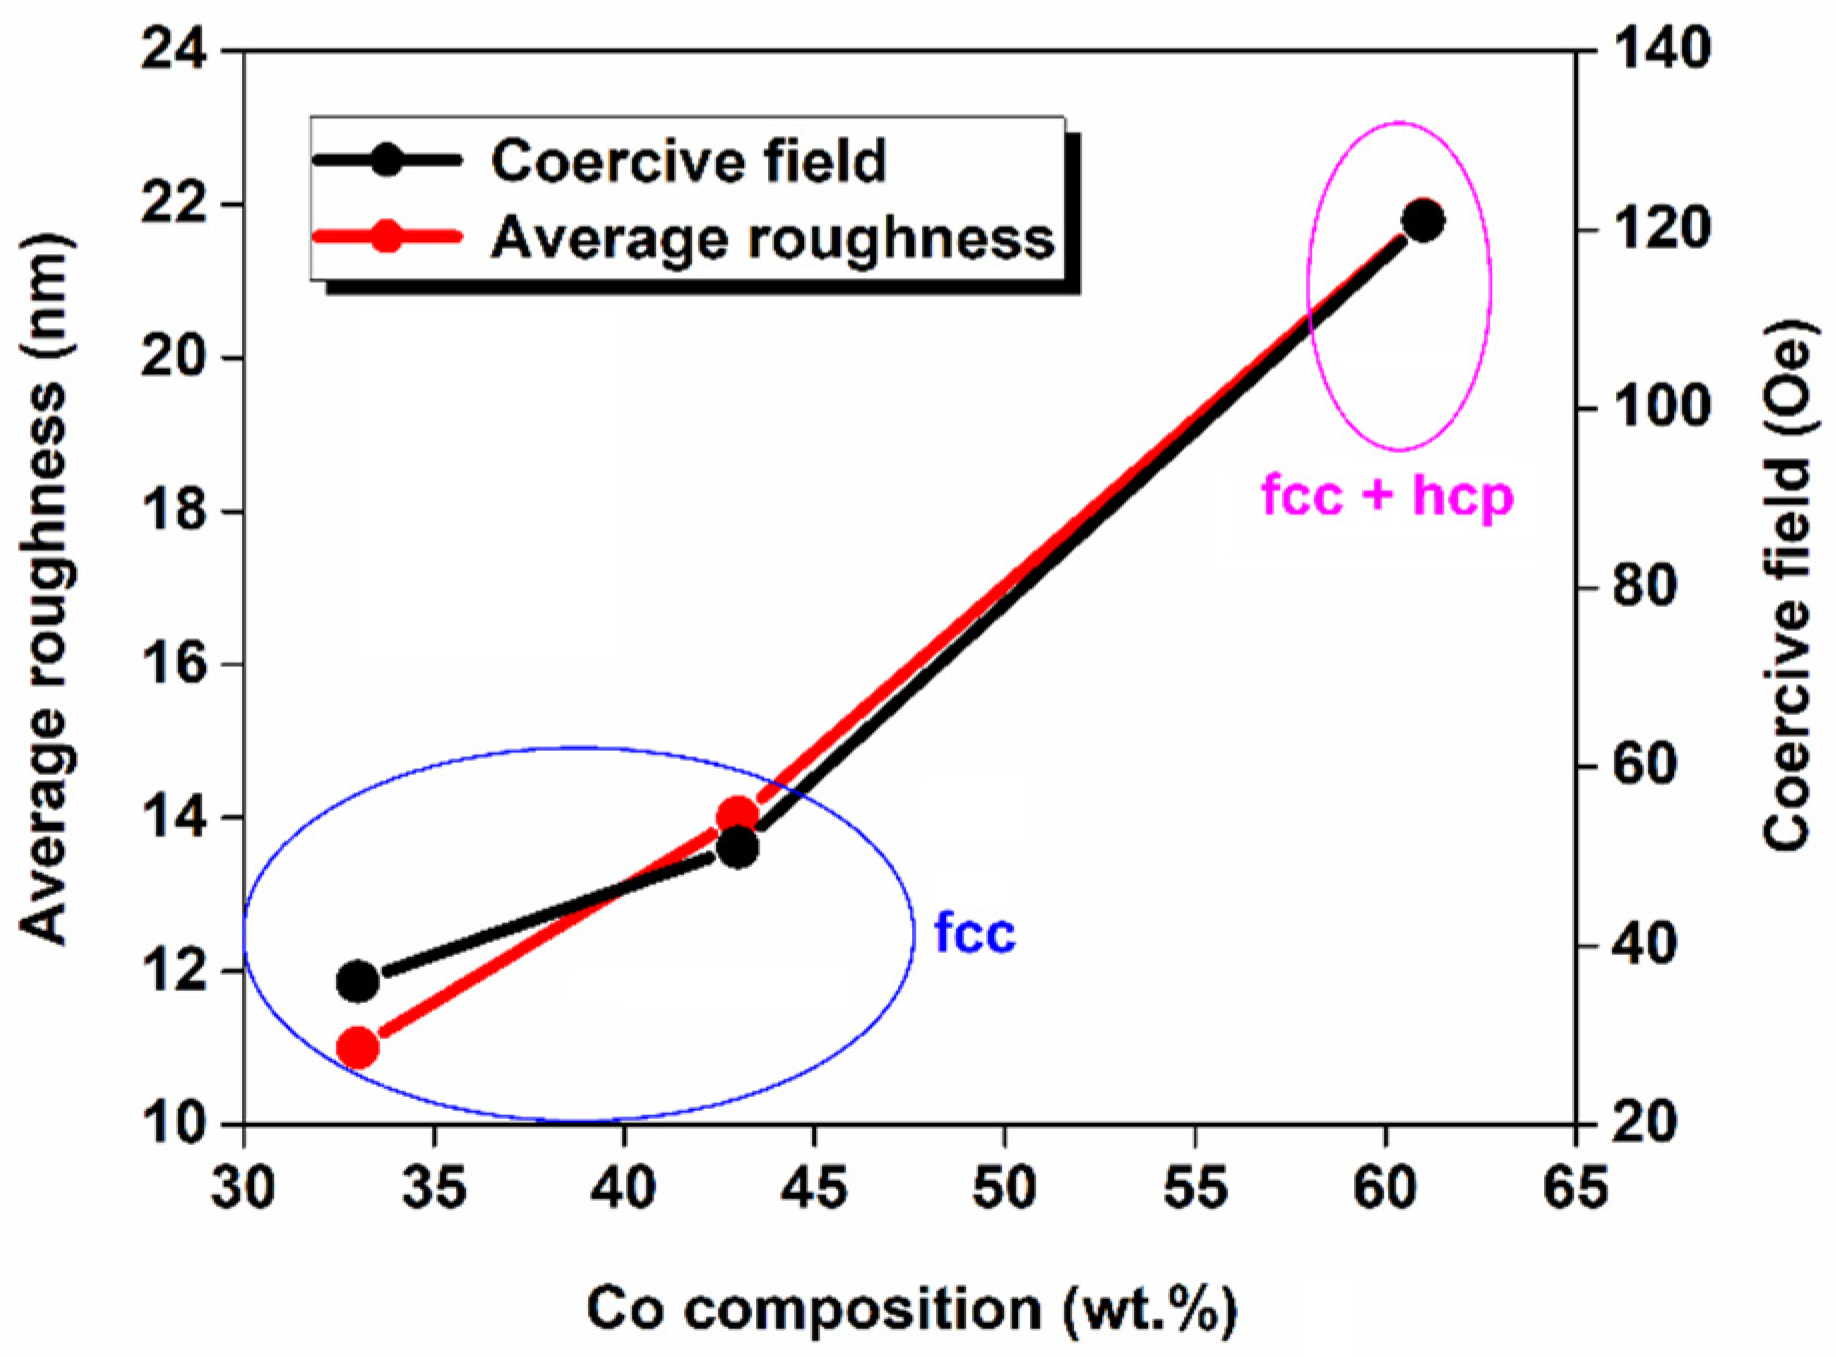
3. Results and Discussion
4. Conclusions
Author Contributions
Funding
Institutional Review Board Statement
Informed Consent Statement
Data Availability Statement
Acknowledgments
Conflicts of Interest
References
- Hemeda, O.M.; Tawfik, A.; El–Sayed, A.H.; Hamad, M.A. Synthesis and characterization of semi–crystalline NiCoP film. J. Supercond. Nov. Magn. 2015, 28, 3629–3632. [Google Scholar] [CrossRef]
- Boubatra, M.; Azizi, A.; Schmerber, G.; Dinia, A. The influence of pH electrolyte on the electrochemical deposition and properties of nickel thin films. Ionics 2012, 18, 425–432. [Google Scholar] [CrossRef]
- Ledwig, P.; Kac, M.; Kopia, A.; Falkus, J.; Dubiel, B. Microstructure and properties of electrodeposited nanocrystalline Ni–Co–Fe coatings. Materials 2021, 14, 3886. [Google Scholar] [CrossRef]
- Betancourt-Cantera, L.G.; Sánchez-de Jesús, F.; Bolarίn–Mirό, A.M.; Gallegos–Melgar, A.; Mayen, J.; Betancourt-Cantera, J.A. Structural analysis and magnetic characterization of ternary alloys (Co–Fe–Ni) synthesized by mechanical alloying. J. Mater. Res. Technol. 2020, 9, 14969–14978. [Google Scholar] [CrossRef]
- Milyaev, M.A.; Bannikova, N.S.; Naumova, L.I.; Proglyado, V.V.; Patrakov, E.I.; Glazunov, N.P.; Ustinov, V.V. Effective Co–rich ternary CoFeNi alloys for spintronics application. J. Alloys Compd. 2021, 854, 157171. [Google Scholar] [CrossRef]
- Budi, S.; Manaf, A. The effects of saccharin on the electrodeposition of NiCoFe films on a flexible substrate. Mater. Res. Express 2021, 8, 086513. [Google Scholar] [CrossRef]
- Kayani, Z.N.; Riaz, S.; Naseem, S. Structural and magnetic properties of FeCoNi thin films. Indian J. Phys. 2014, 88, 165–169. [Google Scholar] [CrossRef]
- Safavi, M.S.; Tanhaei, M.; Ahmadipour, M.F.; Adli, R.G.; Mahdavi, S.; Walsh, F.C. Electrodeposited Ni–Co alloy–particle composite coatings: A comprehensive review. Surf. Coat. Technol. 2020, 382, 125153. [Google Scholar] [CrossRef]
- Song, J.; Yoon, D.; Han, C.; Kim, D.; Park, D.; Myung, N. Electrodeposition characteristics and magnetic properties of CoFeNi thin film alloys. J. Korean Electrochem. Soc. 2002, 5, 17–20. [Google Scholar] [CrossRef]
- Pingale, A.D.; Owhal, A.; Katarkar, A.S.; Belgamwar, S.U.; Rathore, J.S. Recent researches on Cu–Ni alloy matrix composites through electrodeposition and powder metallurgy methods: A review. Mater. Today Proc. 2021, 47, 3301–3308. [Google Scholar] [CrossRef]
- Alizadeh, M.; Safaei, H. Characterization of Ni–Cu matrix, Al2O3 reinforced nano–composite coatings prepared by electrodeposition. Appl. Surf. Sci. 2018, 456, 195–203. [Google Scholar] [CrossRef]
- Sattawitchayapit, S.; Yordsri, V.; Panyavan, P.; Chookajorn, T. Solute and grain boundary strengthening effects in nanostructured Ni–Co alloys. Surf. Coat. Technol. 2021, 428, 127902. [Google Scholar] [CrossRef]
- Tian, L.; Xu, J.; Qiang, C. The electrodeposition behaviors and magnetic properties of Ni–Co films. Appl. Surf. Sci. 2011, 257, 4689–4694. [Google Scholar] [CrossRef]
- Su, X.; Qiang, C. Influence of pH and bath composition on properties of Ni–Fe alloy films synthesized by electrodeposition. Bull. Mater. Sci. 2012, 35, 183–189. [Google Scholar] [CrossRef] [Green Version]
- Saraç, U.; Baykul, M.C. Comparison of microstructural and morphological properties of electrodeposited Fe–Cu thin films with low and high Fe: Cu ratio. Adv. Mater. Sci. Eng. 2013, 2013, 971790. [Google Scholar] [CrossRef] [Green Version]
- Saraç, U.; Baykul, M.C. Microstructural and morphological characterizations of nanocrystalline Ni–Cu–Fe thin films electrodeposited from electrolytes with different Fe ion concentrations. J. Mater. Sci. Mater. Electron. 2014, 25, 2554–2560. [Google Scholar] [CrossRef]
- Saraç, U.; Baykul, M.C.; Uguz, Y. Differences observed in the phase structure, grain size–shape, and coercivity field of electrochemically deposited Ni–Co thin films with different Co contents. J. Supercond. Nov. Magn. 2015, 28, 3105–3110. [Google Scholar] [CrossRef]
- Saraç, U.; Kaya, M.; Baykul, M.C. Synthesis of Ni–Fe thin films by electrochemical deposition technique and characterization of their microstructures and surface morphologies. Turk. J. Phys. 2017, 41, 536–544. [Google Scholar] [CrossRef]
- Saraç, U.; Kaya, M.; Baykul, M.C. The influence of deposit composition controlled by changing the relative Fe ion concentration on properties of electroplated nanocrystalline Co–Fe–Cu ternary thin films. Turk. J. Phys. 2018, 42, 136–145. [Google Scholar]
- Saraç, U.; Baykul, M.C. An investigation of structural properties and surface morphologies of electrochemically fabricated nanocrystalline Ni–Co–Cu/ITO deposits with different compositions. Turk. J. Phys. 2019, 43, 372–382. [Google Scholar]
- Saraç, U.; Baykul, M.C. Studying structural, magnetic and morphological features of electrochemically fabricated thin films of Co–Ni–Fe with different Fe compositions. Thin Solid Films 2021, 736, 138901. [Google Scholar] [CrossRef]
- Saraç, U.; Baykul, M.C.; Uguz, Y. The influence of applied current density on microstructural, magnetic, and morphological properties of electrodeposited nanocrystalline Ni–Co thin films. J. Supercond. Nov. Magn. 2015, 28, 1041–1045. [Google Scholar] [CrossRef]
- Hanafi, I.; Daud, A.R.; Radiman, S. Potentiostatic electrodeposition of Co–Ni–Fe thin films from sulfate medium. J. Chem. Technol. Metall. 2016, 51, 547–555. [Google Scholar]
- Saraç, U.; Kaya, M.; Baykul, M.C. A comparative study on microstructures, magnetic features and morphologies of ternary Fe–Co–Ni alloy thin films electrochemically fabricated at different deposition potentials. J. Supercond. Nov. Magn. 2019, 32, 917–923. [Google Scholar] [CrossRef]
- Brenner, A. Electrodeposition of Alloys Principles and Practice; Academic Press: New York, NY, USA, 1963. [Google Scholar]
- Dung, N.T.; Cuong, C.N.; Hung, V.T. Molecular dynamics study of microscopic structures, phase transitions and dynamic crystallization in Ni nanoparticles. RSC Adv. 2017, 7, 25406–25413. [Google Scholar]
- Hue, D.T.M.; Coman, G.; Hoc, N.Q.; Dung, N.T. Influence of heating rate, temperature, pressure on the structure, and phase transition of amorphous Ni material: A molecular dynamics study. Heliyon 2020, 6, e05548. [Google Scholar]
- Dung, N.T. Z-AXIS deformation method to investigate the influence of system size, structure phase transition on mechanical properties of bulk nickel. Mater. Chem. Phys. 2020, 252, 123275. [Google Scholar]
- Dung, N.T.; van, C.L. Effects of number of atoms, shell thickness, and temperature on the structure of Fe nanoparticles amorphous by molecular dynamics method. Adv. Civ. Eng. 2021, 2021, 9976633. [Google Scholar]
- Dung, N.T.; Phuong, N.T. Understanding the heterogeneous kinetics of Al nanoparticles by simulations method. J. Mol. Struct. 2020, 1218, 128498. [Google Scholar]
- Quoc, T.T.; Trong, D.N. Molecular dynamics factors affecting on the structure, phase transition of Al bulk. Phys. B Condens. Matter 2019, 570, 116–121. [Google Scholar] [CrossRef]
- Dung, N.T.; van, C.L.; van, D.Q.; Ţălu, Ş. First-principles calculations of structural and electronic structural properties of Au–Cu alloys. J. Compos. Sci. 2022; in press. [Google Scholar]
- Dung, N.T.; Cuong, N.C.; van, D.Q. Study on the effect of doping on lattice constant and electronic structure of bulk AuCu by the density functional theory. J. Multiscale Model. 2020, 11, 2030001. [Google Scholar]
- Dung, N.T.; van, C.L. Factors affecting the depth of the Earth’s surface on the heterogeneous dynamics of Cu1−xNix alloy, x = 0.1, 0.3, 0.5, 0.7, 0.9 by molecular dynamics simulation method. Mater. Today Commun. 2021, 29, 102812. [Google Scholar]
- Dung, N.T. Some factors affecting structure, transition phase and crystallized of CuNi nanoparticles. Am. J. Mod. Phys. 2017, 6, 66–75. [Google Scholar] [CrossRef] [Green Version]
- Dung, N.T.; Phuong, N.T. Molecular dynamic study on factors influencing the structure, phase transition and crystallization process of NiCu6912 nanoparticle. Mater. Chem. Phys. 2020, 250, 123075. [Google Scholar]
- Dung, N.T.; van, C.L.; Ţălu, Ş. The structure and crystallizing process of NiAu alloy: A molecular dynamics simulation method. J. Compos. Sci. 2021, 5, 18. [Google Scholar]
- Hoc, N.Q.; Viet, L.H.; Dung, N.T. On the melting of defective FCC interstitial alloy γ-FeC under pressure up to 100 Gpa. J. Electron. Mater. 2020, 49, 910–916. [Google Scholar] [CrossRef]
- Dung, N.T.; Kien, P.H.; Phuong, N.T. Simulation on the factors affecting the crystallization process of FeNi alloy by molecular dynamics. ACS Omega 2019, 4, 14605–14612. [Google Scholar]
- Dung, N.T. Influence of impurity concentration, atomic number, temperature and tempering time on microstructure and phase transformation of Ni1−xFex (x = 0:1, 0.3, 0.5) nanoparticles. Mod. Phys. Lett. B 2018, 14, 1850204. [Google Scholar] [CrossRef]
- Van, C.L.; van, D.Q.; Dung, N.T. Ab initio calculations on the structural and electronic properties of AgAu alloys. ACS Omega 2020, 5, 31391–31397. [Google Scholar]
- Dung, N.T.; Phuong, N.T. Factors affecting the structure, phase transition and crystallization process of AlNi nanoparticles. J. Alloys Compd. 2020, 812, 152133. [Google Scholar]
- Quoc, T.T.; Trong, D.N. Effect of heating rate, impurity concentration of Cu, atomic number, temperatures, time annealing temperature on the structure, crystallization temperature and crystallization process of Ni1−xCux bulk; x = 0.1, 0.3, 0.5, 0.7. Int. J. Mod. Phys. B 2018, 32, 1830009. [Google Scholar]
- Dung, T.N.; Cuong, C.N.; Toan, T.N.; Hung, K.P. Factors on the magnetic properties of the iron nanoparticles by classical Heisenberg model. Phys. B 2018, 532, 144–148. [Google Scholar]
- Dung, N.T.; van, C.L.; Țălu, Ș. the study of the influence of matrix, size, rotation angle, and magnetic field on the isothermal entropy, and the néel phase transition temperature of Fe2O3 nanocomposite thin films by the Monte-Carlo simulation method. Coatings 2021, 11, 1209–1216. [Google Scholar]
- Yang, Y. Preparation of Fe–Co–Ni ternary alloys with electrodeposition. Int. J. Electrochem. Sci. 2015, 10, 5164–5175. [Google Scholar]
- Yanai, T.; Koda, K.; Kaji, J.; Aramaki, H.; Eguchi, K.; Takashima, K.; Nakano, M.; Fukunaga, H. Electroplated Fe–Co–Ni films prepared in ammonium-chloride-based plating baths. AIP Adv. 2018, 8, 056127. [Google Scholar] [CrossRef] [Green Version]
- Omata, F. Magnetic properties of Fe–Co–Ni films with high saturation magnetization prepared by evaporation and electrodeposition. IEEE Transl. J. Magn. Jpn. 1990, 5, 17–28. [Google Scholar] [CrossRef]
- Horcas, I.; Fernández, R.; Gómez–Rodrίguez, J.M.; Colchero, J.; Gómez–Herrero, J.; Baro, A.M. WSXM: A software for scanning probe microscopy and a tool for nanotechnology. Rev. Sci. Instrum. 2007, 78, 013705. [Google Scholar] [CrossRef]
- Tseng, Y.T.; Wu, G.X.; Lin, J.C.; Hwang, Y.R.; Wei, D.H.; Chang, S.Y.; Peng, K.C. Preparation of Co–Fe–Ni alloy micropillar by microanode-guided electroplating. J. Alloys Compd. 2021, 885, 160873. [Google Scholar] [CrossRef]
- Zhang, Y.; Ivey, D.G. Electrodeposition of nanocrystalline CoFe soft magnetic thin films from citrate–stabilized baths. Mater. Chem. Phys. 2018, 204, 171–178. [Google Scholar] [CrossRef]
- Qiang, C.; Xu, J.; Xiao, S.; Jiao, Y.; Zhang, Z.; Liu, Y.; Tian, L.; Zhou, Z. The influence of pH and bath composition on the properties of Fe–Co alloy film electrodeposition. Appl. Surf. Sci. 2010, 257, 1371–1376. [Google Scholar] [CrossRef]
- Ramazani, A.; Almasi–Kashi, M.; Golafshan, E.; Arefpour, M. Magnetic behavior of as-deposited and annealed CoFe and CoFeCu nanowire arrays by ac–pulse electrodeposition. J. Cryst. Growth 2014, 402, 42–47. [Google Scholar] [CrossRef]
- Budi, S.; Kurniawan, B.; Mott, D.M.; Maenosono, S.; Umar, A.A.; Manaf, A. Comparative trial of saccharin–added electrolyte for improving the structure of an electrodeposited magnetic FeCoNi thin film. Thin Solid Films 2017, 642, 51–57. [Google Scholar] [CrossRef]
- Kockar, H.; Demirbas, O.; Kuru, H.; Alper, M.; Karaagac, O.; Haciismailoglu, M.; Ozergin, E. Electrodeposited NiCoFe films from electrolytes with different Fe ion concentrations. J. Magn. Magn. Mater. 2014, 360, 148–151. [Google Scholar] [CrossRef]
- Wu, G.; Li, N.; Zhou, D.; Mitsuo, K. Electrodeposited Co–Ni–Al2O3 composite coatings. Surf. Coat. Technol. 2004, 176, 157–164. [Google Scholar] [CrossRef]
- Wang, J.; Lei, W.; Deng, Y.; Xue, Z.; Qian, H.; Liu, W.; Li, X. Effect of current density on microstructure and corrosion resistance of Ni graphene oxide composite coating electrodeposited under supercritical carbon dioxide. Surf. Coat. Technol. 2019, 358, 765–774. [Google Scholar] [CrossRef]
- Ţălu, Ş. Micro and Nanoscale Characterization of Three Dimensional Surfaces. Basics and Applications; Napoca Star Publishing House: Cluj-Napoca, Romania, 2015. [Google Scholar]
- Méndez, A.; Reyes, Y.; Trejo, G.; Stępień, K.; Ţălu, Ş. Micromorphological characterization of zinc/silver particle composite coatings. Microsc. Res. Tech. 2015, 78, 1082–1089. [Google Scholar] [CrossRef] [PubMed] [Green Version]
- Grayeli-Korpi, A.R.; Luna, C.; Arman, A.; Ţălu, Ş. Influence of the oxygen partial pressure on the growth and optical properties of RF-sputtered anatase TiO2 thin films. Results Phys. 2017, 7, 3349–3352. [Google Scholar] [CrossRef]
- Mwema, F.M.; Akinlabi, E.T.; Oladijo, O.P.; Fatoba, O.S.; Akinlabi, S.A.; Ţălu, Ş. Advances in manufacturing analysis: Fractal theory in modern manufacturing. In Modern Manufacturing Processes, 1st ed.; Kumar, K., Davim, J.P., Eds.; Woodhead Publishing Reviews: Mechanical Engineering Series; Elsevier: Amsterdam, The Netherlands, 2020; pp. 13–39. [Google Scholar] [CrossRef]
- Ţălu, Ş.; Stach, S.; Raoufi, D.; Hosseinpanahi, F. Film thickness efect on fractality of tin-doped In2O3 thin films. Electron. Mater. Lett. 2015, 11, 749–757. [Google Scholar] [CrossRef]
- Ţălu, Ş.; Morozov, I.A.; Yadav, R.P. Multifractal analysis of sputtered indium tin oxide thin film surfaces. Appl. Surf. Sci. 2019, 484, 892–898. [Google Scholar] [CrossRef]
- Ţălu, Ş.; Stach, S.; Ramazanov, S.; Sobola, D.; Ramazanov, G. Multifractal characterization of epitaxial silicon carbide on silicon. Mater. Sci.-Pol. 2017, 35, 539–547. [Google Scholar] [CrossRef] [Green Version]
- Denizli, Ç.; Sarac, U.; Baykul, M.C. Controlling the surface morphologies, structural and magnetic properties of electrochemically fabricated Ni–Co thin film samples via seed layer deposition. J. Mater. Sci. Mater. Electron. 2020, 31, 4279–4286. [Google Scholar] [CrossRef]
- Rhen, F.M.F.; Roy, S. Dependence of magnetic properties on micro–to nanostructure of CoNiFe films. J. Appl. Phys. 2008, 103, 103901. [Google Scholar] [CrossRef] [Green Version]


| Co Ion Concentration (M) | |||
|---|---|---|---|
| 0.016 | 0.024 | 0.040 | |
| Co (wt.%) | 32.9 | 43.2 | 60.9 |
| Ni (wt.%) | 62.4 | 52.7 | 35.7 |
| Fe (wt.%) | 4.7 | 4.1 | 3.4 |
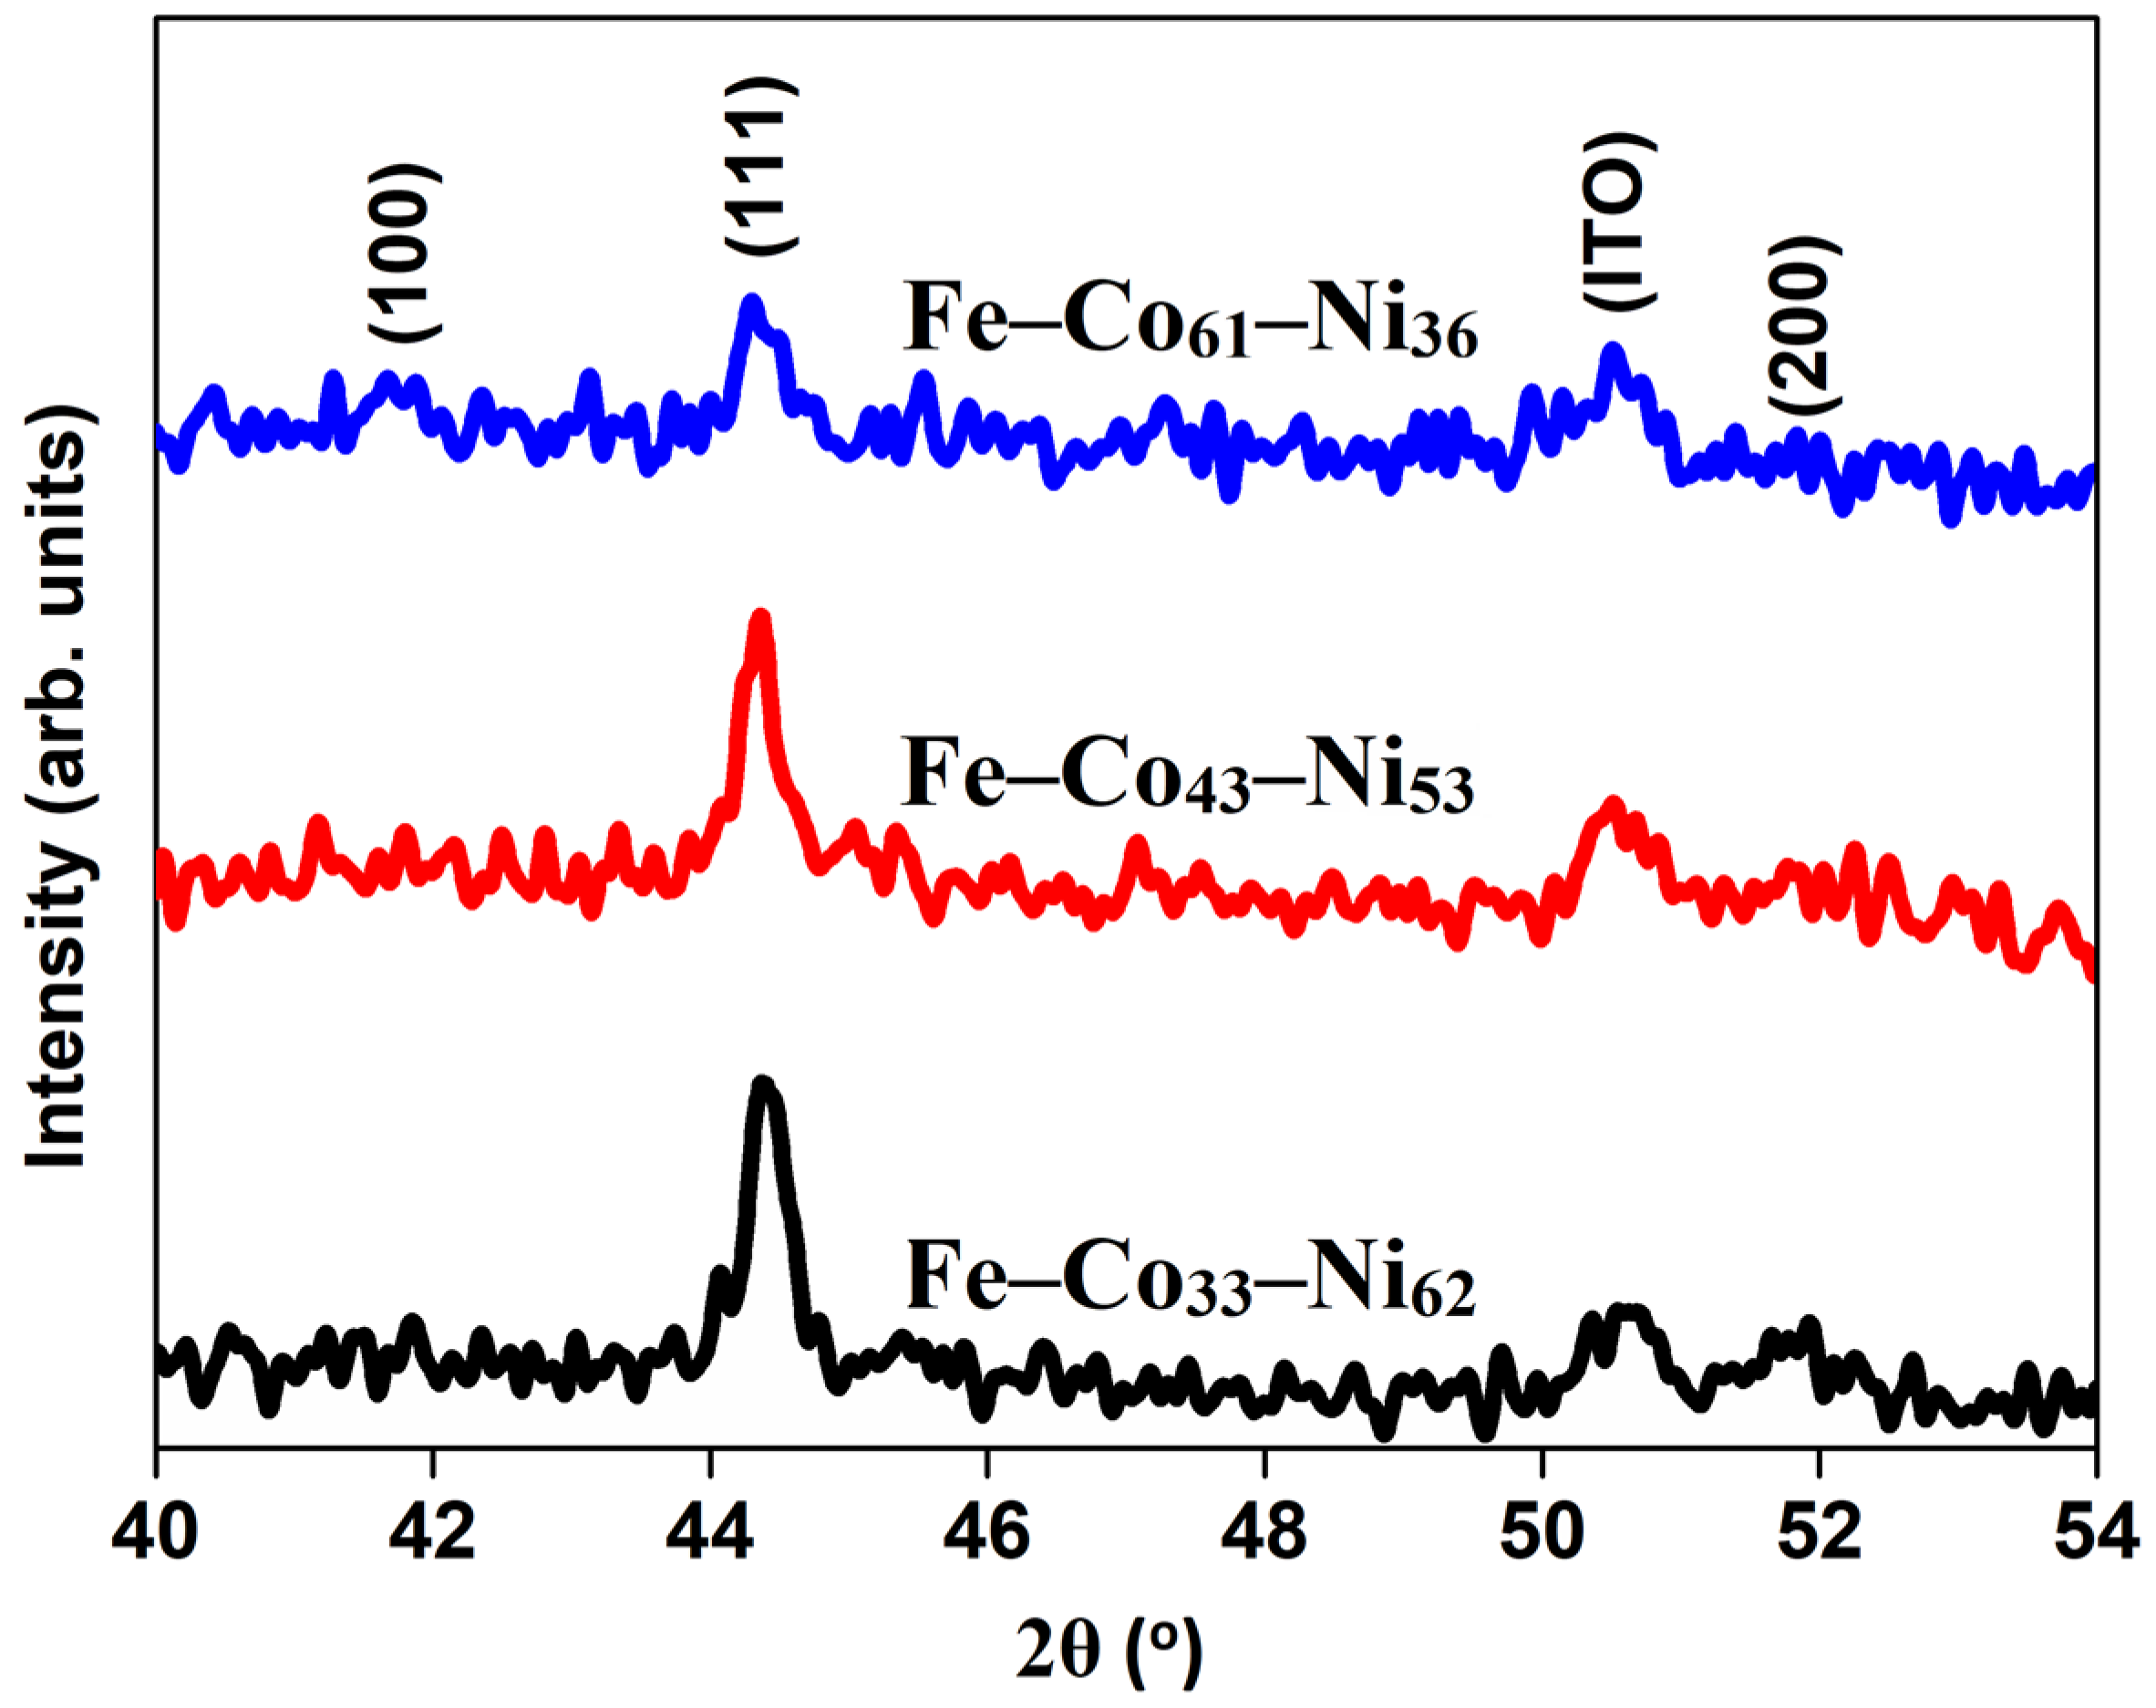
| Resultant sample | Fe–Co33–Ni62 | Fe–Co43–Ni53 | Fe–Co61–Ni36 |
| Phase structure | fcc | fcc | Fcc + hcp |
| Mean crystallite size (nm) | 21.6 | 20.2 | 15.6 |
| RMS roughness (nm) | 14.4 | 17.8 | 28.4 |
| Average roughness (nm) | 11.0 | 14.0 | 21.8 |
| Average particle size (nm) | ~150 | ~14.0 | ~250 |
| Coercive field (Oe) | 36 | 51 | 121 |
| Squareness ratio (%) | 9.2 | 17.6 | 23.6 |
Publisher’s Note: MDPI stays neutral with regard to jurisdictional claims in published maps and institutional affiliations. |
© 2022 by the authors. Licensee MDPI, Basel, Switzerland. This article is an open access article distributed under the terms and conditions of the Creative Commons Attribution (CC BY) license (https://creativecommons.org/licenses/by/4.0/).
Share and Cite
Cao Long, V.; Saraç, U.; Baykul, M.C.; Trong, L.D.; Ţălu, Ş.; Nguyen Trong, D. Electrochemical Deposition of Fe–Co–Ni Samples with Different Co Contents and Characterization of Their Microstructural and Magnetic Properties. Coatings 2022, 12, 346. https://doi.org/10.3390/coatings12030346
Cao Long V, Saraç U, Baykul MC, Trong LD, Ţălu Ş, Nguyen Trong D. Electrochemical Deposition of Fe–Co–Ni Samples with Different Co Contents and Characterization of Their Microstructural and Magnetic Properties. Coatings. 2022; 12(3):346. https://doi.org/10.3390/coatings12030346
Chicago/Turabian StyleCao Long, Van, Umut Saraç, Mevlana Celalettin Baykul, Luong Duong Trong, Ştefan Ţălu, and Dung Nguyen Trong. 2022. "Electrochemical Deposition of Fe–Co–Ni Samples with Different Co Contents and Characterization of Their Microstructural and Magnetic Properties" Coatings 12, no. 3: 346. https://doi.org/10.3390/coatings12030346