Article

Simultaneous Precipitation and Electrodeposition of Hydroxyapatite Coatings at Different Temperatures on Various Metal Substrates

by
Bogdan-Ovidiu Taranu
,
Paula Ianasi
,
Stefania Florina Rus
and
Alexandra Ioana Bucur
*
National Institute for Research and Development in Electrochemistry and Condensed Matter, Dr. A. Paunescu Podeanu Street, No. 144, 300569 Timisoara, Romania
*
Author to whom correspondence should be addressed.
Coatings 2022, 12(2), 288; https://doi.org/10.3390/coatings12020288
Submission received: 20 December 2021 / Revised: 14 February 2022 / Accepted: 18 February 2022 / Published: 21 February 2022
(This article belongs to the Special Issue Development of Hydroxyapatite Coatings)

Abstract

:
The coating of orthopedic and dental implants with hydroxyapatite (HA) is recognized as a method to increase their integration ability. A new metal coating method, comprising simultaneous precipitation and electrodeposition, is presented. Two studies are described: the first is related to the influence of time/temperature increase on the morpho-structural characteristics of the deposited layer on the Ti substrate, while the second study presents the characteristics of the layers deposited on different metal substrates. For comparison, specimens were obtained using the classical electrochemical deposition under the same experimental conditions. The addition of Ca to the electrolyte creates more compact and more uniform coatings, while the addition of P creates more porous layers. Only a very small quantity of crystalline HA deposited on the C55, Cu, and Ni substrates when the classic electrodeposition method was employed, while using the new approach has clearly led to a larger crystalline HA amount electrodeposited on the same types of metals. With some exceptions, the advantages of using the new method are: better crystallinity, more uniform and continuous surface, higher roughness, and potentially higher anti-corrosion capabilities.

Graphical Abstract

1. Introduction

Hydroxyapatite (HA) is a bioceramic calcium phosphate with the chemical formula Ca10(PO4)6(OH)2 and composition similar to that found in human bones and teeth. Its properties make it an outstanding biomaterial for the field of biological clinical medicine [1,2,3,4] including excellent bioactivity and biocompatibility, osteoconductivity, osteoinductivity as well as good corrosion resistance [5,6,7,8], and recommend it as one of the most promising ceramic materials for applications such as bone and teeth implants or drugs and gene delivery [9,10,11,12]. Unfortunately, HA is inherently a brittle mineral, possessing low tensile strength and fracture resistance, which implies that it cannot be used alone as an implant for load bearing applications [13,14]. In order to overcome this problem, HA and HA-based ceramic biomaterials need to be utilized together with reinforcing materials, metallic or polymeric [15].
The properties of HA make it an ideal material for coating on metal supports that are already being used in the medical field [16,17]. These metals, which are basically stainless steel, Ti, and Ti- and Co-based alloys [18,19], have found applications in orthopedics and dentistry due to their properties (such as corrosion and wear resistance), but with the caveat that they display a relatively low biocompatibility, which is why this property must be supplied to medical implants by the combination of metals with ceramics [18]. Another drawback consists in their poor bioactivity, and in this case, Ti implants can serve as an example. The protective titanium oxide that forms on their surface makes them biologically inert, while their high stiffness can make them fail to bond to the bone tissue [20,21,22]. As for stainless steel (316L), even though it is highly resistant to corrosion and has good biocompatibility, it is difficult for the bone tissue to develop on its surface [22,23].
As a consequence, both types of implant materials—HA and HA-based bioceramics on one hand, and the specified metals on the other—are inadequate when utilized individually. By using HA as a coating on the metal surfaces, hierarchical structures with improved properties can be manufactured. In this way, HA promotes the rapid osseointegration of the implants, improves the compositional stability that in turn prevents metal atom diffusion into the biological environment, increases the corrosion resistance by creating a protecting effect against the surrounding environment, and allows for application without the help of cementing materials [15,23,24,25,26,27,28]. The implant benefits not only from the properties of the HA layer, but also from the outstanding mechanical integrity of the metal support, its corrosion resistance, and the fact that it does not form toxic products in contact with the tissues and fluids of the host body [15,29,30].
The method used to obtain the HA coating on the surface of the metal support has a very important role in the implant manufacturing process. Plasma spraying is the standard technique used for this purpose [31], but its disadvantages such as the formation of amorphous phases due to high process temperatures, the difficulty of coating geometrically complex metal supports and the costs [32,33] have led to the development of alternative coating methods. Examples include the sol–gel and sol–gel dip coating method [24,34,35], the hydrothermal process [36,37], RF-magnetron sputtering [38], micro-arc oxidation [39], pulsed laser deposition [40], hot isostatic pressing [41], biomimetic deposition [42], high-velocity suspension flame spraying [43], gas detonation deposition [44], electrophoretic deposition [45], and electrochemical deposition [46,47].
The standard HA electrodeposition procedure is carried out in an aqueous electrolyte solution containing calcium and phosphate ions. The solution is electrified using a two-electrode system (for galvanostatic electrodeposition) or a three-electrode system (for potentiostatic electrodeposition) [1,48,49], and the electrode reactions that take place on the surface of the working electrode (the cathode) are well known [1,50,51]. A new electrochemical approach for the electrodeposition of HA coatings onto Ti supports has been described elsewhere [52]. According to this method, one of the two precursors (either the calcium or the phosphate precursor) is present in the electrolysis cell, while the other one is added dropwise, simultaneously with the application of an electrochemical potential. By alternating the addition order of the precursors as well as the deposition time, coatings that display a higher crystallinity compared to those obtained via standard electrodeposition can be obtained.
Herein, experiments that continue our previous investigations regarding HA coatings obtained using the new electrodeposition method are presented. These experiments are divided into two comparative studies: the first focuses on a comparison between HA electrodeposited at 80 and 90 °C on Ti supports, while the second compares HA coatings electrodeposited at 80 °C on different metal substrates. The specified previous investigations [52] proved that the novel approach has advantages over the standard method, the former being applied in the present case for an intermediate time period (2 h, compared with 1 and 4 h) and for a temperature increase of 10 degrees, taking into consideration the influence of time and/or temperature upon crystallization (among other factors). The control over the electrolyte ion (Ca2+ and PO43−) concentration is improved when only one precursor is initially present in solution and the second one is added gradually, hindering the increase in local supersaturation and providing a more uniform distribution of the concentration gradient over time.
One aim of the present studies consist of the comparison between coatings obtained on different substrates (other than Ti) when using the classical and the new method. Given the benefits of the new approach compared to standard electrodeposition on the Ti substrate, it was hypothesized that these also be applied to other metal substrates (such as copper, nickel, and stainless steel). Thus, new coatings were obtained using the two different approaches and were subsequently characterized and compared in terms of their morpho-structural properties in relation to the electrodeposition method as well as to the metal substrate type.

2. Materials and Methods

2.1. Materials and Reagents

The HA precursors were analytical grade calcium nitrate tetrahydrate Ca(NO3)2·4H2O (Sigma Aldrich, St. Louis, MO, USA) as a 1.75 mM solution and diammonium phosphate (NH4)2HPO4 (Merck, Kenilworth, NJ, USA) as a 1.05 mM solution. Titanium, copper, and nickel discs of 1 cm in diameter were cut from as-received pure metal plates/foils (Sigma Aldrich). Stainless steel (C55) discs of 1 cm in diameter were cut from a stainless steel rod with the following composition: 0.53−0.61% C, 0.44−0.45% Mn, 0.23−0.25% Si, max 0.01% S, max 0.01% P, max 0.03% Al, max 0.06% Cu, max 0.03% Cr, max 0.06% Ni, max 0.09% Mo, and the remainder being Fe (Mechel, Campia Turzii, Romania). Prior to the electrodeposition experiments, the discs were polished using a polishing setup employing SiC sandpaper of different grit sizes (800 and 1200), felt wetted with 0.05 μm colloidal silica/alumina solution, and the TwinPrep 5 grinder/polisher (Allied High Tech Products, Rancho Dominguez, CA, USA). Soap solution and double distilled water were used to wash the polished disks that were subsequently subjected to an ultrasonic treatment for 30 min in 50:50 ethanol/acetone mixture (ethanol and acetone were purchased from Chimreactiv, Bucuresti, Romania).

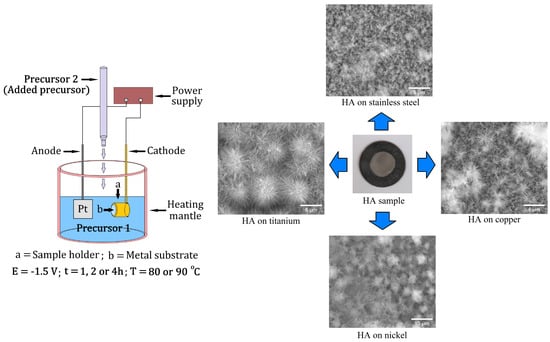
2.2. Electrochemical Deposition

The electrochemical ensemble consisted of a glass cell with heating mantle, a thermostat set at either 80 or 90 °C, a PGZ 402 potentiostat (Radiometer Analytical, Lyon, France) equipped with a Pt plate electrode (as anode, S = 0.8 cm2) and discs made of Ti, C55, Cu, and Ni, respectively (as cathode). The discs were inserted into a Teflon support (S = 0.28 cm2) and one of the subsequent two routes was followed:
I. Fifty mL of each precursor solution was placed inside the glass cell. The deposition process took place under stirring at a constant applied electrochemical potential (E = −1.5 V) while maintaining the thermostat temperature at 80 or 90 °C.
II. The deposition took place according to the novel method [52] with 50 mL of one precursor present in the electrolyte solution and the other being added dropwise (under stirring) from a total volume of 50 mL, simultaneously with the application of a −1.5 V potential (Scheme 1). The potential value and the thermostat temperature (of 80 or 90 °C) were kept constant throughout the experiment.
In the first study, Ti substrates were coated with HA deposited using the novel method at 80 and 90 °C for different periods of time (1, 2, and 4 h, respectively). The 80 °C temperature and −1.5 V electrochemical potential were selected in agreement with other studies [53,54,55]. The 90 °C temperature was chosen based on the fact that a higher synthesis temperature increases the crystallinity degree of the product [56]. In the second study, Ti, C55, Cu, and Ni substrates were coated with HA by deposition for 4 h at 80 °C using either the standard method or the novel method. The pH was kept around 7 for all specimens and at all times, using ammonia (Merck), in order to ensure a heterogeneous nucleation on the supports.
The electrodeposition strategies used to obtain the HA coated discs are presented in Table 1.

2.3. Physico-Chemical Characterization

For the first study, the HA coatings electrodeposited on Ti substrates were investigated using X-ray powder diffraction (XRD) and atomic force microscopy (AFM), while for the second study, the HA electrodeposition on different metal substrates was characterized by XRD, scanning electron microscopy (SEM), and AFM.
XRD patterns were obtained using an X’Pert Pro MPD Diffractometer with Cu anode and PIXcel detector (PANalytical, Almelo, The Netherlands) at working parameters of 45 kV and 30 mA. The XRD patterns were obtained after the samples were attached to metal holders with dough, and the holder rotated during the pattern recording. SEM micrographs were recorded in high vacuum using an Inspect S scanning electron microscope (FEI Company, Hillsboro, OR, USA) and AFM images were acquired utilizing a MultiView 2000 scanner (Nanonics Imaging Ltd., Jerusalem, Israel) in intermittent mode (radius tip = 20 nm).
Thickness measurements were performed using a laser confocal microscope Olympus OLS 4000 LEXT (Olympus Corporation, Tokyo, Japan) that could take high-resolution 3D images by acquiring successive pictures of the sample between two heights, then recombining the laser-recorded representations and color images to produce a 3D projection.

3. Results and Discussion

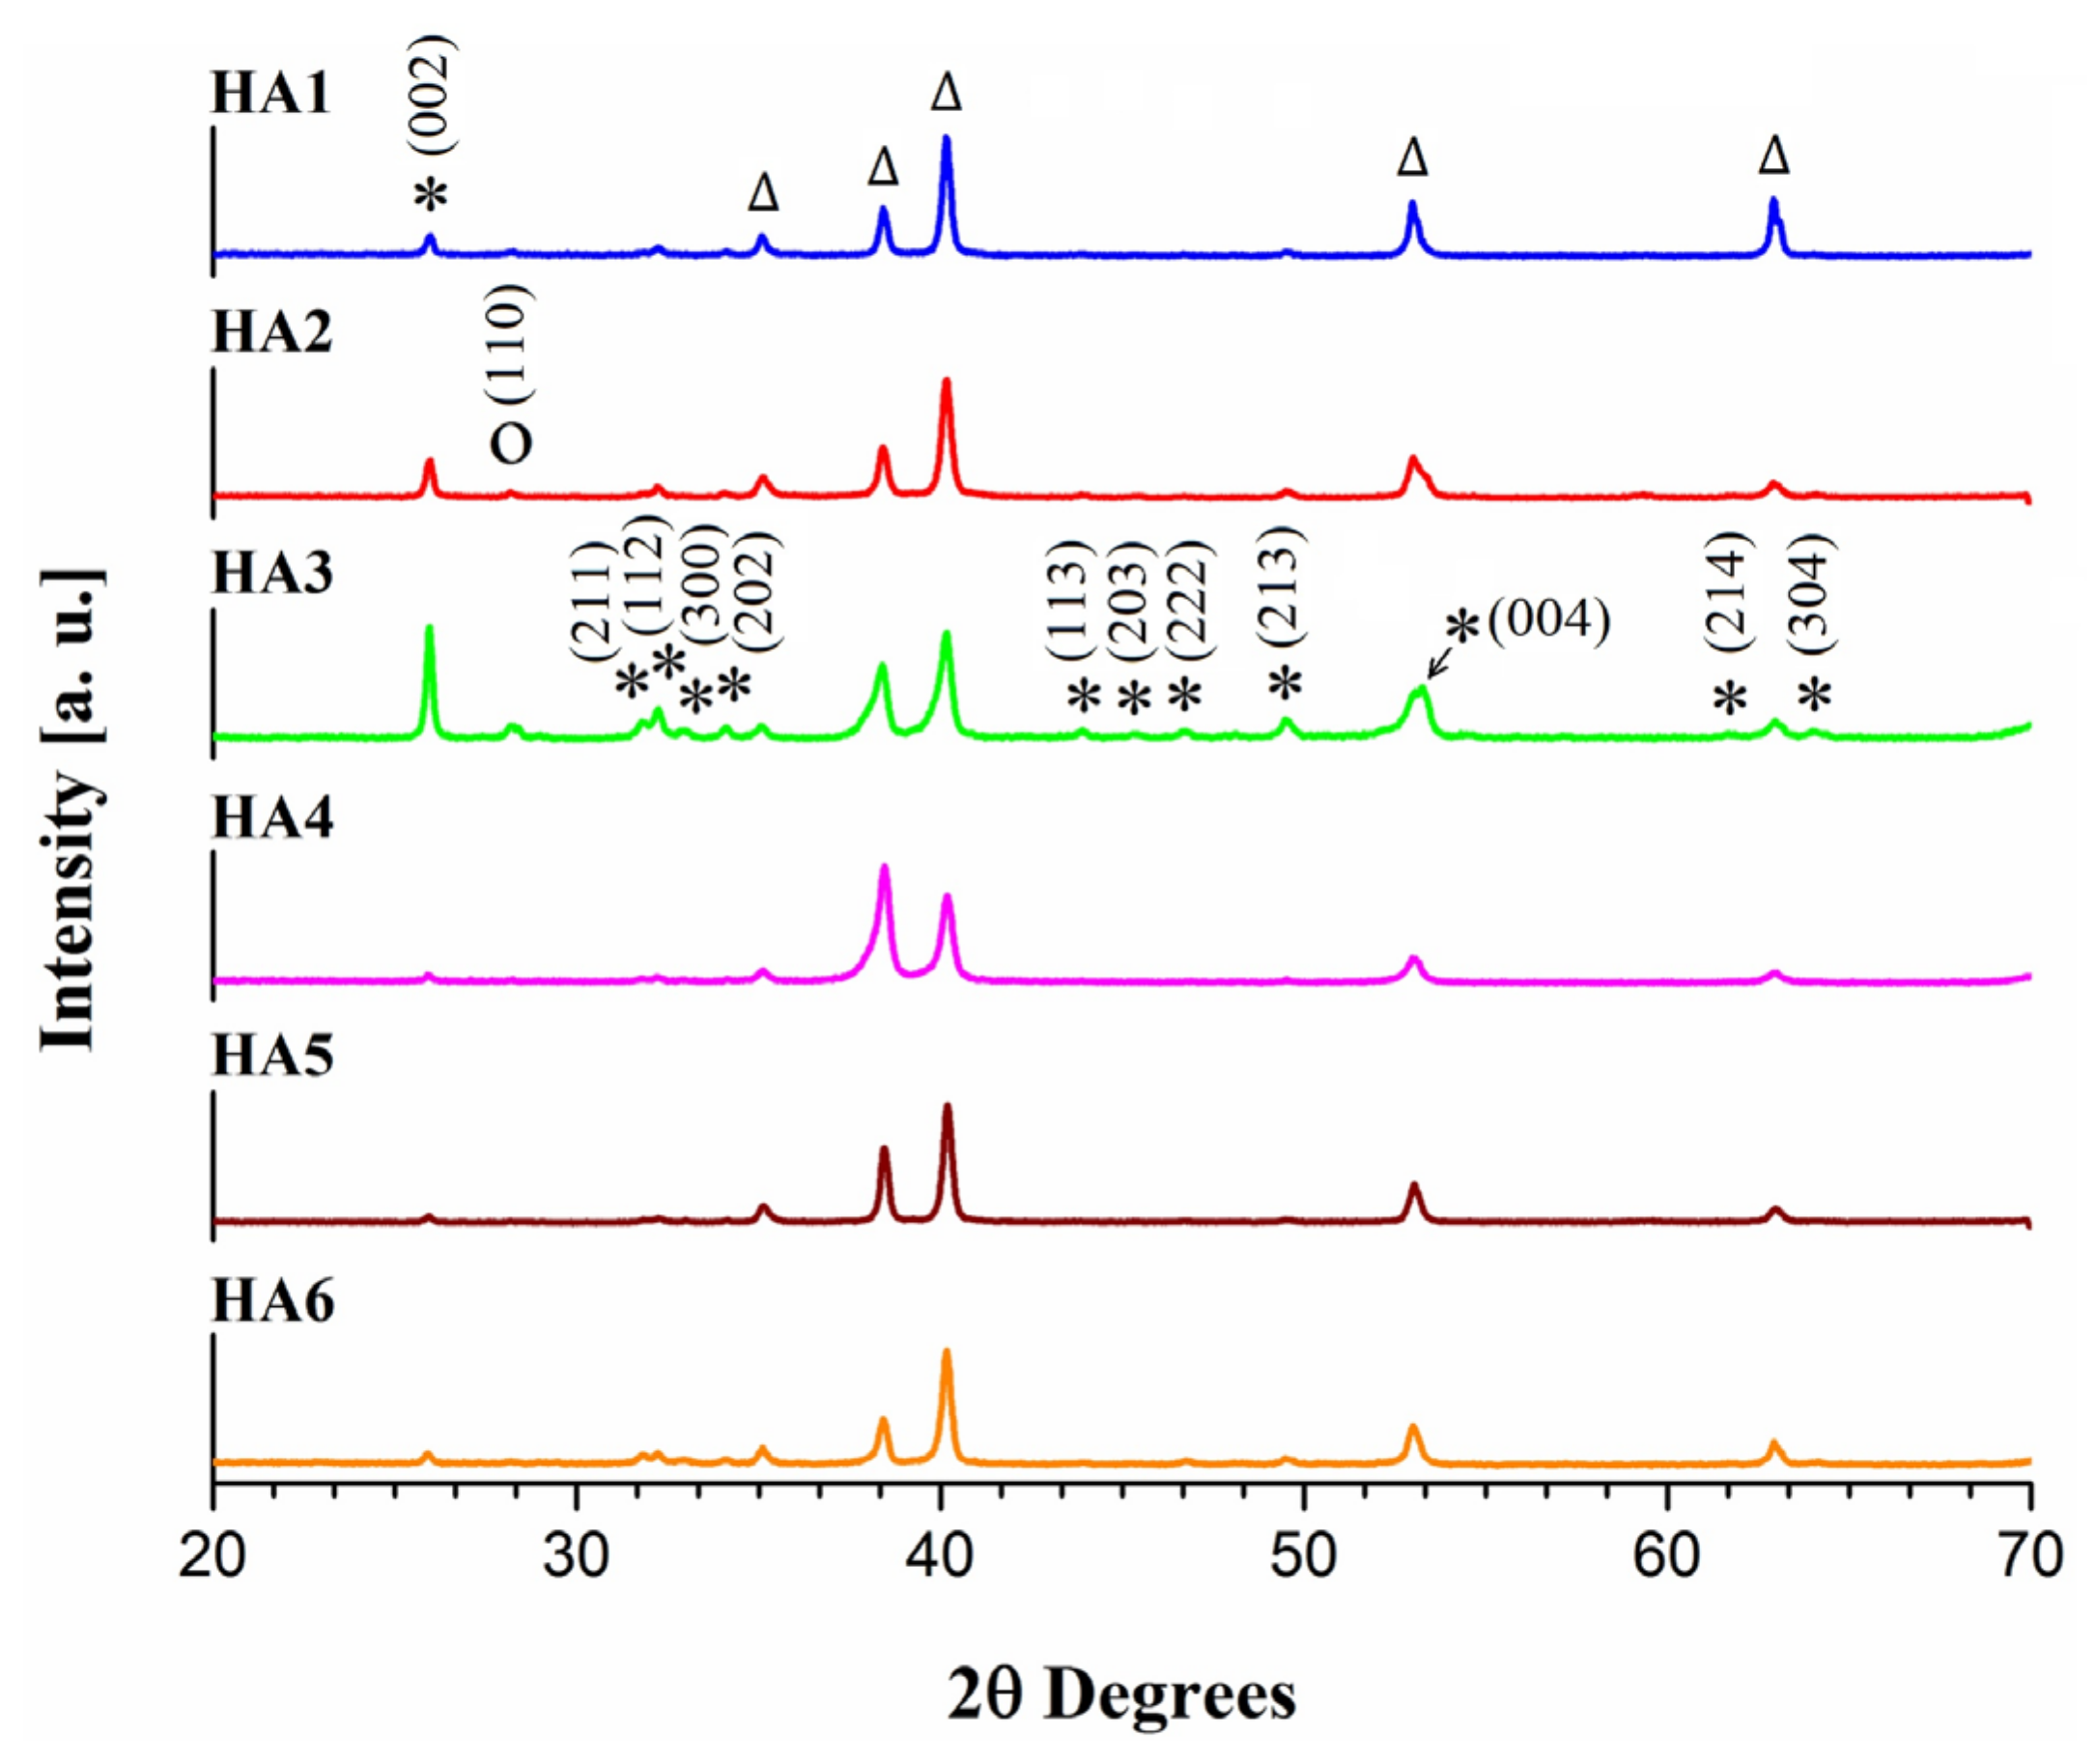
3.1. The First Comparative Study

The XRD patterns of the samples deposited at 80 °C are presented in Figure 1: the first three patterns are for Ca added to the electrolyte and the other three are for P added to the electrolyte.
The identification of the peaks revealed the presence of Ti and HA. The ascription made use of the ICDD file nos. 00-044-1294 for titanium and 01-086-0740 for HA, for all the studied samples.
In the HA3 and HA4 samples, the Ti peak at ~38° 2θ displayed an intensity higher than standard, which can be attributed to the formation of hexagonal TiO (ICDD file 00-012-0754), whose standard pattern presents the most intense peak at 37.5° 2θ. A second small reflection belonging to hexagonal TiO showed up in the same patterns at 52.9° 2θ. The peak at 28.1° 2θ may correspond to octacalcium phosphate (OCP), identified using the ICDD file 00-026-1056.
The peak at approx. 25.8° 2θ corresponds to the (002) crystallographic plane of HA. The expectation is that by adding Ca to the electrolyte solution (HA1-3) and increasing the deposition time (first three patterns in Figure 1), the HA crystals grow along the c crystallographic direction. The longest crystals should be achieved for a deposition time of 4 h, but the intensities of the HA main peaks were oddly distributed in this pattern. When P is added to the electrolyte solution (HA4-HA6), the ratio between the intensity of the peak at 25.8° 2θ and the HA main peaks (region 31.97–34.16° 2θ) decreased considerably. The expectation is of crystals of a more symmetrical shape. The parallel family of planes, (004), gives a reflection at 53.13° 2θ, but at the same time, there is a peak corresponding to the titanium substrate positioned at the approximate same 2θ value. The intensity of HA peaks was lower for the case of P being added to the electrolyte, which means that the crystallinity of this layer is poorer.
The crystallite size was calculated for the 002 line (the peak at 25.8 ± 0.5° 2θ) using the Debye–Scherrer equation [57,58,59]:
X s = K λ Β c o s θ
In this equation, Xs is the crystallite size in nm; K is a constant with the value 0.9; λ is the Cu Kα wavelength, 1.5418 nm; Β is the full width at half maximum (FWHM) of the considered diffraction signal; and θ is the diffraction angle in radians.
The size of the crystalline domains (Table 2) had similar values for all the samples deposited at 80 °C, without being significantly influenced by precursor addition order or by electrodeposition time.
Regarding the time influence on the result of the electrodeposition, the samples deposited during 4 h (regardless of which ion is added to the electrolyte) were more crystalline, which recommends the use of this parameter value for future experiments at 80 °C. For the sample deposited during 4 h where P was added to the electrolyte, there was a good resolution observed for the main HA peaks (region 31.97–34.16° 2θ) and a distribution of the intensities according to standard patterns.
The highest intensity of the 32.25° 2θ peak was for the sample deposited by adding Ca during 4 h, and represents the reflection given by the (112) family of crystallographic planes, presumed as terminating the long dimension of the crystals [56]. This may be a measure of the number of crystals with the (112) terminating plane, meaning a larger number of long crystals for the mentioned case.
The intensity of the peak given by the (300) family of planes was very low in all cases.
Some SEM images of the specimens obtained by deposition during 2 h at 80 °C are presented in Figure 2 (the SEM images recorded for samples resulted after 1 h and 4 h deposition times are presented in [52]). In the experiments performed thus far, coherence was noticed for the samples obtained by adding Ca to the electrolyte regarding the fact that HA nucleated as islands on the substrate, followed by new HA crystals covering these islands (circle marks in Figure 2a) and the substrate that was not coated by islands (square marks in Figure 2a). As the electrolyte solution was supplemented with precursor ions, new nucleation centers were created, which led to the growth of new crystals over the primary isolated formations and base layer. The crystals were submicrometric in size and acicular in shape, grown along the c direction (according to XRD). When P was added to the electrolyte, hemispherical formations of acicular HA crystals appeared from place to place, then grew with the deposition time not as much in size, but more in number (the c-direction growth was much reduced, according the XRD). The trend is that they do not cover the substrate completely, but form more of a porous structure (circle marks in Figure 2b). The assumption is that the formation of a large number of small crystals is favored by the low supersaturation of the electrolyte solution given by the experimental methodology, and the continuous addition of fresh precursor solution stimulates the formation of new nuclei.
The XRD patterns of the samples deposited at 90 °C are presented in Figure 3: the first three patterns are for Ca added to the electrolyte and the other three are for the P addition. The patterns of the samples deposited at 90 °C contained peaks belonging to Ti and HA, as previously identified by the same ICDD files. Ti peaks intensity decreased (counts/s value) along with an increase in deposition time, regardless of which ion was added to the electrolyte. When deposition was achieved at 80 °C, the intensity of the Ti peaks did not have a similar behavior; the intensity increased or decreased without a coherent pattern. This behavior is due to the fact that the deposited layer at 80 °C is not continuous and the substrate is unequally exposed to X-rays, while for the layers deposited at 90 °C, the decrease in the substrate reflections intensity may indicate that the titanium is more uniformly covered by HA. This phenomenon was more visible for the case of Ca addition.
For the series where Ca was added to the electrolyte at 90 °C, an initial increase in the HA crystallinity was observed when the deposition time increased from 1 to 2 h, then this parameter decreased, with the exception of the peaks representing reflections from the (00x) family of planes, equivalent to the c direction growth. The crystallite size (Table 2) also grew with the deposition time from 2 to 4 h.
The same behavior could be observed when P was added to the electrolyte: first an increase in crystallinity with a time increase from 1 to 2 h, then a decrease in crystallinity when time increased from 2 to 4 h. Compared to the case of Ca addition, this time, the preferential c-direction growth decreased considerably from 2 h deposition to 4 h deposition. The crystallite size along the c direction also followed this pattern (Table 2).
Together with the decrease in the c-direction peaks, it is interesting to note the decrease in intensity of the peak at 32.2° 2θ, assigned to the (112) family of planes, which are presumed to terminate the long dimension of the crystals [56]. This may indicate a decrease in the number of crystals with free terminal (112) planes, meaning that more crystals may be bound at/through their endings. There was a peak at 28.1° 2θ, identified as possibly belonging to octacalcium phosphate Ca8H2(PO4)6.5H2O (ICDD file no. 00-026-1056), which grew in all of the samples prepared at 90 °C.
All of the samples deposited at 90 °C presented a better crystallinity compared to the ones obtained at 80 °C, while all the samples deposited by adding Ca to the electrolyte presented a preferential growth along the c direction.
As seen in the SEM images presented in Figure 4, the aspect of the deposited layer resembled glass wool for both samples. For the samples deposited for 4 h by adding P (Figure 4b), the increase in temperature from 80 to 90 °C led to the enhanced preferential growth along the c direction and formation of long (few micrometers) needle-like crystals grouped in spherically-shaped arrangements, without preserving the previous feathery aspect obtained for samples deposited at 80 °C for 4 h (see [52]). The XRD patterns did not display changes for the P-added samples (4 h deposition time) when the deposition temperature increased from 80 to 90 °C.
Thickness measurements were performed for each sample in three different areas and the results are presented in Table 3 as mean values with standard deviation. Some of the recorded micrographs are presented in Figure S1 from the Supplementary Materials.
For the specimens deposited at 80 °C, a decreasing trend in the thickness value with deposition time could be observed when the Ca precursor was added to the electrolyte, while an increase in this parameter appeared for the P precursor. This probably occurred because the coatings created by adding Ca are more compact and the coatings created adding P are more porous, phenomena that intensify with an increase in the deposition time (as seen from the SEM micrographs). At 90 °C, no coherent behavior regarding the thickness variation with deposition time was identifiable.
The 5 µm × 5 µm 2D and 3D AFM micrographs recorded on the six specimens obtained at 80 °C using the novel electrodeposition method are presented in Figure 5, while those scanned on the six samples deposited at 90 °C using the same method are displayed in Figure 6. Table S1 (see the Supplementary Materials) shows the average values (from three different areas scanned on each specimen), together with their standard deviations, for the following AFM parameters: the roughness average (Sa), the root mean square roughness (Sq), the maximum peak height (Sp), the maximum valley depth (Sv), the maximum peak to valley height (Sy), the surface kurtosis (Sku), and the surface skewness (Ssk) [60,61].
Based on Figure 5a–f, recorded on the HA1–HA3 samples, the following observations can be made: after a 1 h deposition time (Figure 5a,b), the surface of the Ti substrate was covered with clusters of elongated including acicular structures that, from a 2D perspective, resemble cotton bundles. Larger formations were evidenced after 2 h (Figure 5c,d), which had an irregular shape and came into contact with submicrometric squared and round structures. After a deposition time of 4 h, submicrometric hemispherical formations of different heights covered the metal substrate. By varying the duration of the electrodeposition process, the crystal sizes and shapes of the HA structures covering the Ti disks also varied.
Along with the increase in deposition time, it appeared that the deposited layers underwent recrystallization and formation of a more uniform layer, without the crevasses observed in Figure 5a. The size of the clusters became smaller and their number increased, while acicular crystals grew and agglomerated.
In the case of samples HA4–HA6, deposited under the same conditions but with P precursor added to the electrolyte, the recorded micrographs (Figure 5g–l) revealed the following: elongated formations incorporating small round structures can be seen in Figure 5g,h, as obtained for the HA4 sample (1 h electrodeposition time). Larger elongated structures in contact with smaller ones bearing various shapes were observed for the sample after a 2 h deposition time (HA5), while the smallest formations with elongated and hemispherical shapes are displayed in Figure 5k,l. These latter formations appeared after a 4 h deposition time and belonged to specimen HA6.
There were differences between the situations when Ca or P was added to the electrolyte (HA1–HA3 on one hand, and HA4–HA6 on the other), but also similarities, among which an obvious one is that in both cases, the largest HA structures were obtained when the deposition time was 2 h, while the smallest formations resulted after a 4 h deposition time.
By focusing on the micrographs recorded on the HA7–HA9 specimens deposited at 90 °C by gradually adding the Ca precursor, several observations can be outlined. The aggregates that resulted after deposition times of 1 h Figure 6a,b) and 2 h (Figure 6c,d) had very similar shapes, the exception being the size of the structures—smaller aggregates were observed for sample HA7. In the case of specimen HA9 (Figure 6e,f) the shape of the observed formations was different. Judging by the 2D images, the evolution of this series was from small rounded structures (1 h) to larger rounded aggregates (2 h) and a second layer of round particles added on top of the larger ones (4 h). Looking at the 3D images, an elongation of the particles in the z direction was visible when the time increased from 2 to 4 h, in agreement with the XRD results.
Similar situations were seen for samples HA10–HA12, resulting after deposition times of 1, 2, and 4 h at 90 °C, but from electrolyte solutions obtained by the dropwise addition of P. The micrographs in Figure 6g,h displayed similar formations to those outlined in Figure 6i,j, but the structures belonging to sample HA10 appeared to be overlapping to a greater extent than the ones from HA11. Finally, Figure 6k,l—obtained on the HA12 specimen—presented large aggregates in contact with smaller ones having a grain-like shape.
For both sample sets (HA7–HA9 and HA10–HA12), increasing the electrodeposition time from 1 to 2 h did not lead to significant morphological differences, but this situation was different when the deposition time reached 4 h.
By comparing the mean values of the AFM parameters calculated for the HA1, HA2, and HA3 specimens, the following observations could be made: in the case of the Sa and Sq parameters, the highest values were those for the HA2 sample, followed by HA3 and HA1, respectively. Since a higher surface roughness is desired for implants because it indicates a larger contact surface between the coating and the bone tissue [62], it can be concluded that HA2 satisfies this property to a higher degree than the other two samples. The calculated absolute mean values for the Sp, Sv, and Sy parameters showed that the same relationship between the three samples was preserved. For all three samples, the calculated Sku mean values were >3, which suggests spiky surfaces, while the mean Ssk values were >0, indicating that the profile of the samples was skewed downward relative to the mean plane. In other words, there was a predominance of peaks.
In the case of the samples that resulted after adding the P precursor over the Ca precursor and applying the fixed electrochemical potential at 80 °C for different periods of time, the calculated mean values for the Sa and Sq parameters were close in the case of HA4 and HA6, while the highest values were obtained for HA5. The absolute values calculated for HA5 in case of the Sp, Sv, and Sy parameters were also higher than those obtained for HA4 and HA6. The Sku mean values were <3 for HA4 (which indicates bumpy surfaces) and >3 for HA5 and HA6, suggesting that the sample surfaces were spiky. Finally, the Ssk mean values are <0 in the case of the HA4 and HA5 samples, indicating that their profiles are skewed upwards relative to the mean plane (there is a predominance of valleys), and >0 in the case of HA6, pointing to a predominance of peaks.
The mean values calculated for the AFM parameters in the case of the HA7, HA8, and HA9 samples allow for several observations. Thus, in the case of the Sa and Sq parameters, the highest values were obtained for the HA8 sample, followed by those calculated for HA7 and HA9, respectively. The same situation was observed when considering the absolute values obtained for the Sp, Sv, and Sy parameters. As for the Sku mean values shown in Table S1, it can be seen that for all three samples, these were >3, indicating that they had spiky surfaces. The calculated Ssk mean value for HA7 was ~0, suggesting that the profile was symmetric relative to the mean plane; for HA8 it was <0, implying a predominance of valleys and for HA9, it was >0, pointing to a predominance of peaks.
Finally, based on the calculated mean values for the AFM parameters of the HA10, HA11, and HA12 samples, the following can be said: in the case of HA10 and HA12, the calculated values for the Sa and Sq parameters were very close, while those obtained for the HA11 sample were relatively higher. The absolute mean values (observed in Table S1) for the Sp, Sv, and Sy parameters were also higher for the HA11 sample and, for all samples, the mean values for the Sku parameter were >3, suggesting that the surfaces of the samples were spiky. As for the Ssk parameter, a value of ~0 was calculated for HA10, and values >0 and <0 were obtained for HA11 and HA12, respectively. Thus, for HA10, the profile was symmetric relative to the mean plane; for HA11, it is skewed downward relative to the mean plane and for HA12, it was skewed upward relative to the mean plane.
A comparison between the samples of HA that resulted by electrodeposition from solutions in which the Ca precursor was gradually added at 80 °C and those obtained at 90 °C revealed that the samples with the highest surface roughness of the coating were those that resulted after a 2 h deposition time (HA2 and HA8). Furthermore, between these two samples, the highest roughness corresponded to the HA2 sample. As previously specified, the higher the surface roughness of a coating, the larger the contact surface between that coating and the bone tissue becomes [1].
A comparison between the samples deposited at 80 and 90 °C when the P precursor was added to the electrolyte showed that the samples with the roughest surface were the ones obtained after a 2 h deposition time (HA5 and HA11) and of these, the surface of HA5 displayed the highest roughness.
Finally, by comparing the roughness parameter mean values corresponding to the HA2 and HA5 samples, it can be seen that the Sa and Sq parameters were very close, but in the case of the Sp, Sv, and Sy parameters, the calculated absolute values were higher for HA2. This indicates that a lower crystallinity is favorable for biointegration [55,63].

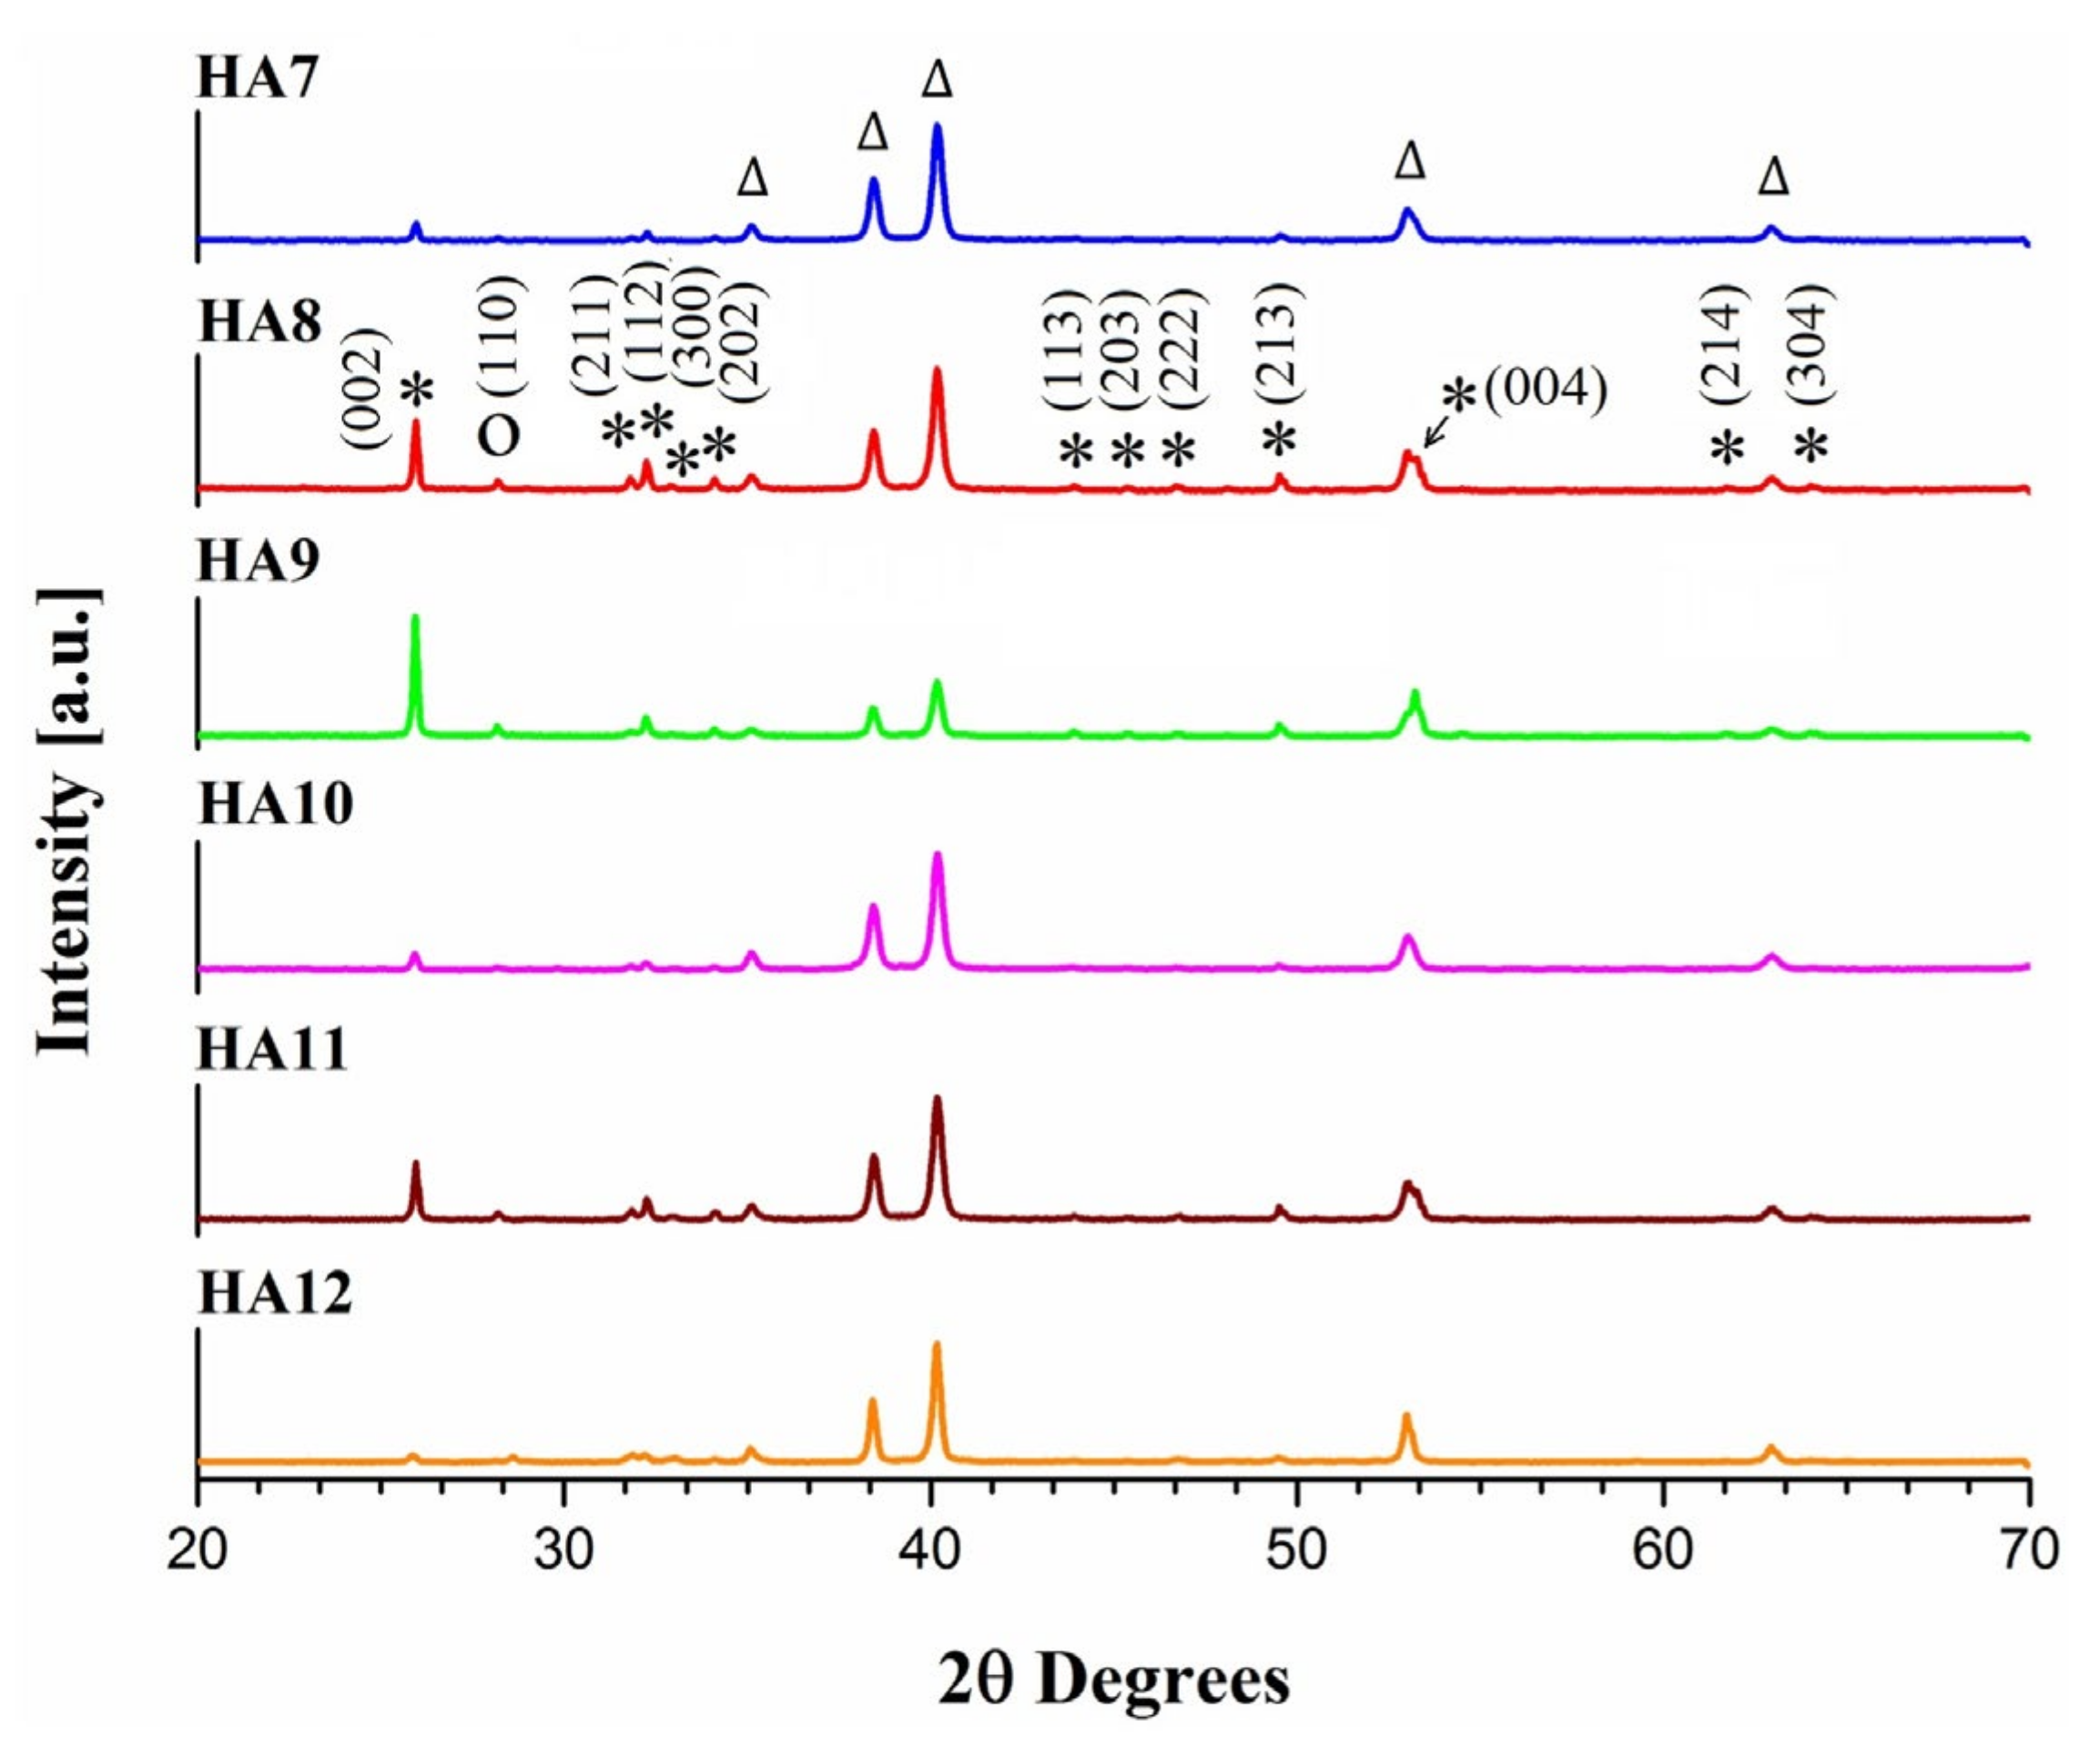
3.2. The Second Comparative Study

Both the standard and the novel method were employed to electrodeposit HA coatings on the surface of different metallic substrates (Ti, C55 stainless steel, Cu, and Ni). The purpose of the study was to perform the morpho-structural characterization of the deposited layers and to discuss the influence of each type of metal substrate. The deposition time of 4 h and the deposition temperature of 80 °C were used to obtain all samples, regardless of the deposition method. When the novel deposition method was employed, the Ca precursor was the second added precursor because this choice led to better results. These electrodeposition conditions were selected based on our previous work [52], which outlined the following: the HA layers deposited with the novel method for longer time displayed higher crystallinity, which increases the chemical and corrosion resistance. The addition of the Ca precursor solution over the P precursor solution during the electrodeposition process led to HA coatings that gave the smallest errors at the tensile tests and displayed the most congruent and stable behavior regarding the electrodeposition procedure.
Except for pure Ti substrates, which are being utilized in biomedical applications [64], the other selected metal supports are not being used as such, and, as the scientific literature reveals, there are very few studies—some of them are summarized in the Supplementary Materials, together with additional literature data [15,65,66,67,68,69,70,71,72,73,74,75,76,77,78,79,80,81,82]—regarding their utility as substrates for hydroxyapatite coatings electrodeposited via the standard method.
In the absence of significantly relevant investigations performed on HA coatings electrodeposited on C55 stainless steel, Cu, and Ni substrates, the following comparative study has a high novelty degree. However, since these substrates are not suitable for biomedical applications, the purpose of the study is to outline their influence on the characteristics of the electrodeposited HA.
The XRD patterns of the samples HA13-HA19 are presented in Figure 7 (the patterns are presented only for the range of interest). The patterns presented few peaks, all of the present reflections belonging to either HA or substrate; the only exception is when Cu was used as the substrate and the electrolyte contained both Ca and P ions when the deposited layer consists in octacalcium phosphate and HA. For the Ti substrate, the overall crystallinity of the deposited HA layer was slightly better when the electrolyte contained both Ca and P ions. The specimen obtained by adding Ca to the electrolyte presented a preferential growth along the c-direction, in agreement with previous results [52].
When the substrate was C55, the XRD showed no reflections of a deposited layer (if it exists, it is amorphous) for the electrolyte containing both ions, and a crystalline product was present when Ca was added to the electrolyte, with preferential growth of HA along the c direction. When the Cu substrate was used and the electrolyte contained Ca and P ions, the deposited layer showed no reflections other than those coming from the metal substrate compared to the case when Ca was added to the electrolyte and the same substrate was used when only HA was present and the preferential growth along c was again evidenced. The situation obtained using the Ni substrate was the same as when C55 was used. A visible intensity response for the HA peaks was given by the specimens deposited using the novel method, regardless of the nature of the substrate used (C55 or Ni), while for the depositions made on the same substrates using electrolytes that contained both ions, XRD peaks were not visible. The important conclusion of these experiments is that only a very small quantity of crystalline HA was deposited on the C55, Cu, and Ni substrates when the classic electrodeposition method was used. On the other hand, using the new approach clearly led to a larger crystalline HA amount electrodeposited on the same types of metals. Thus, with the exception of the Ti substrate, there was a lack of coherence between the results obtained when using the two electrodeposition methods, which recommends the new method as a way of successfully depositing HA on Ni, Cu, and C55 stainless steel.
In the case of specimens deposited on Ti, the c-direction preferential growth, which was more intense when Ca is added to the electrolyte, was accompanied by an increase in the intensity of the 112 plane reflection (2θ = 32.2°), supposed to belong to the terminal edges of the long crystals [56].
Crystallite size was calculated using the Debye–Scherrer equation for the 002 line of HA, except for samples HA14, HA16, and HA18, where peaks were too small/non-existent. Given the similar values of the crystallite sizes (Table 4), this parameter was not influenced by the substrate nature.
SEM images recorded on the samples that are the focus of the second comparative study are presented in Figure 8. In the case of the HA samples deposited on Ti by the two strategies, the difference, as seen in the SEM (Figure 8a,b) was that the HA crystals were smaller and more numerous when both Ca and P were present in the electrolyte, and long crystals (1−2 µm) in the shape of blades grouped in spherical arrangements when Ca was added to the electrolyte while the electrochemical potential was applied. In the first case, the crystals also grouped in a spherical arrangement, but all the spheres were interconnected and formed an aggregate that was more compact and offered a highly uneven surface of the deposited layer, while in the second case, the deposited layer comprised spherical arrangements with a higher independence degree, which formed a more porous aggregate with an even surface distribution.
When the support was C55 and both ions were present from the start in the solution (Figure 8c), the deposited layer was amorphous, according to XRD data. HA must have precipitated without crystallization compared to the case when the same support was used and the solution contained only P at the start (Figure 8d), where star-shaped aggregates of needle-like submicrometric HA crystals led to a uniformly deposited layer.
For the HA16 sample, XRD data showed the presence of both OCP (octacalcium phosphate) and HA. The deposited layer of this sample, presented in Figure 8e, consists in a base layer with an ambiguous morphology and a discontinuous top layer consisting of clusters of very small needle-like crystals, grouped in a cauliflower arrangement. Since OCP is a precursor in the HA synthesis [83], the base layer is probably made up of OCP, which appeared first, and the small crystals represent HA, which grew slowly at the expense of OCP recrystallization. The other situation, where Cu was used as substrate, led to the formation of star-like aggregates of micrometric needle-like HA crystals (Figure 8f). The deposited layer was uniform and continuous. Rather than evolving into more dense spheres along with Ca intake, these star-like arrangements maintained a reduced number of component crystals and grew their own number.
According to XRD analysis, the sample HA18 contained Ni and HA, the latter weakly crystallized. The SEM image recorded on this specimen (Figure 8g) outlined a non-uniform cauliflower-type structure, which grew preferentially perpendicular to the surface of the substrate. The main units consist of submicrometric acicular crystals grouped in hemispherical arrangements. Better results were obtained when Ca was not present from the start in the electrolyte (Figure 8h), when a better crystallized layer could be observed, but which was less uniform compared to the case of using a different substrate. Arrangements of long crystals formed a compact shape, having a central connection point (resembling a sphere) and the connection with the neighboring spheres was made by the tips of the component crystals. Small particles were placed on these spherical arrangements, presumably precipitated particles and this structure seemed to have a higher porosity.
All the layers deposited using the new approach were uniform and continuous compared to classically deposited layers, regardless of the type of support that was used. These results are in agreement with the corresponding XRD patterns as well as with the data obtained in the previous studies [52].
Thickness measurements were performed and the results are presented in Table 5 as mean values of three determinations, together with the standard deviation. Some of the recorded micrographs are shown in Figure S2 in the Supplementary Materials.
The HA layer thickness decreased when switching from using the classic electrodeposition to the new deposition method for C55 and Ni substrates, while for Cu and Ti, the thickness grew when the new method was employed. A correlation could not be established between the calculated thickness values, but it is likely that the different substrate types influenced the experimental results. The 2D and 3D AFM images recorded on the eight samples obtained using different metal substrates (Ti, C55 stainless steel, Cu, and Ni) and either the standard HA electrodeposition method (specimens HA13, HA14, HA16, and HA18) or the novel method (specimens HA3, HA15, HA17, HA19) are presented in Figure 9. Table S2 (see Supplementary Materials) outlines the average values calculated using data gathered from three different areas corresponding to each of these samples for the Sa, Sq, Sp, Sv, Sy, Sku, and Ssk AFM parameters.
The AFM images obtained on the specimens electrodeposited on different metal substrates and using the two different deposition methods support the observations extracted from the SEM images, in the sense that there were clear differences between the formed structures when the two procedures were employed.
Thus, on the Ti support, smaller structures forming an uneven surface were obtained using the standard deposition method (Figure 9a,b), while the novel method led to larger, more evenly distributed aggregates (Figure 9c,d).
On the C55 support, hemispherical structures could be observed when the standard deposition method was used (Figure 9e,f), but a quite different morphology represented by submicrometric aggregates and a more evenly deposited layer were outlined when the novel method was employed.
Large aggregates were identified on the HA16 sample (Figure 9i,j) obtained on the Cu support using the standard method, while many smaller, stellar aggregates were formed on the surface of the HA17 sample (Figure 9k,l). The layer resulted in the Cu support when using the novel method was uniform and continuous, in contrast to the one observed on HA16.
Morphological differences were also observed for the HA18 (Figure 9m,n) and HA19 (Figure 9o,p) samples. Thus, when the standard electrodeposition method was applied, large aggregates comprised of smaller structures covered the specimen’s surface, but when the novel method was used, a more uniform layer was evidenced, consisting of spherical structures in contact with each other.
The general conclusion that can be drawn based on the AFM micrographs is that the deposited layers obtained with the novel method were more uniform and continuous than those that resulted when the standard procedure was employed. This conclusion is the same as the one reached after the SEM investigation.
Before presenting the average values of the AFM parameters calculated based on data acquired from different areas of each sample, it should be noted that the observations derived from the comparison between the micrographs recorded on the HA samples electrodeposited on the Ti substrate using the standard method and those obtained with the novel method can be supplemented with data from the AFM images presented in the literature studies, which were recorded on HA coatings electrodeposited on the same type of substrate. Furthermore, while no AFM analyses of HA electrodeposited on copper and nickel substrates have been found in the scientific literature, such characterizations have been reported in the case of HA covered stainless steel supports, albeit of a different type than C55.
By comparing sample HA13 with HA3, it can be seen that the calculated mean values were close to each other in the case of the Sa, Sq, and Sv parameters, while in the case of the Sp parameter, the obtained value was higher for HA13. The Sku and Ssk mean values indicate that the surface of both samples was spiky and their profiles were skewed downward relative to the mean plane.
The relative similarity between the mean values calculated for HA13 and HA3 was not observed when comparing the HA14 and HA15 samples. The absolute values obtained for the Sa, Sq, Sp, Sv, and Sy parameters were higher in the case of HA14. The Sku values indicate that the surfaces of both samples were spiky, but while the Ssk value for HA14 implies a predominance of valleys, the one calculated for HA15 points to a predominance of peaks.
The same situation was observed when comparing HA16 with HA17 in terms of the mean values calculated for the roughness parameters specified in Table S2. Finally, in the case of HA18 and HA19, while the same situation was once again observed, it should be noted that the mean values for the Sa, Sq, Sp, Sv, and Sy parameters were closer between the two samples than they were between HA14 and HA15, and between HA16 and HA17, respectively.
If the focus was only on the samples obtained when both precursors were present in the electrolyte solution at the beginning of the HA deposition process, then the samples with the highest surface roughness of the coating were HA14 and HA16 (in fact, these two specimens presented the highest surface roughness out of all the samples presented in Table S2). Of course, while this feature makes orthopedic implants that possess it more advantageous, it must be pointed out that such a benefit would be significantly outweighed by the low corrosion resistance of copper and the C55 stainless steel.
A comparison between the samples obtained from electrolyte solutions in which the Ca precursor was added dropwise on top of the P precursor during the electrodeposition process shows that the specimen with the overall highest surface roughness of the coating was HA19. Unfortunately, Ni is not among the metals that have found application in the fields of orthopedics and dentistry due to their unsuitable properties [64], but new applications for these hybrid structures may be discovered.

4. Conclusions

The results of our study show that all the layers deposited using the new approach were more uniform and continuous compared to classically deposited layers. All the samples deposited at 90 °C presented a better crystallinity compared to the samples deposited at 80 °C, while all the samples deposited by adding Ca to the electrolyte presented a preferential growth along the c-direction and acicular morphology (enhanced by temperature growth). The addition of Ca created more compact and more uniform coatings, while the addition of P created more porous layers. Best results were obtained by adding Ca at 90 °C on the Ti substrate, when the intensity of the XRD peaks decreased for the substrate, indicating the growth in thickness of the deposited layers and the potential for anti-corrosion applications. The XRD pattern characteristics did not change for the P-added samples when the deposition temperature increased from 80 to 90 °C. In terms of the parameter mean values calculated from the AFM data for the first study, the conclusion is that the HA coated Ti sample obtained by adding the Ca precursor over the P precursor at 80 °C for 2 h had the highest surface roughness.
As for the second study, only a very small quantity of crystalline HA was deposited on the C55, Cu, and Ni substrates when the classic electrodeposition method was employed while using the new approach clearly led to a larger amount of crystalline HA electrodeposited on the same types of metals. The samples obtained using the standard HA electrodeposition procedure (for 4 h at 80 °C) displayed the highest surface roughness of the coating, especially when the metal substrate was copper and C55 stainless steel, while more uniform and continuous surfaces of the samples were obtained when the novel method and different metal substrates were employed.

Supplementary Materials

The following supporting information can be downloaded at: https://www.mdpi.com/article/10.3390/coatings12020288/s1, The supplementary file contains: In brief, literature data regarding the electrodeposition of HA on various metal substrates; examples of AFM investigations of HA coatings on titanium and stainless steel; Figure S1: Selected micrographs recorded during the laser microscopy analysis of the HA1-HA12 samples; Table S1: Mean values obtained from AFM surface analysis of the HA1–HA12 specimens; Figure S2: Selected micrographs recorded during the laser microscopy analysis of the HA13–HA19 samples; Table S2: Mean values obtained from AFM surface analysis of the HA3 and HA13–HA19 specimens.

Author Contributions

Conceptualization, B.-O.T. and A.I.B.; Methodology, B.-O.T., A.I.B. and P.I.; Validation, B.-O.T., A.I.B. and P.I.; Investigation, B.-O.T., A.I.B., S.F.R. and P.I.; Resources, B.-O.T., A.I.B. and P.I.; Data curation, B.-O.T., A.I.B., S.F.R. and P.I.; Writing—original draft preparation, B.-O.T. and A.I.B.; Writing—review & editing, B.-O.T. and A.I.B.; Visualization, B.-O.T. and A.I.B.; Project administration, B.-O.T. and A.I.B. All authors have read and agreed to the published version of the manuscript.

Funding

This work was supported by the National Program NUCLEU, Project Code PN 19 22 01 01, Contract No. 40N/2019.

Institutional Review Board Statement

Not applicable.

Informed Consent Statement

Not applicable.

Data Availability Statement

Not applicable.

Conflicts of Interest

The authors declare no conflict of interest.

References

  1. Li, T.T.; Ling, L.; Lin, M.C.; Peng, H.K.; Ren, H.T.; Lou, C.W.; Lin, J.H. Recent advances in multifunctional hydroxyapatite coating by electrochemical deposition. J. Mater. Sci. 2020, 55, 6352–6374. [Google Scholar] [CrossRef]
  2. Alizadeh-Osgouei, M.; Li, Y.; Wen, C. A comprehensive review of biodegradable synthetic polymer-ceramic composites and their manufacture for biomedical applications. Bioact. Mater. 2019, 4, 22–36. [Google Scholar] [CrossRef]
  3. Li, Z.; Chu, D.; Gao, Y.; Jin, L.; Zhang, X.; Cui, W.; Li, J. Biomimicry, biomineralization, and bioregeneration of bone using advanced three-dimensional fibrous hydroxyapatite scaffold. Mater. Today Adv. 2019, 3, 100014. [Google Scholar] [CrossRef]
  4. Sattar, T.; Manzoor, T.; Khalid, F.A.; Akmal, M.; Saeed, G. Improved in vitro bioactivity and electrochemical behavior of hydroxyapatite-coated NiTi shape memory alloy. J. Mater. Sci. 2019, 54, 7300–7306. [Google Scholar] [CrossRef]
  5. Woodard, J.R.; Hilldore, A.J.; Lan, S.K.; Park, C.J.; Morgan, A.W.; Eurell, J.A.C.; Clark, S.G.; Wheeler, M.B.; Jamison, R.D.; Wagoner Johnson, A.J. The mechanical properties and osteoconductivity of hydroxyapatite bone scaffolds with multi-scale porosity. Biomaterials 2007, 28, 45–54. [Google Scholar] [CrossRef]
  6. Lin, L.; Chow, K.L.; Leng, Y. Study of hydroxyapatite osteoinductivity with an osteogenic differentiation of mesenchymal stem cells. J. Biomed. Mater. Res.—Part A 2009, 89, 326–335. [Google Scholar] [CrossRef]
  7. Aktuğ, S.L.; Durdu, S.; Yalçın, E.; Çavuşoğlu, K.; Usta, M. Bioactivity and biocompatibility of hydroxyapatite-based bioceramic coatings on zirconium by plasma electrolytic oxidation. Mater. Sci. Eng. C 2017, 71, 1020–1027. [Google Scholar] [CrossRef] [PubMed]
  8. Albahadli, N.A.; Ajeel, S. Hydroxyapatite coating improved corrosion resistance of 316L stainless steel used for surgical implants applications. Eng. Technol. J. 2008, 26, 958–964. [Google Scholar]
  9. Qadir, M.; Li, Y.; Wen, C. Ion-substituted calcium phosphate coatings by physical vapor deposition magnetron sputtering for biomedical applications: A review. Acta Biomater. 2019, 89, 14–32. [Google Scholar] [CrossRef] [PubMed]
  10. Jung, J.H.; Kim, S.Y.; Yi, Y.J.; Lee, B.K.; Kim, Y.K. Hydroxyapatite-coated implant: Clinical prognosis assessment via a retrospective followup study for the average of 3 years. J. Adv. Prosthodont. 2018, 10, 85–92. [Google Scholar] [CrossRef] [Green Version]
  11. Ghiasi, B.; Sefidbakht, Y.; Rezaei, M. Hydroxyapatite for biomedicine and drug delivery. In Nanomaterials for Advanced Biological Applications; Rahmandoust, M., Ayatollahi, M.R., Eds.; Springer International Publishing: Cham, Switzerland, 2019; pp. 85–120. ISBN 9783030108342. [Google Scholar]
  12. Bakan, F. Gene delivery by hydroxyapatite and calcium phosphate nanoparticles: A review of novel and recent applications. In Hydroxyapatite—Advances in Composite Nanomaterials, Biomedical Applications and Its Technological Facets; Thirumalai, J., Ed.; InTech Croatia: Rijeka, Croatia, 2018; pp. 157–176. [Google Scholar]
  13. Abu Bakar, M.S.; Cheng, M.H.W.; Tang, S.M.; Yu, S.C.; Liao, K.; Tan, C.T.; Khor, K.A.; Cheang, P. Tensile properties, tension-tension fatigue and biological response of polyetheretherketone-hydroxyapatite composites for load-bearing orthopedic implants. Biomaterials 2003, 24, 2245–2250. [Google Scholar] [CrossRef]
  14. Mihailescu, N.; Stan, G.E.; Duta, L.; Chifiriuc, M.C.; Bleotu, C.; Sopronyi, M.; Luculescu, C.; Oktar, F.N.; Mihailescu, I.N. Structural, compositional, mechanical characterization and biological assessment of bovine-derived hydroxyapatite coatings reinforced with MgF2 or MgO for implants functionalization. Mater. Sci. Eng. C 2016, 59, 863–874. [Google Scholar] [CrossRef] [PubMed]
  15. Stefan, L.G.; Abrudeanu, M.; Iosub, I.; Plaiasu, A.G.; Dinu, A.; Mihalache, M. Electrodeposition of hydroxyapatite coatings on stainless steel 316 L. Sci. Bull. Automot. Ser. 2009, A, 129–134. [Google Scholar]
  16. Harun, W.S.W.; Asri, R.I.M.; Alias, J.; Zulkifli, F.H.; Kadirgama, K.; Ghani, S.A.C.; Shariffuddin, J.H.M. A comprehensive review of hydroxyapatite-based coatings adhesion on metallic biomaterials. Ceram. Int. 2018, 44, 1250–1268. [Google Scholar] [CrossRef]
  17. Arabnejad, S.; Burnett Johnston, R.; Pura, J.A.; Singh, B.; Tanzer, M.; Pasini, D. High-strength porous biomaterials for bone replacement: A strategy to assess the interplay between cell morphology, mechanical properties, bone ingrowth and manufacturing constraints. Acta Biomater. 2016, 30, 345–356. [Google Scholar] [CrossRef] [Green Version]
  18. Manam, N.S.; Harun, W.S.W.; Shri, D.N.A.; Ghani, S.A.C.; Kurniawan, T.; Ismail, M.H.; Ibrahim, M.H.I. Study of corrosion in biocompatible metals for implants: A review. J. Alloys Compd. 2017, 701, 698–715. [Google Scholar] [CrossRef] [Green Version]
  19. Yılmaz, E.; Gökçe, A.; Findik, F.; Gulsoy, H.O.; İyibilgin, O. Mechanical properties and electrochemical behavior of porous Ti-Nb biomaterials. J. Mech. Behav. Biomed. Mater. 2018, 87, 59–67. [Google Scholar] [CrossRef]
  20. De Sena, L.Á.; De Andrade, M.C.; Rossi, A.M.; De Almeida Soares, G. Hydroxyapatite deposition by electrophoresis on titanium sheets with different surface finishing. J. Biomed. Mater. Res. 2002, 60, 1–7. [Google Scholar] [CrossRef]
  21. Spoerke, E.D.; Murray, N.G.; Li, H.; Brinson, L.C.; Dunand, D.C.; Stupp, S.I. A bioactive titanium foam scaffold for bone repair. Acta Biomater. 2005, 1, 523–533. [Google Scholar] [CrossRef]
  22. Isa, N.N.C.; Mohd, Y.; Yury, N. Electrodeposition of hydroxyapatite (HAp) coatings on etched titanium mesh substrate. In CHUSER 2012—2012 IEEE Colloquium on Humanities, Science and Engineering (CHUSER); IEEE Xplore: Piscataway, NJ, USA, 2012; pp. 771–775. [Google Scholar] [CrossRef]
  23. Vo, T.H.; Le, T.D.; Pham, T.N.; Nguyen, T.T.; Nguyen, T.P.; Thanh Dinh, T.M. Electrodeposition and characterization of hydroxyapatite coatings doped by Sr2+, Mg2+, Na+ and F- on 316L stainless steel. Adv. Nat. Sci. Nanosci. Nanotechnol. 2018, 9, 045001. [Google Scholar] [CrossRef]
  24. Bryington, M.S.; Hayashi, M.; Kozai, Y.; Vandeweghe, S.; Andersson, M.; Wennerberg, A.; Jimbo, R. The influence of nano hydroxyapatite coating on osseointegration after extended healing periods. Dent. Mater. 2013, 29, 514–520. [Google Scholar] [CrossRef]
  25. Gambardella, A.; Bianchi, M.; Kaciulis, S.; Mezzi, A.; Brucale, M.; Cavallini, M.; Herrmannsdoerfer, T.; Chanda, G.; Uhlarz, M.; Cellini, A.; et al. Magnetic hydroxyapatite coatings as a new tool in medicine: A scanning probe investigation. Mater. Sci. Eng. C 2016, 62, 444–449. [Google Scholar] [CrossRef] [PubMed]
  26. Hiromoto, S.; Inoue, M.; Taguchi, T.; Yamane, M.; Ohtsu, N. In vitro and in vivo biocompatibility and corrosion behaviour of a bioabsorbable magnesium alloy coated with octacalcium phosphate and hydroxyapatite. Acta Biomater. 2015, 11, 520–530. [Google Scholar] [CrossRef]
  27. Dorozhkin, S.V. Calcium orthophosphate coatings on magnesium and its biodegradable alloys. Acta Biomater. 2014, 10, 2919–2934. [Google Scholar] [CrossRef] [PubMed]
  28. Suvorova, E.I.; Klechkovskaya, V.V.; Bobrovsky, V.V.; Khamchukov, Y.D.; Klubovich, V.V. Nanostructure of plasma-sprayed hydroxyapatite coating. Crystallogr. Rep. 2003, 48, 872–877. [Google Scholar] [CrossRef]
  29. Habibovic, P.; Li, J.; Van Der Valk, C.M.; Meijer, G.; Layrolle, P.; Van Blitterswijk, C.A.; De Groot, K. Biological performance of uncoated and octacalcium phosphate-coated Ti6Al4V. Biomaterials 2005, 26, 23–36. [Google Scholar] [CrossRef]
  30. Xue, J.; Farris, A.; Wang, Y.; Yeh, W.; Romany, C.; Guest, J.K.; Grayson, W.L.; Hall, A.S.; Weihs, T.P. Electrodeposition of hydroxyapatite on a metallic 3D-woven bioscaffold. Coatings 2020, 10, 715. [Google Scholar] [CrossRef]
  31. Ebrahimi, N.; Ahangari, A.S.; Zadeh, H.; Vaezi, M.R.; Mozafari, M. A new double-layer hydroxyapatite/alumina-silica coated titanium implants using plasma spray technique. Surf. Coat. Technol. 2018, 352, 474–482. [Google Scholar] [CrossRef]
  32. Huang, H.; Lan, P.H.; Zhang, Y.Q.; Li, X.K.; Zhang, X.; Yuan, C.F.; Zheng, X.-B.; Guo, Z. Surface characterization and in vivo performance of plasma-sprayed hydroxyapatite-coated porous Ti6Al4V implants generated by electron beam melting. Surf. Coat. Technol. 2015, 283, 80–88. [Google Scholar] [CrossRef]
  33. Peng, P.; Kumar, S.; Voelcker, N.H.; Szili, E.; Smart, R.S.C.; Griesser, H.J. Thin calcium phosphate coatings on titanium by electrochemical deposition in modified simulated body fluid. J. Biomed. Mater. Res.—Part A 2006, 76, 347–355. [Google Scholar] [CrossRef]
  34. Asri, R.I.M.; Harun, W.S.W.; Hassan, M.A.; Ghani, S.A.C.; Buyong, Z. A review of hydroxyapatite-based coating techniques: Sol-gel and electrochemical depositions on biocompatible metals. J. Mech. Behav. Biomed. Mater. 2016, 57, 95–108. [Google Scholar] [CrossRef] [PubMed] [Green Version]
  35. Catauro, M.; Papale, F.; Bollino, F. Characterization and biological properties of TiO2/PCL hybrid layers prepared via sol-gel dip coating for surface modification of titanium implants. J. Non. Cryst. Solids 2015, 415, 9–15. [Google Scholar] [CrossRef]
  36. Yigit, O.; Dikici, B.; Ozdemir, N. Hydrothermal synthesis of nanocrystalline hydroxyapatite–graphene nanosheet on Ti-6Al-7Nb: Mechanical and in vitro corrosion performance. J. Mater. Sci. Mater. Med. 2021, 32, 40. [Google Scholar] [CrossRef] [PubMed]
  37. Kien, P.T.; Quan, T.N.; Tuyet Anh, L.H. Coating characteristic of hydroxyapatite on titanium substrates via hydrothermal treatment. Coatings 2021, 11, 1226. [Google Scholar] [CrossRef]
  38. Ivanova, A.A.; Surmeneva, M.A.; Surmenev, R.A.; Depla, D. Structural evolution and growth mechanisms of RF-magnetron sputter-deposited hydroxyapatite thin films on the basis of unified principles. Appl. Surf. Sci. 2017, 425, 497–506. [Google Scholar] [CrossRef]
  39. Sedelnikova, M.B.; Komarova, E.G.; Sharkeev, Y.P.; Ugodchikova, A.V.; Mushtovatova, L.S.; Karpova, M.R.; Sheikin, V.V.; Litvinova, L.S.; Khlusov, I.A. Zn-, Cu- or Ag-incorporated micro-arc coatings on titanium alloys: Properties and behavior in synthetic biological media. Surf. Coat. Technol. 2019, 369, 52–68. [Google Scholar] [CrossRef]
  40. Khandelwal, H.; Singh, G.; Agrawal, K.; Prakash, S.; Agarwal, R.D. Characterization of hydroxyapatite coating by pulse laser deposition technique on stainless steel 316 L by varying laser energy. Appl. Surf. Sci. 2013, 265, 30–35. [Google Scholar] [CrossRef]
  41. Ehsani, N.; Sorrell, C.C.; Ruys, A.J. Hydroxyapatite matrix composites by hot isostatic pressing: Part 2. Zirconia fibre and powder reinforced. J. Biomim. Biomater. Tissue Eng. 2012, 15, 85–100. [Google Scholar] [CrossRef]
  42. Yılmaz, E.; Gökçe, A.; Findik, F.; Gulsoy, H.O. Metallurgical properties and biomimetic HA deposition performance of Ti-Nb PIM alloys. J. Alloys Compd. 2018, 746, 301–313. [Google Scholar] [CrossRef]
  43. Bolelli, G.; Bellucci, D.; Cannillo, V.; Gadow, R.; Killinger, A.; Lusvarghi, L.; Müller, P.; Sola, A. Comparison between suspension plasma sprayed and high velocity suspension flame sprayed bioactive coatings. Surf. Coat. Technol. 2015, 280, 232–249. [Google Scholar] [CrossRef]
  44. Klyui, N.I.; Temchenko, V.P.; Gryshkov, A.P.; Dubok, V.A.; Shynkaruk, A.V.; Lyashenko, B.A.; Barynov, S.M. Properties of the hydroxyapatite coatings obtained by gas-detonation deposition onto titanium substrates. Funct. Mater. 2011, 18, 285–292. [Google Scholar]
  45. Tahmasbi Rad, A.; Solati-Hashjin, M.; Osman, N.A.A.; Faghihi, S. Improved bio-physical performance of hydroxyapatite coatings obtained by electrophoretic deposition at dynamic voltage. Ceram. Int. 2014, 40, 12681–12691. [Google Scholar] [CrossRef] [Green Version]
  46. Dinh, T.M.T.; Nguyen, T.T.; Pham, T.N.; Nguyen, T.P.; Nguyen, T.T.T.; Hoang, T.; Grossin, D.; Bertrand, G.; Drouet, C. Electrodeposition of HAp coatings on Ti6Al4V alloy and its electrochemical behavior in simulated body fluid solution. Adv. Nat. Sci. Nanosci. Nanotechnol. 2016, 7, 025008. [Google Scholar] [CrossRef]
  47. Yılmaz, E.; Çakıroğlu, B.; Gökçe, A.; Findik, F.; Gulsoy, H.O.; Gulsoy, N.; Mutlu, Ö.; Özacar, M. Novel hydroxyapatite/graphene oxide/collagen bioactive composite coating on Ti16Nb alloys by electrodeposition. Mater. Sci. Eng. C 2019, 101, 292–305. [Google Scholar] [CrossRef] [PubMed]
  48. Bakin, B.; Koc Delice, T.; Tiric, U.; Birlik, I.; Ak Azem, F. Bioactivity and corrosion properties of magnesium-substituted CaP coatings produced via electrochemical deposition. Surf. Coat. Technol. 2016, 301, 29–35. [Google Scholar] [CrossRef]
  49. San, H.; Hu, J.; Zhang, Y.; Han, J.; Tang, S. Formation and in vitro mineralization of electrochemically deposited coatings prepared on micro-arc oxidized titanium alloy. J. Appl. Electrochem. 2019, 49, 485–501. [Google Scholar] [CrossRef]
  50. Wu, P.P.; Zhang, Z.Z.; Xu, F.J.; Deng, K.K.; Nie, K.B.; Gao, R. Effect of duty cycle on preparation and corrosion behavior of electrodeposited calcium phosphate coatings on AZ91. Appl. Surf. Sci. 2017, 426, 418–426. [Google Scholar] [CrossRef]
  51. Katić, J.; Metikoš-Huković, M.; Škapin, S.D.; Petravić, M.; Varašanec, M. The potential-assisted deposition as valuable tool for producing functional apatite coatings on metallic materials. Electrochim. Acta 2014, 127, 173–179. [Google Scholar] [CrossRef]
  52. Bucur, A.I.; Linul, E.; Taranu, B.O. Hydroxyapatite coatings on Ti substrates by simultaneous precipitation and electrodeposition. Appl. Surf. Sci. 2020, 527, 146820. [Google Scholar] [CrossRef]
  53. Eliaz, N.; Eliyahu, M. Electrochemical processes of nucleation and growth of hydroxyapatite on titanium supported by real-time electrochemical atomic force microscopy. J. Biomed. Mater. Res. Part A 2006, 80, 621–634. [Google Scholar] [CrossRef]
  54. Isa, N.N.C.; Mohd, Y.; Yury, N. Electrochemical deposition and characterization of hydroxyapatite (HAp) on titanium substrate. APCBEE Procedia 2012, 3, 46–52. [Google Scholar] [CrossRef] [Green Version]
  55. Taranu, B.O.; Bucur, A.I.; Sebarchievici, I. Three-step procedure for the deposition of hydroxyapatite coatings. J. Coat. Technol. Res. 2020, 17, 1075–1082. [Google Scholar] [CrossRef]
  56. Bucur, A.I.; Bucur, R.A.; Szabadai, Z.; Mosoarca, C.; Linul, P.A. Influence of small concentration addition of tartaric acid on the 220 °C hydrothermal synthesis of hydroxyapatite. Mater. Charact. 2017, 132, 76–82. [Google Scholar] [CrossRef]
  57. Gopi, D.; Bhuvaneshwari, N.; Indira, J.; Kanimozhi, K.; Kavitha, L. A novel green template assisted synthesis of hydroxyapatite nanorods and their spectral characterization. Spectrochim. Acta—Part A Mol. Biomol. Spectrosc. 2013, 107, 196–202. [Google Scholar] [CrossRef]
  58. Valério, A.; Morelhão, S.L. Usage of Scherrer’s formula in X-ray diffraction analysis of size distribution in systems of monocrystalline nanoparticles. arXiv 2019, arXiv:1911.00701. [Google Scholar]
  59. Rabiei, M.; Palevicius, A.; Monshi, A.; Nasiri, S.; Vilkauskas, A.; Janusas, G. Comparing methods for calculating nano crystal size of natural hydroxyapatite using X-ray diffraction. Nanomaterials 2020, 10, 1627. [Google Scholar] [CrossRef] [PubMed]
  60. Lewandowska, M.; Stefaniuk, T.; Pniewski, J. The technique of measurement of intraocular lens surface roughness using atomic force microscopy. Interdiscip. J. Eng. Sci. 2014, 2, 21–25. [Google Scholar]
  61. Rajesh Kumar, B.; Subba Rao, T. AFM studies on surface morphology, topography and texture of nanostructured zinc aluminum oxide thin films. Dig. J. Nanomater. Biostruct. 2012, 7, 1881–1889. [Google Scholar]
  62. Roşu, R.A.; Şerban, V.-A.; Bucur, A.I.; Dragoş, U. Deposition of titanium nitride and hydroxyapatite-based biocompatible composite by reactive plasma spraying. Appl. Surf. Sci. 2012, 258, 3871–3876. [Google Scholar] [CrossRef]
  63. García, C.; Ceré, S.; Durán, A. Bioactive coatings deposited on titanium alloys. J. Non. Cryst. Solids 2006, 352, 3488–3495. [Google Scholar] [CrossRef]
  64. Niinomi, M. Recent metallic materials for biomedical applications. Metall. Mater. Trans. A 2002, 33A, 477–486. [Google Scholar] [CrossRef]
  65. Qiu, D.; Wang, A.; Yin, Y. Characterization and corrosion behavior of hydroxyapatite/zirconia composite coating on NiTi fabricated by electrochemical deposition. Appl. Surf. Sci. 2010, 257, 1774–1778. [Google Scholar] [CrossRef]
  66. Adhitya, K. Electrophoretic deposition of calcium phosphate ceramics over duplex stainless steel (S2205) and its characterization. Int. Res. J. Eng. Technol. 2020, 7, 1905–1909. [Google Scholar]
  67. Durairaj, R.B.; Ramachandran, S. Corrosion characteristics of hydroxyapatite coated titanium substrate for biomedical applications. Int. J. Chem. Sci. 2016, 14, 2157–2163. [Google Scholar]
  68. Huang, S.; Zhou, K.; Huang, B.; Li, Z.; Zhu, S.; Wang, G. Preparation of an electrodeposited hydroxyapatite coating on titanium substrate suitable for in-vivo applications. J. Mater. Sci. Mater. Med. 2008, 19, 437–442. [Google Scholar] [CrossRef]
  69. Gopi, D.; Collins Arun Prakash, V.; Kavitha, L.; Kannan, S.; Bhalaji, P.R.; Shinyjoy, E.; Ferreira, J.M.F. A facile electrodeposition of hydroxyapatite onto borate passivated surgical grade stainless steel. Corros. Sci. 2011, 53, 2328–2334. [Google Scholar] [CrossRef]
  70. Thom, N.T.; Nam, P.T.; Phuong, N.T.; Thi, D.; Thanh, M. Investigation of the condition to synthesize HAp/CNTs coatings on 316LSS. Vietnam J. Sci. Technol. 2018, 56, 50–62. [Google Scholar]
  71. Ghosh, R.; Swart, O.; Westgate, S.; Miller, B.L.; Yates, M.Z. Antibacterial copper-hydroxyapatite composite coatings via electrochemical synthesis. Langmuir 2019, 35, 5957–5966. [Google Scholar] [CrossRef] [PubMed]
  72. Huang, Y.; Zhang, X.; Mao, H.; Li, T.; Zhao, R.; Yan, Y.; Pang, X. Osteoblastic cell responses and antibacterial efficacy of Cu/Zn co-substituted hydroxyapatite coatings on pure titanium using electrodeposition method. RSC Adv. 2015, 5, 17076–17086. [Google Scholar] [CrossRef]
  73. Huang, Y.; Hao, M.; Nian, X.; Qiao, H.; Zhang, X.; Zhang, X.; Song, G.; Guo, J.; Pang, X.; Zhang, H. Strontium and copper co-substituted hydroxyapatite-based coatings with improved antibacterial activity and cytocompatibility fabricated by electrodeposition. Ceram. Int. 2016, 42, 11876–11888. [Google Scholar] [CrossRef]
  74. Lobo, A.; Marciano, F.R.; Matsushima, J.T.; Ramos, S.C.; Corat, E.J. Influence of temperature and time for direct hydroxyapatite electrodeposition on superhydrophilic vertically aligned carbon nanotube films. J. Nanomed. Nanotechnol. 2011, 6, 6–11. [Google Scholar] [CrossRef] [Green Version]
  75. Liu, D.; Savino, K.; Yates, M.Z. Coating of hydroxyapatite films on metal substrates by seeded hydrothermal deposition. Surf. Coat. Technol. 2011, 205, 3975–3986. [Google Scholar] [CrossRef]
  76. Thanh, D.T.M.; Nam, P.T.; Phuong, N.T.; Que, L.X.; Van Anh, N.; Hoang, T.; Lam, T.D. Controlling the electrodeposition, morphology and structure of hydroxyapatite coating on 316L stainless steel. Mater. Sci. Eng. C 2013, 33, 2037–2045. [Google Scholar] [CrossRef]
  77. Gopi, D.; Indira, J.; Kavitha, L. A comparative study on the direct and pulsed current electrodeposition of hydroxyapatite coatings on surgical grade stainless steel. Surf. Coat. Technol. 2012, 206, 2859–2869. [Google Scholar] [CrossRef]
  78. Büyüksağiş, A.; Bulut, E.; Kayalı, Y. Corrosion behaviors of hydroxyapatite coated by electrodeposition method of Ti6Al4V, Ti and AISI 316L SS substrates. Prot. Met. Phys. Chem. Surf. 2013, 49, 776–787. [Google Scholar] [CrossRef]
  79. Chakraborty, R.; Sengupta, S.; Saha, P.; Das, K.; Das, S. Synthesis of calcium hydrogen phosphate and hydroxyapatite coating on SS316 substrate through pulsed electrodeposition. Mater. Sci. Eng. C 2016, 69, 875–883. [Google Scholar] [CrossRef] [PubMed]
  80. Chakraborty, R.; Saha, P. A comparative study on surface morphology and electrochemical behaviour of hydroxyapatite-calcium hydrogen phosphate composite coating synthesized in-situ through electro chemical process under various deposition conditions. Surf. Interfaces 2018, 12, 160–167. [Google Scholar] [CrossRef]
  81. Chennah, A.; Naciri, Y.; Ahsaine, H.A.; Taoufyq, A.; Bakiz, B.; Bazzi, L.; Guinneton, F.; Gavarri, J.R.; Benlhachemi, A. Electrocatalytic properties of hydroxyapatite thin films electrodeposited on stainless steel substrates. Mediterr. J. Chem. 2018, 6, 255–266. [Google Scholar] [CrossRef] [Green Version]
  82. Saremi, M.; Sabet, F.H. Nano hydroxyapatite coating on stainless steel 304 by electrochemical method. Int. J. Mod. Phys. B 2008, 22, 3092–3098. [Google Scholar] [CrossRef]
  83. Suzuki, O. Evolution of Octacalcium Phosphate Biomaterials. In Octacalcium Phosphate Biomaterials; Woodhead Publishing: Sawston, UK, 2019; ISBN 9780081025116. [Google Scholar]
Scheme 1. The experimental setup of the novel method.
Coatings 12 00288 sch001
Figure 1. XRD patterns obtained for the HA1-HA6 samples, electrodeposited at 80 °C. The ∆ symbol indicates the diffraction peaks corresponding to the Ti support. The O symbol indicates the diffraction peak possibly corresponding to octacalcium phosphate (OCP). The peaks that belong to HA are marked with *.
Coatings 12 00288 g001
Figure 2. SEM images of samples deposited during 2 h at 80 °C, with (a) Ca added to the electrolyte; (b) P added to the electrolyte.
Coatings 12 00288 g002
Figure 3. XRD patterns obtained for the HA7-HA12 samples, electrodeposited at 90 °C. The ∆ symbol indicates the diffraction peaks corresponding to the Ti support. The O symbol indicates the diffraction peak possibly corresponding to octacalcium phosphate (OCP). The peaks that belong to HA are marked with *.
Coatings 12 00288 g003
Figure 4. SEM images recorded on samples HA9 (a) and HA12 (b) obtained at 90 °C.
Coatings 12 00288 g004
Figure 5. 5 µm × 5 µm 2D AFM micrographs obtained for the HA1 (a), HA2 (c), HA3 (e), HA4 (g), HA5 (i), and HA6 (k) samples and their respective 3D representations (b,d,f,h,j,l).
Coatings 12 00288 g005
Figure 6. 5 µm × 5 µm 2D AFM micrographs obtained for the HA7 (a), HA8 (c), HA9 (e), HA10 (g), HA11 (i), and HA12 (k) samples and their respective 3D representations (b,d,f,h,j,l).
Coatings 12 00288 g006
Figure 7. XRD patterns of the samples HA13, HA3, and HA14–HA19. Peaks marked with * belong to HA and the peak marked with O belong to OCP. ICDD file for HA: 01-084-1998 and ICDD file for OCP: 00-026-1056.
Coatings 12 00288 g007
Figure 8. SEM images recorded on specimens HA13 (a), HA3 (b), HA14 (c), HA15 (d), HA16 (e), HA17 (f), HA18 (g), and HA19 (h).
Coatings 12 00288 g008
Figure 9. 2D AFM micrographs recorded for the HA13 (a), HA3 (c), HA14 (e), HA15 (g), HA16 (i), HA17 (k), HA18 (m), and HA19 (o) samples and their respective 3D representations (b,d,f,h,j,l,n,p).
Coatings 12 00288 g009
Table 1. Electrodeposition strategies used to obtain the HA specimens.
Deposition StrategySubstrateTemperature
(°C)
Time (h)Precursor AdditionApplied Potential
(V)
Specimen Code
1Ti801Ca *−1.5HA1
2Ti802Ca *−1.5HA2
3Ti804Ca *−1.5HA3
4Ti801P *−1.5HA4
5Ti802P *−1.5HA5
6Ti804P *−1.5HA6
7Ti901Ca *−1.5HA7
8Ti902Ca *−1.5HA8
9Ti904Ca *−1.5HA9
10Ti901P *−1.5HA10
11Ti902P *−1.5HA11
12Ti904P *−1.5HA12
13Ti804Ca + P **−1.5HA13
14C55804Ca + P **−1.5HA14
15C55804Ca *−1.5HA15
16Cu804Ca + P **−1.5HA16
17Cu804Ca *−1.5HA17
18Ni804Ca + P **−1.5HA18
19Ni804Ca *−1.5HA19
* Refers to the second added precursor, which was drop-added to the electrolyte solution. ** Both precursors were present into the electrolyte solution at the start of the experiment.
Table 2. Crystallite size calculated from the XRD patterns *.
Sample CodeHA1HA2HA3HA4HA5HA6HA7HA8HA9HA10HA11HA12
Crystallite Size, XS (nm)7.13 ± 0.276.95 ± 0.337.81 ± 0.166.36 ± 0.26.98 ± 0.226.81 ± 0.279.07 ± 0.179.51 ± 0.2512.24 ± 0.397.44 ± 0.218.96 ± 0.286.83 ± 0.38
* Measurement accuracy: 0.02 degrees 2 theta.
Table 3. HA layer thickness.
Sample CodeHA1HA2HA3HA4HA5HA6HA7HA8HA9HA10HA11HA12
Thickness (µm)126.332 ± 2.4679.856 ± 0.6413.136 ± 0.4224.646 ± 0.1166.956 ± 0.79167.074 ± 3.1513.809 ± 0.2613.157 ± 0.0664.527 ± 1.2548.219 ± 1.1274.757 ± 0.1755.917 ± 0.58
Table 4. Crystallite size calculated from the XRD patterns for the 002 line of HA.
Sample CodeHA13Ha3HA14HA15HA16HA17HA18HA19
Crystallite Size, XS (nm)7.547.81-8.45-8.00-9.54
Table 5. HA layer thickness.
Sample CodeHA13HA3HA14HA15HA16HA17HA18HA19
Thickness (µm)5.847 ± 0.0713.136 ± 0.42185.88 ± 4.8935.104 ± 0.11101.907 ± 7.7117.136 ± 1.493.918 ± 3.3245.783 ± 0.75
Publisher’s Note: MDPI stays neutral with regard to jurisdictional claims in published maps and institutional affiliations.

