
Phytic Acid Doped Polyaniline as a Binding Coating Promoting Growth of Prussian Blue on Cotton Fibers for Adsorption of Copper Ions

Abstract
:1. Introduction
2. Materials and Methods
2.1. Materials
2.2. Methods
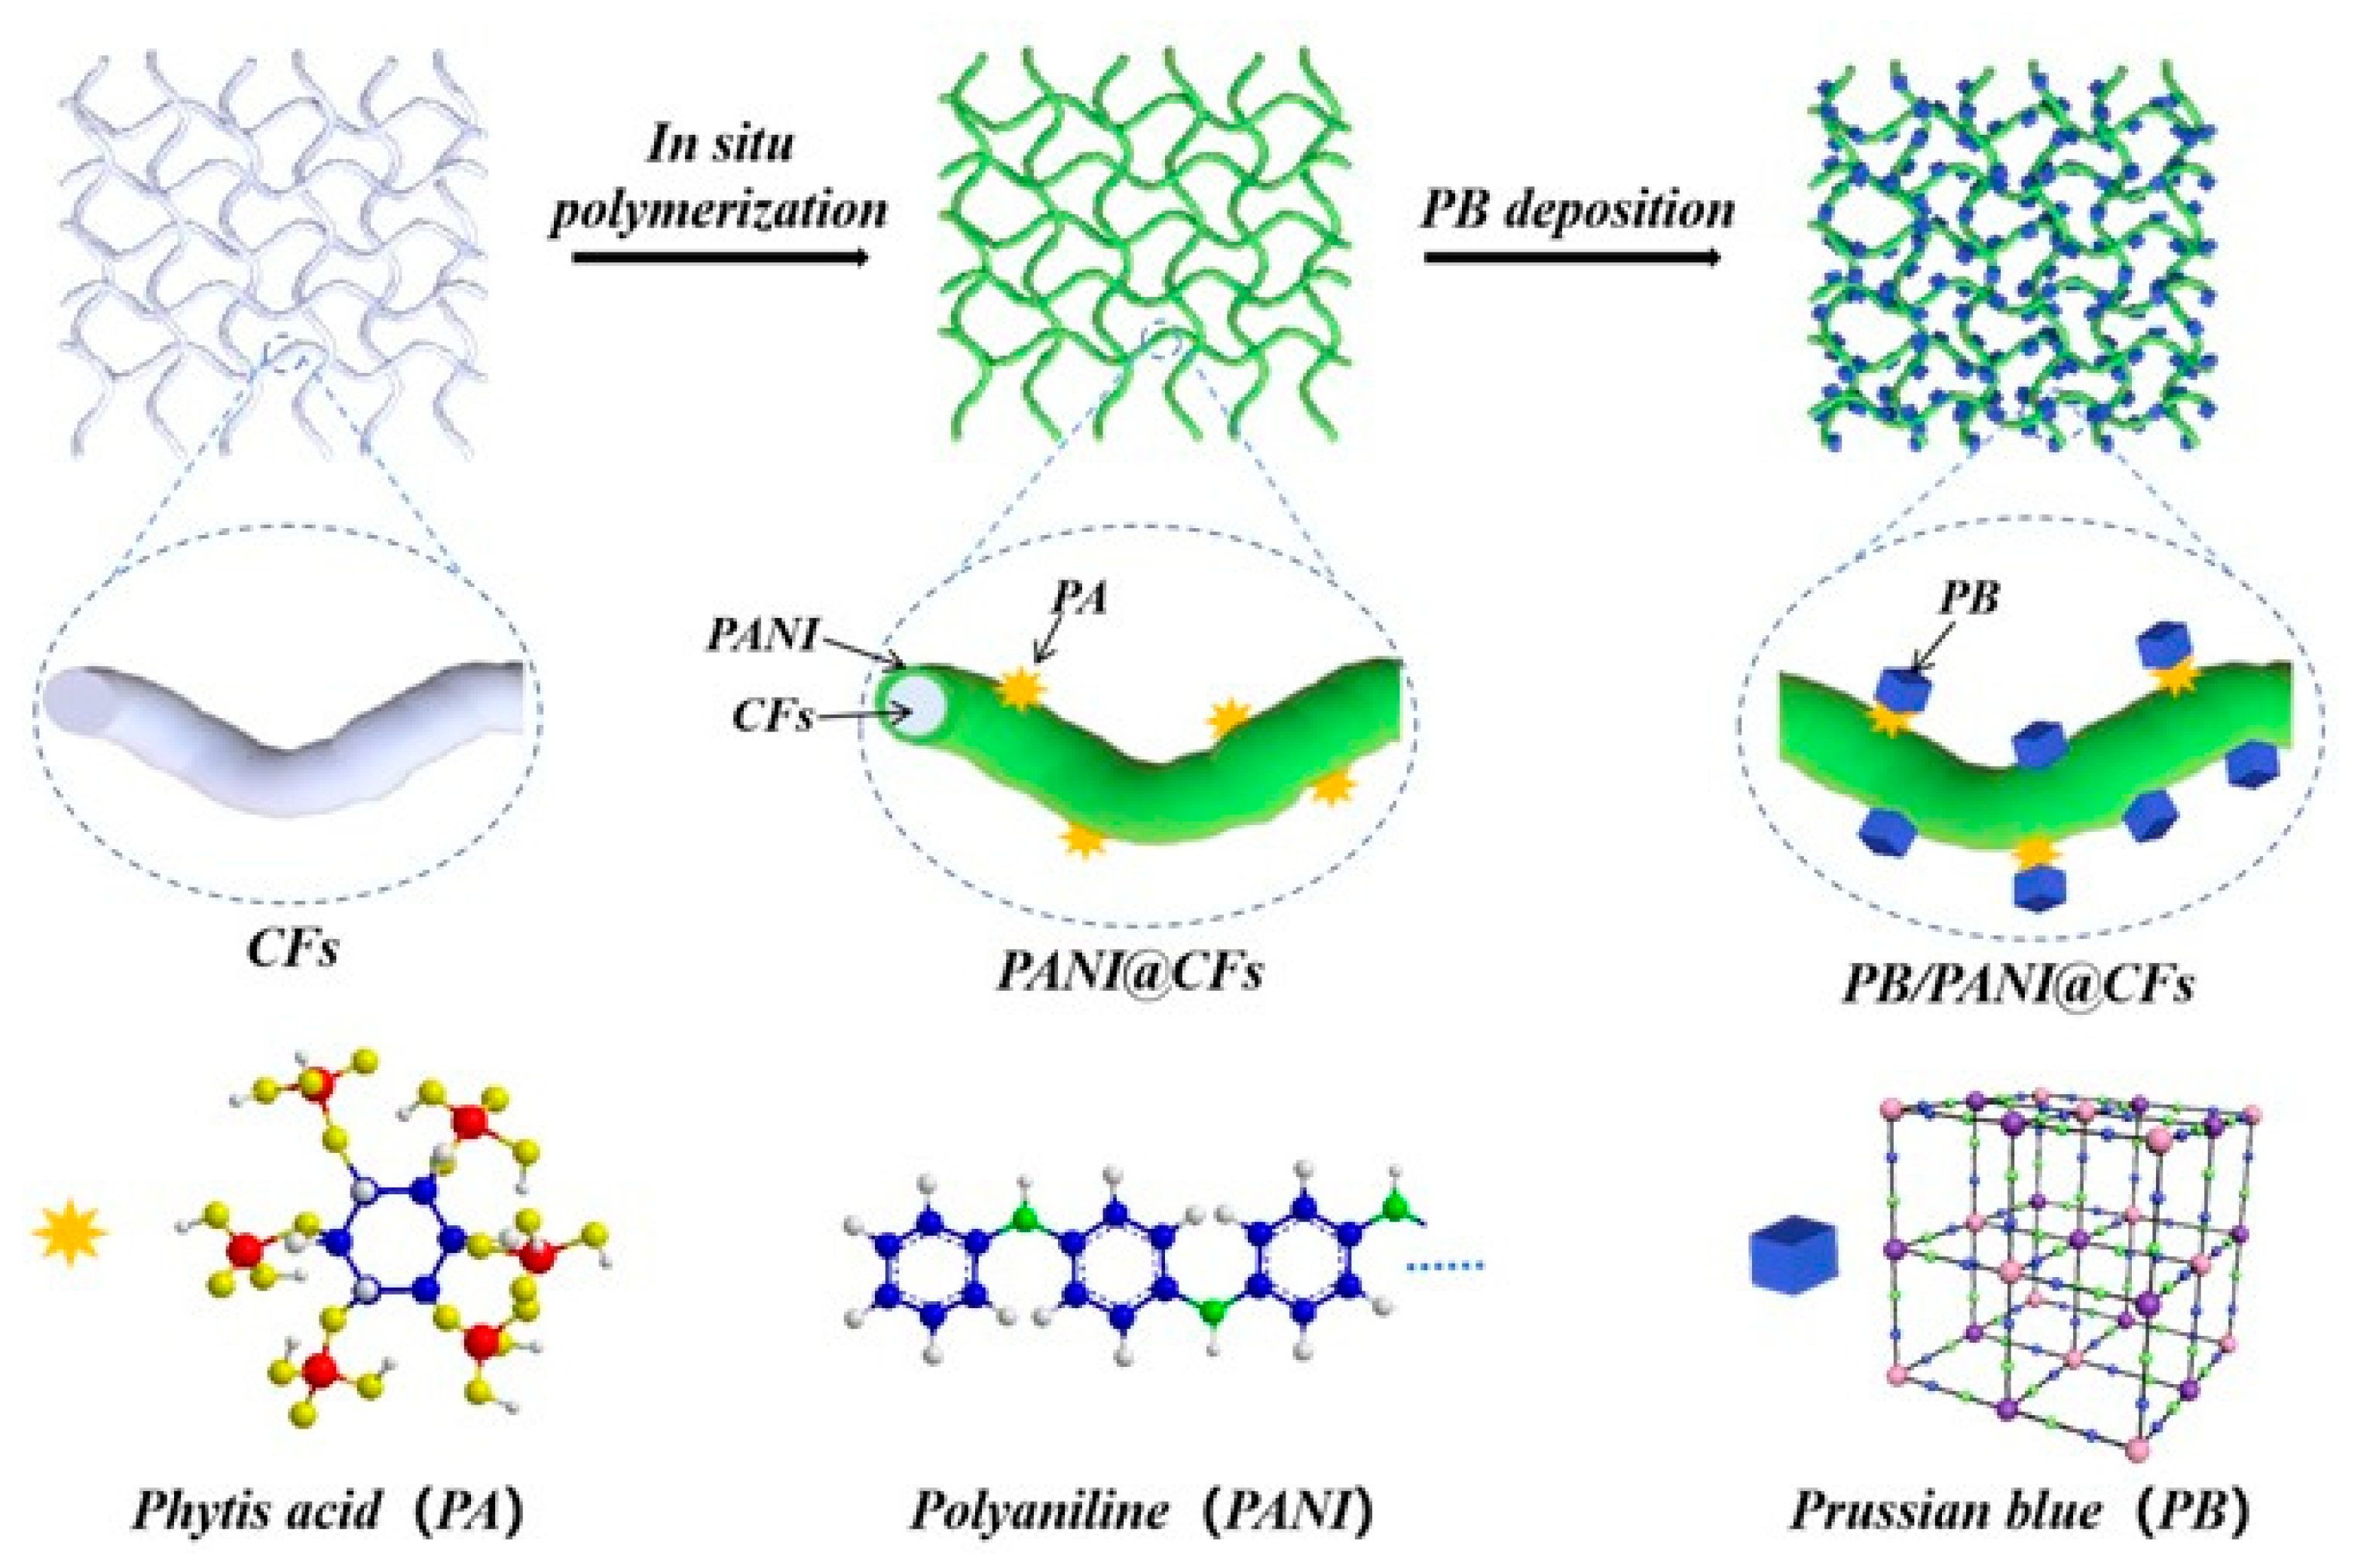
2.2.1. Preparation of PANI@CFs Composite
2.2.2. Preparation of PB@CFs Composite
2.2.3. Preparation of PB/PANI@CFs Composite
2.2.4. Static Adsorption Experiment
2.3. Characterization
3. Results and Discussion
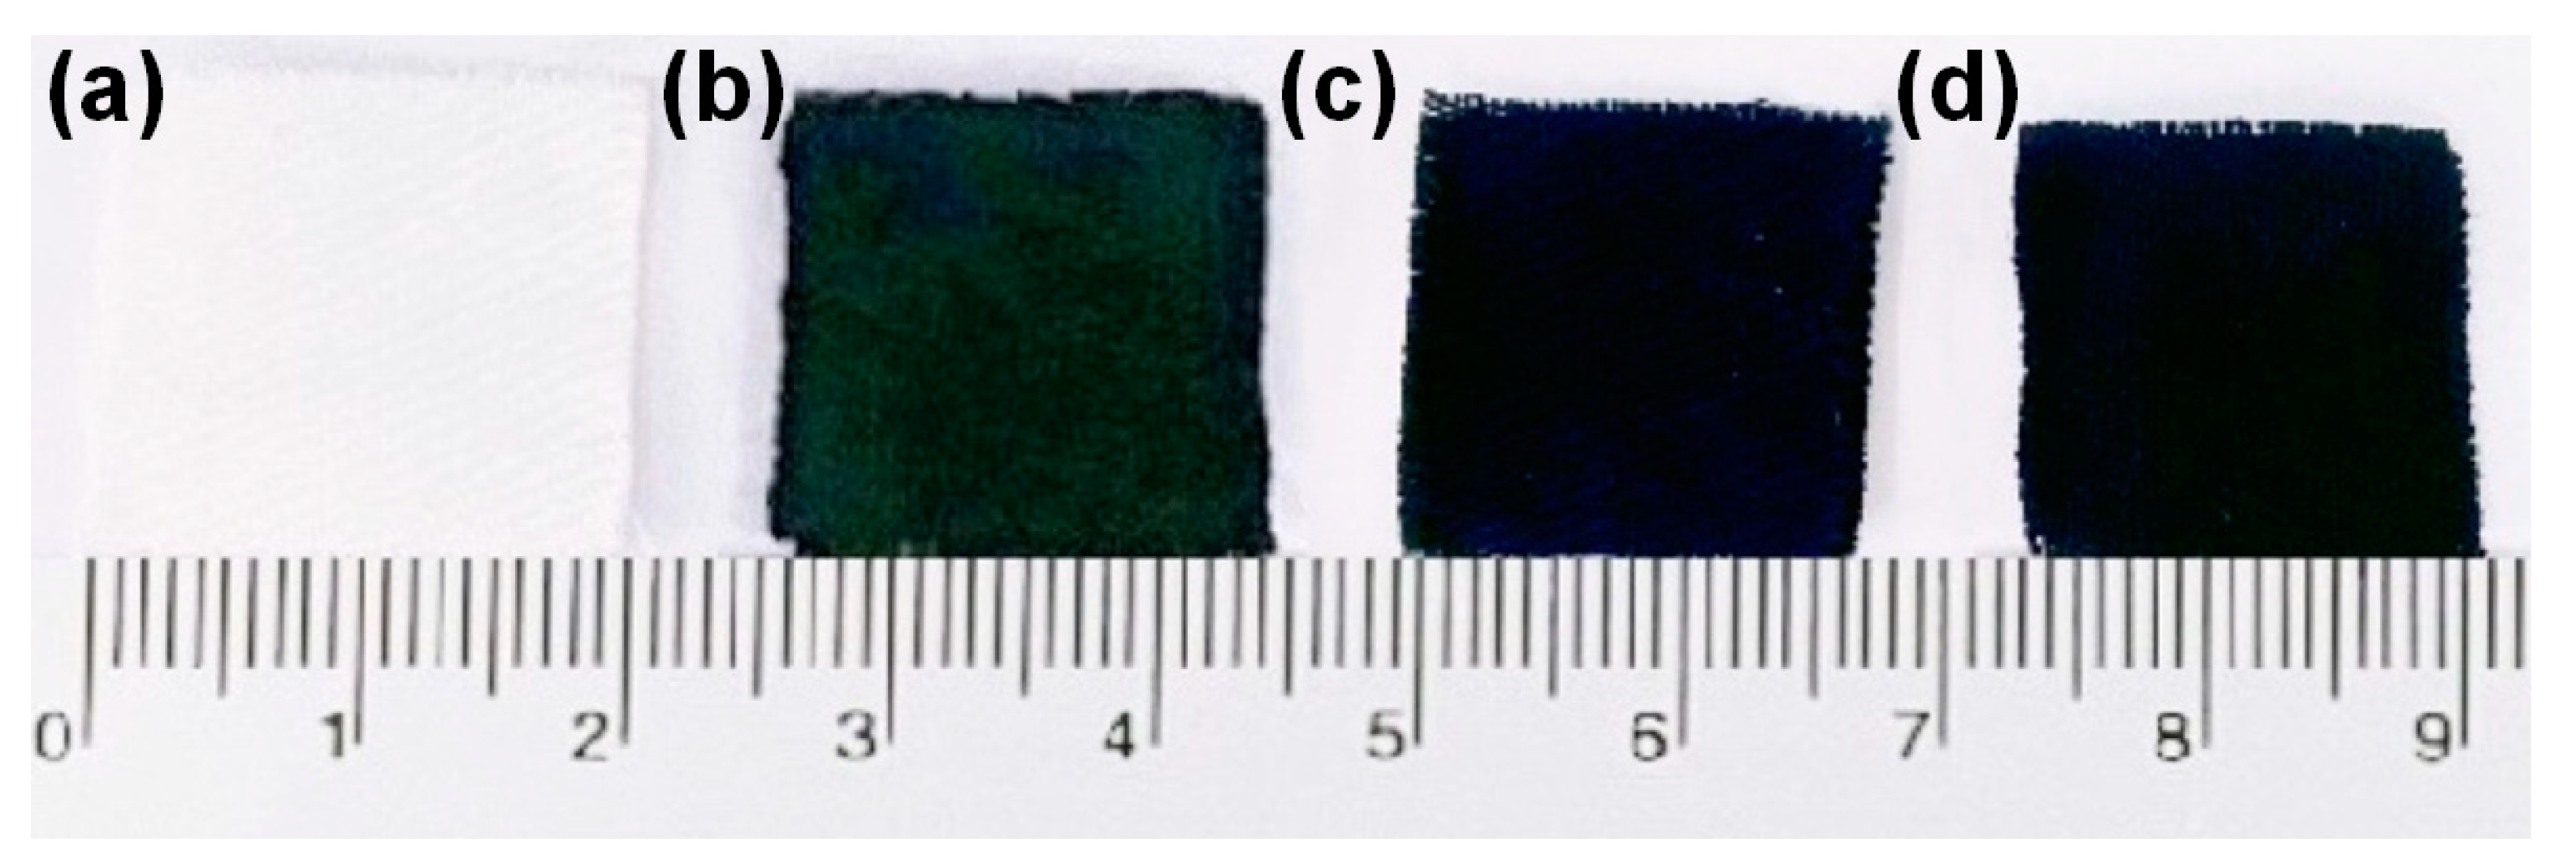
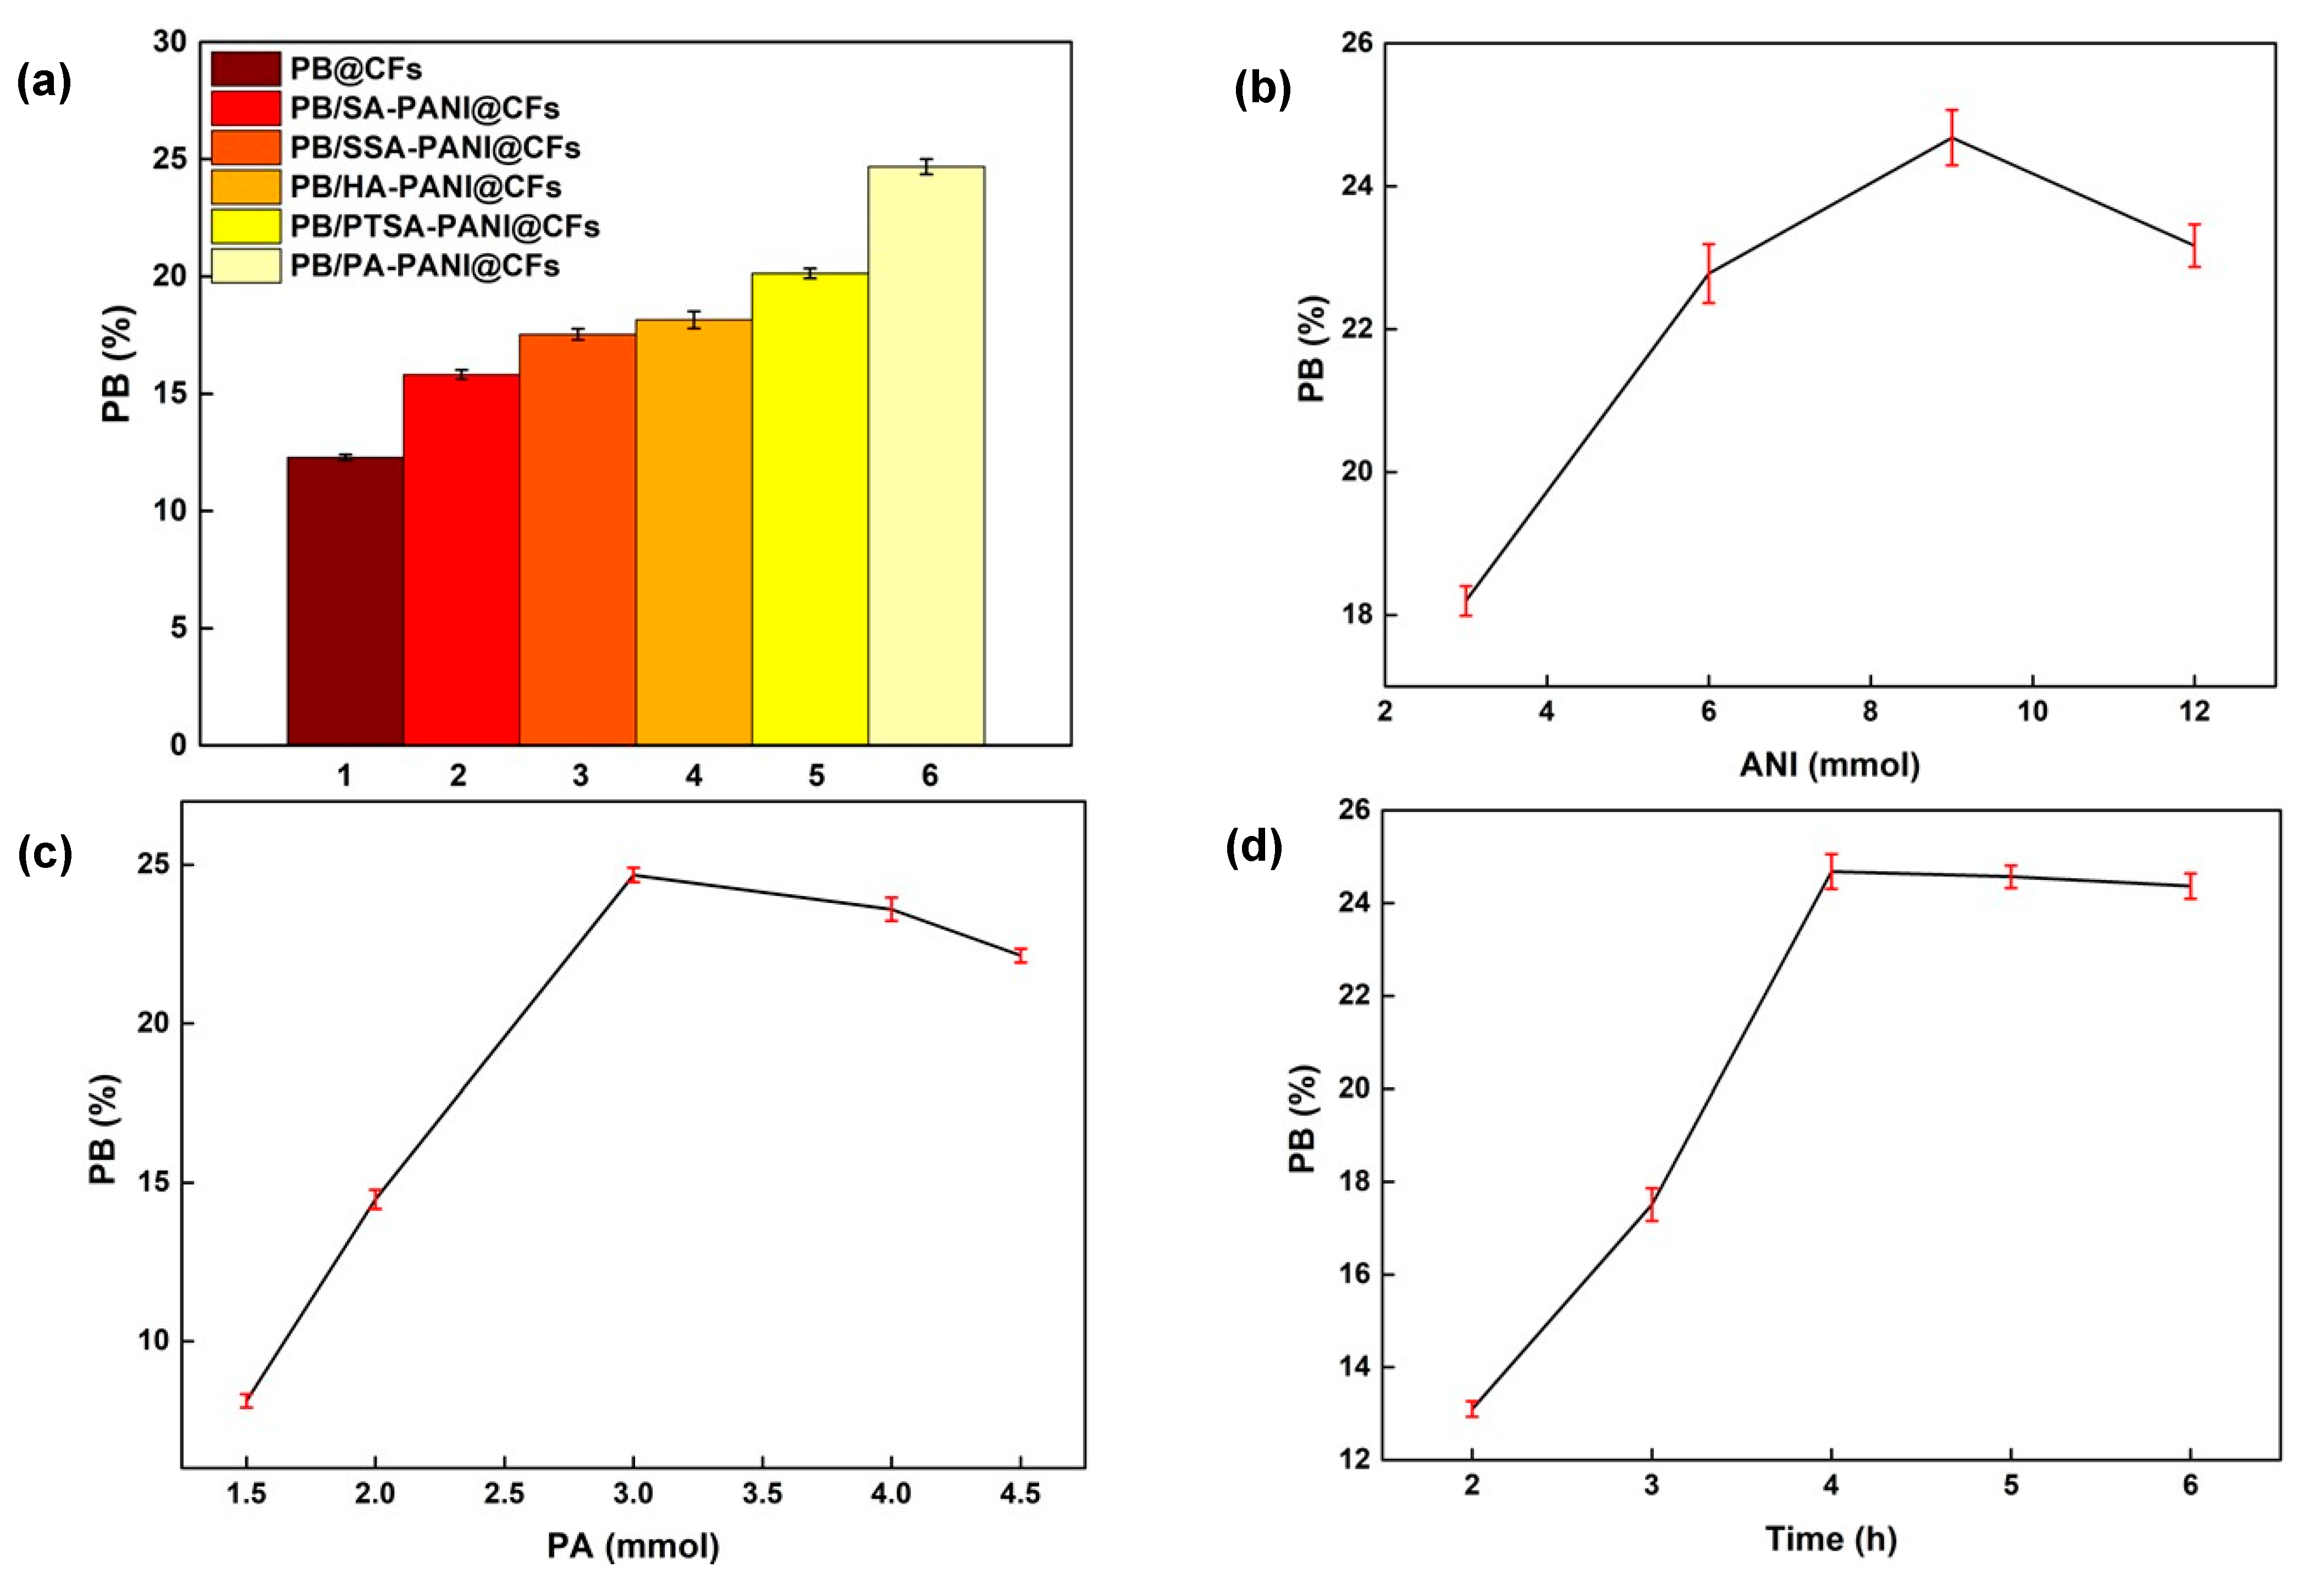
3.1. PANI Promoting Effect on PB Growth
3.2. Composite Characterization
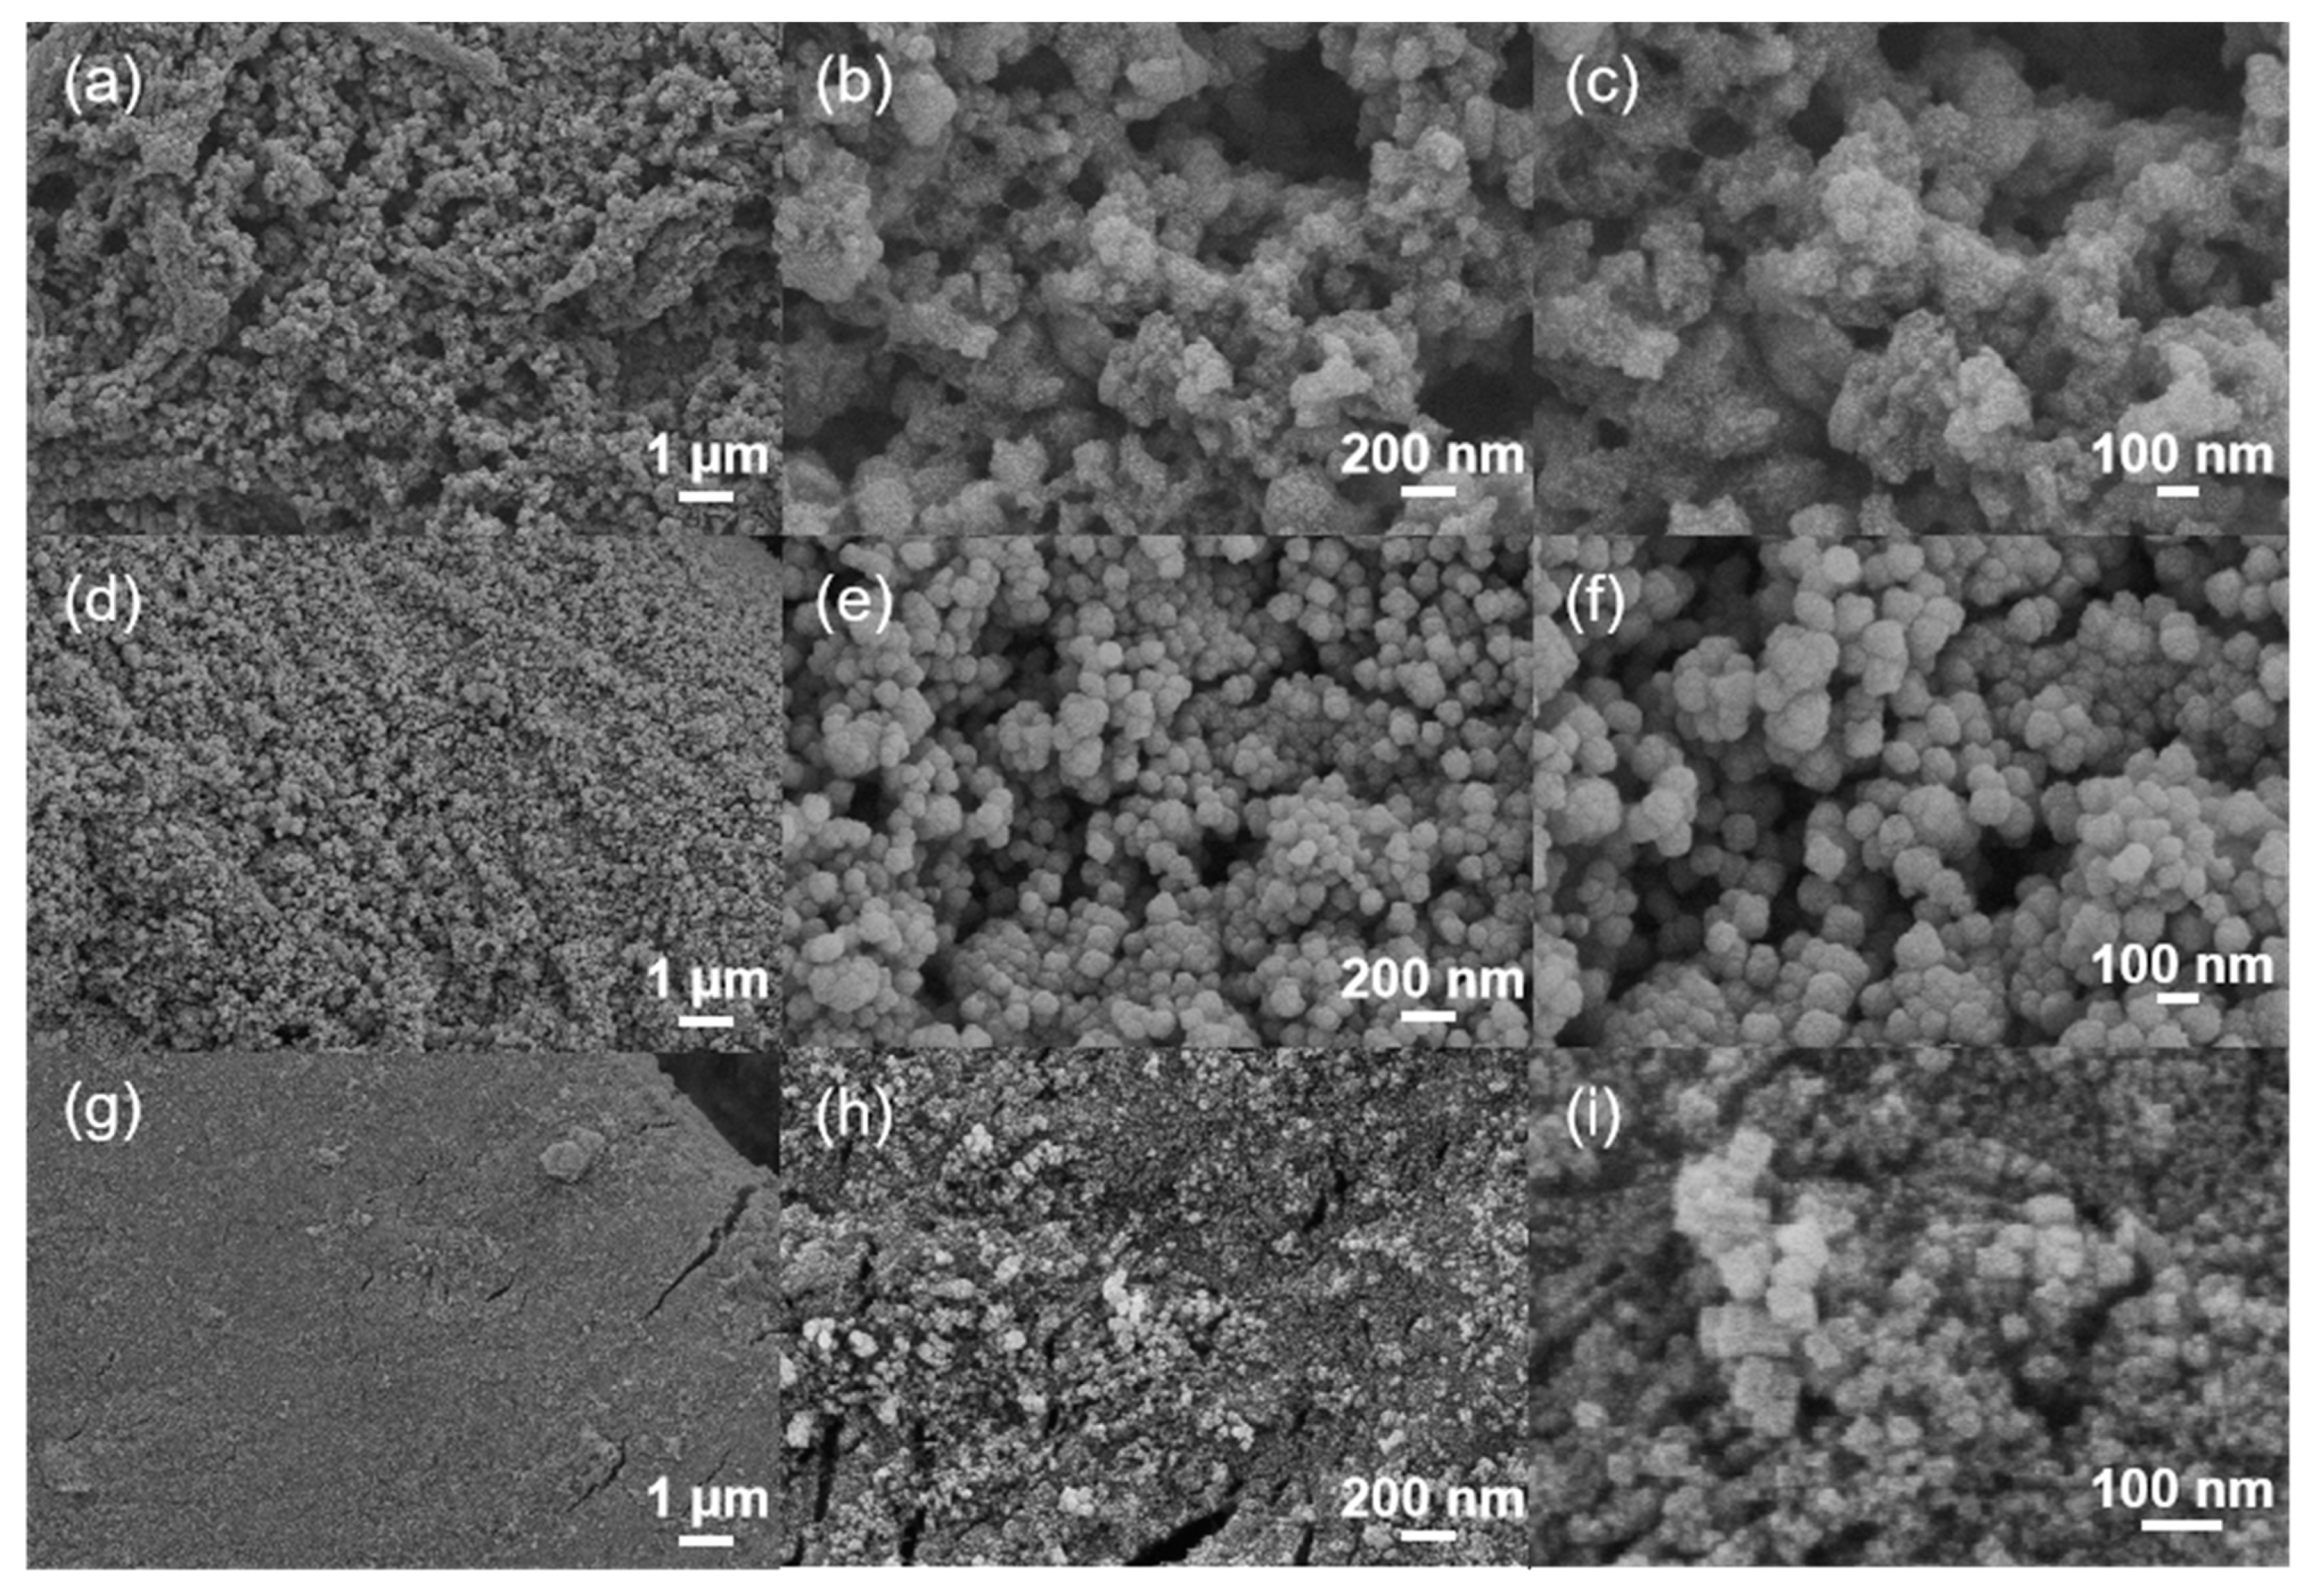
3.2.1. SEM Analysis
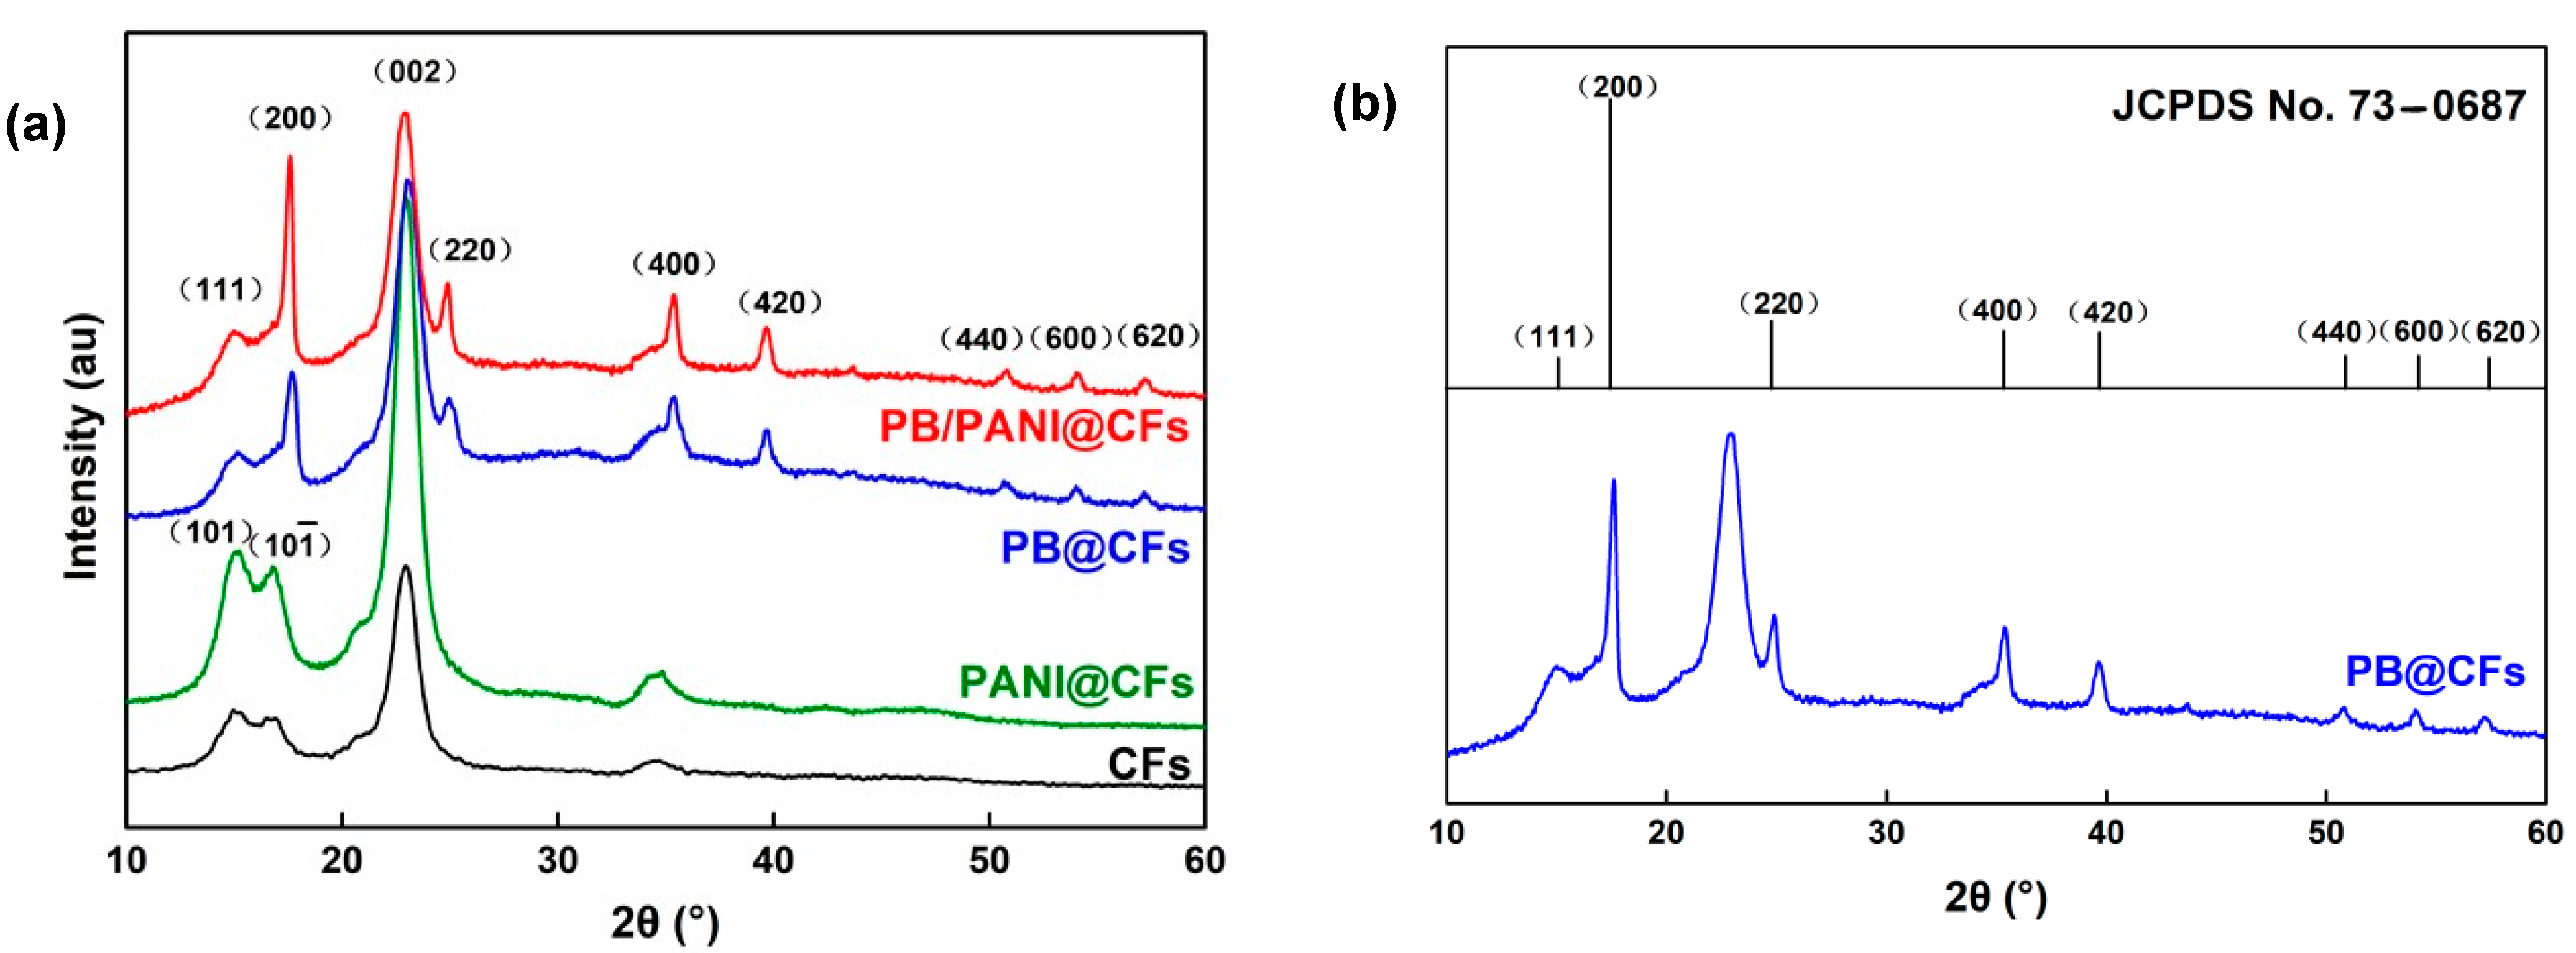
3.2.2. XRD Analysis
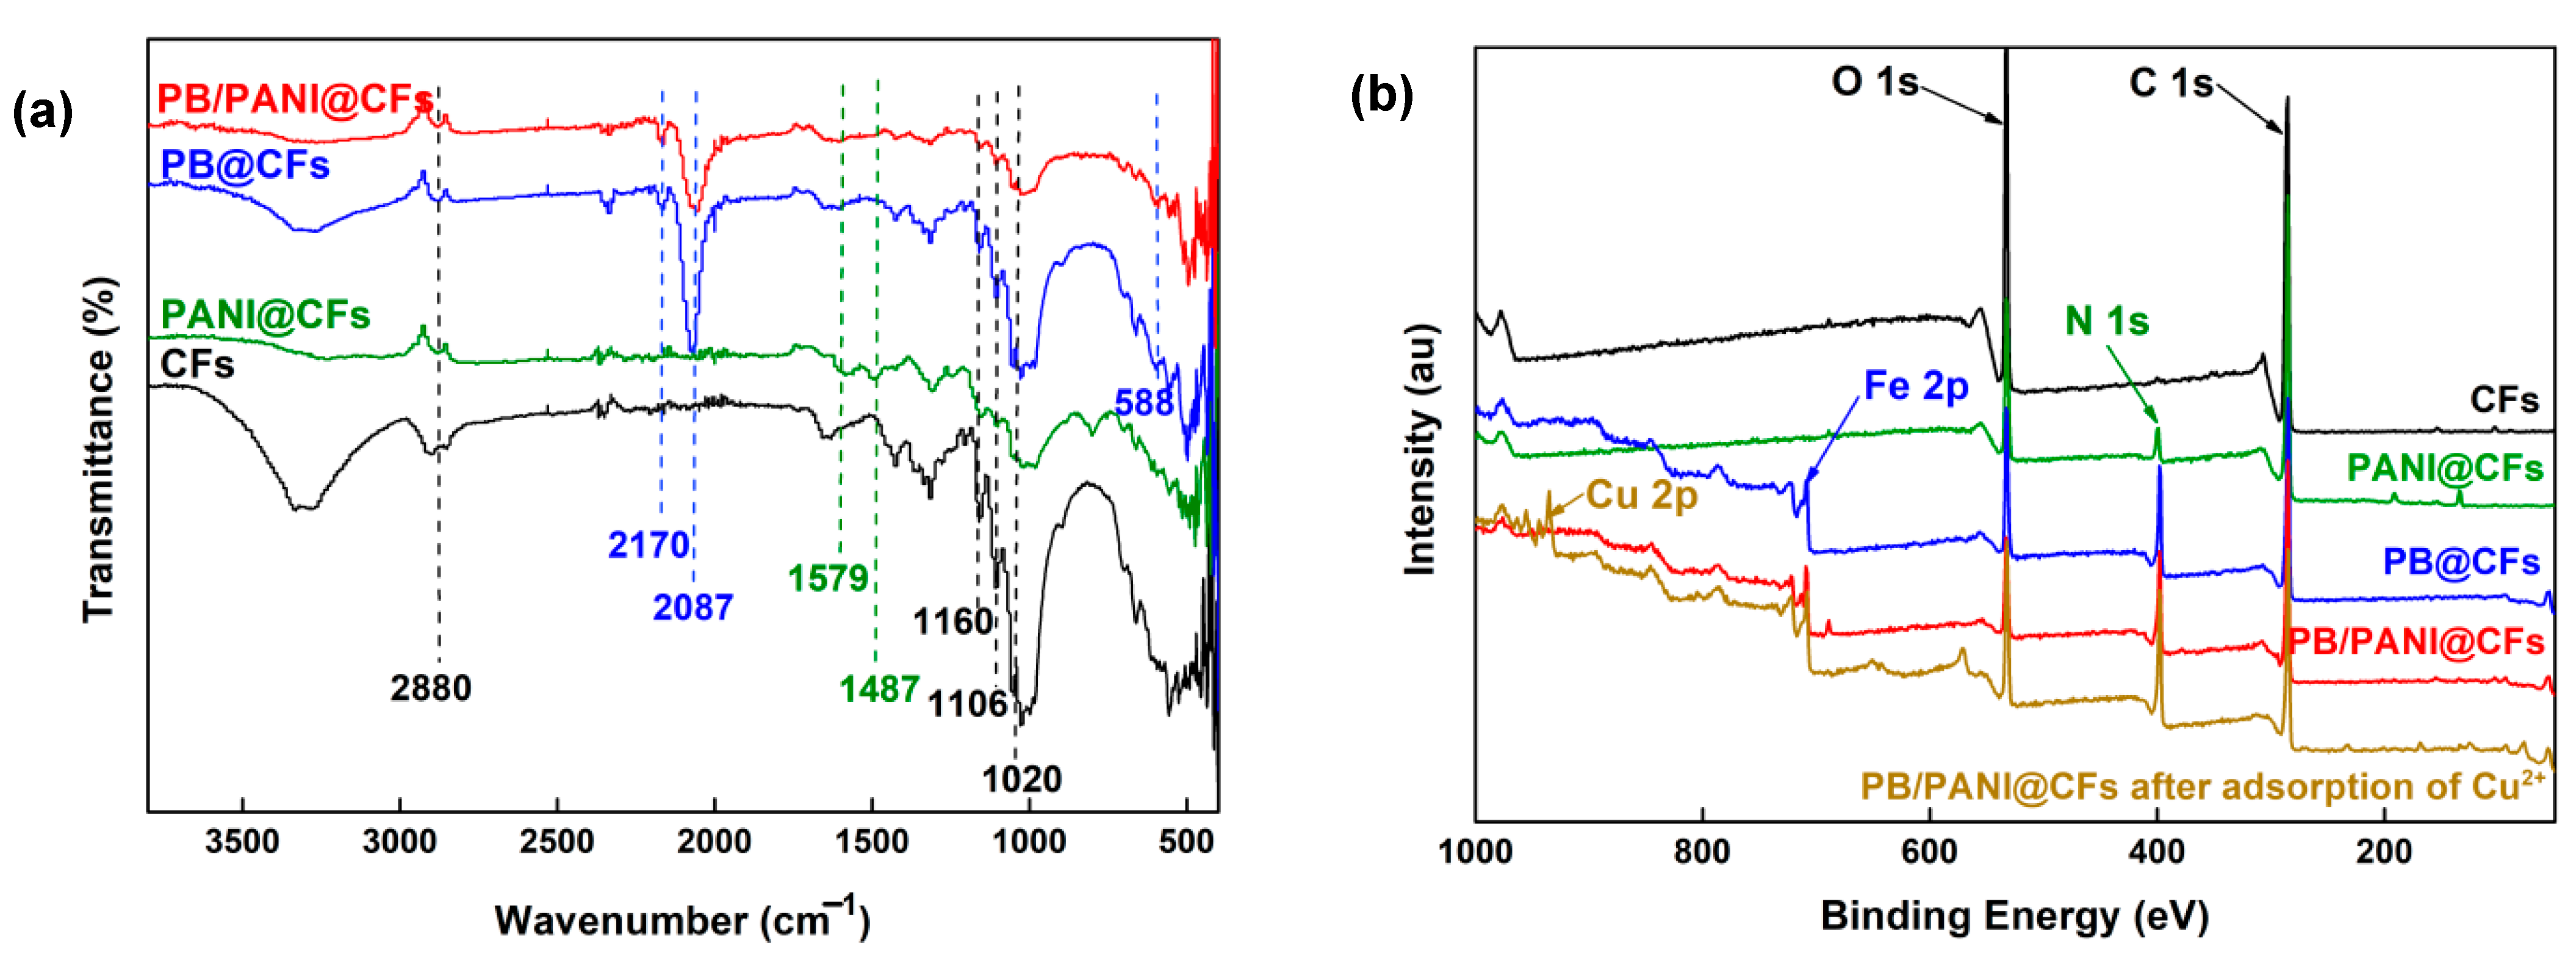
3.2.3. FTIR Analysis
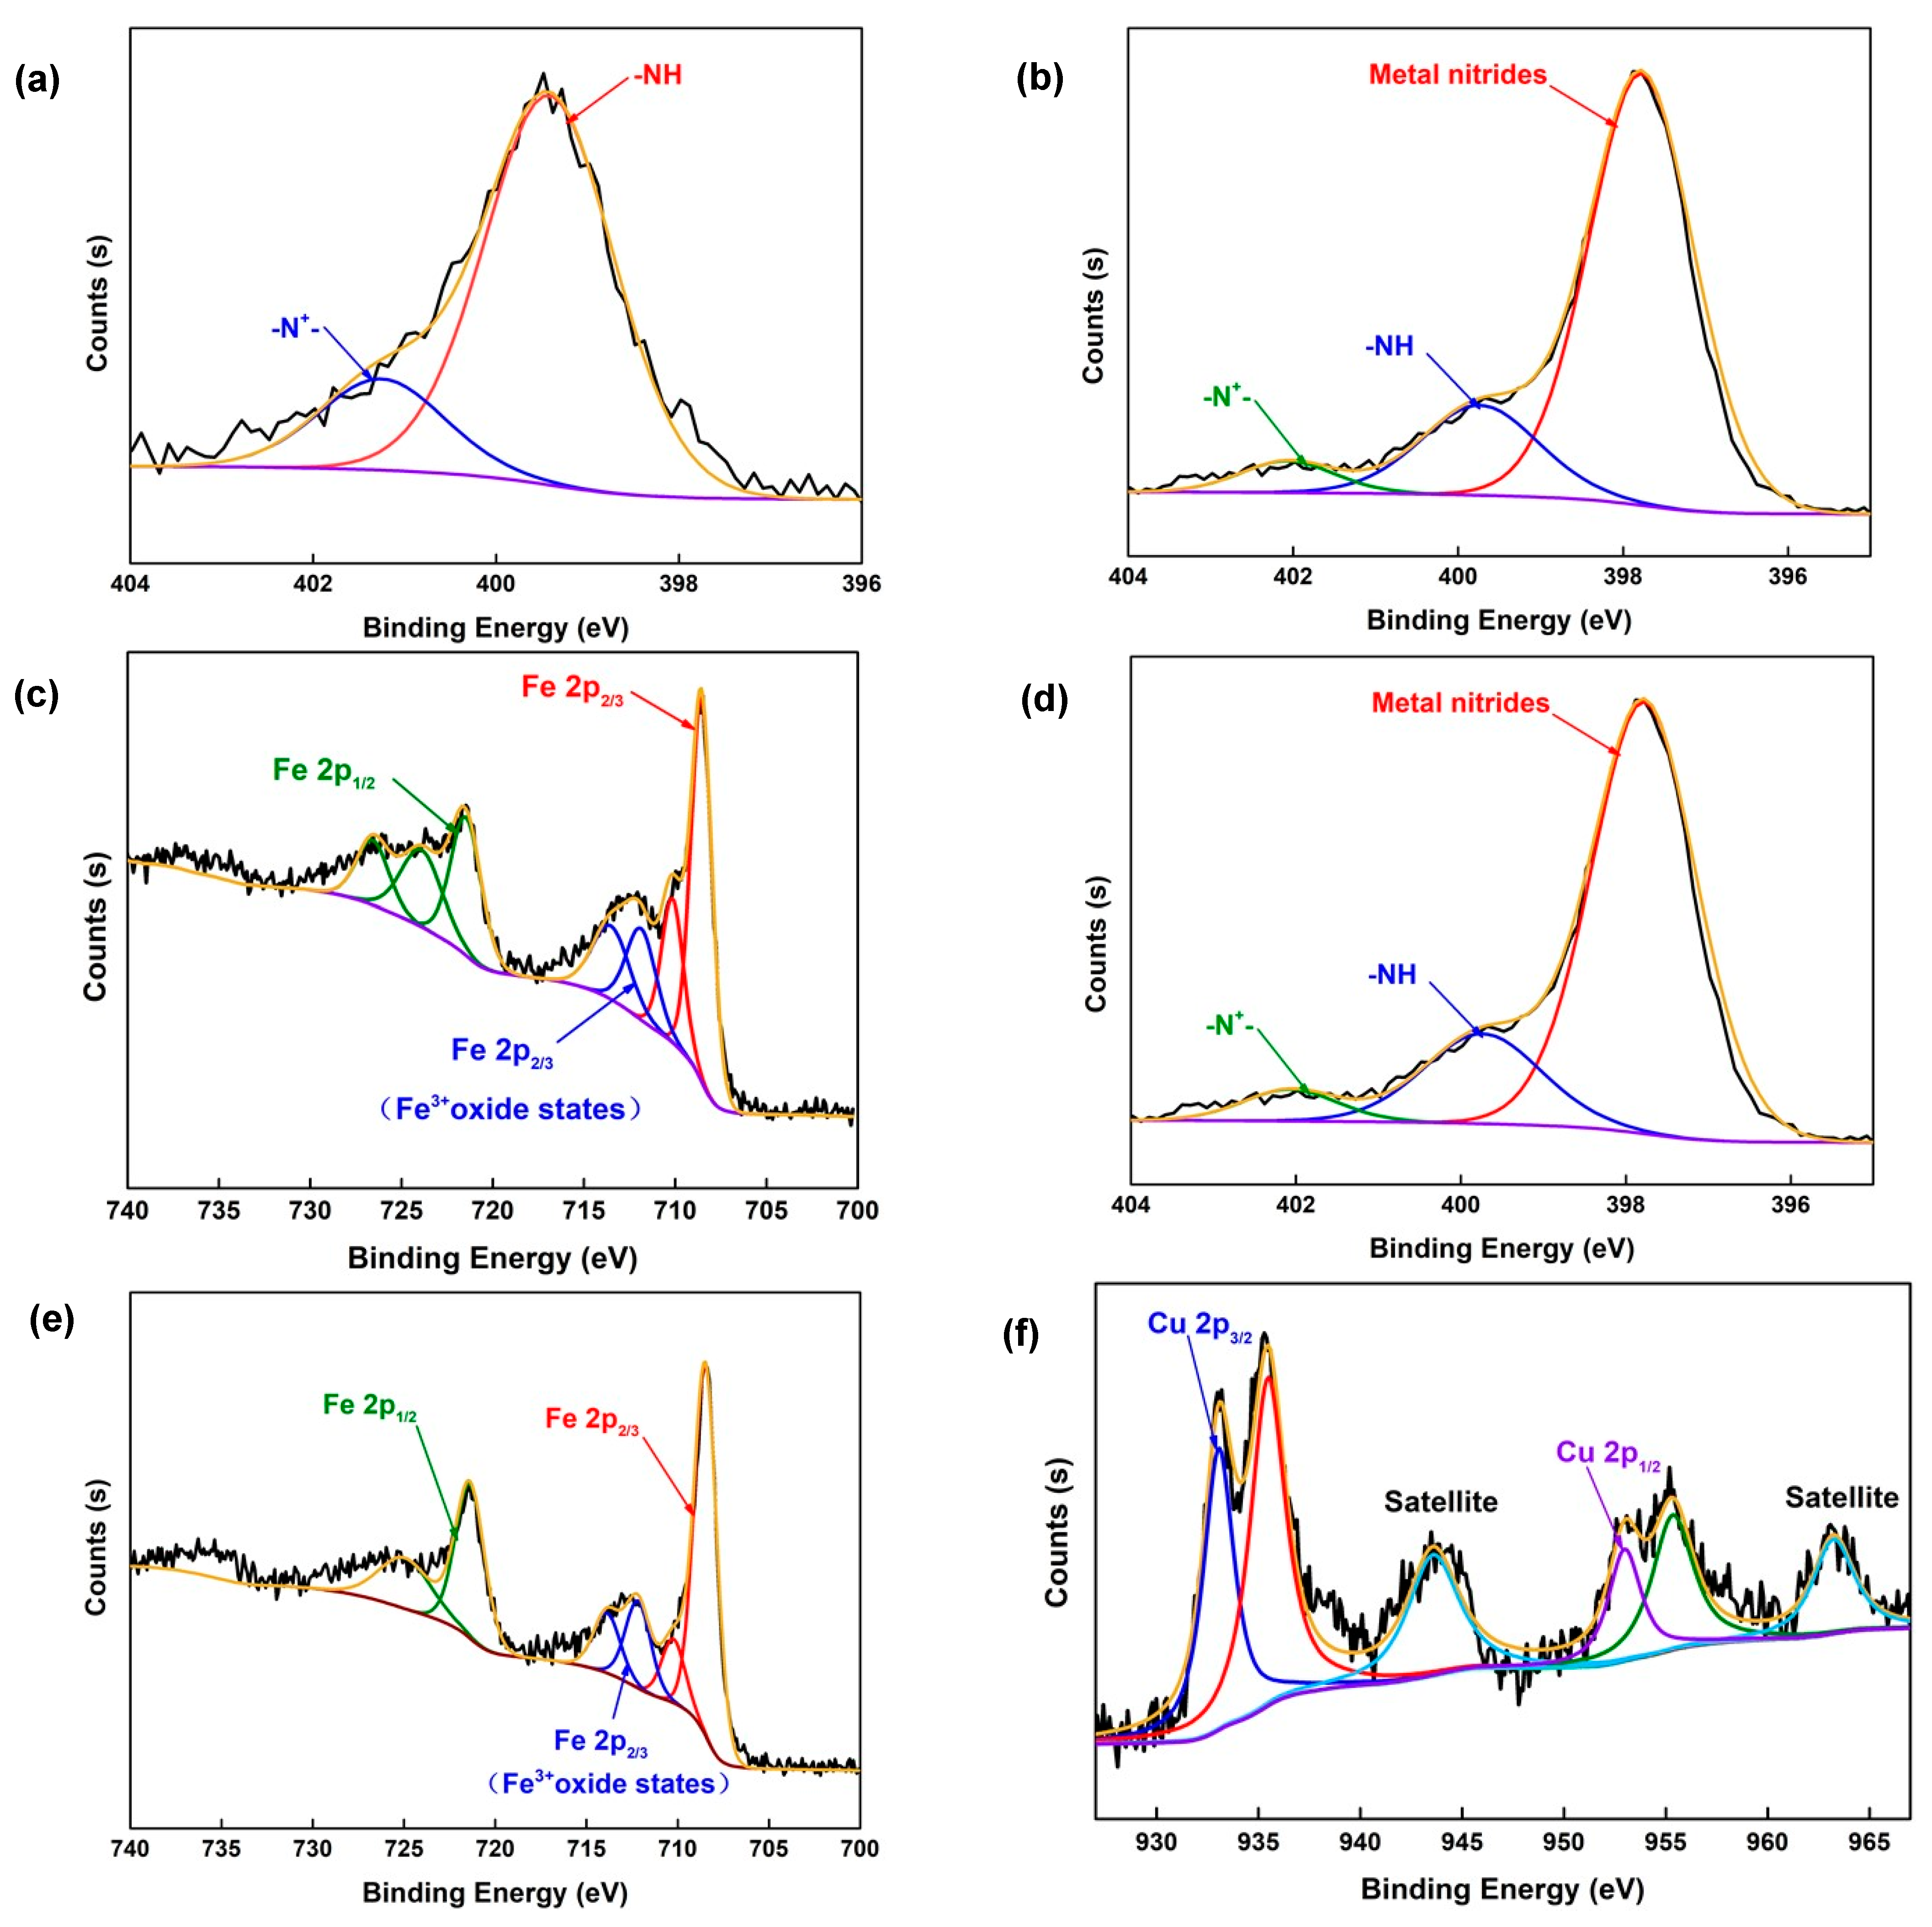
3.2.4. XPS Analysis
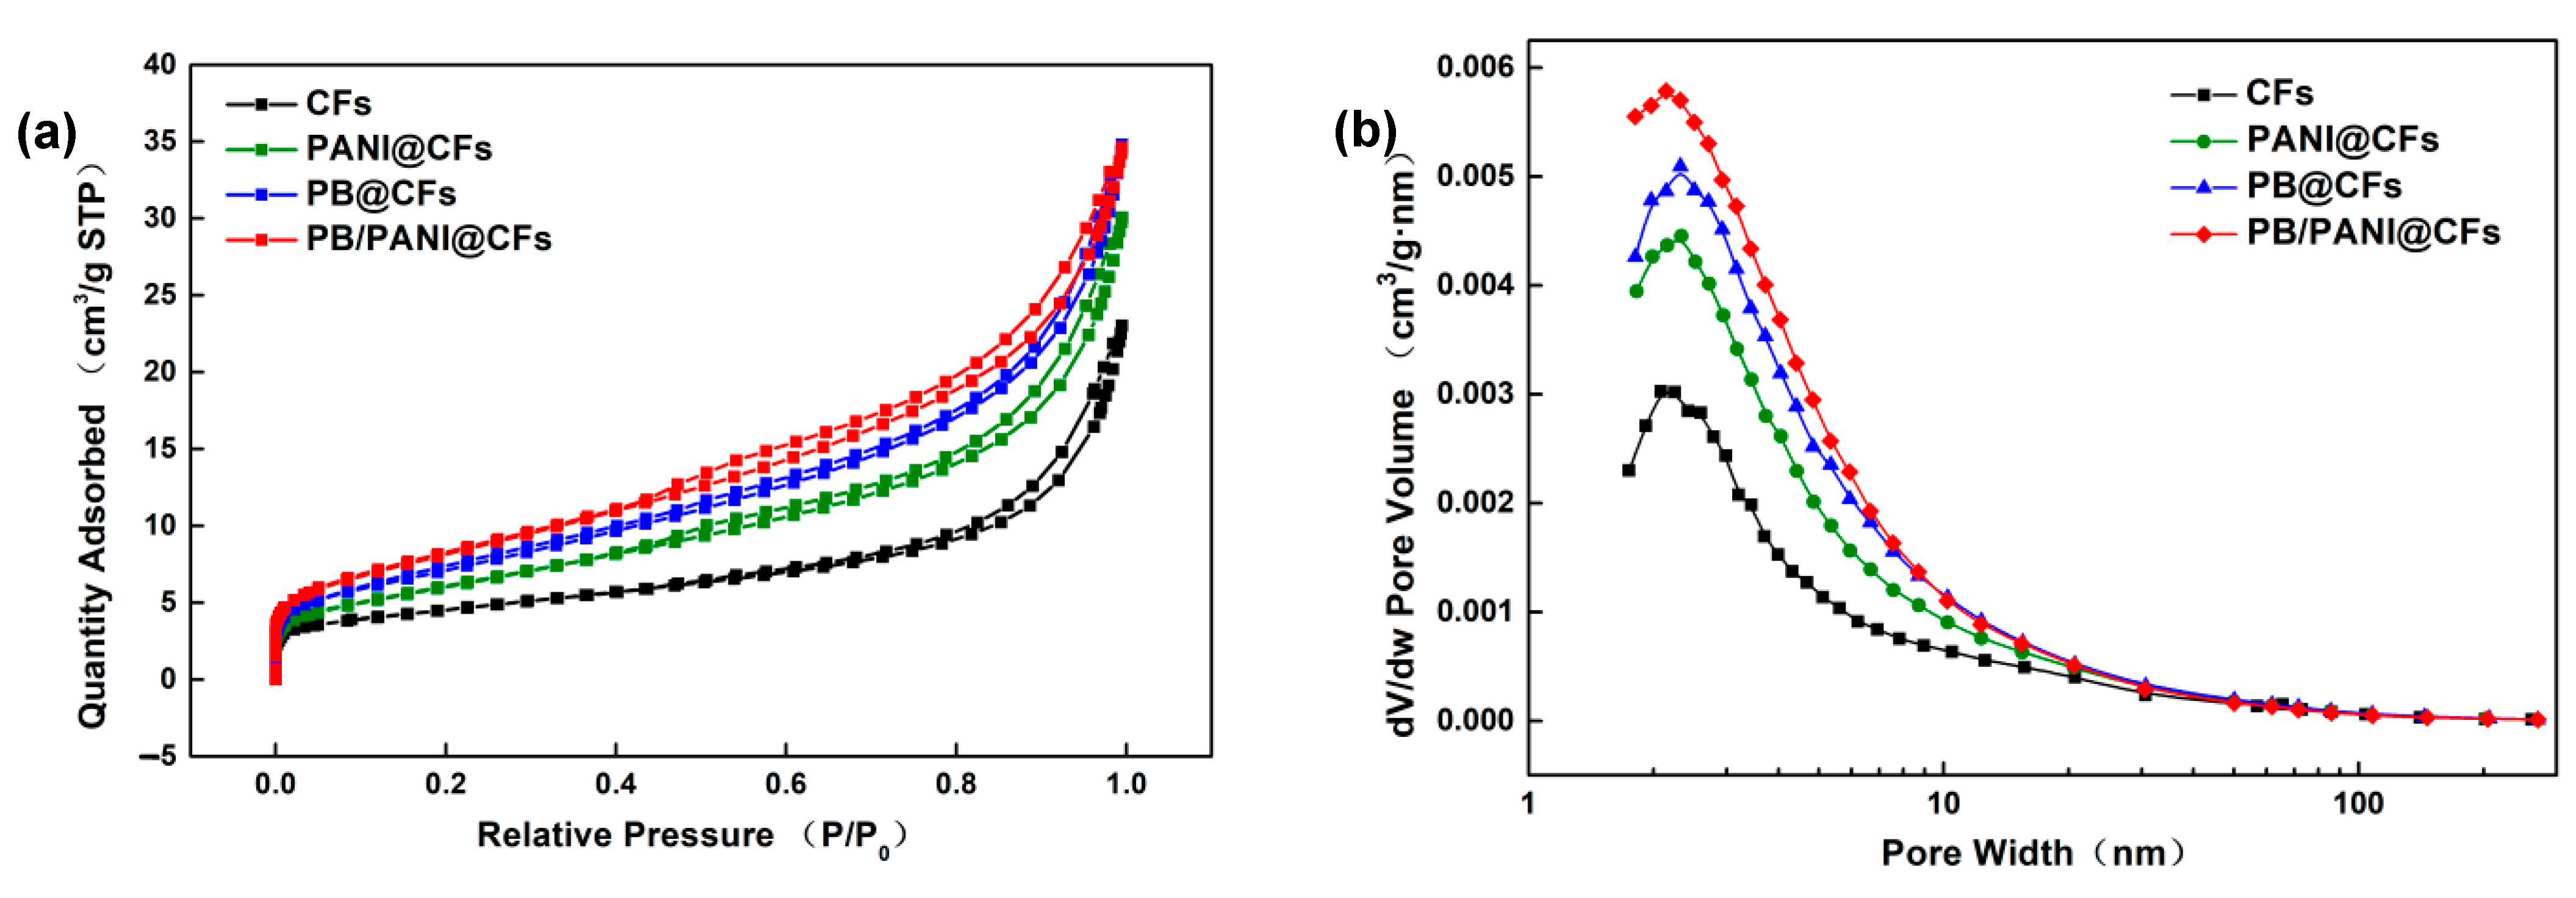
3.2.5. Nitrogen Adsorption Isotherm
3.3. Static Adsorption Study
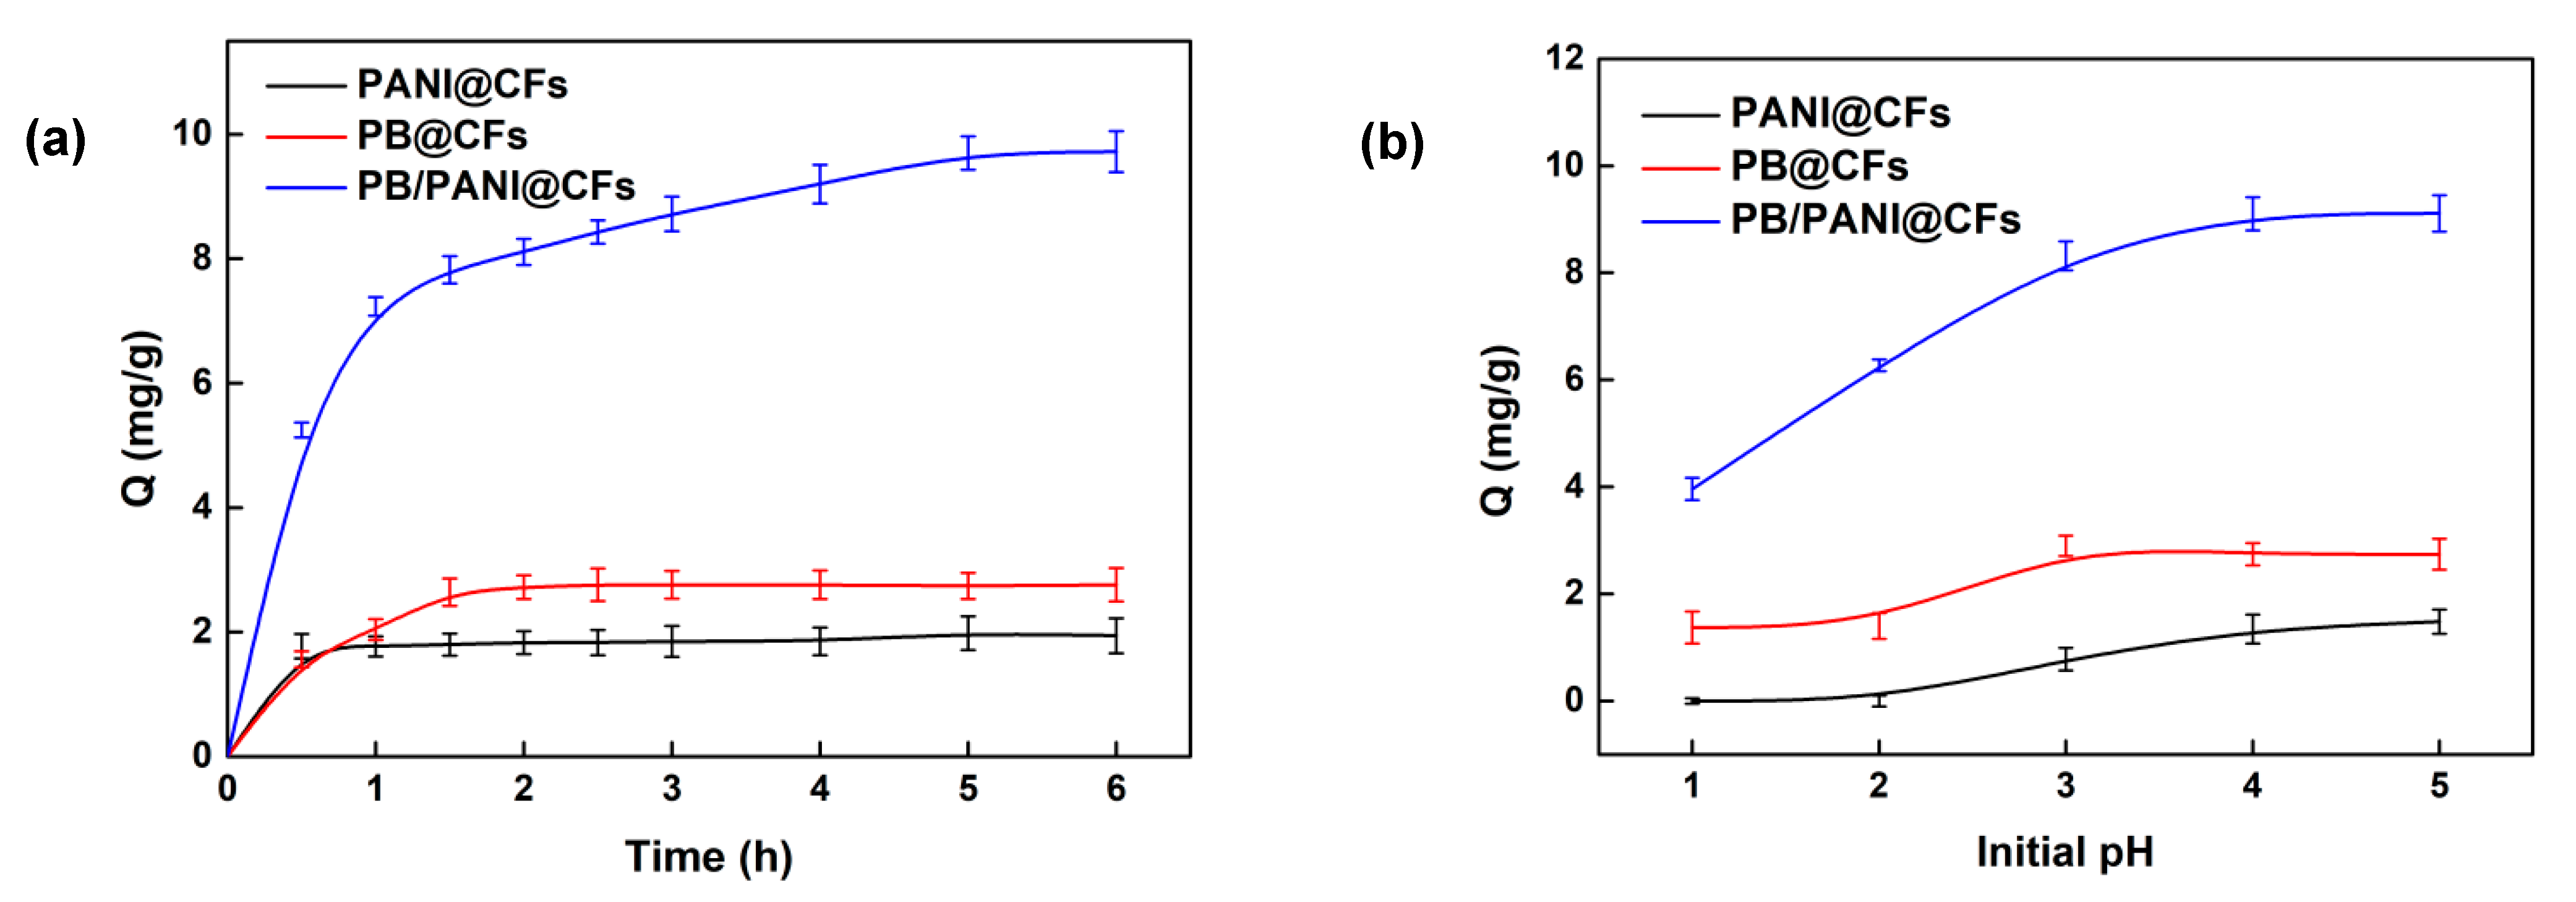
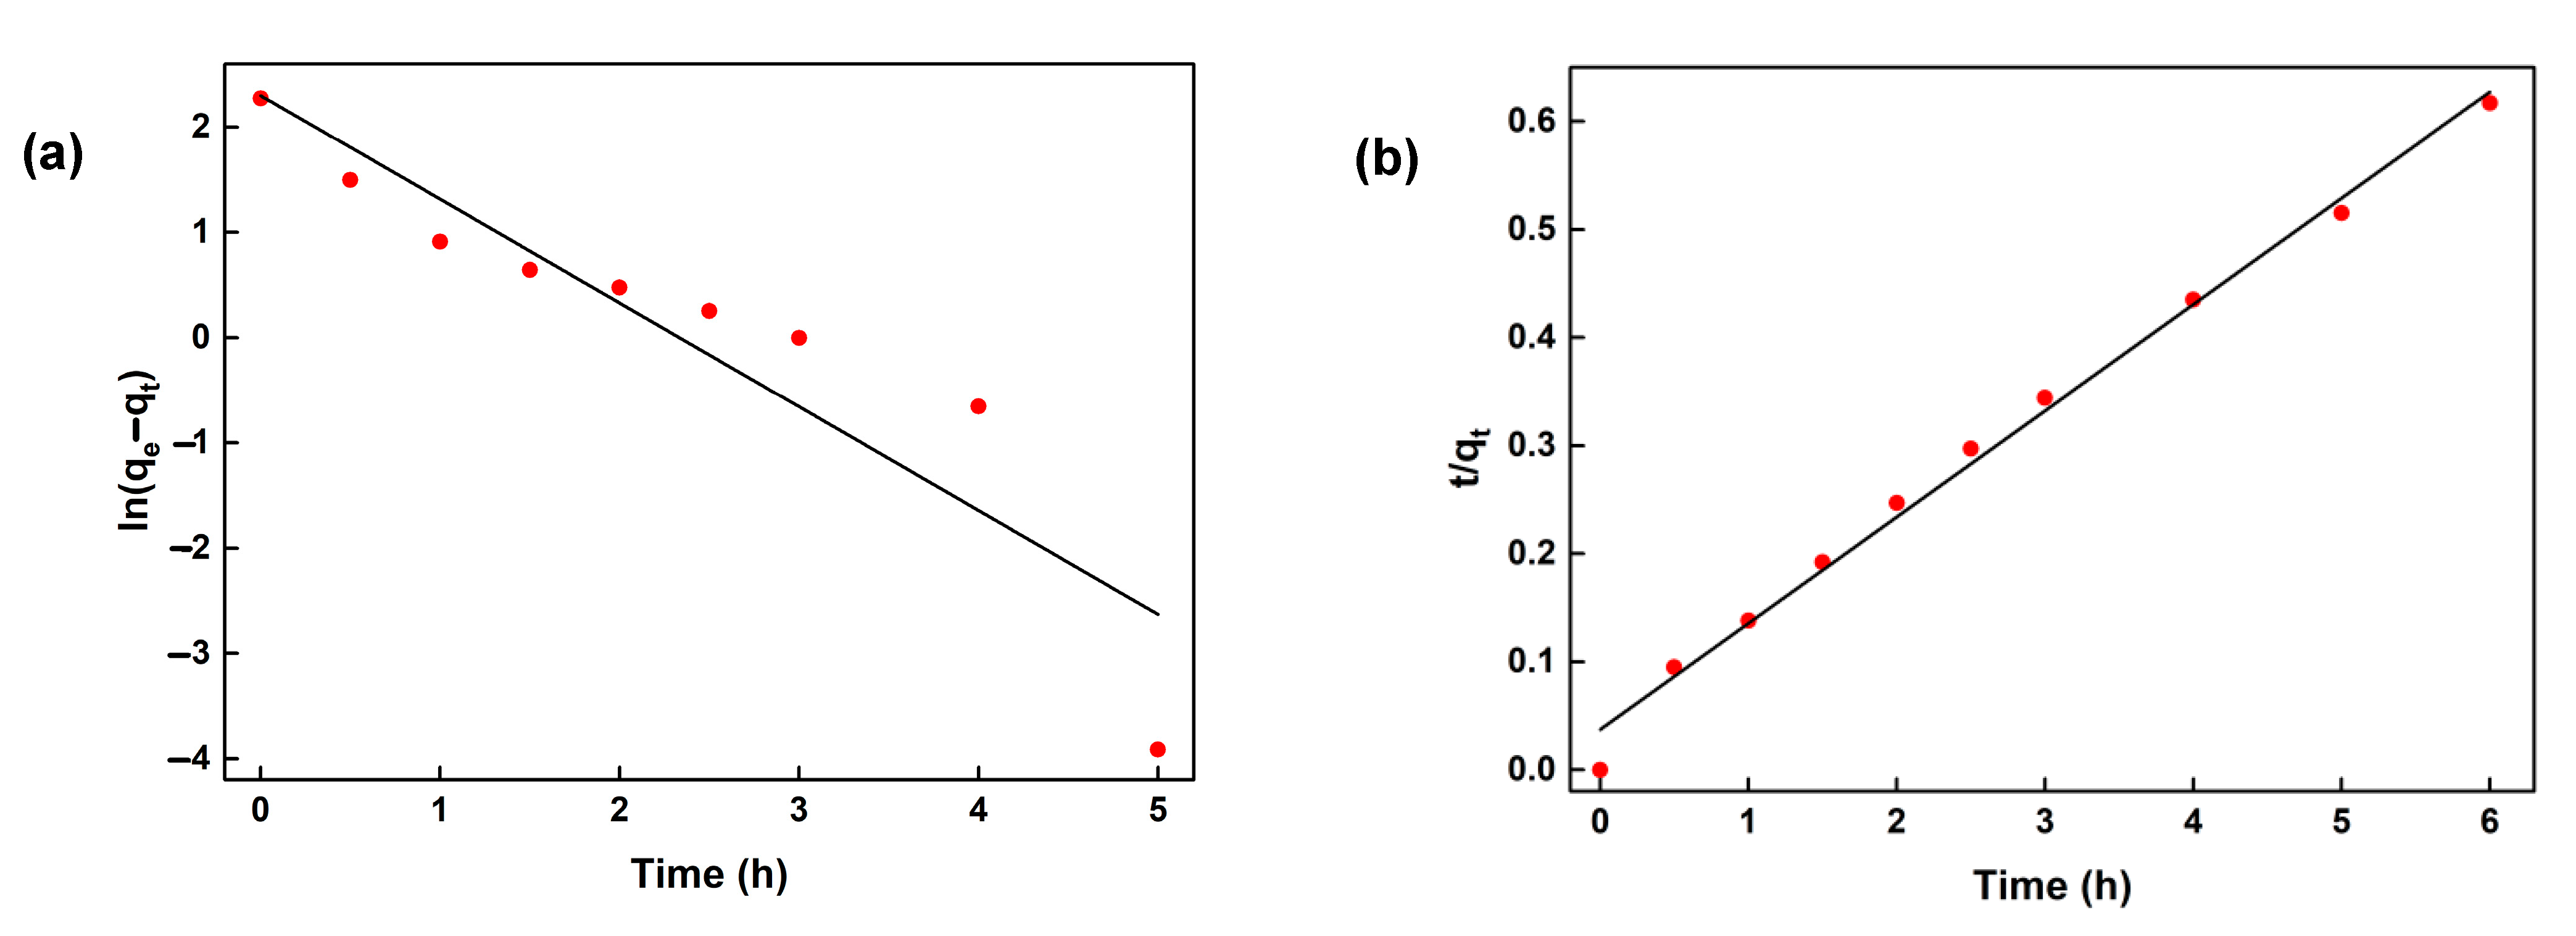
3.3.1. Influence of Adsorption Time on Cu2+ Adsorption Capacity and Adsorption Kinetic Models
3.3.2. Influence of Initial pH on Cu2+ Adsorption Capacity
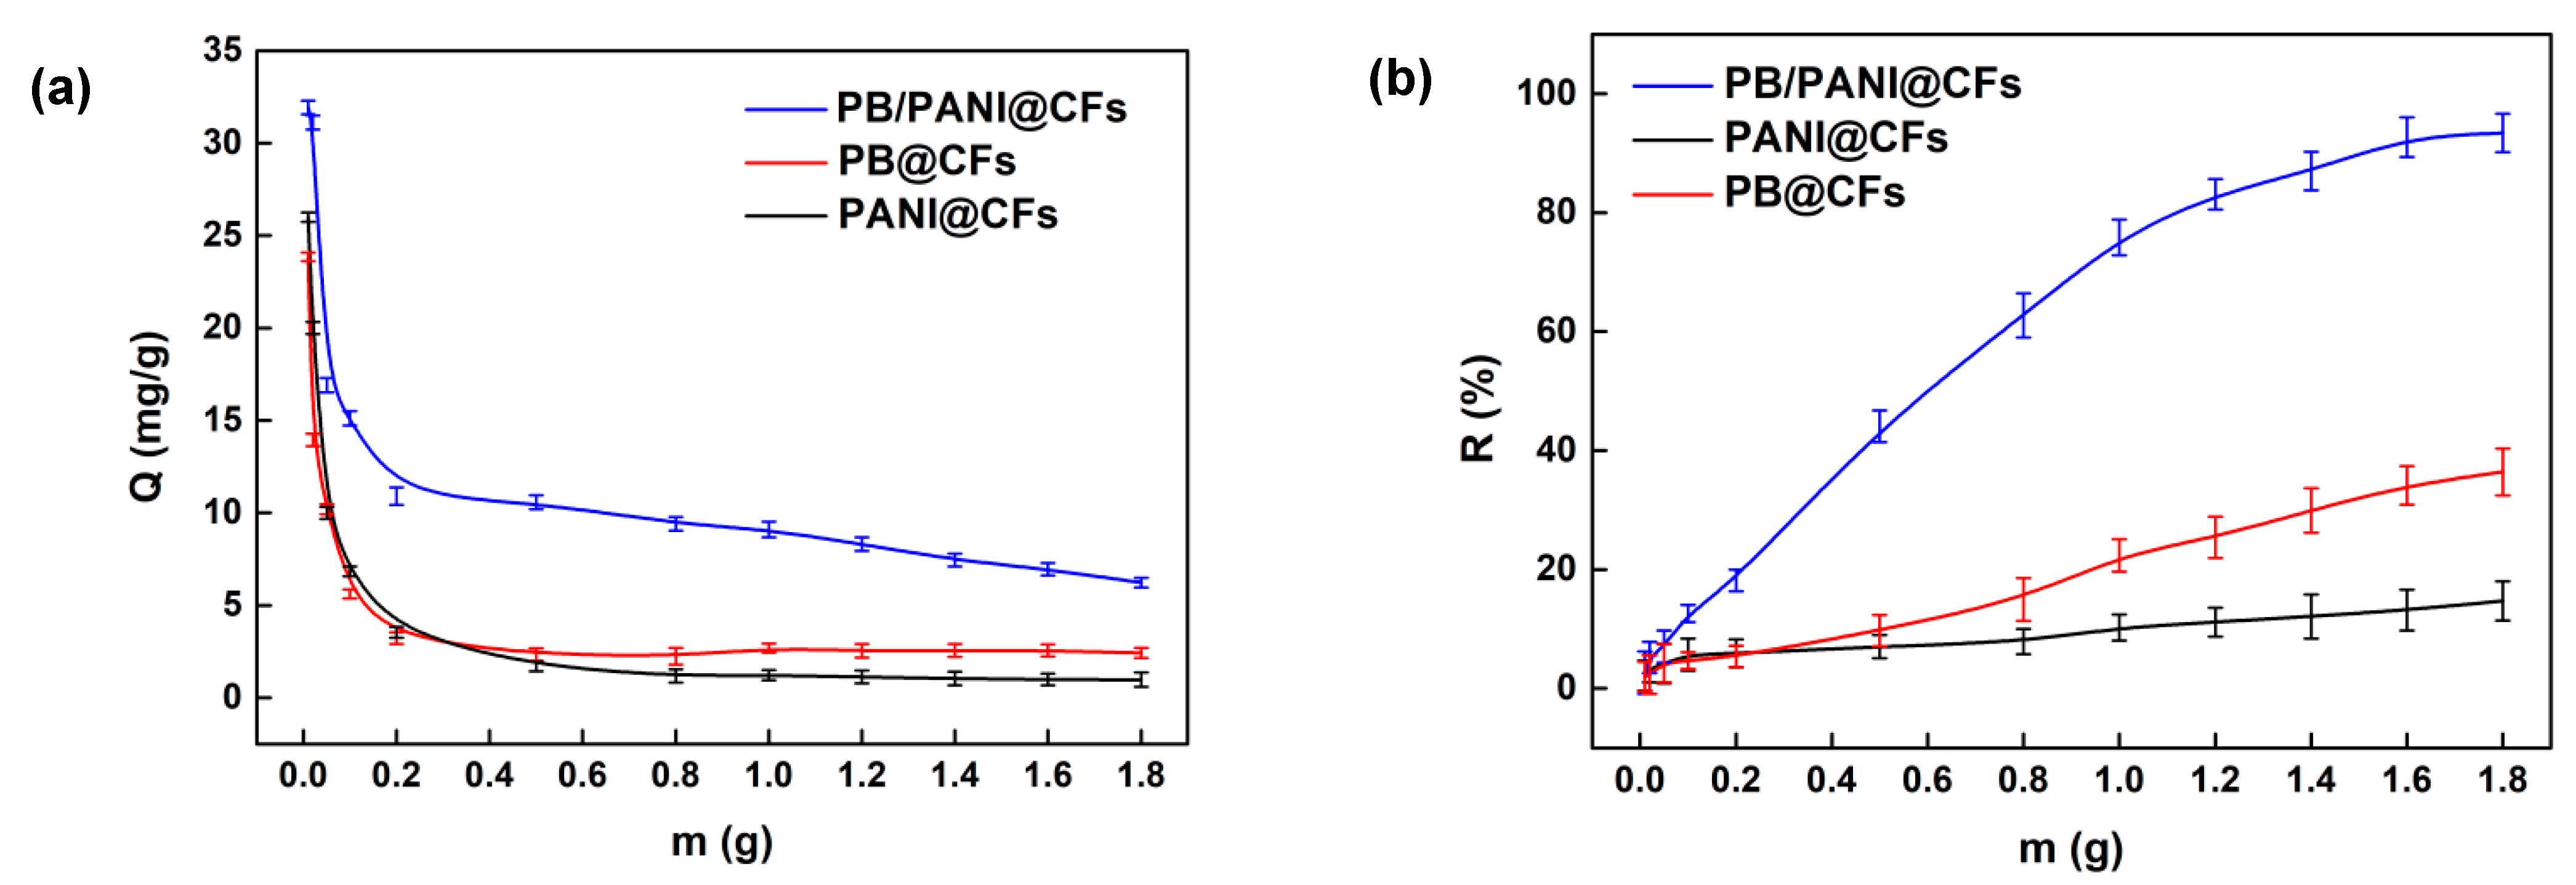
3.3.3. Influence of Adsorbent Dose on Cu2+ Adsorption Capacity
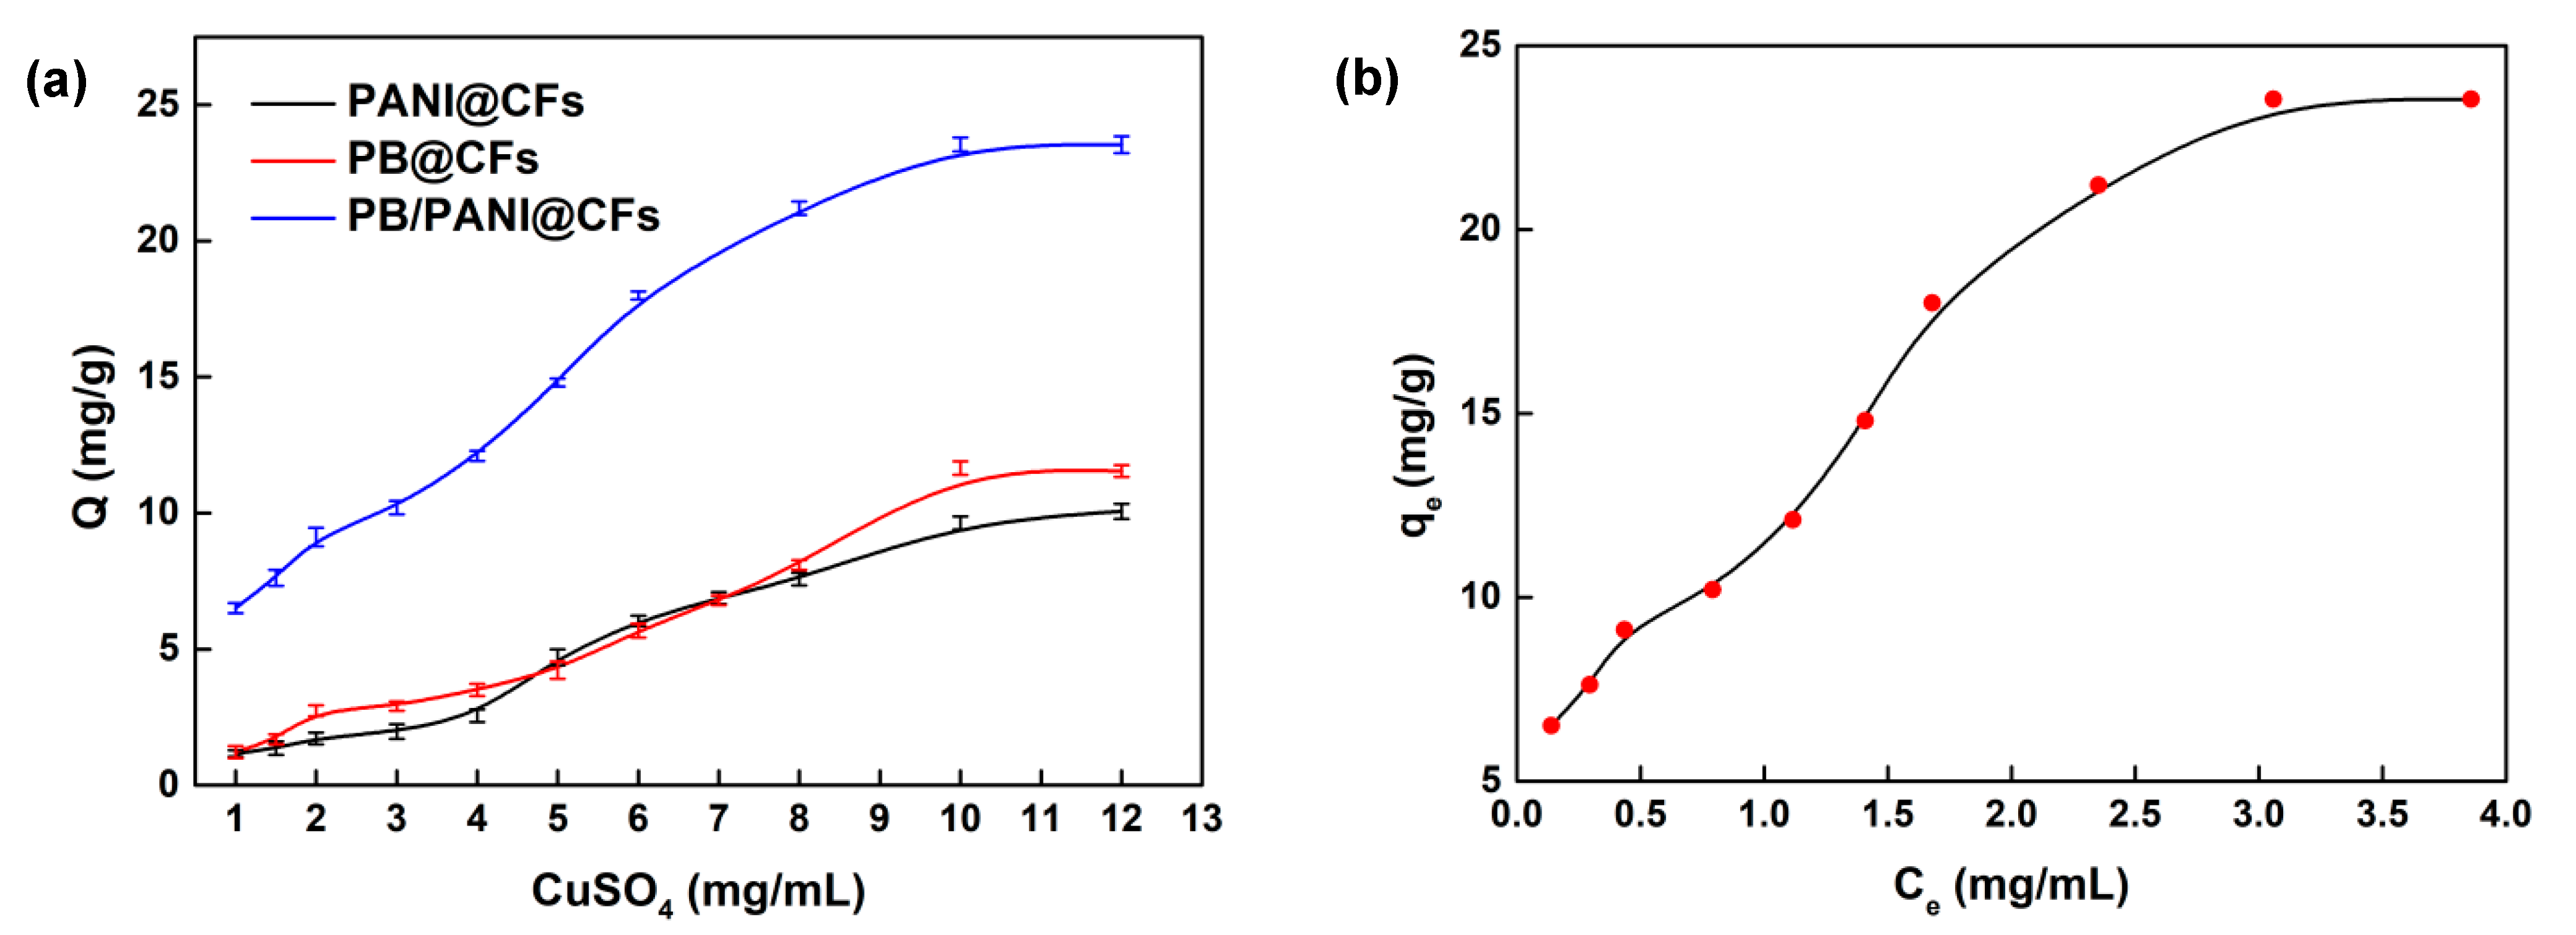
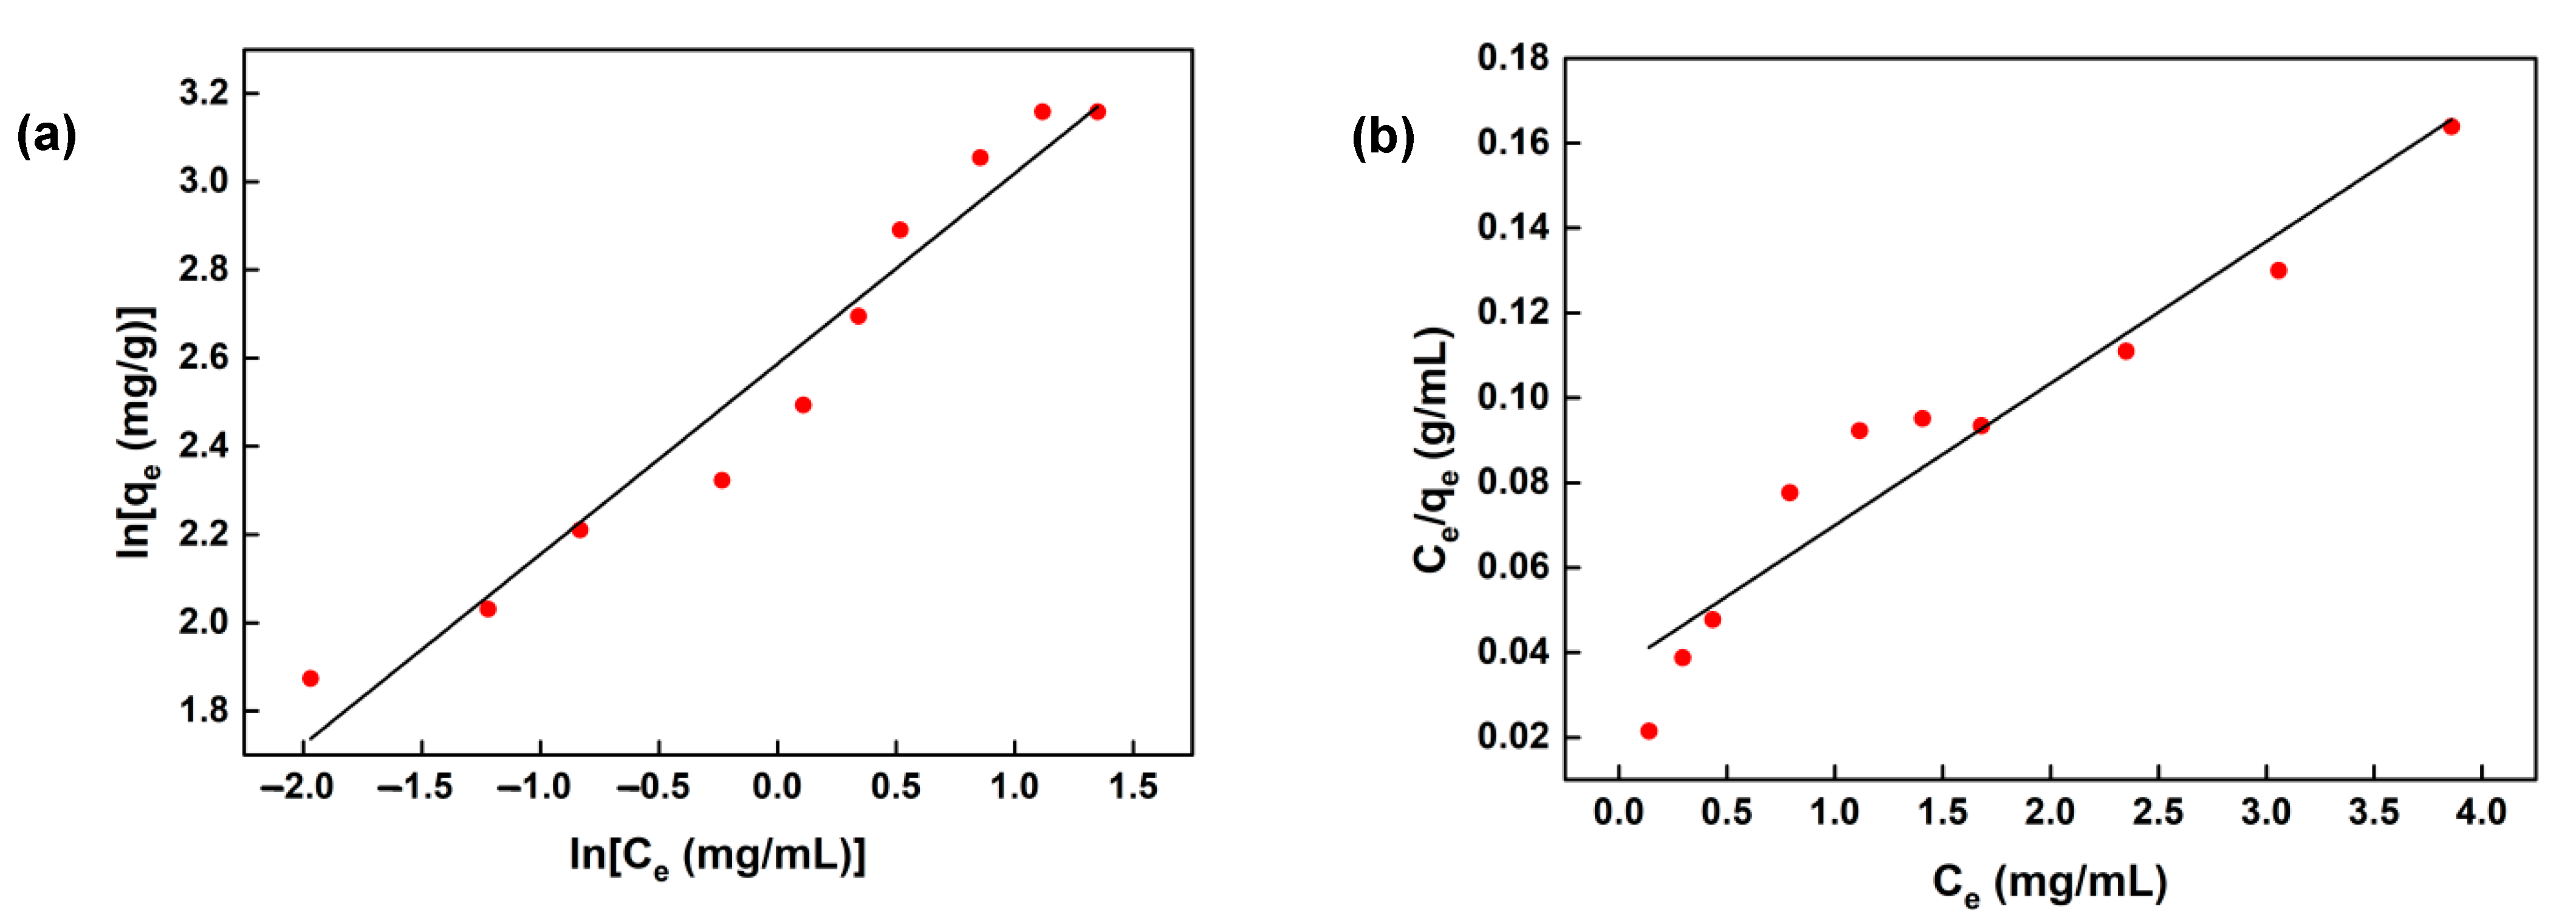
3.3.4. Influence of Initial Copper Sulfate Concentration on Adsorption Capacity and Isothermal Adsorption Models
4. Conclusions
Author Contributions
Funding
Institutional Review Board Statement
Informed Consent Statement
Data Availability Statement
Acknowledgments
Conflicts of Interest
References
- Zamora-Ledezma, C.; Negrete-Bolagay, D.; Figueroa, F.; Zamora-Ledezma, E.; Ni, M.; Alexis, F.; Guerrero, V.H. Heavy metal water pollution: A fresh look about hazards, novel and conventional remediation methods. Environ. Technol. Innov. 2021, 22, 101504. [Google Scholar] [CrossRef]
- Hänninen, H.; Forsström, A.; Yagodzinskyy, Y. Copper behavior in geological nuclear waste disposal. In Nuclear Corrosion: Research, Progress and Challenges; Woodhead Publishing: Cambridge, UK, 2020; pp. 391–402. [Google Scholar]
- Wang, J.; Dang, M.; Duan, C.; Zhao, W.; Wang, K. Carboxymethylated cellulose fibers as low-cost and renewable adsorbent materials. Ind. Eng. Chem. Res. 2017, 56, 14940–14948. [Google Scholar] [CrossRef]
- Zhu, B.; Fan, T.; Zhang, D. Adsorption of copper ions from aqueous solution by citric acid modified soybean straw. J. Hazard. Mater. 2008, 153, 300–308. [Google Scholar] [CrossRef] [PubMed]
- Manos, M.J.; Malliakas, C.D.; Kanatzidis, M.G. Heavy-metal-ion capture, ion-exchange, and exceptional acid stability of the open-framework chalcogenide (NH4)4In12Se20. Chem.—A Eur. J. 2007, 13, 51–58. [Google Scholar] [CrossRef]
- Hamza, M.F.; Hamad, N.A.; Hamad, D.M.; Khalafalla, M.S.; Abdel-Rahman, A.A.; Zeid, I.F.; Wei, Y.; Hessien, M.M.; Fouda, A.; Salem, W.M. Synthesis of ecofriendly biopolymer, alginate-chitosan composite to adsorb the heavy metals, Cd(II) and Pb(II) from contaminated effluents. Materials 2021, 14, 2189. [Google Scholar] [CrossRef]
- Blokhin, A.A.; Murashkin, Y.V.; Mikhaylenko, M.A. Ion exchange treatment of cobalt acetate solutions to remove iron (III) impurity. Russ. J. Appl. Chem. 2021, 94, 116–121. [Google Scholar] [CrossRef]
- Hunter, H.A.; Ling, F.T.; Peters, C.A. Coprecipitation of heavy metals in calcium carbonate from coal fly ash leachate. ACS EST Water 2021, 1, 339–345. [Google Scholar] [CrossRef]
- Pettipher, G.L.; Mansell, R.; McKinnon, C.H.; Cousins, C.M. Rapid membrane filtration-epifluorescent technique for direct enumeration of bacteria in raw milk. Appl. Environ. Microb. 1980, 39, 423–429. [Google Scholar] [CrossRef] [Green Version]
- Malara, A.; Fotia, A.; Paone, E.; Serrano, G. Electrospun nanofibers and electrochemical techniques for the detection of heavy metal ions. Materials 2021, 14, 3000. [Google Scholar] [CrossRef]
- Saeki, D.; Yonamine, G.; Matsuyama, H. Effect of hydrophilic polymer modification of reverse osmosis membrane surfaces on organic adsorption and biofouling behavior. Colloid Surf. A 2021, 609, 125680. [Google Scholar] [CrossRef]
- El-Halim, E.H.A.; El-Gayar, D.A.; Farag, H. Removal of copper ions from wastewater by ion exchange resin using pulsation technique. Mater. Sci. Forum. 2020, 1008, 191–201. [Google Scholar] [CrossRef]
- Nilchi, A.; Atashi, H.; Javid, A.H.; Saberi, R. Preparations of PAN-based adsorbers for separation of cesium and cobalt from radioactive wastes. Appl. Radiat. Isot. 2007, 65, 482–487. [Google Scholar] [CrossRef] [PubMed]
- Moradi, G.; Zinadini, S.; Rajabi, L.; Derakhshan, A.A. Removal of heavy metal ions using a new high performance nanofiltration membrane modified with curcumin boehmite nanoparticles. Chem. Eng. J. 2020, 390, 124546. [Google Scholar] [CrossRef]
- Wang, C.; Luo, Y.; He, X.; Hong, D.; Wang, J.; Chen, F.; Chen, C.; Sun, B. Porous high-valence metal-organic framework featuring open coordination sites for effective water adsorption. Inorg. Chem. 2019, 58, 3058–3064. [Google Scholar] [CrossRef] [PubMed]
- Li, W.; Liu, X.; Hu, Y.; Teng, F.; Hu, Y. Potassium isotopic fractionation during clay adsorption. Geochim. Cosmochim. Acta 2021, 304, 160–177. [Google Scholar] [CrossRef]
- Jiang, B.; Jiang, N.; Chang, Y. Synthesis of highly active Cu(I)-Y(III)-Y zeolite and its selective adsorption desulfurization performance in presence of xylene isomers. Pet. Sci. 2021, 18, 295–306. [Google Scholar] [CrossRef]
- Miao, Y.; Peng, W.; Cao, Y.; Chang, L.; Fan, G.; Yu, F. Facile preparation of sulfhydryl modified montmorillonite nanosheets hydrogel and its enhancement for Pb(II) adsorption. Chemosphere 2021, 280, 130727. [Google Scholar] [CrossRef]
- Le, L.H.T.; Nguyen, S.A.; Nguyen, T.D.; Le, V.C.T.; Cao, H.V.; Nguyen, N.B.; Le, T.P.T. Prussian blue analogues of A2[Fe(CN)6] (A: Cu2+, Co2+, and Ni2+) and their composition-dependent sorption performances towards Cs+, Sr2+, and Co2+. J. Nanomater. 2021, 2021, 5533620. [Google Scholar] [CrossRef]
- Chen, J.H.; Liu, P.S.; Cheng, W. PBA-loaded albite-base ceramic foam in application to adsorb harmful ions of Cd, Cs and As(V) in water. Multidiscip. Model. Mater. Struct. 2019, 15, 659–672. [Google Scholar] [CrossRef]
- Hu, C.-W.; Kawamoto, T.; Tanaka, H.; Takahashi, A.; Lee, K.-M.; Kao, S.-Y.; Liao, Y.-C.; Ho, K.-C. Water processable Prussian blue-polyaniline: Polystyrene sulfonate nanocomposite (PB-PANI:PSS) for multi-color electrochromic applications. J. Mater. Chem. C 2016, 4, 10293–10300. [Google Scholar] [CrossRef]
- Moosavian, M.A.; Moazezi, N. Removal of cadmium and zinc ions from industrial wastewater using nanocomposites of PANI/ZnO and PANI/CoHCF: A comparative study. Desalination Water Treat. 2016, 57, 20817–20836. [Google Scholar] [CrossRef]
- Ishizaki, M.; Akiba, S.; Ohtani, A.; Hoshi, Y.; Ono, K.; Matsuba, M.; Togashi, T.; Kananizuka, K.; Sakamoto, M.; Takahashi, A. Proton-exchange mechanism of specific Cs+ adsorption via lattice defect sites of Prussian blue filled with coordination and crystallization water molecules. Dalton Trans. 2013, 42, 16049–16055. [Google Scholar] [CrossRef] [PubMed]
- Ohara, E.; Soejima, T.; Ito, S. Removal of low concentration Cs(I) from water using Prussian blue. Inorg. Chim. Acta 2021, 514, 120029. [Google Scholar] [CrossRef]
- Fang, Q.; Li, G.; Lin, H.; Liu, F. Solar-driven organic solvents purification enabled by robust cubic Prussian blue. J. Mater. Chem. A 2019, 7, 8960–8966. [Google Scholar] [CrossRef]
- Bilal, M.; Shah, J.A.; Ashfaq, T.; Gardazi, S.; Tahir, A.A.; Pervez, A.; Haroon, H.; Mahmood, Q. Waste biomass adsorbents for copper removal from industrial wastewater—a review. J. Hazard. Mater. 2013, 263, 322–333. [Google Scholar] [CrossRef]
- Hou, X.; Sun, L.; Hu, Y.; An, X.; Qian, X. De-doped polyaniline as a mediating layer promoting in-situ growth of metal–organic frameworks on cellulose fiber and enhancing adsorptive-photocatalytic removal of ciprofloxacin. Polymers 2021, 13, 3298. [Google Scholar] [CrossRef]
- Chen, Y.; Li, S.; Pei, X.; Zhou, J.; Feng, X.; Zhang, S.; Cheng, Y.; Li, H.; Han, R.; Wang, B. A solvent-free hot-pressing method for preparing metal-organic-framework coatings. Angew. Chem. Int. Ed. 2016, 55, 3419–3423. [Google Scholar] [CrossRef]
- Silva Pinto, M.D.; Sierra-Avila, C.A.; Hinestroza, J.P. In situ synthesis of a Cu-BTC metal-organic framework (MOF 199) onto cellulosic fibrous substrates: Cotton. Cellulose 2012, 19, 1771–1779. [Google Scholar] [CrossRef]
- Duan, C.; Meng, J.; Wang, X.; Meng, X.; Sun, X.; Xu, Y.; Zhao, W.; Ni, Y. Synthesis of novel cellulose-based antibacterial composites of Ag nanoparticles@metal-organic frameworks@carboxymethylated fibers. Carbohydr. Polym. 2018, 193, 82–88. [Google Scholar] [CrossRef]
- Zhao, J.; Losego, M.D.; Lemaire, P.C.; Williams, P.S.; Gong, B.; Atanasov, S.E.; Blevins, T.M.; Oldham, C.J.; Walls, H.J.; Shepherd, S.D.; et al. Highly adsorptive, MOF-functionalized nonwoven fiber mats for hazardous gas capture enabled by atomic layer deposition. Adv. Mater. Interfaces 2014, 1, 1400040. [Google Scholar] [CrossRef]
- Bao, T.; Su, Y.; Zhang, N.; Gao, Y.; Wang, S. Hydrophilic carboxyl cotton for in situ growth of UiO-66 and its application as adsorbents. Ind. Eng. Chem. Res. 2019, 58, 20331–20339. [Google Scholar] [CrossRef]
- Abdelhameed, R.M.; Kamel, O.M.H.M.; Amr, A.; Rocha, J.; Silva, A.M.S. Antimosquito activity of a titanium-organic framework supported on fabrics. ACS Appl. Mater. Inter. 2017, 9, 22112–22120. [Google Scholar] [CrossRef] [PubMed]
- Shen, C.; Mao, Z.; Xu, H.; Zhang, L.; Zhong, Y.; Wang, B.; Feng, X.; Tao, C.; Sui, X. Catalytic MOF-loaded cellulose sponge for rapid degradation of chemical warfare agents simulant. Carbohydr. Polym. 2019, 213, 184–191. [Google Scholar] [CrossRef] [PubMed]
- Au-Duong, A.N.; Lee, C.K. Flexible metal-organic framework-bacterial cellulose nanocomposite for iodine capture. Cryst. Growth Des. 2018, 18, 356–363. [Google Scholar] [CrossRef]
- Zhang, Y.; Tu, L.; Zeng, Q.; Kong, X. Effect of protein molecules on the photoluminescence properties and stability of water-soluble CdSe/ZnS core-shell quantum dots. Chin. Sci. Bull. 2013, 58, 2616–2621. [Google Scholar] [CrossRef] [Green Version]
- Mao, H.; Wu, X.; Qian, X.; An, X. Conductivity and flame retardancy of polyaniline-deposited functional cellulosic paper doped with organic sulfonic acids. Cellulose 2014, 21, 697–704. [Google Scholar] [CrossRef]
- Zhou, Y.; Ding, C.; Qian, X.; An, X. Further improvement of flame retardancy of polyaniline-deposited paper composite through using phytic acid as dopant or co-dopant. Carbohydr. Polym. 2015, 115, 670–676. [Google Scholar] [CrossRef]
- Chang, Z.; An, X.; Qian, X. High mass loading polyaniline layer anchored cellulose fibers: Enhanced interface junction for high conductivity and flame retardancy. Carbohydr. Polym. 2020, 230, 115660. [Google Scholar] [CrossRef]
- Rafiqi, F.A.; Majid, K. Removal of copper from aqueous solution using polyaniline and polyaniline/ferricyanide compo-site. J. Environ. Chem. Eng. 2015, 3, 2492–2501. [Google Scholar] [CrossRef]
- Lei, H.; Pan, N.; Wang, X.; Zou, H. Facile synthesis of phytic acid impregnated polyaniline for enhanced U(VI) adsorption. J. Chem. Eng. Data 2018, 63, 3989–3997. [Google Scholar] [CrossRef]
- Kim, H.J.; Im, S.; Kim, J.C.; Hong, W.G.; Shin, K.; Jeong, H.Y.; Hong, Y.J. Phytic acid doped polyaniline nanofibers for enhanced aqueous copper(II) adsorption capability. ACS Sustain. Chem. Eng. 2017, 5, 6654–6664. [Google Scholar] [CrossRef]
- Ali, M.B.; Wang, F.; Boukherroub, R.; Lei, W.; Xia, M. Phytic acid-doped polyaniline nanofibers-clay mineral for efficient adsorption of copper (II) ions. J. Colloid Interf. Sci. 2019, 553, 688–698. [Google Scholar]
- Moharram, M.A.; Mahmoud, O.M. X-ray diffraction methods in the study of the effect of microwave heating on the transformation of cellulose I into cellulose II during mercerization. J. Appl. Polym. Sci. 2010, 105, 2978–2983. [Google Scholar] [CrossRef]
- Xu, L.; Sun, Y.; Han, B.; Su, C. Preparation of polyaniline/FeFe(CN)6 composite and its electrochemical performance as cathode material of lithium ion battery. Nano 2020, 15, 2050107. [Google Scholar] [CrossRef]
- Srivastava, N.; Shripathi, T.; Srivastava, P.C. Core level X-ray photoelectron spectroscopy study of exchange coupled Fe/NiO bilayer interfaced with Si substrate (Fe/NiO–nSi structure). J. Electron Spectrosc. Relat. Phenom. 2013, 191, 20–26. [Google Scholar] [CrossRef]
- Chen, H.Y.; Chen, L.; Lin, J.; Tan, K.L.; Li, J. Copper sites in copper-exchanged ZSM-5 for CO activation and methanol synthesis: XPS and FTIR studies. Inorg. Chem. 1997, 36, 1417–1423. [Google Scholar] [CrossRef]
- Qusti, A.H. Removal of chromium(VI) from aqueous solution using manganese oxide nanofibers. J. Ind. Eng. Chem. 2014, 20, 3394–3399. [Google Scholar] [CrossRef]
- Ho, Y.S.; McKay, G. Pseudo-second order model for sorption processes. Process Biochem. 1999, 34, 451–465. [Google Scholar] [CrossRef]
- Long, Q.; Kang, B.; Dai, Y.D.; Li, J. Study of adsorption of copper ion in radioactive wastewater by zinc ferrocyanide. Int. Mater. Rev. 2014, 28, 95–98. [Google Scholar]
- Gregg, S.J.; Sing, K.S.W. Adsorption Surface Area and Porosity; Academic Press: London, UK, 1982. [Google Scholar]
- Wang, N.; Chen, J.; Wang, J.; Feng, J.; Yan, W. Removal of methylene blue by polyaniline/TiO2 hydrate: Adsorption kinetic, isotherm and mechanism studies. Powder Technol. 2019, 347, 93–102. [Google Scholar] [CrossRef]
- Febrianto, J.; Kosasiha, A.N.; Sunarso, J.; Ju, Y.H.; Indraswati, N.; Ismadji, S. Equilibrium and kinetic studies in adsorption of heavy metals using biosorbent: A summary of recent studies. J. Hazard. Mater. 2009, 162, 616–645. [Google Scholar] [CrossRef] [PubMed]
- Qu, R.; Wang, M.; Song, R.; Sun, C.; Zhang, Y.; Sun, X.; Ji, C.; Wang, C.; Yin, P. Adsorption kinetics and isotherms of Ag(I) and Hg(II) onto silica gel with functional groups of hydroxyl- or amino-terminated polyamines. J. Chem. Eng. Data 2011, 56, 1982–1990. [Google Scholar] [CrossRef]


| Sample | SBET m2·g−1 | VT cm3·g−1 | Vmicro cm3·g−1 | Vmeso cm3·g−1 |
|---|---|---|---|---|
| CFs | 15.83 | 0.033 | 0.0066 | 0.035 |
| PANI@CFs | 21.84 | 0.044 | 0.0086 | 0.045 |
| PB@CFs | 25.76 | 0.051 | 0.0100 | 0.051 |
| PB/PANI@CFs | 29.50 | 0.054 | 0.0120 | 0.051 |
| Pseudo-First Order Kinetic | Pseudo-Second Order Kinetic | ||||
|---|---|---|---|---|---|
| k1 (h−1) | qe (mg·g−1) | R2 | k2 (mg·g−1·h−1) | qe (mg·g−1) | R2 |
| 0.9855 | 9.98 | 0.855 | 0.2598 | 10.17 | 0.993 |
| Freundlich | Langmuir | ||||
|---|---|---|---|---|---|
| n | KF [(mg·g−1)/(L·mg)1/n] | R2 | qm (mg·g−1) | KL (L·mg−1) | R2 |
| 2.32 | 1.54 | 0.954 | 27.39 | 1.09 | 0.926 |
Publisher’s Note: MDPI stays neutral with regard to jurisdictional claims in published maps and institutional affiliations. |
© 2022 by the authors. Licensee MDPI, Basel, Switzerland. This article is an open access article distributed under the terms and conditions of the Creative Commons Attribution (CC BY) license (https://creativecommons.org/licenses/by/4.0/).
Share and Cite
Wang, X.; Li, Q.; Yang, D.; An, X.; Qian, X. Phytic Acid Doped Polyaniline as a Binding Coating Promoting Growth of Prussian Blue on Cotton Fibers for Adsorption of Copper Ions. Coatings 2022, 12, 138. https://doi.org/10.3390/coatings12020138
Wang X, Li Q, Yang D, An X, Qian X. Phytic Acid Doped Polyaniline as a Binding Coating Promoting Growth of Prussian Blue on Cotton Fibers for Adsorption of Copper Ions. Coatings. 2022; 12(2):138. https://doi.org/10.3390/coatings12020138
Chicago/Turabian StyleWang, Xueyao, Qiang Li, Dongmei Yang, Xianhui An, and Xueren Qian. 2022. "Phytic Acid Doped Polyaniline as a Binding Coating Promoting Growth of Prussian Blue on Cotton Fibers for Adsorption of Copper Ions" Coatings 12, no. 2: 138. https://doi.org/10.3390/coatings12020138