Article

Characterization of Quasi-Static/Dynamic Contact Mechanical Properties of Mo Surface-Modified TC4

1
National Key Laboratory of Science and Technology on Vacuum Electronics, University of Electronic Science and Technology of China, Chengdu 610054, China
2
College of Materials Science and Engineering, Taiyuan University of Technology, Taiyuan 030024, China
*
Authors to whom correspondence should be addressed.
Coatings 2022, 12(2), 123; https://doi.org/10.3390/coatings12020123
Submission received: 17 December 2021 / Revised: 15 January 2022 / Accepted: 20 January 2022 / Published: 23 January 2022
(This article belongs to the Special Issue Plasma Technologies for Surface Engineering)

Abstract

:
By using the double glow plasma surface alloying technique, a Mo surface-modified layer is prepared on Ti6Al4V(TC4). The element concentration and microstructure are characterized with a glow-discharge optical emission spectroscope and a scanning electron microscope. The results indicate that the Mo modified layer is compact in structure and gradation in composition, which consists of a pure Mo deposition layer and a thick Mo diffusion layer. Nanoindentation test results indicate that the surface hardness of TC4 is significantly improved after surface modification. Therefore, the initial part of the Mo diffusion layer has higher hardness than the Mo deposition layer. The impact tests for 10,000 cycles at different loads demonstrate that impact load 100 N only causes small plastic deformation, while impact loads 300 N and 500 N could result in cracks. Combining nanoindentation test with finite element reverse analysis, plastic parameters of the Mo modified layer are quantitatively determined. By using the impact test and finite element forward analysis, the dynamic contact mechanical properties of Mo surface-modified TC4 are characterized. When the impact cycles are fixed, ring cracks firstly occur and then radial cracks occur with the impact load increase on the graded layer. The ring cracks are mainly caused by impact stretch fatigue and corresponding cyclic stress is between 3.53 and 2.62 GPa. The radial cracks are mainly related to the tension-compression fatigue and corresponding cyclic stress is between 3.92 and −0.97 GPa.

1. Introduction

Titanium and its alloys, especially TC4, have excellent properties including low density, high specific strength, good corrosion resistance and excellent biocompatibility, etc. Thus, they are widely used in aerospace, automotive, chemical, biomedical and marine industries [1,2,3]. However, their low hardness, high friction coefficient and poor wear resistance cannot be ignored [4,5]. Besides, their surface mechanical properties are obviously inferior to those of iron-based metal structural materials. The above drawbacks reduce their service lifetime and limit their applications. Surface treatment is an effective method which can improve surface properties of titanium and its alloys without changing their internal performance and expanding their new industrial applications.
With different levels of success, many surface treatment methods for titanium and its alloys have been developed in the past 20 years. According to mechanical properties, the surface treatment layers typically fall into two types: (i) homogeneous layers with the same mechanical parameters and (ii) graded layers with varying mechanical parameters along the thickness direction. Homogeneous layers are often prepared by coating deposition such as electrodeposition and electrospray [6,7]. Graded layers are generally obtained through thermochemical treatments such as plasma nitriding and plasma surface alloying [8,9,10,11,12,13]. Compared with the homogeneous layer, the graded layer has no interface with the substrate and could coordinate deformation to some extent. Therefore, graded surface modification is more effective to improve the wear and impact resistance of titanium and its alloys. According to the graded properties, graded layers can be treated as elastically graded materials (EGMs), plastically graded materials (PGMs) or elasto-plastically graded materials (EPGMs). Plasma nitriding layers belong to PGMs because their plastic properties vary with depth whereas their elastic properties have little change [14]. In contrast, plasma surface alloying layers are EPGMs with varied elasto-plastic properties [15]. Because of the lack of characterization methods for EPGMs, surface alloying layers on titanium alloys have not been widely applied in practice even though they possess excellent comprehensive mechanical properties. Therefore, it is technologically important to establish effective ways to quantitatively characterize the mechanical behavior of surface elasto-plastically graded layers on titanium alloys and understand their quasi-static/dynamic deformation behaviors.
For homogeneous surface treatment layers on metals, many characterization methods of mechanical properties have been successfully established. Elastic modulus and hardness could be directly obtained by the nanoindentation test [16]. Combining finite element simulations, plastic parameters could be further determined through reverse analysis [17,18,19,20]. Different from homogeneous treatment layers, the mechanical properties of a graded layer are difficult to directly characterize. Some existing research on graded materials mainly focuses on EGMs or PGMs. Giannakopoulos et al. systematically investigated EGMs and PGMs by indentation tests and theoretical analysis [21,22,23]. The results of their work show how surface modifications can induce elastically or plastically graded properties that strengthen substrates against contact-induced damage. Cao et al. [24] firstly established a reverse analysis algorithm to determine the plastic properties of a plastically graded surface. Then, I.S. Choi et al. [25,26] comprehensively studied the mechanics of indentation of PGMs and established a universal dimensionless function describing the indentation response. Similar investigations were also conducted on nitriding layers [27]. For EPGMs, however, no reverse analysis algorithm has been directly deduced through surface indentation load-displacement curves.
When elasto-plastic parameters are known, the quasi-static stress-strain distributions in the surface treatment layer could be quantitatively obtained through finite element simulations (forward analysis) [17,28,29,30,31,32]. When it comes to failure phenomena such as crack initiation and propagation in the indentation process, a forward analysis should be carried out with some assumptions [33,34,35]. Simulation results not only can proximately determine the bearing capacity of the surface treated layer, but can further explain its failure mechanism.
In this work, the double glow plasma surface alloying (DG-PSA) technique is firstly used to fabricate the Mo modified layer on the TC4 substrate. Then, the quasi-static/dynamic contact mechanical behavior of the Mo modified layer is quantitatively investigated.

2. Experimental Procedure

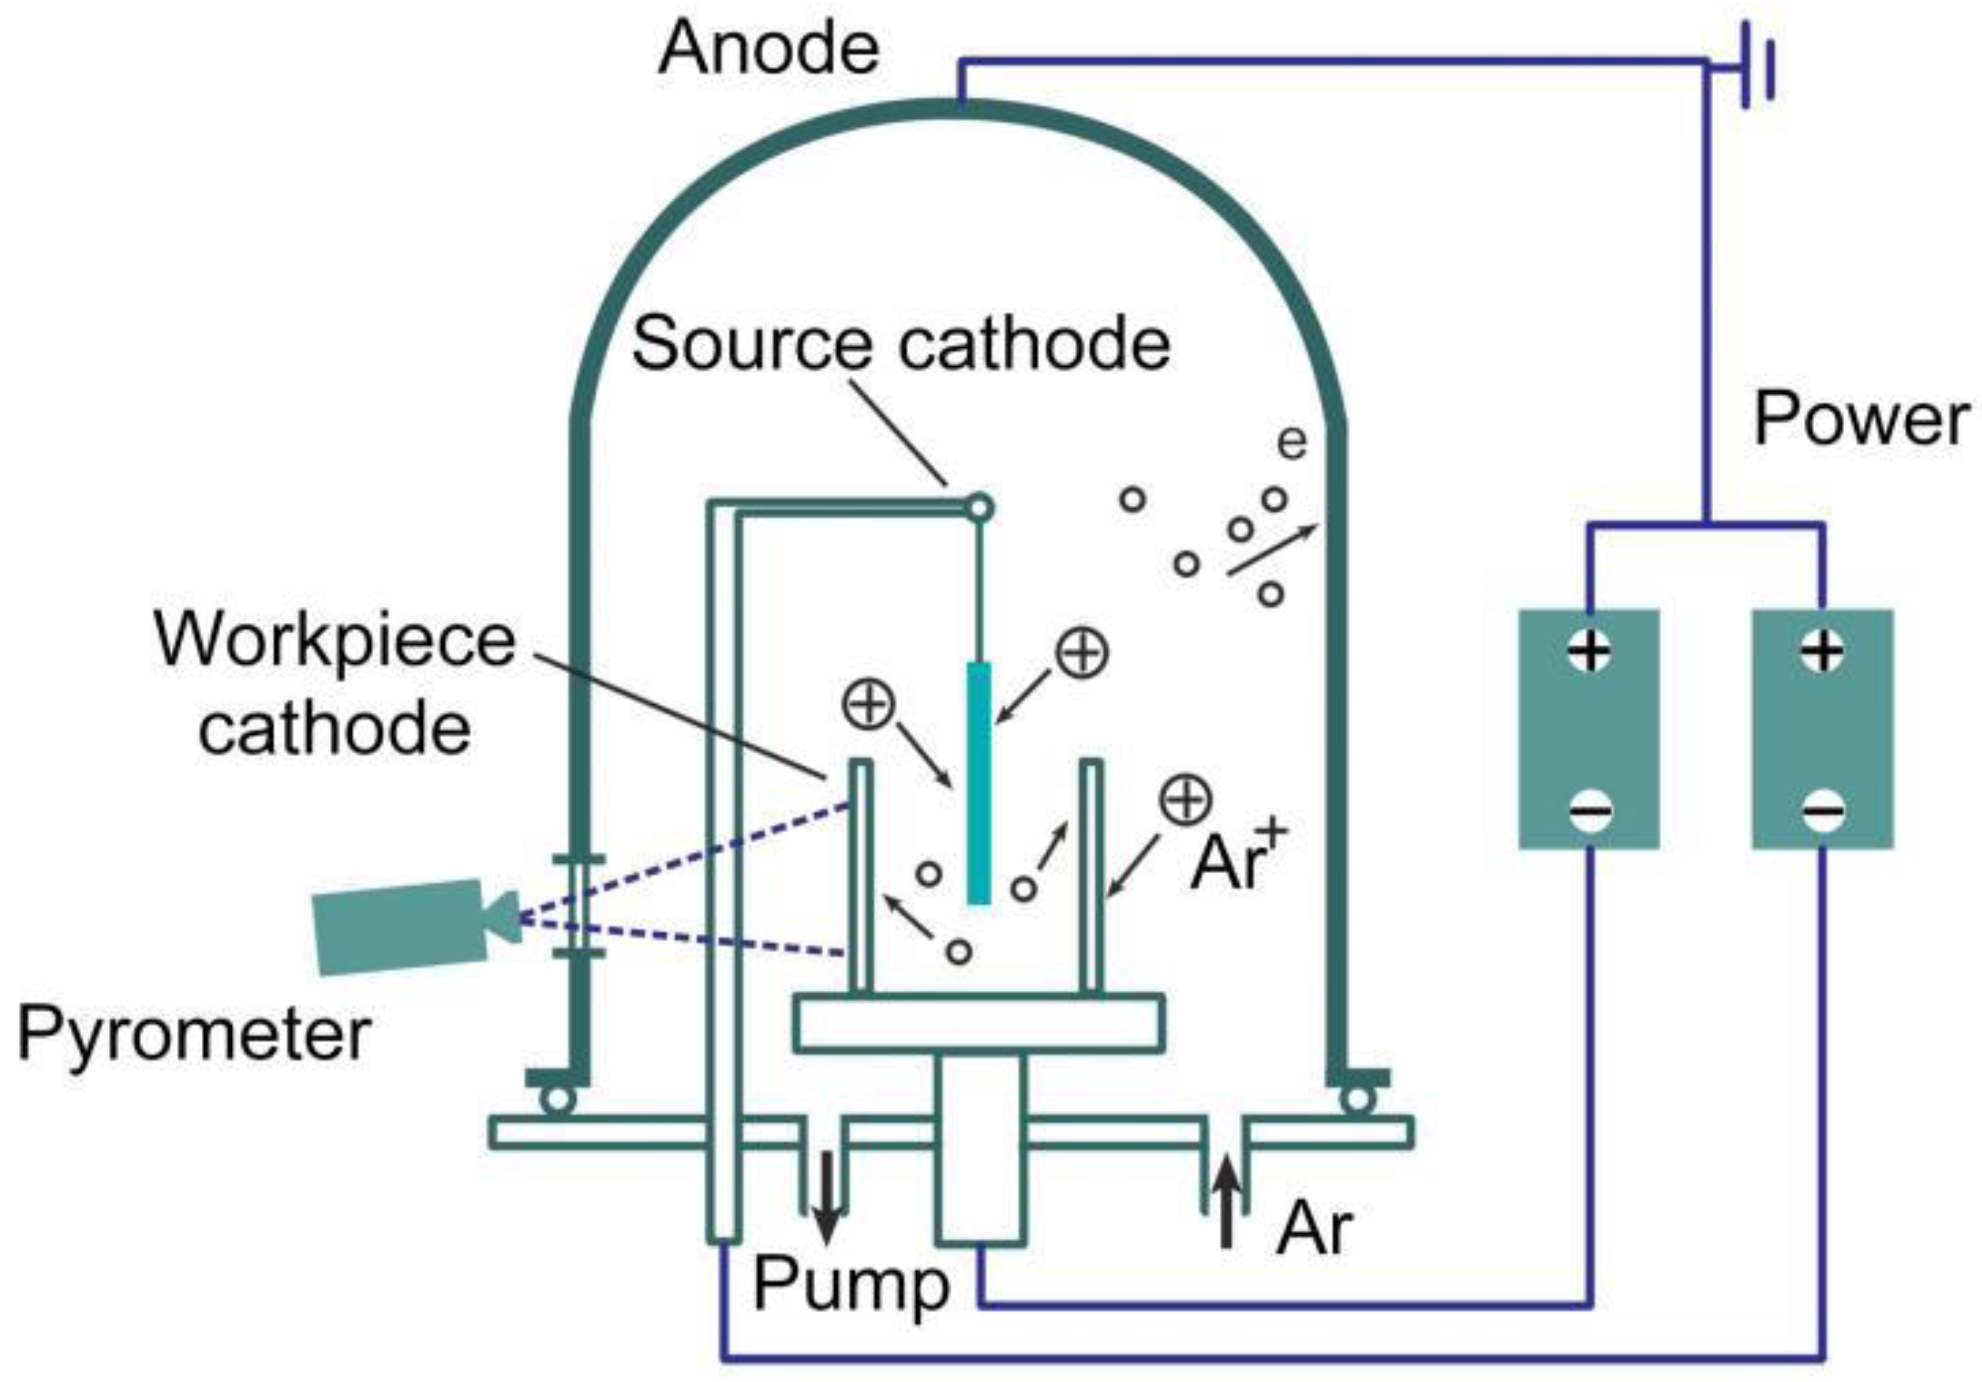
2.1. Substrate Material and Modified Layer Preparation

The substrate material is Alpha–Beta alloy TC4 annealed at 750 °C. Its chemical composition in wt % is listed in Table 1. The substrate size is Φ12 mm × 5 mm cut from a TC4 alloy rod by wire electrical discharge machining-medium speed (WEDM-MS). With a surface roughness Ra = 0.8 mm, the cutting surface needs further polishing. Firstly, the cutting surface for treatment was ground on SiC papers (320# to 2000#) and polished on a velvet polishing cloth until the surface roughness reached Ra ≤ 0.1 μm. Then, all the polished substrate samples were ultrasonically cleaned with acetone for 15 min and finally dried for the following surface modification.
The Mo surface-modified layer was prepared using an LS-450 plasma surface alloying device [11]. The alloying concept is shown in Figure 1. There are three electrodes in the chamber, one anode and two cathodes. The ground chamber shell is the anode. The target and substrate samples are the source cathode and the workpiece cathode, respectively. The two cathodes are provided with different negative bias voltages and the potential difference leads to a hollow cathode effect. A certain amount of argon (Ar, 99.999% purity) added into the vacuum chamber is used as the discharge gas. When the power system is switched on and the bias voltages reach the predetermined values, double glow discharge occurs between the anode and the cathodes. In this process, Ar is ionized and its ions (Ar+) continuously hit the target and sputter out source elements in the form of ions and atoms, which firstly deposit on and then diffuse into the workpiece surface. By mainly controlling the process temperature and alloying time, an expected graded layer can be successfully prepared on the sample surface. Here, a pure molybdenum (99.99% wt %) plate with a size of 200 mm × 100 mm × 10 mm was used as the target. Detailed processing parameters are listed in Table 2.

2.2. Microstructural and Composition Analysis

The element concentration along the thickness direction of the Mo modified layer was measured by glow-discharge optical emission spectroscopy (GDOES, GDA-750, Spuctruma Analytik Company, Kleve, Germany). For microstructure characterization, the cross-section of the Mo surface-modified TC4 was polished by taking the same polishing process as the substrate sample. Etched with Kroll reagent (1 mL HF, 2 mL HNO3 and 7 mL distilled water), the cross-section was scanned with field-emission scanning electron microscopy (FE-SEM, Hitachi S4800, Hitachi Ltd., Hitachi, Japan).

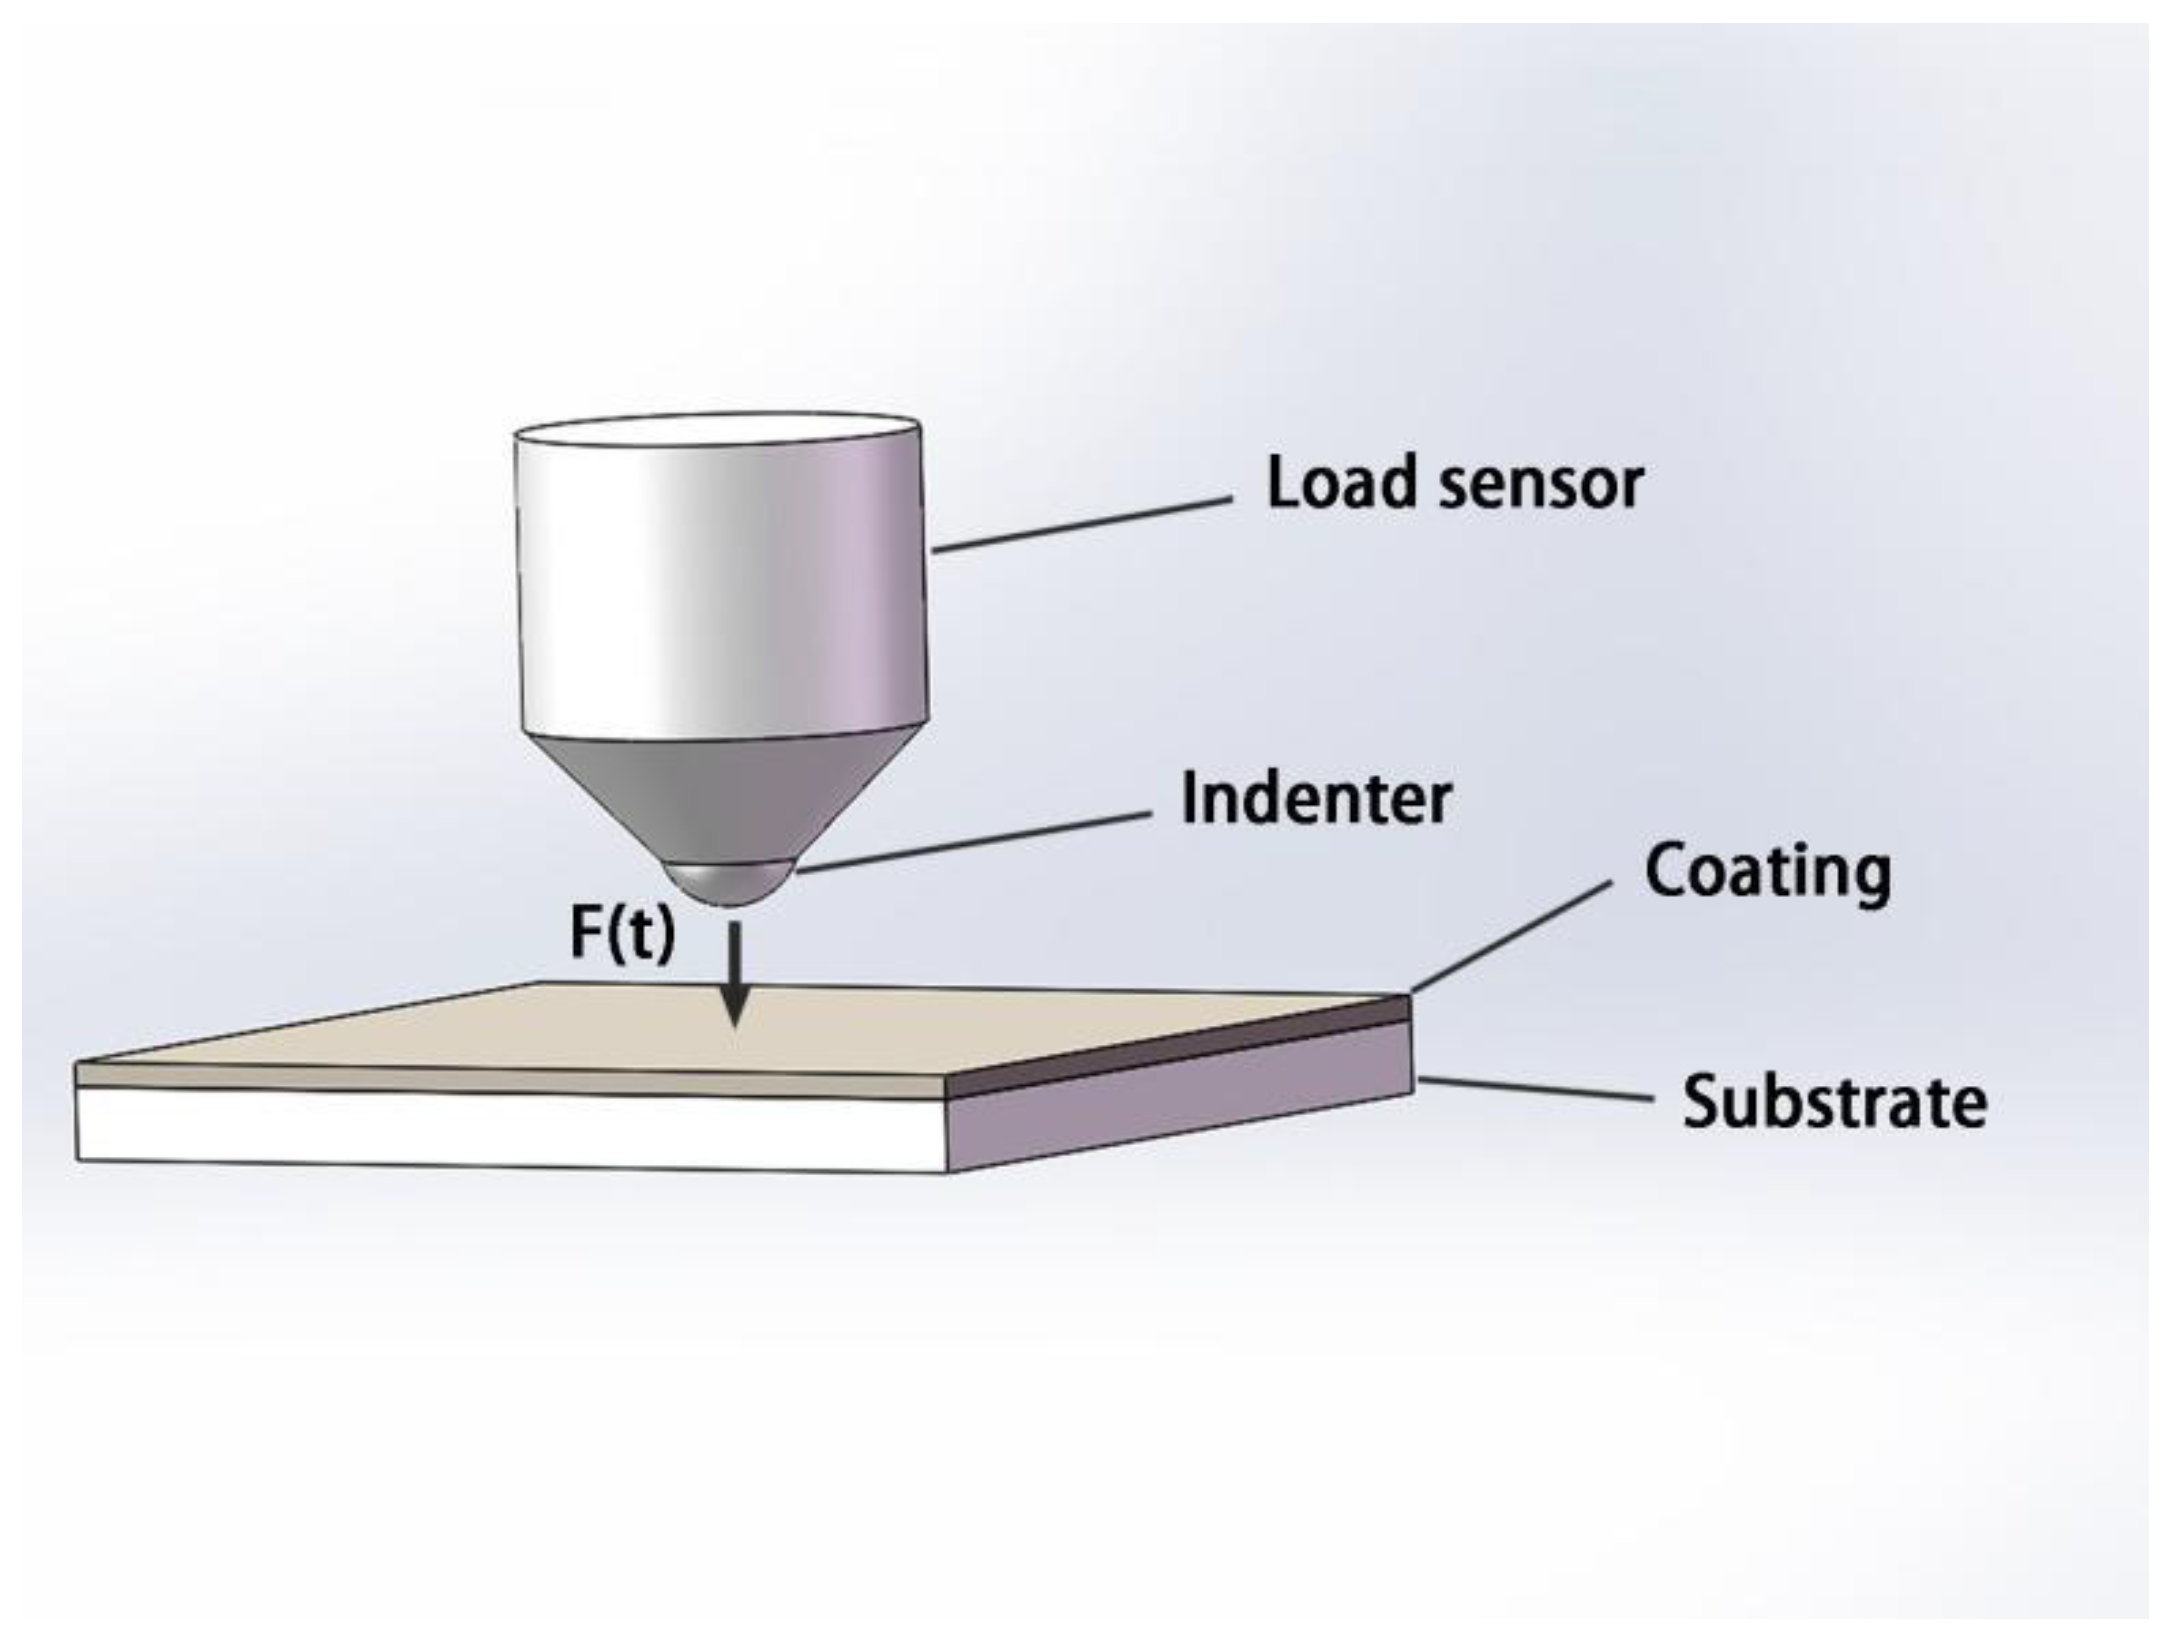
2.3. Nanoindentation and Impact Tests

Nanoindentation tests were carried out using NanoTest Vantage (Micro Materials Ltd., Wrexham, UK) equipped with a diamond Berkovich tip. The resolutions in displacement and load are 0.002 nm and 3 nN, respectively. A 5 × 16 indentation grid was set with indentations 2 μm apart. The maximum indentation load was 4 mN and the loading/unloading rate was 0.25 mN/s. At the maximum indentation depth, the peak load was held for 10 s to reduce the creep effect.
A repetitive impact test method, which has been regarded as an effective way to study coating cohesion and adhesion performance under low energy dynamic loading conditions, was used to characterize the fatigue resistance of the Mo-modified layer [36]. The schematic of the homemade impact tester is shown in Figure 2. The impact force, impact frequency and the number of impacts are controlled via a stored program control system. The force is exerted as a linear impact on the sample surface by a hard alloy ball, of which the diameter can be adjusted according to the need of experiment. The oscillation frequency and the impact force are adjusted by the coil current of the electromagnet. The number of impacts should be selected before the test. The distance from the sample to the hard alloy ball can be changed by adjusting the sample holder. The indenter velocity can be determined using a laser diode displacement sensor by recording the tip position. Typical testing parameters are shown in Table 3.
During this work, the impact body was a 5 mm-diameter WC-cemented carbide ball with an elastic modulus of 610 GPa and a density of 15 g/cm3. The total indenter mass was ~900 g. At a distance of 0.5 mm, impact forces were set as 100, 300 and 500 N. A total 10,000 impact cycles at a frequency of 20 Hz were carried out for each load. Corresponding impact speeds are ~1.5 m/s, ~5 m/s and ~8.5 m/s, respectively. Before testing, both the WC ball and the sample were cleaned with acetone. In order to reduce the measurement error, each impact condition was repeated three times and a new ball was used for each test. After impacts, the Mo modified layer was cleaned with acetone for 15 min and the imprints were characterized through the field-emission scanning electron microscope.

3. Finite Element Analysis

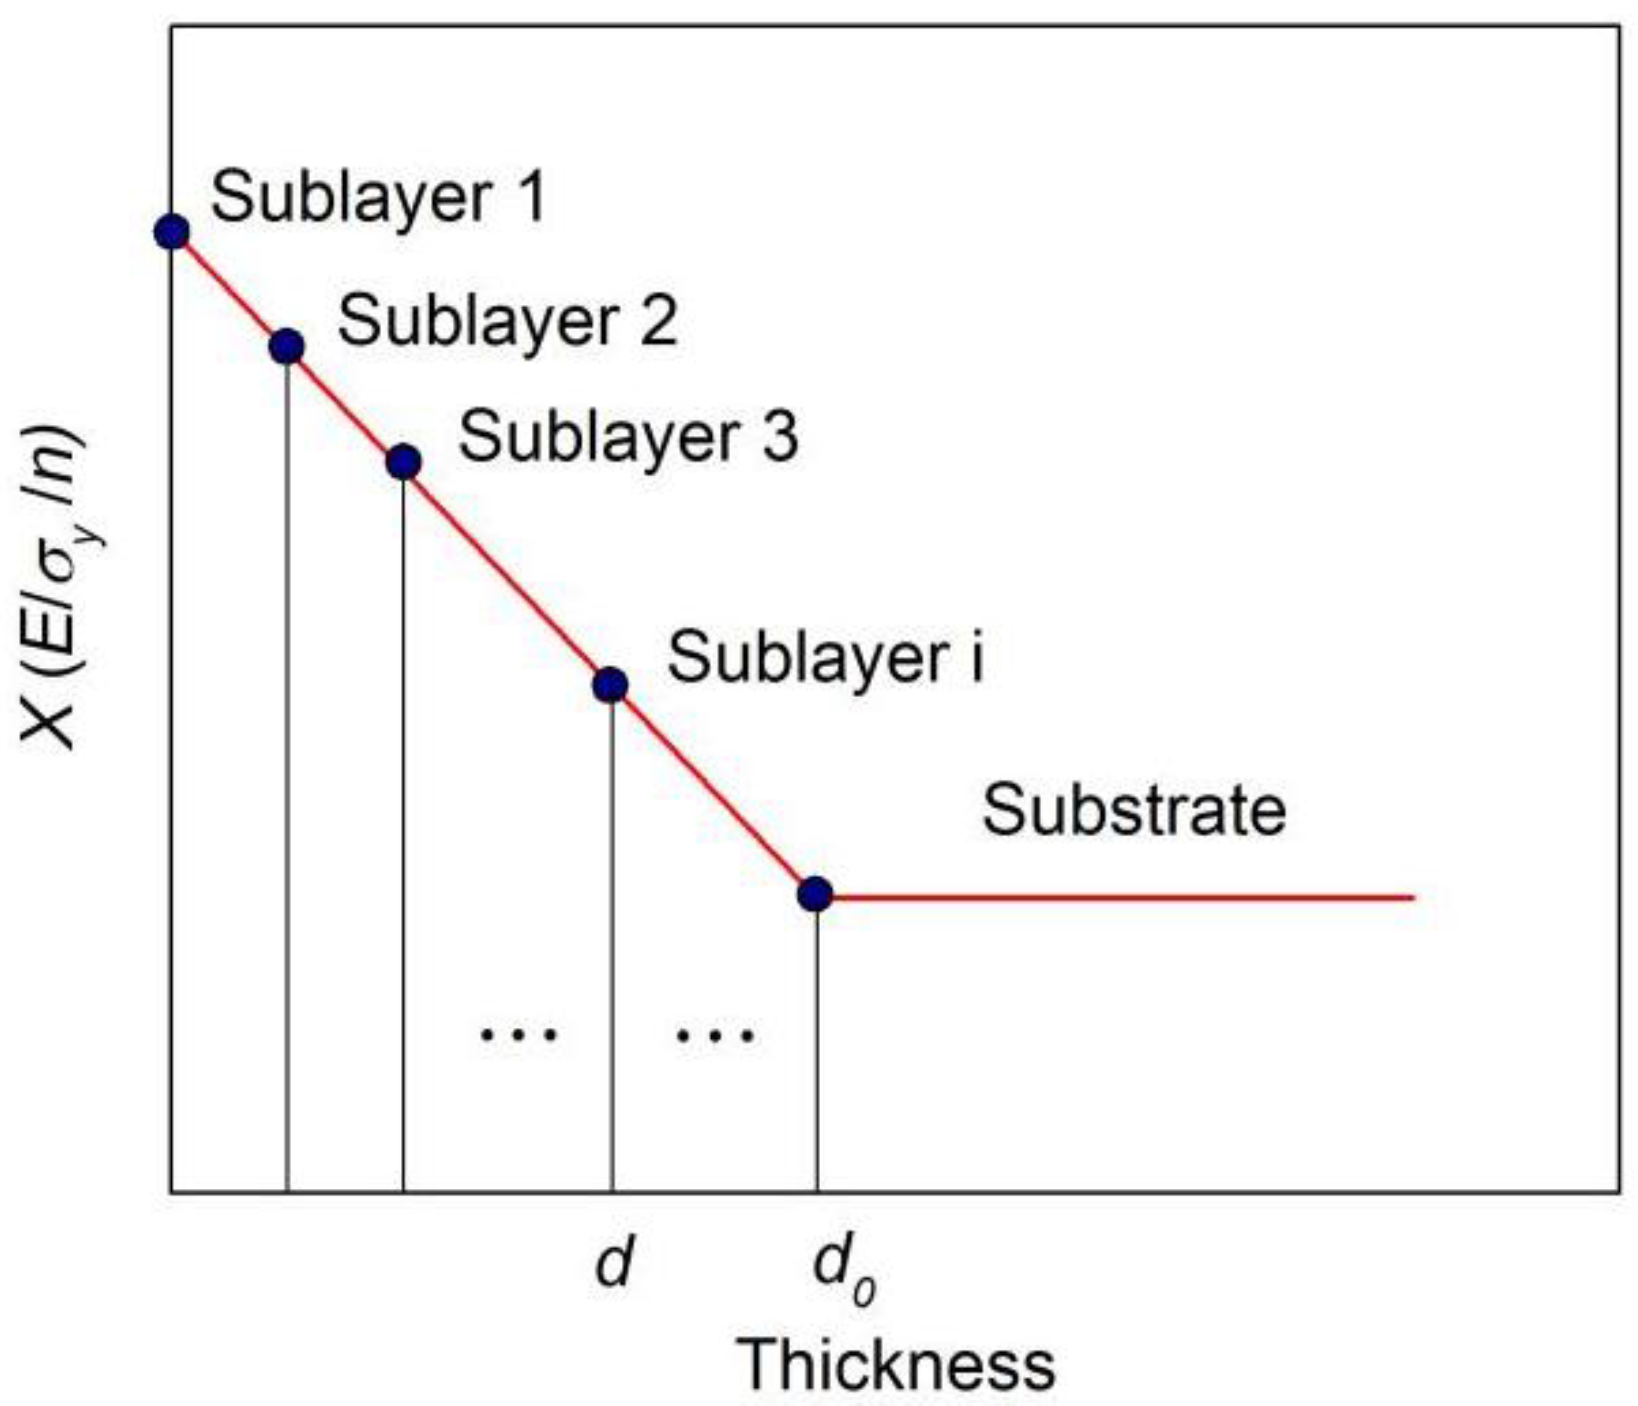
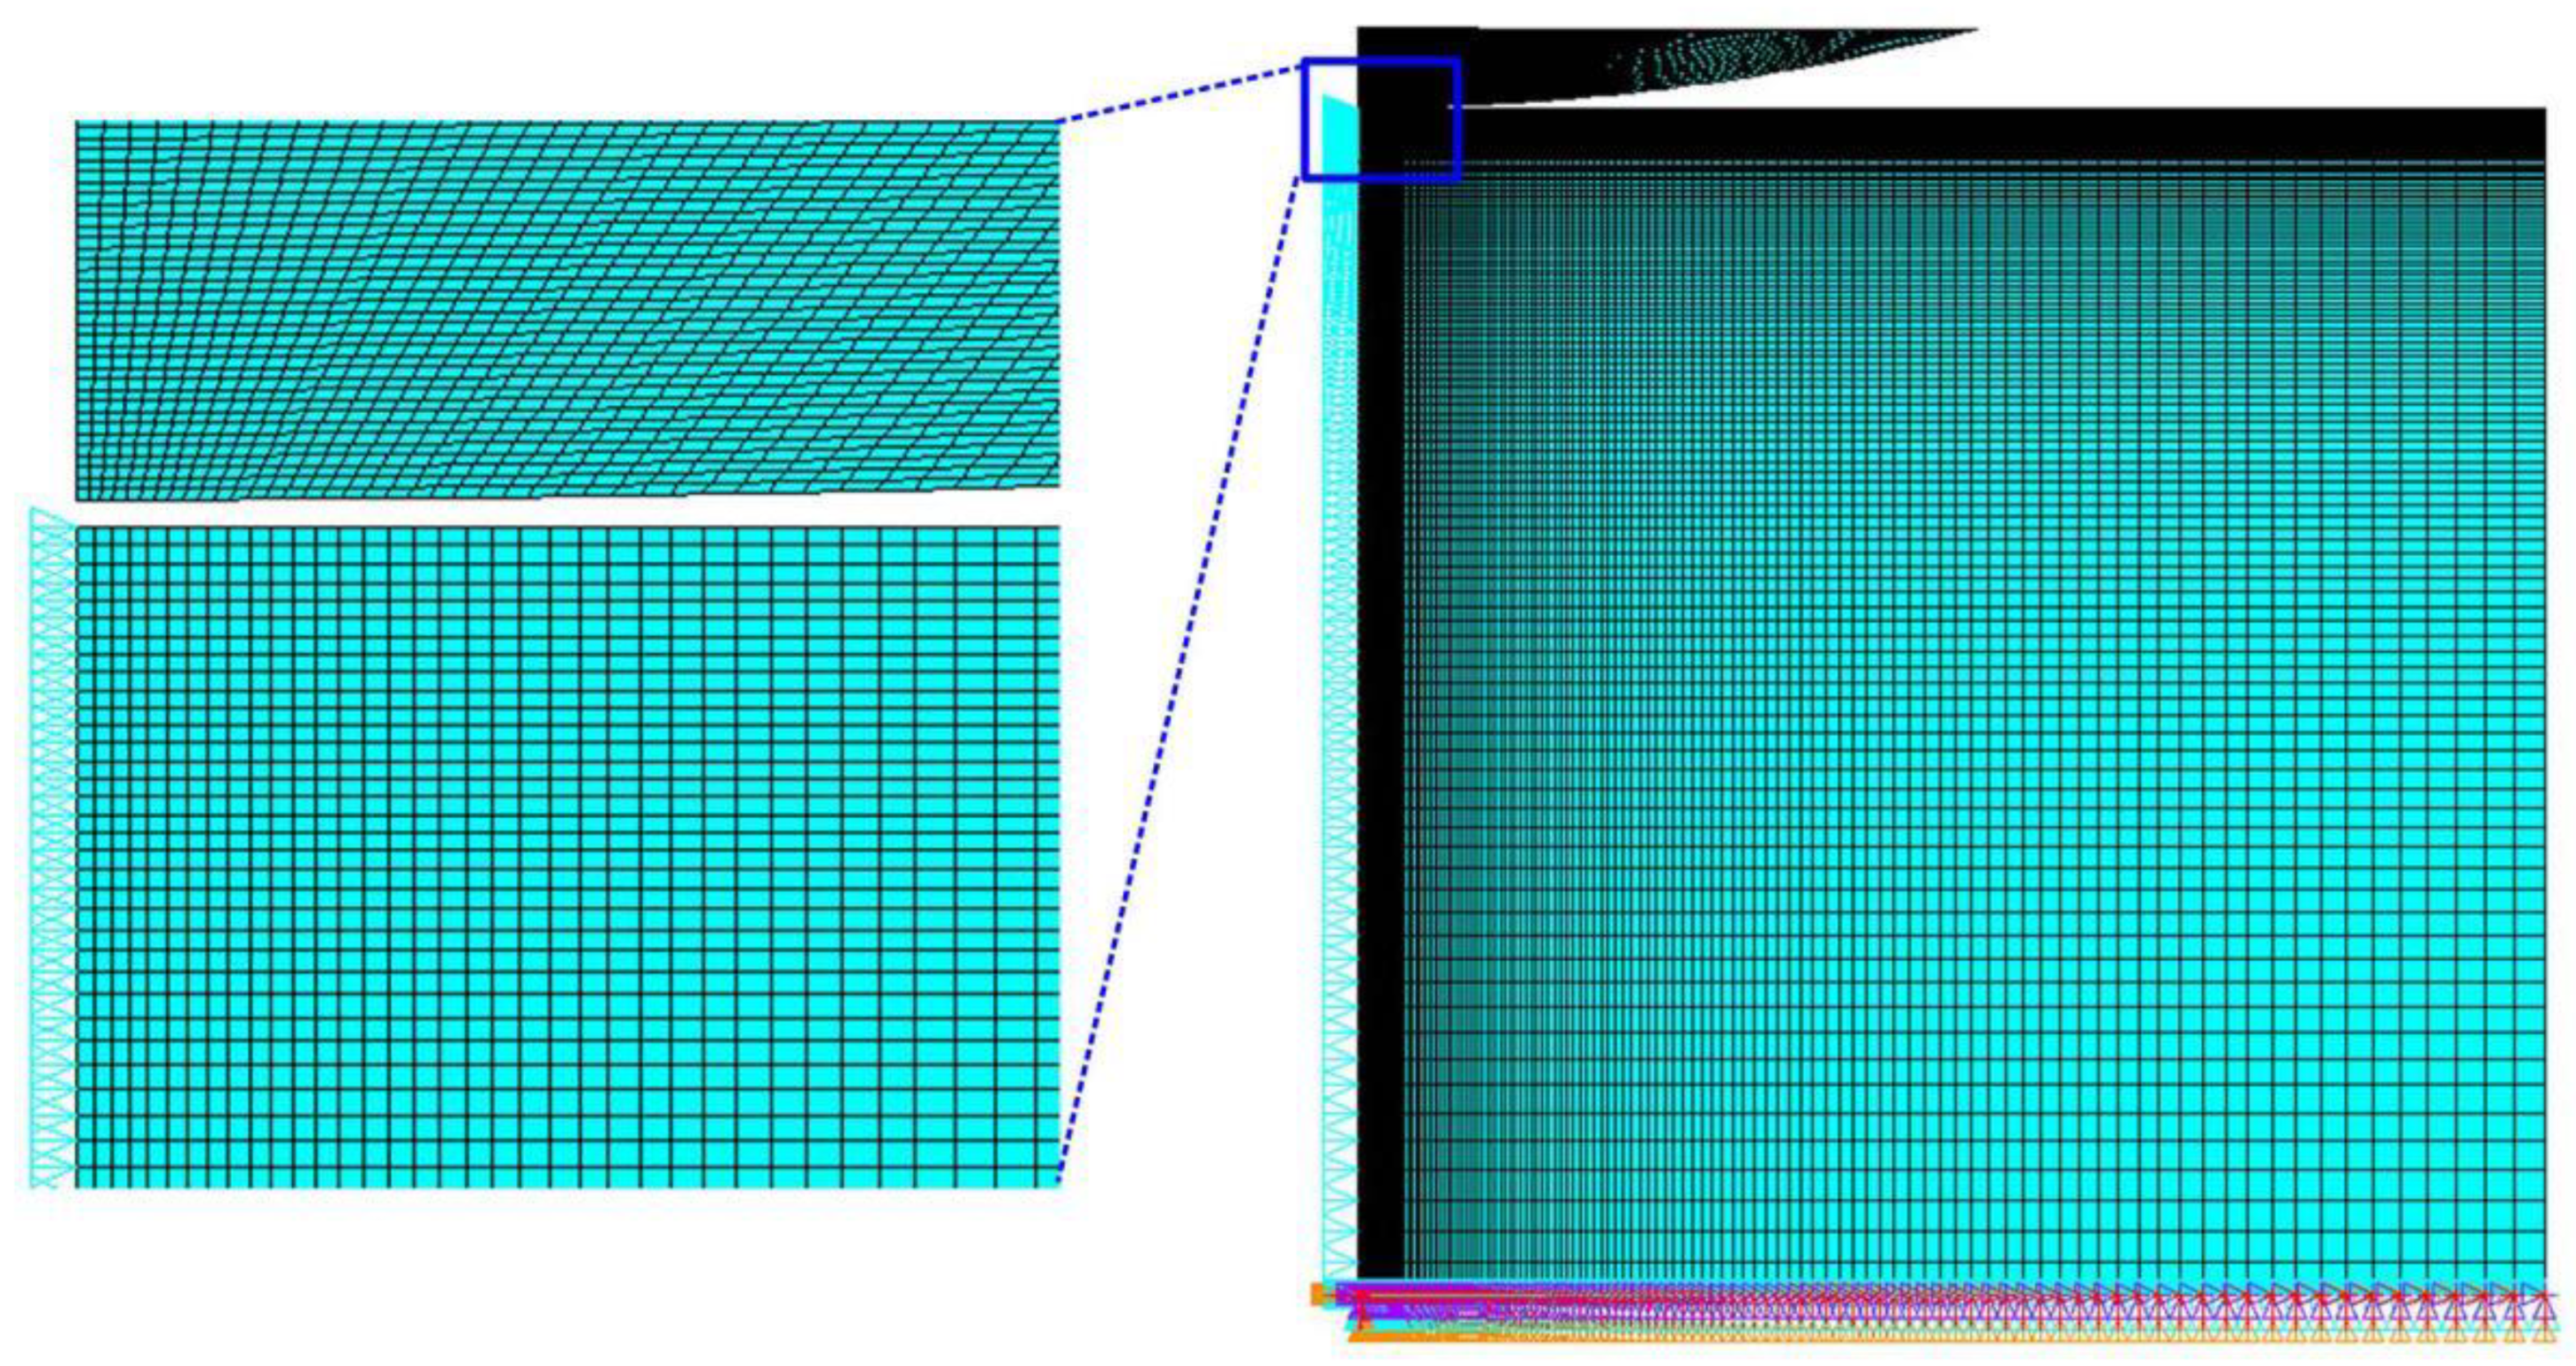
3.1. Reverse Analysis of Nanoindentation Test

The process of extracting stress-strain curves from indentation load-displacement curves is called reverse analysis. The Hollomon’s power law is mostly used in reverse analysis to model the elasto-plastic behavior of metals [37], which is expressed as:
σ = { E ε ,                                   σ < σ y σ y 1 n E n ε n ,       σ σ y
where σ is the true stress, ε is the true strain, σy is the initial yield stress and n is the strain hardening exponent. If n and a specific point on the stress-strain curve are determined, σy can be calculated from Equation (1). Based on that the representative strain εr corresponding to the representative stress σr was redefined by Dao [17], and then the specific point (σr, εr) was further studied [38,39,40,41]. For conventional engineering applications, (σr, εr) can be preliminarily estimated by Equations (2) and (3) [42,43], and then modified by repeated finite element simulations [44].
σ r = 0.231 E r E r / H 4.91
ε r = 0.04734 0.02466 1 + e C / E r 0.6722 0.21139
where Er is the reduced modulus and C is the loading curvature. Er is given by:
1 E r = 1 v 2 E + 1 v i 2 E i  
where E and v are Young’s modulus and Poisson’s ratio of the test material, respectively, and Ei and vi denote Young’s modulus and Poisson’s ratio of the indenter, respectively. For the diamond Berkovich tip, Ei is 1140 GPa and νi is 0.07.
The strain hardening exponent can be calculated from the following dimensionless function [45]:
h r h m a x = u ( σ r E r , n )
where hmax is the maximum indentation depth and hr is the residual indentation depth. ∏u is obtained through extensive finite element simulations carried out over a batch of different combinations of material properties. These cases represent the range of parameters of mechanical behavior found in common engineering metals. The concrete expression of ∏u is:
u ( σ r E r , n ) = h r h m a x = ( 0.00025 n 3 + 0.010307 n 2 + 0.00168 n 0.00408 ) [ ln ( σ r E r ) ] 3 + ( 0.000253 n 3 + 0.14359 n 2 + 0.01823 n 0.0882 ) [ ln ( σ r E r ) ] 2 + ( 0.60011 n 2 + 0.03396 n 0.65421 ) [ ln ( σ r E r ) ] + ( 0.58211 n 2 0.08854 n 0.6729 )
According to our previous study, the elastic modulus, yield stress and strain hardening exponent of the Mo diffusion layer on pure Ti decrease linearly with depth [15,46]. If the Mo diffusion layer is simplified into homogeneous sublayers, the above mechanical parameters can be determined by a linear model, as shown in Figure 3. X is for the elastic modulus, yield stress and strain hardening exponent. The plastic parameters of the initial sublayer and the deposition layer were directly determined by the reverse analysis method mentioned above. For other sublayers, they were calculated from the relation:
X Sublayer   i = X Substrate + X Sublayer   1 X Substrate d 0 ( d 0 d )  
where d is the vertical distance from the interface of the deposition layer and the diffusion layer, and d0 is the thickness of the diffusion layer.

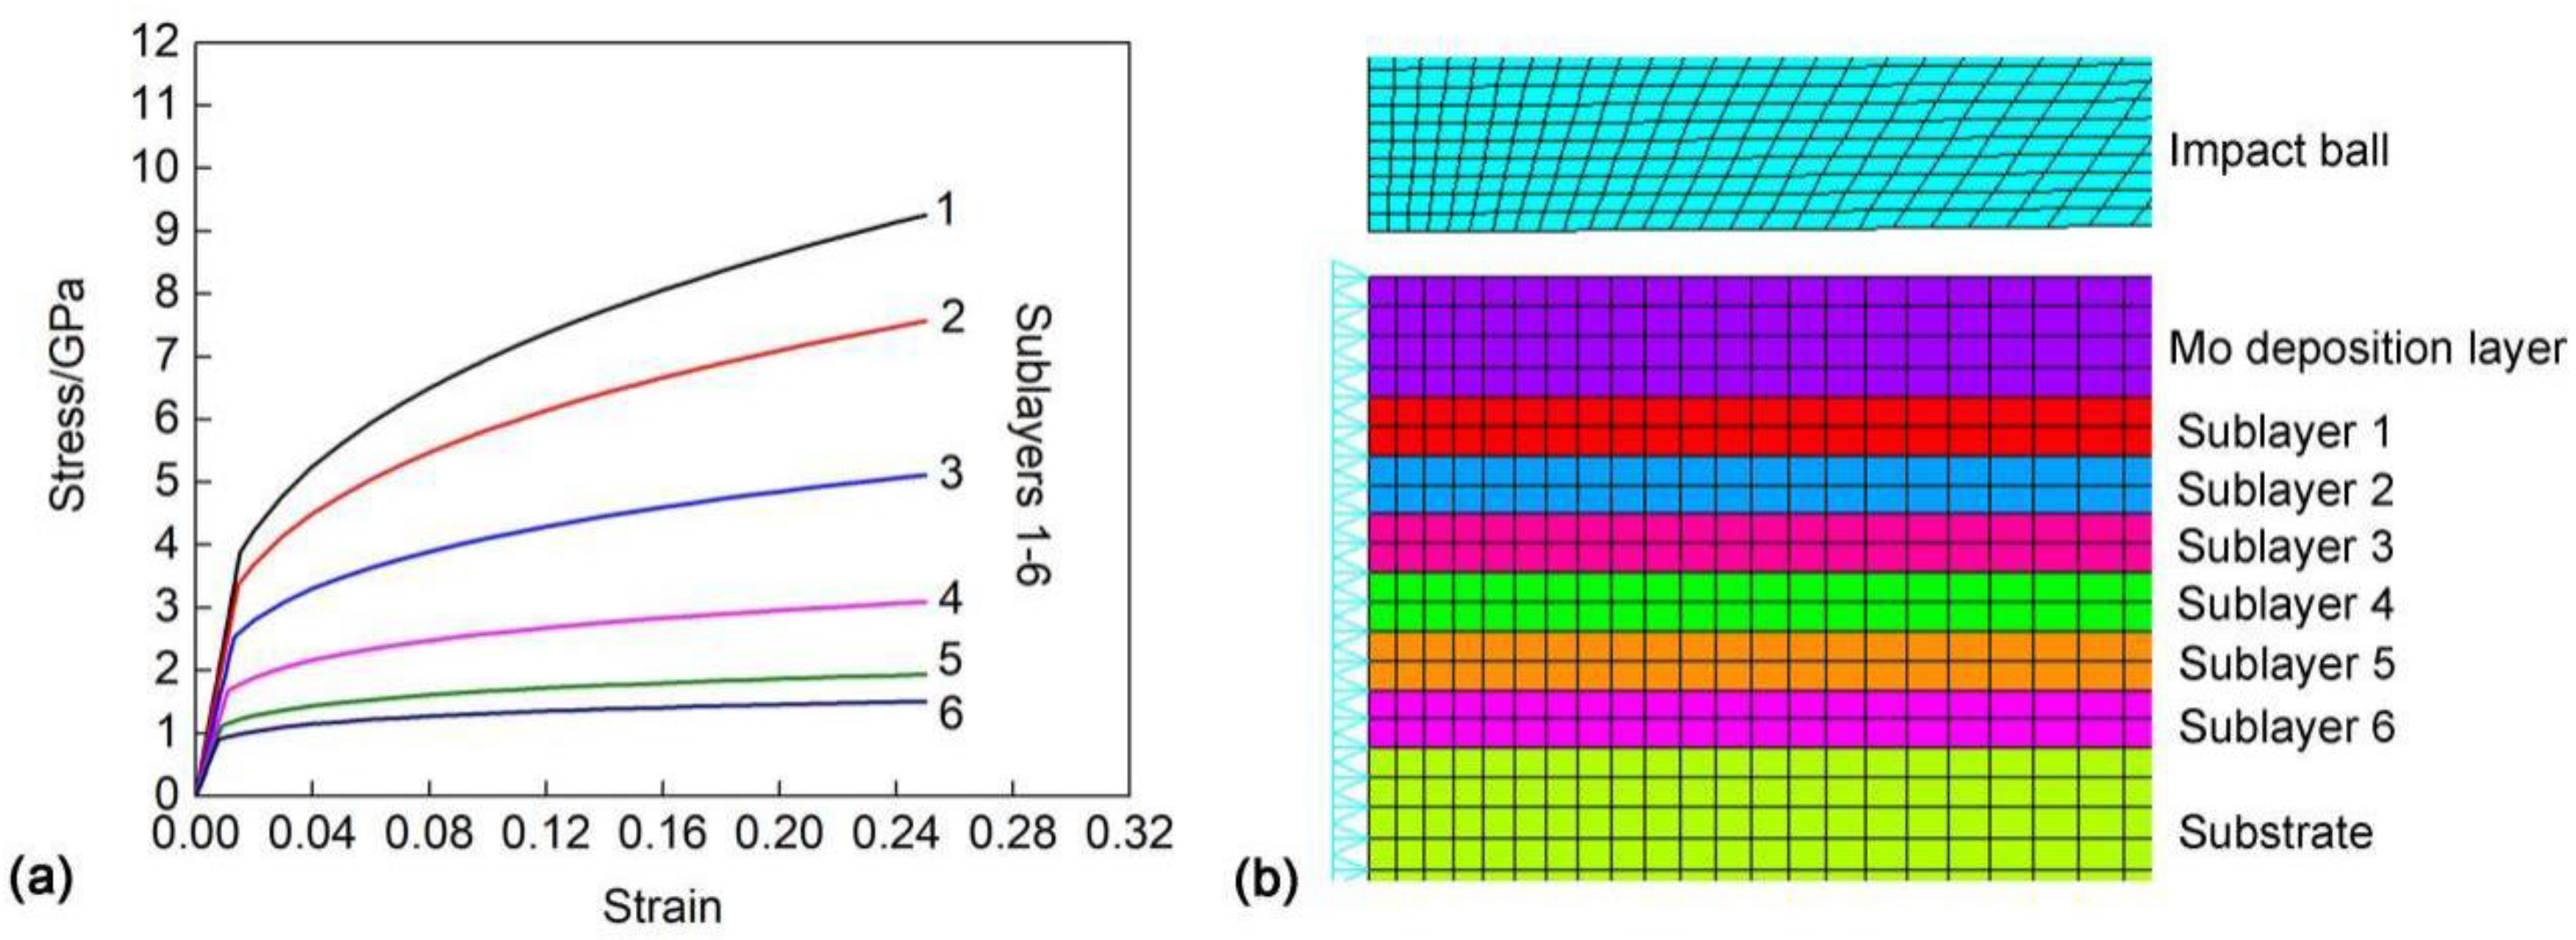
3.2. Finite Element Modeling of Impact Test

Forward analysis was carried out using ANSYS/LS-DYNA which is well adapted to fast nonlinear dynamic problems. Due to the axial symmetry of the problem, a two-dimensional (2D) semi-infinite space model was developed, as shown in Figure 4. The initial gap between the indenter ball and the Mo modified layer was 2 μm. In order to reduce the calculation time, a small part (spherical crown) of the indenter ball was modeled. The equivalent density corresponding to the complete indenter was 10.6 × 10⁴ g/cm3. Four-node rectangular elements were adopted for the Mo modified TC4, while the indenter ball was taken as a rigid body. An adapted mesh was preferred with refined elements in the contact area to ensure more accurate analysis. This mesh included 25,180 elements and 25,598 nodes. For the explicit calculation, the contact type of Contact-2D-automatic-surface-to-surface was selected. Nodes were fixed in the bottom line and had no vertical displacements in the symmetry axis, which has an agreement with other finite element simulations on the similar ball on plane contacts [47,48,49]. Impact velocity was applied to the rigid ball. Automatic time stepping was chosen and the calculation terminated after all the plastic deformation had occurred.

4. Results and Discussion

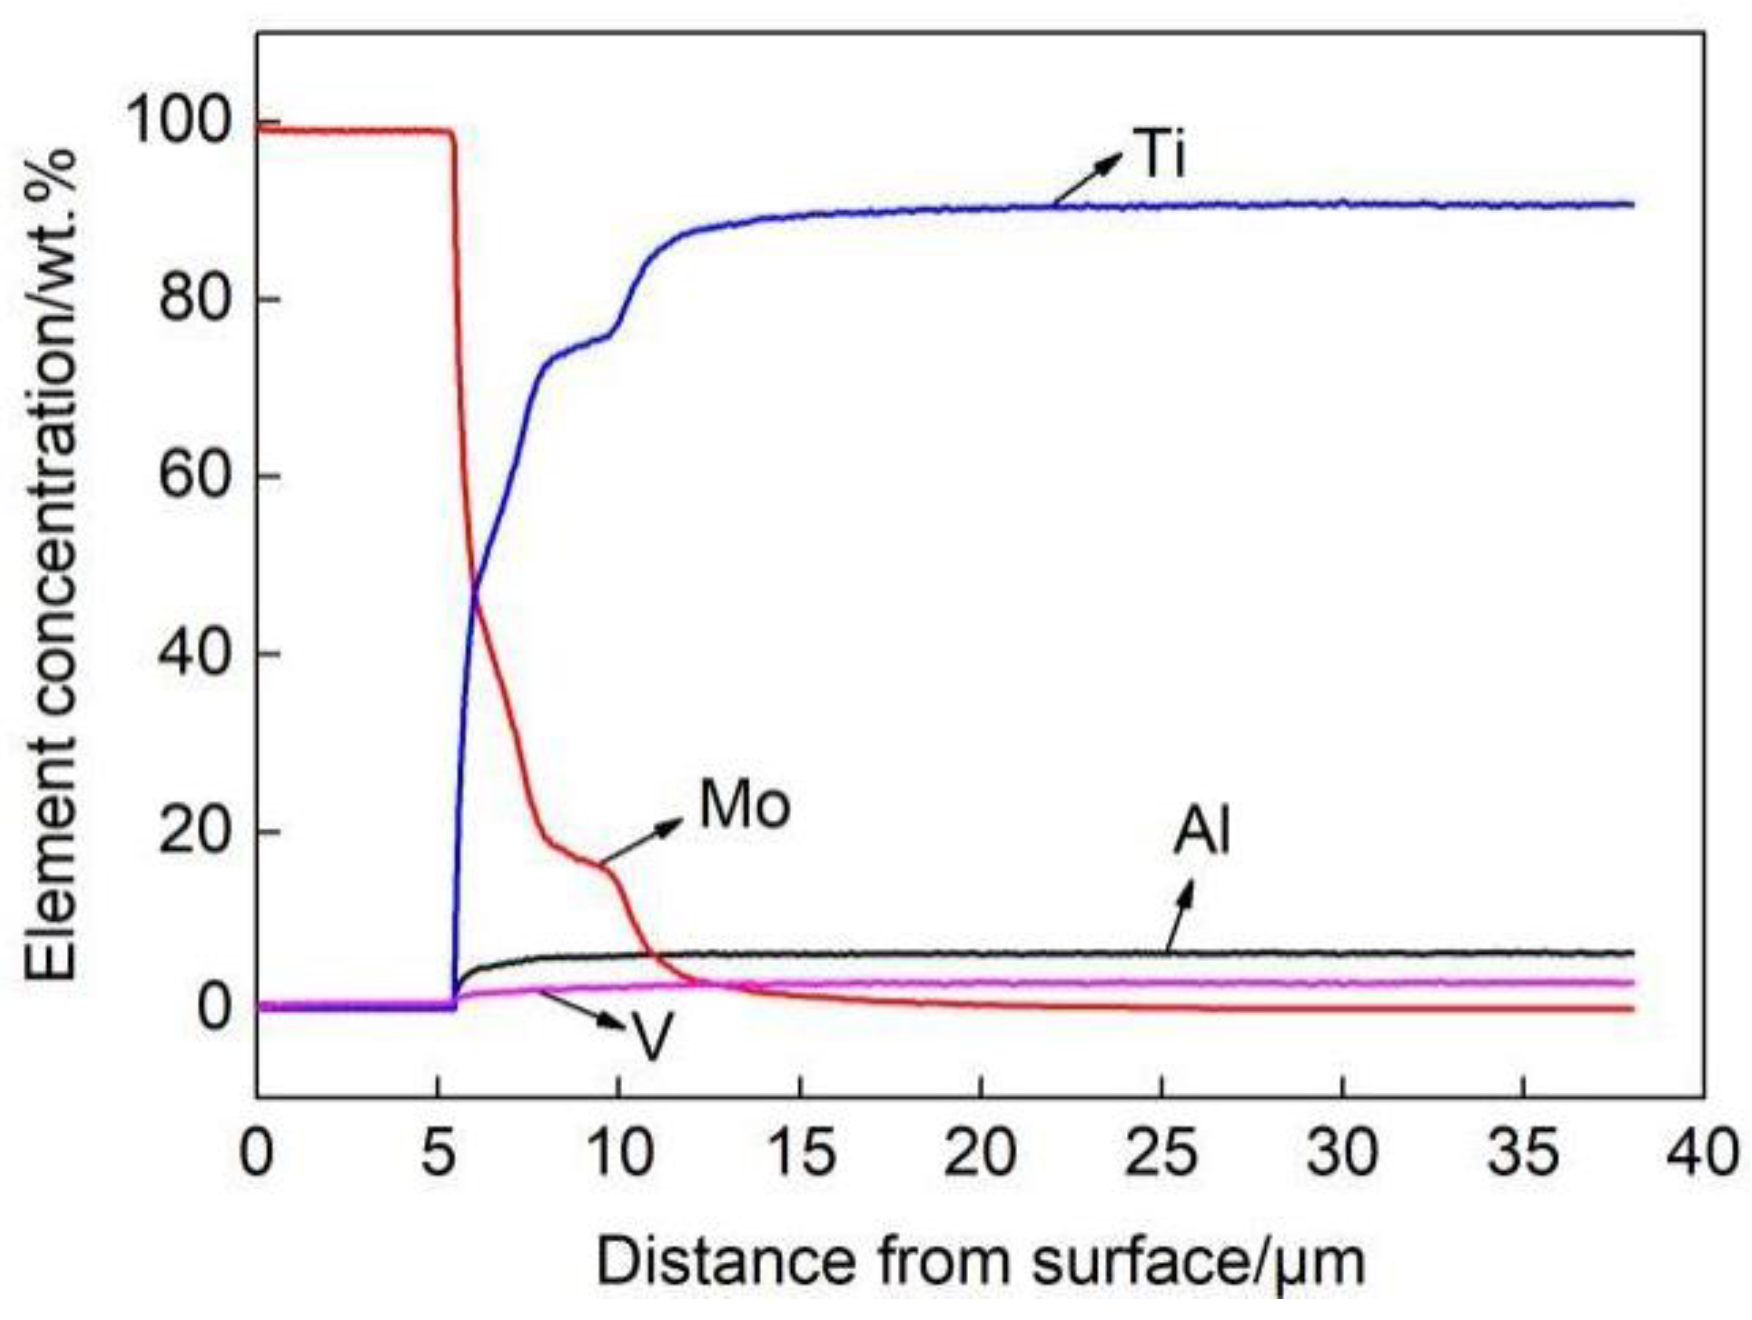
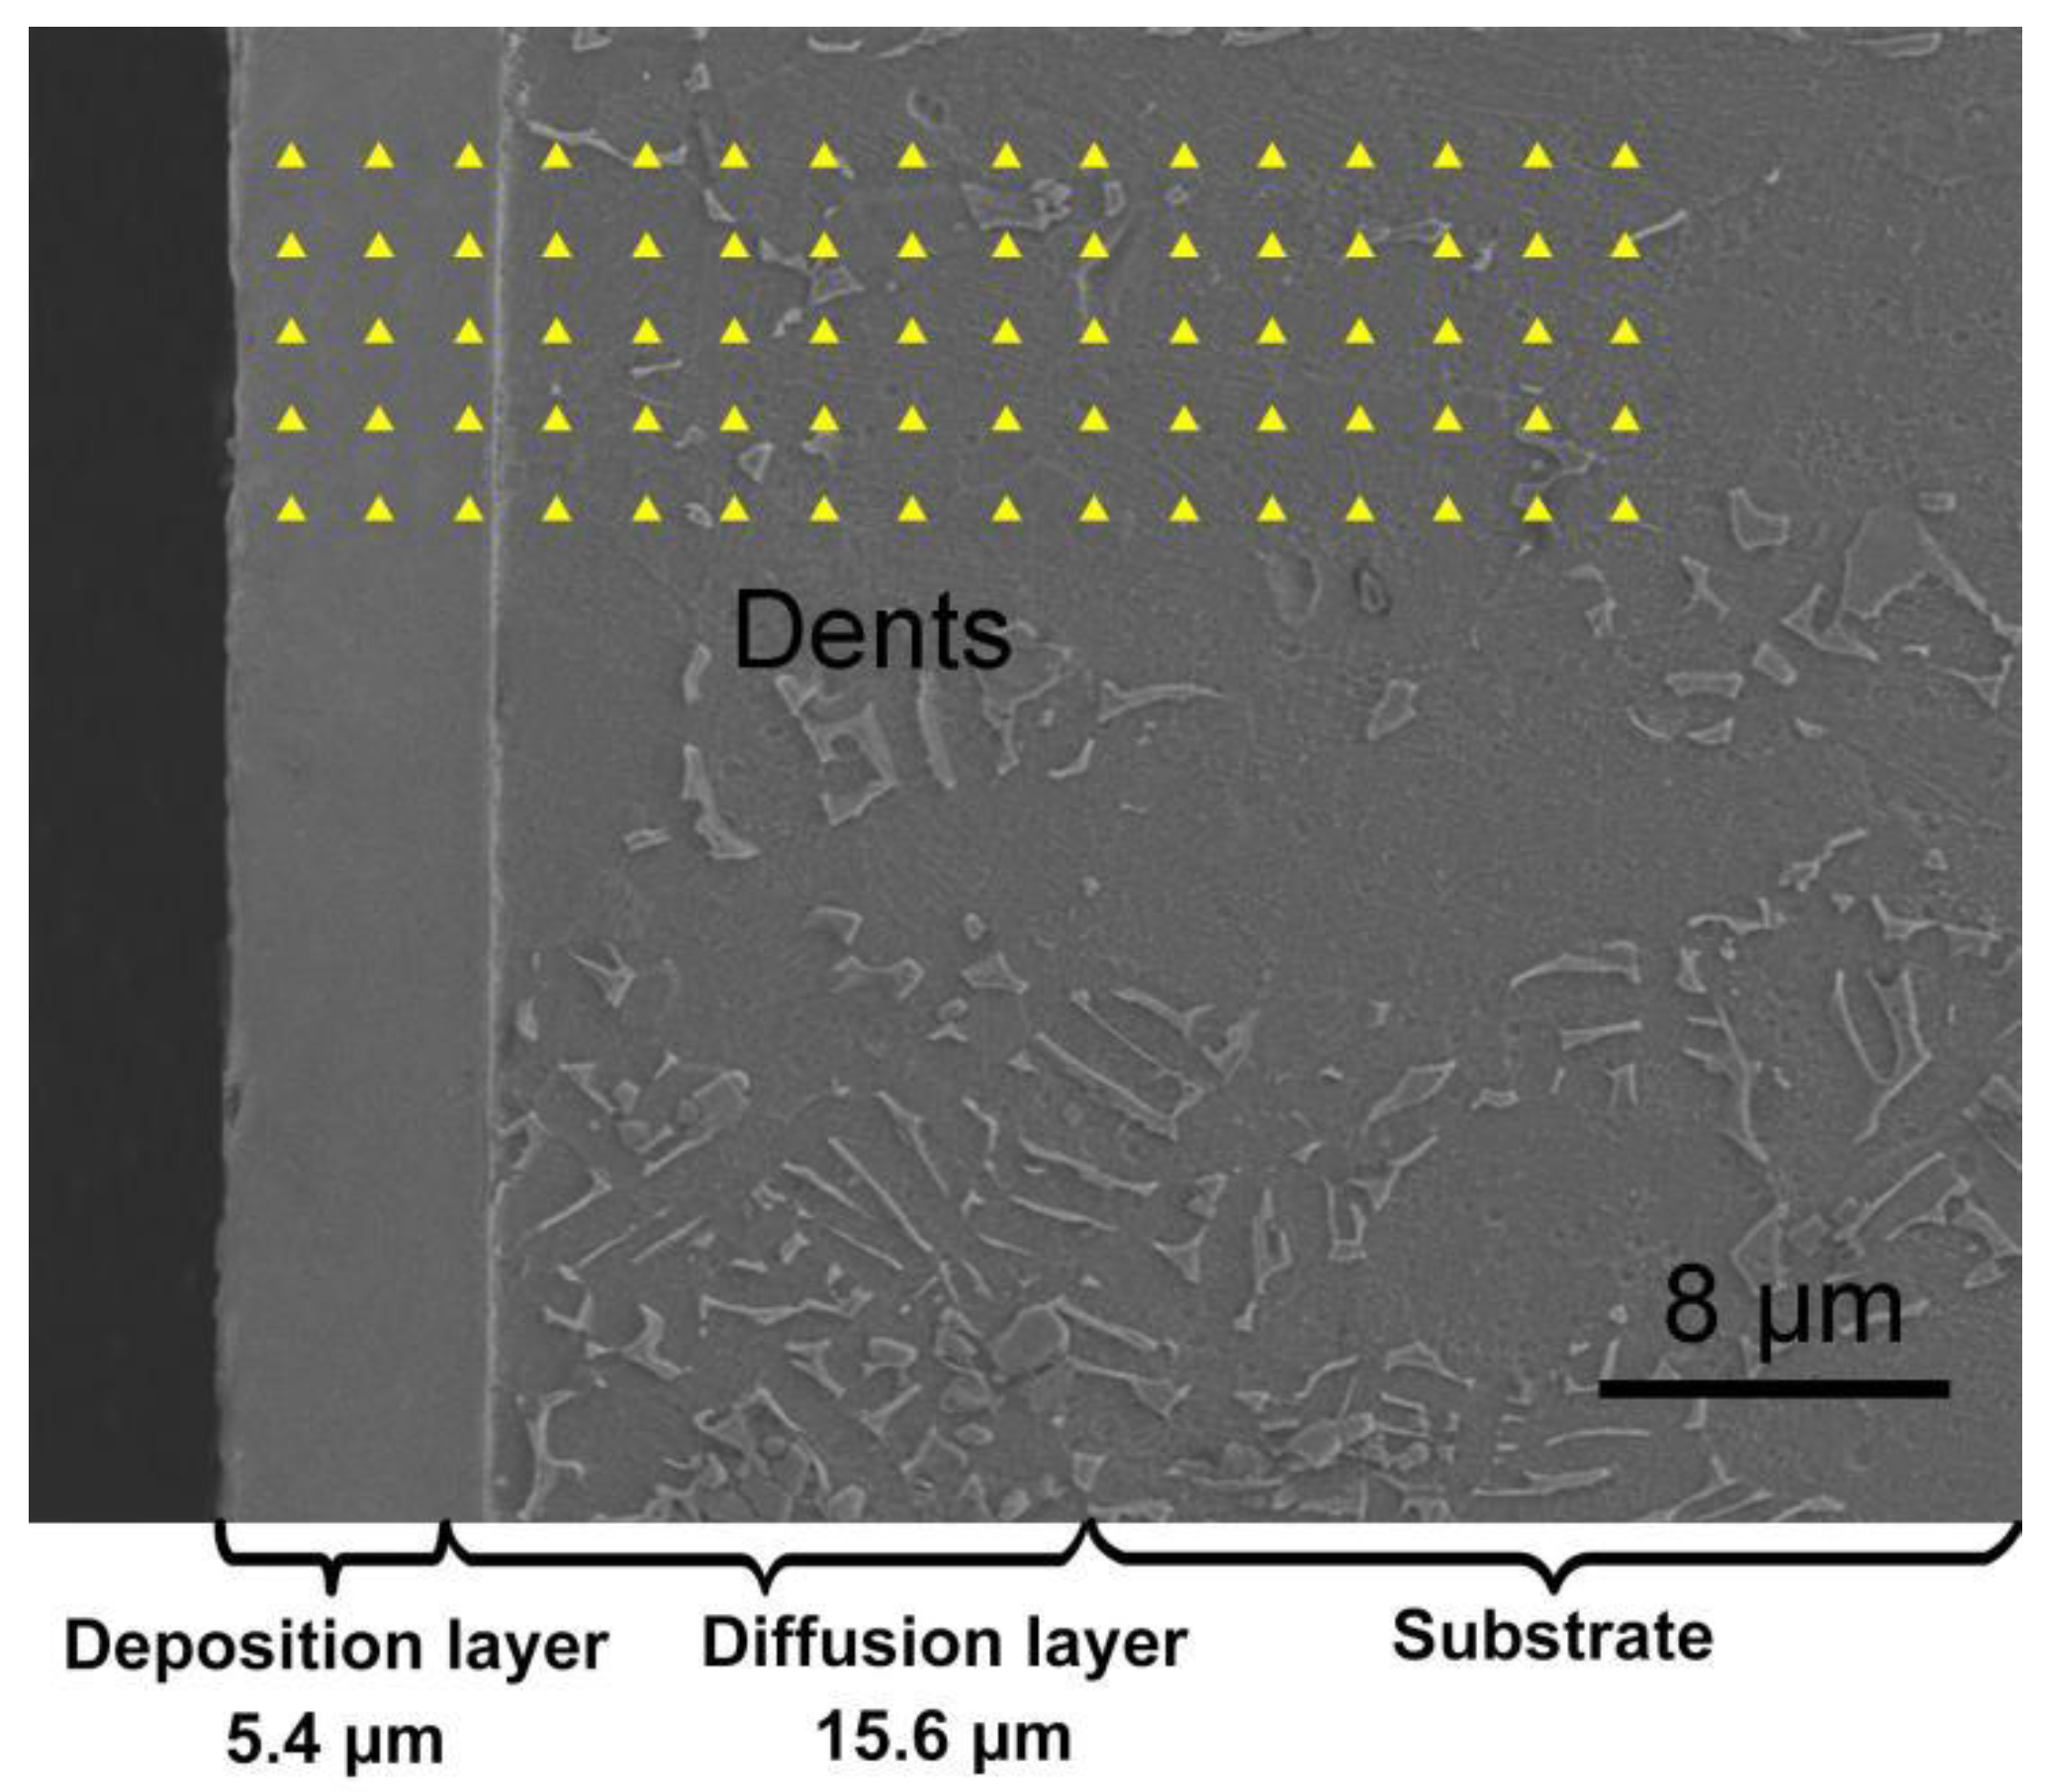
4.1. Microstructure Characterization

The element distribution of the Mo surface-modified TC4 with depth is shown in Figure 5. It is obvious, the Mo modified layer includes two parts, that is a pure Mo deposition layer of 5.4 μm and a Mo diffusion layer of 15.6 μm. In the Mo diffusion layer, the concentration of Mo gradually decreases along the thickness direction. Therefore, the Mo modified layer is compositionally graded.
The cross-sectional SEM micrograph of the Mo surface-modified TC4 is shown in Figure 6. It is seen that the Mo modified layer is continuous, dense and crack-free. Because Mo is infinitely soluble with Ti, the graded layer is a solid solution of Mo in Ti. There do not exist evident interfaces between the Mo diffusion layer and the TC4 substrate as well as the Mo deposition layer and the Mo diffusion layer. The interface in the Mo diffusion layer is caused by preferential etching of different composition and phases. According to the element concentration profile, the boundaries of the Mo deposition layer, the Mo diffusion layer and the TC4 substrate are marked at the bottom of Figure 6. For the convenience of analysis, the 5 × 16 indentation grid is also marked on the cross-section by using triangles.

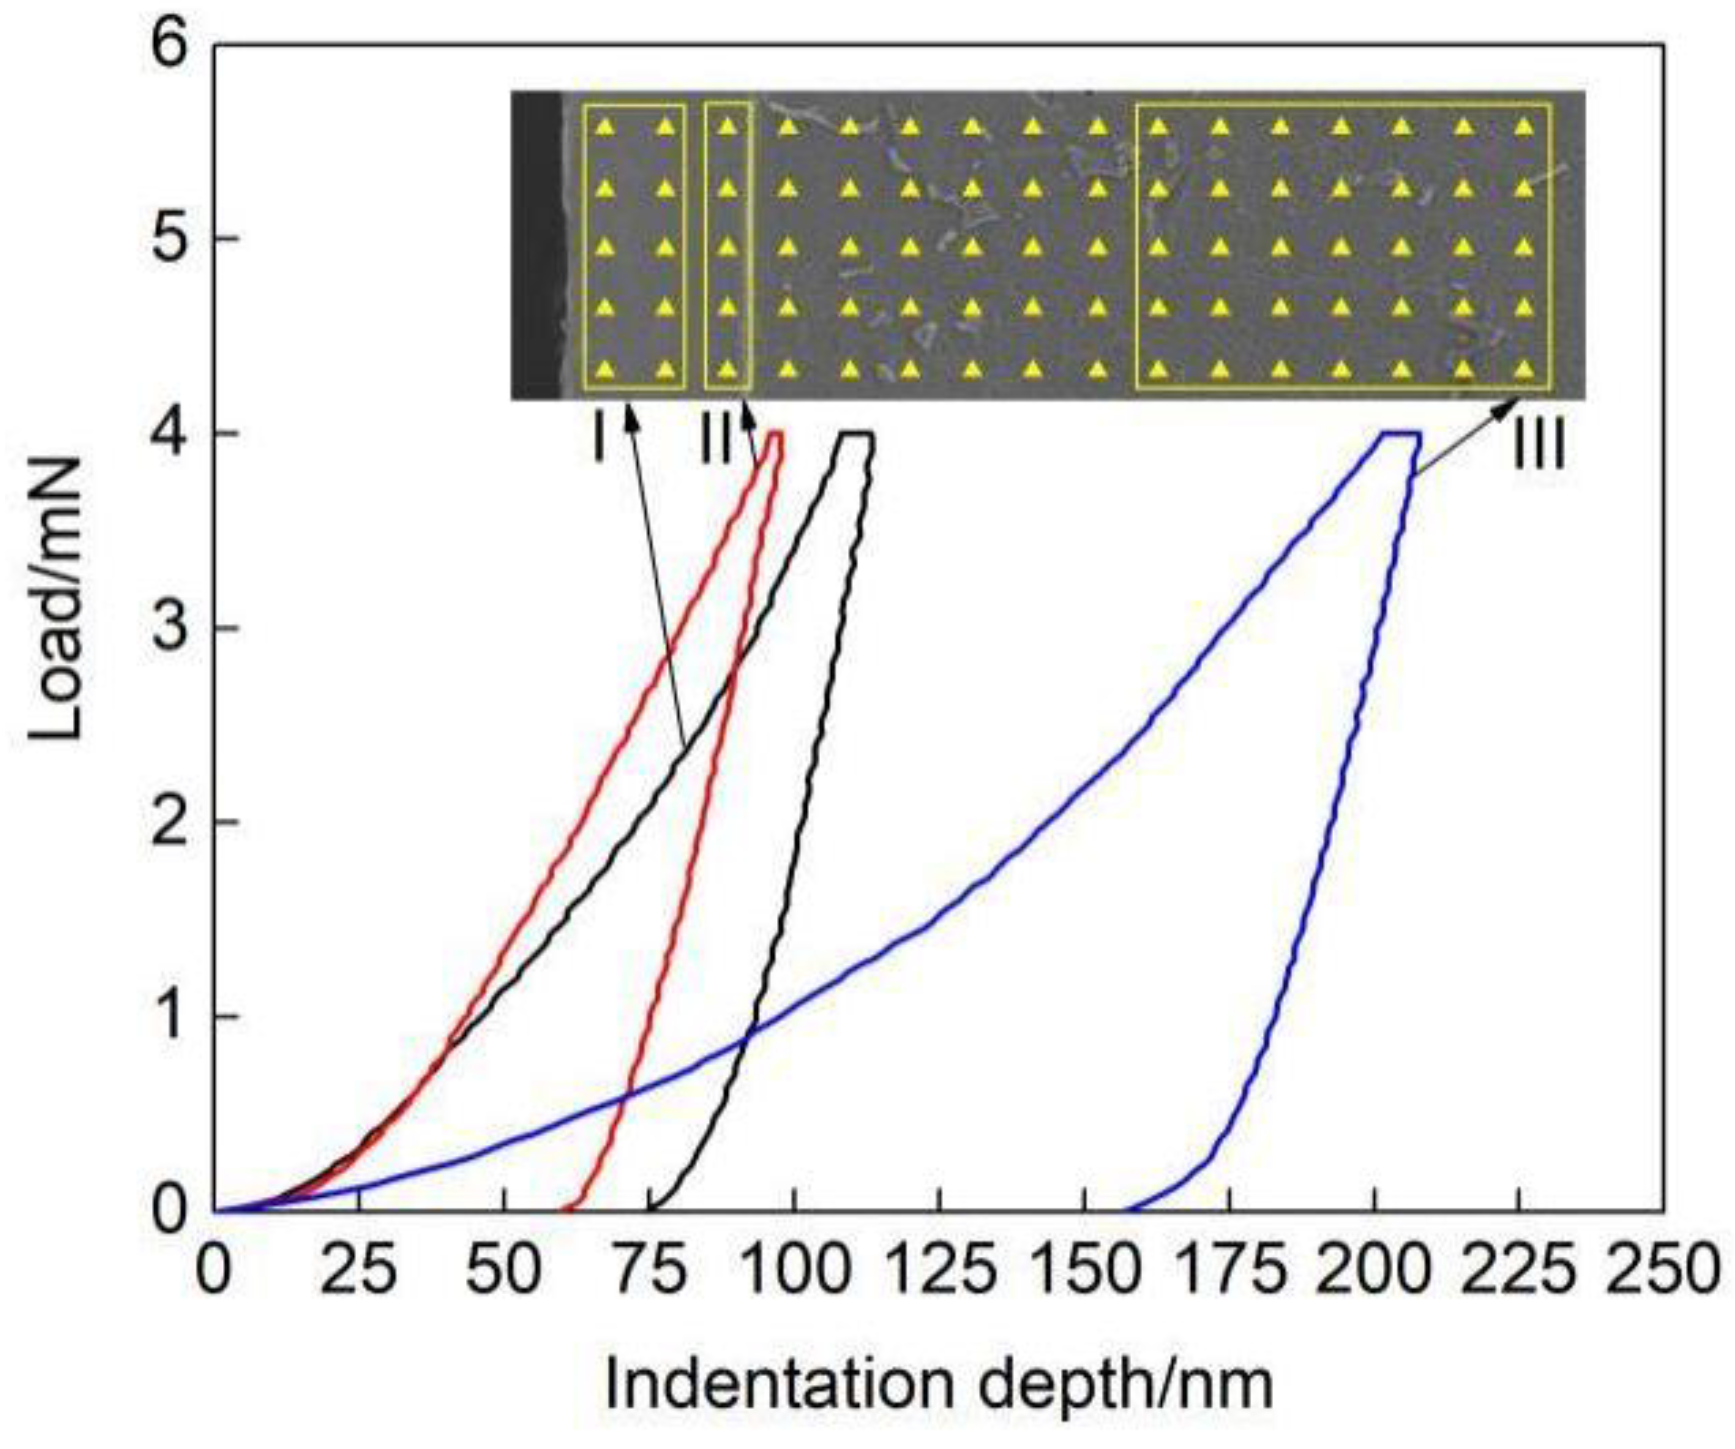
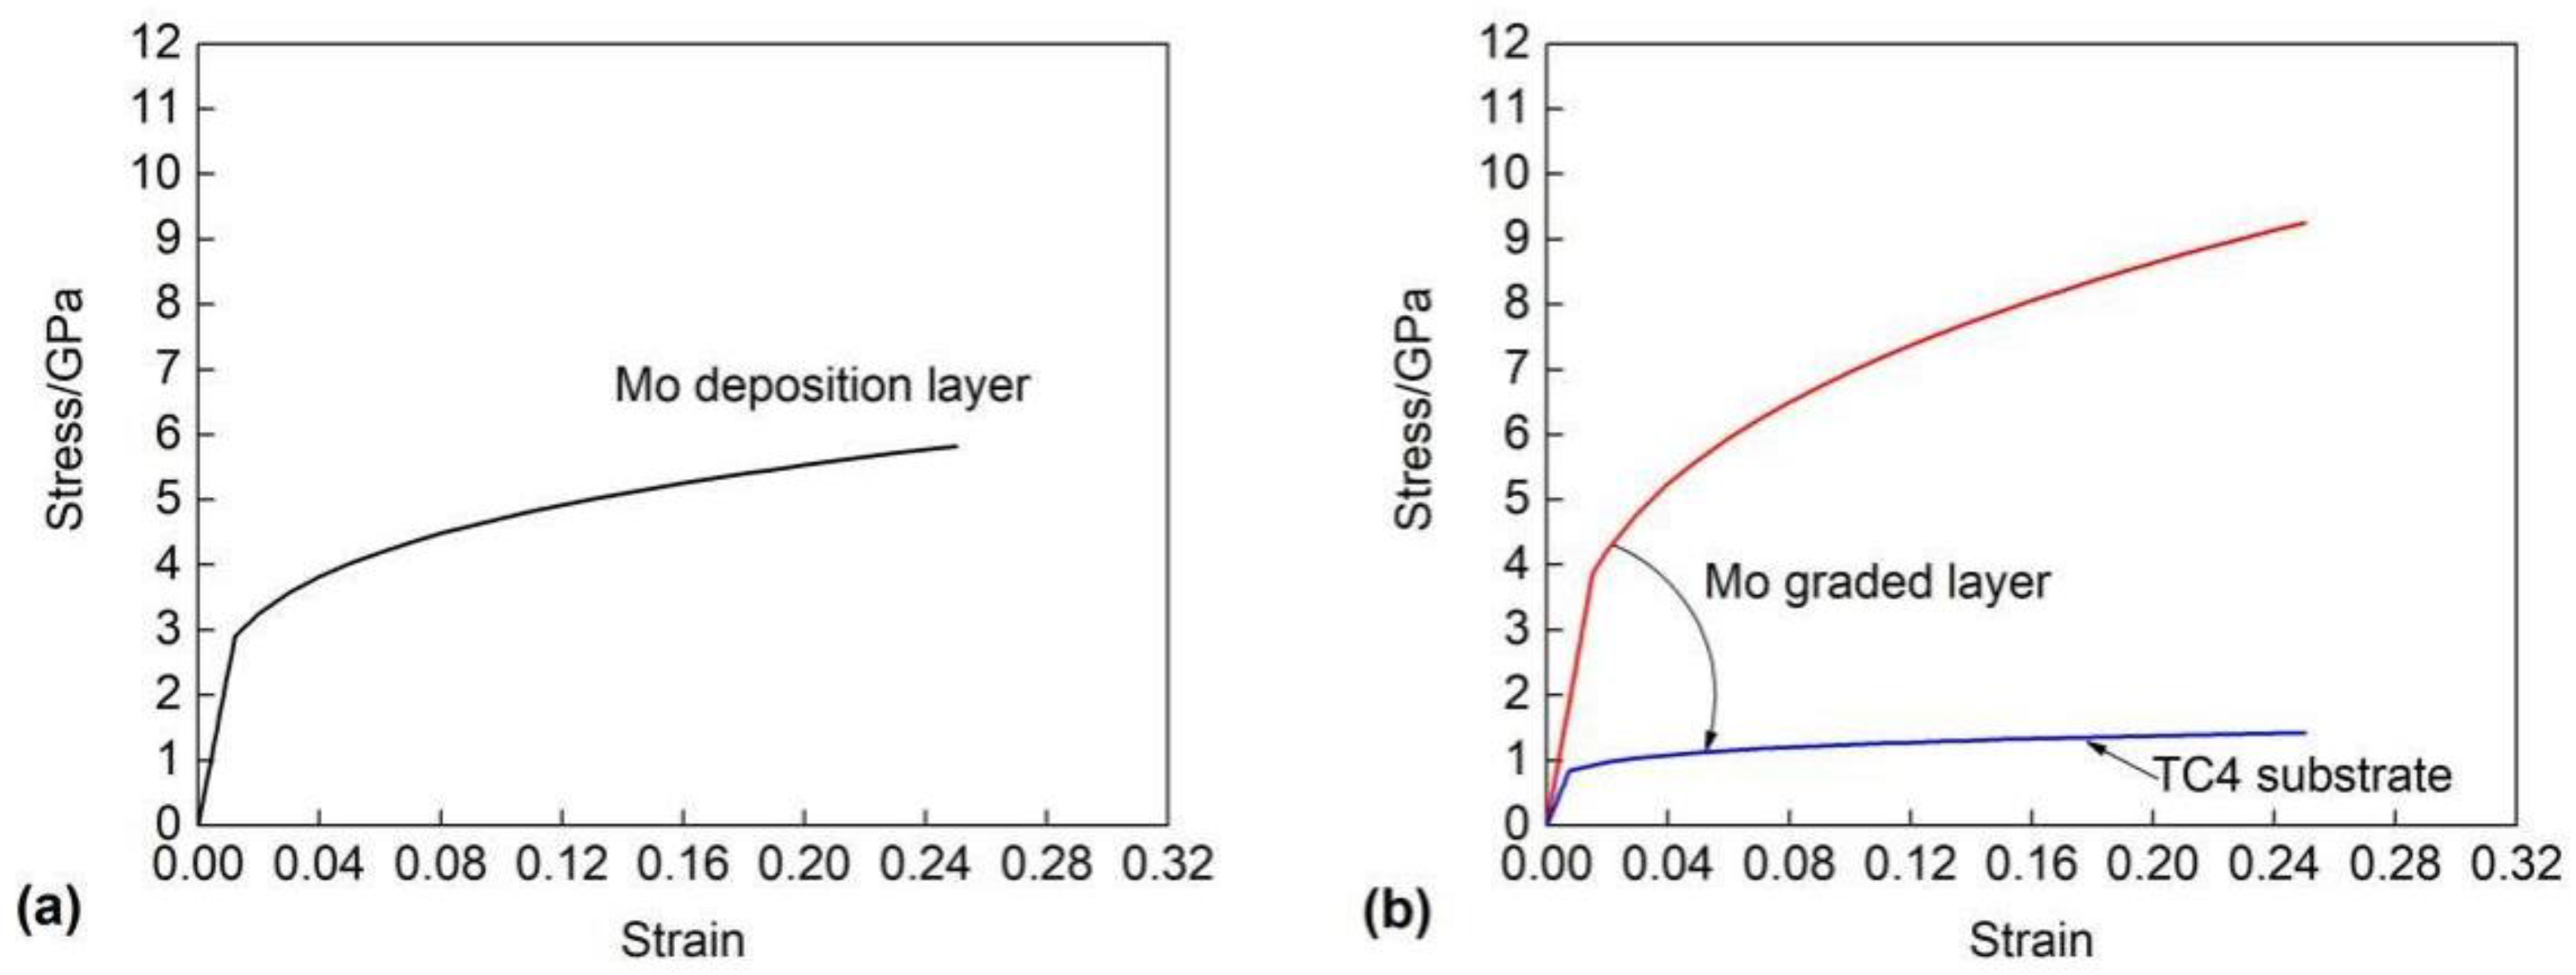
4.2. Elasto-Plastic Property Characterization of Mo Surface-Modified TC4

Average load-displacement curves corresponding to I, II and III areas are shown in Figure 7. I is the deposition layer, II is the initial part of the diffusion layer and III is the TC4 substrate. A load-displacement curve contains abundant mechanical information, such as hardness H, elastic modulus E and plastic deformation degree Δp. H and E can be directly determined by Oliver and Pharr method [16]. Δp is the percentage of residual indentation depth and the maximum indentation depth. Initial yield stress σy and strain hardening exponent n are determined by reverse analysis. All the elasto-plastic parameters are listed in Table 4. Obviously, the Mo modified layer belongs to an EPGM. After modification, the surface hardness is significantly improved. However, the initial part of the Mo diffusion layer is harder than the Mo deposition layer. That is why the thickness of the deposition layer should be properly controlled for specialized applications. Although surface strength is enhanced, Δp indicates that the surface plasticity is still good. Therefore, the Mo diffusion layer could effectively coordinate the deformation between the Mo deposition layer and the TC4 substrate. In addition, the initial part of the diffusion layer has the highest value of H3/E2, which reflects the plastic deformation resistance [50]. To some extent, a higher value of H3/E2 implied that the wear and impact resistance of the TC4 surface is also improved after Mo modification.
True stress-strain curves of the Mo deposition layer, the initial part of the Mo diffusion layer and the TC4 substrate are shown in Figure 8. Because the Mo deposition layer is relatively thick, stress-strain curves of the Mo deposition layer and the initial part of the Mo diffusion layer have an obvious difference. In practical application, the difference can be neglected if the deposition layer is thin enough. For the Mo graded layer, the true stress-strain curve at a given thickness is determined by Equation (7).

4.3. Impact Properties of Mo Surface-Modified TC4

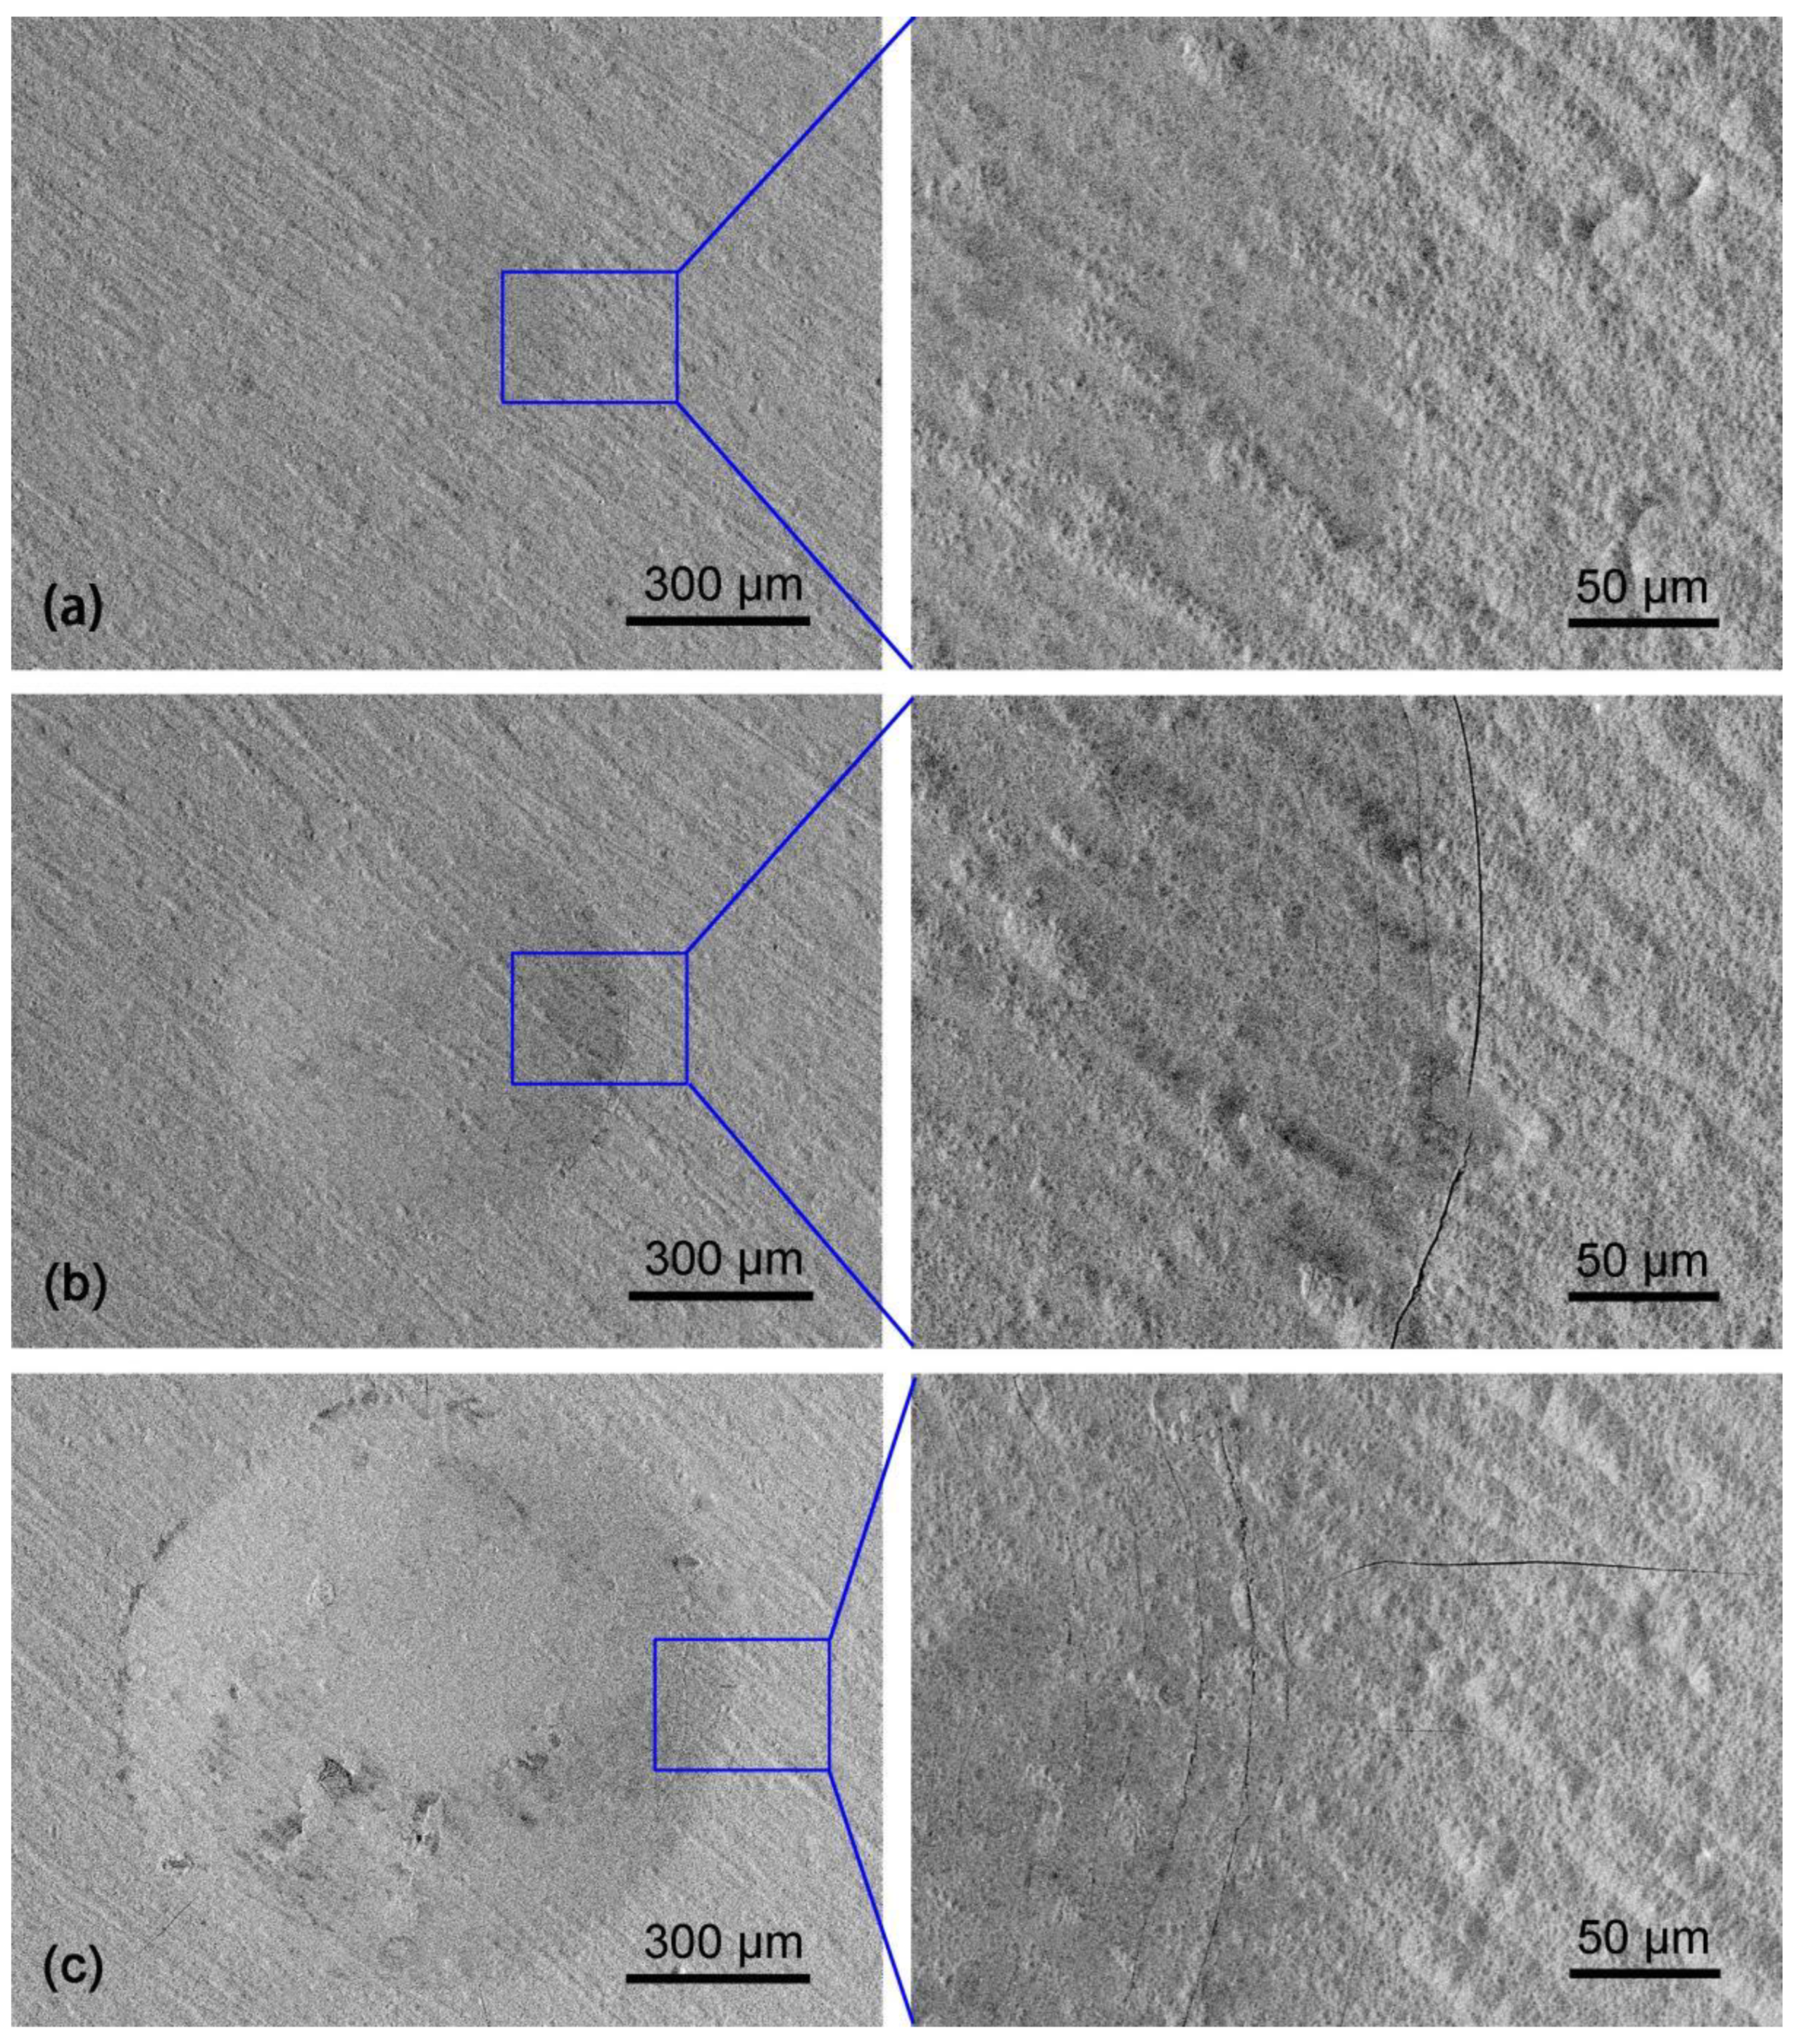
4.3.1. Residual Impact Impression Characterization

After 10,000 impact cycles at 100, 300 and 500 N, the SEM images of residual impact impressions are shown in Figure 9. Figure 9a shows that the impact load 100 N only causes small plastic deformation on the Mo modified layer. Figure 9b,c present cracks near the impact circles. Similar to hard coating/soft substrate systems, ring cracks firstly generate and then radial cracks with the increase of static or dynamic indentation loads [51]. The ring cracks are mainly caused by tensile stress around the impact circle. By contrast, the radial cracks are mainly caused by stress transition from compressive stress underneath the impact indenter to tensile stress. In general, the impact responses of coating/substrate systems can be divided into three stages: (i) plastic deformation, (ii) crack generation and (iii) spalling. Stage (ii) is also called the fatigue stage, which is responsible for the failure of engineering materials. Stage (iii) is caused by repeated fatigue failure. Based on that, the impact effects of 100 N can be neglected. Impact loads 300 and 500 N can result in spalling if impact cycles reach a critical value. Further, only increasing loads can also result in spalling.

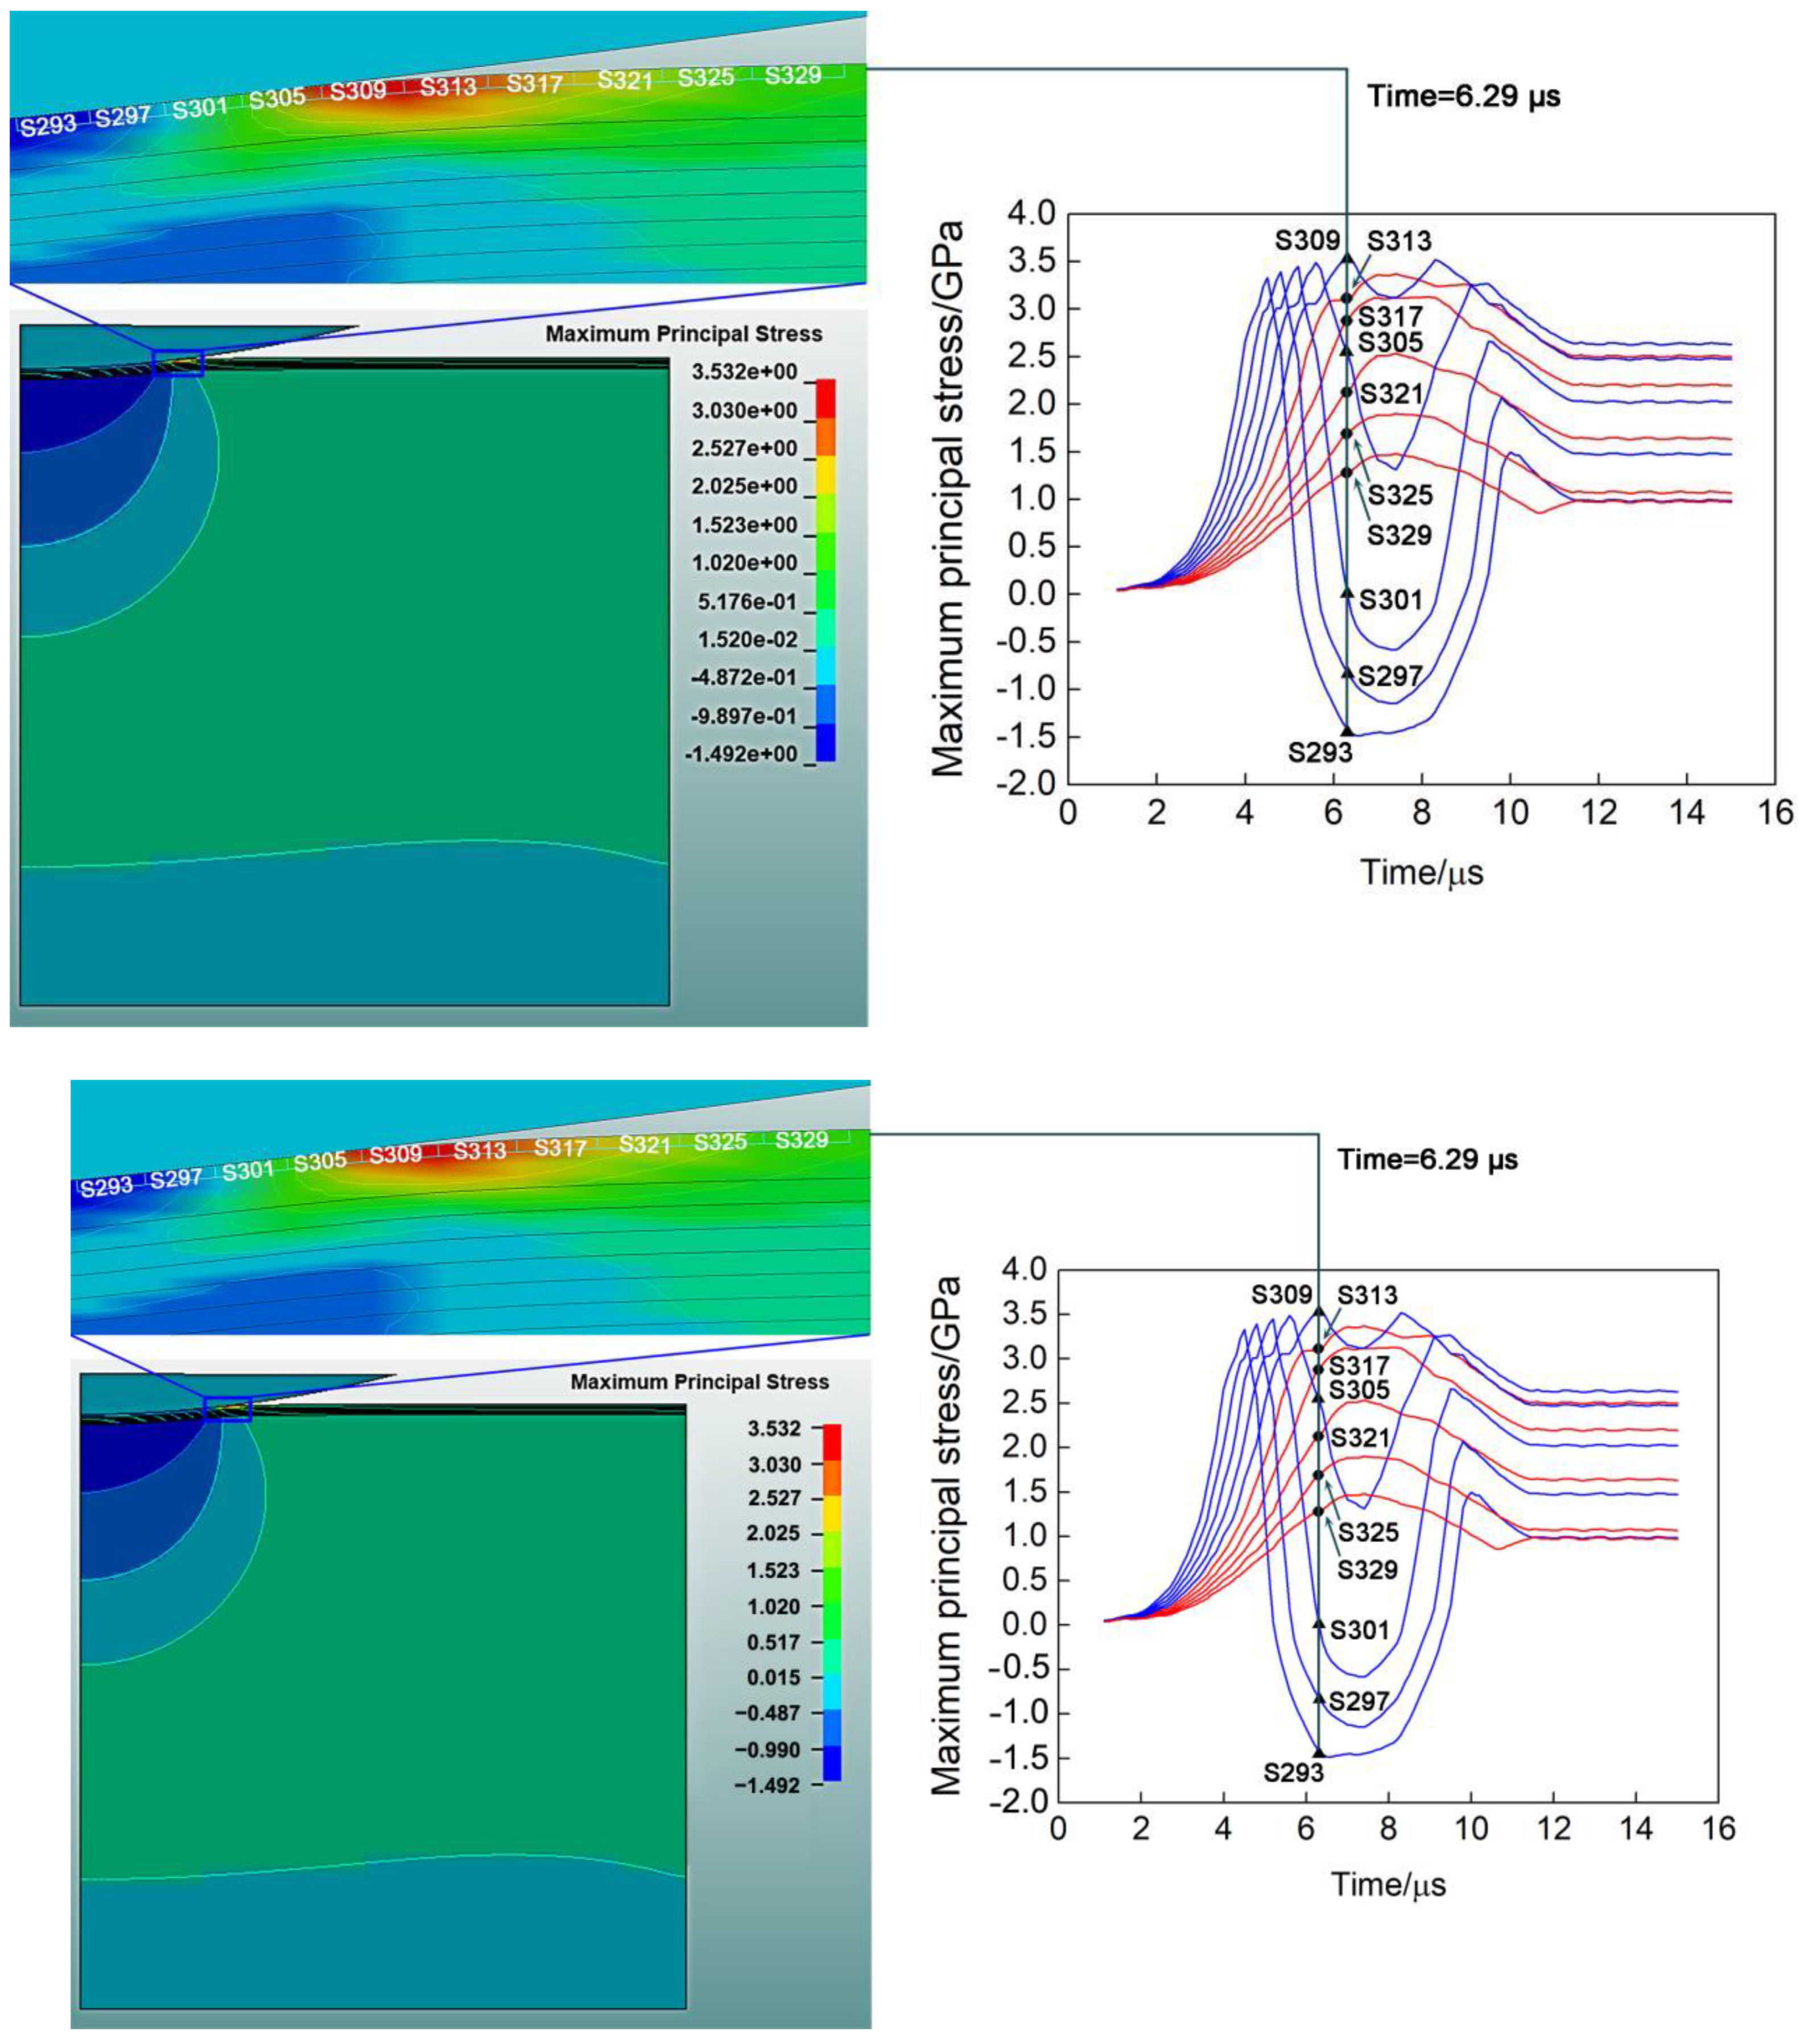
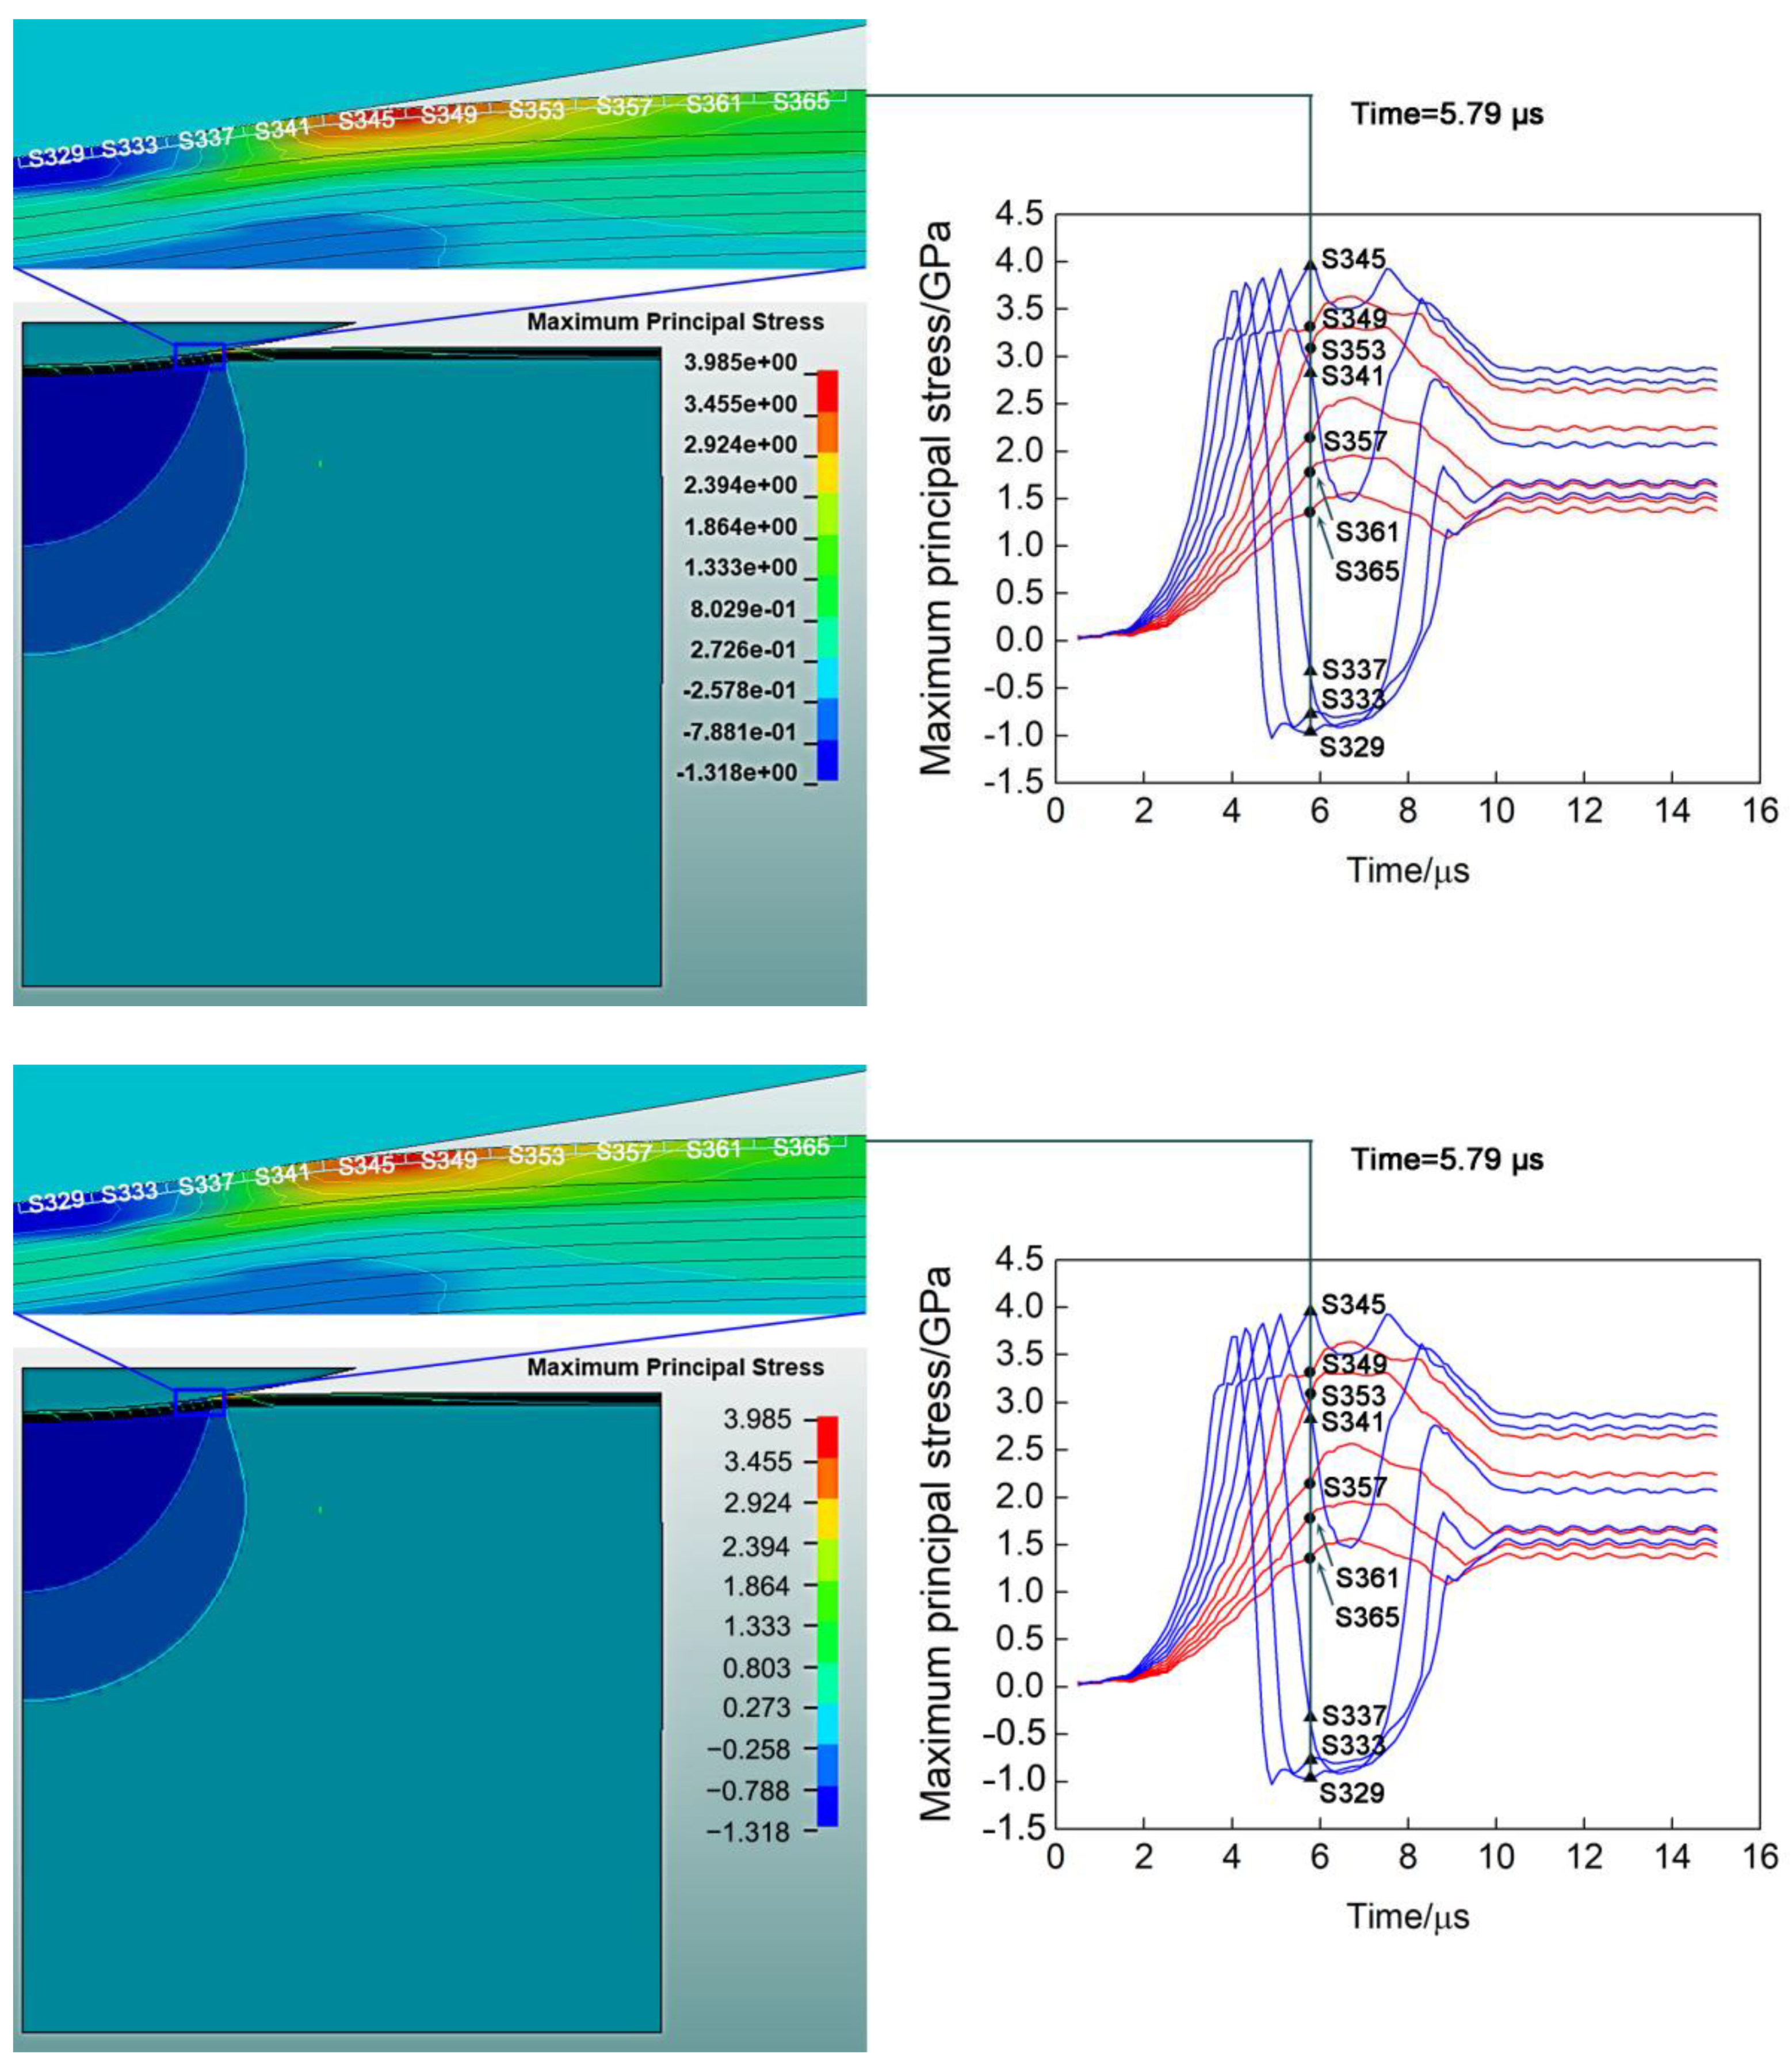
4.3.2. Finite Element forward Analysis

Apart from understanding the failure mode, it is more meaningful to quantitatively determine the stress distributions in the impact material when cracks are generated and further propagate. For that purpose, material models should be firstly established in ANSYS/LS-DYNA. In order to reduce computing time, the Mo diffusion layer is simplified into six homogeneous layers with the same thickness of 2.6 μm. True stress-strain curves of six sublayers are shown in Figure 10a. After material attributes are defined, finite element mesh with different colors is shown in Figure 10b.
As mentioned above, tensile stress and stress transition from compressive stress to tensile stress are most critical in the process of crack formation and propagation. Thus, it is essential to determine the maximum principal stress (first principal stress) distributions in the Mo modified TC4 surface. Figure 11 quantitatively provides the element maximum principal stress information corresponding to the first 300 N impact. The left part in Figure 11 shows the maximum principal stress contours at the impact time of 6.29 μs and the right part shows the surface element maximum principal stress-time curves. It can be found that the contact circle is between element S309 and element S313. From the impact center to the contact circle, the internal stress of surface elements firstly increases and then gradually decreases until the impact velocity becomes zero. When the tensile stress of element S309 reaches a maximum of 3.53 GPa at 6.29 μs, the internal stress of elements S305, S301, S297 and S293 is 2.55, 0.024, −0.81 and −1.41 GPa, respectively. Therefore, elements S297 and S293 undergo a transition from tensile stress to compressive stress. Similar to element S309, element S293 has the maximum compressive stress at 6.29 μs in the entire impact cycle, indicating that large plastic deformations would mainly generate around the impact center and the contact circle. Except for element S293, the internal stress of elements S309, S305, S301 and S297 decreases to minimum values at 7.20 μs, which is 3.14, 1.37, −0.57 and −1.14 GPa, respectively. After 7.20 μs, the internal stress of surface elements inside the contact circle also firstly increases and then gradually decreases until the impact ball leaves the sample surface. Different from surface elements inside the contact circle, surface elements outside the contact circle bear tensile stress in the entire impact cycle, which gradually increases before the impact time of 7.20 μs and then gradually decreases. After the first impact, the contact circle zone has the maximum residual impact tensile stress of 2.62 GPa, while the impact center has the minimum residual impact tensile stress of 0.97 GPa. With the increase of impact times, stretch fatigue can be caused around element S309 and further tension-compression fatigue would occur inside the contact circle. In conclusion, the ring cracks in Figure 9b are mainly caused by impact stretch fatigue and corresponding cyclic stress is between 3.53 and 2.62 GPa.
Figure 12 quantitatively provides the element maximum principal stress information corresponding to the first 500 N impact. The left part in Figure 12 shows the maximum principal stress contours at the impact time of 5.79 μs and the right part shows the surface element maximum principal stress-time curves. By comparison, the impact stress in Figure 11 and Figure 12 have the same variation trend except for elements S329 and S323. At 5.79 μs, element S345 has the maximum tensile stress of 3.98 GPa and element S329 has the compressive stress of −0.96 GPa. It should be noted, the maximum compressive stress in elements S329 and S323 occurs before 5.79 μs. Besides, the compressive stress has a staggering growth from the impact time of 5.79 to 6.49 μs when the impact ball has the maximum impact depth. The compressive stress fluctuation of around 5.79 μs indicates that the impact wave under 500 N leads to the vibration of elements S329 and S323. Compared to Figure 11, stress plateaus in Figure 12 are more obvious. The stress plateau can be regarded as a plastic yield stage and after that plastic deformation begins to occur. After the first impact, the surface maximum residual impact stress is 2.86 GPa and the surface minimum residual impact stress is 1.36 GPa which is much higher than that in Figure 11. The ring cracks in Figure 9c are also mainly caused by impact stretch fatigue and corresponding cyclic stress is between 3.98 and 2.86 GPa. The radial cracks in Figure 9c are mainly related to the tension-compression fatigue and corresponding cyclic stress is between 3.92 and −0.97 GPa.

5. Conclusions

The Mo graded surface-modified layer is prepared on TC4 using the plasma surface alloying technique, which consists of a pure Mo deposition layer of 5.4 μm and a Mo diffusion layer of 15.6 μm. Nanoindentation test results indicate that the surface hardness of TC4 is significantly improved after surface modification. Therefore, the initial part of the Mo diffusion layer has higher hardness than the Mo deposition layer. The impact tests for 10,000 cycles at different loads demonstrate that impact load 100 N only causes small plastic deformation, while impact loads 300 and 500 N could result in cracks. With the increase of impact loads, ring cracks firstly generate and then radial cracks generate, which is a typical characteristic of hard coating/soft substrate systems. Combining nanoindentation with finite element reverse analysis, the plastic parameters of the Mo surface-modified layer are determined. Further, the dynamic contact mechanical properties of Mo surface-modified TC4 are quantitatively characterized by the finite element forward analysis. Based on the maximum principal stress (first principal stress) distributions in the sample surface, impact cyclic stress leading to ring and radial cracks are quantitatively determined. The cyclic stress leading to ring cracks is between 3.53 and 2.62 GPa and the cyclic stress leading to radial cracks is between 3.92 and −0.97 GPa.

Author Contributions

Conceptualization, H.G. and Y.M.; methodology, J.G.; software, K.Z.; validation, J.G. and Y.M.; investigation, K.Z.; data analysis, S.Y. and H.H.; data curation, Y.M.; writing—original draft preparation, J.G.; writing—review and editing, Y.W. and Y.M.; funding acquisition, J.G. All authors have read and agreed to the published version of the manuscript.

Funding

This study was jointly supported by the National Natural Science Foundation of China (51901154), the Natural Science Foundation of Shanxi Province (201901D211092), the Science and Technology Major Project of Shanxi (20181102013), and the “1331 Project” Engineering Research Center of Shanxi (PT201801).

Institutional Review Board Statement

Not applicable.

Informed Consent Statement

Not applicable.

Data Availability Statement

Not applicable.

Conflicts of Interest

The authors declare no conflict of interest.

References

  1. Nolan, D.; Huang, S.; Leskovsek, V.; Braun, S. Sliding wear of titanium nitride thin films deposited on Ti–6Al–4V alloy by PVD and plasma nitriding processes. Surf. Coat. Technol. 2006, 200, 5698–5705. [Google Scholar] [CrossRef]
  2. Spigarelli, S.; Paoletti, C.; Cabibbo, M.; Cerri, E.; Santecchia, E. On the creep performance of the Ti-6Al-4V alloy processed by additive manufacturing. Addit. Manuf. 2021, 49, 102520–1025535. [Google Scholar] [CrossRef]
  3. Farokhzadeh, K.; Qian, J.; Edrisy, A. Effect of SPD surface layer on plasma nitriding of Ti–6Al–4V alloy. Mater. Sci. Eng. A 2014, 589, 199–208. [Google Scholar] [CrossRef]
  4. Farè, S.; Lecis, N.; Vedani, M.; Silipigni, A.; Favoino, P. Properties of nitrided layers formed during plasma nitriding of commercially pure Ti and Ti–6Al–4V alloy. Surf. Coat. Technol. 2012, 206, 2287–2292. [Google Scholar] [CrossRef]
  5. Morita, T.; Asakura, K.; Kagaya, C. Effect of combination treatment on wear resistance and strength of Ti–6Al–4V alloy. Mater. Sci. Eng. A 2014, 618, 438–446. [Google Scholar] [CrossRef]
  6. Fathyunes, L.; Khalil-Allafi, J.; Moosavifar, M. Development of graphene oxide/calcium phosphate coating by pulse elec-trodeposition on anodized titanium: Biocorrosion and mechanical behavior. J. Mech. Behav. Biomed. Mater. 2019, 90, 575–586. [Google Scholar] [CrossRef] [PubMed]
  7. Buga, C.; Hunyadi, M.; Gácsi, Z.; Hegedűs, C.; Hakl, J.; Schmidt, U.; Ding, S.-J.; Csík, A. Calcium silicate layer on titanium fabricated by electrospray deposition. Mater. Sci. Eng. C 2019, 98, 401–408. [Google Scholar] [CrossRef]
  8. Kaestner, P.; Olfe, J.; He, J.-W.; Rie, K.-T. Improvement in the load-bearing capacity and adhesion of TiC coatings on TiAl6V4 by duplex treatment. Surf. Coat. Technol. 2001, 142–144, 928–933. [Google Scholar] [CrossRef]
  9. Hosseini, S.R.; Ahmadi, A. Evaluation of the effects of plasma nitriding temperature and time on the characterisation of Ti 6Al 4V alloy. Vacuum 2013, 87, 30–39. [Google Scholar] [CrossRef]
  10. Farokhzadeh, K.; Edrisy, A. Fatigue improvement in low temperature plasma nitrided Ti-6Al-4V alloy. Mater. Sci. Eng. A 2015, 620, 435–444. [Google Scholar] [CrossRef]
  11. Tang, B.; Wu, P.Q.; Li, X.Y.; Fan, A.L.; Xu, Z.; Celis, J.P. Tribological behavior of plasma Mo–N surface-modified Ti-6Al-4V alloy. Surf. Coat. Technol. 2004, 179, 333–339. [Google Scholar] [CrossRef]
  12. Wang, Z.; He, Z.; Wang, Y.; Liu, X.; Tang, B. Microstructure and tribological behaviors of Ti6Al4V alloy treated by plasma Ni alloying. Appl. Surf. Sci. 2011, 257, 10267–10272. [Google Scholar] [CrossRef]
  13. Lin, C.-M.; Kai, W.-Y.; Su, C.-Y.; Tsai, C.-N.; Chen, Y.-C. Microstructure and mechanical properties of Ti-6Al-4V alloy diffused with molybdenum and nickel by double glow plasma surface alloying technique. J. Alloys Compd. 2017, 717, 197–204. [Google Scholar] [CrossRef]
  14. Marteau, J.; Bouvier, S. Characterization of the microstructure evolution and subsurface hardness of graded stainless steel produced by different mechanical or thermochemical surface treatments. Surf. Coat. Technol. 2016, 296, 136–148. [Google Scholar] [CrossRef]
  15. Ma, Y.; Zhang, Y.; Yao, X.; Zhang, X.; Shu, X.; Tang, B. Characterization of Mo surface modified Ti by indentation techniques. Surf. Coat. Technol. 2013, 226, 75–81. [Google Scholar] [CrossRef]
  16. Oliver, W.C.; Pharr, G.M. An improved technique for determining hardness and elastic modulus using load and dis-placement sensing indentation experiments. J. Mater. Res. 1992, 7, 1564–1583. [Google Scholar] [CrossRef]
  17. Dao, M.; Chollacoop, N.; Van Vliet, K.J.; Venkatesh, T.A.; Suresh, S. Computational modeling of the forward and reverse problems in instrumented sharp indentation. Acta Mater. 2001, 49, 3899–3918. [Google Scholar] [CrossRef] [Green Version]
  18. Zhao, M.; Chen, X.; Xiang, Y.; Vlassak, J.J.; Lee, D.; Ogasawara, N.; Chiba, N.; Gan, Y.X. Measuring elastoplastic properties of thin films on an elastic substrate using sharp indentation. Acta Mater. 2007, 55, 6260–6274. [Google Scholar] [CrossRef]
  19. Zhao, M.H.; Xiang, Y.; Xu, J.; Ogasawara, N.; Chiba, N.; Xi, C. Determining mechanical properties of thin films from the loading curve of nanoinden-tation testing. Thin Solid Film. 2008, 516, 7571–7580. [Google Scholar] [CrossRef]
  20. Liao, Y.; Zhou, Y.; Huang, Y.; Jiang, L. Measuring elastic–plastic properties of thin films on elastic–plastic substrates by sharp indentation. Mech. Mater. 2009, 41, 308–318. [Google Scholar] [CrossRef]
  21. Giannakopoulos, A.; Suresh, S. Indentation of solids with gradients in elastic properties: Part I. Point force. Int. J. Solids Struct. 1997, 34, 2357–2392. [Google Scholar] [CrossRef]
  22. Giannakopoulos, A.; Suresh, S. Indentation of solids with gradients in elastic properties: Part II. axisymmetric indentors. Int. J. Solids Struct. 1997, 34, 2393–2428. [Google Scholar] [CrossRef]
  23. Giannakopoulos, A. Indentation of plastically graded substrates by sharp indentors. Int. J. Solids Struct. 2002, 39, 2495–2515. [Google Scholar] [CrossRef]
  24. Cao, Y.P.; Lu, J. A new scheme for computational modeling of conical indentation in plastically graded materials. J. Mater. Res. 2004, 19, 1703–1716. [Google Scholar] [CrossRef]
  25. Choi, I.; Dao, M.; Suresh, S. Mechanics of indentation of plastically graded materials—I: Analysis. J. Mech. Phys. Solids 2008, 56, 157–171. [Google Scholar] [CrossRef]
  26. Choi, I.; Detor, A.; Schwaiger, R.; Dao, M.; Schuh, C.; Suresh, S. Mechanics of indentation of plastically graded materials—II: Experiments on nanocrystalline alloys with grain size gradients. J. Mech. Phys. Solids 2008, 56, 172–183. [Google Scholar] [CrossRef]
  27. Moussa, C.; Bartier, O.; Mauvoisin, G.; Pilvin, P.; Delattre, G. Characterization of homogenous and plastically graded materials with spherical indentation and inverse analysis. J. Mater. Res. 2011, 27, 20–27. [Google Scholar] [CrossRef] [Green Version]
  28. Pelegri, A.A.; Huang, X. Nanoindentation on soft film/hard substrate and hard film/soft substrate material systems with finite element analysis. Compos. Sci. Technol. 2008, 68, 147–155. [Google Scholar] [CrossRef]
  29. Chen, J.; Bull, S. Finite element analysis of contact induced adhesion failure in multilayer coatings with weak interfaces. Thin Solid Films 2009, 517, 3704–3711. [Google Scholar] [CrossRef]
  30. Kataria, S.; Goyal, S.; Dash, S.; Tyagi, A. Nanomechanical characterization of thermally evaporated Cr thin films—FE analysis of the substrate effect. Thin Solid Films 2010, 519, 312–318. [Google Scholar] [CrossRef]
  31. Kot, M.; Rakowski, W.; Lackner, J.M.; Major, L. Analysis of spherical indentations of coating-substrate systems: Experiments and finite element modeling. Mater. Des. 2013, 43, 99–111. [Google Scholar] [CrossRef]
  32. Brezmes, A.O.; Breitkopf, C. Influence of indenter tip diameter and film thickness on flat indentations into elastic-plastic films by means of the finite element method. Thin Solid Film. 2018, 653, 49–56. [Google Scholar] [CrossRef]
  33. Li, J.; Beres, W. Three-dimensional finite element modelling of the scratch test for a TiN coated titanium alloy substrate. Wear 2006, 260, 1232–1242. [Google Scholar] [CrossRef]
  34. Vedaei-Sabegh, A.; Ahmadi, S.R.; Gholamzadeh, B. Investigation of pile-up during a rigid ball sliding on coated surface based on elastic–plastic analysis. Surf. Coat. Technol. 2014, 251, 283–292. [Google Scholar] [CrossRef]
  35. Bouzakis, K.-D.; Batsiolas, M.; Skordaris, G.; Stergioudi, F.; Michailidis, N. Repetitive impact test near uncoated and coated cutting edges for assessing their fatigue behavior. CIRP J. Manuf. Sci. Technol. 2015, 8, 63–69. [Google Scholar] [CrossRef]
  36. Bouzakis, K.; Maliaris, G.; Makrimallakis, S. Strain rate effect on the fatigue failure of thin PVD coatings: An investigation by a novel impact tester with adjustable repetitive force. Int. J. Fatigue 2012, 44, 89–97. [Google Scholar] [CrossRef]
  37. Bartier, O.; Hernot, X.; Mauvoisin, G. Theoretical and experimental analysis of contact radius for spherical indentation. Mech. Mater. 2010, 42, 640–656. [Google Scholar] [CrossRef] [Green Version]
  38. Ogasawara, N.; Chiba, N.; Chen, X. Representative Strain of Indentation Analysis. J. Mater. Res. 2005, 20, 2225–2234. [Google Scholar] [CrossRef]
  39. Cao, Y.; Huber, N. Further investigation on the definition of the representative strain in conical indentation. J. Mater. Res. 2006, 21, 1810–1821. [Google Scholar] [CrossRef]
  40. Cao, Y.; Qian, X.; Huber, N. Spherical indentation into elastoplastic materials: Indentation-response based definitions of the representative strain. Mater. Sci. Eng. A 2007, 454–455, 1–13. [Google Scholar] [CrossRef]
  41. Moussa, C.; Hernot, X.; Bartier, O.; Delattre, G.; Mauvoisin, G. Identification of the hardening law of materials with spherical indentation using the average representative strain for several penetration depths. Mater. Sci. Eng. A 2014, 606, 409–416. [Google Scholar] [CrossRef] [Green Version]
  42. Antunes, J.; Fernandes, J.V.; Menezes, L.F.; Chaparro, B. A new approach for reverse analyses in depth-sensing indentation using numerical simulation. Acta Mater. 2007, 55, 69–81. [Google Scholar] [CrossRef] [Green Version]
  43. Lee, J.; Lee, C.; Kim, B. Reverse analysis of nano-indentation using different representative strains and residual indentation profiles. Mater. Des. 2009, 30, 3395–3404. [Google Scholar] [CrossRef]
  44. Ma, Y.; Zhang, Y.; Yu, H.-F.; Zhang, X.-Y.; Shu, X.-F.; Tang, B. Plastic characterization of metals by combining nanoindentation test and finite element simulation. Trans. Nonferrous Met. Soc. China 2013, 23, 2368–2373. [Google Scholar] [CrossRef]
  45. Ma, Y.; Yao, X.H.; Tian, L.H.; Zhang, X.; Tang, B. Extract the plastic properties of metals using reverse analysis of nanoindentation test. Acta Metall. Sin. 2011, 47, 321–326. [Google Scholar]
  46. Ma, Y.; Qin, J.; Zhang, X.; Lin, N.; Huang, X.; Tang, B. Failure Behavior Characterization of Mo-Modified Ti Surface by Impact Test and Finite Element Analysis. J. Mater. Eng. Perform. 2015, 24, 2678–2687. [Google Scholar] [CrossRef]
  47. Kermouche, G.; Pacquaut, G.; Langlade, C.; Bergheau, J.-M. Investigation of mechanically attrited structures induced by repeated impacts on an AISI1045 steel. Comptes Rendus Mec. 2011, 339, 552–562. [Google Scholar] [CrossRef]
  48. Kot, M.; Rakowski, W.; Major, Ł.; Lackner, J. Load-bearing capacity of coating–substrate systems obtained from spherical inden-tation tests. Mater. Des. 2013, 46, 751–757. [Google Scholar] [CrossRef]
  49. Bouzakis, K.; Skordaris, G.; Bouzakis, E.; Makrimallakis, S.; Kombogiannis, S.; Lemmer, O. Fatigue strength of diamond coatings’ interface assessed by inclined impact test. Surf. Coat. Technol. 2013, 237, 135–141. [Google Scholar] [CrossRef]
  50. Shtansky, D.; Kiryukhantsev-Korneev, P.; Bashkova, I.; Sheveiko, A.; Levashov, E. Multicomponent nanostructured films for various tribological applications. Int. J. Refract. Met. Hard Mater. 2010, 28, 32–39. [Google Scholar] [CrossRef]
  51. Ma, K.J.; Bloyce, A.; Bell, T. Examination of Mechanical Properties and Failure Mechanisms of TiN and Ti-TiN Multilayer Coatings. Surf. Coat. Technol. 1995, 76, 297–302. [Google Scholar] [CrossRef]
Figure 1. Schematic diagram of the plasma surface alloying technique.
Coatings 12 00123 g001
Figure 2. Sketch of the impact tester.
Coatings 12 00123 g002
Figure 3. A linear model of the elastic modulus, yield stress and strain hardening exponent for the Mo modified TC4.
Coatings 12 00123 g003
Figure 4. Axisymmetric finite element mesh model.
Coatings 12 00123 g004
Figure 5. Element concentration profile of the Mo surface-modified TC4.
Coatings 12 00123 g005
Figure 6. Cross-sectional SEM micrograph of the Mo surface-modified TC4.
Coatings 12 00123 g006
Figure 7. Average load-displacement curves of the Mo deposition layer, the initial part of the Mo diffusion layer and the TC4 substrate.
Coatings 12 00123 g007
Figure 8. True stress-strain curves of (a) the Mo deposition layer and (b) the initial part of the Mo diffusion layer and the TC4 substrate.
Coatings 12 00123 g008
Figure 9. SEM images of Mo surface-modified TC4 after 10,000 impact cycles at (a) 100 N, (b) 300 N and (c) 500 N.
Coatings 12 00123 g009
Figure 10. Material models (a) true stress-strain curves of the Mo diffusion layer with 6 sublayers assumed, (b) finite element mesh with material attributes defined.
Coatings 12 00123 g010
Figure 11. Maximum principal stress distributions in the Mo modified TC4 corresponding to the first 300 N impact.
Coatings 12 00123 g011
Figure 12. Maximum principal stress distributions in the Mo modified TC4 corresponding to the first 500 N impact.
Coatings 12 00123 g012
Table 1. Composition (wt %) of TC4.
AlVOFeSiNHCTi
6.74.210.140.100.070.0150.0030.03Balance
Table 2. Detailed processing parameters of Mo-surface-modified TC4.
Processing ParametersValues/Range of Values
Pressure of the discharge gas (Ar)35 Pa
Bias voltage of the target−600~−1000 V
Bias voltage of the workpiece−400~−600 V
Distance between target and workpiece15 mm
Temperature900 °C
Time3 h
Table 3. Typical impact testing parameters.
ParametersRange of Values
Indenter ball radius2~5 mm
Impact force0~1200 N
Number of impacts1~107
Impact speed0.02~10 m/s
Impact frequency10~200 Hz
Distance between the ball and the sample0~2 mm
Table 4. Elasto-plastic parameters extracted from load-displacement curves of I, II and III.
Mo-Modified TC4H (GPa)E (GPa)σy (GPa)n Δ p   ( % ) H3/E2
Test area I13.18240.502.900.2366.710.0396
Test area II15.06256.213.880.3164.200.0520
Test area III3.60113.000.840.1575.950.0037
Publisher’s Note: MDPI stays neutral with regard to jurisdictional claims in published maps and institutional affiliations.

