
Evolution in Wear and High-Temperature Oxidation Resistance of Laser-Clad AlxMoNbTa Refractory High-Entropy Alloys Coatings with Al Addition Content


Abstract
:1. Introduction
2. Materials and Methods
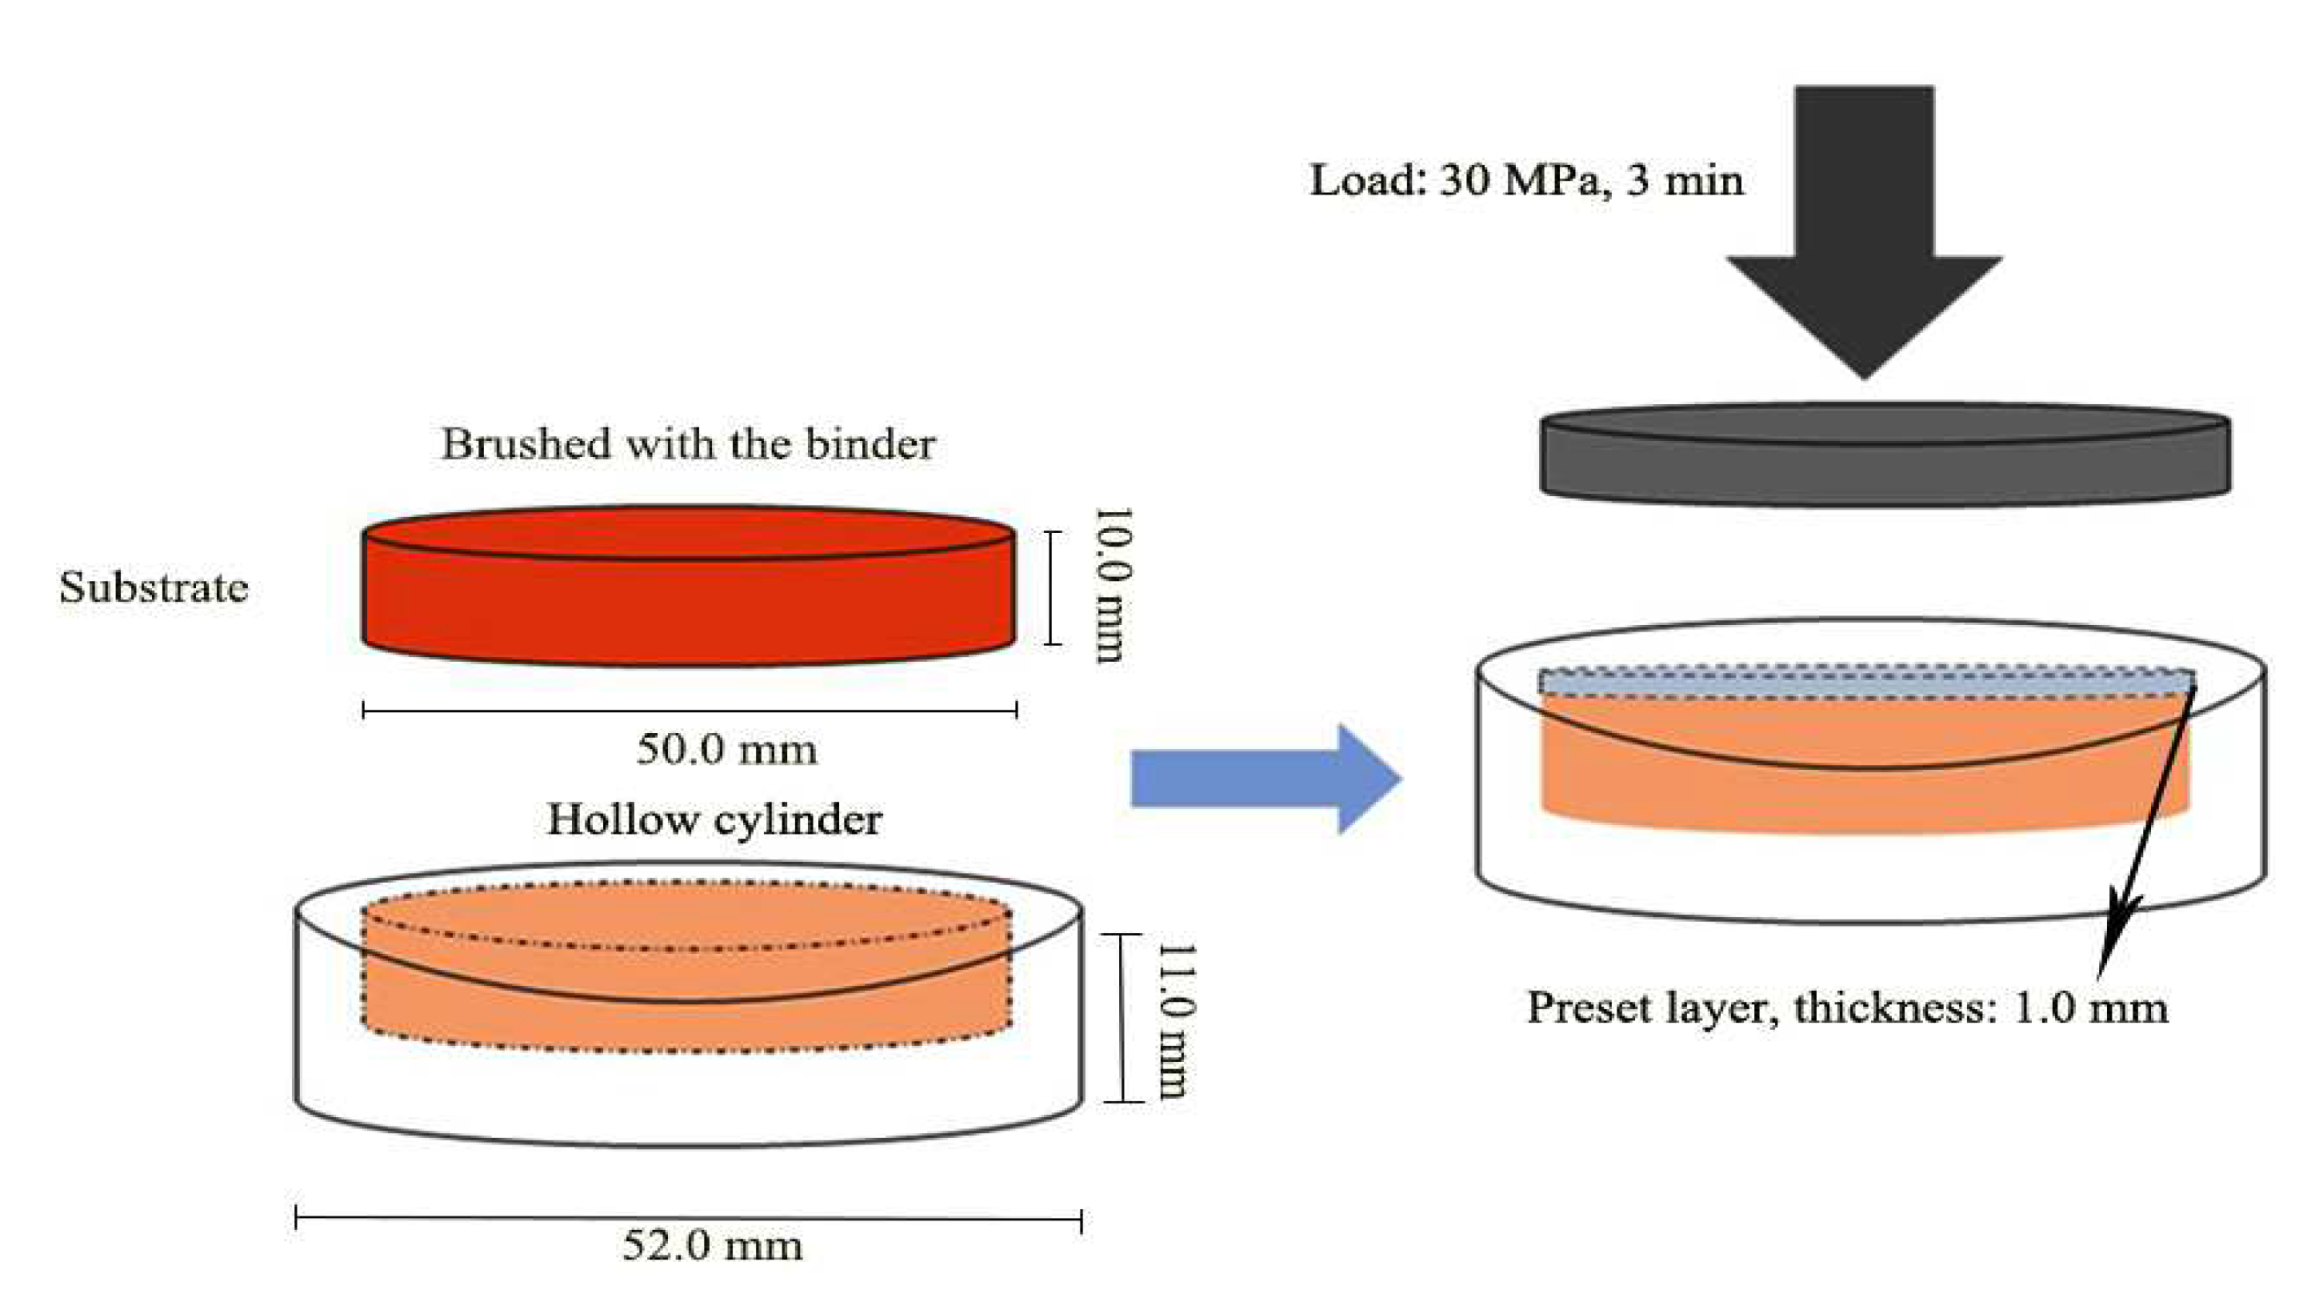
2.1. Fabrication of Laser-Clad Coatings
2.2. Microstructural Characterization
2.3. Mechanical Properties Testing
2.4. High-Temperature Oxidation Tests
3. Results
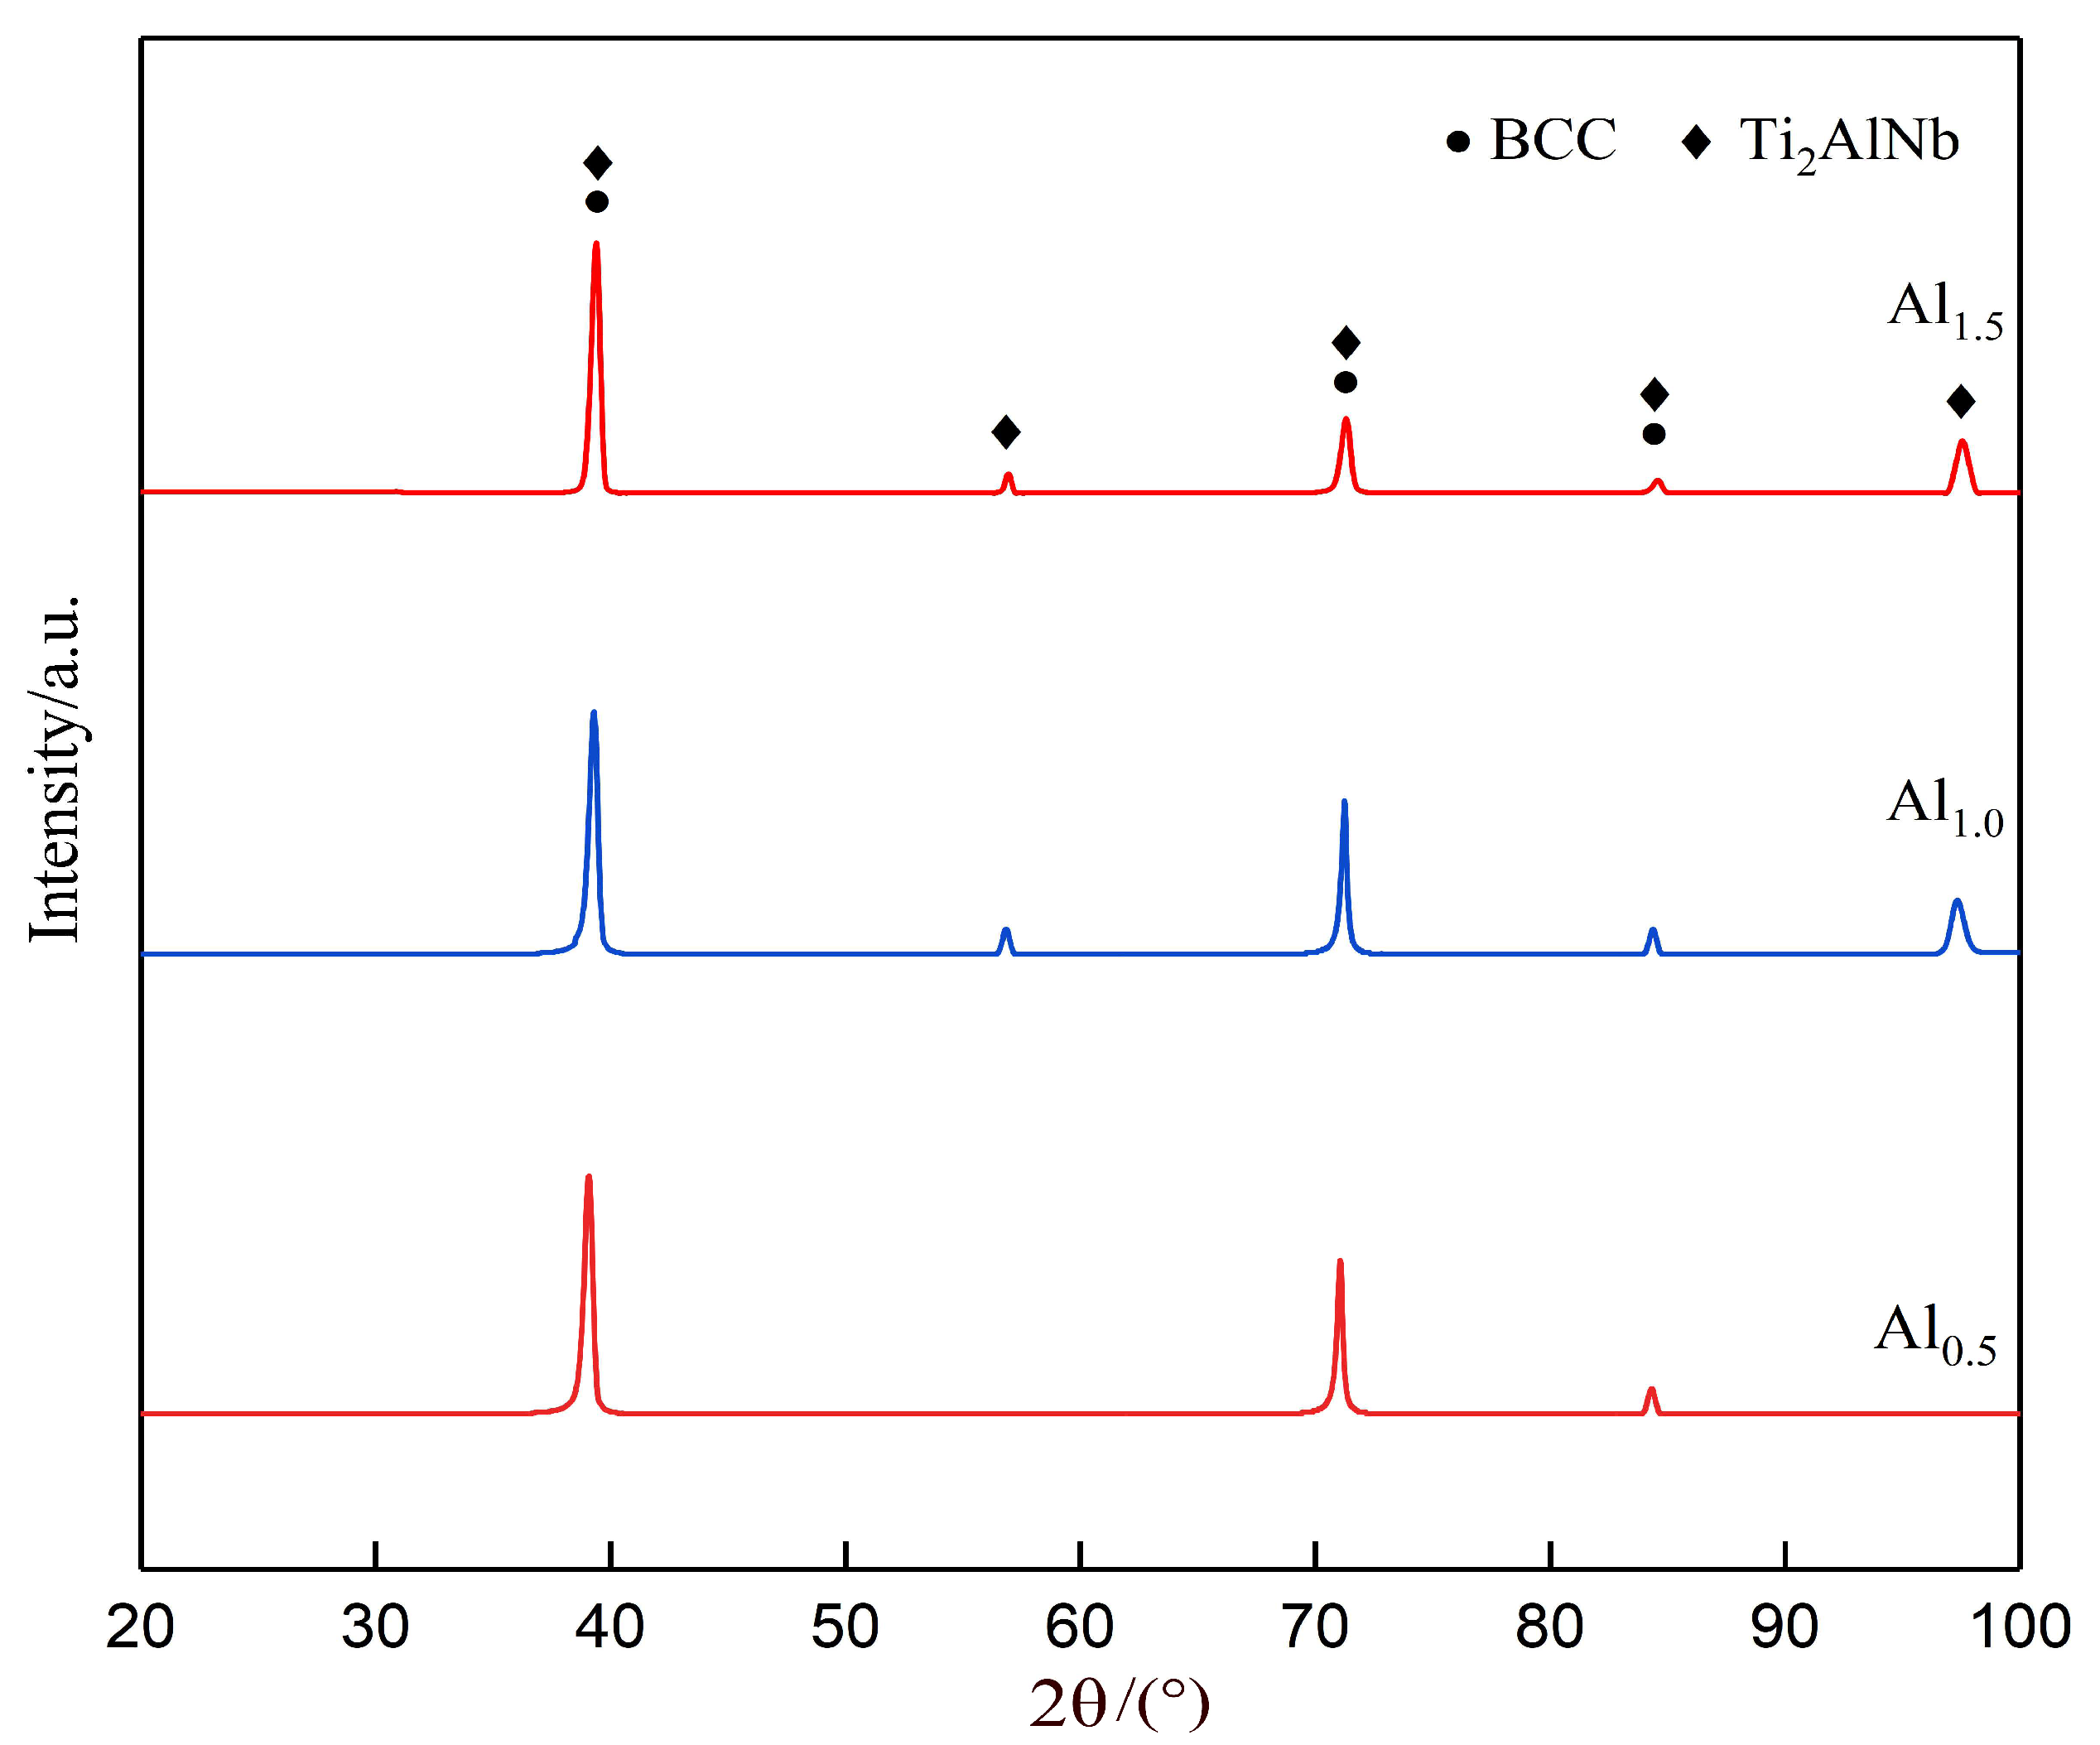
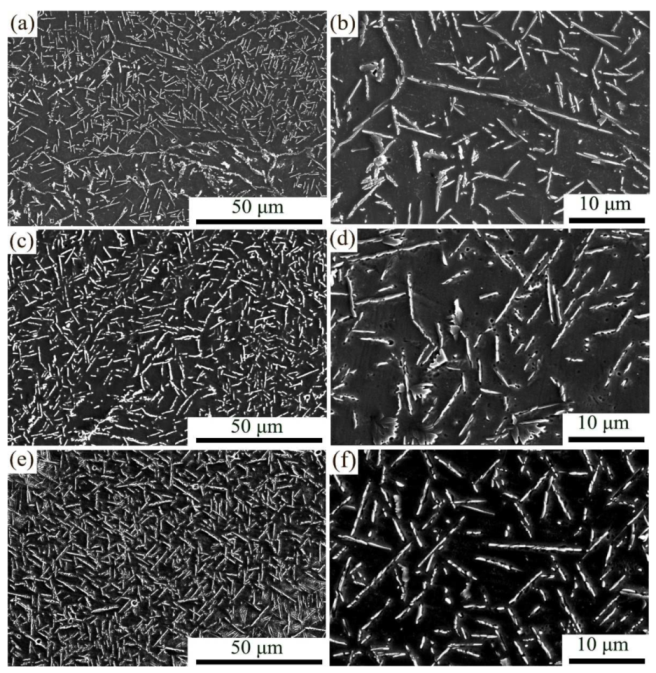
3.1. Microstructural Characteristics
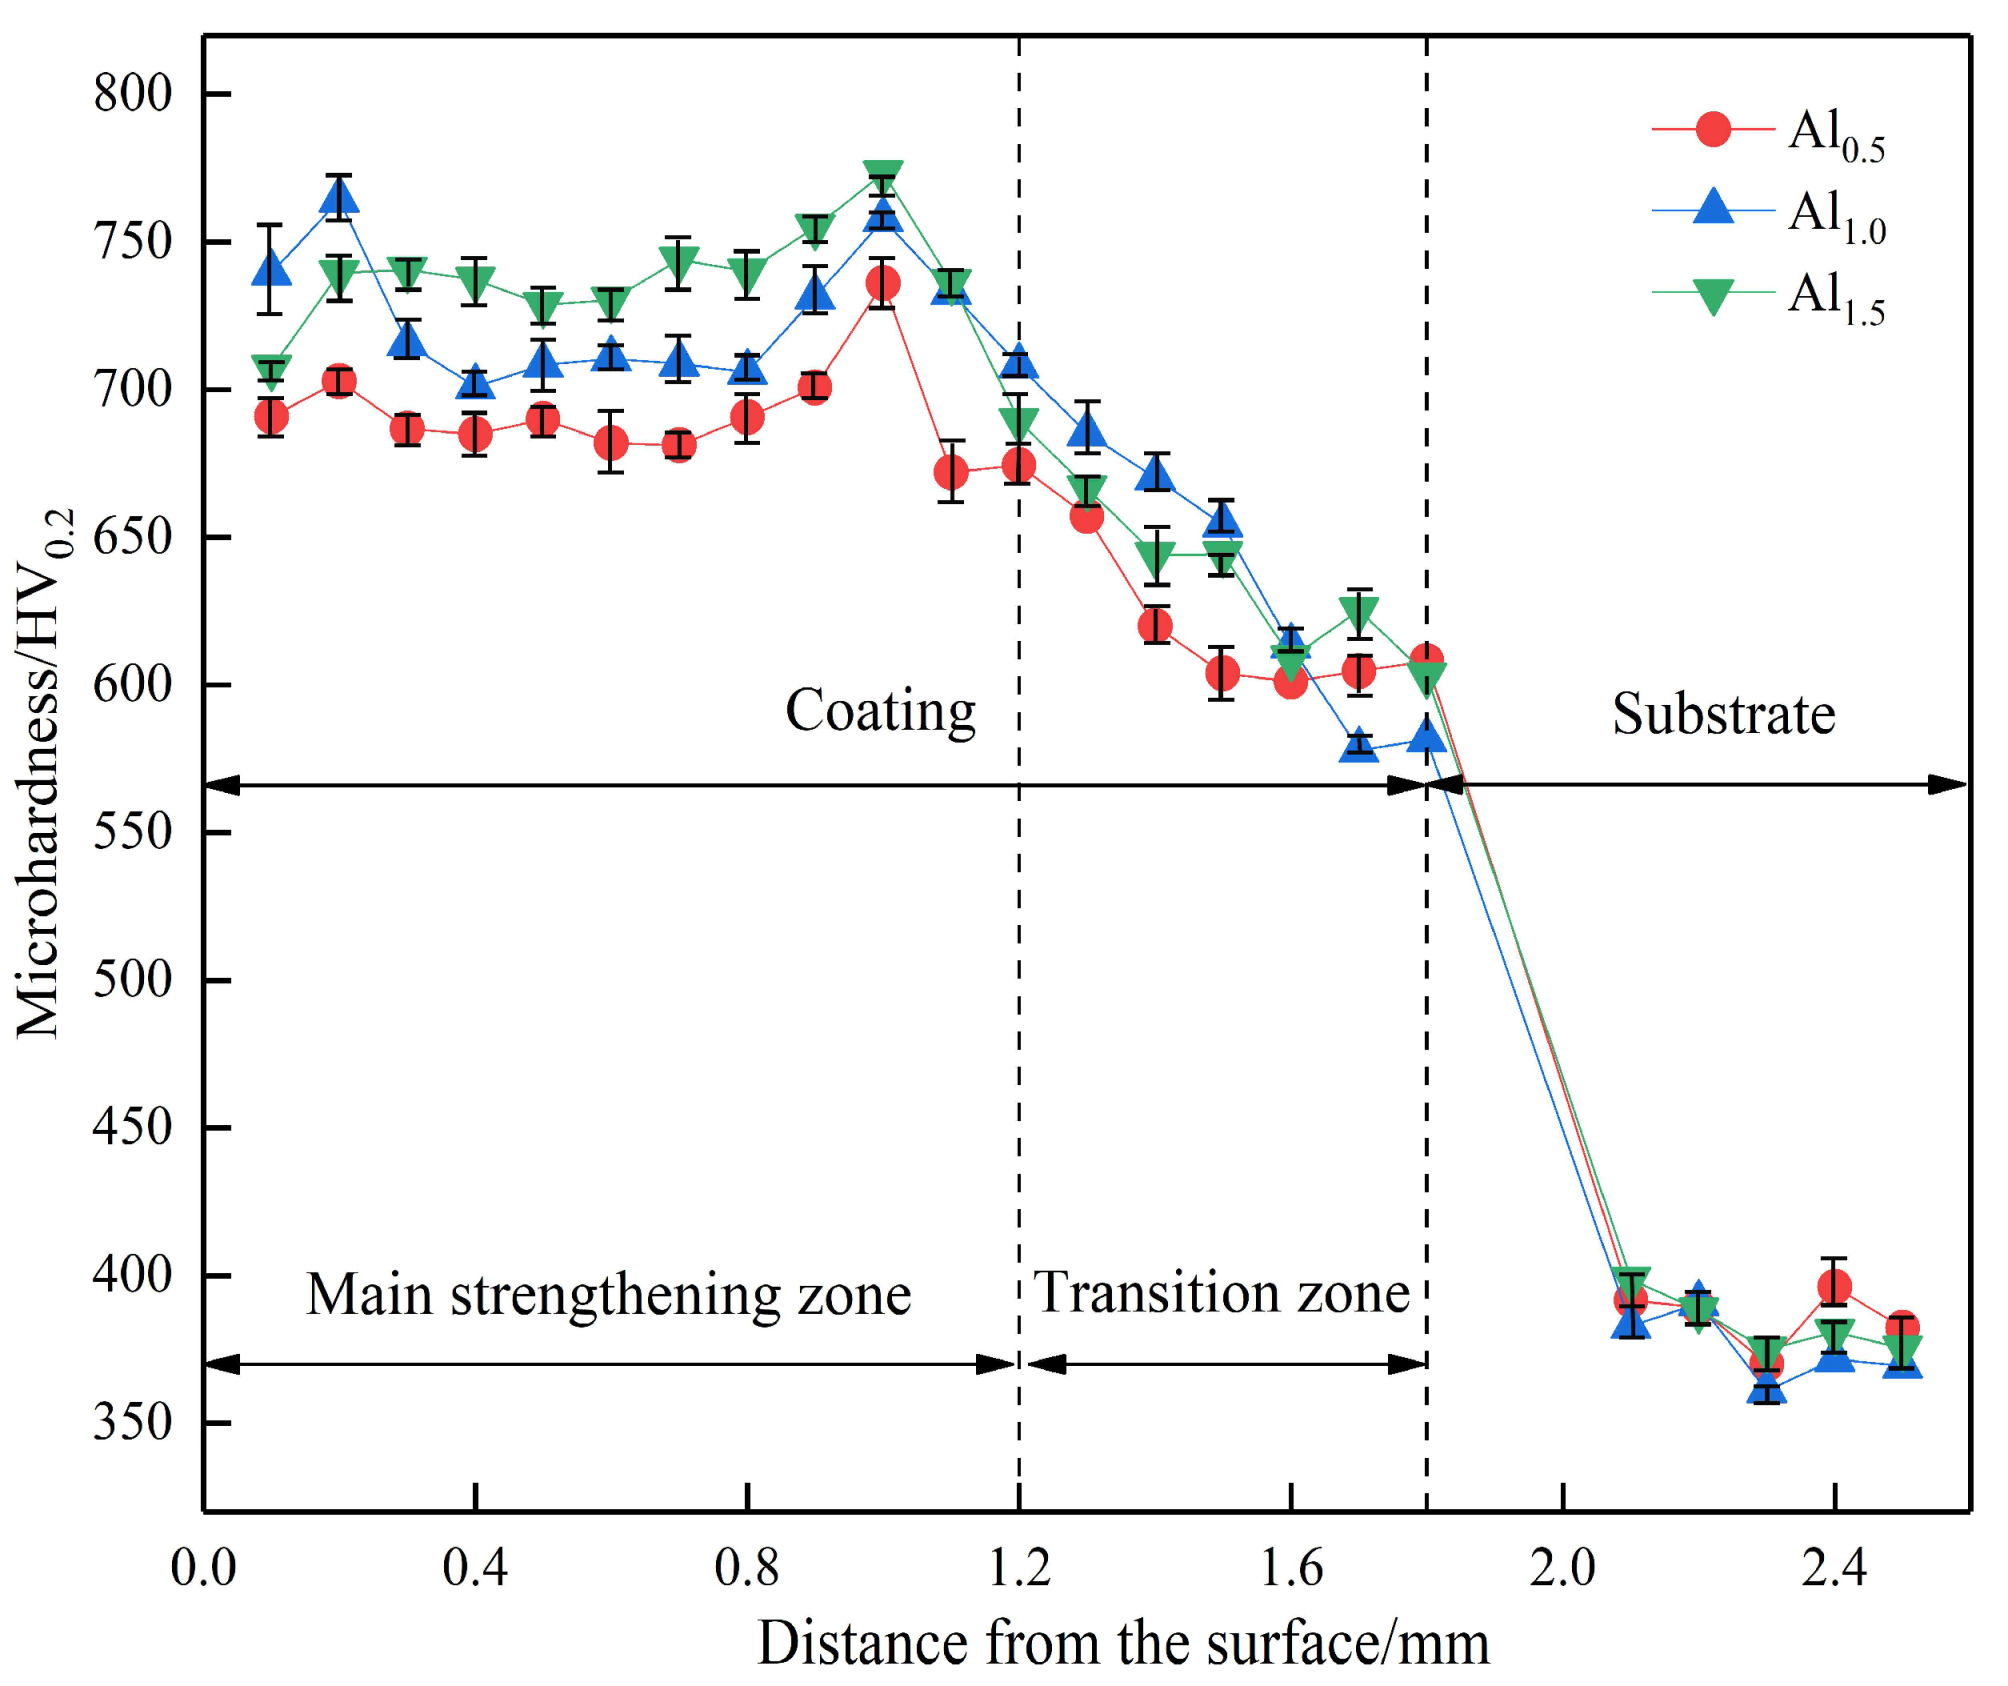
3.2. Mechanical Properties
3.3. Oxidation Behaviors
4. Conclusions
Author Contributions
Funding
Institutional Review Board Statement
Informed Consent Statement
Data Availability Statement
Conflicts of Interest
References
- Liu, Y.N.; Yang, L.J.; Yang, X.J.; Zhang, T.G.; Sun, R.L. Optimization of microstructure and properties of composite coatings by laser cladding on titanium alloy. Ceram. Int. 2021, 47, 2230–2243. [Google Scholar] [CrossRef]
- Gurrappa, I. Characterization of titanium alloy Ti6Al4V for chemical, marine and industrial applications. Mater. Charact. 2003, 51, 131–139. [Google Scholar] [CrossRef]
- Zhou, H.Y.; Shi, X.L.; Lu, G.C.; Chen, Y.; Yang, Z.Y.; Wu, C.H.; Xue, Y.W.; Ibrahim, A.M.M. Friction and wear behaviors of Ti6Al4V alloy with surface microporous channels filled by Sn-Ag-Cu and Al2O3 nanoparticles. Surf. Coat. Technol. 2020, 387. [Google Scholar] [CrossRef]
- Liang, J.; Liu, X.B.; Ke, J.; Luo, Y.S.; Liang, L. Preparation and high temperature oxidation resistance of laser deposited Ti5Si3/MoSi2/Mo5Si3 reinforced α-Ti/NiTi composite coatings. Surf. Coat. Technol. 2019, 372, 56–64. [Google Scholar] [CrossRef]
- Cui, Y.H.; Hu, Z.C.; Ma, Y.D.; Yang, Y.; Zhao, C.C.; Ran, Y.T.; Gao, P.Y.; Wang, L.; Dong, Y.C.; Yan, D.R. Porous nanostructured ZrO2 coatings prepared by plasma spraying. Surf. Coat. Technol. 2019, 363, 112–119. [Google Scholar] [CrossRef]
- Li, X.F.; Wei, Z.S.; Zuo, D.W.; Wang, M. Corrosion Resistance of TC4 Alloy Implanted by La+, Mo+. Key Eng. Mater. 2006, 315, 61–65. [Google Scholar] [CrossRef]
- Zhang, W.G.; Liu, W.M.; Liu, Y.; Wang, C.T. Tribological behaviors of single and dual sol–gel ceramic films on Ti6Al4V. Ceram. Int. 2009, 35, 1513–1520. [Google Scholar] [CrossRef]
- Xie, R.Z.; Lin, N.M.; Zhou, P.; Zou, J.J.; Han, P.J.; Wang, Z.H.; Tang, B. Surface damage mitigation of TC4 alloy via micro arc oxidation for oil and gas exploitation application: Characterizations of microstructure and evaluations on surface performance. Appl. Surf. Sci. 2018, 436, 467–476. [Google Scholar] [CrossRef]
- Das, A.; Shukla, M. New generation hopeite coating on Ti6Al4V (TC4) by radio frequency magnetron sputtering for prosthetic-orthopaedic implant applications: Synthesis and characterisation. Trans. IMF 2020, 98, 88–96. [Google Scholar] [CrossRef]
- Zhang, Q.; Liang, Z.L.; Cao, M.; Liu, Z.F.; Zhang, A.F.; Lu, B.H. Microstructure and mechanical properties of Ti6Al4V alloy prepared by selective laser melting combined with precision forging. Trans. Nonferrous Met. Soc. China 2017, 27, 1036–1042. [Google Scholar] [CrossRef]
- Yue, T.M.; Xie, H.; Lin, X.; Yang, H.O.; Meng, G.H. Solidification behavior in laser cladding of AlCoCrCuFeNi high-entropy alloy on magnesium substrates. J. Alloys Compd. 2014, 587, 588–593. [Google Scholar] [CrossRef]
- Leyens, C.; Beyer, E. 8-Innovations in laser cladding and direct laser metal deposition. Surf. Eng. 2015, 181–192. [Google Scholar] [CrossRef]
- Song, J.L.; Li, Y.T.; Deng, Q.L.; Hu, D.J. Research Progress of Laser Cladding Forming Technology. J. Mech. Eng. 2010, 46, 29–39. [Google Scholar] [CrossRef]
- Sun, R.L.; Lei, Y.W.; Niu, W. Laser clad TiC reinforced NiCrBSi composite coatings on Ti6Al4V alloy using a CW CO2 laser. Surf. Coat. Technol. 2009, 203, 1395–1399. [Google Scholar] [CrossRef]
- Li, N.; Xiong, Y.; Xiong, H.P.; Shi, G.Q.; Blackburn, J.; Liu, W.; Qin, R.Y. Microstructure, formation mechanism and property characterization of Ti+SiC laser cladded coatings on Ti6Al4V alloy. Mater. Charact. 2018, 148, 43–51. [Google Scholar] [CrossRef]
- Lv, Y.H.; Li, J.; Tao, Y.F.; Hu, L.F. High-temperature wear and oxidation behaviors of TiNi/Ti2Ni matrix composite coatings with TaC addition prepared on Ti6Al4V by laser cladding. Appl. Surf. Sci. 2017, 402, 478–494. [Google Scholar] [CrossRef]
- Zhang, T.G.; Zhuang, H.F.; Zhang, Q.; Yao, B.; Yang, F. Influence of Y2O3 on the microstructure and tribological properties of Ti-based wear-resistant laser-clad layers on TC4 alloy. Ceram. Int. 2020, 46, 13711–13723. [Google Scholar] [CrossRef]
- Zhuang, Q.Q.; Zhang, P.L.; Li, M.C.; Yan, H.; Yu, Z.S.; Lu, Q.H. Microstructure, Wear Resistance and Oxidation Behavior of Ni-Ti-Si Coatings Fabricated on Ti6Al4V by Laser Cladding. Materials 2017, 10, 1248. [Google Scholar] [CrossRef] [Green Version]
- Yeh, J.W.; Chen, S.K.; Lin, S.J.; Gan, J.Y.; Chin, T.S.; Shun, T.T.; Tsau, C.H.; Chang, S.Y. Nanostructured high-entropy alloys with multiple principal elements: Novel alloy design concepts and outcomes. Adv. Eng. Mater. 2004, 6, 299–303. [Google Scholar] [CrossRef]
- Chen, G.; Li, L.T.; Qiao, J.W.; Jiao, Z.M.; Ma, S.G.; Ng, F.L.; Zhu, Z.G.; Zhao, D.; Wang, Z.H. Gradient hierarchical grain structures of Al0.1CoCrFeNi high-entropy alloys through dynamic torsion. Mater. Lett. 2019, 238, 163–166. [Google Scholar] [CrossRef]
- Hua, N.B.; Wang, W.J.; Wang, Q.T.; Ye, Y.X.; Lin, S.H.; Zhang, L.; Guo, Q.H.; Brechtl, J.; Liaw, P.K. Mechanical, corrosion, and wear properties of biomedical Ti–Zr–Nb–Ta–Mo high entropy alloys. J. Alloys Compd. 2021, 861, 157997. [Google Scholar] [CrossRef]
- Wang, Y.K.; Xie, Z.M.; Wang, M.M.; Deng, H.W.; Yang, J.F.; Jiang, Y.; Zhang, T.; Wang, X.P.; Fang, Q.F.; Liu, C.S. The superior thermal stability and tensile properties of hot rolled W-HfC alloys. Int. J. Refract. Hard Met. 2019, 81, 42–48. [Google Scholar] [CrossRef]
- Nong, Z.S.; Lei, Y.N.; Zhu, J.C. Wear and oxidation resistances of AlCrFeNiTi-based high entropy alloys. Intermetallics 2018, 101, 144–151. [Google Scholar] [CrossRef]
- Ding, Z.Y.; Cao, B.X.; Luan, J.H.; Jiao, Z.B. Synergistic effects of Al and Ti on the oxidation behaviour and mechanical properties of L12-strengthened FeCoCrNi high-entropy alloys. Corros. Sci. 2021, 184, 109365. [Google Scholar] [CrossRef]
- Kong, D.; Guo, J.; Liu, R.W.; Zhang, X.H.; Song, Y.P.; Li, Z.X.; Guo, F.J.; Xing, X.F.; Xu, Y.; Wang, W. Effect of remelting and annealing on the wear resistance of AlCoCrFeNiTi0.5 high entropy alloys. Intermetallics 2019, 114, 106560. [Google Scholar] [CrossRef]
- Shi, Y.Z.; Yang, B.; Liaw, P. Corrosion-Resistant High-Entropy Alloys: A Review. Metals 2017, 7, 43. [Google Scholar] [CrossRef] [Green Version]
- Chen, M.; Shi, X.H.; Yang, H.J.; Liaw, P.K.; Gao, M.C.; Hawk, J.A.; Qiao, J.W. Wear behavior of Al0.6CoCrFeNi high-entropy alloys: Effect of environments. J. Mater. Res. 2018, 33, 3310–3320. [Google Scholar] [CrossRef]
- Li, Y.Z.; Shi, Y. Microhardness, wear resistance, and corrosion resistance of AlxCrFeCoNiCu high-entropy alloy coatings on aluminum by laser cladding. Opt. Laser Technol. 2021, 134, 106632. [Google Scholar] [CrossRef]
- Chang, F.; Cai, B.J.; Zhang, C.; Huang, B.; Li, S.; Dai, P.Q. Thermal stability and oxidation resistance of FeCrxCoNiB high-entropy alloys coatings by laser cladding. Surf. Coat. Technol. 2019, 359, 132–140. [Google Scholar] [CrossRef]
- Zhang, G.Z.; Liu, H.; Tian, X.H.; Chen, P.J.; Yang, H.F.; Hao, J.B. Microstructure and Properties of AlCoCrFeNiSi High-Entropy Alloy Coating on AISI 304 Stainless Steel by Laser Cladding. J. Mater. Eng. Perform. 2020, 29, 278–288. [Google Scholar] [CrossRef]
- Senkov, O.N.; Wilks, G.B.; Miracle, D.B.; Chuang, C.P.; Liaw, P.K. Refractory high-entropy alloys. Intermetallics 2010, 18, 1758–1765. [Google Scholar] [CrossRef]
- Juan, C.C.; Tsai, M.H.; Tsai, C.W.; Lin, C.M.; Wang, W.R.; Yang, C.C.; Chen, S.K.; Lin, S.J.; Yeh, J.W. Enhanced mechanical properties of HfMoTaTiZr and HfMoNbTaTiZr refractory high-entropy alloys. Intermetallics 2015, 62, 76–83. [Google Scholar] [CrossRef]
- Senkov, O.N.; Wilks, G.B.; Scott, J.M.; Miracle, D.B. Mechanical properties of Nb25Mo25Ta25W25 and V20Nb20Mo20Ta20W20 refractory high entropy alloys. Intermetallics 2011, 19, 698–706. [Google Scholar] [CrossRef]
- Chang, C.H.; Titus, M.S.; Yeh, J.W. Oxidation Behavior between 700 and 1300 °C of Refractory TiZrNbHfTa High-Entropy Alloys Containing Aluminum. Adv. Eng. Mater. 2018, 20, 1700948. [Google Scholar] [CrossRef]
- Liu, C.M.; Wang, H.M.; Zhang, S.Q.; Tang, H.B.; Zhang, A.L. Microstructure and oxidation behavior of new refractory high entropy alloys. J. Alloys Compd. 2014, 583, 162–169. [Google Scholar] [CrossRef]
- Gorr, B.; Azim, M.; Christ, H.J.; Mueller, T.; Schliephake, D.; Heilmaier, M. Phase equilibria, microstructure, and high temperature oxidation resistance of novel refractory high-entropy alloys. J. Alloys Compd. 2015, 624, 270–278. [Google Scholar] [CrossRef]
- Cao, Y.K.; Liu, Y.; Liu, B.; Zhang, W.D.; Wang, J.W.; Meng, D.U. Effects of Al and Mo on high temperature oxidation behavior of refractory high entropy alloys. Trans. Nonferrous Metal. Soc. 2019, 29, 1476–1483. [Google Scholar] [CrossRef]
- Jayaraj, J.; Thirathipviwat, P.; Han, J.; Gebert, A. Microstructure, mechanical and thermal oxidation behavior of AlNbTiZr high entropy alloy. Intermetallics 2018, 100, 9–19. [Google Scholar] [CrossRef]
- Chen, L.; Wang, Y.Y.; Hao, X.H.; Zhang, X.W.; Liu, H.X. Light-weight refractory high entropy alloy coating by laser cladding on Ti–6Al–4V surface. Vacuum 2021, 183, 109823. [Google Scholar] [CrossRef]
- Hamed, N.Z.; Ali-Reza, K.R.; Jalil, V.K. Design of a low density refractory high entropy alloy in non-equiatomic W–Mo–Cr–Ti–Al system. Vacuum 2020, 181, 109614. [Google Scholar] [CrossRef]
- Han, Z.D.; Luan, H.W.; Liu, X.; Chen, N.; Li, X.Y.; Shao, Y.; Yao, K.F. Microstructures and mechanical properties of TixNbMoTaW refractory high-entropy alloys. Mater. Sci. Eng. A. 2018, 712, 380–385. [Google Scholar] [CrossRef]
- Bhardwaj, V.; Zhou, Q.; Zhang, F.; Han, W.C.; Du, Y.; Hua, K.; Wang, H.F. Effect of Al addition on the microstructure, mechanical and wear properties of TiZrNbHf refractory high entropy alloys. Tribol. Int. 2021, 160, 107031. [Google Scholar] [CrossRef]
- Senkov, O.N.; Senkova, S.V.; Woodward, C. Effect of aluminum on the microstructure and properties of two refractory high-entropy alloys. Acta. Mater. 2014, 68, 214–228. [Google Scholar] [CrossRef]
- Yang, X.; Zhang, Y.; Liaw, P.K. Microstructure and Compressive Properties of NbTiVTaAlx High Entropy Alloys. Procedia Eng. 2012, 36, 292–298. [Google Scholar] [CrossRef] [Green Version]
- Stepanov, N.D.; Shaysultanov, D.G.; Salishchev, G.A.; Tikhonovsky, M.A. Structure and mechanical properties of a light-weight AlNbTiV high entropy alloy. Mater. Lett. 2015, 142, 153–155. [Google Scholar] [CrossRef]
- Zheng, Z.P.; Jin, X.; Bai, Y.C.; Yang, Y.; Ni, C.B.; Lu, W.F.; Wang, H. Microstructure and anisotropic mechanical properties of selective laser melted Ti6Al4V alloy under different scanning strategies. Mater. Sci. Eng. A. 2022, 831, 142236. [Google Scholar] [CrossRef]
- Kurz, W.; Bezencon, C.; Gaümann, M. Columnar to equiaxed transition in solidification processing. Sci. Technol. Adv. Mater. 2001, 2, 185. [Google Scholar] [CrossRef]
- Zhang, Y.L.; Li, J.; Zhang, Y.Y.; Kang, D.N. Evolution in microstructure and high-temperature oxidation behaviors of the laser-cladding coatings with the Si addition contents. J. Alloys Compd. 2020, 827, 154131. [Google Scholar] [CrossRef]
- Guo, S.; Hu, Q.; Ng, C.; Liu, C.T. More than entropy in high-entropy alloys: Forming solid solutions or amorphous phase. Intermetallics 2013, 41, 96–103. [Google Scholar] [CrossRef]
- Cai, Z.B.; Pang, X.J.; Cui, X.F.; Wen, X.; Liu, Z.; Dong, M.L.; Li, Y.; Jin, G. In Situ Laser Synthesis of High Entropy Alloy Coating on Ti-6Al-4V Alloy: Characterization of Microstructure and Properties. Mater. Sci. Forum. 2017, 898, 643–650. [Google Scholar] [CrossRef]
- Ye, X.Y.; Ma, M.X.; Cao, Y.X.L.; Liu, W.J.; Ye, X.H.; Gu, Y. The Property Research on High-entropy Alloy AlxFeCoNiCuCr Coating by Laser Cladding. Phys. Procedia 2011, 12, 303–312. [Google Scholar] [CrossRef] [Green Version]
- Jiang, P.F.; Zhang, C.H.; Zhang, S.; Zhang, J.B.; Chen, J.; Liu, Y. Fabrication and wear behavior of TiC reinforced FeCoCrAlCu-based high entropy alloy coatings by laser surface alloying. Mat. Chem. Phys. 2020, 255, 123571. [Google Scholar] [CrossRef]
- Cheng, J.B.; Liu, D.; Liang, X.B.; Chen, Y.X. Evolution of microstructure and mechanical properties of in situ synthesized TiC–TiB2/CoCrCuFeNi high entropy alloy coatings. Surf. Coat. Technol. 2015, 281, 109–116. [Google Scholar] [CrossRef]
- Li, X.F.; Feng, Y.H.; Liu, B.; Yi, D.H.; Yang, X.H.; Zhang, W.D.; Chen, G.; Liu, Y.; Bai, P.K. Influence of NbC particles on microstructure and mechanical properties of AlCoCrFeNi high-entropy alloy coatings prepared by laser cladding. J. Alloys Compd. 2019, 788, 485–494. [Google Scholar] [CrossRef]
- Guo, Y.J.; Li, C.J.; Zeng, M.; Wang, J.Q.; Deng, P.; Wang, Y. In-situ TiC reinforced CoCrCuFeNiSi0.2 high-entropy alloy coatings designed for enhanced wear performance by laser cladding. Mat. Chem. Phys. 2020, 242, 122522. [Google Scholar] [CrossRef]
- Guo, Y.X.; Shang, X.J.; Liu, Q.B. Microstructure and properties of in-situ TiN reinforced laser cladding CoCr2FeNiTi high-entropy alloy composite coatings. Surf. Coat. Technol. 2018, 344, 353–358. [Google Scholar] [CrossRef]
- Park, B.J.; Chang, H.J.; Kim, D.H.; Kim, W.T. In situ formation of two amorphous phases by liquid phase separation in Y-Ti-Al-Co alloy. Appl. Phys. Lett. 2004, 85, 6353–6355. [Google Scholar] [CrossRef]
- Guo, S.; Ng, C.; Lu, J.; Liu, C.T. Effect of valence electron concentration on stability of fcc or bcc phase in high entropy alloys, J. Appl. Phys. 2011, 109, 103505. [Google Scholar] [CrossRef] [Green Version]
- Gao, M.C.; Yeh, J.W.; Liaw, P.K.; Zhang, Y. High-Entropy Alloys: Fundamentals and Applications; Springer International Publishing: Cham, Switzerland, 2016. [Google Scholar] [CrossRef]
- Zhao, P.; Li, J.; Zhang, Y.; Li, X.; Xia, M.M.; Yuan, B.G. Wear and high-temperature oxidation resistances of AlNbTaZrx high-entropy alloys coatings fabricated on Ti6Al4V by laser cladding. J. Alloys Compd. 2021, 862, 158405. [Google Scholar] [CrossRef]
- Jamilpanah, L.; Khademi, I.; Gharehbagh, J.S.; Mohseni, S.A.; Mohseni, S.M. Promising memristive behavior in MoS2-MoO2-MoO3 scalable composite thin films. J. Alloys Compd. 2020, 835, 155291. [Google Scholar] [CrossRef]
- Xu, C.; Gao, W. Pilling-Bedworth ratio for oxidation of alloys. Mat. Res. Innovat. 2000, 3, 231–235. [Google Scholar] [CrossRef]


| ΔHmix | Al | Mo | Nb | Ta | Ti |
|---|---|---|---|---|---|
| Al | - | - | - | - | - |
| Mo | −5 | - | - | - | - |
| Nb | −18 | −6 | - | - | - |
| Ta | −19 | −5 | 0 | - | - |
| Ti | −30 | −4 | 2 | 1 | - |
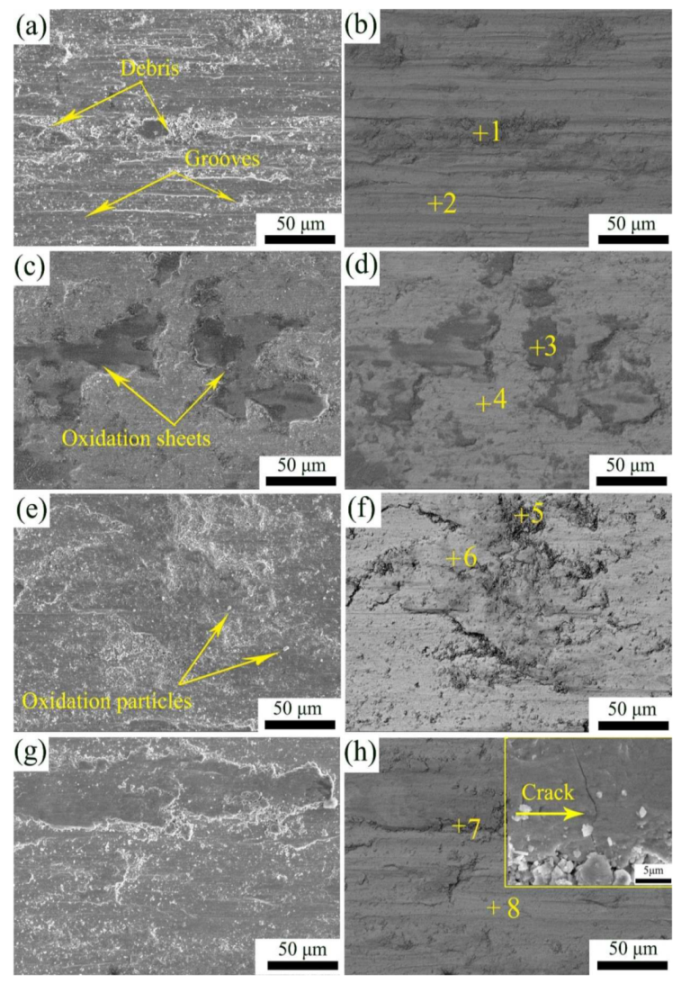
| Samples | Zones | Chemical Compositions (at.%) | ||||||
|---|---|---|---|---|---|---|---|---|
| O | Al | Nb | Mo | Ti | Ta | V | ||
| Substrate | 1 | 48.79 | 06.08 | - | - | 43.21 | - | 01.92 |
| 2 | 15.93 | 09.55 | - | - | 71.90 | - | 02.62 | |
| Al0.5 | 3 | 35.99 | 4.4 | 5.85 | 6.04 | 38.87 | 8.85 | - |
| 4 | 21.92 | 5.29 | 7.99 | 7.5 | 46.85 | 10.44 | - | |
| Al1.0 | 5 | 44.28 | 6.19 | 3.52 | 3.47 | 37.1 | 5.44 | - |
| 6 | 38.35 | 7.68 | 3.95 | 4.14 | 40.57 | 5.31 | - | |
| Al1.5 | 7 | 34.96 | 10.94 | 3.2 | 3.23 | 41.85 | 5.81 | - |
| 8 | 18.44 | 9.77 | 5.57 | 5.39 | 52.52 | 8.31 | - | |
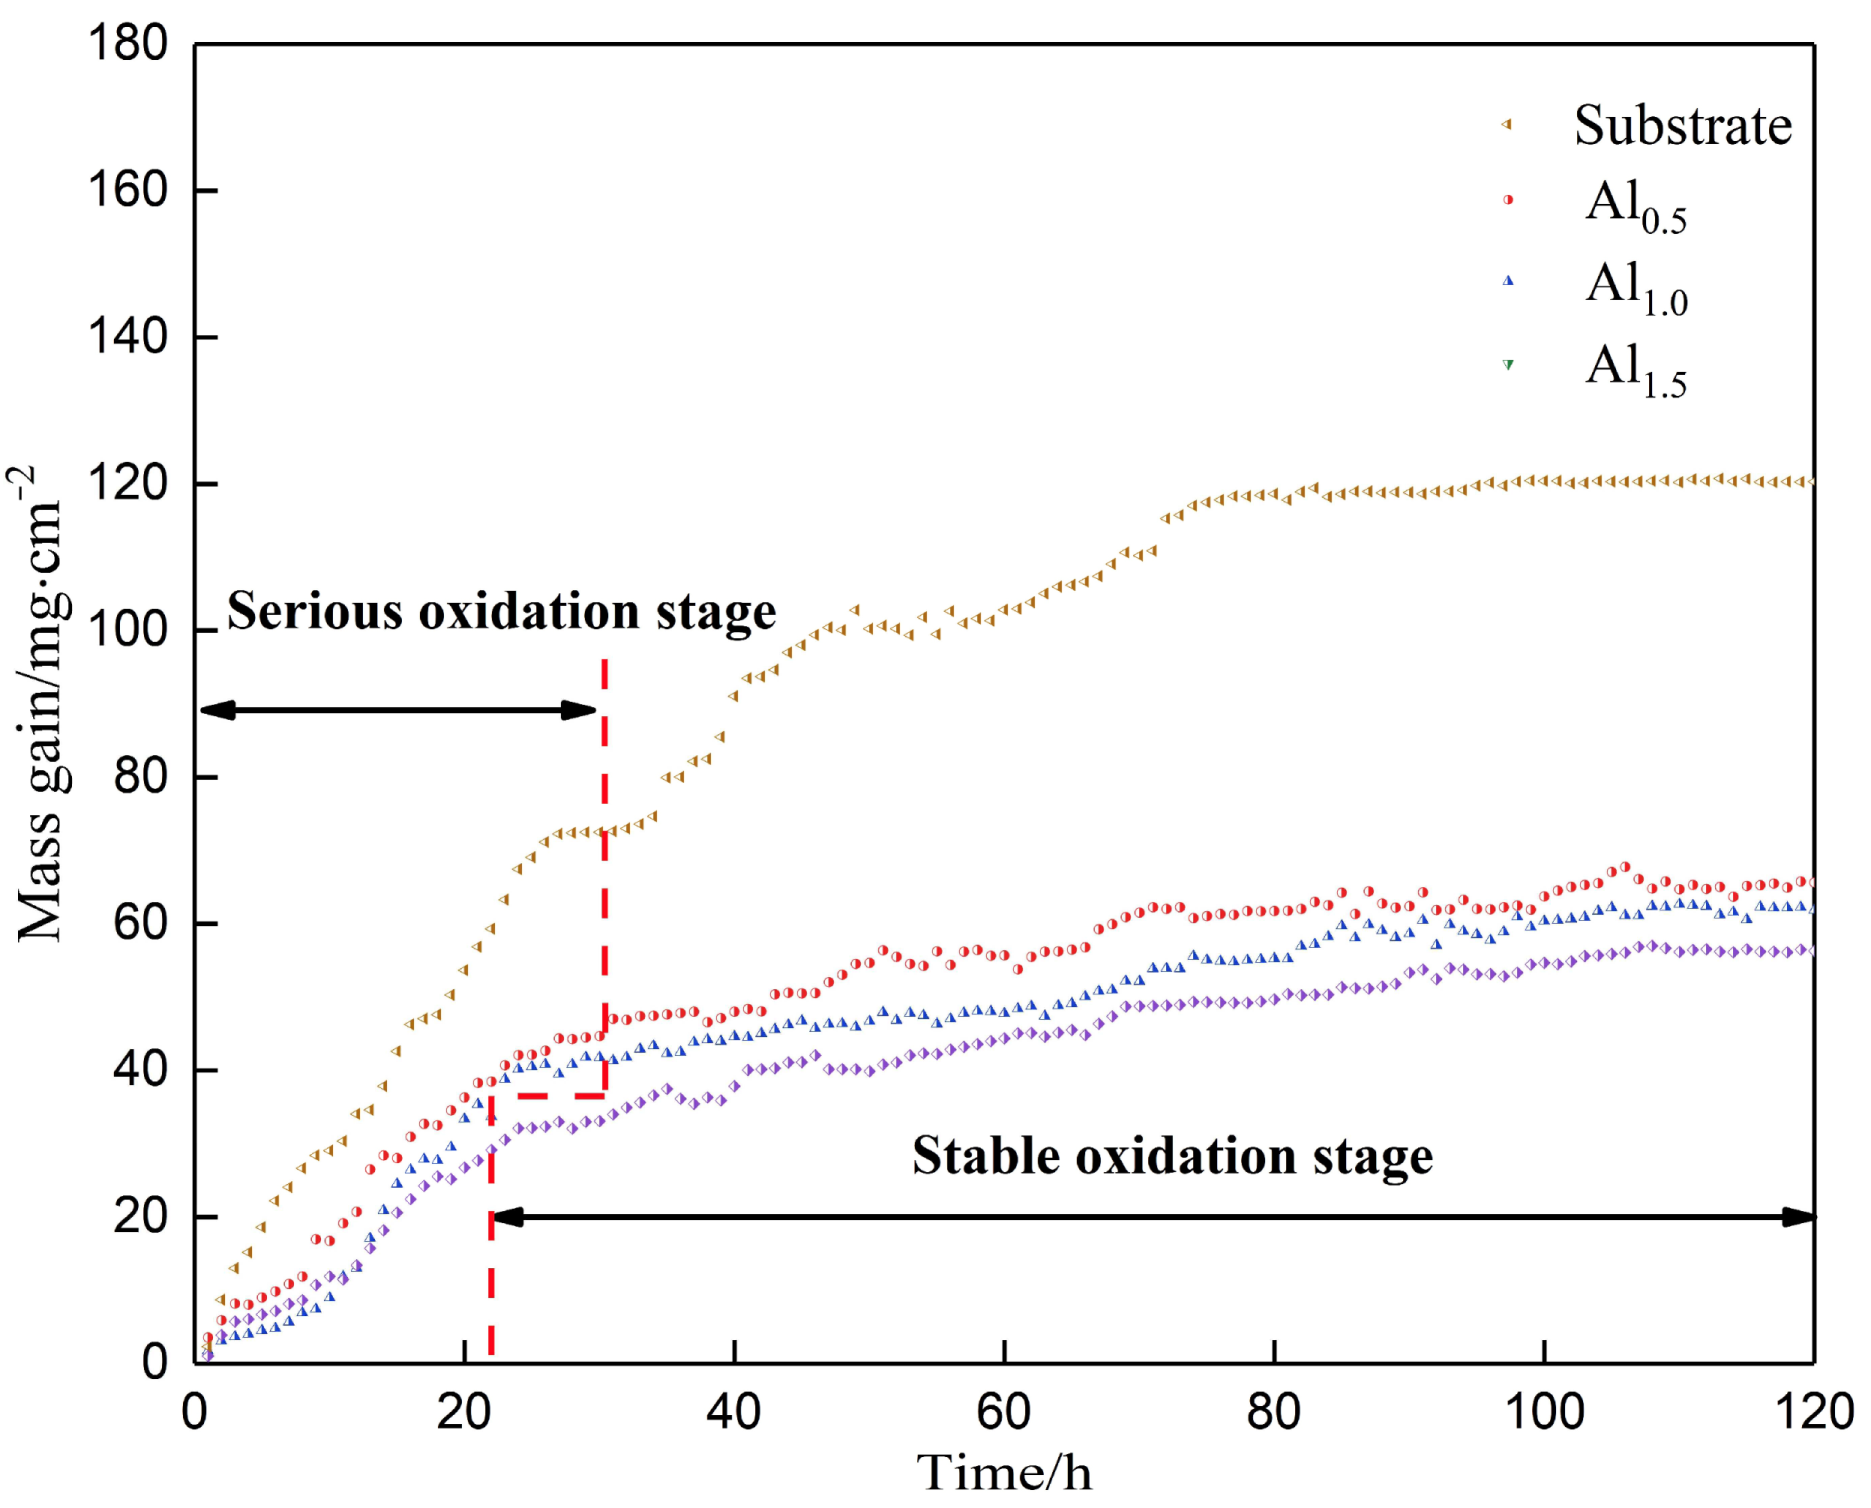
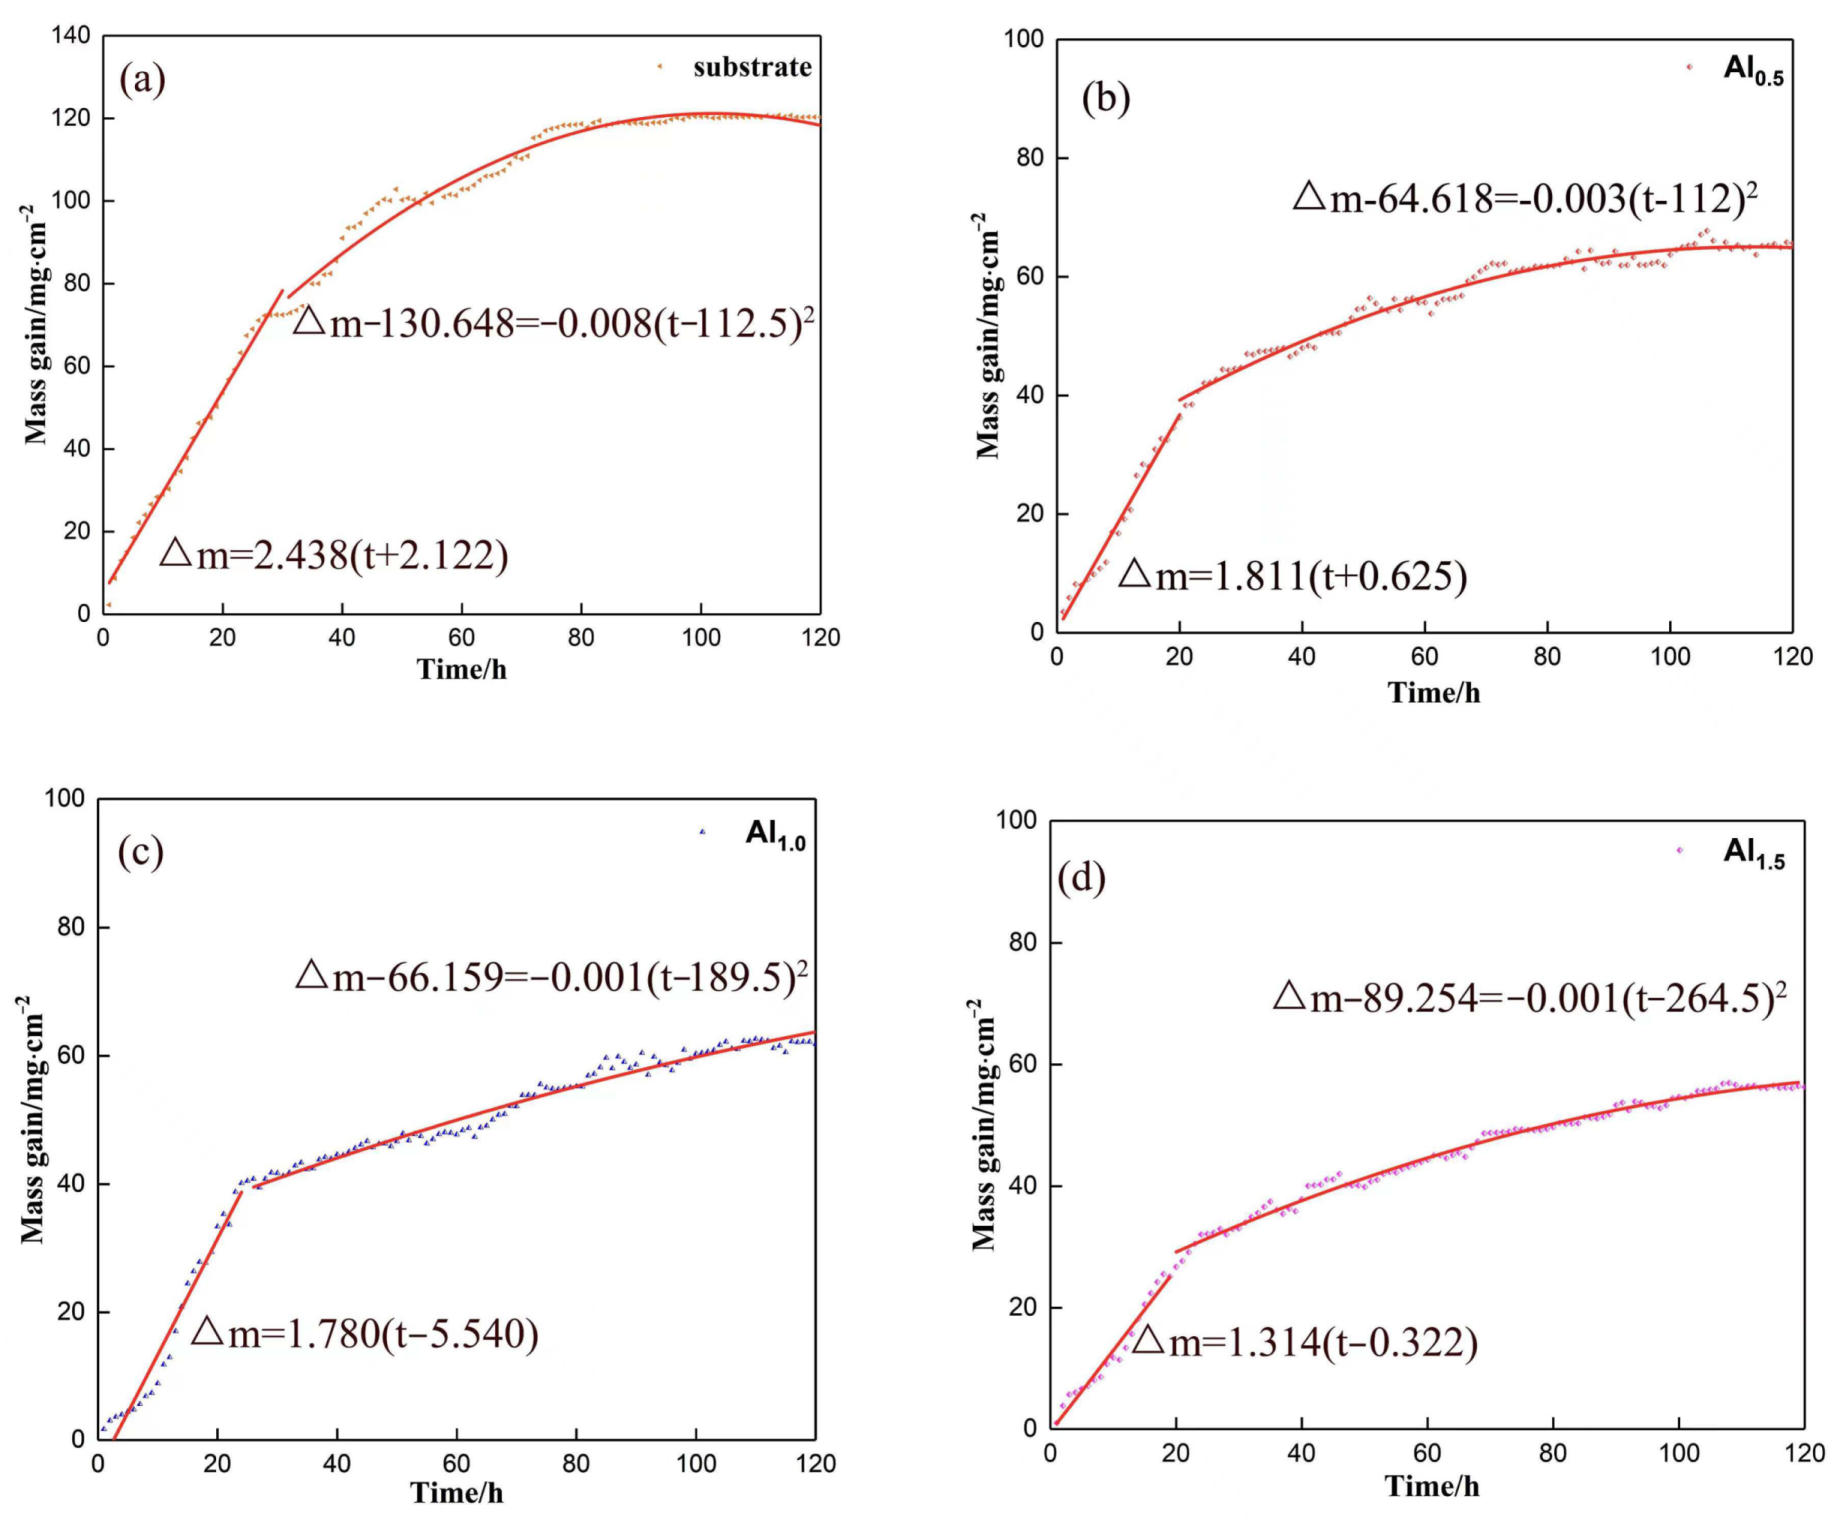
| Samples | Serious Oxidation Stage | Stable Oxidation Stage | |||||
|---|---|---|---|---|---|---|---|
| K1 (mg/h) | a (mg) | COD(R12) | K2(mg/h2) | a(mg) | b(h) | COD(R22) | |
| Substrate | 2.438 | 2.122 | 0.99 | −0.008 | −130.648 | −112.5 | 0.96 |
| Al0.5 | 1.811 | 0.625 | 0.98 | −0.003 | −64.618 | −112.0 | 0.98 |
| Al1.0 | 1.780 | −5.540 | 0.96 | −0.001 | −66.159 | −189.5 | 0.97 |
| Al1.5 | 1.314 | −0.322 | 0.96 | −0.001 | −89.254 | −264.5 | 0.99 |
Publisher’s Note: MDPI stays neutral with regard to jurisdictional claims in published maps and institutional affiliations. |
© 2022 by the authors. Licensee MDPI, Basel, Switzerland. This article is an open access article distributed under the terms and conditions of the Creative Commons Attribution (CC BY) license (https://creativecommons.org/licenses/by/4.0/).
Share and Cite
Hong, S.; Li, J.; Zhao, P.; Xu, Y.; Li, W. Evolution in Wear and High-Temperature Oxidation Resistance of Laser-Clad AlxMoNbTa Refractory High-Entropy Alloys Coatings with Al Addition Content. Coatings 2022, 12, 121. https://doi.org/10.3390/coatings12020121
Hong S, Li J, Zhao P, Xu Y, Li W. Evolution in Wear and High-Temperature Oxidation Resistance of Laser-Clad AlxMoNbTa Refractory High-Entropy Alloys Coatings with Al Addition Content. Coatings. 2022; 12(2):121. https://doi.org/10.3390/coatings12020121
Chicago/Turabian StyleHong, Sichun, Jun Li, Peng Zhao, Yinsi Xu, and Wanggen Li. 2022. "Evolution in Wear and High-Temperature Oxidation Resistance of Laser-Clad AlxMoNbTa Refractory High-Entropy Alloys Coatings with Al Addition Content" Coatings 12, no. 2: 121. https://doi.org/10.3390/coatings12020121