Article

Phase Field Modeling of Air Entrapment in Binary Droplet Impact with Solidification Microstructure Formation

1
School of Mathematics and Statistics, Yancheng Teachers University, Yancheng 224002, China
2
Department of Mechanical Engineering, University of Michigan, Dearborn, MI 48128, USA
*
Author to whom correspondence should be addressed.
Coatings 2022, 12(12), 1990; https://doi.org/10.3390/coatings12121990
Submission received: 8 December 2022 / Revised: 16 December 2022 / Accepted: 16 December 2022 / Published: 19 December 2022

Abstract

:
A novel numerical model was developed to investigate air entrapment in binary droplet impact with solidification microstructure formation under practical plasma spraying conditions. The evolving liquid–gas interface was tracked by the explicit finite difference solution to the Cahn–Hilliard equation, coupled with the Navier–Stokes equations. Another diffuse interface model was invoked to trace solid–liquid and grain–grain boundaries. The model was discretized using an explicit finite difference method on a half-staggered grid. The velocity pressure coupling was decoupled with the projection method. The in-house code was written in Fortran and was run with the aid of the shared memory parallelism, OpenMP. The time duration over which gas compressibility matters was estimated. Typical cases with air entrapment were studied with the model. The effect of droplet porosity on air entrapment was probed into as well: the larger the porosity of a droplet, the bigger the trapped air bubble. The grain growth near the air bubble is skewed. Moreover, a case without air entrapment was also shown herein to stress that air bubbles could be suppressed or even eliminated in plasma spraying by adjusting the landing positions of successive droplets.

1. Introduction

Air or gas entrapment is a common issue in droplet impact onto solid surfaces [1,2,3,4]. It is caused by gas viscosity on one hand, and the building up of pressure around the impacting center on the other hand. The bottom of a droplet will be dimpled by the stagnation pressure developed around the impacting center as the droplet tries to squeeze the gas beneath out. Nevertheless, a tiny portion of gas remains there thanks to its viscosity.
In plasma spraying, gas entrapment increases coating porosity but reduces heat flux nearby due to the smaller thermal conductivity of gases. Moreover, gas entrapment can probably affect grain growth direction in its vicinity [5,6]. Therefore, it is of great interest to figure out how gas is trapped and how grains grow nearby in droplet impact. For single droplet impact onto solid and flat surfaces, the authors conducted a series of studies, in which gas entrapment was captured using the Cahn–Hilliard based phase field model [7] and grain growth near a gas bubble was investigated [8]. For two or more droplet impacts, the situation becomes tricky, as the combination of impacting conditions of multiple droplets may lead to a number of gas entrapment mechanisms. To the authors’ best knowledge, few groups have incorporated solidification microstructure formation into the modeling of droplet impact; so, the following review on numerical work will be focused on other parts, such as fluid motion or gas entrapment, in binary droplet impact.
Pasandideh-Fard et al. [9] may have been the first to numerically investigate binary droplet impact onto a solid surface. They introduced the second droplet after the first had been completely frozen. Obvious splashing was captured when the second drop interacted with the first while spreading on it. Following their work, Ghafouri-Azar et al. [10], tracking the temperature history of certain points on the surface of the first splat, predicted if remelting occurred when the second impinged. Tong et al. [11], using the volume of fluid (VOF) method, probed into flow details when droplet coalescence occurred. They found the maximum spread factor would be increased if the kinetic energy of the following droplet was raised. Bot et al. [12] identified two types of pores in 3D simulations of ceramic droplet impact: one near the tip of the first splat and the other in the overlapping zone. The first type was confirmed in the authors’ prior work [13], with the grain growth direction nearby predicted as well. This is the unique feature of our model. Recently, successive droplet impacts on a curved solid surface were investigated by Chen et al. [14], who, using the coupled volume of fluid and level set method, performed extensive parameter studies. The coupled model is, however, difficult to code, compared with the conservative level set model introduced by [15]. Interactions of successive Ni20Cr drop impacts under plasma spraying conditions were numerically and experimentally studied by Zhang et al. [16], who found that by optimizing the landing positions of the second impacting drop, the inter-splat pore appearing between two splats could be completely eliminated. The above review binary droplet impact onto only solid surfaces, and the readers are referred to literatures [17,18,19] for binary or multiple droplet impacts onto liquid films.
As pointed out before, incorporating solidification microstructure formation into the modeling of droplet impact is rarely seen in literature. Moreover, given few studies on gas entrapment in binary droplet impact under plasma spraying conditions, it whets our appetite to conduct more numerical investigations into the effect of binary droplet impact on gas entrapment and, especially, solidification microstructure formation. Therefore, a novel yet comprehensive numerical model was developed to that end. The model adopts three phase fields, one for liquid–gas flow, one for liquid–solid phase change, and another for grains of distinct crystalline orientations. The model is built in the diffuse interface framework, free of directly tracking moving boundaries. The rest of the paper is organized as follows: First, the integrated model is described, with numerical procedures being given. Second, fitting parameters and thermophysical quantities are chosen. Third, binary droplet impacts with and without gas entrapment were run. The model was validated with experimental data, showing gratifying agreement. Besides, the time duration over which gas compressibility matters was also estimated.

2. Mathematical Statement

Let us consider a binary droplet impact under typical plasma spraying conditions, as shown in Figure 1. These two droplets are initially apart horizontally, but are released from the same vertical height. After the droplets collide with the solid surface, pressure will build up at the impacting center, resulting in air entrapment therein. This is one place where air entrapment occurs. It will also take place where the spreading fronts of the two droplets meet. Meanwhile, the interaction of the two spreading fronts is very likely to skew grain growth direction therein. Therefore, the emphasis of the paper is given to the formation of air entrapment in binary droplet impact and the ensuing effect on solidification microstructure formation. The governing equations for this complex phenomenon, having been described in [7,8,13], are reviewed below.

2.1. Mass, Momentum, and Energy Equations

It is assumed that the fluids are incompressible and Newtonian in this paper. Accordingly, the governing equations for this complex gas–liquid flow show up as
· u = 0
ρ ( c ) ( u t + u · u ) = p + · σ + ρ ( c ) g + G c + S
ρ ( c ) c P ( c ) ( T t + u · T ) = · [ k ( c ) T ] + ρ l L l 2 ϕ t
where u is velocity, t is time, p is pressure, σ = μ ( c ) [ u + ( u ) T ] is the Newtonian stress tensor, and g is the local gravitational acceleration. The fourth and fifth term on the right-hand side (RHS) of Equation (2) stand for surface tension and a momentum sink that will be elaborated on later, respectively. The second term on the RHS of Equation (3) represents latent heat, with subscript l denoting liquid. Note that ϕ / t is updated only where c 0.5 .

2.2. Equation for an Evolving Gas–Liquid Interface

The Cahn–Hilliard equation is employed in this paper to advect the gas–liquid interface.
c t + u · c M 2 G = 0
where M is the phase field mobility and G = δ f / δ c is the chemical potential, with
f = ξ γ α | c | 2 / 2 + ξ 1 γ α c 2 ( 1 c ) 2 / 4
where ξ measures interfacial thickness and γ is surface tension, with α = 6 2 . Herein, c = 1 denotes a gas and c = 0 a liquid, with the value in between indicating a smooth but finite transition area.

2.3. Solidification Microstructure Formation

The other two order parameters, ϕ and θ , are needed to mimic polycrystalline growth in solidification. ϕ distinguishes fluid from solid and θ differentiates crystals of distinct orientations. Their kinetic equations are given below [20,21,22].
τ ϕ ( φ ) ϕ t = [ ϕ λ u ( 1 ϕ 2 ) ] ( 1 ϕ 2 ) + · ( Λ · ϕ ) 2 s ( 1 + ϕ ) | θ | ε θ 2 ( 1 + ϕ ) | θ | 2
P τ θ ( 1 + ϕ ) 2 θ t = · [ ( 1 + ϕ ) 2 ( s | θ | + ε θ 2 ) θ ]
where τ ϕ ( φ ) and τ θ are interface attachment kinetic times, λ is a coupling constant, and P ( ε θ | θ | ) = 1 + ( μ / ε θ 1 ) e β ε θ | θ | is the inverse mobility function. The reader is referred to literatures [7,8,13] for the explanation of the others.
S in Equation (2) governs flow in a mushy region, taking the form of
S = d ( 1 F l ) 2 F l 3 + b u
where d is to suppress all other momentum sources when the liquid fraction F l = ( 1 ϕ ) / 2 vanishes, and b is to avoid division by zero. In this paper, d and b are chosen to be on the order of magnitude of 10 8 ~ 10 11 and 10 3 , respectively.

2.4. Gas Compressibility

Mandre and Brenner [23] proposed a dimensionless number δ = P 0 / ( ρ l 4 V 7 R / μ g ) 1 / 3 to measure gas compressibility, where P 0 is the ambient gas pressure, V is initial impacting velocity, and R is drop radius. The subscripts l and g denote liquid and gas, respectively. For the cases studied in this paper, computation shows δ 1 at the very beginning of impact, indicating a significant compressible effect. However, as the drop spreads, the maximum pressure inside the drop diminishes rapidly, falling to less than 0.1 MPa when the spread factor, defined below, exceeds 2 [24]. During subsequent stages of spreading, δ 1 , meaning practically incompressible gas [23].

2.4.1. Compression Started Sometime before Real Contact

A.
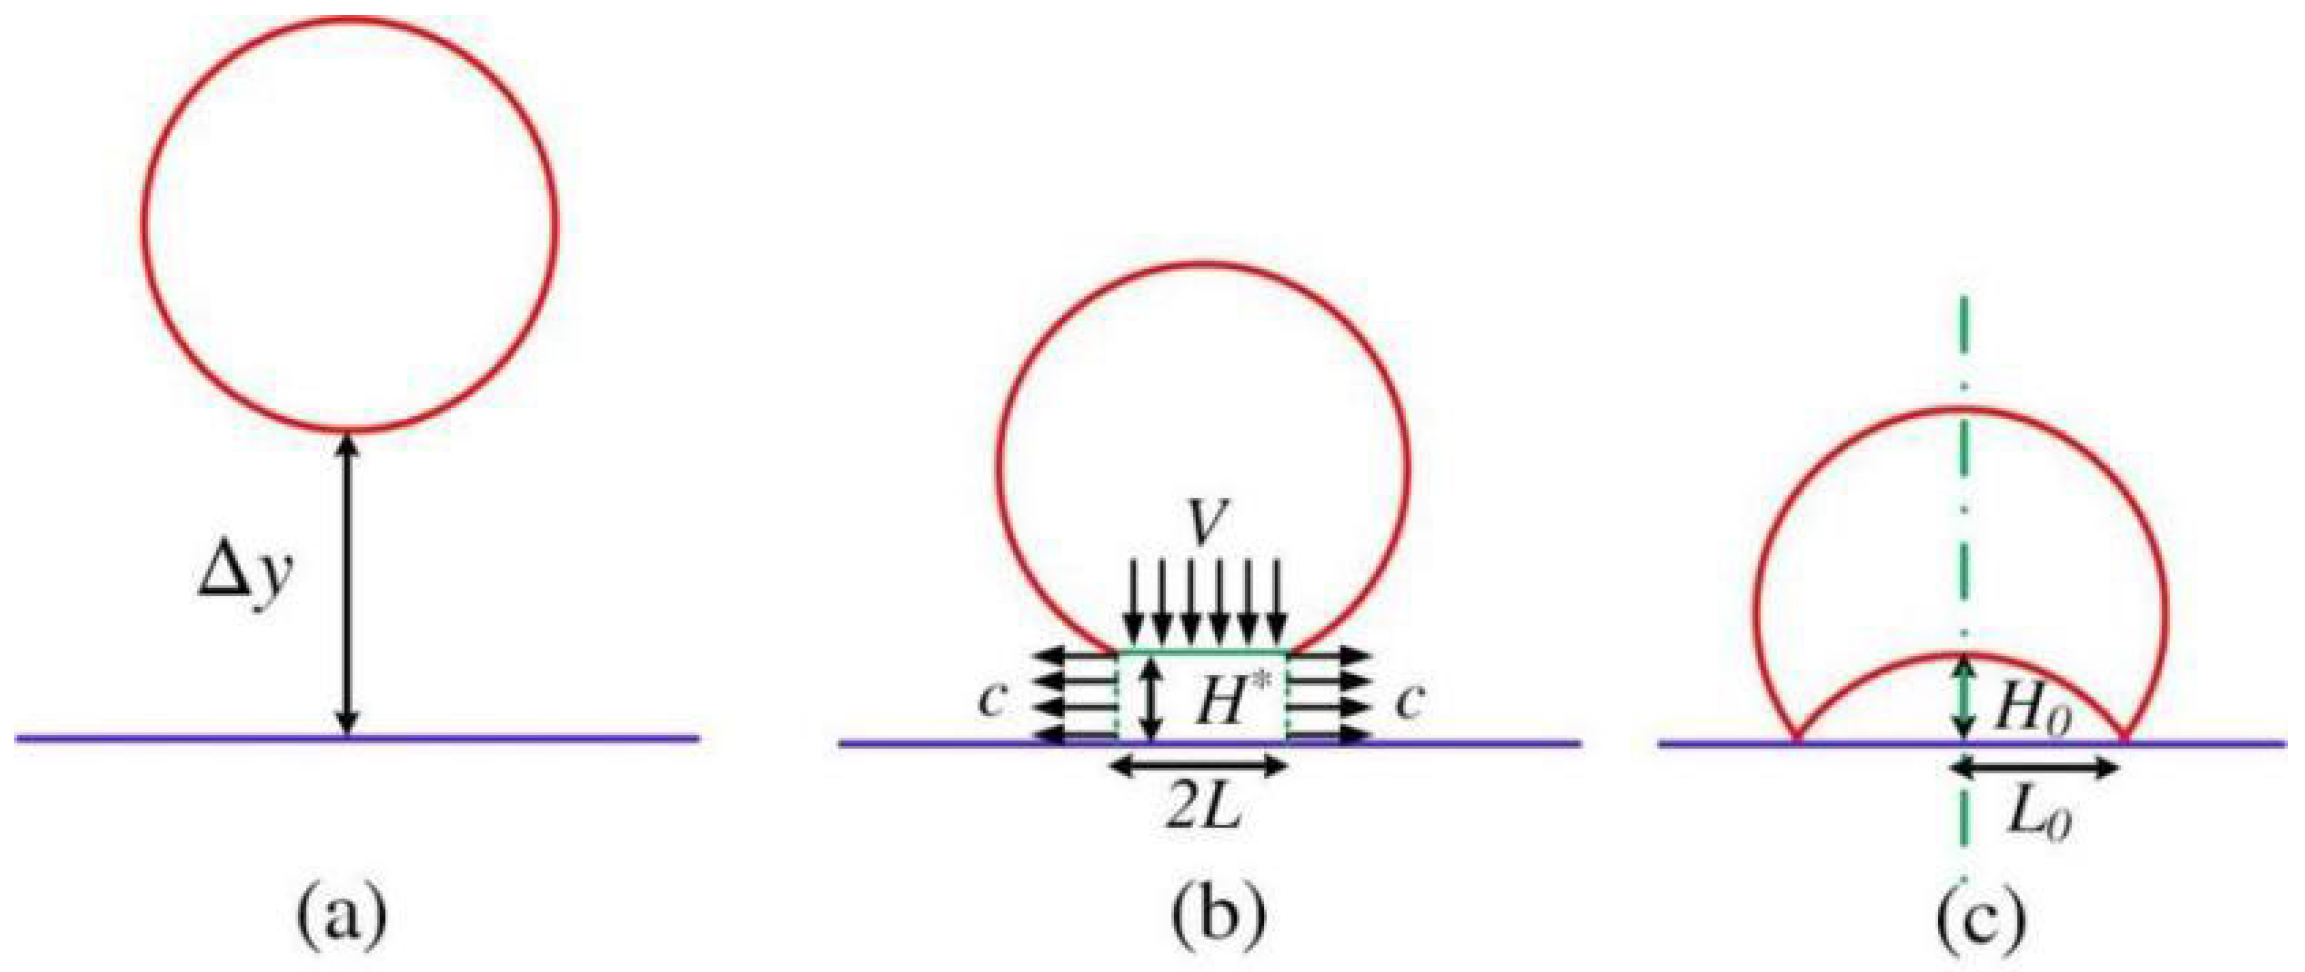
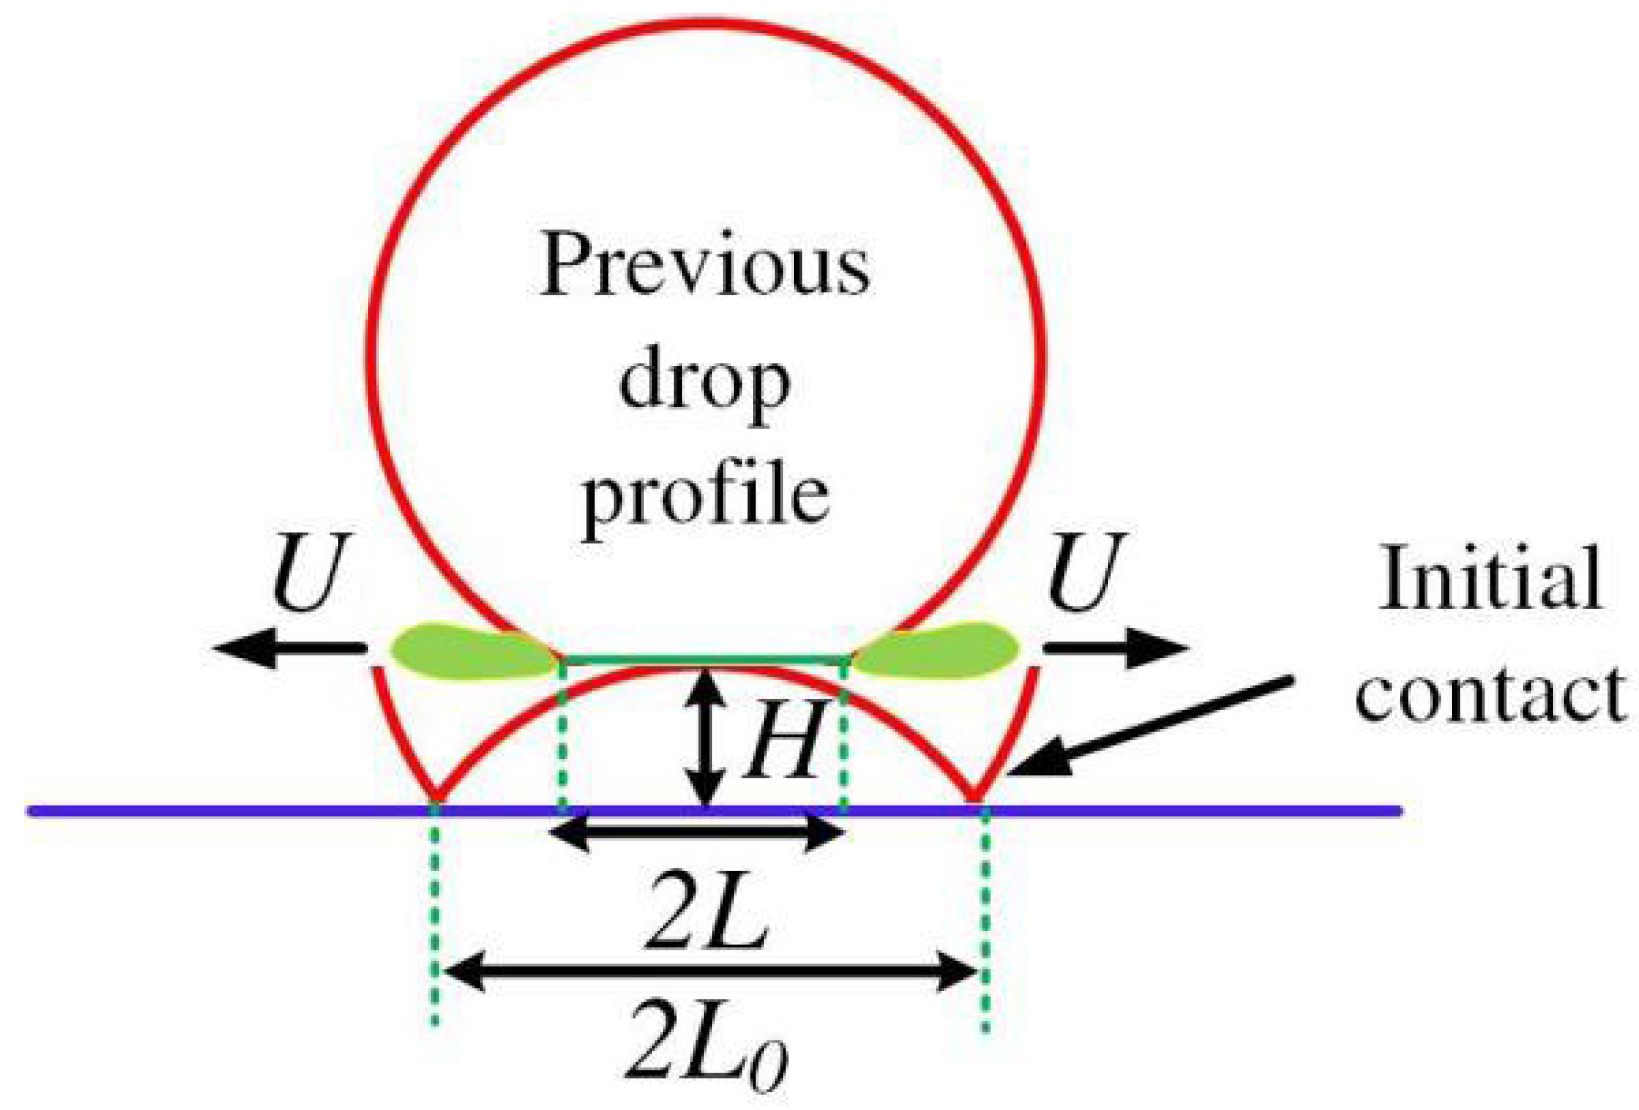
Estimate of air layer thickness and of the strength of deceleration
The top of the bubble moves upwards instead of downwards after contact with the substrate, while the dimple is formed before contact with the substrate. H 0 is the air layer thickness at first contact. Assume compression begins a distance H * away from the substrate. Figure 2 shows the dynamics of air entrapment with various lengths involved. The time elapsed from (a) to (b) is of little interest and can be estimated to be ( y H * ) / V . The pressure at the bottom of the droplet in (b) can be approximated as p ~ μ g V R / H 2 , since it is assumed that compression begins for the first time at this height. H is a length scale comparable to H*. Subsequently, the pressure in the gas rapidly accumulates, indicating the beginning of compression.
At the state of compression, the pressure force within the gas film should be comparable to that of the liquid inertia so that the sign of the bottom curvature could be reversed. Hence, according to the lubrication equation within the gas,
12   μ g H t = ( p x H 3 ) x
Using order of magnitude analysis, the two sides can be approximated as
μ g H τ ~ p H 3 L 2
in which τ = H / V is the time scale to approach the substrate. Rearrangement gives
p ~ μ g V L 2 H 3
The length scale L in the horizontal direction is found if the fact is considered that the droplet would penetrate a depth of H downwards provided there was no resistance of the air film and also of the substrate. According to a simple geometric analysis in Figure 3,
R 2 = L 2 + ( R H ) 2
Hence, one has, after neglecting higher order terms such as H 2 ,
L = 2 R H H 2 ~ R H
Substitution of Equation (13) into Equation (11) gives the order of magnitude of p ~ μ g V R / H 2 . This pressure force must decelerate the battering liquid, whose inertial force scales as ~ ρ l V / τ ~ ρ l V 2 / H . It has the unit of Pa / m , calling for another length scale, which is L = R H in two dimensions. Thus, the liquid inertia should be on the same order of magnitude as the pressure force within the gas:
ρ l V 2 R H ~ μ g V R H 2
Thus, the air film thickness scales as
H ~ R S t 2 / 3
where S t = μ g / ρ l V R is the inverse Stokes number. The subscripts represent liquid and gas, respectively. The strength of deceleration when the drop starts to compress the gas until it is brought to rest is on the scale of
a ~ V τ ~ V H / V ~ V 2 H
B.
Estimate of H * and the time for the first stage of compression t 1
The sound speed within the gas beneath the droplet is calculated as follows:
c = R g a s T k = 289 × 3000 × 1.4   m / s 1100   m / s
The strategy is then to estimate H * where compression just begins. Above this height, one has every reason to believe that the downward velocity is reduced but still asymptotically approaching the initial impacting velocity, since the time scale is rather small and the pressure built up thus far below the droplet is not as enormous as in later times. Once the height H * is sought, the time duration from the start of compression H * to H 0 is calculated as
t 1 ~ ( H * H 0 ) / a
The height H * is found from mass conservation in Figure 4. Writing out the mass flux on each face gives
V L ~ c H *
Thus, H * ~ V L / c and L = R H ; then, the time duration when air is compressible from H * to H 0 scales as
t 1 ~ ( V R S t 1 / 3 c R S t 2 / 3 ) × R S t 2 / 3 V 2 ~ 10 11   s
This value is tiny compared with the time scale for solidification (~1 μs) and for spreading (~0.1 μs) in practical thermal spray conditions. This stage is termed as the first stage of compression.

2.4.2. Compression Completed When the Bubble Recedes

The following is to estimate when the bubble is enclosed by the droplet and the substrate. If this time interval is also found, then adding it to the time interval in Equation (20) will give the total time interval during which gas is compressed.
A.
How is the bubble enclosed?
According to [23], the ejection velocity of the liquid sheet U in Figure 5 scales as
U ~ 0.34 V S t 1 / 3 ~ 4 × 10 3   m / s
The liquid sheet denoted in green in Figure 5 is squeezed before contact with the substrate, since the dimensionless number measuring the relative importance between surface tension and inertial force turns out to be quite small, as shown in Equation (22):
δ = σ μ g V S t 4 / 3 ~ 10 5
Pushed by pressure gradient, the liquid sheet touches the substrate eventually. The exact instant when the liquid sheet is ejected is approximated by [23] as
t e j e c t ~ 7.6 R S t 2 / 3 / V ~ 3 × 10 11   s
t = 0 is when the undeformed drop would have touched the surface in the absence of air [23]. If time is measured when the bottom surface falls to H * , then the sheet is ejected around 5 × 10 11   s after the first stage of compression.
B.
Estimate of the time for the second stage of compression
As shown in Figure 6, the second stage of compression starts from the appearance of the lamella to the first contact with the substrate, and the time interval in this stage is approximated simply as
t 2 ~ L 0 L U
The authors in [25] proposed a theory for the initial contact radius L 0
L 0 = 3.8 ( 4 μ g ρ l V ) 1 / 3 R b 2 / 3
where Rb is the bottom radius immediately before contact. As a first estimate, take Rb as 1 ~ 1000   R . Calculation and substitution yields
10 10   s t 2 10 8   S
Hence, the total time for gas being compressible is on the order of magnitude of only nanoseconds, which is much faster than a blink of an eye.

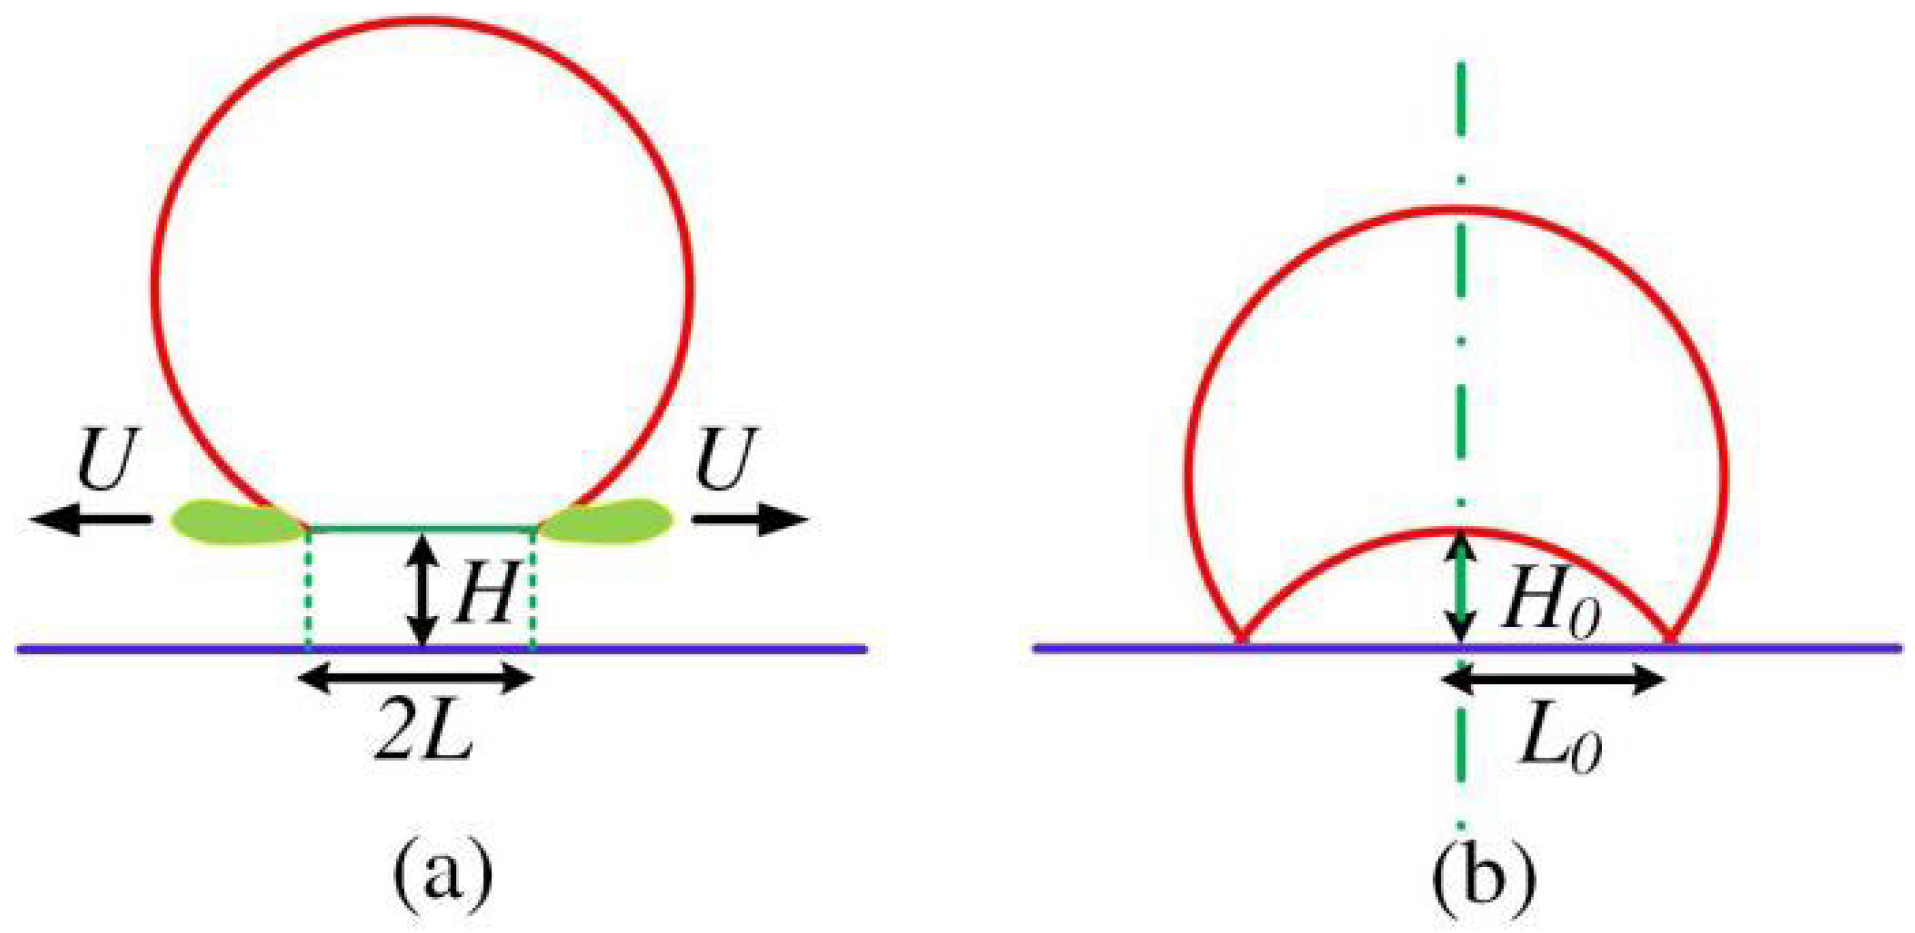
2.4.3. Gas Bubble Receding

As mentioned above, gas is actually compressed at the very beginning of impact. Having been compressed, a tiny amount of gas is entrapped beneath the bottom of a droplet, thus forming a cap-like bubble. Then, the bubble will retract, returning to a sphere and rising upwards off the substrate [26]. As the bubble retracts, it is mostly uncompressed [27,28]. As a result, if the time of retracting is estimated and added up to the time scales in the above section, then the extent to which gas compressibility is significant could be determined. Retracting of a gas bubble could be described as follows [26]:
γ δ ( t ) = C 1 ρ l v ( t ) 2 + C 2 μ l v ( t ) δ ( t )
where C 1 = 0.63 and C 2 = 1.54 are pre-factors of order one, v ( t ) is the retracting velocity, and δ ( t ) is the characteristic size of the rim. The retracting velocity v ( t ) is correlated with the contact radius L ( t ) of the gas bubble as follows:
L ( t ) = L 0 0 t v ( τ ) d τ = L 0 0 t C 2 μ l + C 2 2 μ l 2 + 4 C 1 ρ l γ δ ( τ ) 2 C 1 ρ δ ( τ ) d τ
where the horizontal radius L 0 = 3.8 ( 4 μ g / ρ l V ) 1 / 3 R b 2 / 3 [25], with Rb being the bottom radius of curvature of the droplet. The initial radius of the droplet is used for Rb herein. Accordingly, for the cases considered here, L 0 ~ O ( 10 7 ) m. With L ( t ) = 0 , meaning the gas bubble is just returned to a sphere, and δ ( τ ) ~ O ( 10 9 )   m, estimated according to [26], Equation (28) yields the retracing time t r e ~ O ( 10 8 ) s, which is small enough compared with the spreading time ~ O ( 10 7 ) s calculated by the present numerical model.
From the discussions above, the time interval when gas compressibility matters adds up to t 1 + t e j e c t + t 2 + t r e ~ O ( 10 8 )   s , which is much smaller than the time scale for solidification (~1 μs) and for spreading (~0.1 μs) in practical thermal spray conditions; thus, the effect of gas compressibility elapses quickly and could be safely neglected herein.

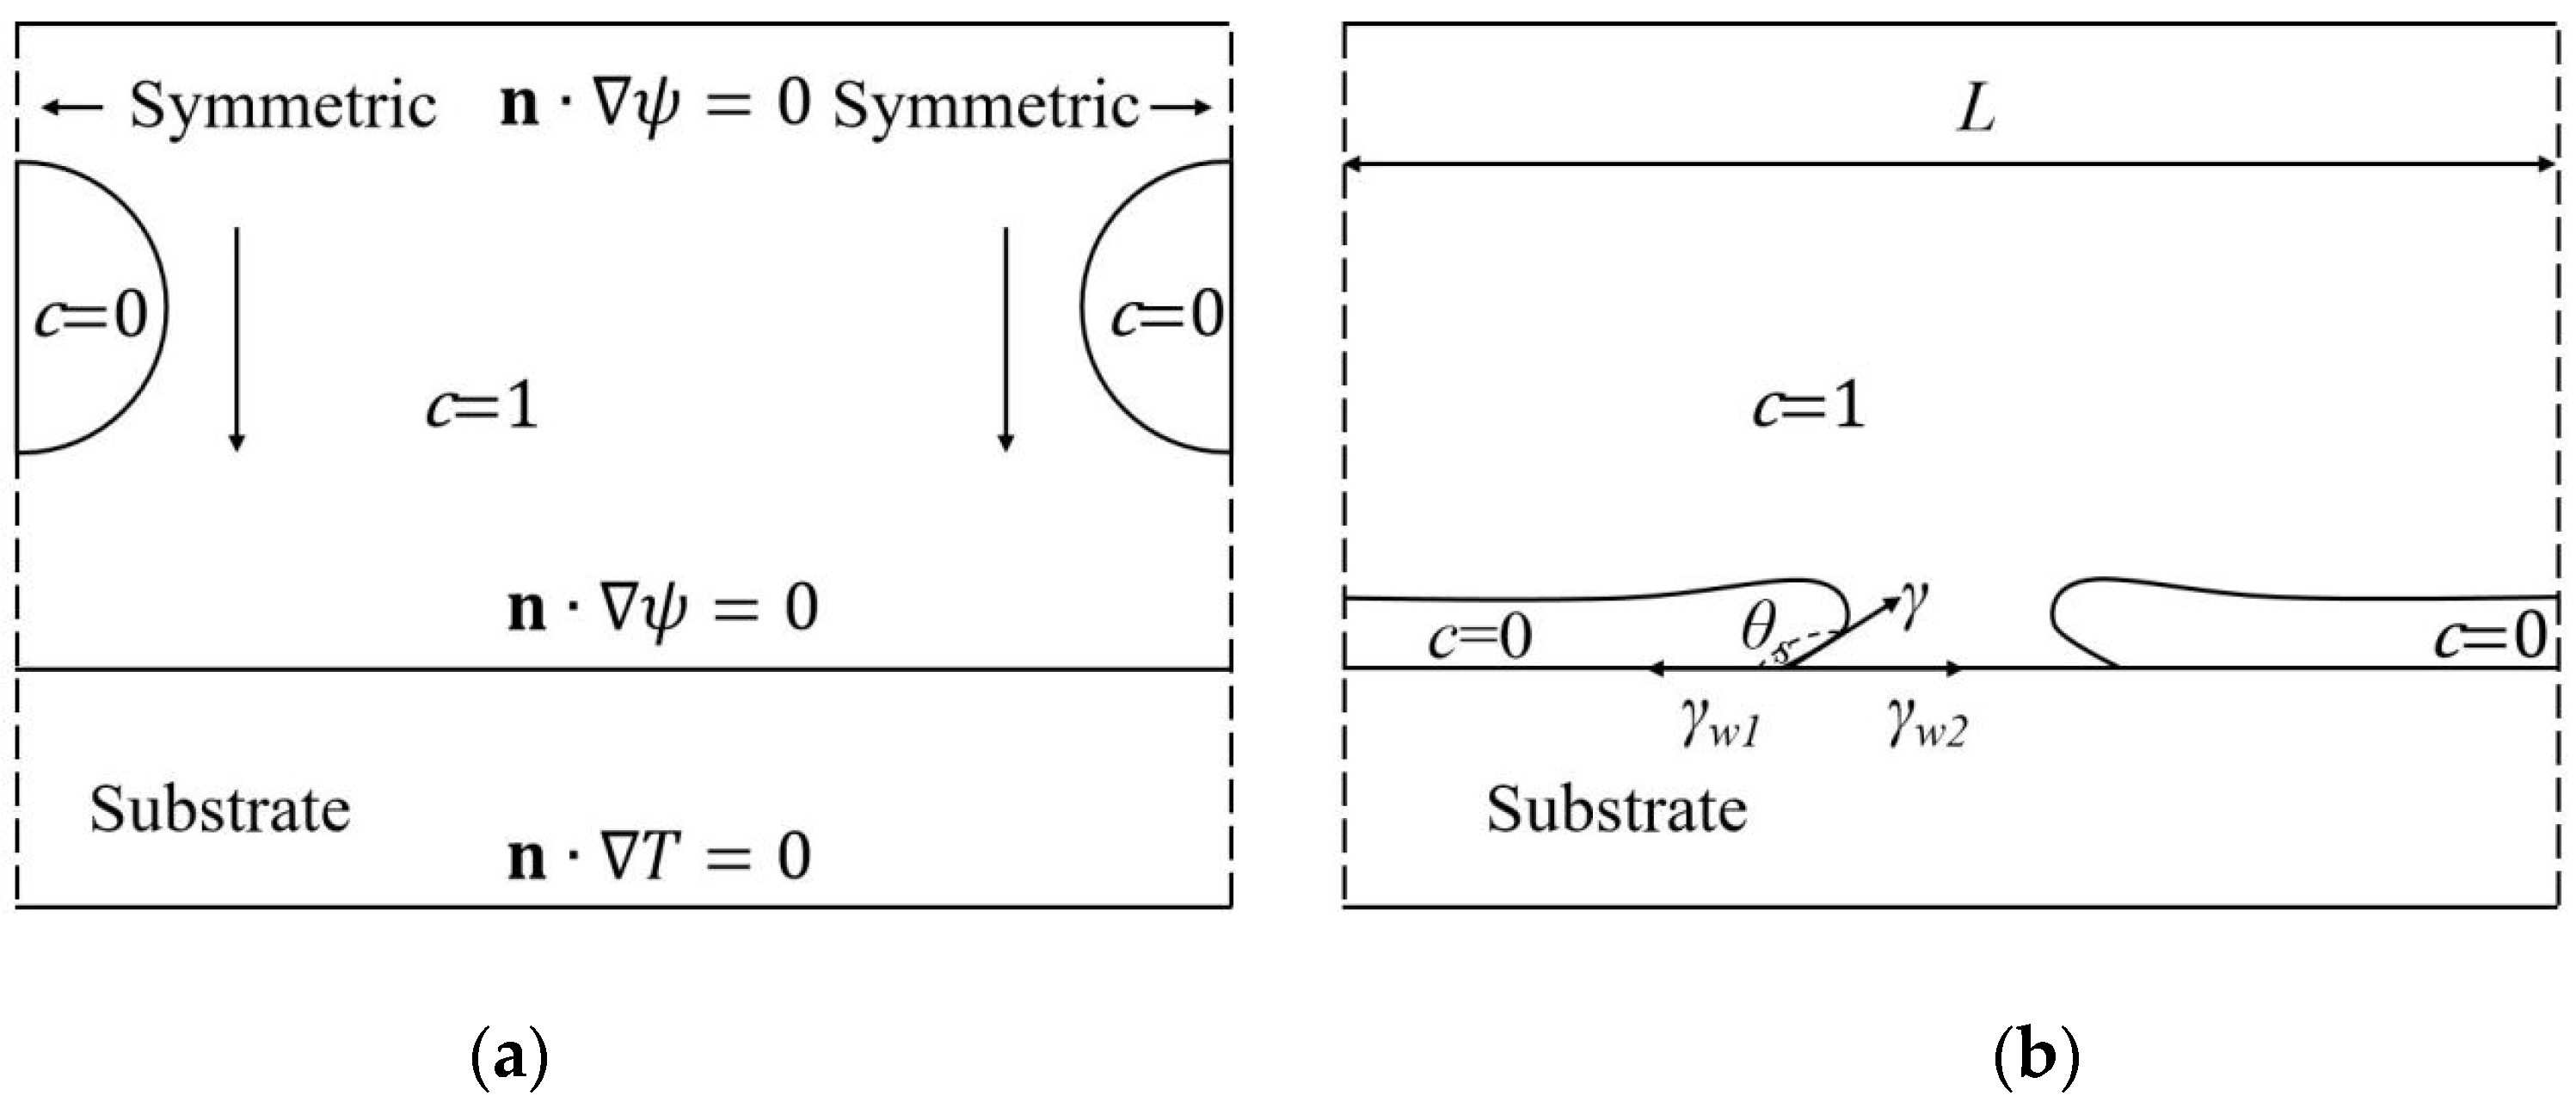
2.5. Boundary Conditions

Given in Figure 1, the boundary conditions deserve more explanation. First, for heat transfer, the whole domain, including the substrate, adopts adiabatic boundaries; second, ψ embraces all field variables, except for the velocity components at the axis of symmetry and at the wall, respectively, and for the order parameter c at the substrate surface that satisfies ξ γ α n · c + f w ( c ) = 0 , where n is an outward unit normal.
f w ( c ) = [ γ cos θ S ( 4 c 3 6 c 2 + 1 ) + γ w 1 + γ w 2 ] / 2
is the wall free-energy density. f w ( c = 0 ) = γ w 1 and f w ( c = 1 ) = γ w 2 , the two determining a static contact angle θ S via Young’s equation γ w 2 γ w 1 = γ cos θ S .

2.6. Numerical Procedures

A finite difference method on a half-staggered grid is utilized to discretize the governing equations. All variables, except the pressure that is stored at the cell center (black), are stored at the cell vertex (white), as shown in Figure 7. TCR is short for thermal contact resistance and is accounted for in the grid points on the substrate and just beneath it, such as nodes A and B. The no slip condition is applied to point A.
In addition, diffusion terms are discretized using the central difference scheme, convection terms using the upwind scheme, and transient terms using the forward Euler scheme. The velocity–pressure coupling is decoupled via the projection method.
Solution steps: The set of equations as below are solved explicitly, except Equation (35). Note that the sequence leaves no effect on final results, the superscript n flags the previous time step and n + 1 the current, and F n contains all the other terms in the NS equations.
τ ϕ ϕ n + 1 ϕ n t = f ( ϕ n ) + · ( Λ · ϕ n ) 2 s ( 1 + ϕ n ) | θ | ε θ 2 ( 1 + ϕ n ) | θ | 2
τ θ ( 1 + ϕ ) 2 P ( ε θ | θ n | ) θ n + 1 θ n t = · [ ( 1 + ϕ ) 2 ( s | θ n | + ε θ 2 ) θ n ]
ρ c P ( T n + 1 T n t + u · T n ) = · ( k T n ) + ρ l L l 2 ϕ t
c n + 1 c n t + u · c n M 2 G n = 0
u * u n t = F n
· ( p n + 1 ρ n + 1 ) = · u * t
u n + 1 u * t = p n + 1 ρ n + 1
The time step t is chosen according to the following constraints to ensure numerical stability. u max is the norm of the maximum velocity.
t 10 4 τ ϕ
t x u m a x
Throughout the paper, t is on the order of magnitude of 10 12   s . Besides, computation is facilitated with the aid of the shared-memory parallelism OpenMP.

3. Results and Discussion

Before extensive simulations were run, the model was validated and the mesh size was carefully checked to exclude any side effect. The impacting process with solidification microstructure formation is a complex phenomenon, containing a few length scales, both macroscopic and microscopic. The former is represented by drop diameter or by the width or height of columnar grains, and the latter by solid–liquid interface or grain boundary thickness. For numerical results to be convincing, the smallest macroscopic length scales under consideration should be adequately resolved by grid nodes. In this paper, the smallest macroscopic length scales primarily reside in the height or width of columnar grains, usually on the order of magnitude of 10 7   m . Therefore, the characteristic length scales in the phase field model—that is, ξ and ε ˜ ϕ —are chosen to be approximately one order of magnitude lower, reaching 10 8   m . Besides, ξ = ε ˜ ϕ = 1.25 x , where x = 4 × 10 8   m throughout the paper unless otherwise stated.
The kinetic effect on solidification is dismissed as it is manifested only at the very beginning of solidification. The thermophysical quantities and fitting parameters are listed in Table 1 and Table 2, respectively. Note that, in Table 2, L c stands for droplet diameter, μ e = μ g μ l for effective viscosity, d 0 for thermal capillary length, and D for the thermal diffusivity of YSZ. In addition, a 1 = 0.8839 and a 2 = 0.6267 [29].

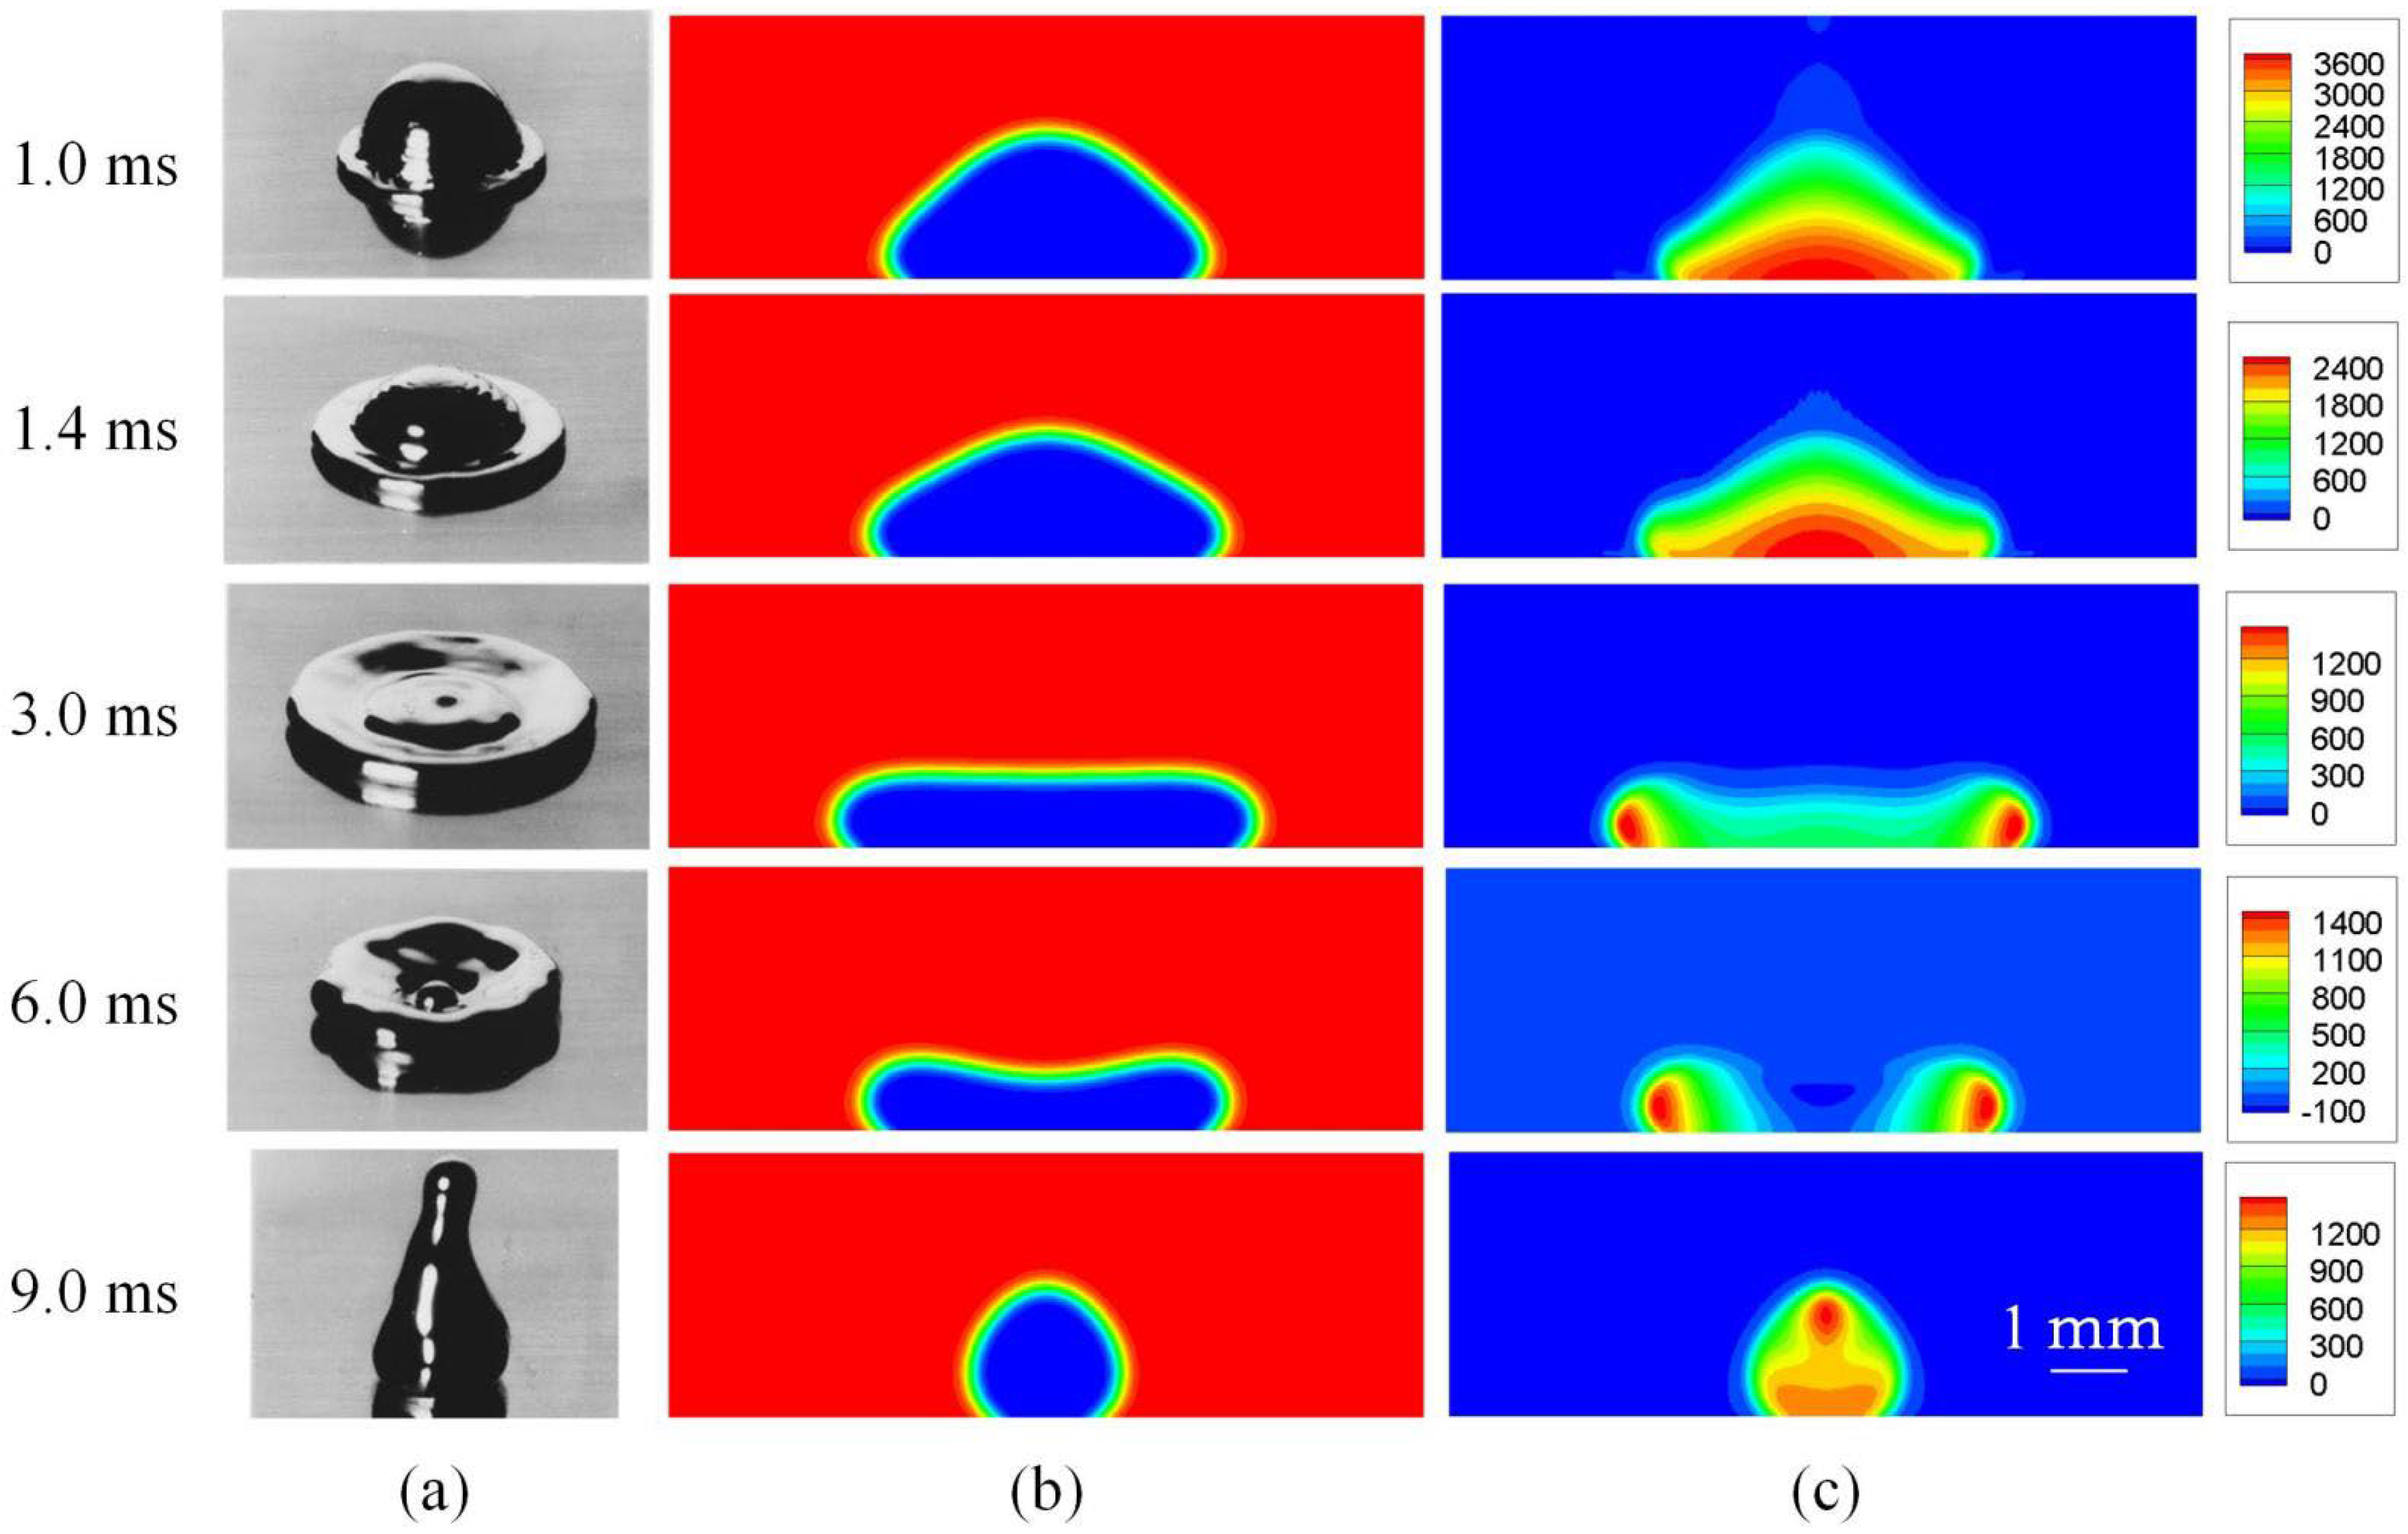
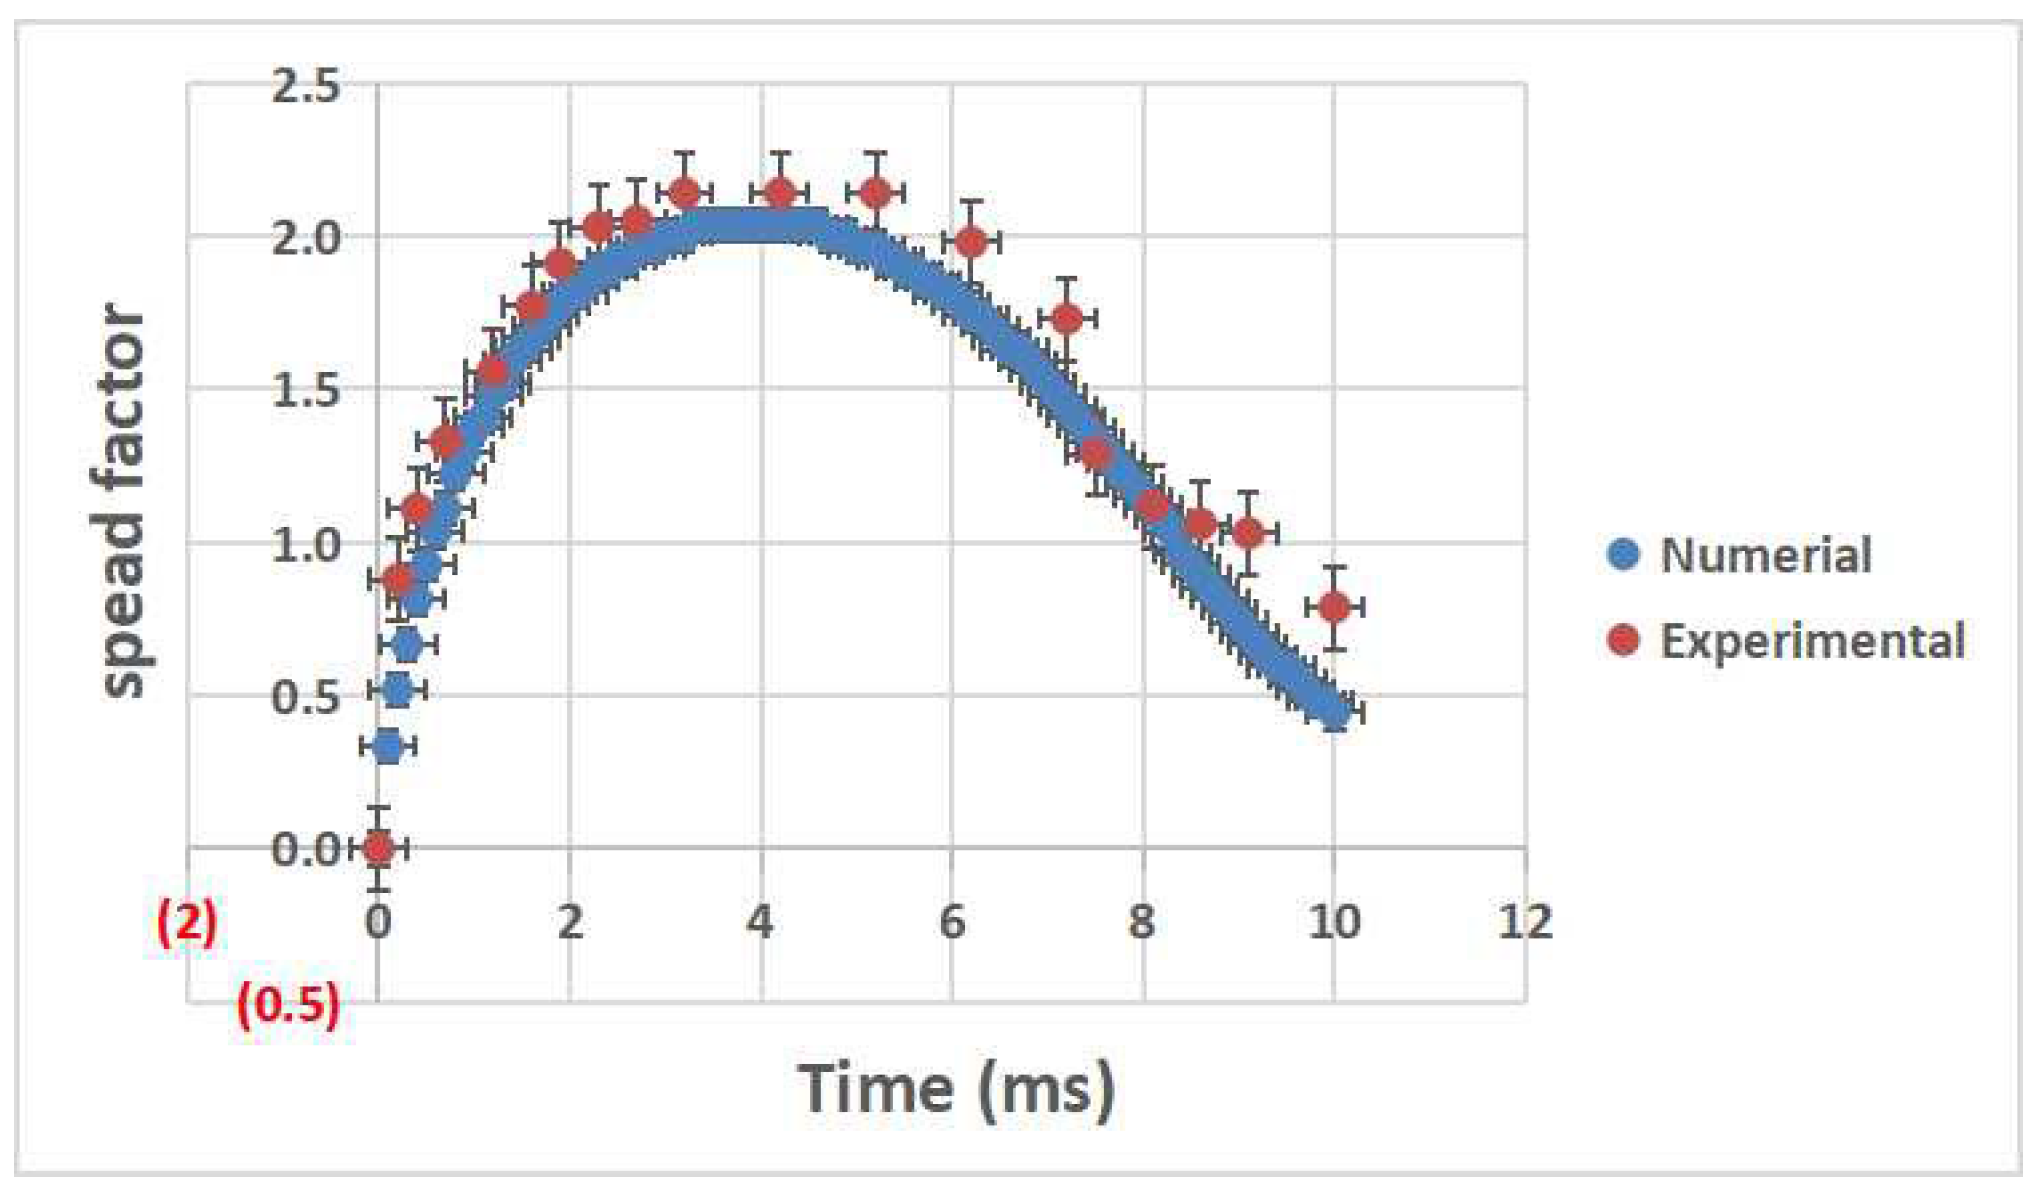
3.1. Model Validation

The model was validated against the experimental outcome, which was conducted by Aziz and Chandra [33]. The experiment is about molten Tin drop impact, with drop diameter 2.7 mm and impacting velocity 1 m/s. Phase change is not considered. Numerically, a grid of 101 × 71 (half domain) points is employed. The uniform spatial step in both directions is x = y = 5 × 10 5   m . The contact angle is set to 140°. The evolving liquid–gas interface is tracked by the Cahn–Hilliard model. The phase field mobility, a crucial parameter controlling contact line motion, is tuned to be 5 × 10 8   m 3 · s / kg , about four times less than that predicated by ξ 2 / 16 μ e . There are 27 cells per drop radius, resulting in a Cahn number of 1/27 if ξ = x . The numerical outcome is shown in Figure 8, with column (b) representing drop contour and column (c) displaying pressure distribution. Overall, the agreement between the numerical and experimental outcomes is satisfying when it comes to drop profile.
Figure 9 compares the spread factor evolution, displaying reasonable agreement during both spreading and retraction phases. The spread factor is defined as the ratio of the changing drop diameter in the x direction to the initial drop diameter.

3.2. Typical Binary Droplet Impact under Plasma Spraying Conditions

In this section, a typical binary droplet impact under plasma spraying conditions is investigated numerically. The focus is on simultaneous binary drop impact, namely, the two droplets are released at the same time. The droplet diameter is set to 4.8 μm. Initially, the droplet temperature, together with that of the surrounding gas, is prescribed to 3000 K, a little higher than the melting point of YSZ. Besides, the substrate is preheated to 423 K to promote the formation of pancake-like splats; 423 K is the temperature to which the substrate in our previous physical experiments was heated [34]. The droplet collides at 200 m/s with the substrate, whose surface has been seeded with super critical nuclei with a density of 75/500, with the numerator denoting the number of nuclei and the denominator the dimensionless horizontal length of the computational domain. At the beginning, the two droplets are 500 × Δx apart horizontally, but with the same vertical height. The thermal contact resistance equals 10 8   m 2 · K / W , meaning perfect contact between the drop and the substrate. The numerical outcome is shown below in Figure 10.
Compared with single droplet impact, binary droplet impact has a couple of salient features. One is the extra gas entrapment that occurs where the spreading fronts of the two droplets meet, as observed at 0.06 μs. Its formation is similar to the gas entrapment at the impacting center, which is due to gas viscosity. When the spreading fronts encounter each other, the gas in between fails to escape wholly, leaving a portion trapped. The flow around them is directed upwards because of mass conservation. It is of interest to note the variation of the contour of the entrapped gas. At 0.06 μs, because of the violent kinetic energy, the interfacial curvature is large. Nevertheless, as time goes on, surface tension restores the interface to a rounded shape at 0.2 μs. The other characteristic lies in the skewing of grain boundary near the entrapped gas, as demonstrated by the curved grain boundary in black at 1.5 μs. The skewing is probably caused by fluid motion, since the effect of anisotropic crystal growth of a small ε 4 has been ruled out. The squeezed jet, after 0.2 μs, is dragged downward, impinging obliquely onto the grains nearby. Therefore, the grain boundary is curved.
Figure 11 gives the temperature distribution at particular instants, with black contours denoting the droplet. It is clear that on account of air entrapment, the heat flux nearby is reduced, as demonstrated by the heat wave crests at 0.3 μs—one in the air and the other in the substrate. Thanks to a larger thermal diffusivity, the cusp in the substrate has been smoothed out by 1.5 μs.

3.3. Effect of Droplet Porosity

As seen in the last section, an air bubble is liable to form around the spreading front when two droplets impact simultaneously. The role of the air bubble is twofold: on one hand, it increases the porosity of coatings, which is not desired or unwanted; on the other hand, it decreases the thermal conductivity of coatings, which in turn helps improve their performance in thermal cycling experiments. Therefore, the air bubble, albeit being mostly unwanted, has a role to play. In this section, one of the droplets was made hollow to see whether air entrapment can be mitigated or even eliminated. Hollow droplets can be obtained via spray dried agglomerates, and porous powder particles form hollow droplets after going through the high energy plasma jet [35,36,37]. Hollow droplets are not uncommon in thermal spray [38], and numerical studies of hollow droplet impact can be found in [39,40].
Initial conditions are the same as in the last section, except that the right droplet has a circular void within, which is concentric with and has half the diameter of the bigger one. The void is filled with air. The numerical outcome is given in Figure 12.
At 0.03 μs, when the spreading process just begins, the counter flow in the hollow drop has emerged due to the smaller dynamic pressure within the void. The uprising flow resembles a spring that is suddenly freed after being fully loaded. As the dynamic pressure of the air within the void is weak, the stagnation pressure transformed from it is hardly able to drain the air beneath the drop as much as that transformed from a dense drop. As time proceeds to 0.08 μs, the shell of the hollow drop breaks up, and solidification has started.
Compared with Figure 10, Figure 12 gives a distinct final splat morphology, as seen at 1.3 μs, where air entrapment has been eliminated but the two splats are not connected, separated by an air gap. If subsequent droplets continue impinging, air entrapment can still form. Another feature deserving some remarks is the more curved top surface of the right splat. The formation of the concave top surface may date back to 0.15 μs, when the contour of the entrapped air bubble loses its symmetry because of the energetic left droplet and of the sluggish right one. Though the air bubble is complete at 0.15 μs, the thin film encompassing the bubble soon ruptures. This is due to the imbalance between inertial force and surface tension force. Subsequently, the rising jet is gradually pulled back by surface tension, resulting in a rounded and thick edge eventually.
Besides, there is a noticeable difference in final solidification microstructure. On account of air entrapment beneath the hollow droplet, as at 0.2 μs and 0.3 μs, the grain boundaries nearby bend towards the liquid. Thus, the boundary deviates from vertical and prefers an oblique path. The rest of the grains exhibits columnar structures driven by the vertical thermodynamic force.
From this simple comparative study, it is found that symmetry is lost when one droplet is hollow with the rest of the conditions being the same. Can the degree of symmetry be controlled by adjusting void size? Figure 13 shows the outcome with a smaller void in the hollow droplet. The void diameter, however, is decreased by a factor of 2.
As expected from Figure 13, as the void becomes small, the degree of symmetry recovers somewhat and the concave top surface is smoothed a bit. The final solidification microstructure in general is columnar-structured, except in the lower right corner where the grain boundary is bent due to air entrapment at 0.2 μs and 0.3 μs.
In summary, if two droplets are both dense, air entrapment is most likely to occur in the vicinity of the spreading front. Though a tiny portion of air is destined to be trapped around the impacting point, its amount may not be considerable thanks to the enormous stagnation pressure building up there. If a droplet is partially filled with air, the entrapped air will relocate from where the two droplets meet to the bottom of the hollow droplet. Moreover, the splats are not bridged, leaving a gap in between.

3.4. Sequential Droplet Impact with Well Bonding

In real plasma spraying, air entrapment or voids are unavoidable when a multitude of droplets come down, spreading and interacting with one another. It is, however, of theoretical relevance to investigate under which conditions the void is likely to be suppressed when binary droplets impact, sequentially. In other words, the two droplets do not impinge at the same time, but with some time interval.
Initially, the two droplets are 600 × Δx apart, with the second being introduced at 0.7 μs when the first has been solidified completely. This simplifies the problem, since the first is motionless while the second is spreading on the substrate. Besides, the readers are referred to Section 3.2 for other numerical configurations. The numerical outcome is given in Figure 14.
Since the first droplet has been frozen when the second is introduced, the impacting process can be seen as a single droplet impact in irregular computational domains, with the contour of the first splat constituting the irregular domain boundaries. At 0.8 μs, a slit can be observed between the two droplets. At this moment, the two droplets are not connected. Nevertheless, with the spreading front coming down, the two make contact, with air entrapment thus taking place, as demonstrated at 0.9 μs. As the unsolidified liquid continues descending, the air bubble diminishes to a minimum as seen at 1.5 μs. The final splat morphology is very much like that in Figure 10, but air entrapment has been eliminated greatly.
As for solidification microstructure, most of the grains are columnar. Due to the air bubble, the yellow grain beneath it stops growing early, while the left (light brown) grain grows over the bubble and is linked to the right (dark brown) one eventually.
Next, restriction on the set-in time of the second droplet is relaxed. Figure 15 provides the numerical outcomes for different set-in times of the second droplet. In the left column, the second droplet is brought in at 0.15 μs, when the first just finishes its spreading process, with only a small portion being solidified. Moreover, air entrapment occurs beneath the spreading front of the first droplet at 0.15 μs. Its formation may differ from those occurring around the impacting center and near the converging zone of two spreading front as in Section 3.2. Because of a large portion still being liquid, the two droplets merge when they come together, as shown at 0.25 μs. Note that some amount of air has been trapped by then. The undulation is smoothed out by surface tension and gravity. However, the final solidification microstructures around the contact area of the two, although slightly curved, are not affected too much by fluid motion nearby. The situation is nearly the same for the right column; hence, no more explanation is required.

4. Concluding Remarks

With an aim at delving into air entrapment in binary droplet impact with solidification microstructure formation in plasma spraying, a complex numerical model was established. The model consists of two diffuse interface sub-models to capture liquid–gas and solid–liquid (solid–solid) boundaries, respectively. An explicit finite difference method on a half-staggered grid was employed to solve the pressure–velocity coupling. The major findings are below.
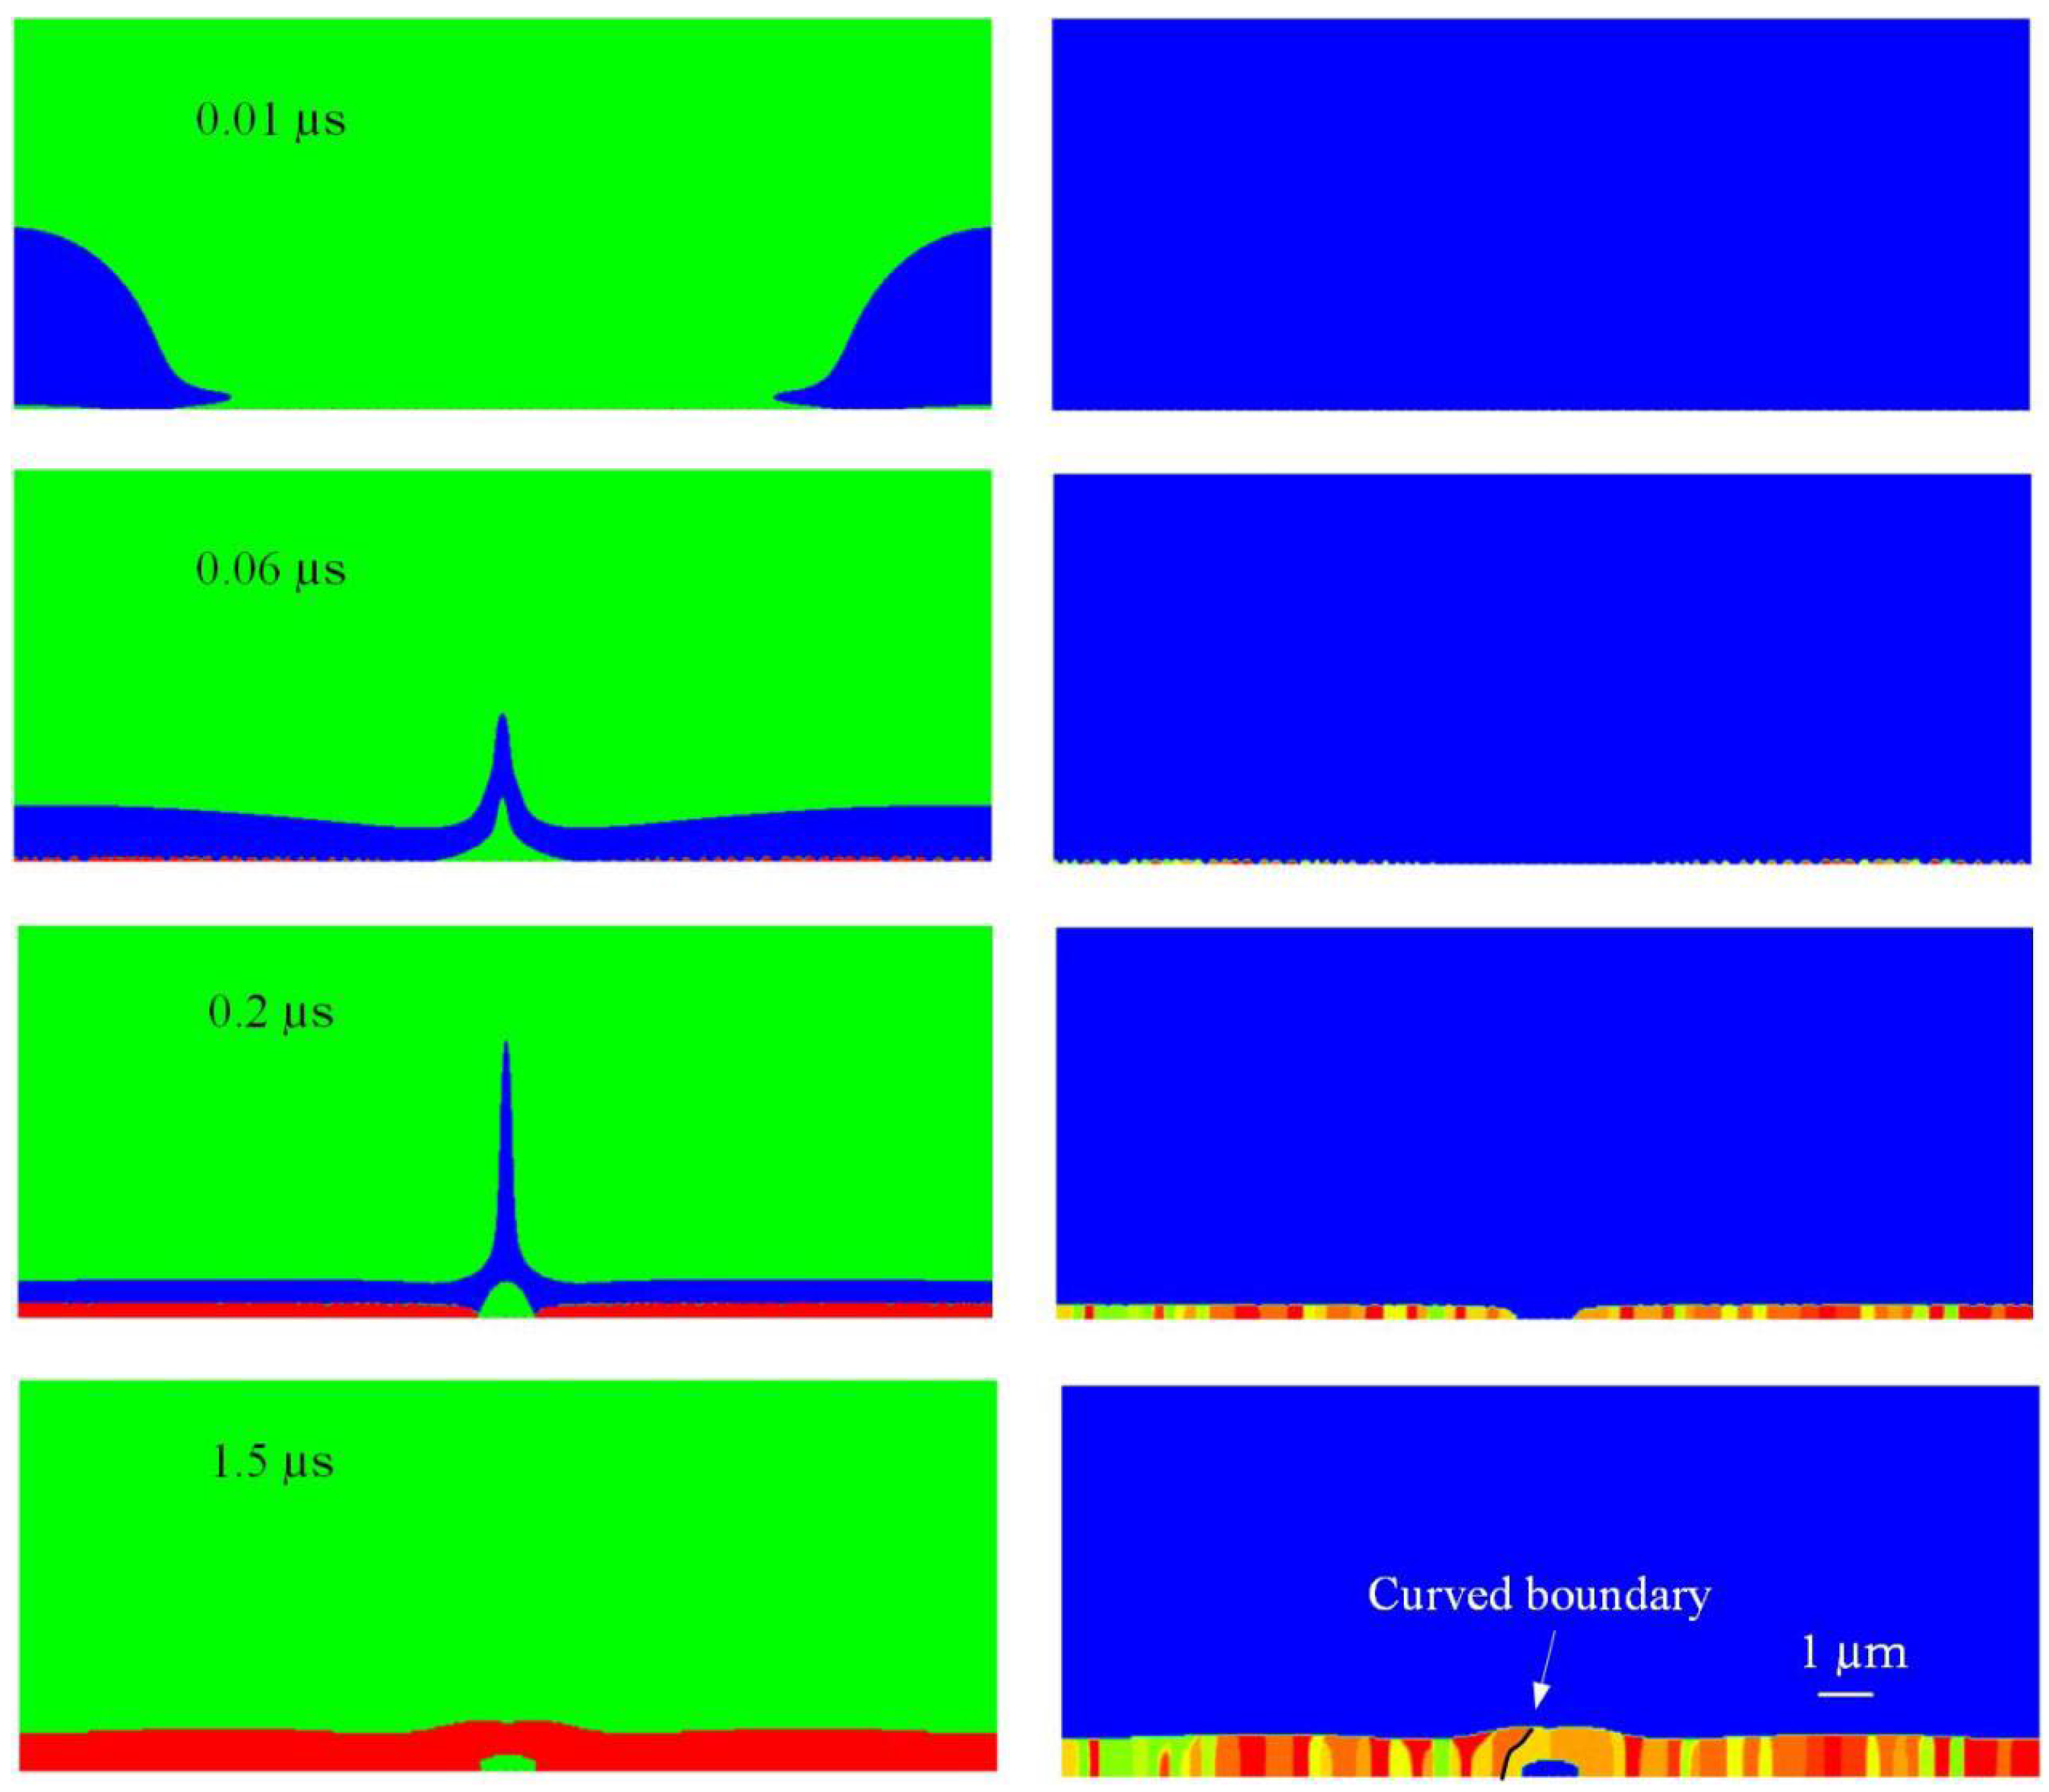
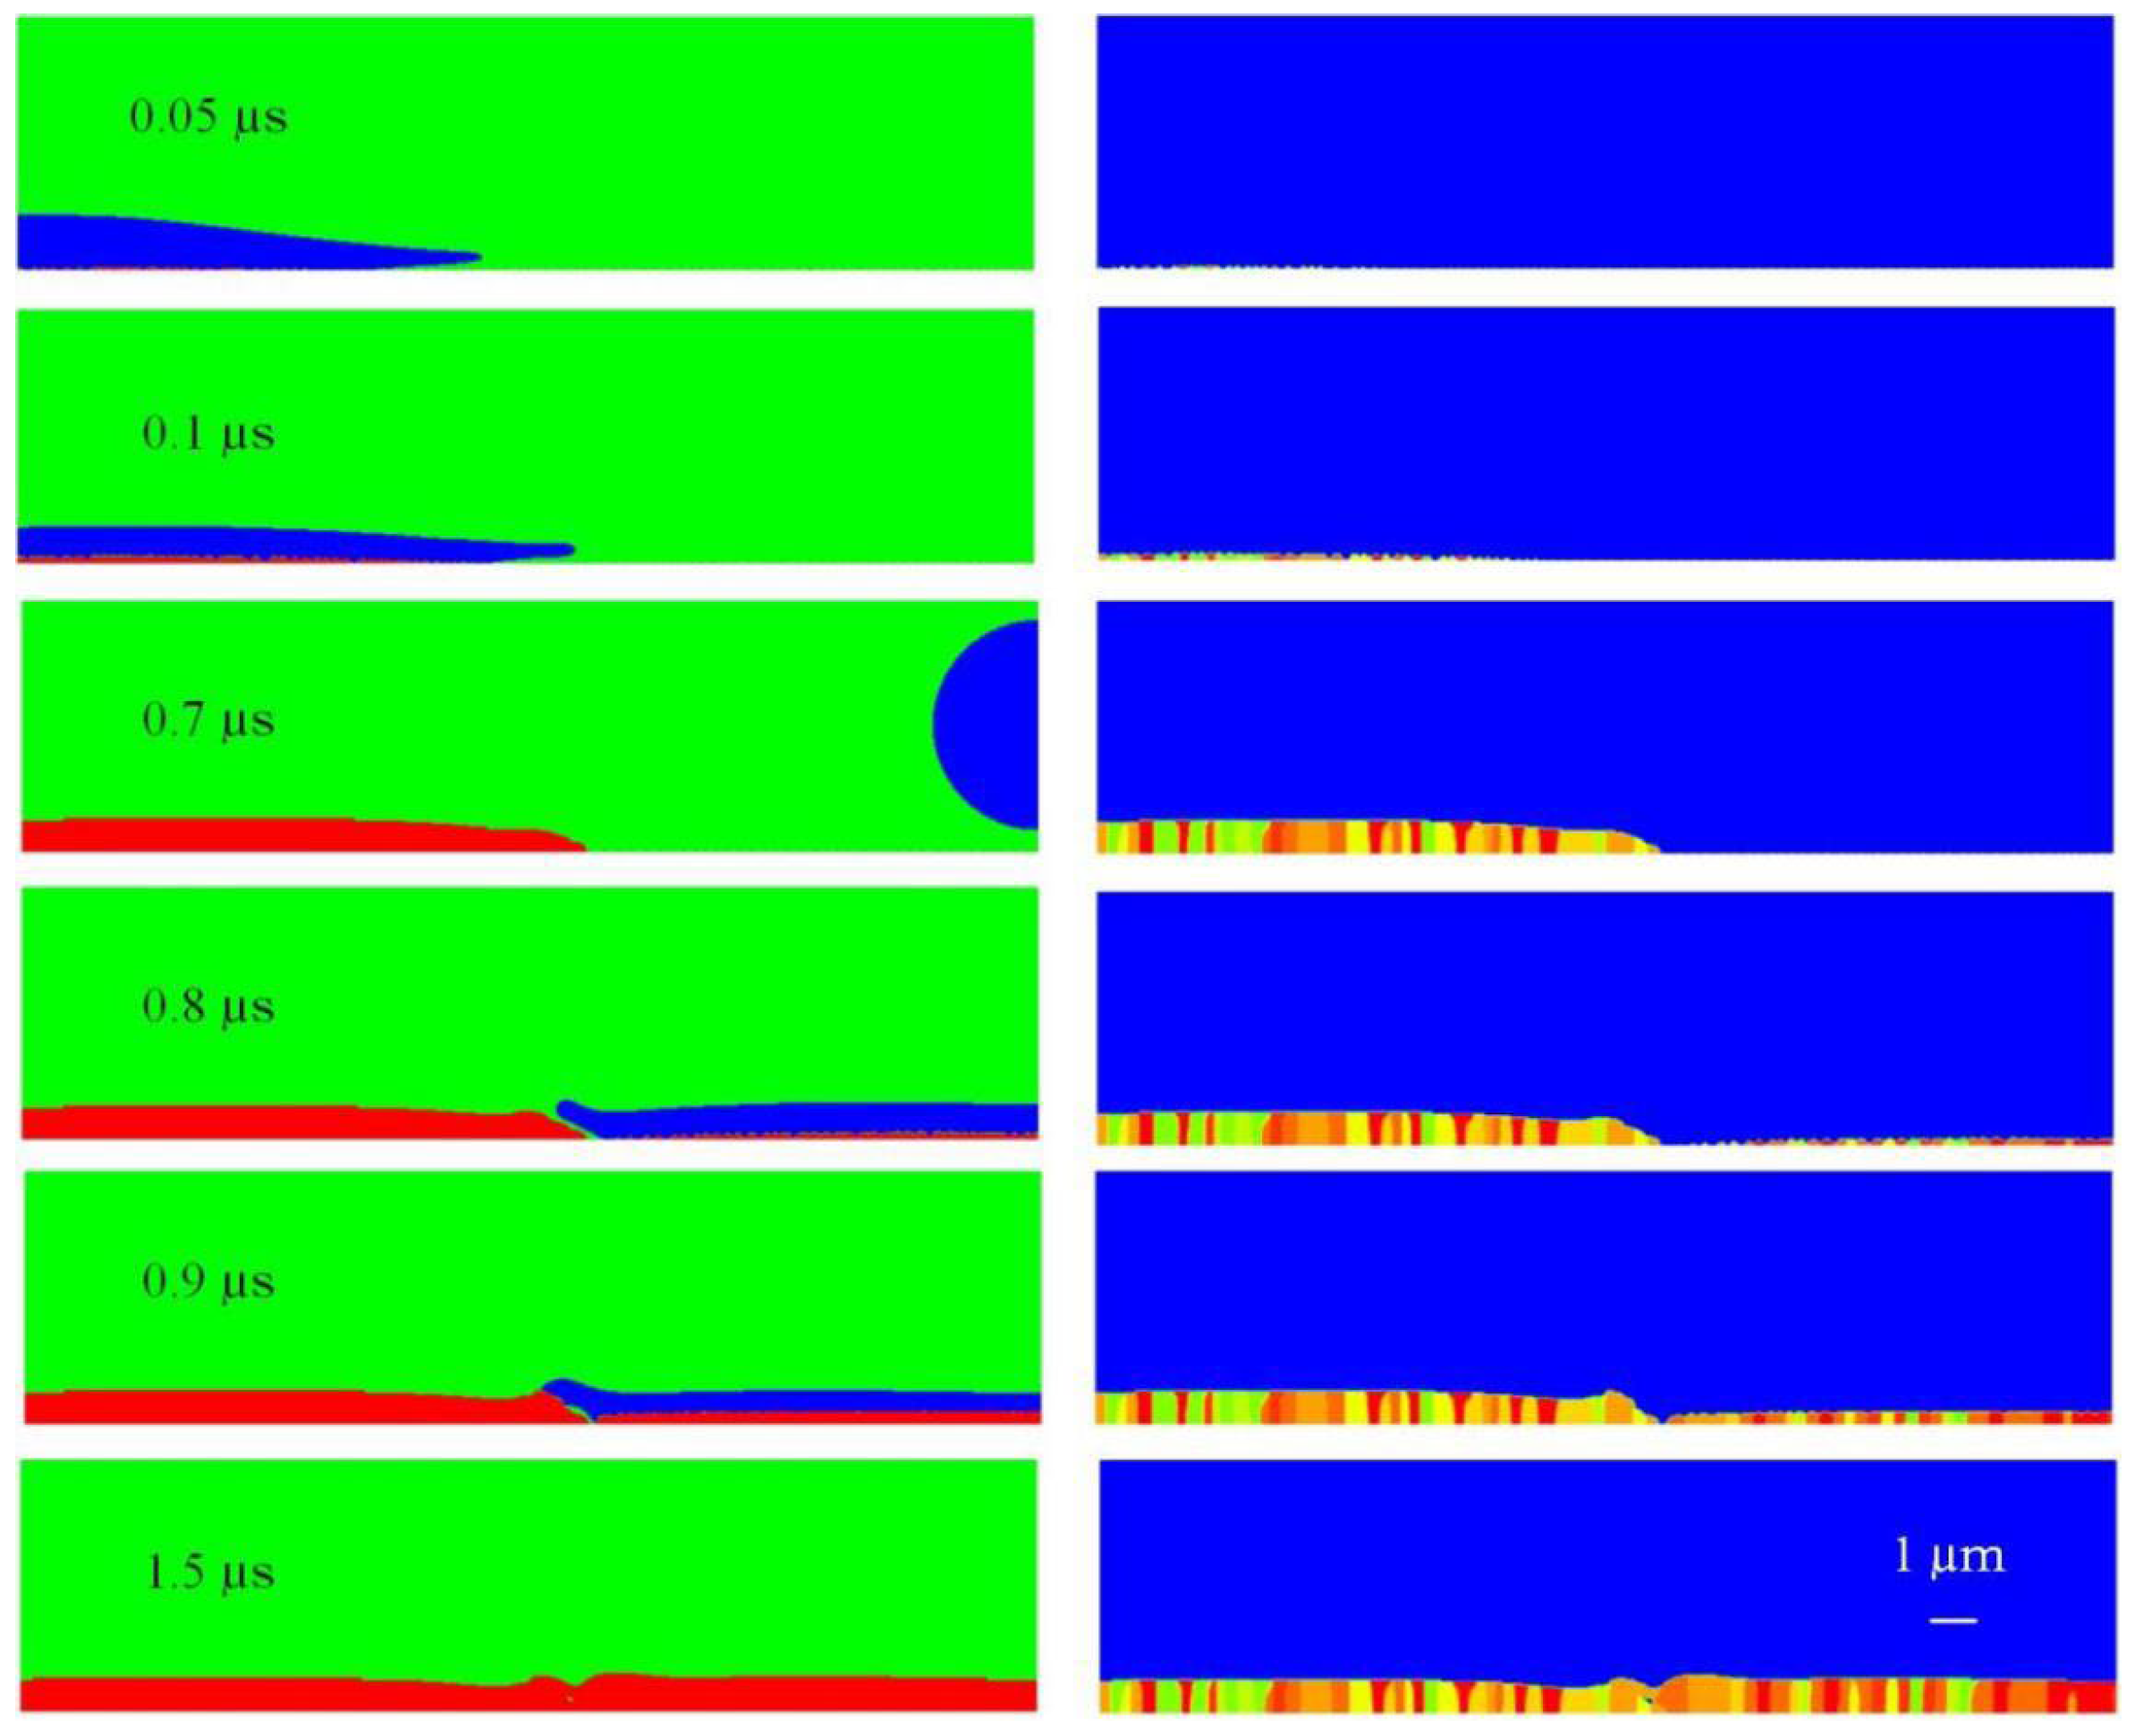
  • When two droplets—initially separated by less than the maximum spread diameter as if one droplet impinged—impact simultaneously onto a solid surface, air would be trapped near the spread front and the grain boundary nearby curved towards the liquid.
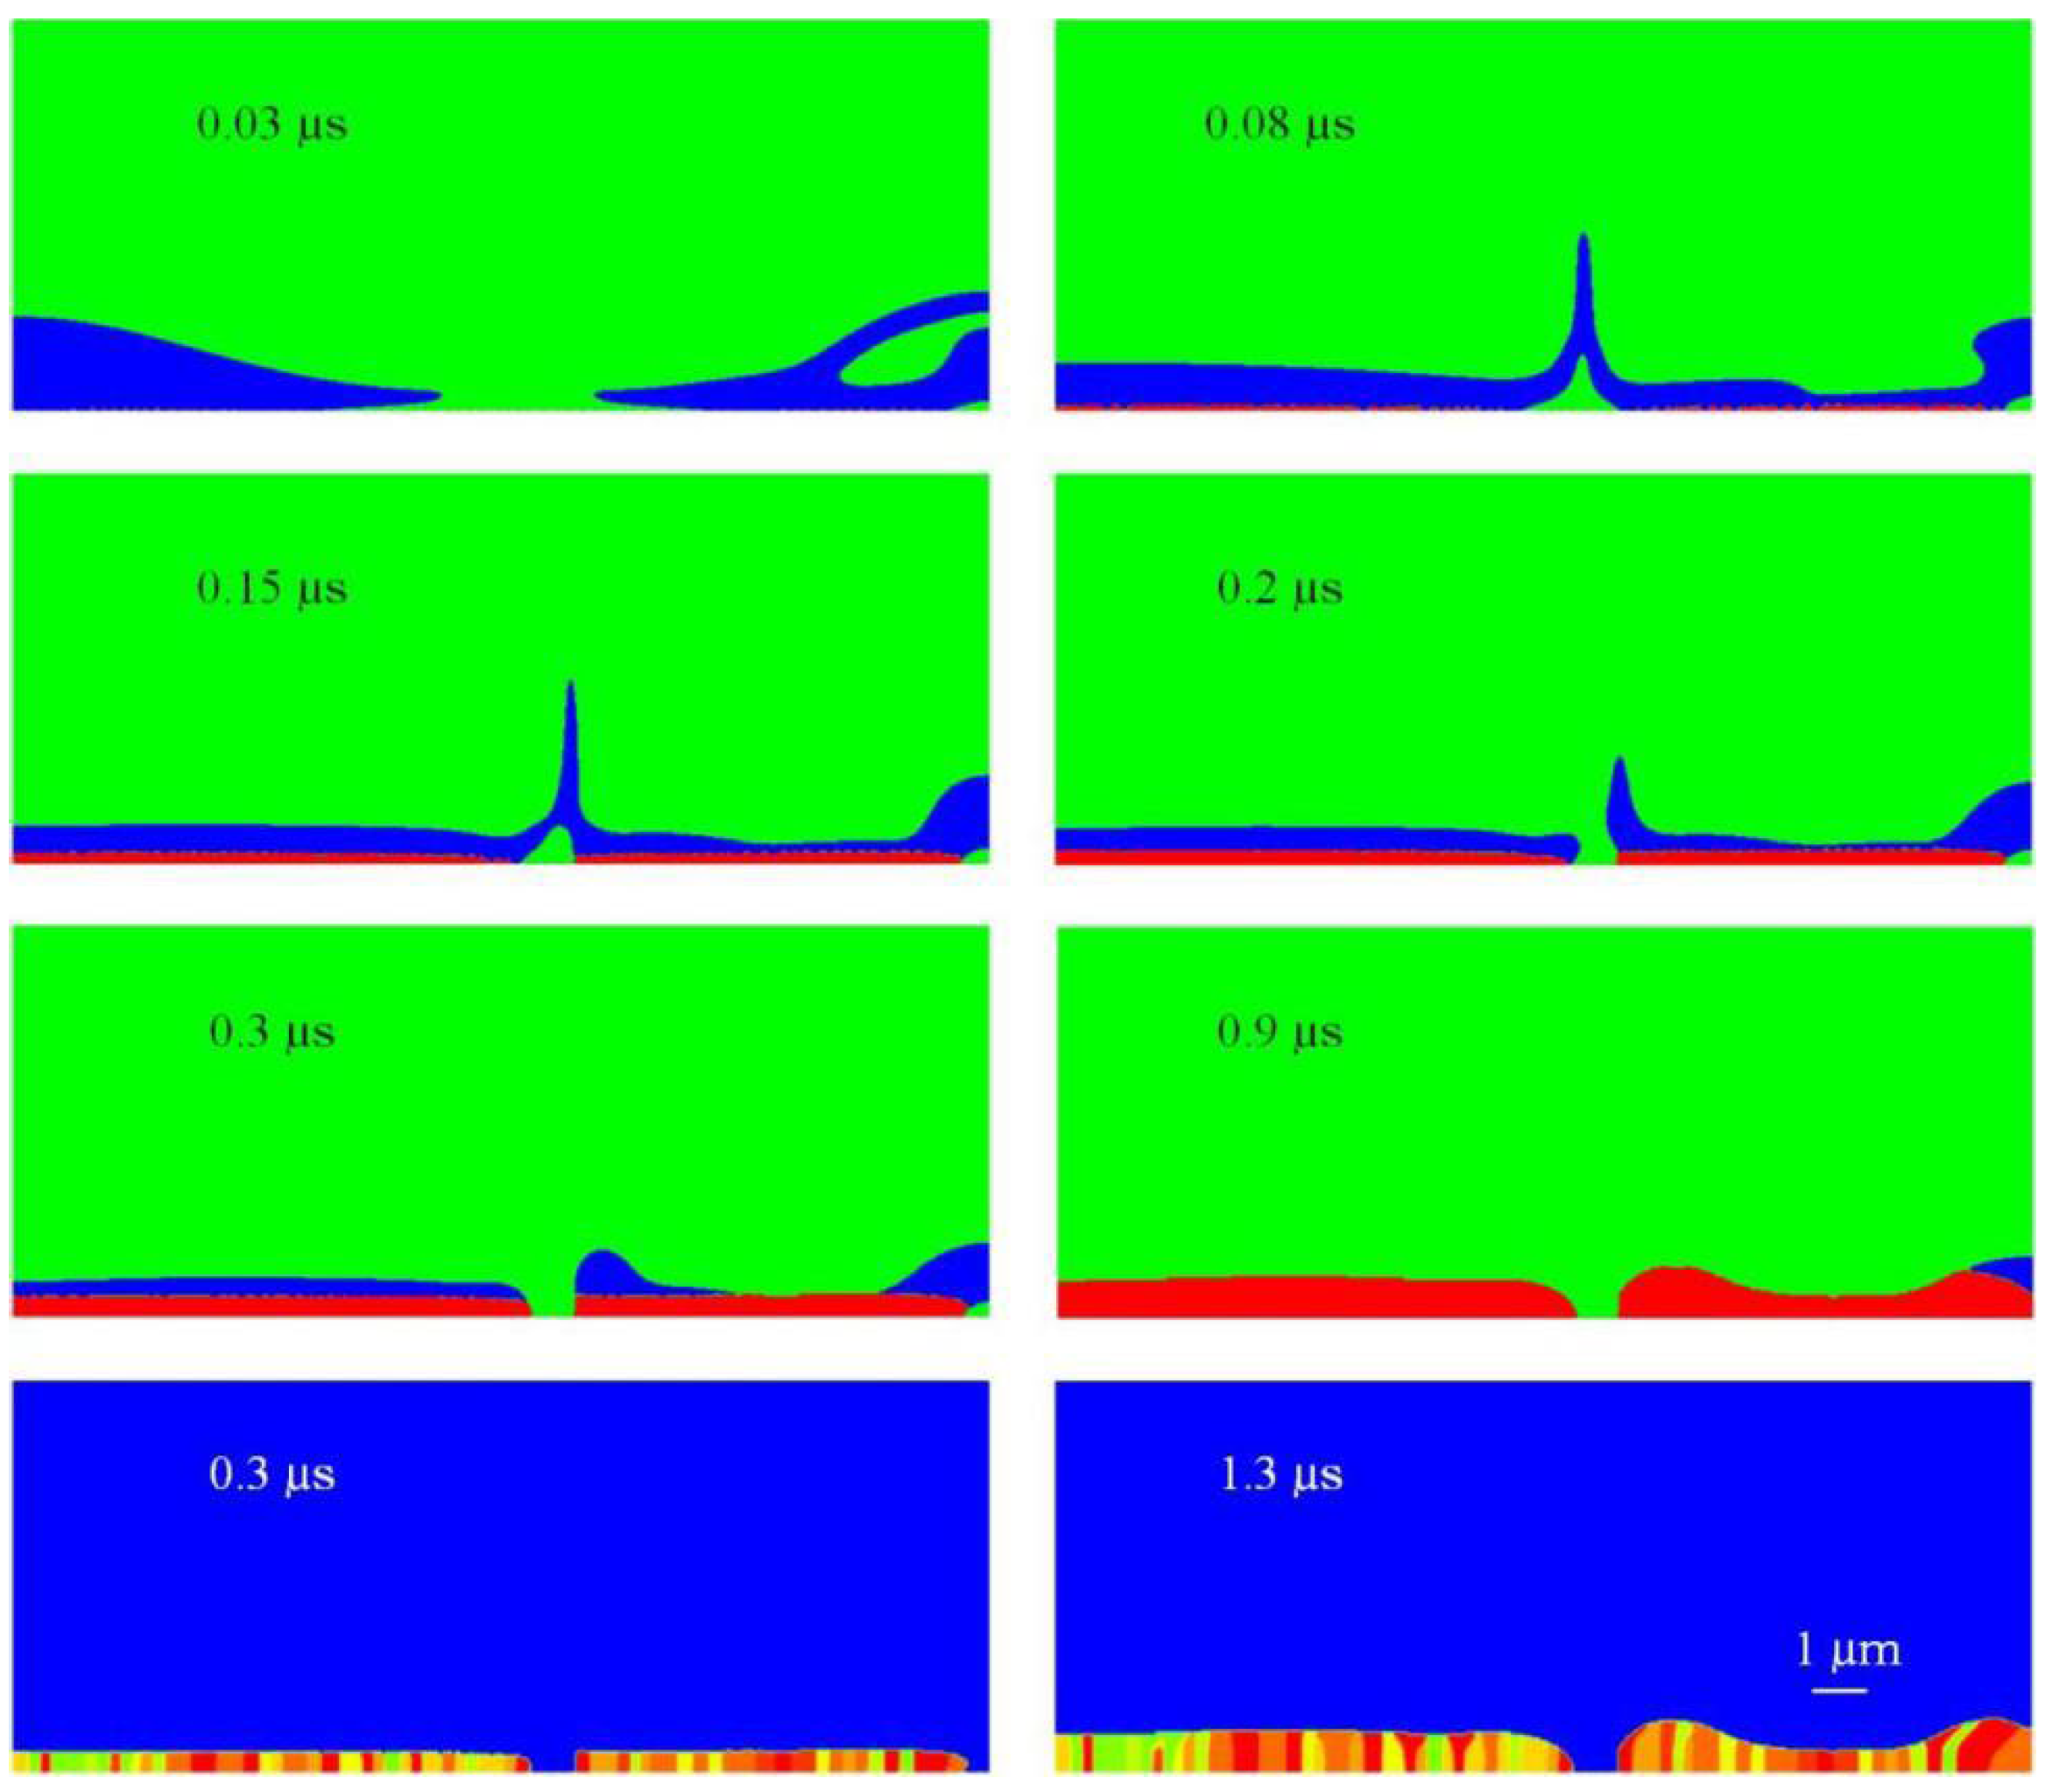
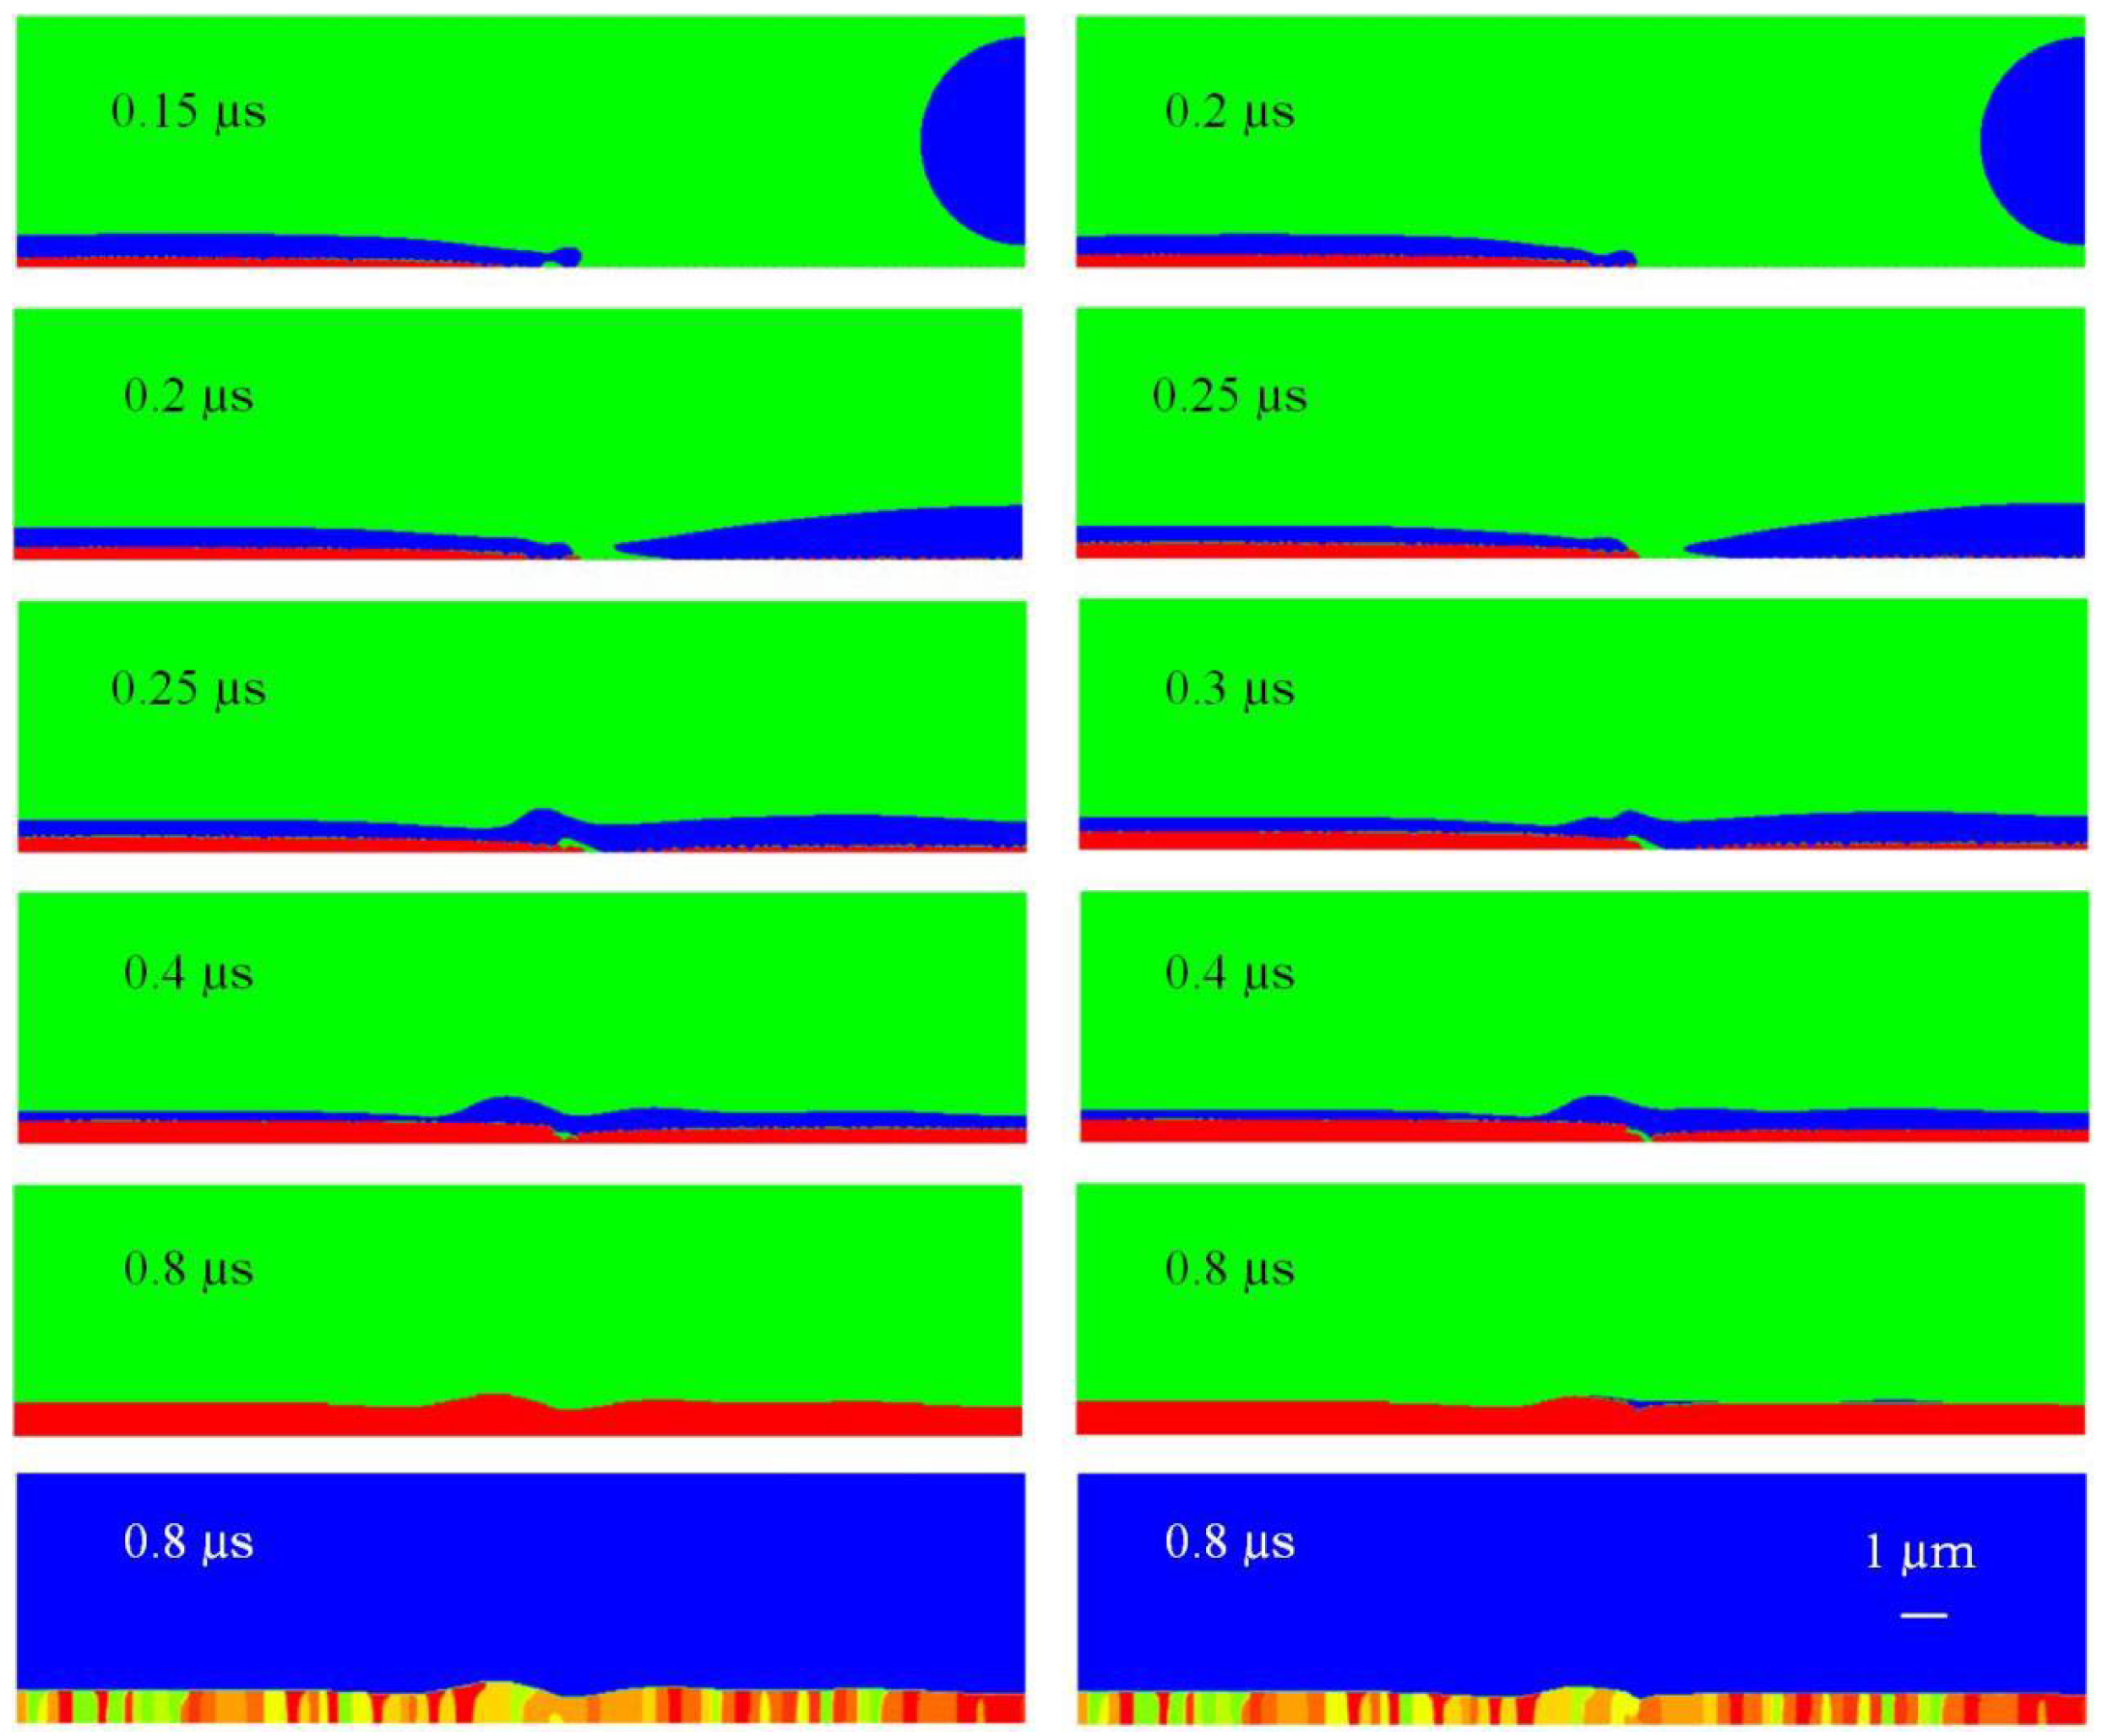
  • If one of the droplets is hollow, then air entrapment may not take place near the spreading front, since the liquid jet of higher kinetic energy—obviously from the dense droplet—when coming close to the less energetic one, may push the oncoming liquid backwards, thus leaving a concave surface on the splat formed by the hollow droplet.
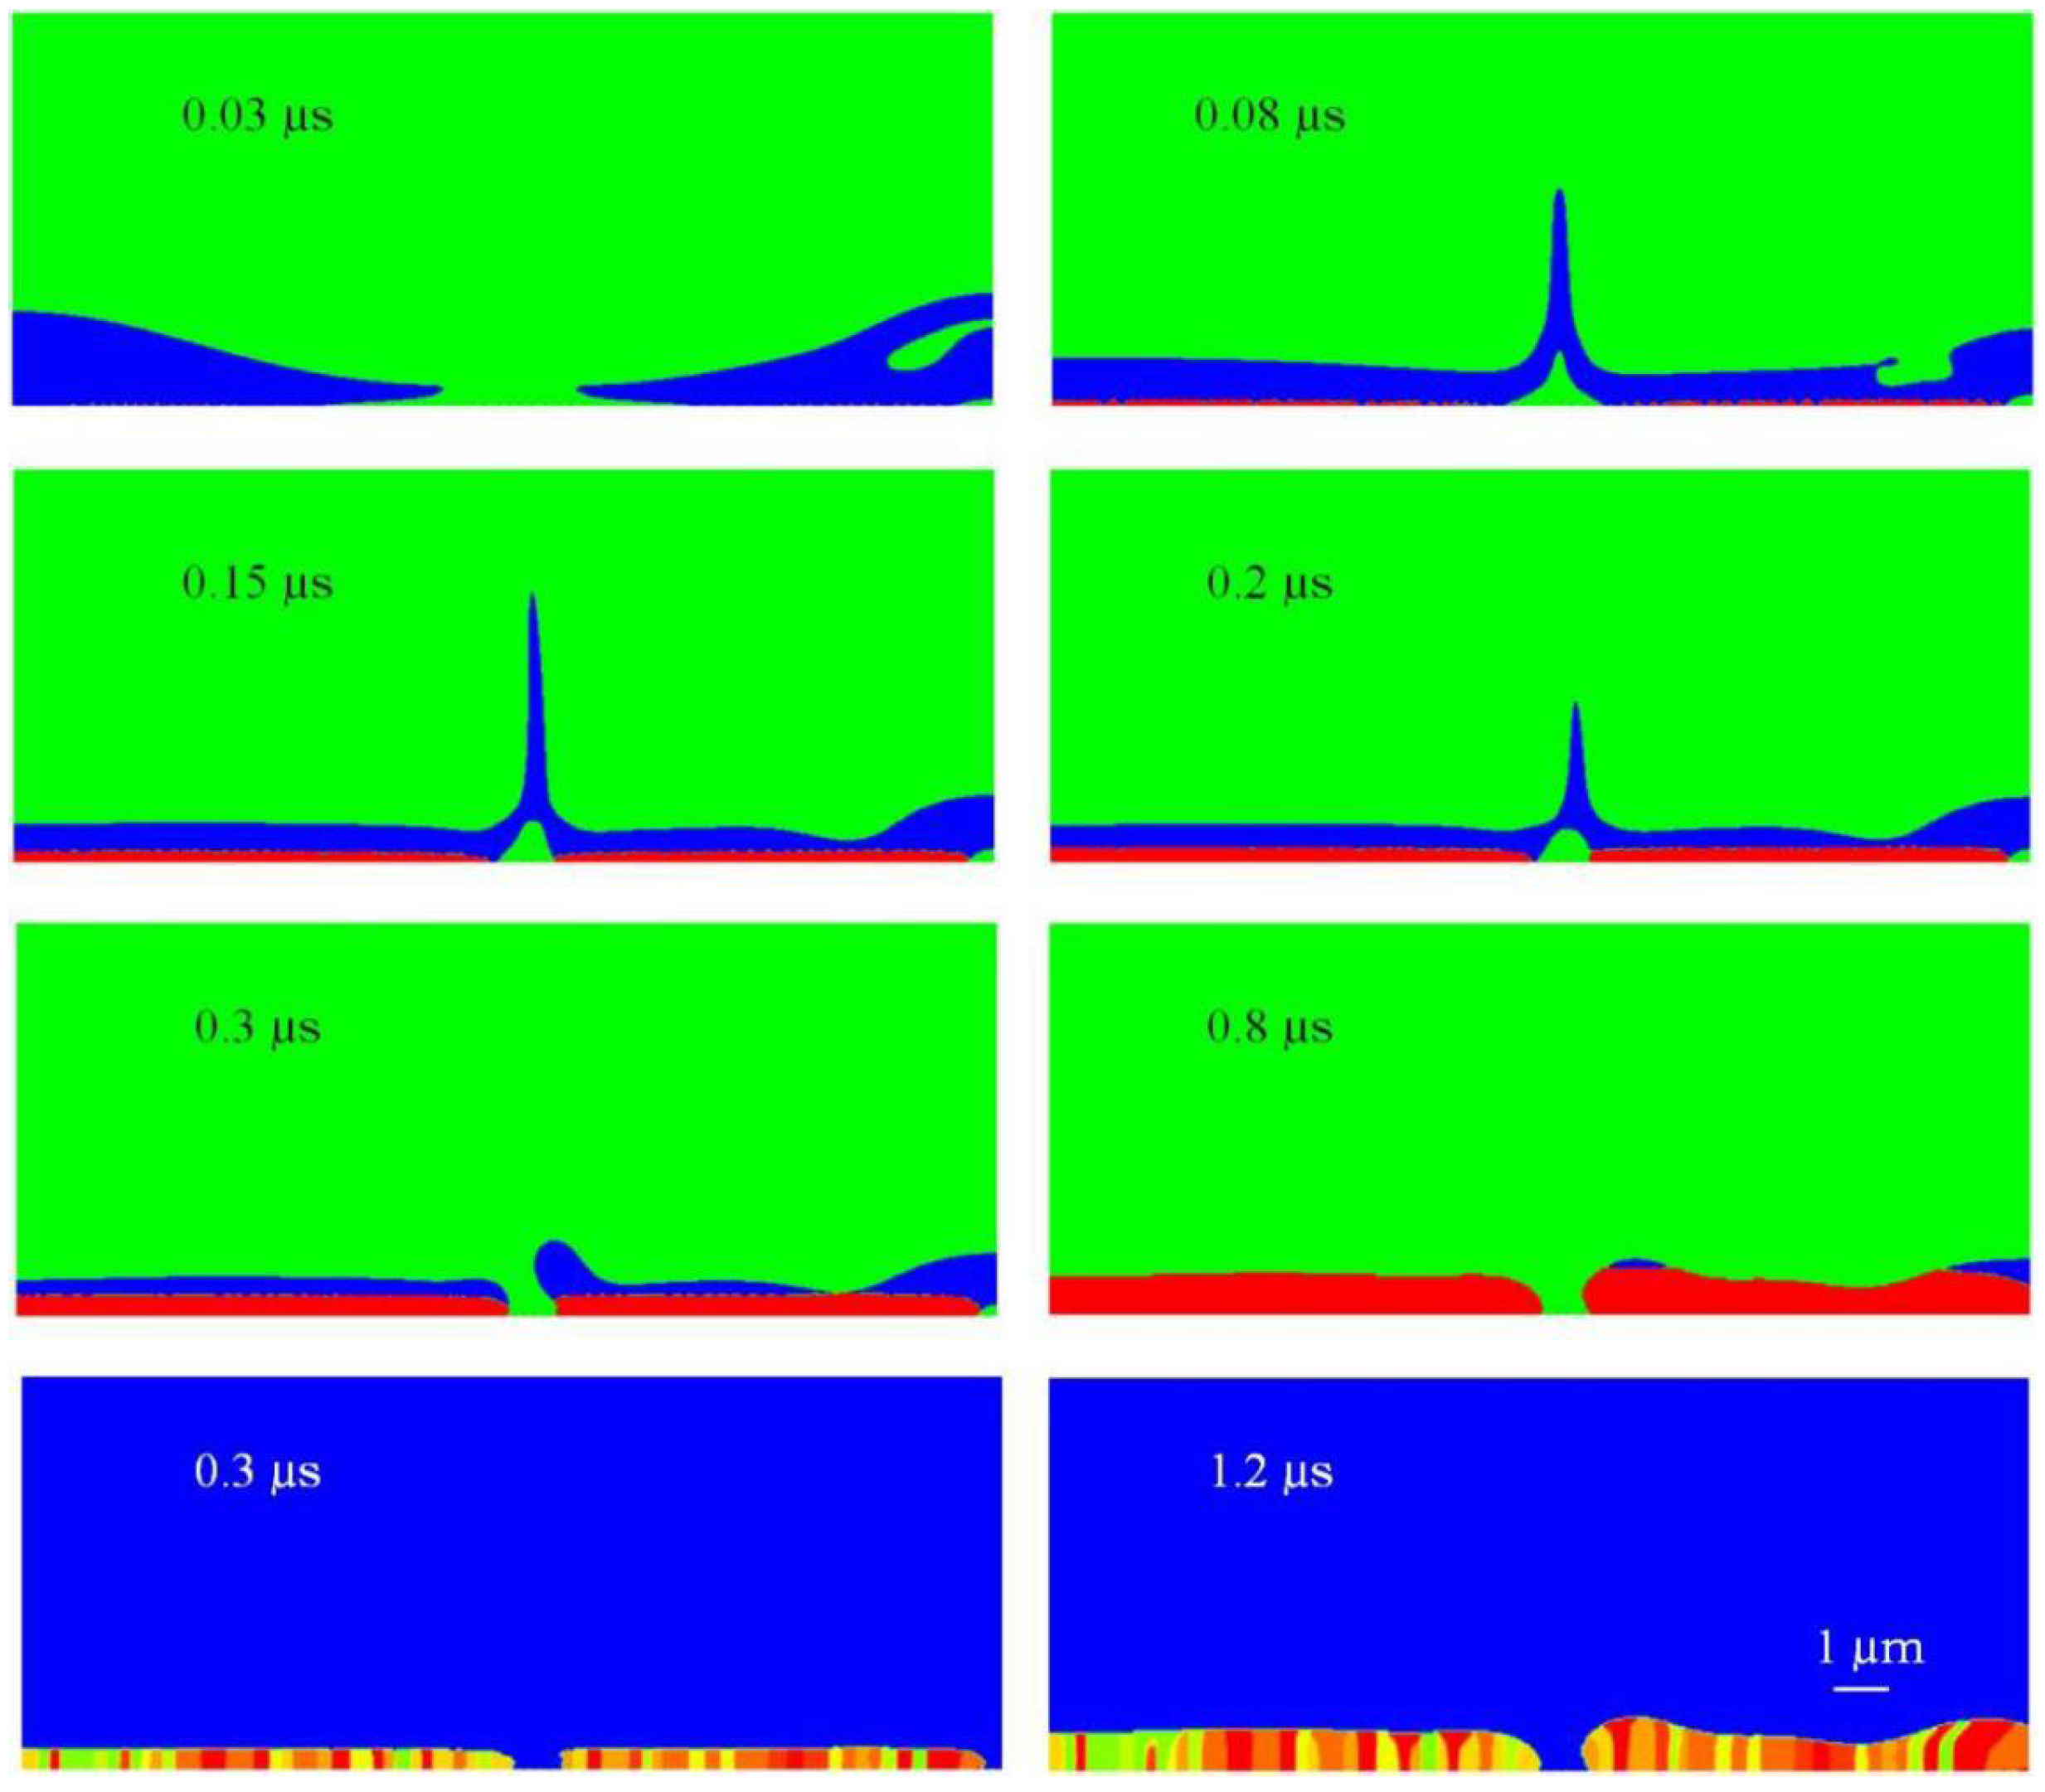
  • Air entrapment can be eliminated if the second droplet is introduced when the first is completely solidified. In the parameters used herein, the horizontal distance between the two droplets should be around 90% of the maximum spread diameter as if one droplet impacted.

Author Contributions

Conceptualization, M.S.; methodology, M.S.; software, M.S.; validation, M.S.; formal analysis, M.S.; investigation, M.S.; resources, M.S.; data curation, M.S.; writing—original draft preparation, M.S.; writing—review and editing, B.Q.L.; visualization, M.S.; supervision, B.Q.L.; project administration, B.Q.L.; funding acquisition, M.S. All authors have read and agreed to the published version of the manuscript.

Funding

This research was funded by the Natural Science Foundation of the Jiangsu Higher Education Institutions of China (Grant No. 21KJB460034).

Institutional Review Board Statement

Not applicable.

Informed Consent Statement

Not applicable.

Data Availability Statement

Not applicable.

Acknowledgments

Thanks go to Yu Wang for constructive discussion and helpful suggestions.

Conflicts of Interest

The authors declare no conflict of interest.

References

  1. Xiong, W.; Cheng, P. Numerical investigation of air entrapment in a molten droplet impacting and solidifying on a cold smooth substrate by 3D lattice Boltzmann method. Int. J. Heat Mass Transf. 2018, 124, 1262–1274. [Google Scholar] [CrossRef]
  2. Kumar, R.; Shukla, R.K.; Kumar, A.; Kumar, A. A computational study on air entrapment and its effect on convective heat transfer during droplet impact on a substrate. Int. J. Therm. Sci. 2020, 153, 106363. [Google Scholar] [CrossRef]
  3. Guo, J.; Zou, S.; Lin, S.; Zhao, B.; Deng, X.; Chen, L. Oblique droplet impact on superhydrophobic surfaces: Jets and bubbles. Phys. Fluids 2020, 32, 122112. [Google Scholar] [CrossRef]
  4. Langley, K.R.; Castrejon-Pita, A.A.; Thoroddsen, S.T. Droplet impacts onto soft solids entrap more air. Soft Matter 2020, 16, 5702–5710. [Google Scholar] [CrossRef] [PubMed]
  5. Nabavizadeh, S.A.; Eshraghi, M.; Felicelli, S.D.; Tewari, S.N.; Grugel, R.N. Effect of bubble-induced Marangoni convection on dendritic solidification. Int. J. Multiph. Flow 2019, 116, 137–152. [Google Scholar] [CrossRef]
  6. Zhang, A.; Du, J.; Zhang, X.; Guo, Z.; Wang, Q.; Xiong, S. Phase-Field Modeling of Microstructure Evolution in the Presence of Bubble During Solidification. Met. Mater. Trans. A 2020, 51, 1023–1037. [Google Scholar] [CrossRef]
  7. Shen, M.; Li, B.Q.; Bai, Y. Numerical modeling of YSZ droplet impact/spreading with solidification microstructure formation in plasma spraying. Int. J. Heat Mass Transf. 2020, 150, 119267. [Google Scholar] [CrossRef]
  8. Shen, M.; Li, B.Q.; Bai, Y. Modeling Microstructure Formation in Yttria-Stabilized Zirconia (YSZ) Droplet with High Impact Velocity in Supersonic Plasma Spray. J. Therm. Spray Technol. 2020, 29, 1695–1707. [Google Scholar] [CrossRef]
  9. Pasandideh-Fard, M.; Pershin, V.; Chandra, S.; Mostaghimi, J. Splat shapes in a plasma spraying coating process: Simulations and experiments. J. Therm. Spray Technol. 2002, 11, 206–217. [Google Scholar] [CrossRef]
  10. Ghafouri-Azar, R.; Shakeri, S.; Chandra, S.; Mostaghimi, J. Interactions between molten metal droplets impinging on a solid surface. Int. J. Heat Mass Transf. 2003, 46, 1395–1407. [Google Scholar] [CrossRef]
  11. Tong, A.Y.; Kasliwal, S.; Fujimoto, H. On the Successive Impingement of Droplets Onto a Substrate. Numer. Heat Transfer Part A Appl. 2007, 52, 531–548. [Google Scholar] [CrossRef]
  12. Le Bot, C.; Vincent, S.; Meillot, E.; Sarret, F.; Caltagirone, J.-P.; Bianchi, L. Numerical simulation of several impacting ceramic droplets with liquid/solid phase change. Surf. Coatings Technol. 2014, 268, 272–277. [Google Scholar] [CrossRef]
  13. Shen, M.; Li, B.Q.; Bai, Y. Numerical investigation of solidification microstructure formation in sequential YSZ droplet impact under supersonic plasma spraying. Int. J. Heat Mass Transf. 2020, 157, 119844. [Google Scholar] [CrossRef]
  14. Chen, H.; Liu, X.; Wang, K.; Liu, H.; Shen, S. Numerical study on dynamic characteristics of double droplets impacting a su-per-hydrophobic tube with different impact velocities. Int. J. Comput. Fluid Dyn. 2019, 33, 22–33. [Google Scholar] [CrossRef]
  15. Chiu, P.-H.; Lin, Y.-T. A conservative phase field method for solving incompressible two-phase flows. J. Comput. Phys. 2011, 230, 185–204. [Google Scholar] [CrossRef]
  16. Zhang, Y.; Matthews, S.; Wu, D.; Zou, Y. Interactions between successive high-velocity impact droplets during plasma spraying. Surf. Coatings Technol. 2021, 431, 128006. [Google Scholar] [CrossRef]
  17. Ray, B.; Biswas, G.; Sharma, A.; Welch, S.W. CLSVOF method to study consecutive drop impact on liquid pool. Int. J. Numer. Methods Heat Fluid Flow 2013, 23, 143–158. [Google Scholar] [CrossRef]
  18. Wang, Y.-B.; Wang, X.-D.; Wang, T.-H.; Yan, W.-M. Asymmetric heat transfer characteristics of a double droplet impact on a moving liquid film. Int. J. Heat Mass Transf. 2018, 126, 649–659. [Google Scholar] [CrossRef]
  19. Fest-Santini, S.; Steigerwald, J.; Santini, M.; Cossali, G.; Weigand, B. Multiple drops impact onto a liquid film: Direct numerical simulation and experimental validation. Comput. Fluids 2021, 214, 104761. [Google Scholar] [CrossRef]
  20. Yamaguchi, M.; Beckermann, C. Simulation of solid deformation during solidification: Shearing and compression of polycrys-talline structures. Acta Mater. 2013, 61, 2268–2280. [Google Scholar] [CrossRef]
  21. Ren, J.-K.; Chen, Y.; Xu, B.; Sun, M.-Y.; Li, D.-Z. A vector-valued phase field model for polycrystalline solidification using operator splitting method. Comput. Mater. Sci. 2019, 163, 37–49. [Google Scholar] [CrossRef]
  22. Ren, J.-K.; Chen, Y.; Cao, Y.-F.; Xu, B.; Sun, M.-Y.; Li, D.-Z. A phase-field simulation of the solidification process under compression. J. Mater. Res. Technol. 2021, 13, 2210–2219. [Google Scholar] [CrossRef]
  23. Mandre, S.; Brenner, M.P. The mechanism of a splash on a dry solid surface. J. Fluid Mech. 2011, 690, 148–172. [Google Scholar] [CrossRef]
  24. Li, C.-J.; Li, J.-L. Transient Contact Pressure During Flattening of Thermal Spray Droplet and Its Effect on Splat Formation. J. Therm. Spray Technol. 2004, 13, 229–238. [Google Scholar] [CrossRef]
  25. Hicks, P.D.; Ermanyuk, E.V.; Gavrilov, N.V.; Purvis, R. Air trapping at impact of a rigid sphere onto a liquid. J. Fluid Mech. 2012, 695, 310–320. [Google Scholar] [CrossRef]
  26. Liu, Y.; Tan, P.; Xu, L. Compressible air entrapment in high-speed drop impacts on solid surfaces. J. Fluid Mech. 2013, 716, 716. [Google Scholar] [CrossRef] [Green Version]
  27. Thoroddsen, S.T.; Etoh, T.G.; Takehara, K. Air entrapment under an impacting drop. J. Fluid Mech. 2003, 478, 125–134. [Google Scholar] [CrossRef]
  28. Thoroddsen, S.T.; Etoh, T.G.; Takehara, K.; Ootsuka, N.; Hatsuki, Y. The air bubble entrapped under a drop impacting on a solid surface. J. Fluid Mech. 2005, 545, 203–212. [Google Scholar] [CrossRef]
  29. Karma, A.; Rappel, W.-J. Quantitative phase-field modeling of dendritic growth in two and three dimensions. Phys. Rev. E 1998, 57, 4323–4349. [Google Scholar] [CrossRef] [Green Version]
  30. Kang, C.-W.; Tan, J.K.; Pan, L.; Low, C.Y.; Jaffar, A. Numerical and experimental investigations of splat geometric characteristics during oblique impact of plasma spraying. Appl. Surf. Sci. 2011, 257, 10363–10372. [Google Scholar] [CrossRef]
  31. Shukla, R.K.; Patel, V.; Kumar, A. Modeling of rapid solidification with undercooling effect during droplet flattening on a sub-strate in coating formation. J. Therm. Spray Technol. 2018, 27, 269–287. [Google Scholar] [CrossRef]
  32. Yue, P.; Zhou, C.; Feng, J.J. Sharp-interface limit of the Cahn–Hilliard model for moving contact lines. J. Fluid Mech. 2010, 645, 279–294. [Google Scholar] [CrossRef] [Green Version]
  33. Aziz, S.D.; Chandra, S. Impact, recoil and splashing of molten metal droplets. Int. J. Heat Mass Transf. 2000, 43, 2841–2857. [Google Scholar] [CrossRef]
  34. Wang, Y.; Bai, Y.; Wu, K.; Zhou, J.; Shen, M.; Fan, W.; Chen, H.; Kang, Y.; Li, B. Flattening and solidification behavior of in-flight droplets in plasma spraying and micro/macro-bonding mechanisms. J. Alloys Compd. 2019, 784, 834–846. [Google Scholar] [CrossRef]
  35. Gulyaev, I.; Solonenko, O.P.; Gulyaev, P.; Smirnov, A. Hydrodynamic features of the impact of a hollow spherical drop on a flat surface. Technol. Phys. Lett. 2009, 35, 885–888. [Google Scholar] [CrossRef]
  36. Baldelli, A.; Power, R.M.; Miles, R.E.; Reid, J.P.; Vehring, R. Effect of crystallization kinetics on the properties of spray dried mi-croparticles. Aerosol Sci. Technol. 2016, 50, 693–704. [Google Scholar] [CrossRef] [Green Version]
  37. Vehring, R.; Foss, W.R.; Lechuga-Ballesteros, D. Particle formation in spray drying. J. Aerosol Sci. 2007, 38, 728–746. [Google Scholar] [CrossRef]
  38. Li, D.; Zhang, D.; Zheng, Z. Numerical analysis of hollow droplet impacts on a dry flat surface. Int. J. Heat Mass Transf. 2018, 129, 753–763. [Google Scholar] [CrossRef]
  39. Solonenko, O.P.; Gulyaev, I.; Smirnov, A. Plasma processing and deposition of powdered metal oxides consisting of hollow spherical particles. Technol. Phys. Lett. 2008, 34, 1050–1052. [Google Scholar] [CrossRef]
  40. Kumar, A.; Gu, S.; Tabbara, H.; Kamnis, S. Study of impingement of hollow ZrO2 droplets onto a substrate. Surf. Coatings Technol. 2013, 220, 164–169. [Google Scholar] [CrossRef]
Figure 1. Problem schematic with boundary conditions defined. (a) is the initial configuration and (b) is of some time later.
Coatings 12 01990 g001
Figure 2. Dynamics of air entrapment: (a) Initially, the droplet resides y away from the substrate; (b) compression just begins; (c) the first contact. L0 is the initial contact radius, different from L.
Coatings 12 01990 g002
Figure 3. Estimate of the horizontal length scale L. The red denotes the contour of the drop and the blue signifies that of the substrate.
Coatings 12 01990 g003
Figure 4. Estimate of height H * . The sound speed in the gas is denoted by c. The solid green line denotes the drop bottom. The solid and dashed green lines constitute a control volume.
Coatings 12 01990 g004
Figure 5. Enclosure of the bubble. (a) marks the appearance of the lamella and (b) shows when the lamella touches the substrate for the first time.
Coatings 12 01990 g005
Figure 6. The second stage of compression.
Coatings 12 01990 g006
Figure 7. A half-staggered grid. ψ stores other variables such as temperature, and u and v are velocity components in the horizontal and the vertical directions, respectively.
Coatings 12 01990 g007
Figure 8. Validation of the model. The experimental photographs are taken from Aziz et al. Reprinted with permission from Ref. [29] Copyright Phys. Rev. E 1998, where (a) is of experimental results, (b) is of drop profile and (c) is of pressure distribution, measured in Pa.
Coatings 12 01990 g008
Figure 9. Spread factor evolution for the Tin drop impact. The standard error is shown as well.
Coatings 12 01990 g009
Figure 10. Typical binary droplet impact under plasma spraying conditions. In the left column, red denotes solid, green gas, and blue liquid. In the right column, blue signifies fluid while the others represent crystals of distinct orientations.
Coatings 12 01990 g010
Figure 11. Temperature distribution at particular instants.
Coatings 12 01990 g011
Figure 12. Air entrapment suppression in binary droplet impact with one being hollow.
Coatings 12 01990 g012
Figure 13. Effect of void size in the hollow droplet.
Coatings 12 01990 g013
Figure 14. Sequential droplet impact with well bonding.
Coatings 12 01990 g014
Figure 15. Effect of the set-in time of the second droplet.
Coatings 12 01990 g015
Table 1. Thermophysical quantities used in simulations.
YSZAirSubstrate
Density ( kg / m 3 )5890 [30] 1 . 18 8400
Specific heat ( J / kg · K )713 [31]1006575
Thermal conductivity ( W / m · K )2.32 [31]0.026318.8
Viscosity ( mPa · s )27.8 [29]0.0185-
Surface tension (N/m)0.43 [31]--
Latent heat of fusion ( kJ / kg ) 707 [31]--
Melting point (K)2923--
Anisotropic strength ε 4 0.01--
Contact angle120°--
Table 2. Fitting parameters in the phase field model.
ParameterValueParameterValue
ξ 1.25 x ε ˜ ϕ = s 1.25 x
C n = ξ / L c 0.0104 τ θ τ ˜ ϕ
M ξ 2 / 16 μ e [32] ε θ ~ 10 3 ε ˜ ϕ
λ a 1 ε ˜ ϕ / d 0 [29] μ 10 3
τ ˜ ϕ a 2 λ ε ˜ ϕ 2 / D [29] β 10 5
Publisher’s Note: MDPI stays neutral with regard to jurisdictional claims in published maps and institutional affiliations.

