
The Initial Corrosion Behavior of 20# Steel under the CO2/Aqueous Solution Gas–Liquid Two-Phase Bubble Flow Condition
Abstract
:1. Introduction
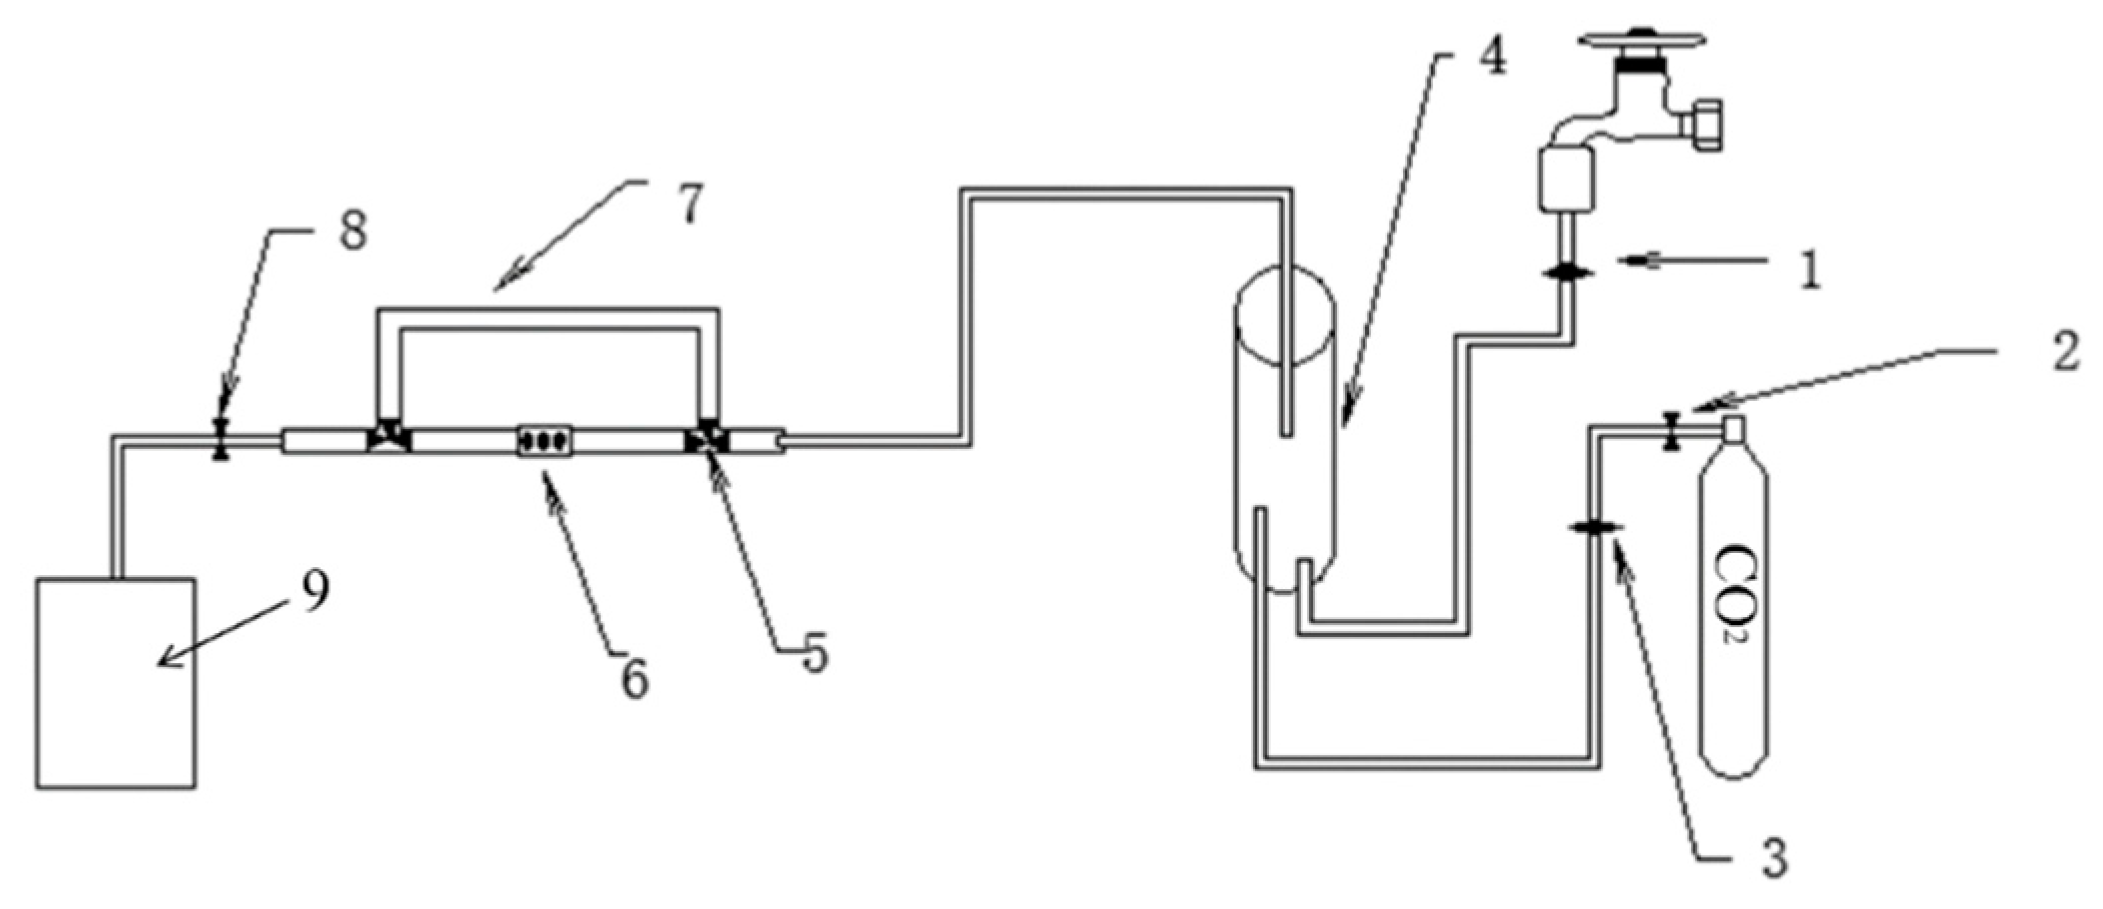
2. Experimental
3. Results and Discussion
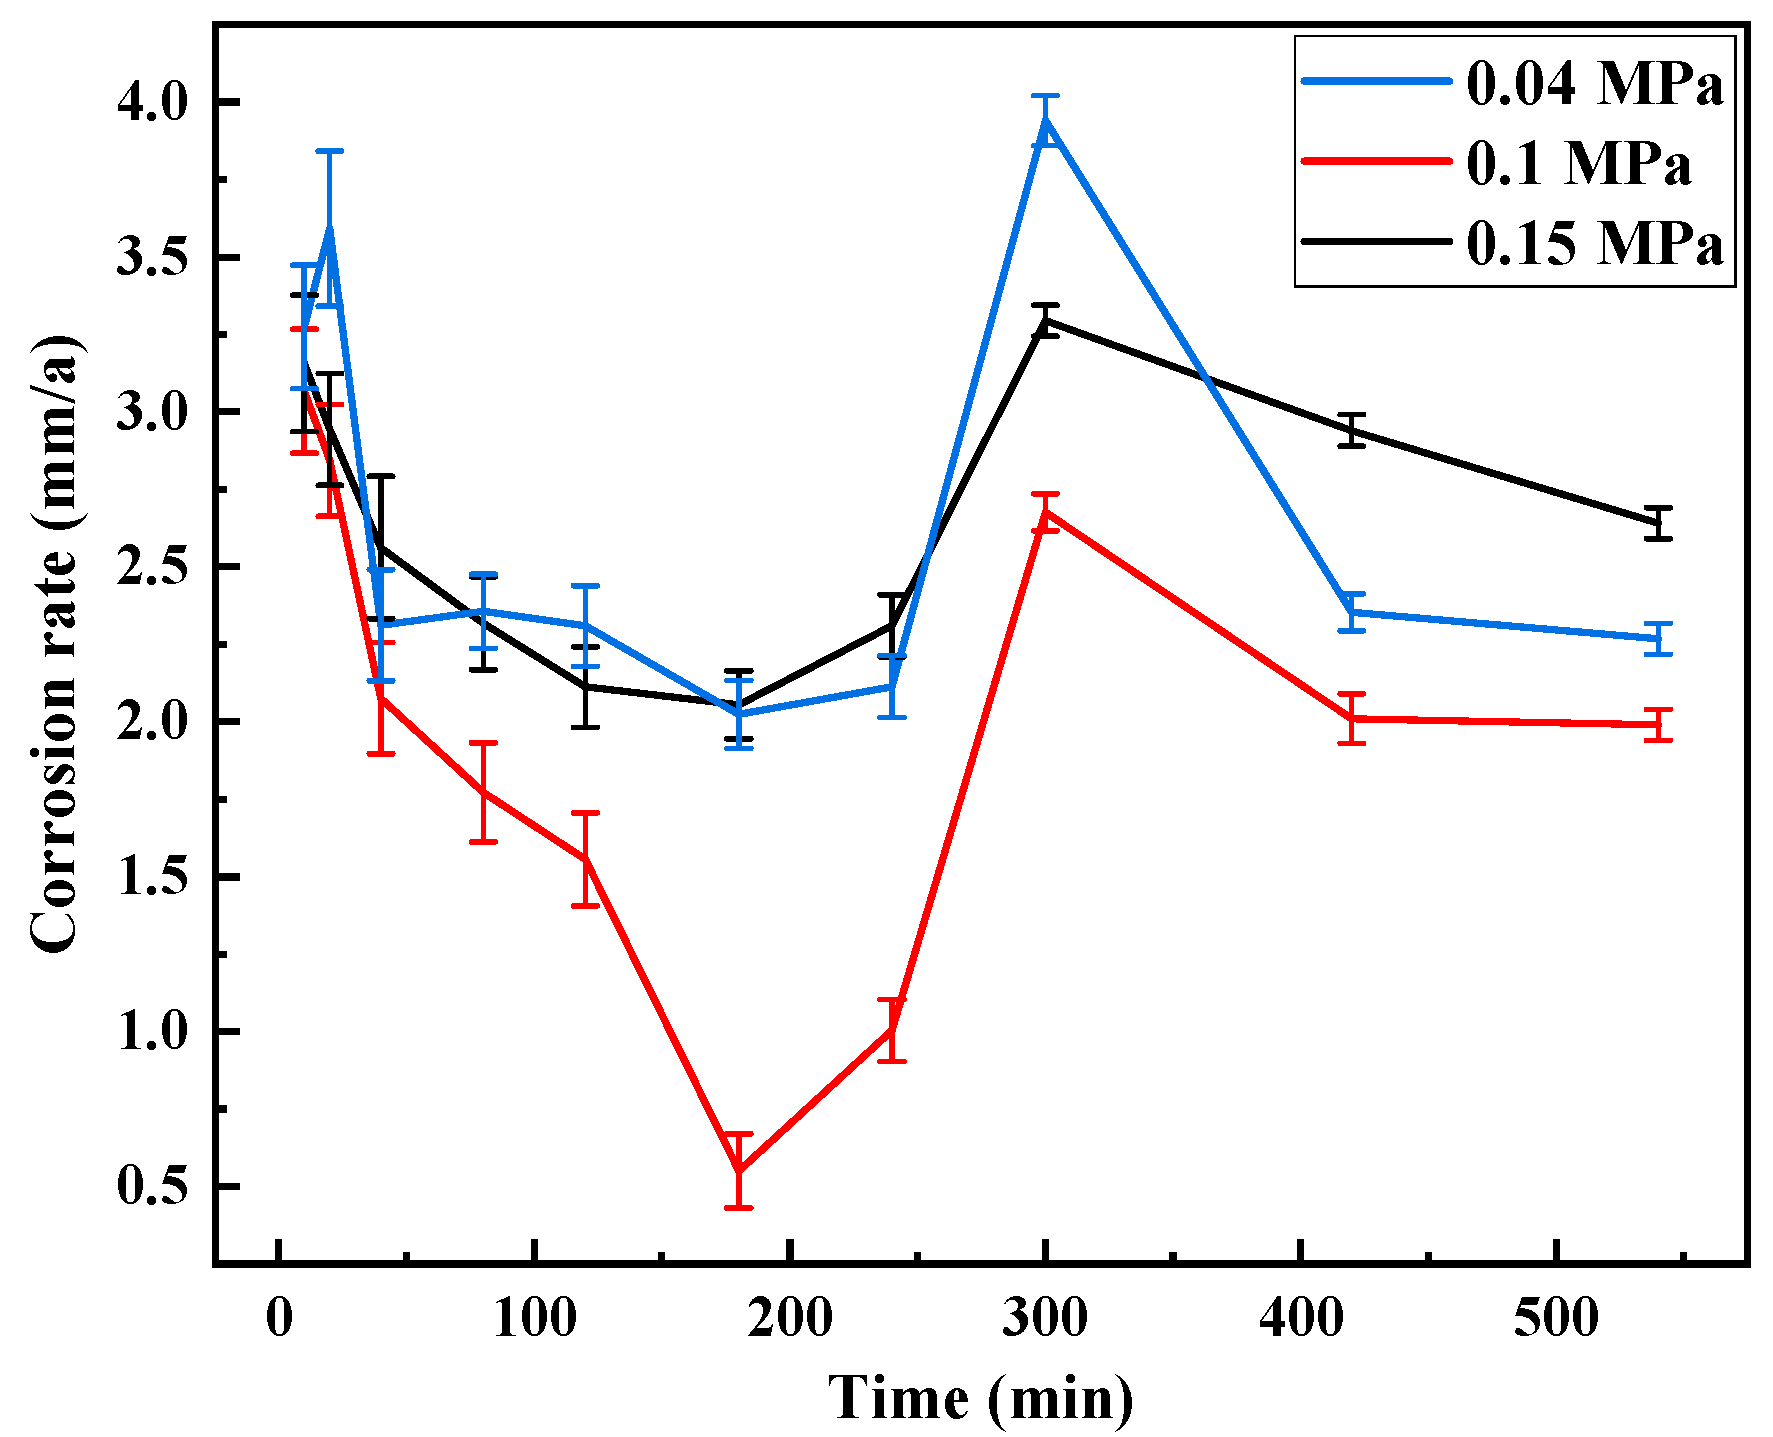
3.1. Corrosion Rate
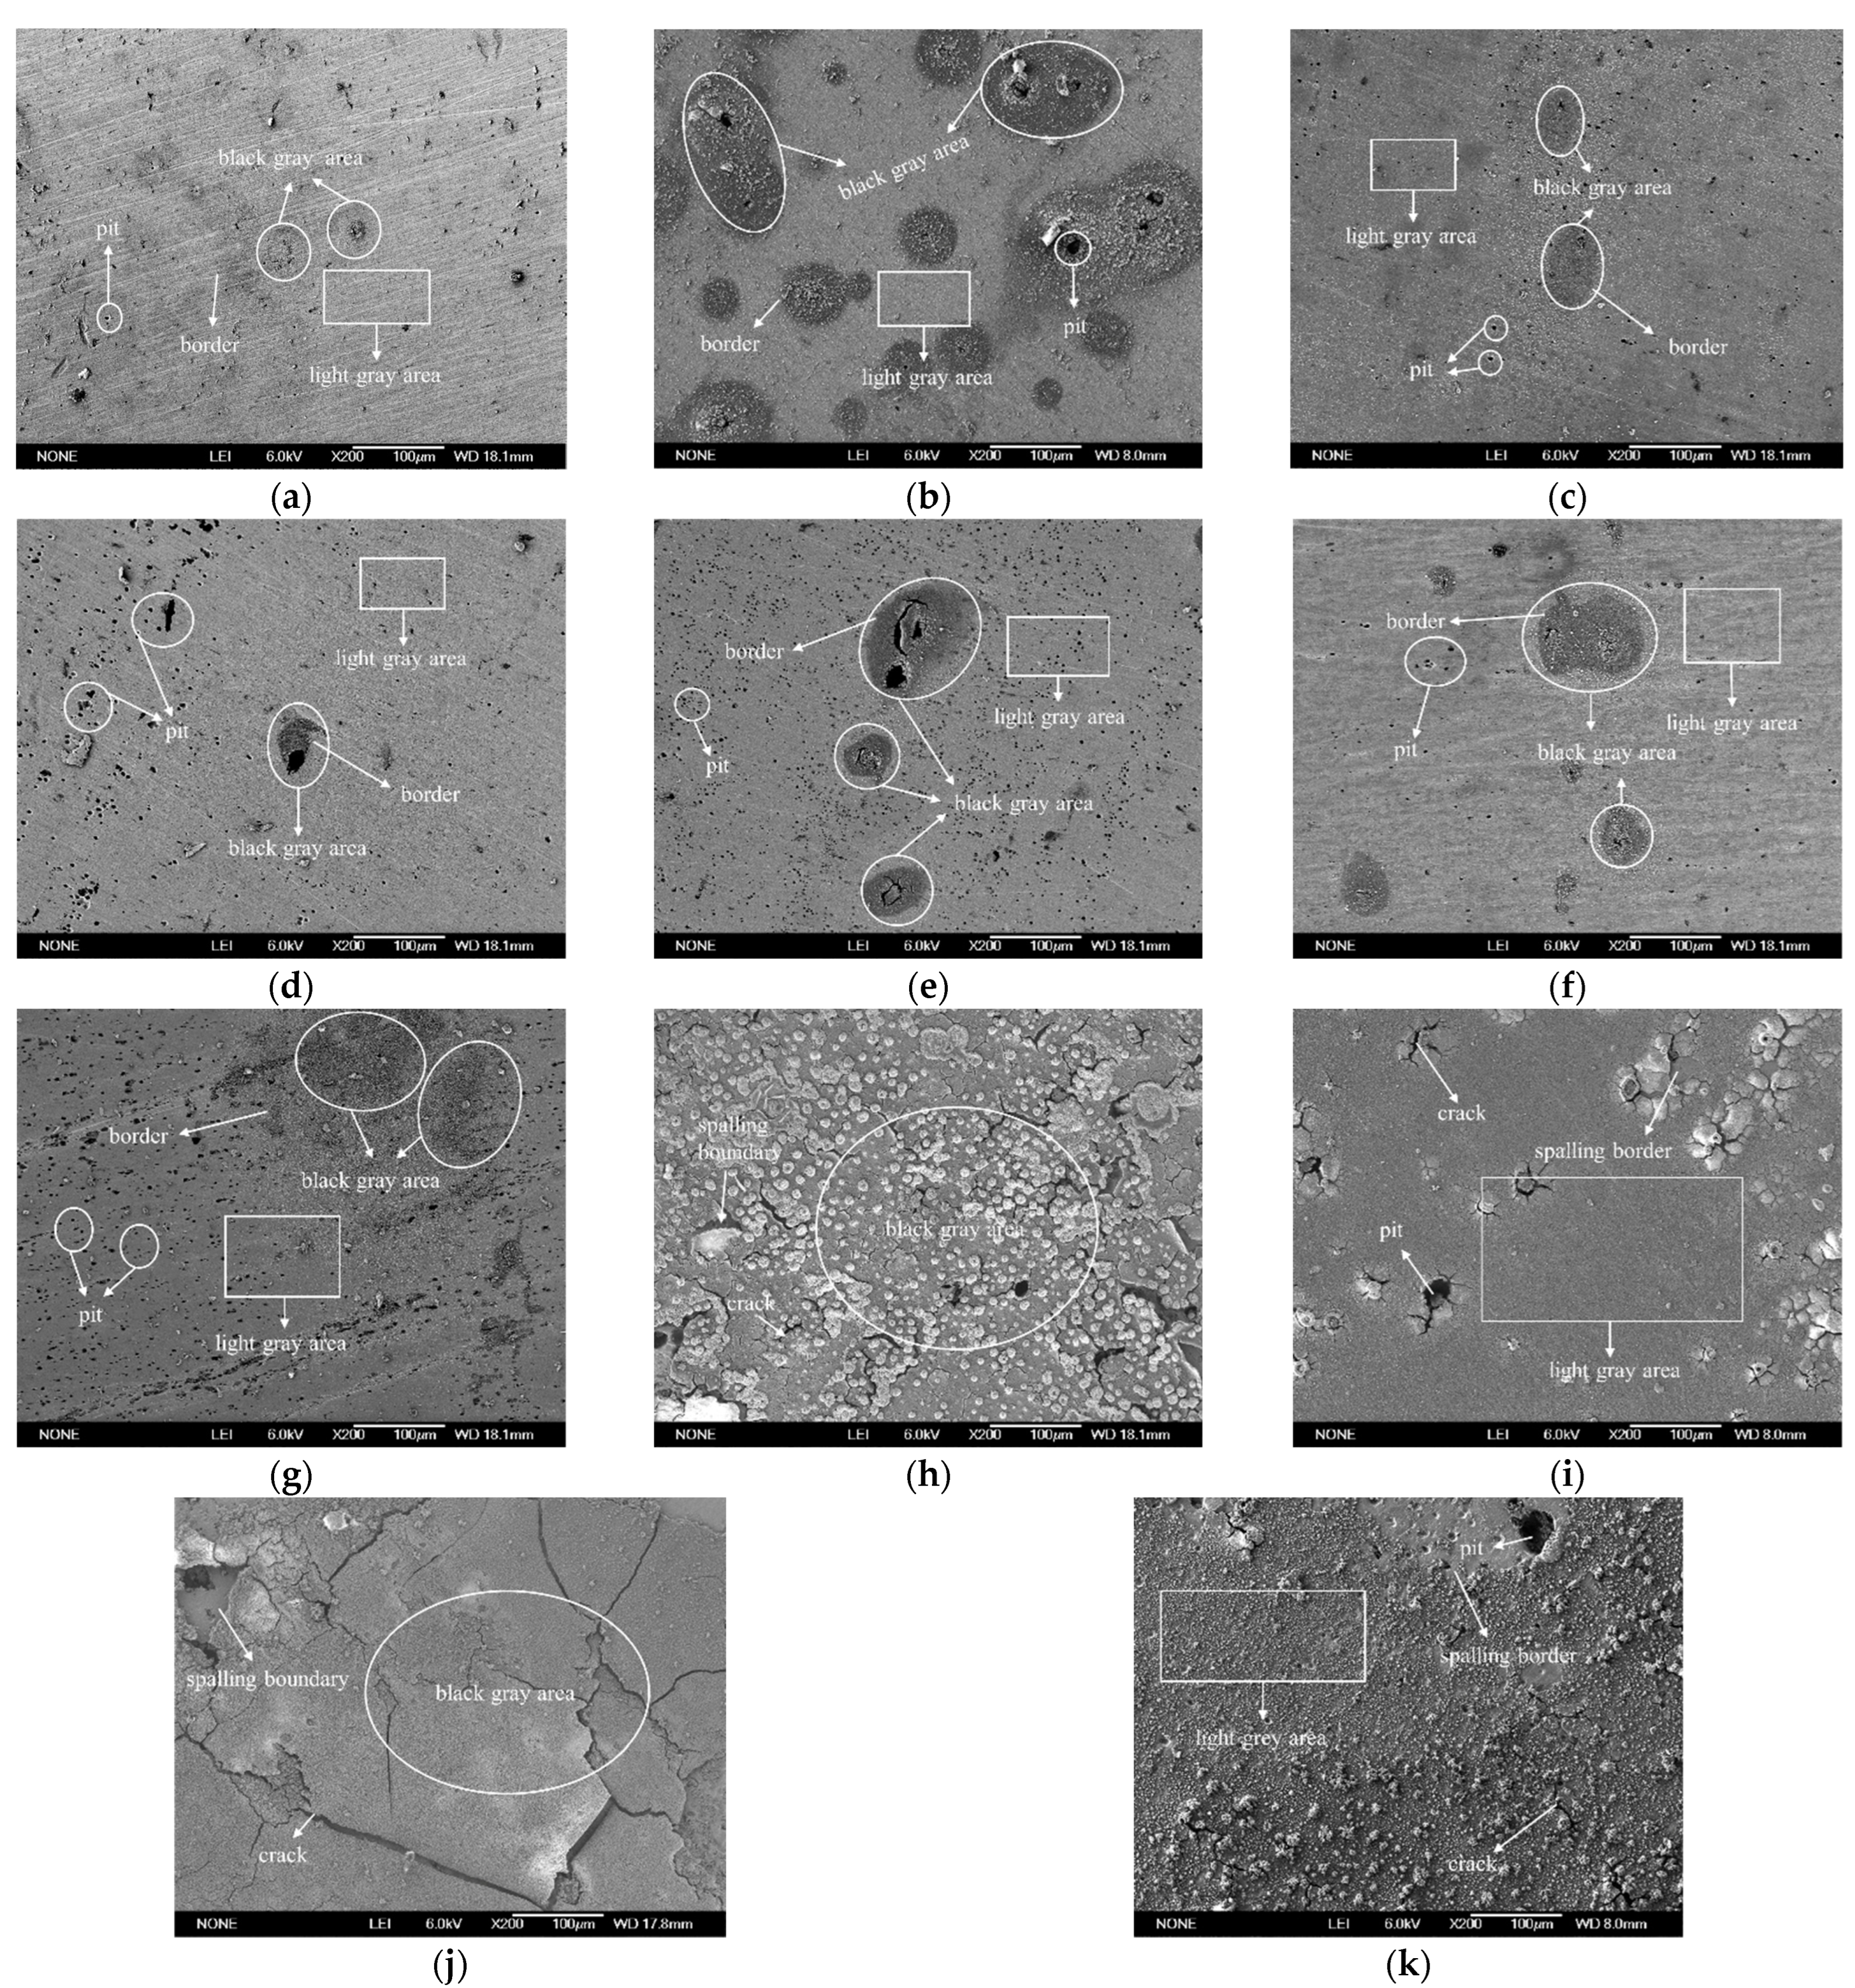
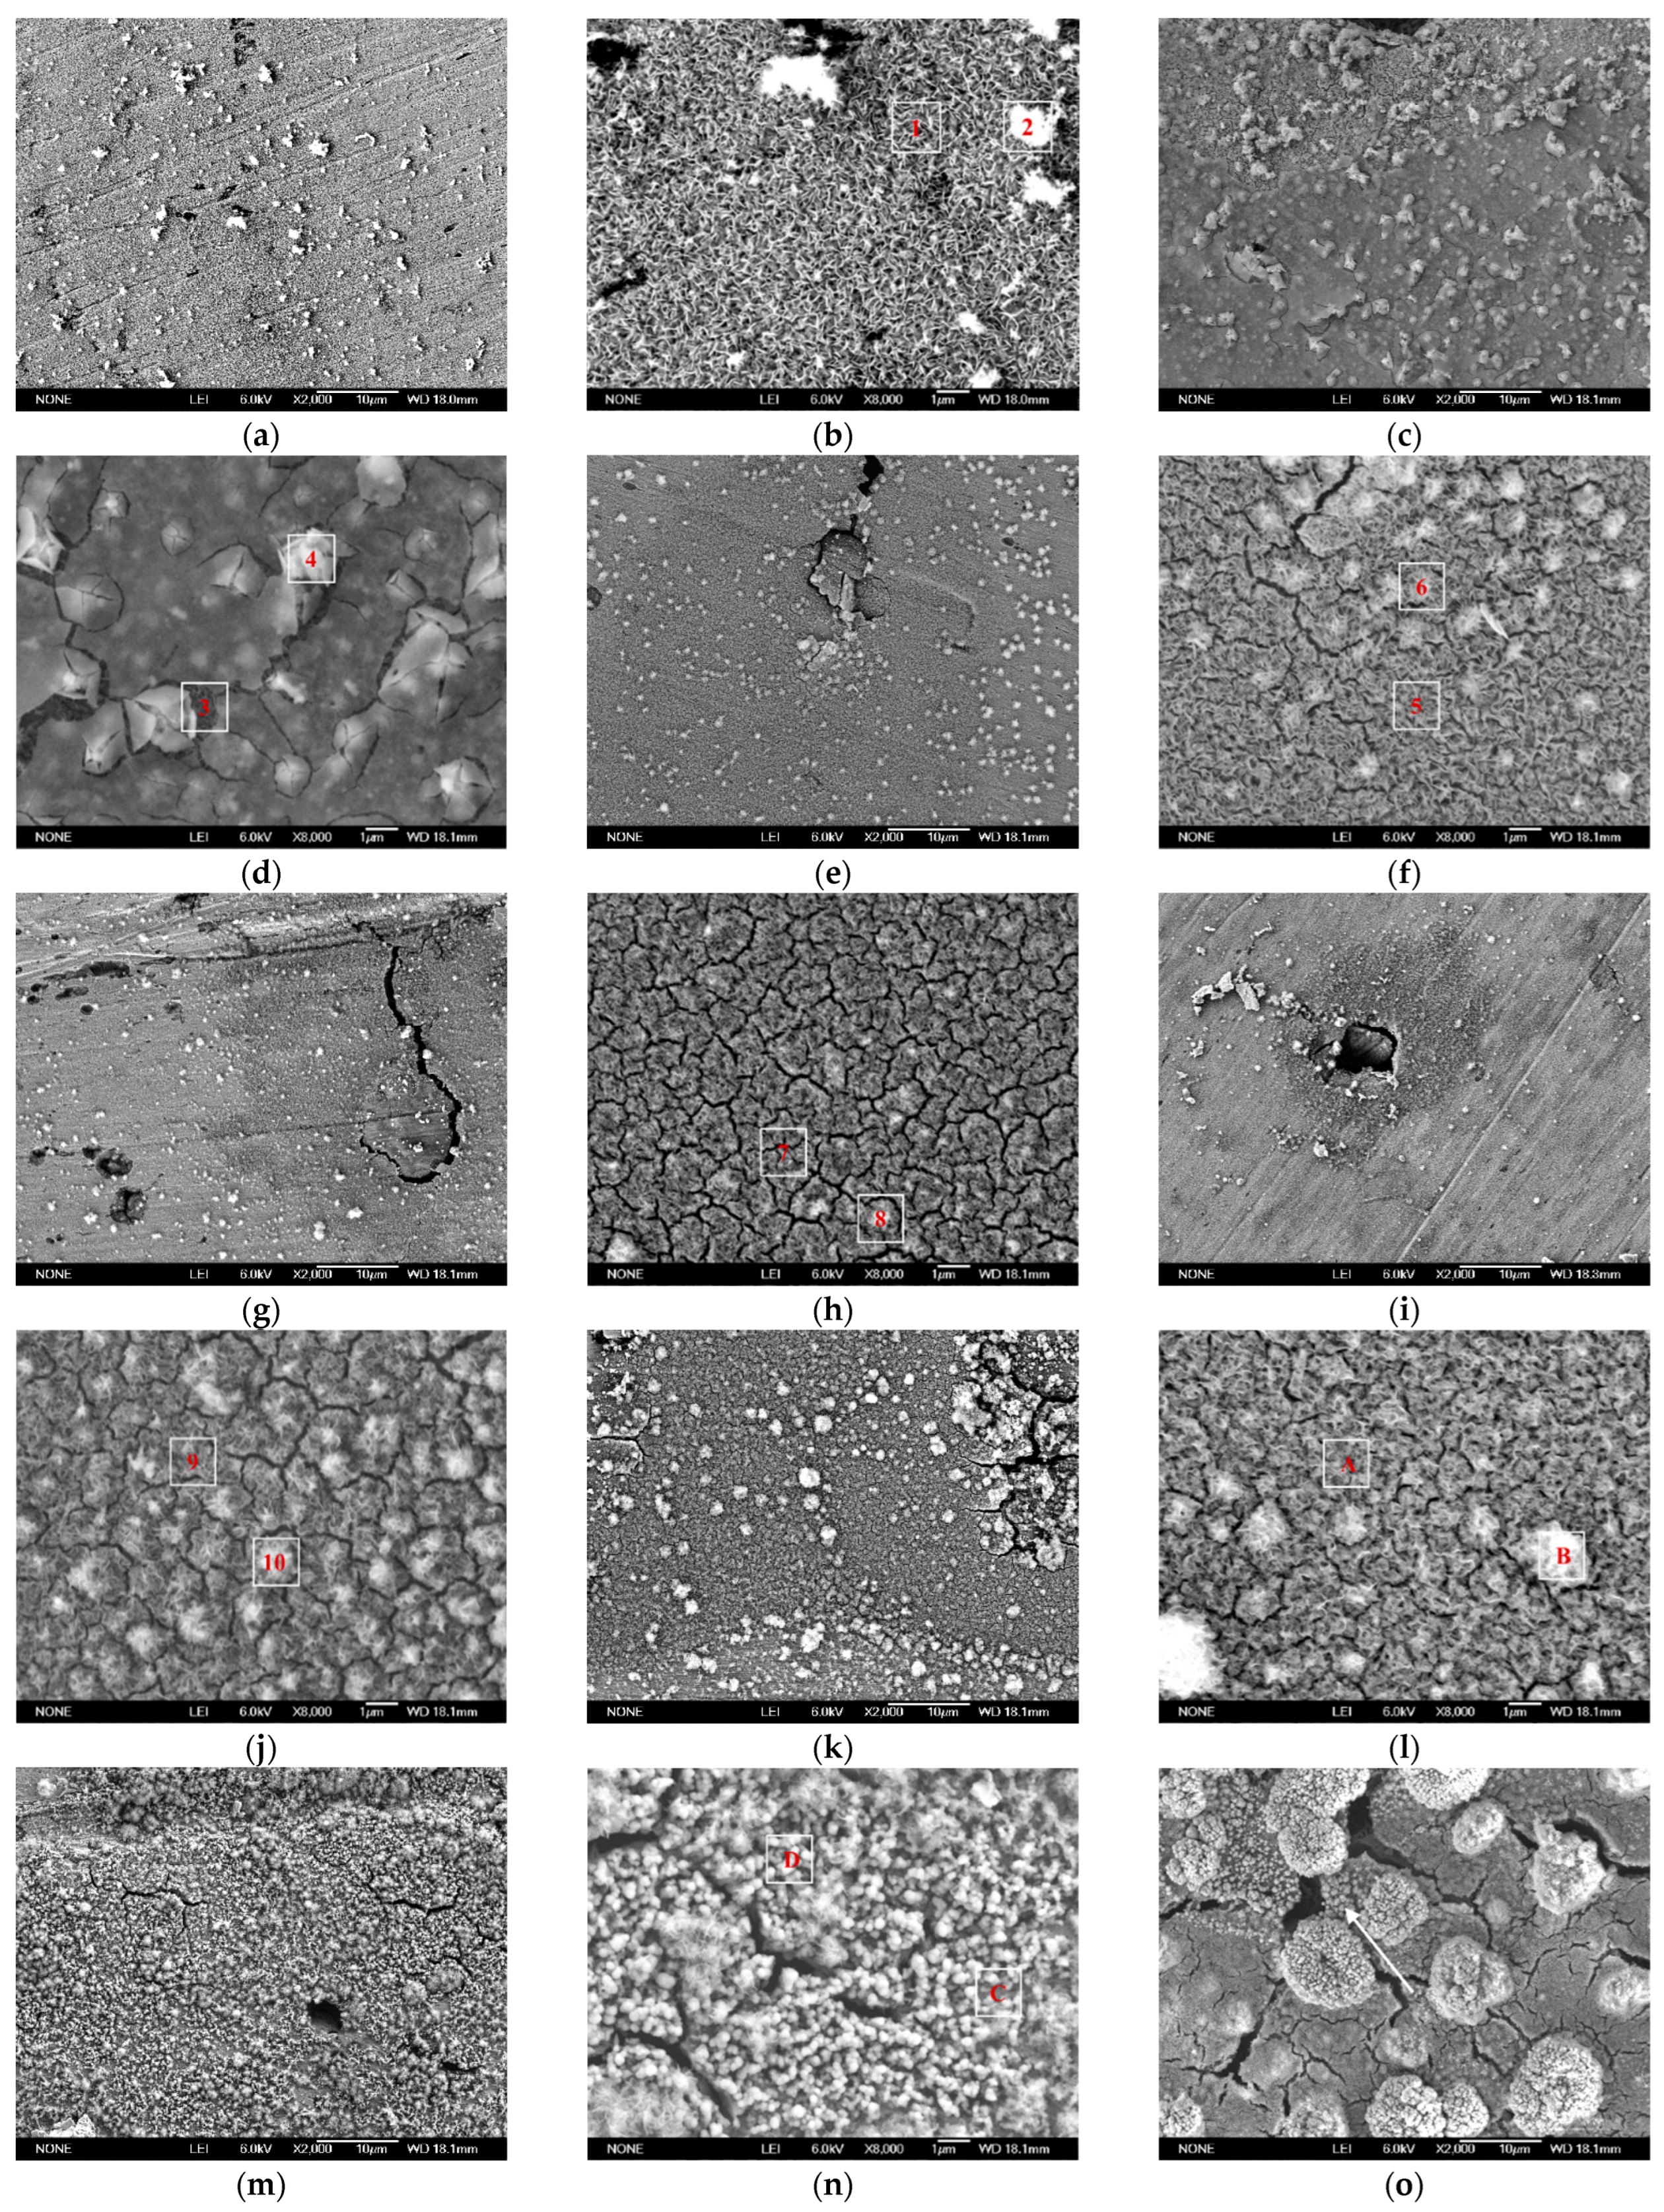
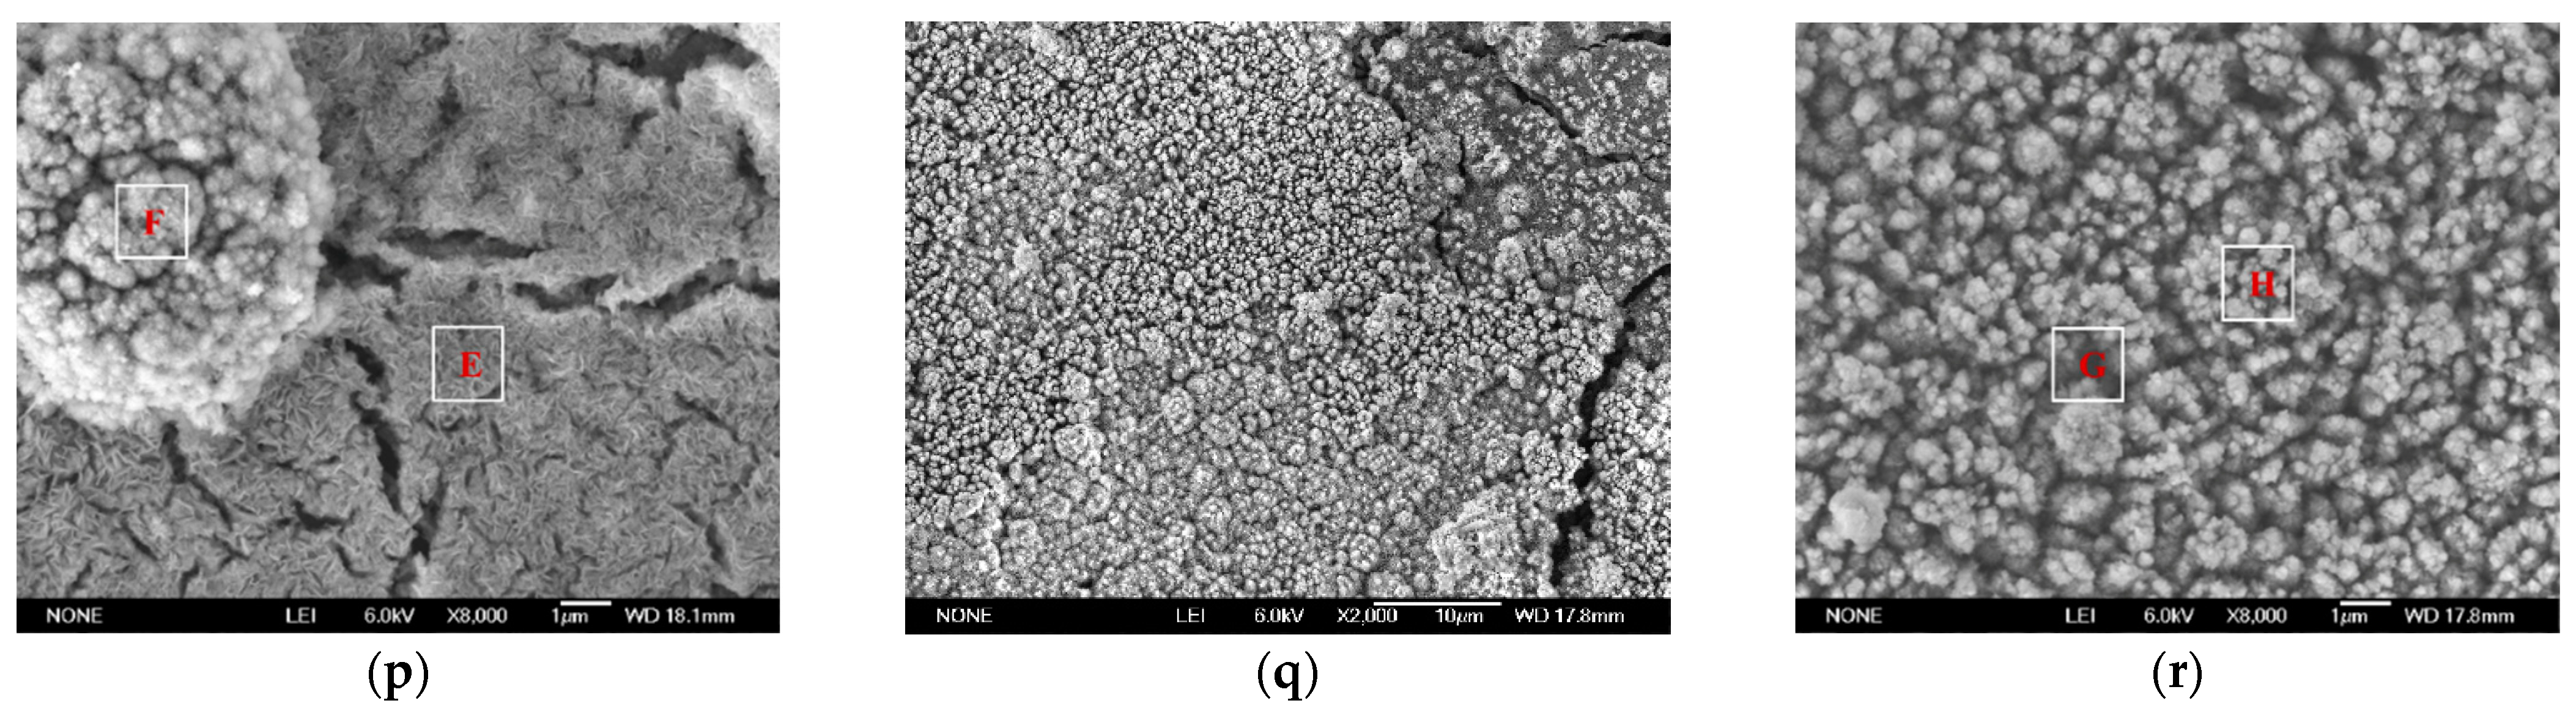
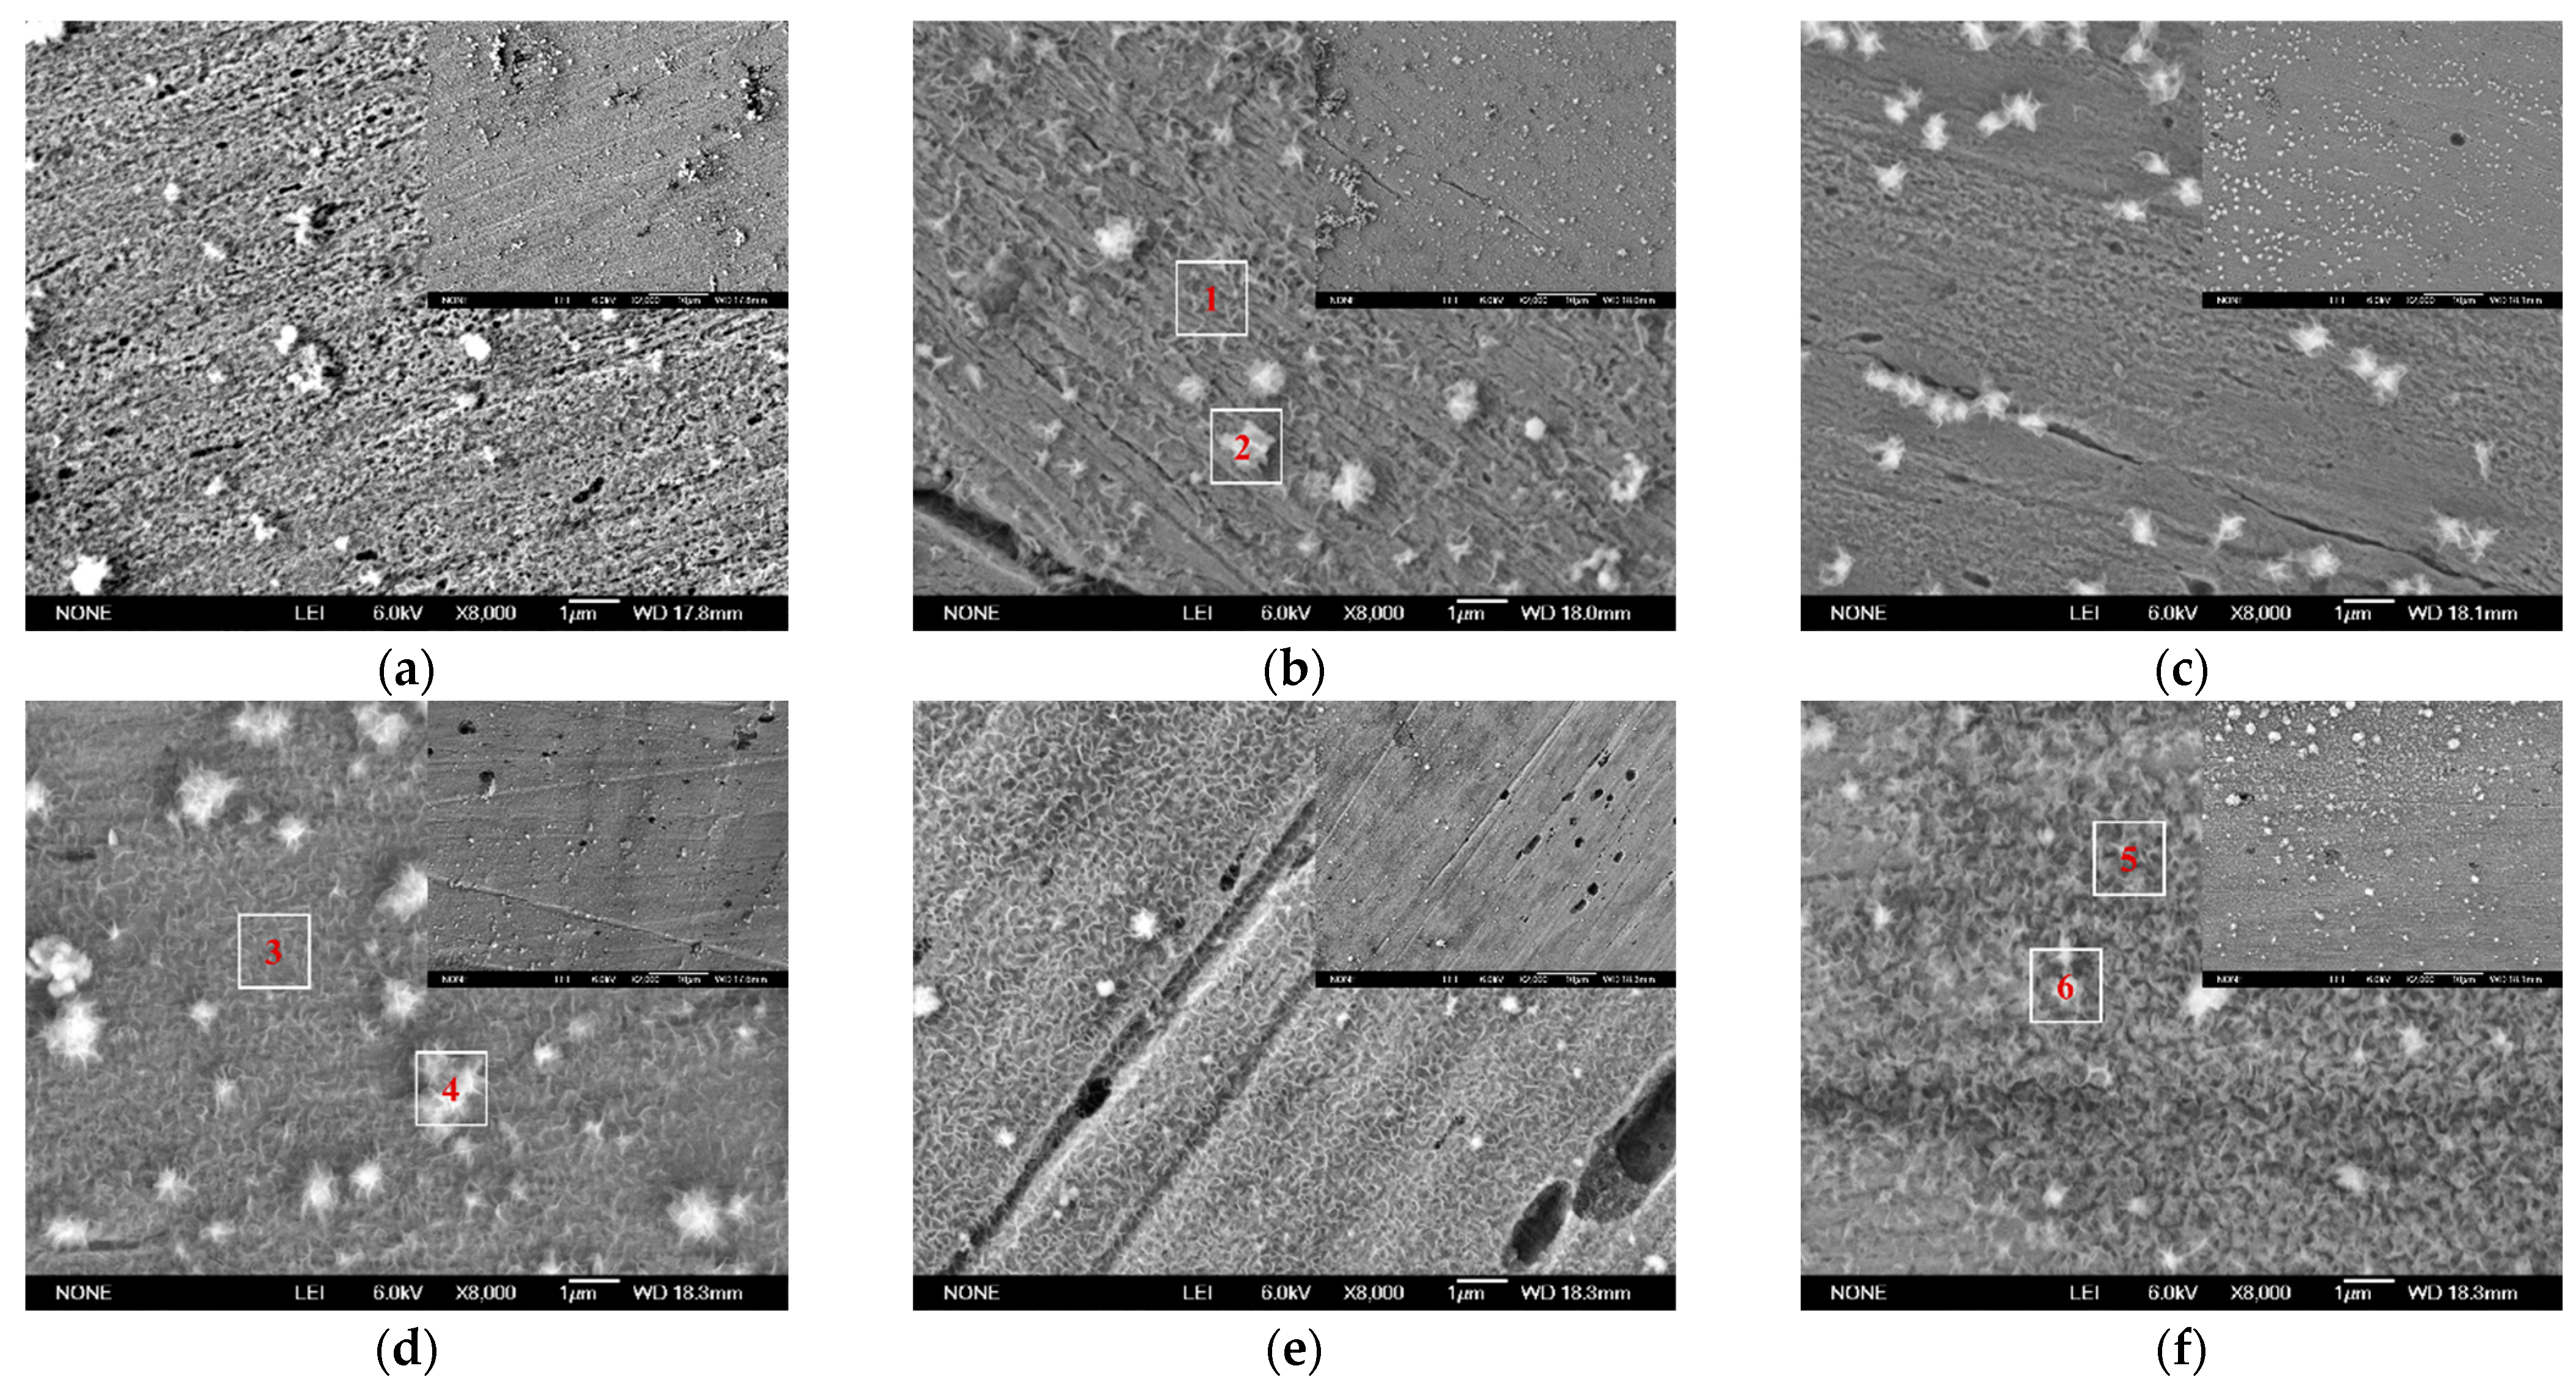
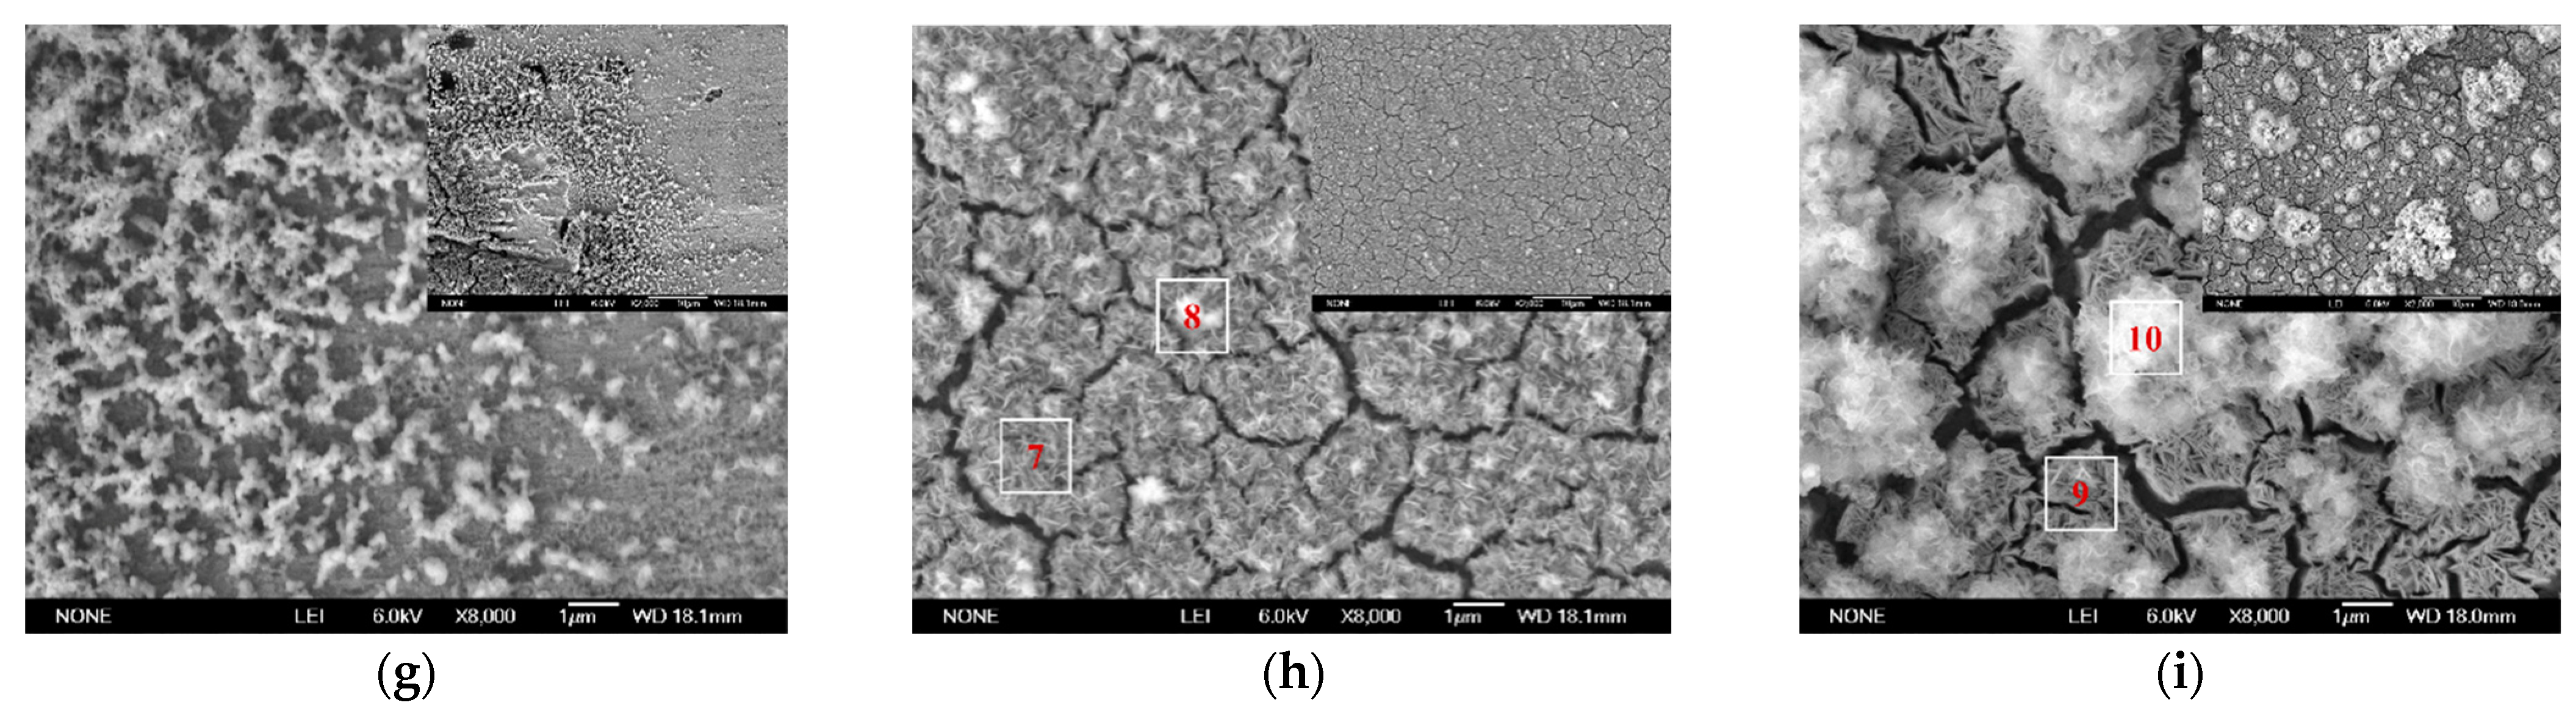
3.2. Morphology of the Corroded Surface
3.3. The Composition Analysis of Corrosion Products
3.3.1. EDS Analysis
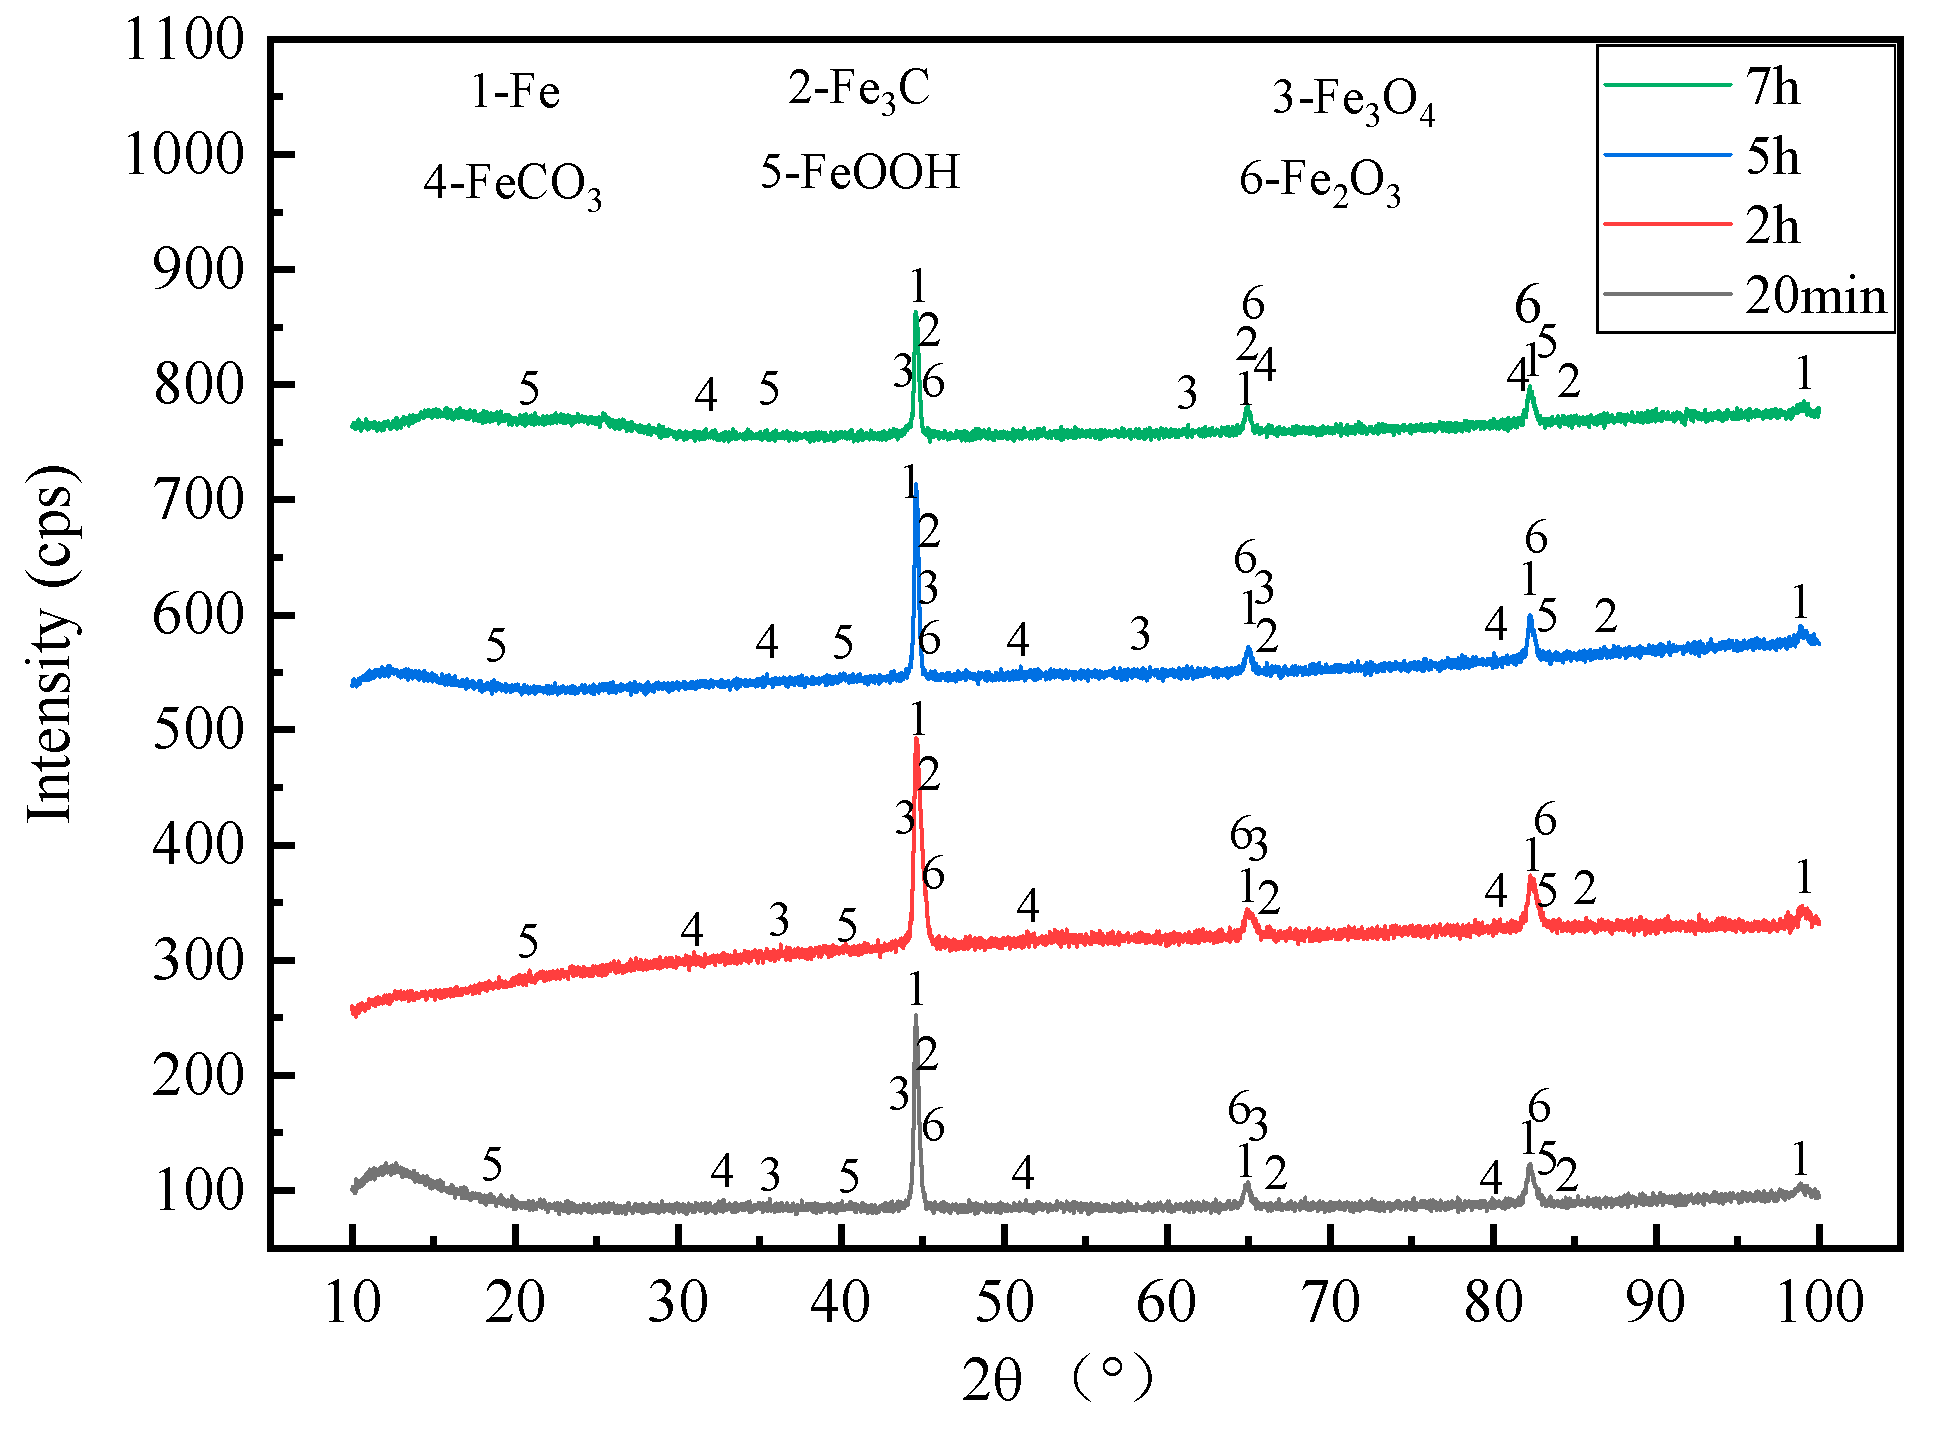
3.3.2. XRD Analysis
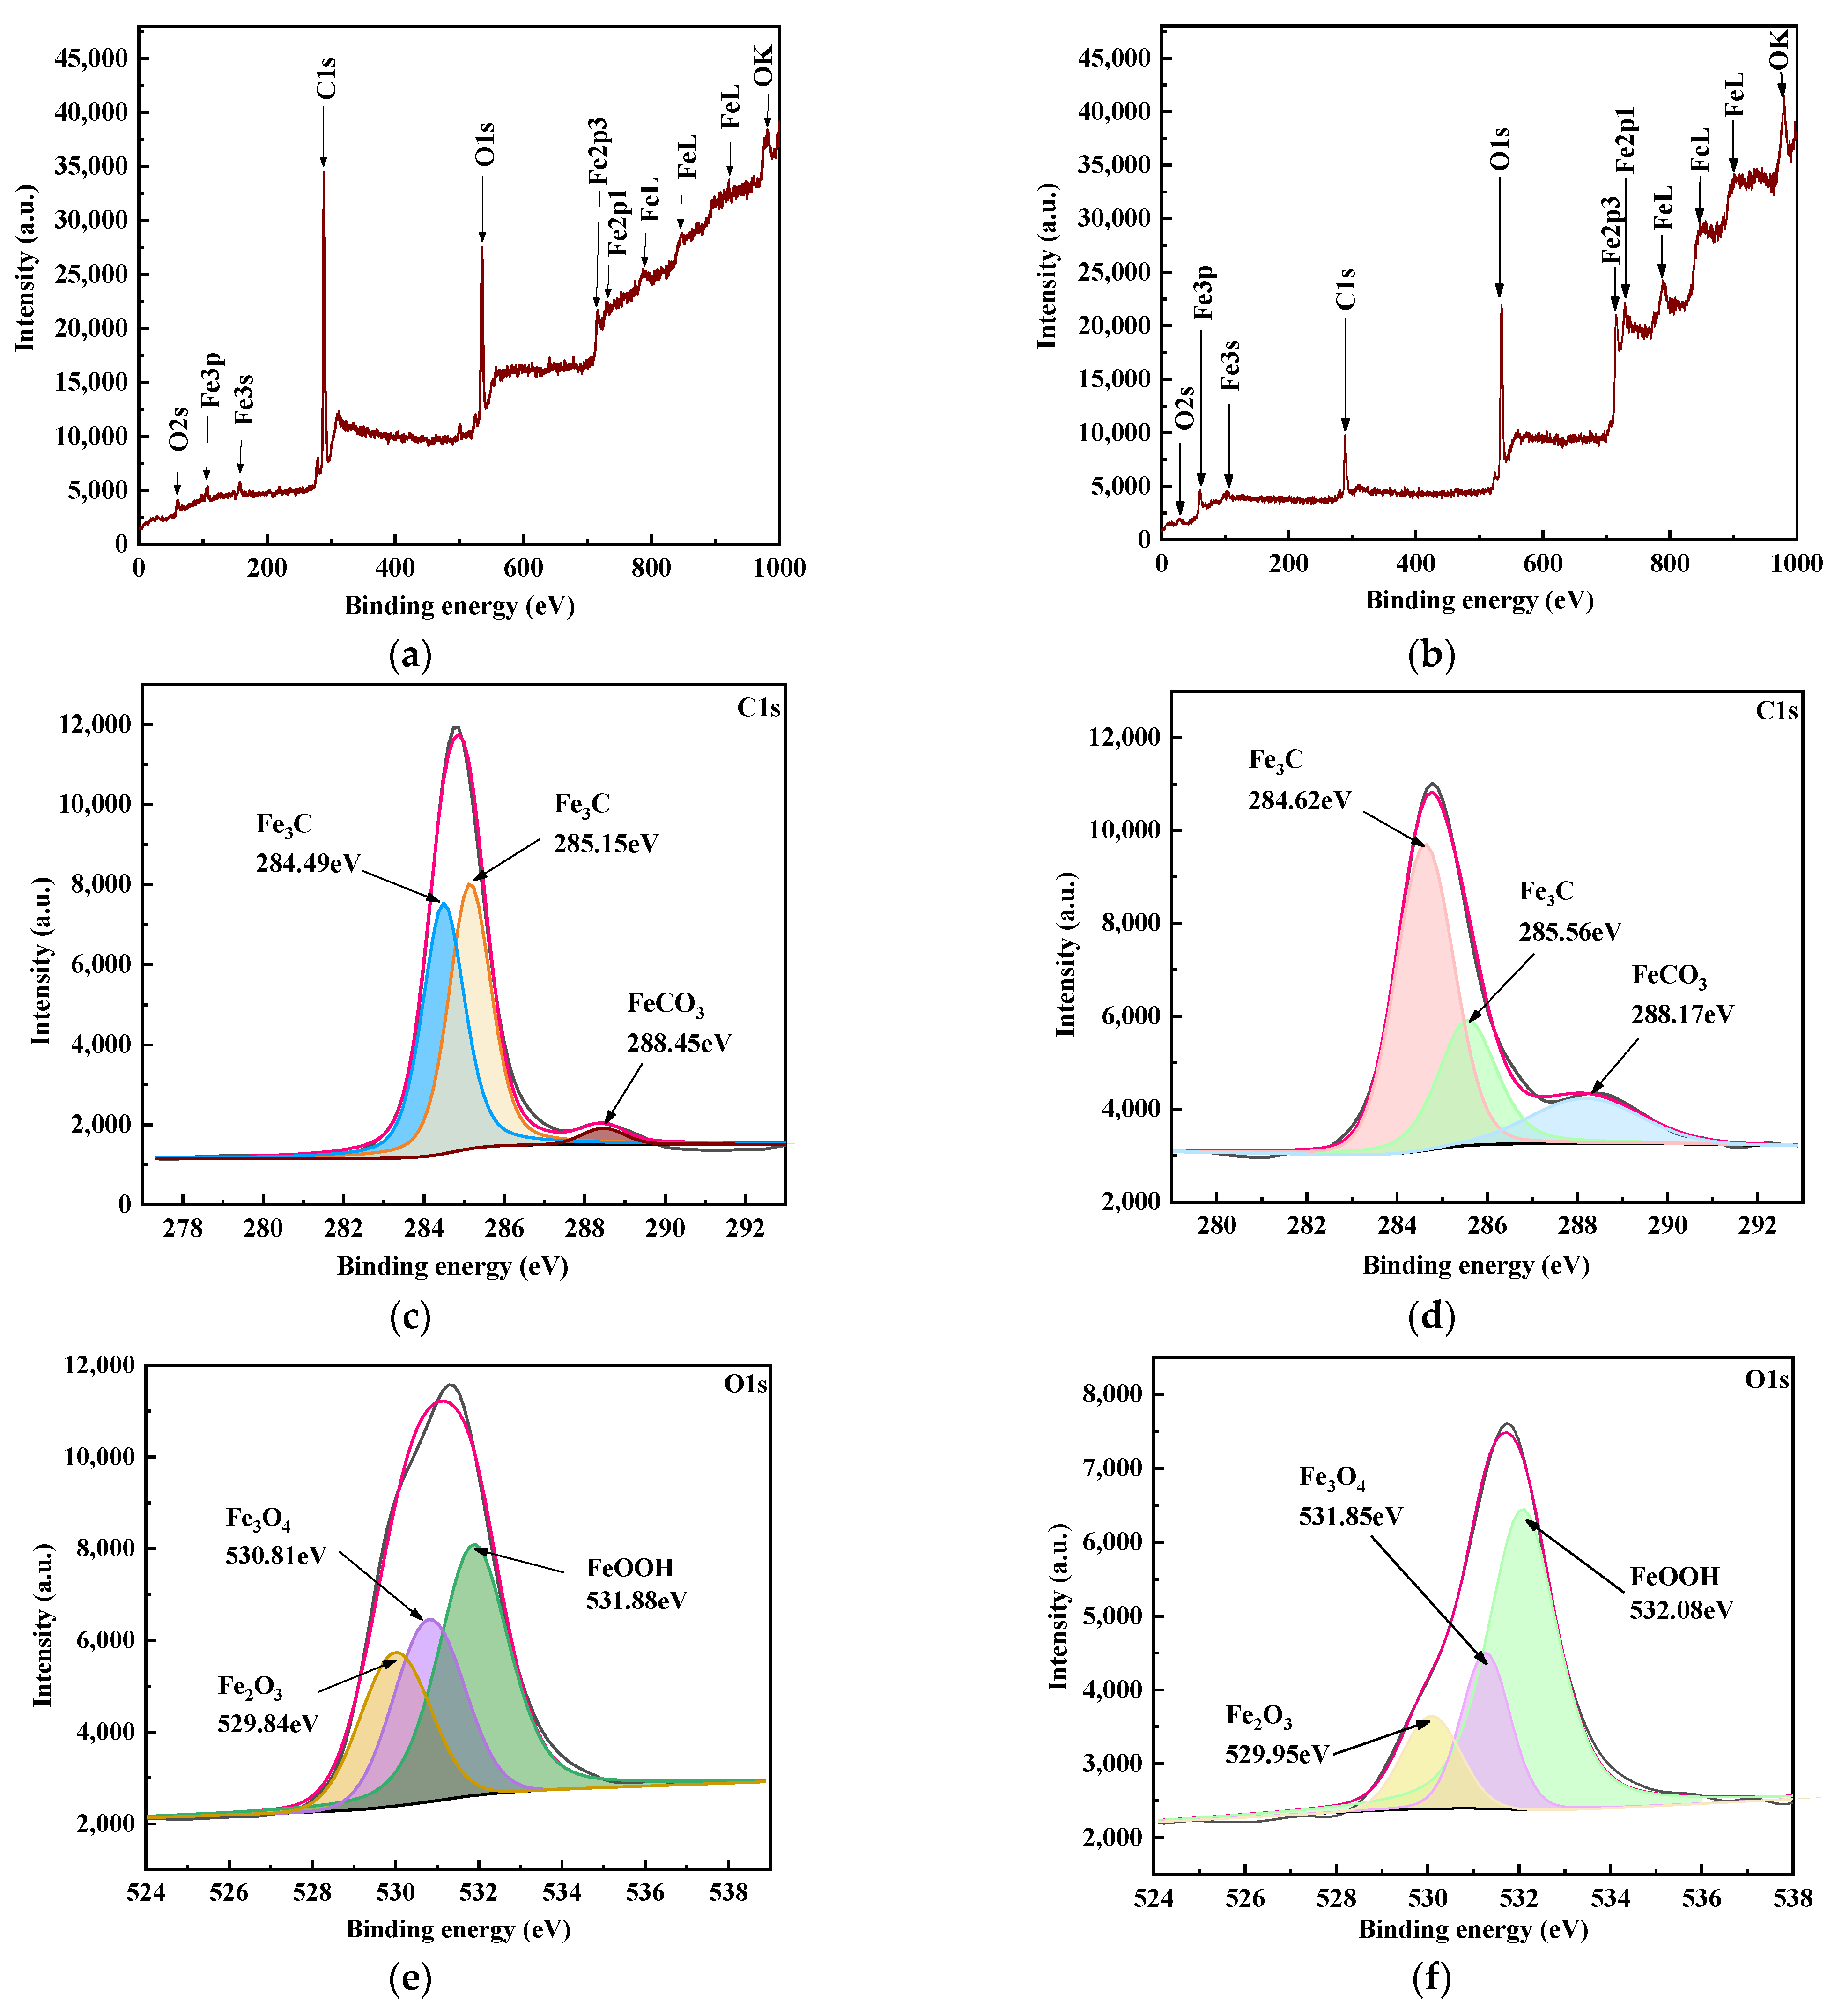
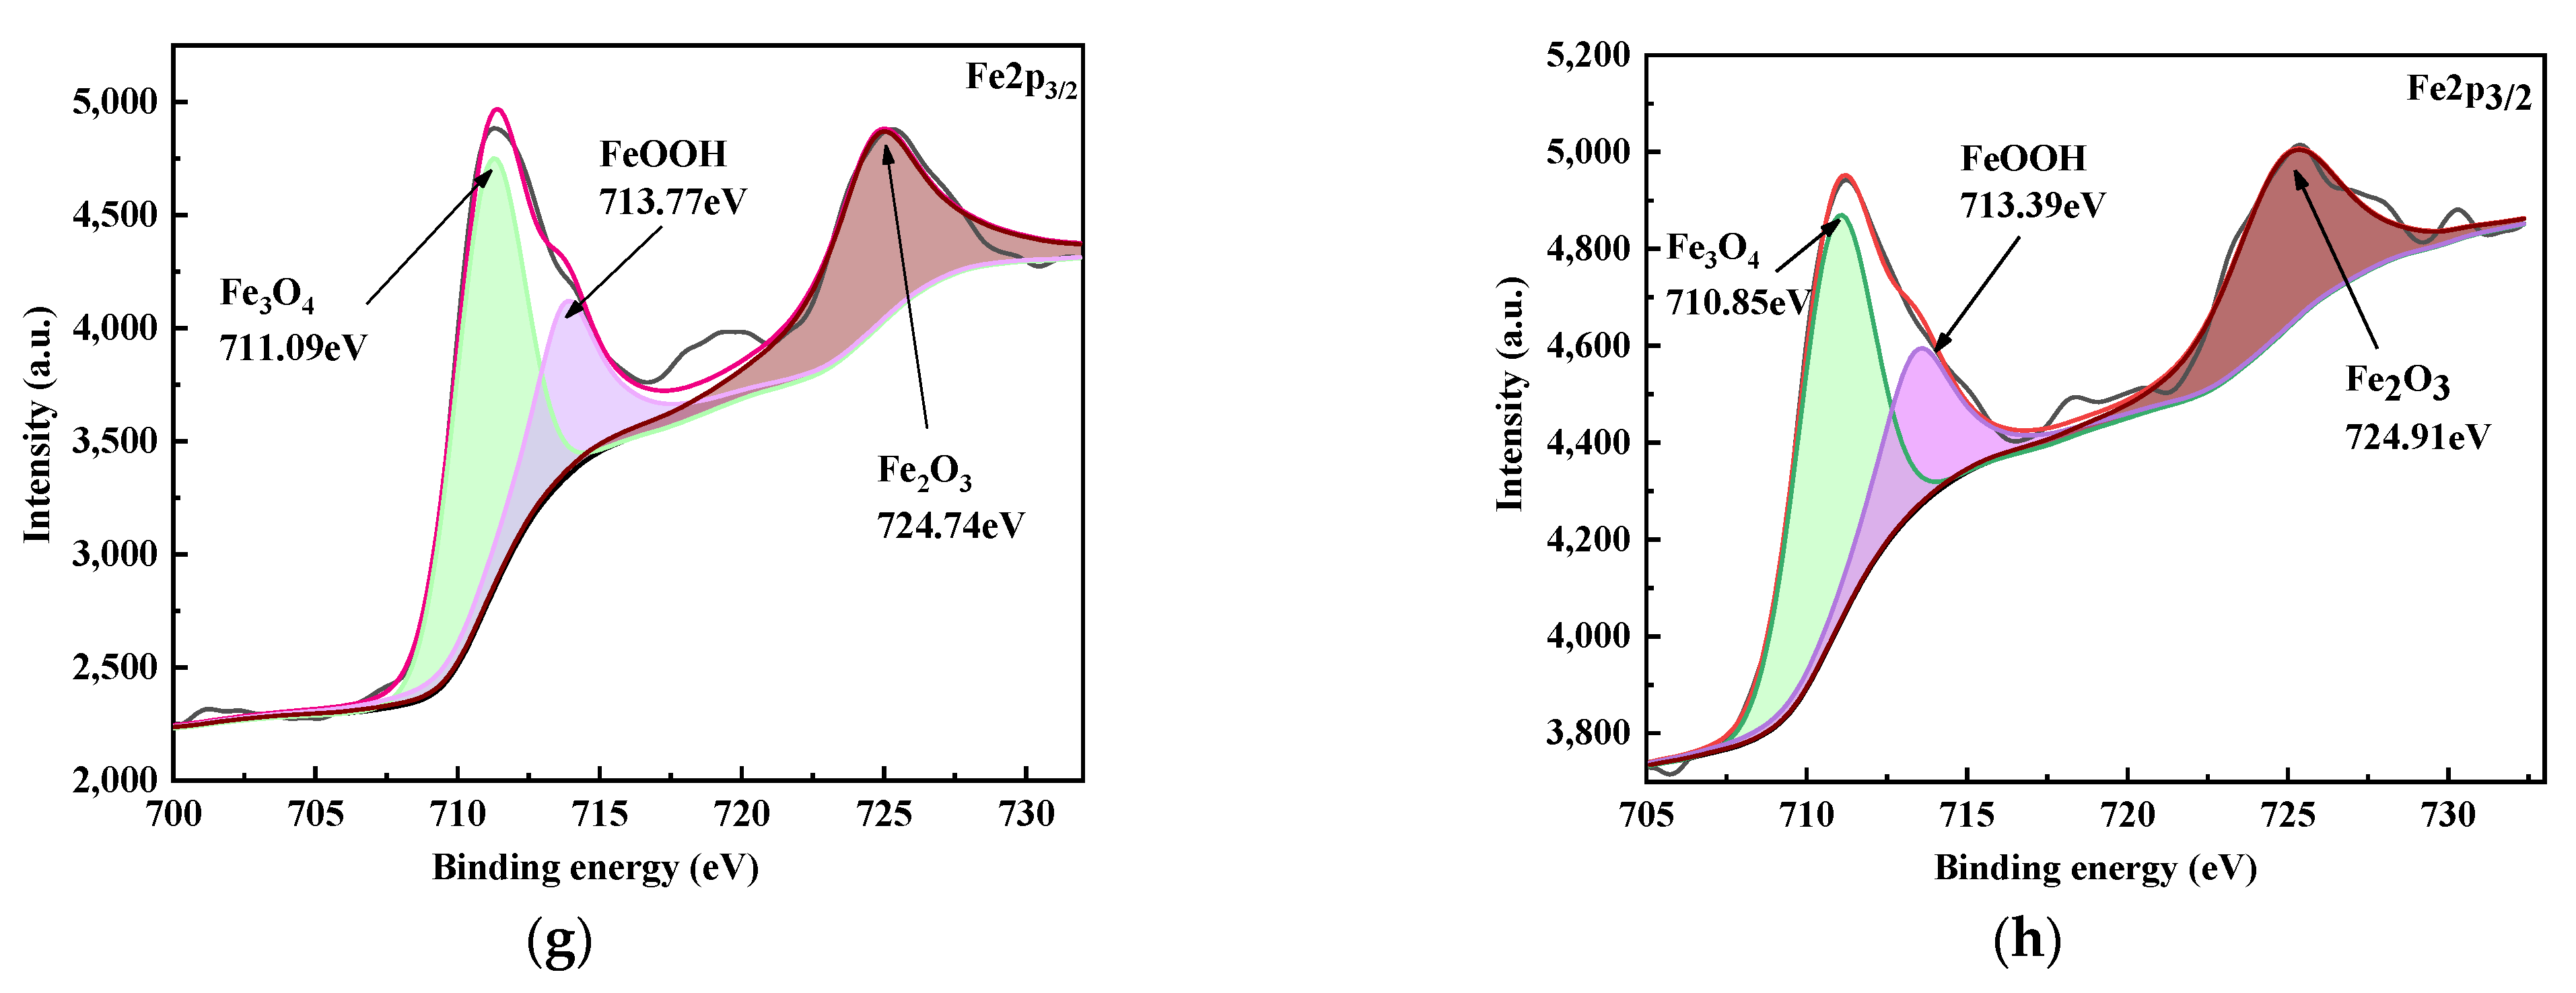
3.3.3. XPS Analysis
4. Analysis and Discussion
5. Conclusions
- (1)
- With the extension of the corrosion time, the corrosion rate of 20# steel under gas–liquid two-phase (CO2/ aqueous solution) bubble flow conditions decreased obviously at the initial stage, then increased quickly, and then decreased gradually. Under the conditions of PCO2 = 0.1 MPa, VL = 0.72 m/s, and Vg = 0.36 m/s, the corrosion rate reached the minimum value of 0.5504 mm/a at 3 h and the peak value of 2.6759 mm/a at 5 h.
- (2)
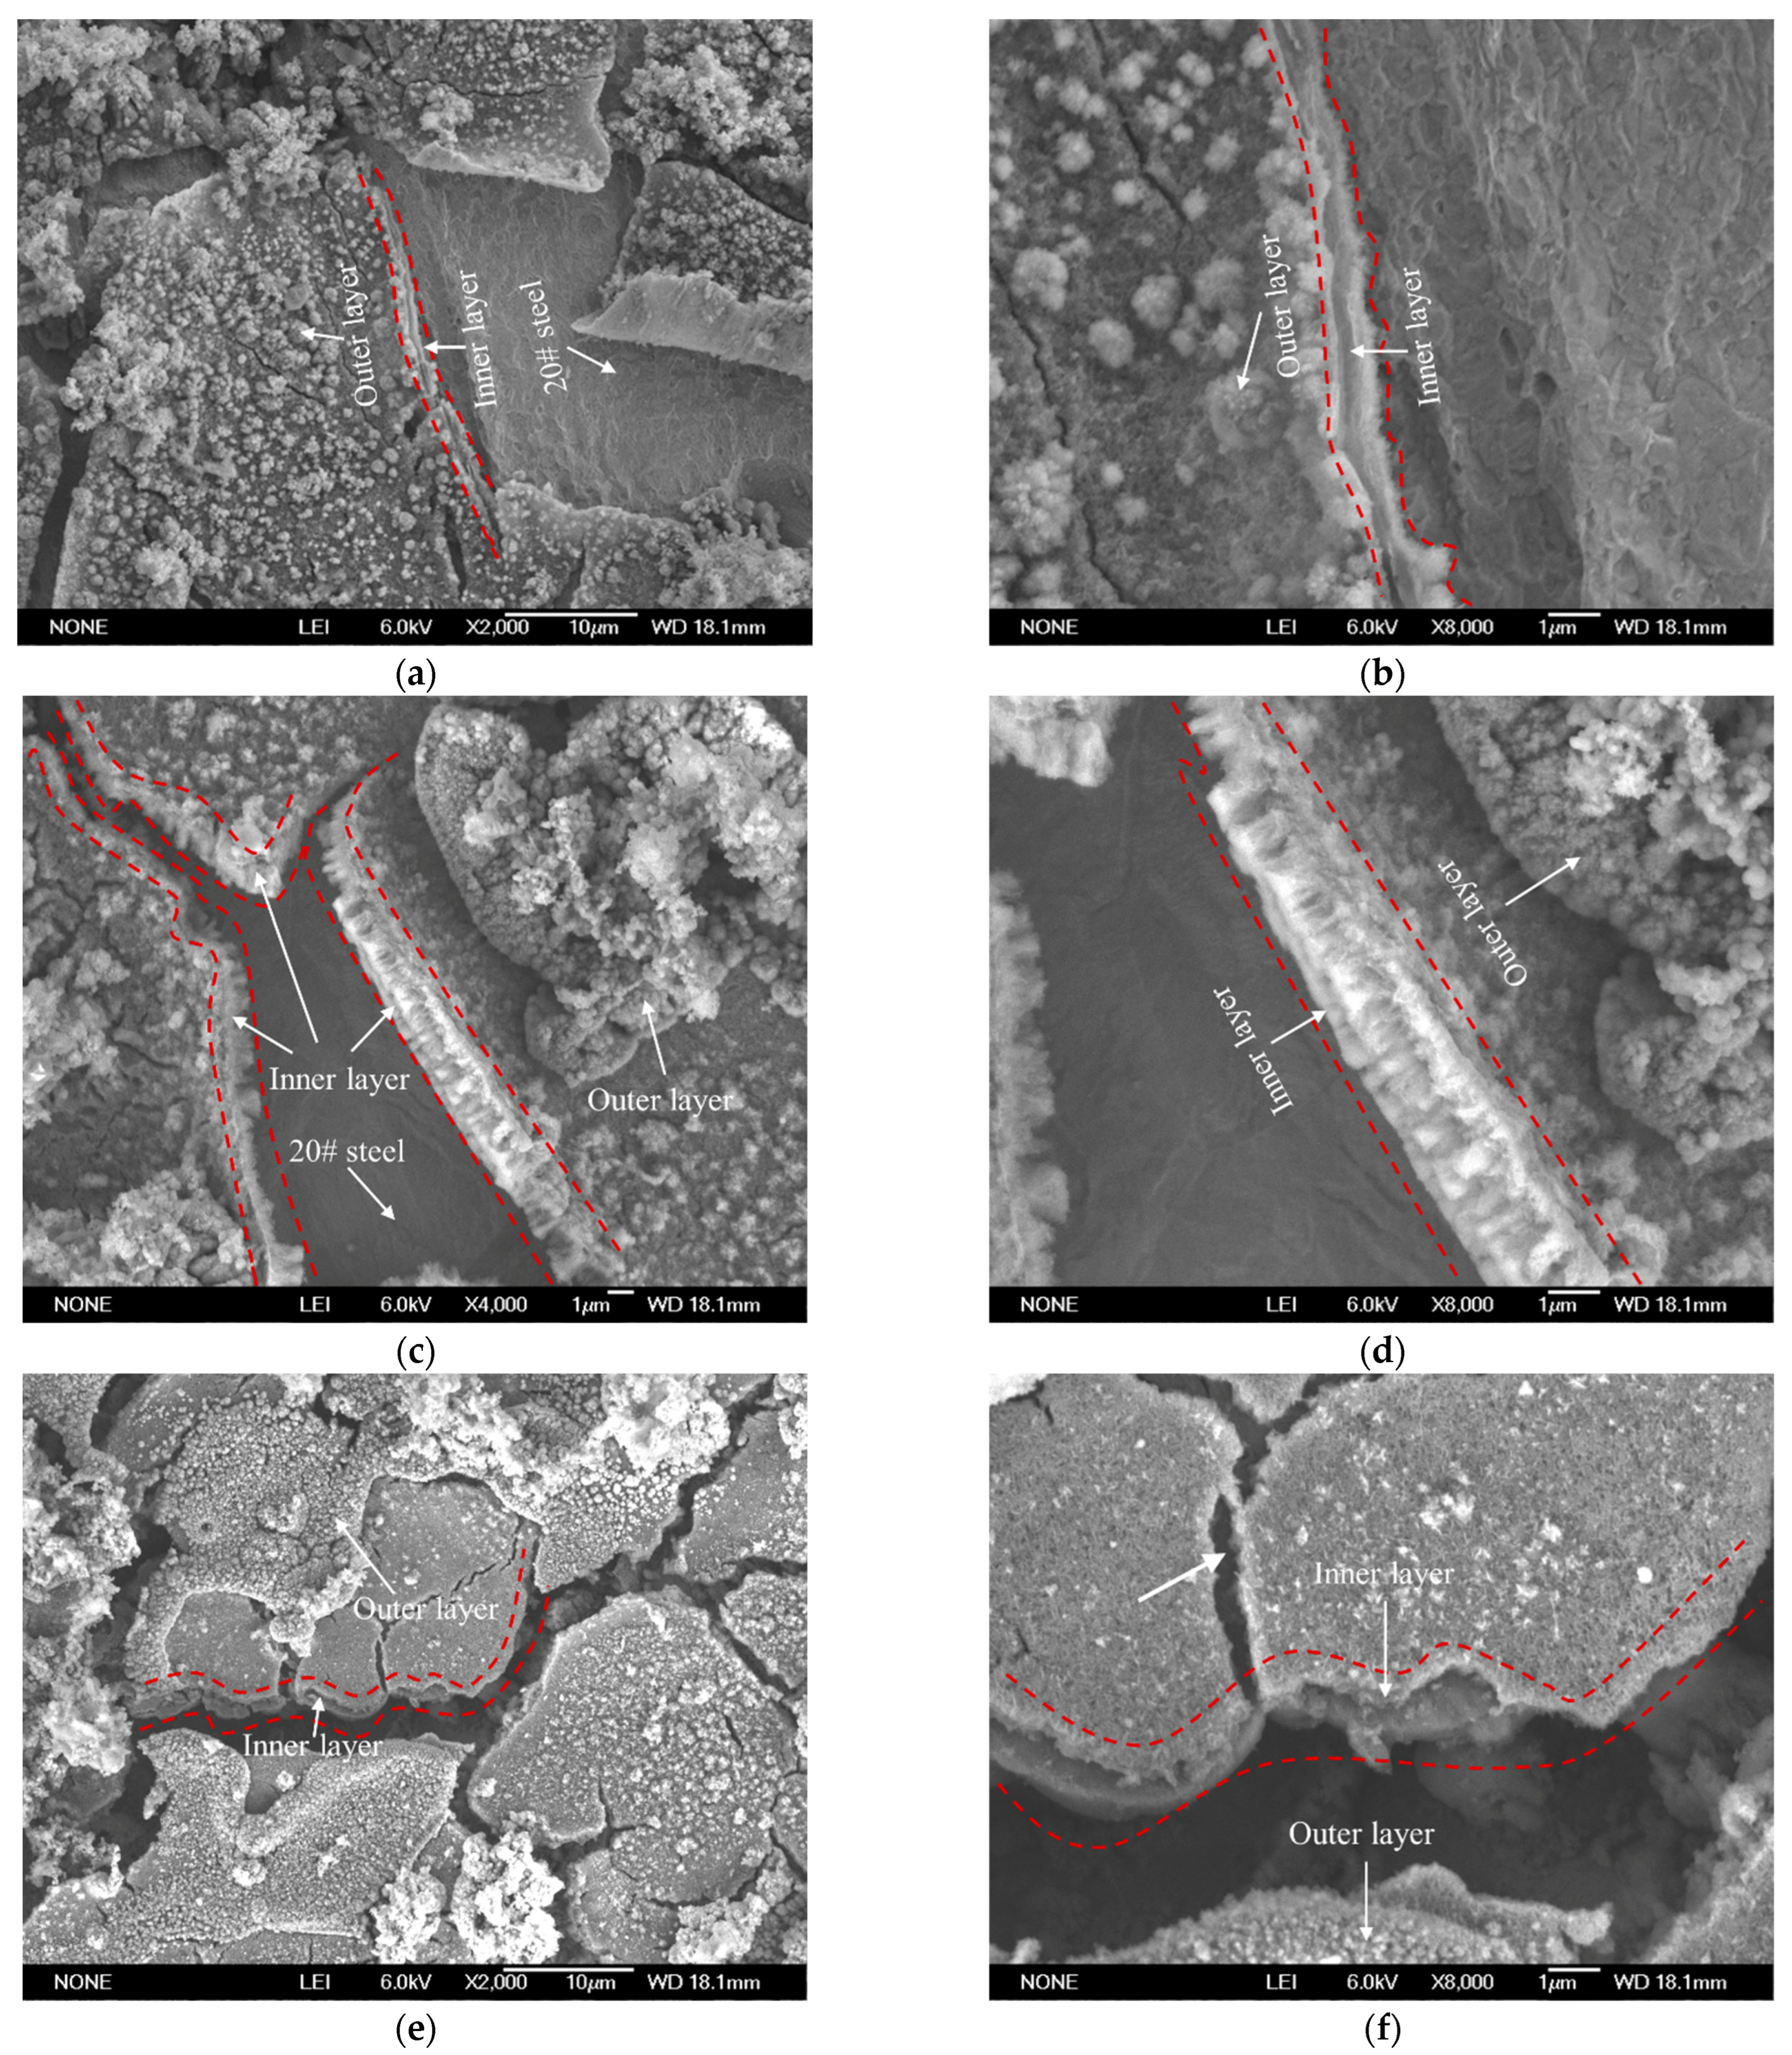
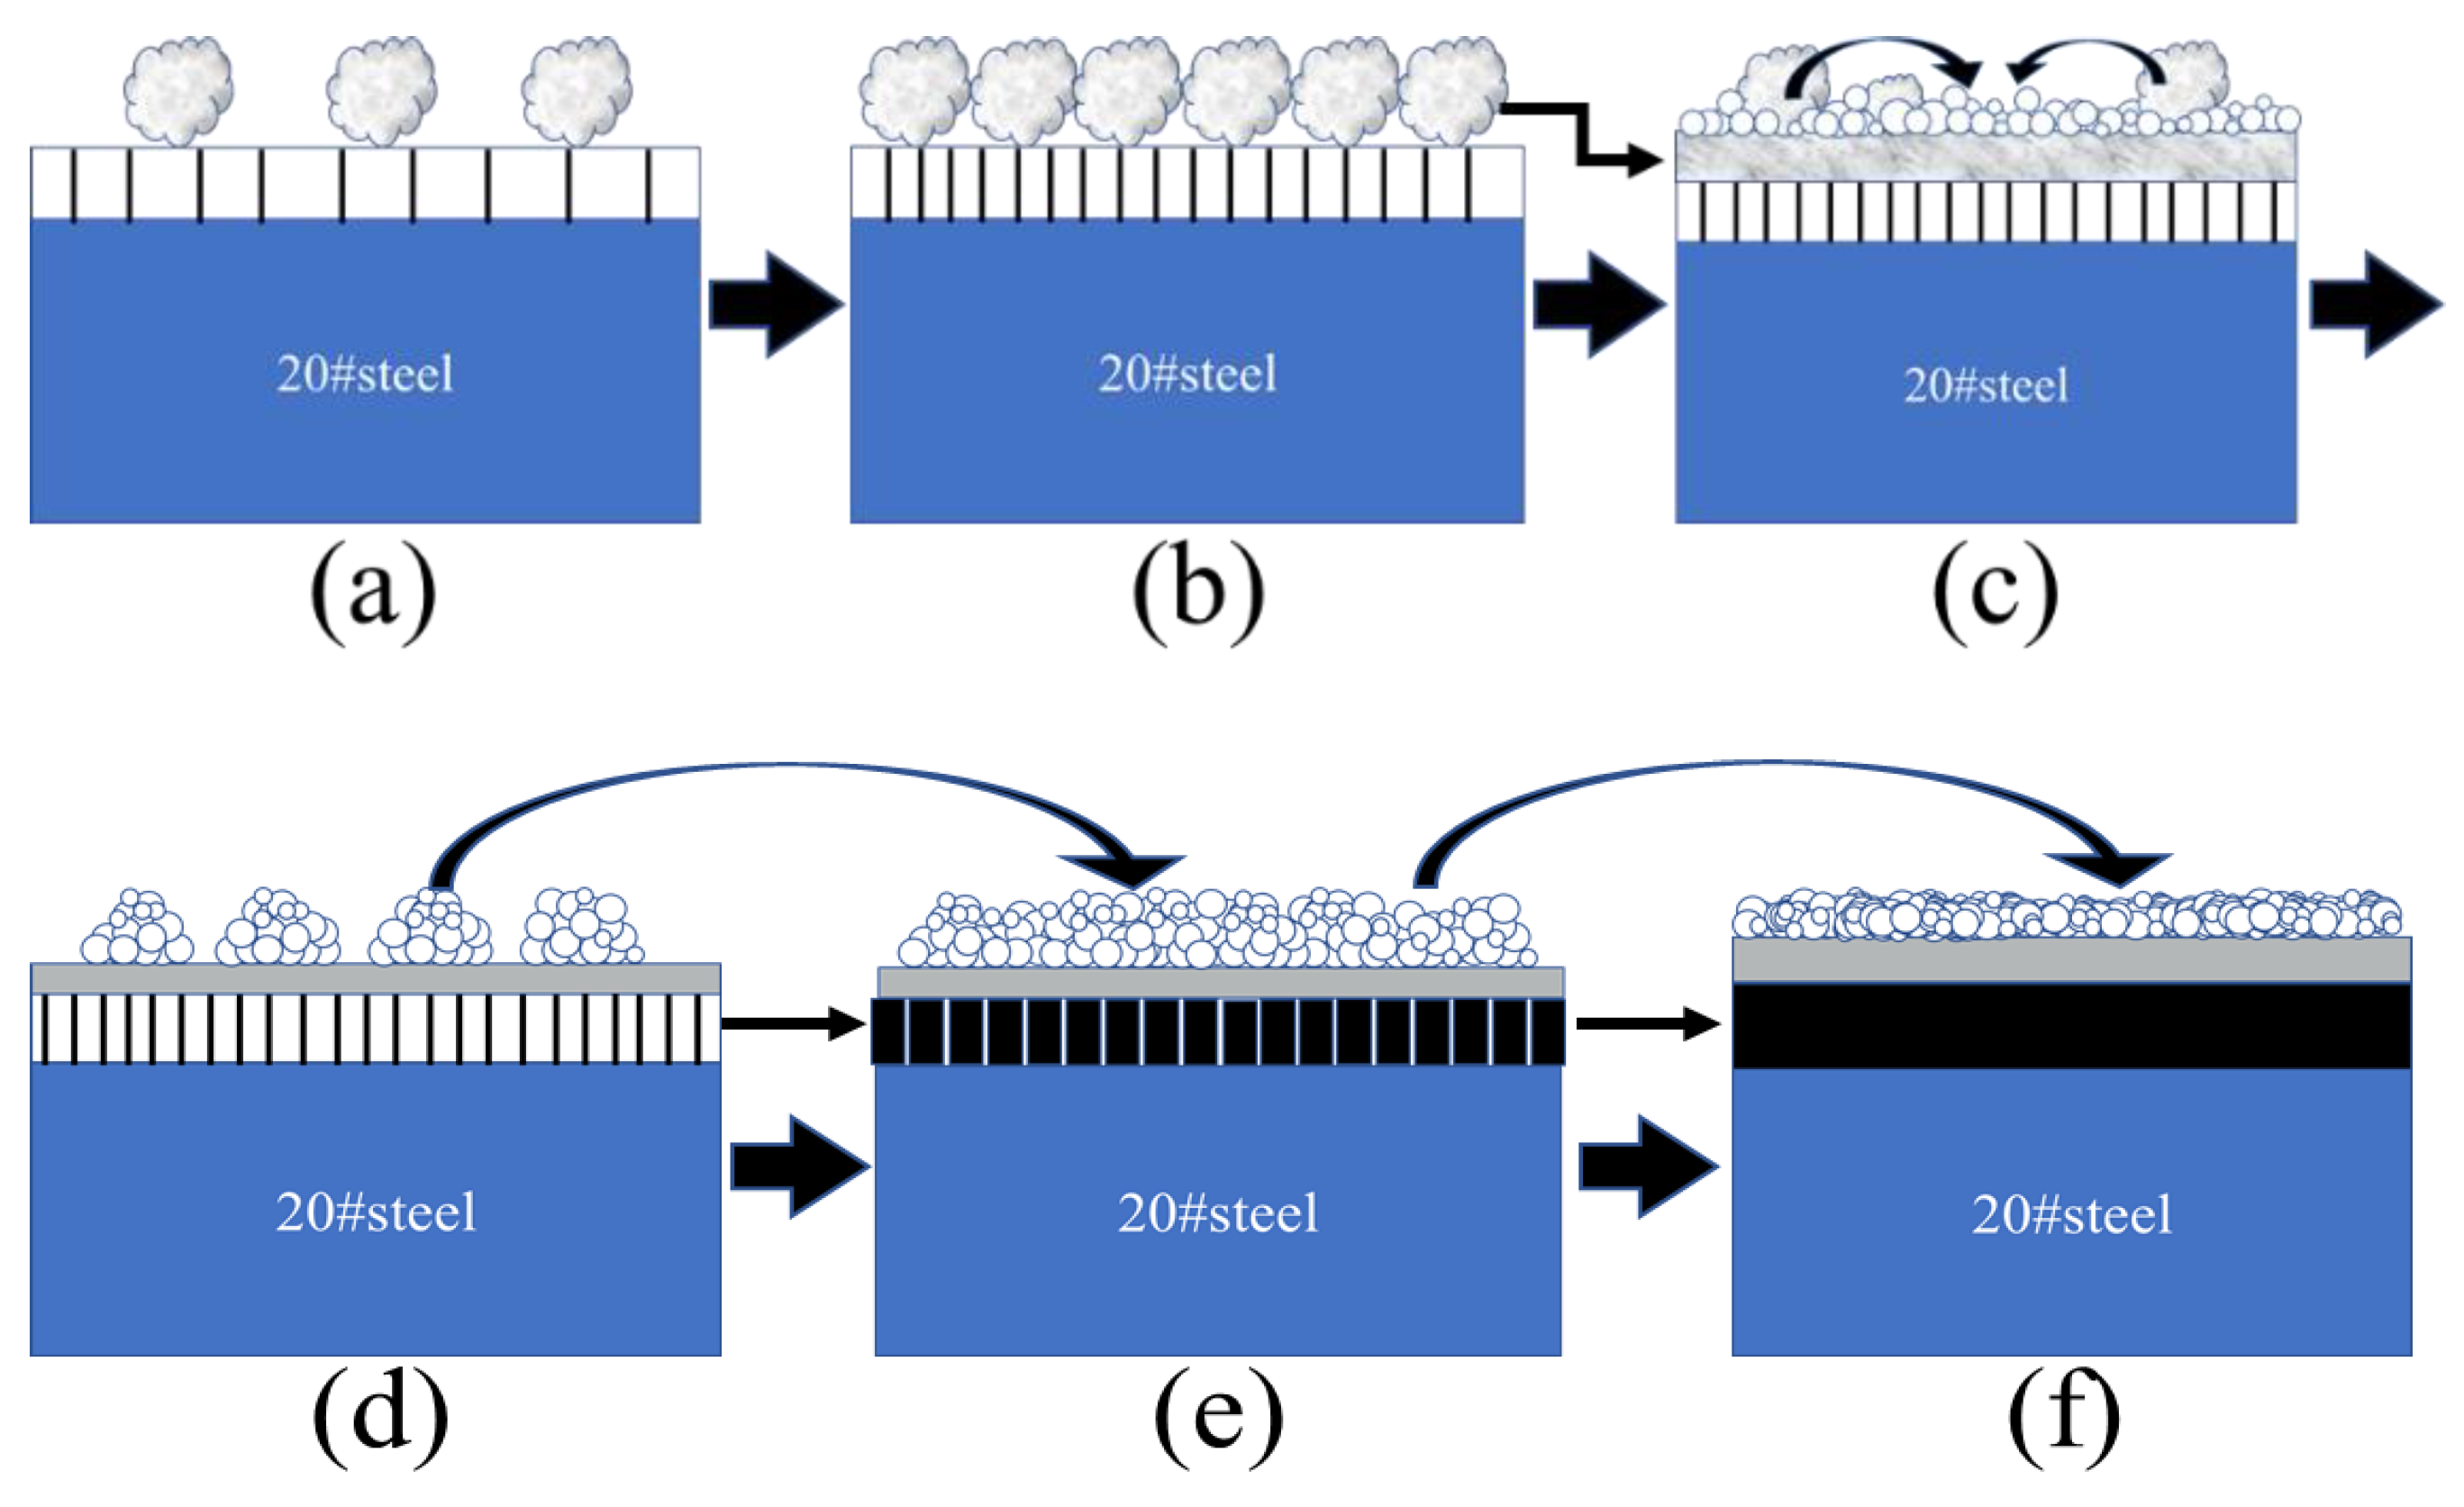
- The morphology characteristic of the corroded surface showed that the needle flocculent corrosion products formed preferentially at the area with defects such as scratches, their crosses, or inclusion on the pipe wall, and then the corrosion products gradually extended around centering on the initial corrosion products. With the extension of the corrosion time, the corrosion products gradually became dense, and the inner corrosion product layer with a dual-structure characteristic formed, while the outermost corrosion product layer composed of spherical granular products formed at the same time. During the forming and densifying process of the outer corrosion product layer, the inner corrosion product layer with a dual-structure characteristic gradually differentiated into a dense underlying sub-layer with a columnar structure and a relatively dense middle sub-layer. The corrosion process far from the defect area lagged behind the defect area, but the evolution process and characteristic of the corrosion products were the same for the two kinds of areas.
- (3)
- The main elements of the corrosion product layer were Fe, C, and O, and the main constituent phases were Fe3C, FeCO3, FeOOH, Fe3O4, and Fe2O3. The elemental analysis results showed that the Fe content of the inner layer of corrosion products was higher than that of the outer layer of corrosion products, while the content of C and O was just opposite to that of Fe. With the extension of the corrosion time, the Fe content in the corrosion product layer decreased gradually, while the contents of C and O increased accordingly.
Author Contributions
Funding
Institutional Review Board Statement
Informed Consent Statement
Data Availability Statement
Conflicts of Interest
References
- Amir, S.; Richard, B.; Yong, H.; Evgeny, B.; Trevor, L.; Hughes Anne, N. Impact of corrosion products on performance of imidazoline corrosion inhibitor on X65 carbon steel in CO2 environments. Corros. Sci. 2021, 185, 109423. [Google Scholar]
- Yong, H.; Yue, X.Q.; Liu, H.F.; Zhao, Y.; Wen, Z.Z.; Wang, Y.X.; Zhang, T.; Zhang, L.; Sun, J.B.; Anne, N. The evolution and characterisation of the corrosion scales formed on 3Cr steel in CO2-containing conditions relevant to geothermal energy production. Corros. Sci. 2021, 183, 109342. [Google Scholar]
- Barker, R.; Al Shaaili, I.; De Motte, R.A.; Burkle, D.; Charpentier, T.; Vargas, S.M.; Neville, A. Iron carbonate formation kinetics onto corroding and pre-filmed carbon steel surfaces in carbon dioxide corrosion environments. Appl. Surf. Sci. 2019, 469, 135–145. [Google Scholar] [CrossRef]
- Dong, B.; Zeng, D.; Yu, Z.; Le Le, C.; Yu, H.; Shi, S.Z.; Tian, G.; Yi, Y. Major corrosion influence factors analysis in the production well of CO2 flooding and the optimization of relative anti-corrosion measures. J. Pet. Sci. Eng. 2021, 200, 108052. [Google Scholar] [CrossRef]
- Shamsa, A.; Barker, R.; Hua, Y.; Barmatov, E.; Hughes, T.L.; Nevillea, A. Performance evaluation of an imidazoline corrosion inhibitor in a CO2-saturated environment with emphasis on localised corrosion. Corros. Sci. 2020, 176, 108916. [Google Scholar] [CrossRef]
- Ghalib, L.; Abdulkareem, A.; Si, B.; Shaukat, A.; Mazari, A. Modeling the rate of corrosion of carbon steel using activated diethanolamine solutions for CO2 absorption. Chin. J. Chem. Eng. 2020, 28, 2099–2110. [Google Scholar] [CrossRef]
- Hua, Y.; Xu, S.; Wang, Y.; Taleb, W.; Sun, J.; Zhang, L.; Barker, R.; Nevillea, A. The formation of FeCO3 and Fe3O4 on carbon steel and their protective capabilities against CO2 corrosion at elevated temperature and pressure. Corros. Sci. 2019, 157, 392–405. [Google Scholar] [CrossRef]
- Nesic, S. Key issues related to modeling of internal corrosion of oil and gas pipelines. J. Corros. Sci. 2007, 49, 4308–4338. [Google Scholar] [CrossRef]
- De Waard, C.; Lotz, U.; Milliams, D.E. Predictive model for CO2 corrosion engineering in wet natural gas pipelines. J. Corros. 1991, 31, 976–985. [Google Scholar] [CrossRef]
- Turgoose, S.; Cottis, R.A.; Lawson, K. Modelling of electrode processes and surface chemistry in carbon dioxide containing solution A. In Proceedings of the ASTM Symposium on Computer Modelling of Corrosion, San Antonio, TX, USA, 12–13 November 1990. [Google Scholar]
- Silva, C.A.; Varelabc, L.B.; Kolawoleb, F.O.; Tschiptschinb, A.P.; Panossiana, Z. Multiphase-flow-induced corrosion and cavitation-erosion damages of API 5L X80 and API 5DP grade S steels. J. Wear 2020, 452, 203282. [Google Scholar] [CrossRef]
- Helmi, A. On the thermal origin of the antagonistic and synergistic effects of fretting and crevice corrosion processes in multi-phase flow environment. Tribol. Int. 2009, 42, 1263–1268. [Google Scholar]
- Li, W.; Pots, B.F.M.; Brown, B.; Zhong, X. A direct measurement of wall shear stress in multiphase flow—Is it an important parameter in CO2 corrosion of carbon steel pipelines. J. Corros. Sci. 2016, 110, 35–45. [Google Scholar] [CrossRef]
- Liu, Y. Numerical simulations on phase spilt phenomenon in two-phase bubbly and annular flow in T-junction. Ph.D. Thesis, Dalian University of Technology, Dalian, China, 2011. [Google Scholar]
- Fan, Y.Q.; Fang, J.; Igor, B. Complex bubble deformation and break-up dynamics studies using interface capturing approach. Exp. Comput. Multiph. Flow 2021, 3, 139–151. [Google Scholar] [CrossRef]
- Yang, X.H.; Mark-Patrick, M.; Jochen, F. Efficient simulation of bubble dispersion and resulting interaction. Exp. Comput. Multiph. Flow 2021, 3, 152–170. [Google Scholar] [CrossRef]
- Zhang, Y.B.; Yan, K.; Che, D.F.; Guo, L.; Joseph, D.D.; Matsumoto, Y. Effect of slug flow on CO2 corrosion. Am. Inst. Phys. 2010, 1207, 403–409. [Google Scholar]
- Song, W.M.; Yang, G.R.; Dong, X.J.; Wang, F.Q.; Li, J.; Ma, Y. The corrosion behavior of 20# steel in CO2 /H2O two phase plug flow. J. Harbin Inst. Technol. 2017, 49, 116–120. [Google Scholar]
- Villarreal, D.; Laverde, D.; Fuente, C. Carbon-steel corrosion in multiphase slug flow and CO2. J. Corros. Sci. 2006, 48, 2363–2379. [Google Scholar] [CrossRef]
- Yang, G.R.; Pan, Z.X.; Zhang, Z.H.; Song, W.M.; Ma, Y.; Hao, Y. Mesoscopic transformation at initial corrosion stage of 20# steel in aqueous solution under gas–liquid two-phase stratified flow condition. Anti-Corros. Methods Mater. 2021, 68, 53–63. [Google Scholar]
- Yang, G.R.; Song, W.M.; Zhu, Z.B.; Ma, Y.; Hao, Y. Effect of liquid flow velocity on corrosion behavior of 20# steel at initial stage under gas–liquid two-phase plug flow condition. Anti-Corros. Methods Mater. 2020, 67, 415–425. [Google Scholar]
- Sun, W.; Nesic, S. Basics revisited: Kinetics of iron carbonate scale precipitation in CO2 corrosion. J. Corros. 2006, 65, 114–121. [Google Scholar]
- Simard, S.; Drogowska, M.; Menard, H.; Brossard, L. Electrochemical behaviour of 1024 mild steel in slightly alkaline bicarbonate solutions. J. Electrochem. 1997, 27, 317–324. [Google Scholar] [CrossRef]
- Castro, E.B.; Vilche, J.R.; Arvia, A.J.; Charpentier, T. Iron dissolution and passivation in K2CO3-KHCO3 solutions rotating ring discelectrode and XPS studies. J. Corros. Sci. 1991, 32, 37–50. [Google Scholar] [CrossRef] [Green Version]
- Davies, D.H.; Burstein, G.T.; Kermani, M.B.; Hassani, S.; Neville, A. The effects of bicarbonate on the corrosion and passivation of iron. J. Corros. 1980, 36, 416–422. [Google Scholar] [CrossRef]
- Navabzadeh, S.; Zhang, W.; Xu, L.; Brown, B.; Takabe, H. Localized corrosion of mild steel in marginally sour environments. J. Corros. 2017, 24, 22–30. [Google Scholar]
- Videm, K.; Kvarekval, J.; Barmatov, E.; Hughes, T.L.; Neville, A. Corrosion of carbon steel in carbon dioxide-saturated solutions containing small amounts of hydrogen sulfide. J. Corros. Sci. 2015, 51, 260–269. [Google Scholar] [CrossRef]
- Choi, Y.-S.; Nesic, S.; Ling, S. Effect of H2S on the CO2 corrosion of carbon steel in acidic solutions. J. Electrochem. Acta 2011, 56, 1752–1760. [Google Scholar] [CrossRef]
- Jones, D.A. Principles and Prevention of Corrosion; Paper No. 168–198; Prentice-Hall: Hoboken, NJ, USA, 1996. [Google Scholar]
- Zhang, S.; Hou, L.; Du, H.; Mansoori, H.; Laycock, N. A study on the interaction between chloride ions and CO2 towards carbon steel corrosion. J. Corros. Ence 2020, 16, 31–42. [Google Scholar] [CrossRef]
- Gao, K.; Fang, Y.; Pang, X.; Zhang, G.; Qiao, L.; Chu, W. Mechanical properties of CO2 corrosion product scales and their relationship to corrosion rates. Corros. Sci. 2008, 50, 2796–2803. [Google Scholar] [CrossRef]


| Title | 10 Min | 20 Min | 40 Min | 80 Min | 2 H | |||||
|---|---|---|---|---|---|---|---|---|---|---|
| Point 1 | Point 2 | Point 3 | Point 4 | Point 5 | Point 6 | Point 7 | Point 8 | Point 9 | Point 10 | |
| Fe | 89.0 | 73.39 | 77.23 | 67.77 | 76.62 | 58.95 | 78.41 | 58.39 | 75.65 | 56.70 |
| C | 6.45 | 16.18 | 8.79 | 8.70 | 13.88 | 24.29 | 9.67 | 15.25 | 6.91 | 12.98 |
| O | 4.52 | 10.43 | 15.47 | 23.53 | 9.49 | 16.77 | 11.92 | 26.36 | 17.10 | 29.01 |
| Title | 3 H | 4 H | 5 H | 7 H | ||||
|---|---|---|---|---|---|---|---|---|
| Point A | Point B | Point C | Point D | Point E | Point F | Point G | Point H | |
| Fe | 72.26 | 54.97 | 68.1 | 57.43 | 73.42 | 61.64 | 60.76 | 52.74 |
| C | 7.99 | 14.42 | 10.37 | 17.37 | 13.27 | 14.18 | 7.39 | 15.22 |
| O | 19.76 | 30.62 | 21.53 | 25.21 | 13.32 | 24.17 | 31.86 | 32.04 |
| Title | 20 Min | 80 Min | 3 H | 5 H | 7 H | |||||
|---|---|---|---|---|---|---|---|---|---|---|
| Point 1 | Point 2 | Point 3 | Point 4 | Point 5 | Point 6 | Point 7 | Point 8 | Point 9 | Point 10 | |
| Fe | 90.14 | 70.38 | 89.52 | 58.39 | 84.77 | 71.7 | 74.37 | 52.57 | 70.43 | 50.46 |
| C | 6.39 | 17.05 | 5.57 | 15.25 | 6.90 | 10.37 | 8.75 | 11.28 | 7.35 | 15.93 |
| O | 3.48 | 12.56 | 4.88 | 26.36 | 8.37 | 17.93 | 16.89 | 36.16 | 22.23 | 33.62 |
Publisher’s Note: MDPI stays neutral with regard to jurisdictional claims in published maps and institutional affiliations. |
© 2022 by the authors. Licensee MDPI, Basel, Switzerland. This article is an open access article distributed under the terms and conditions of the Creative Commons Attribution (CC BY) license (https://creativecommons.org/licenses/by/4.0/).
Share and Cite
Yang, G.; Song, W.; Pan, Z.; Ma, Y.; Hao, Y. The Initial Corrosion Behavior of 20# Steel under the CO2/Aqueous Solution Gas–Liquid Two-Phase Bubble Flow Condition. Coatings 2022, 12, 1945. https://doi.org/10.3390/coatings12121945
Yang G, Song W, Pan Z, Ma Y, Hao Y. The Initial Corrosion Behavior of 20# Steel under the CO2/Aqueous Solution Gas–Liquid Two-Phase Bubble Flow Condition. Coatings. 2022; 12(12):1945. https://doi.org/10.3390/coatings12121945
Chicago/Turabian StyleYang, Guirong, Wenming Song, Zhaoxia Pan, Ying Ma, and Yuan Hao. 2022. "The Initial Corrosion Behavior of 20# Steel under the CO2/Aqueous Solution Gas–Liquid Two-Phase Bubble Flow Condition" Coatings 12, no. 12: 1945. https://doi.org/10.3390/coatings12121945