Article

Molecular Dynamics Study of Phase Transition Heat Transfer in Water Nanofilm on Nanorough Surfaces

1
Shandong Engineering Laboratory for Preparation and Application of High-Performance Carbon Materials, College of Electromechanical Engineering, Qingdao University of Science and Technology, Qingdao 266061, China
2
State Key Lab of Marine Coatings, Marine Chemical Research Institute Co., Ltd., Qingdao 266071, China
*
Author to whom correspondence should be addressed.
Coatings 2022, 12(12), 1943; https://doi.org/10.3390/coatings12121943
Submission received: 14 November 2022 / Revised: 1 December 2022 / Accepted: 8 December 2022 / Published: 10 December 2022

Abstract

:
The thermal management of micro- and nano-electromechanical systems is closely related to maintaining optimal system performance and reliability. Heat dissipation through the phase transition of the working medium has emerged as an effective approach to these problems. In this study, the phase transition of liquid nanofilms over copper surfaces with various heat fluxes, nanoroughness, and wetting conditions is studied by means of molecular dynamics simulations. The results indicate that the phase transition mode of the water nanofilm is normal evaporation at low heat flux and explosive boiling at high heat flux. Two different nanorough surfaces with the same surface area have almost an identical effect on the water nanofilm phase transition. Explosive boiling occurs earlier on hydrophobic surfaces, which is consistent to the macroscopic phenomenon. The heat flux at which explosive boiling occurs on nanorough surface increases for hydrophobic and neutral surfaces compared with smooth surfaces and remains constant for hydrophilic surfaces. The onset of explosive boiling on nanorough surfaces is later than that on smooth surfaces. These findings on the mechanism of heat and mass transfer at the micro- and nanoscale are conducive to efficient utilization and energy conservation.

1. Introduction

With the rapid evolution of micro- and nano-electromechanical systems (MEMS/ NEMS), electronic devices are gradually becoming compact, light, miniaturized, and efficient [1]. The heat flux on the surface of electronic devices can reach an extremely high order of magnitude, being up to 10 W/m2 in some highly sophisticated fields, such as nuclear power and aerospace [2]. The thermal management of various electronic devices due to high heat flux is one of the most challenging problems in the rapidly developing field of MEMS/NEMS. Therefore, how to dissipate heat efficiently and in a timely manner has become a focus of research and development for devices in various fields. Because of the extremely high heat transfer coefficient near the solid–liquid surface, caused by the latent heat of vaporization released and violent disturbence due to bubble, the boiling of working fluids is recognized as an effective means of solving the thermal management problems for a variety of microelectronic devices [3,4]. When the size is reduced to the micro- and nanoscale, the phase transition heat transfer in MEMS/NEMS may be different from that in macroscopic systems, both in theory and in practice. Moreover, precise experiments on the phase transition of liquid films at the nanoscale cannot be performed due to time and space limitations, leading to an inaccurate understanding of the boiling phenomenon by researchers. Therefore, it is essential to investigate the mechanism of liquid film boiling at the nanometer level. Molecular dynamics (MD), which is oriented directly towards the atomic level, has been widely accepted as an effective tool for studying heat transfer at micro- and nanoscales [5].
Recently, studies on the enhancement of boiling heat transfer on surfaces with nanostructure, nanoporosity, and nanomaterial coatings, which is essentially achieved by altering the surface nanoroughness and wettability, have received extensive attention [6,7,8]. In molecular dynamics, researchers have simulated and observed the phase transitions in the liquid nanofilm by adjusting the size control parameters of the nanoroughness on the surface, as well as the extent of surface superheat. Moreover, the mechanism of that has been explored through the atomic distributions, temperature profiles, and critical heat flux densities over time and space. The solid surface can be divided into homogeneous and heterogeneous surfaces, depending on whether the nanoroughness of the material is consistent with that of the substrate. As for homogeneous surfaces, the modifications of metallic substrates are common, such as the construction of perforated nanochannels, localized nanocavities, and regular cubic protrusions. In general, nanoroughness is beneficial for the enhancement of boiling heat transfer, which is embodied in the increasing temperature when liquid nanofilm leaves solid surface, reducing the size of the unevaporated liquid nanofilm clusters, and shortening the time required for phase transition [9,10,11,12,13,14,15,16,17,18]. Additionally, it has been found that there is an optimal range between the size of the nanoroughness and the enhancement effect. As for heterogeneous surfaces, there are numerous nanoroughness materials, among which the common ones are metals and carbon nanomaterials, such as graphene and carbon nanotubes. Qasemian et al. [19] studied the explosive boiling of a thin argon nanofilm on conical Al-Cu-based nanostructures and found that the surface with a Cu-Al nanostructure has better heat transfer efficiency than the surface with a single-metal nanostructure. Tang et al. [20] investigated the boiling of nanofilm on a single-layer graphene-coated Cu-like surface, and found that the heat transfer of the nanofilm during boiling is barely affected by the single-layer graphene coating. However, Refs. [21,22] showed that single-layer graphene reduces the degree of superheating to reach the critical heat flux, and defective single-layer graphene has a higher initial heat flux than pristine graphene. In summary, the Kapitza thermal resistance and the energy difference between the solid face and the liquid are the main influences.
Wettability refers to the ability of a liquid to spread on a solid surface, typically determined by the interaction between atoms or groups of atoms at the solid–liquid surface. It also has a very important impact on the phase transition of the liquid nanofilm, which is manifested by the droplet contact angle. According to the contact angle from small to large, the surface can be divided into a lyophilic surface, neutral surface, and lyophobic surface [23]. In molecular dynamics, the tuning of wettability is achieved by varying the energy parameter of the solid–liquid surface. Taking water as an example [24], droplet wetting behavior that is basically consistent with macroscopic phenomena has been achieved by MD simulations. According to classical nucleation theory, explosive boiling is expected to occur more favorably on hydrophobic surfaces, but the behavior of the phase transition at the nanoscale is significantly different from that observed in macroscopic phenomena. It has been explained by researchers that the stronger the potential energy between the surface and the liquid, the stronger the wettability of the surface, which causes the Kapitza thermal resistance of the lyophilic surface to be smaller than that of the lyophobic surface. Therefore, the gradient and heat between the liquid nanofilm and lyophilic surface is higher, resulting in higher heat transfer efficiency [25,26,27,28,29,30,31,32,33,34]. However, the heating method used in the above references of setting a constant degree of superheat for the solid surface is not consistent with the thermal dissipation scenario at the nanoscale. Therefore, a more realistic heating method, in which a constant heat flux is applied to the bottom plate, has been innovated in MD simulations. Tang et al. [35] investigated the phase transition of water nanofilm, considering the effects of heat flux and wettability, eventually obtaining a conclusion consistent with the macroscopic phenomenon.
Research on phase transitions in liquid nanofilms have become hot topics, taking into account the effects of nanoroughness or wettability. However, the use of a constant heat flux instead of a fixed temperature difference as a heat source has been little investigated. Therefore, it is desirable to study this question with different nanoroughness, wettability, and heat flux through molecular dynamics simulations to enrich the research in this area. In addition, the height and width of the nanorough surface are skillfully combined by the sinusoidal function. Moreover, the effect of the nanorough surface and wettability is verified in terms of the atomic distribution, the bottom plate temperature, the number of evaporating atoms, and the spatial profile of the temperature to reveal the mechanism of heat transfer on the molecular scale.

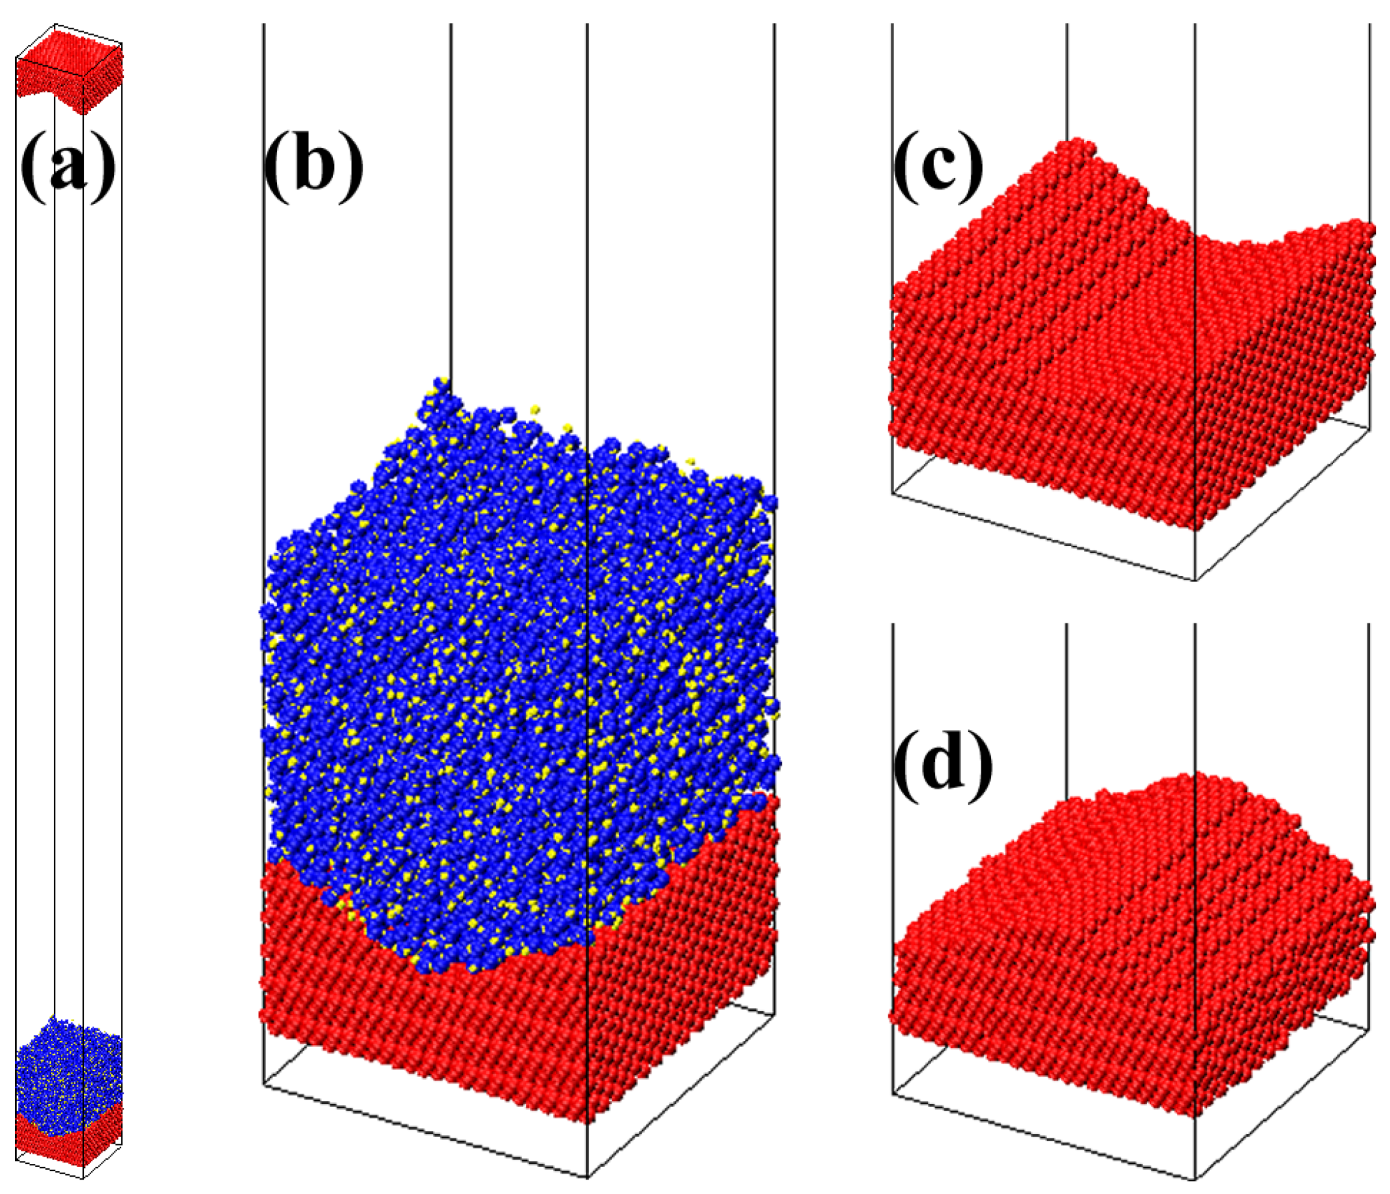
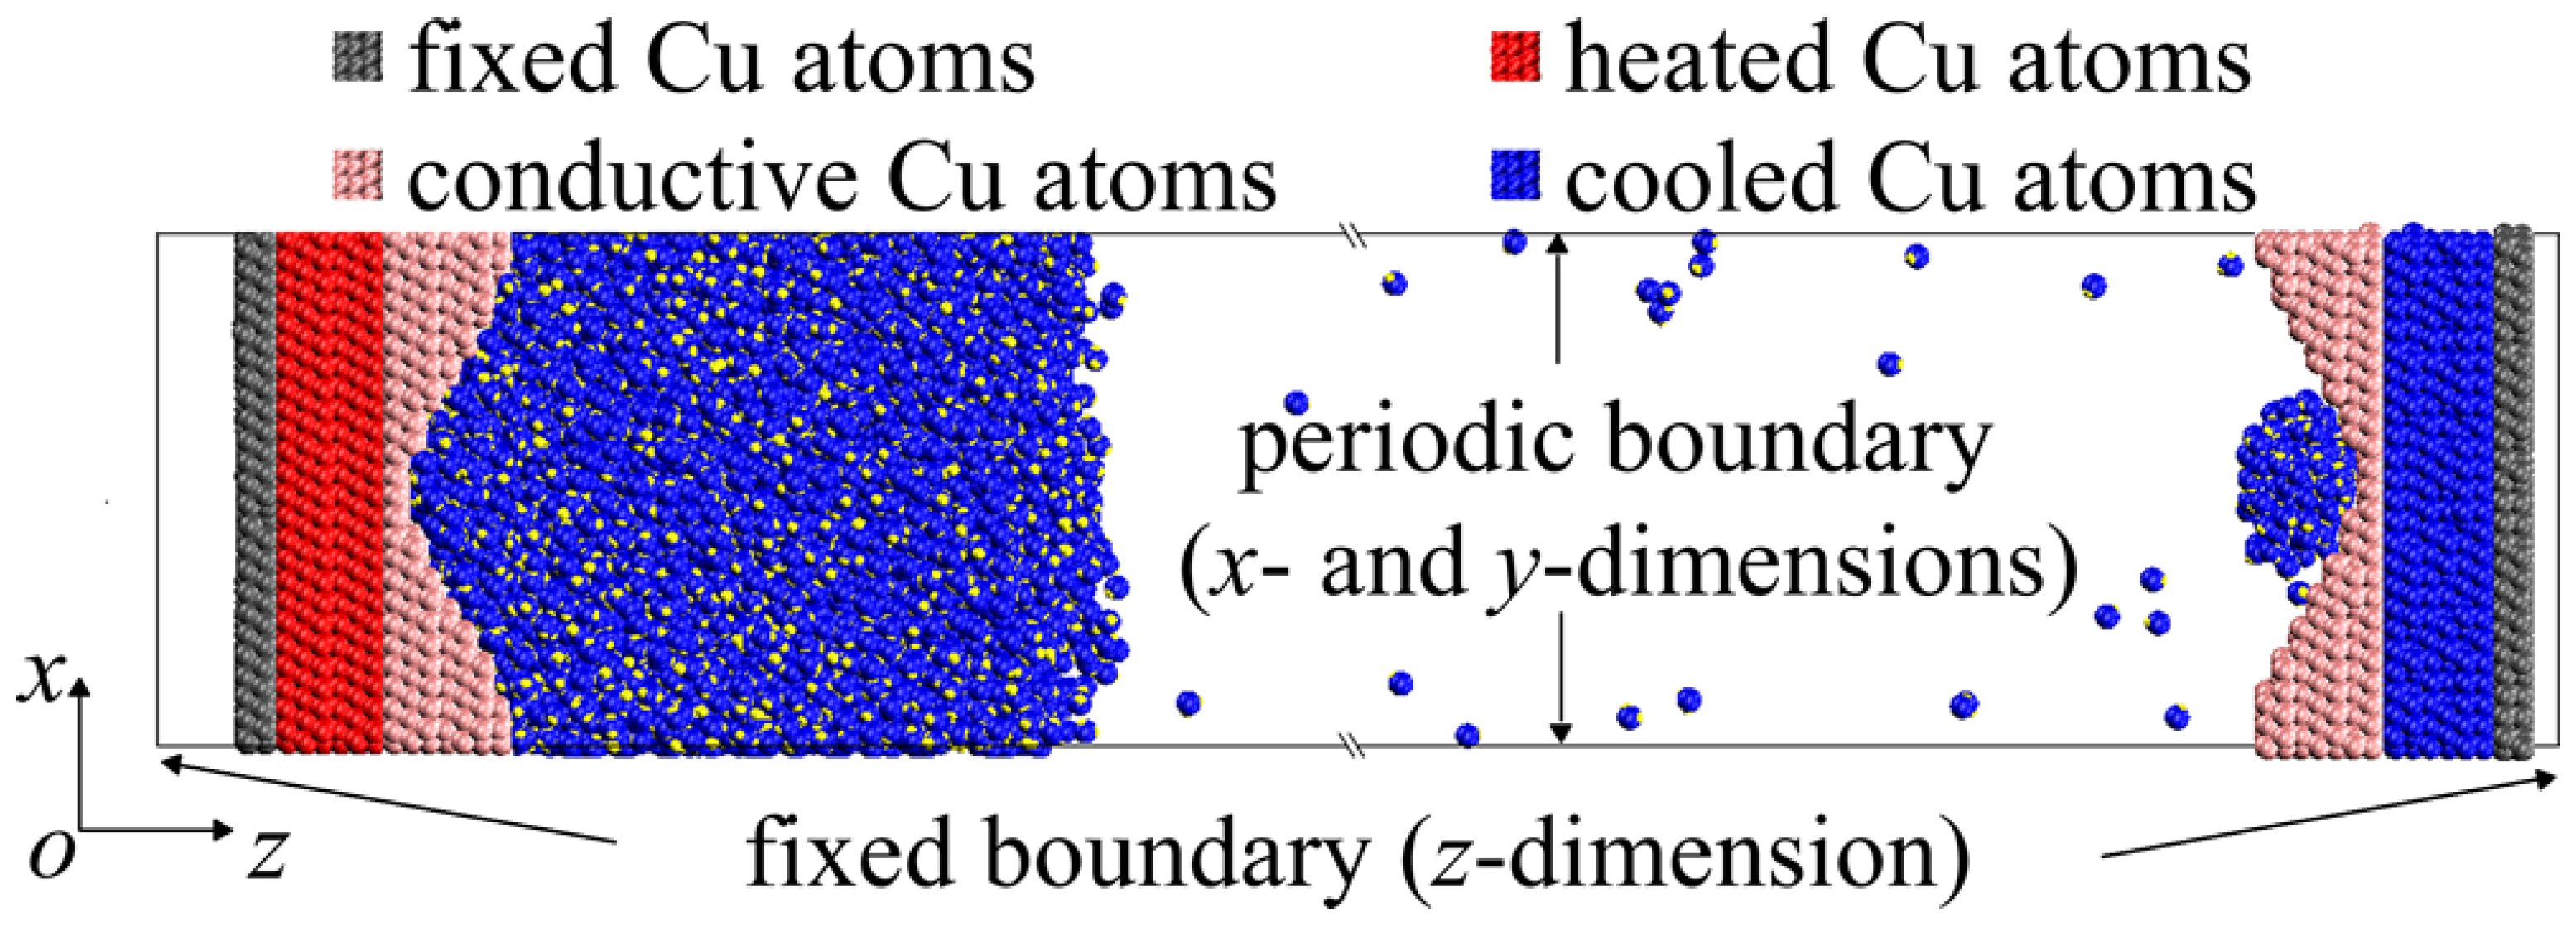
2. Simulation Methods

In this simulation, an initial system with a size of 6.2 × 6.2 × 102.0 nm3 and 40,128 atoms was constructed to investigate the phase transition heat transfer of a water (H2O) nanofilm over a Cu plate with different heat flux and wettability, as shown in Figure 1a. A Cu plate was placed at the bottom of the system, the mirror of which was at the top of the system. Both of them were obtained by setting a regular half-period sinusoidal surface on a flat substrate; the mathematical expression for the projection of which onto the x o z plane is
z = 6 ( sin 5 π 31 x + 5.05 ) + 34.38
To guarantee that the length of the half-cycle was exactly 6.2 nm and the number of atoms in the bottom plate was the same as that of the smooth surface, the period was valued. Meanwhile, the amplitude was set to six to avoid the nanostructures being too tall, becoming unstable and eventually collapsing. In addition, the initial phase and setover were set to 5.05 and 34.38, respectively, which ensured that the nanostructure was placed exactly on the midline of the flat substrate. Two different surface structures were studied in this work (Figure 1c,d): one is a sinusoidal surface at minus one half-cycle to one half-cycle (i.e., −Surface 1), and the other is at one half-cycle to three half-cycles (i.e., Surface 1). Both of them had a surface area of 95.4434 nm2, which is 2.48 times larger than that of the smooth bottom plate. Moreover, each plate contained 8064 Cu atoms arranged in a face-centered cubic (FCC) lattice structure with a lattice constant of 0.3615 nm at 297 K. A cuboid box containing a H2O molecule was established with a size of 0.31 × 0.31 × 0.31 nm3 depending on the density of water. Then, the cuboid box was replicated 20 times in three dimensions to form a water nanofilm placed over the bottom plate.
It is widely accepted to use the embedded atom method (EAM) [36] to describe the atomic interactions among Cu atoms. Moreover, a simple point charge (SPC/E) [37] model is used to describe the atomic and molecular interactions among H2O molecules. Some of the parameters of water molecules in this model are shown in Table 1, where e is elementary charge. Moreover, the Coulomb forces between Cu atoms and hydrogen and oxygen atoms in water molecules are neglected, considering that the Cu atoms have no charge. Meanwhile, the O-H bond length and H-O-H angle are fixed to 0.1 nm and 109.47° for rigid H2O molecules with the SHAKE algorithm [38]. The intermolecular van der Waals (vdW) forces among the H2O molecules and between H2O molecules and Cu atoms are calculated by using the widely accepted 12-6 Lennard–Jones (L-J) potential. The L-J potential can be expressed as
Φ ( r i j ) = 4 ϵ [ ( σ r i j ) 12 ( σ r i j ) 6 ] , r i j r c u t 0 , r i j > r c u t
where r i j is the distance between atoms i and j. Meanwhile, r c u t is the cut-off distance, which is selected r c u t = 1.0 nm in these simulations. The distance parameter is σ and the energy parameter is ϵ , both of which are linked to the properties of the solid–liquid surface.
Wettability has a remarkable impact on the boiling of liquid nanofilms. Molecular dynamics studies have shown that wettability is determined by interactions between atom pairs at the solid–liquid interface. A common way to change the wettability is to vary the potential energy parameter in the pair of atoms. A previous work [24] confirmed that when the potential energy parameter (i.e., ϵ O C u ) and the distance parameter (i.e., σ O C u ) between Cu atoms and water molecules are taken as 7.370 meV and 0.3190 nm, respectively, the simulated value of the contact angle is consistent with the experimental value, which is 84.1 ± 1.8 . Moreover, according to our previous simulations [35], the Cu surface is hydrophilic for values of the energy parameter ϵ O C u above 7.370 meV. In turn, it is hydrophobic for values of the energy parameter ϵ O C u less than 7.370 meV. The parameters ϵ and σ are shown in Table 2 [24,35].
The initial system was run for 0.1 ns and 1 ns under the isothermal–isobaric (NPT) and canonical (NVT) ensembles, respectively, maintaining a temperature and pressure of 275 K and 1 atm, respectively. Then, the stable system, after being equilibrated, was changed into a pseudo-microcanonical (pseudo-NVE) ensemble to collect data and observe the phase transition of the water nanofilm. Figure 2 shows the arrangements of boundaries and reservoirs. In this system, only the boundary in the z direction is a fixed boundary. The bottom plate is divided into a fixed Cu atom, a thermal reservoir, and a conducting Cu atom, where the fixed atom is frozen to avoid atom percolation and translational motion. The atomic setup of the top plate is essentially the same as that of the bottom plate, except that the hot reservoir is transformed into a cool reservoir. The Cu atoms in the hot reservoir are subjected to a heat flow Q by using an asymmetric version of the enhanced heat exchange algorithm [39]. The heat flux q applied to raise the bottom plate temperature to generate a phase transition is calculated as
q = Q A x o y
where A x o y is the cross-sectional area of the simulated cuboid in the x o y plane. The q is q 0 = 1 × 10 9 W/m2 which corresponds to Q 0 = 237.18 eV/ns. The Cu atoms in the cool reservoir, with a temperature of 273 K, are used to condense the evaporated H2O molecules. Table 3 shows the serial number of the simulation cases according to the heat flow Q and the energy parameter ϵ O C u used for various nanorough surfaces and wetting conditions.
According to the statistical interpretation, the relationship between the temperature T and atomic kinetic energy is expressed as
D O F 1 2 k B T = i = 1 N 1 2 m i v i 2
where k B is the Boltzmann constant, and m i and v i correspond to the mass and the velocity of atom i, respectively. D O F is the total degrees of freedom for each type of atoms. In these simulations, the D O F of Cu atoms is still commonly 3N, where N is the number of atoms, while the D O F of the water molecules is 2N, for they are rigid molecules.
The large-scale atomic/molecular massively parallel simulator (LAMMPS) are used to emulate all MD simulations. The velocity and position of atoms are computed every 1 fs. The pseudo-NVE sub-simulation is set to last 10 ns–13 ns to ensure the water nanofilm phase change completely, in which the data are collected every 0.001 ns. Visual molecular dynamics (VMD) is used for visualization.

3. Results and Discussion

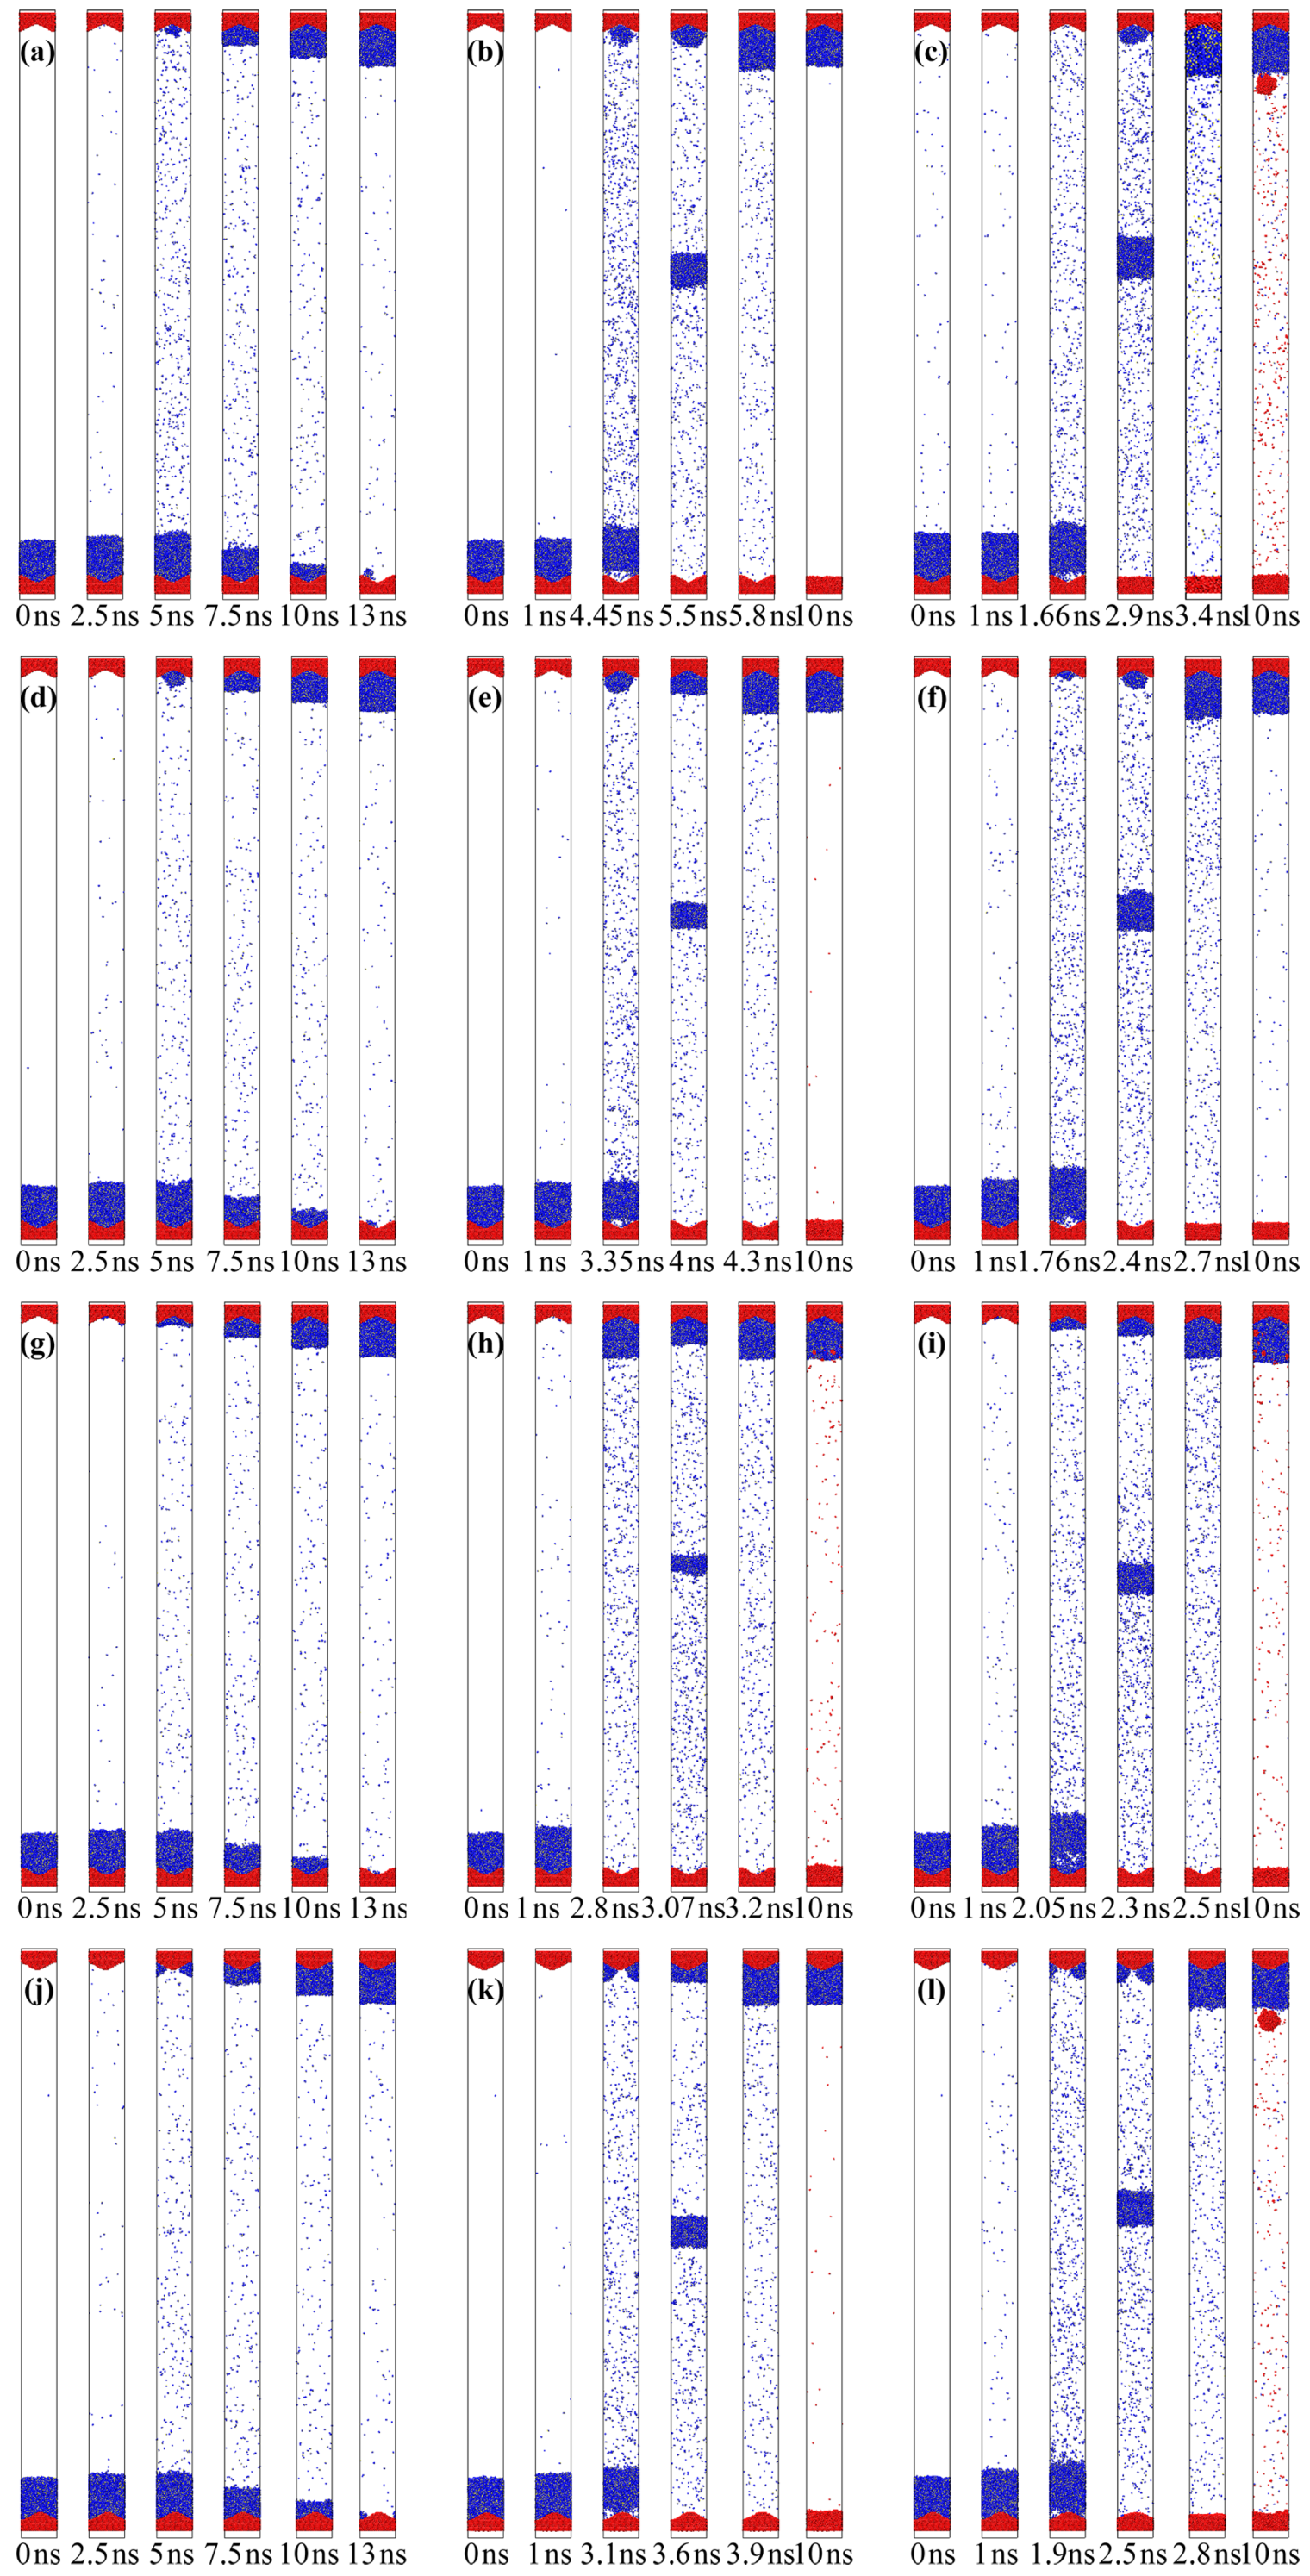
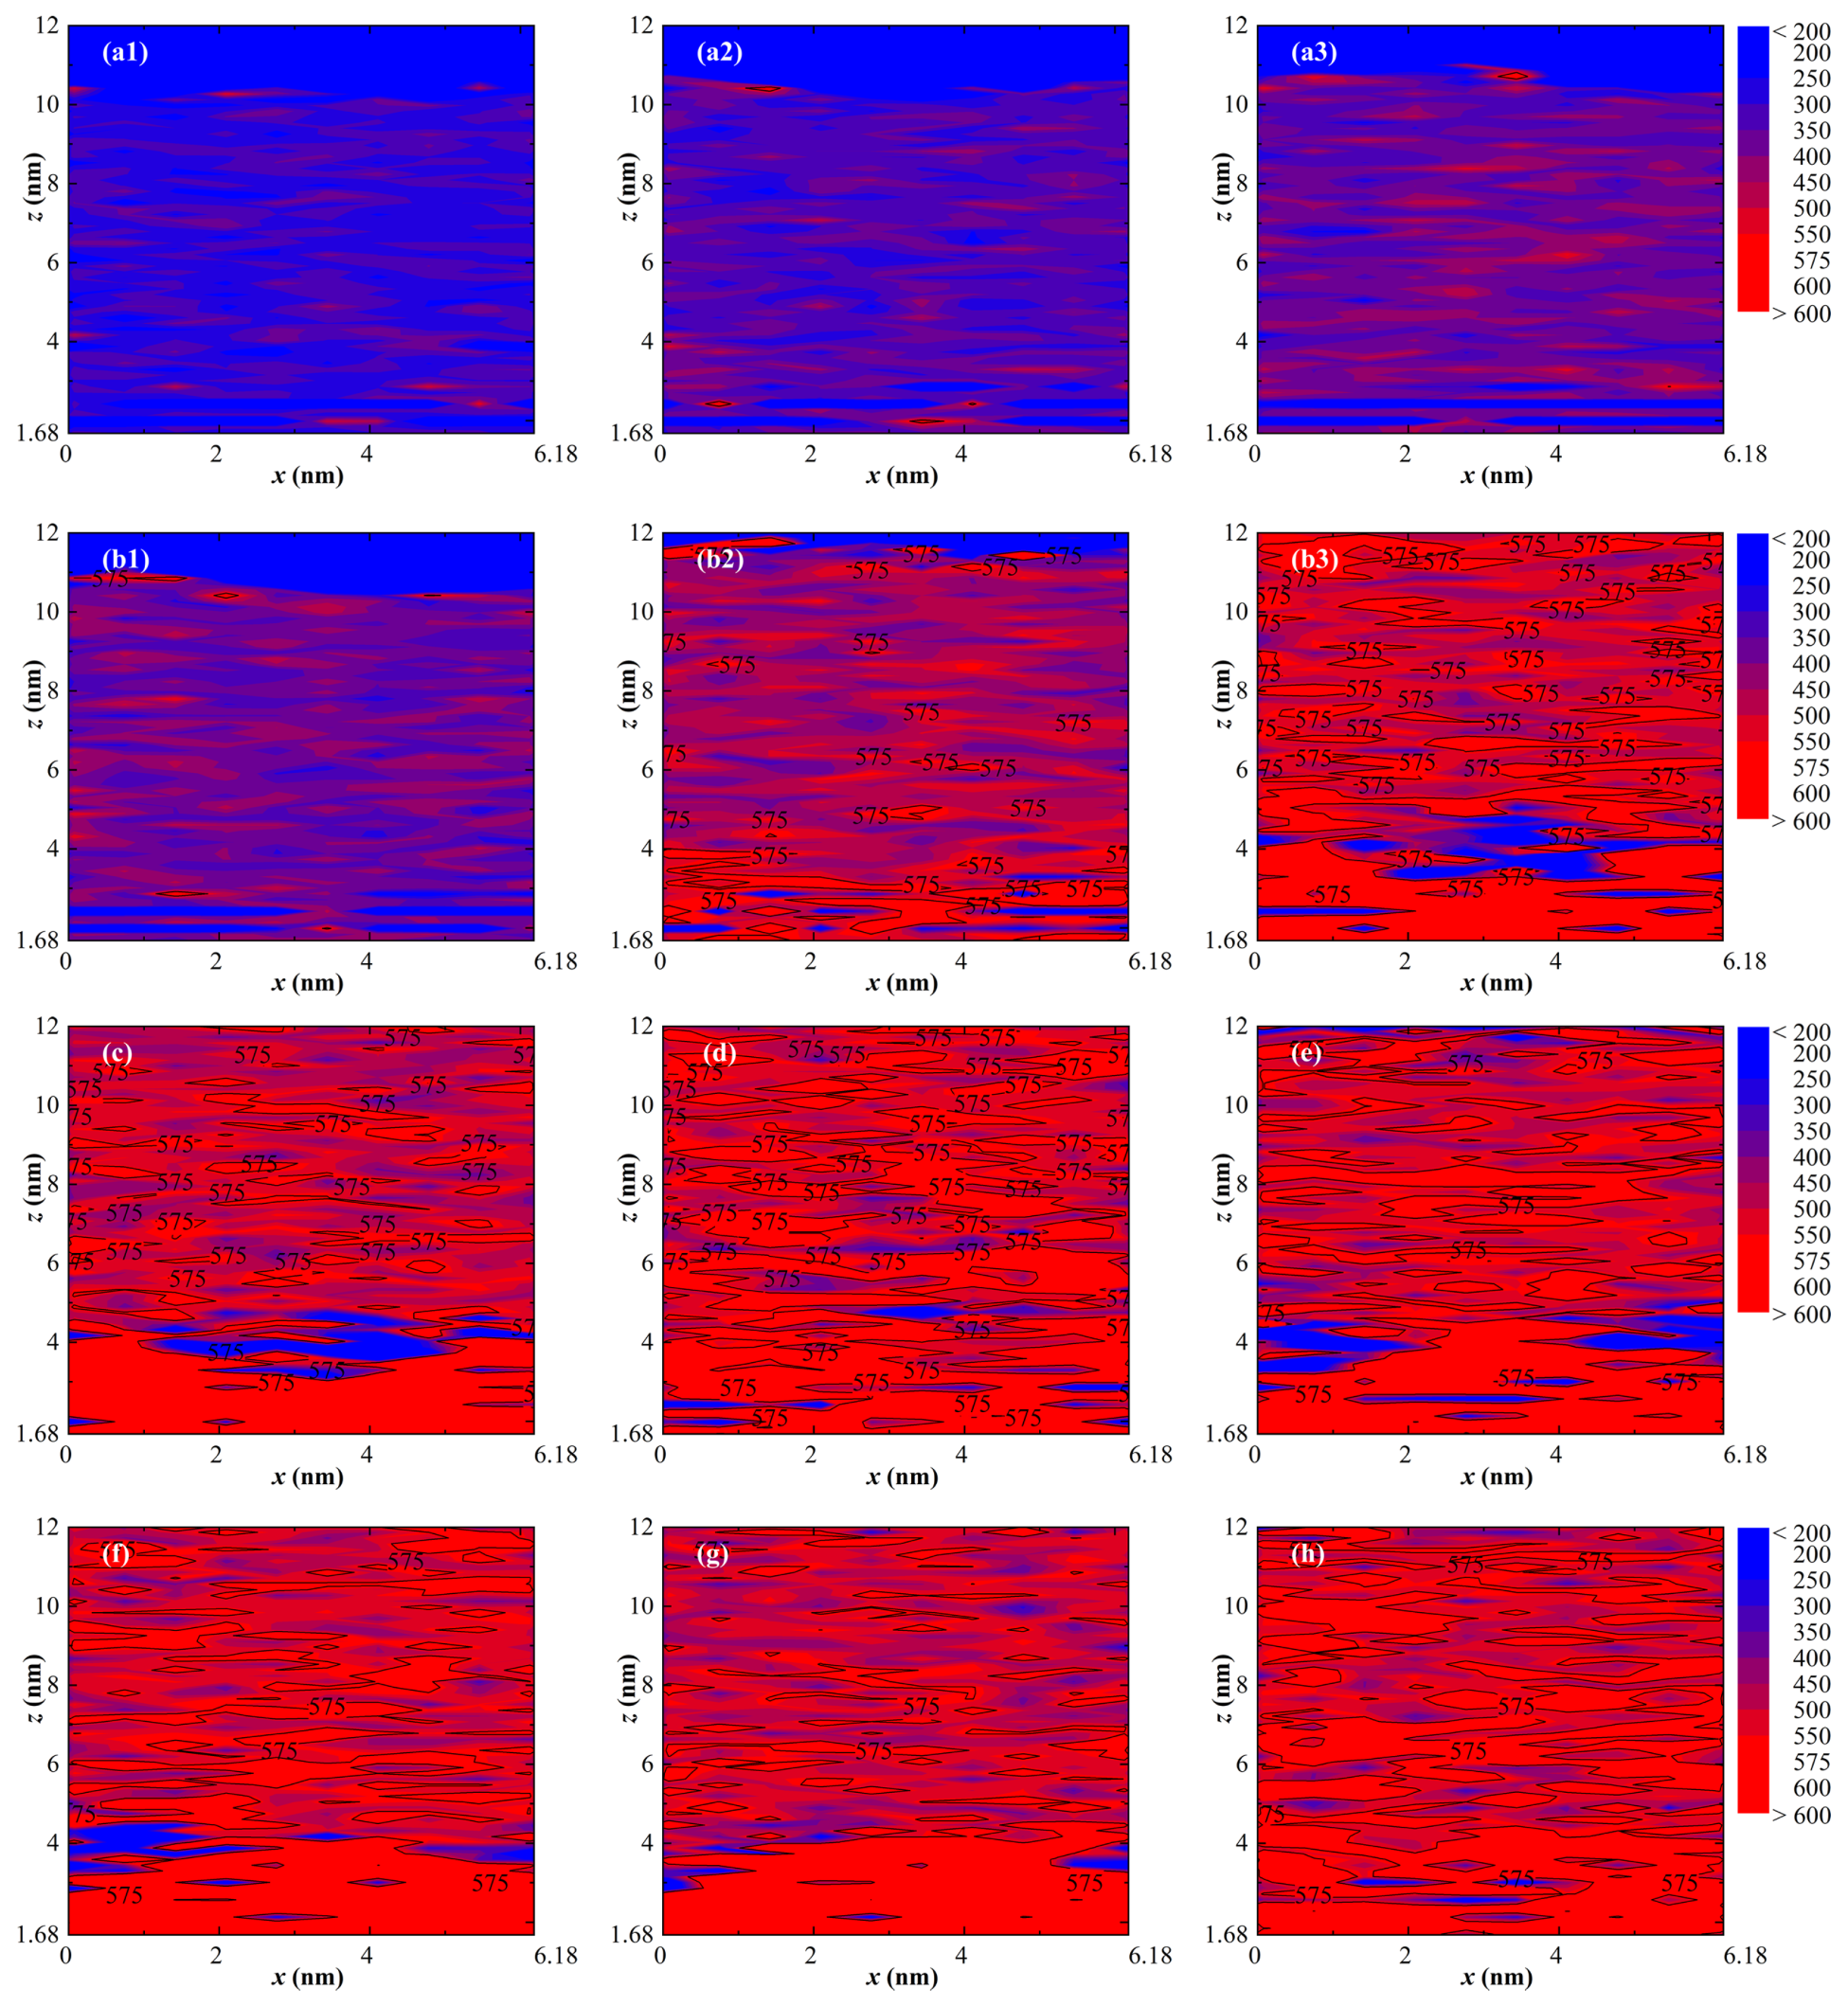
3.1. Spatial Distribution of Atoms and Shift in Phase Transition Modes

Based on the atomic distribution snapshots, as shown in Figure 3, it is observed that there are two modes of the water nanofilm phase transition—normal evaporation and explosive boiling—the conversion of which is connected to the heat flux, illustrated by some cases in Surface 1 and Surface 1. As shown in Figure 3a,d,g,j, which correspond to normal evaporation case nos. 1, 5, 9 and 17, respectively, it can be seen the water nanofilm starts to evaporate, and the water molecules are detached from the upper surface of the water nanofilm as heat is continuously input into the system. Therefore, the thickness of the water nanofilm gradually decreases until there are almost no water molecules on the bottom plate. As the heat flux increases, the evaporation rate of the water nanofilm also increases, shortening the time for its complete evaporation. Comparing Figure 3a,d,g, it can be seen that the evaporation rate of the water nanofilm gradually increases within 2.5 to 7.5 ns as the wettability of the solid–liquid surface changes from hydrophobic to hydrophilic. After 7.5 ns, the evaporation rate is virtually the same. Comparing Figure 3d,j, the normal evaporation of the two nanorough surfaces is basically the same. Both parts of the unevaporated water nanofilm end up in the lowest position of the bottom plate.
Figure 3b,c,e,f,h,j–l reflect the explosive boiling case nos. 3, 4, 7, 8, 11, 12, 19 and 20, respectively. It can be observed that water nanofilm first evaporates for a period of time, and then a vapor film forms immediately on the surface of the bottom plate, which takes the remaining water nanofilm off the bottom plate. Moreover, the increasing heat flux in the same wettability cases significantly shortens the time for explosive boiling to occur, implying a reduced evaporation period as well. Therefore, the unevaporated nanofilm is thicker at high heat flux. As shown in Figure 3b,e,h, the amount of heat flux required for explosive boiling to occur increases gradually as the solid–liquid surface changes from hydrophobic to hydrophilic, the valve of which is 2 q 0 for hydrophobic surfaces, 3.5 q 0 for neutral surfaces, and 5 q 0 for hydrophilic surfaces. Meanwhile, Figure 3c,f,j,l show that the onset time of explosive boiling in case nos. 4, 8, 12, and 20 is delayed at the same heat flux, 6 q 0 . That is, explosive boiling is more favorable on hydrophobic surfaces, which is consistent with the macroscopic results. Comparing Figure 3e,k, the lowest heat flux at which explosive boiling occurs remains the same. All that changes is the onset of explosive boiling, which is perfectly acceptable due to the sampling interval and the error in the timing of the selection.
In addition, Figure 3b,c,e,f illustrate that a cavity without any water molecules is observed at the lowest position of the hydrophobic and neutral solid surface at the beginning of explosive boiling. However, Figure 3h,i show that there is a water nanofilm with a certain thickness between the cavity and the solid surface for the hydrophilic surface. The location where the cavity is created is invariably the lowest part of both the nanorough surfaces. Finally, it is found that the bottom plate starts to melt, the nanorough structure is destroyed, and the Cu atoms eventually evaporate.
The difference with respect to our previous work [35] is mainly reflected in the explosive boiling. First, for hydrophilic and neutral surfaces, the heat flux at which explosive boiling occurs increases from 1.5 q 0 and 3 q 0 to 2 q 0 and 3.5 q 0 for hydrophilic and neutral surfaces, respectively. This may be due to the fact that the nanoroughness increases the heat transfer area. Moreover, the spatial profile of the temperature illustrates that it is more uniform inside the water nanofilm. However, the value remains at 5 q 0 for hydrophilic surfaces, which is associated with stronger intermolecular forces. Second, the occurance of explosive boiling is advanced to varying degrees at the heat flux 6 q 0 , especially on hydrophilic surfaces.

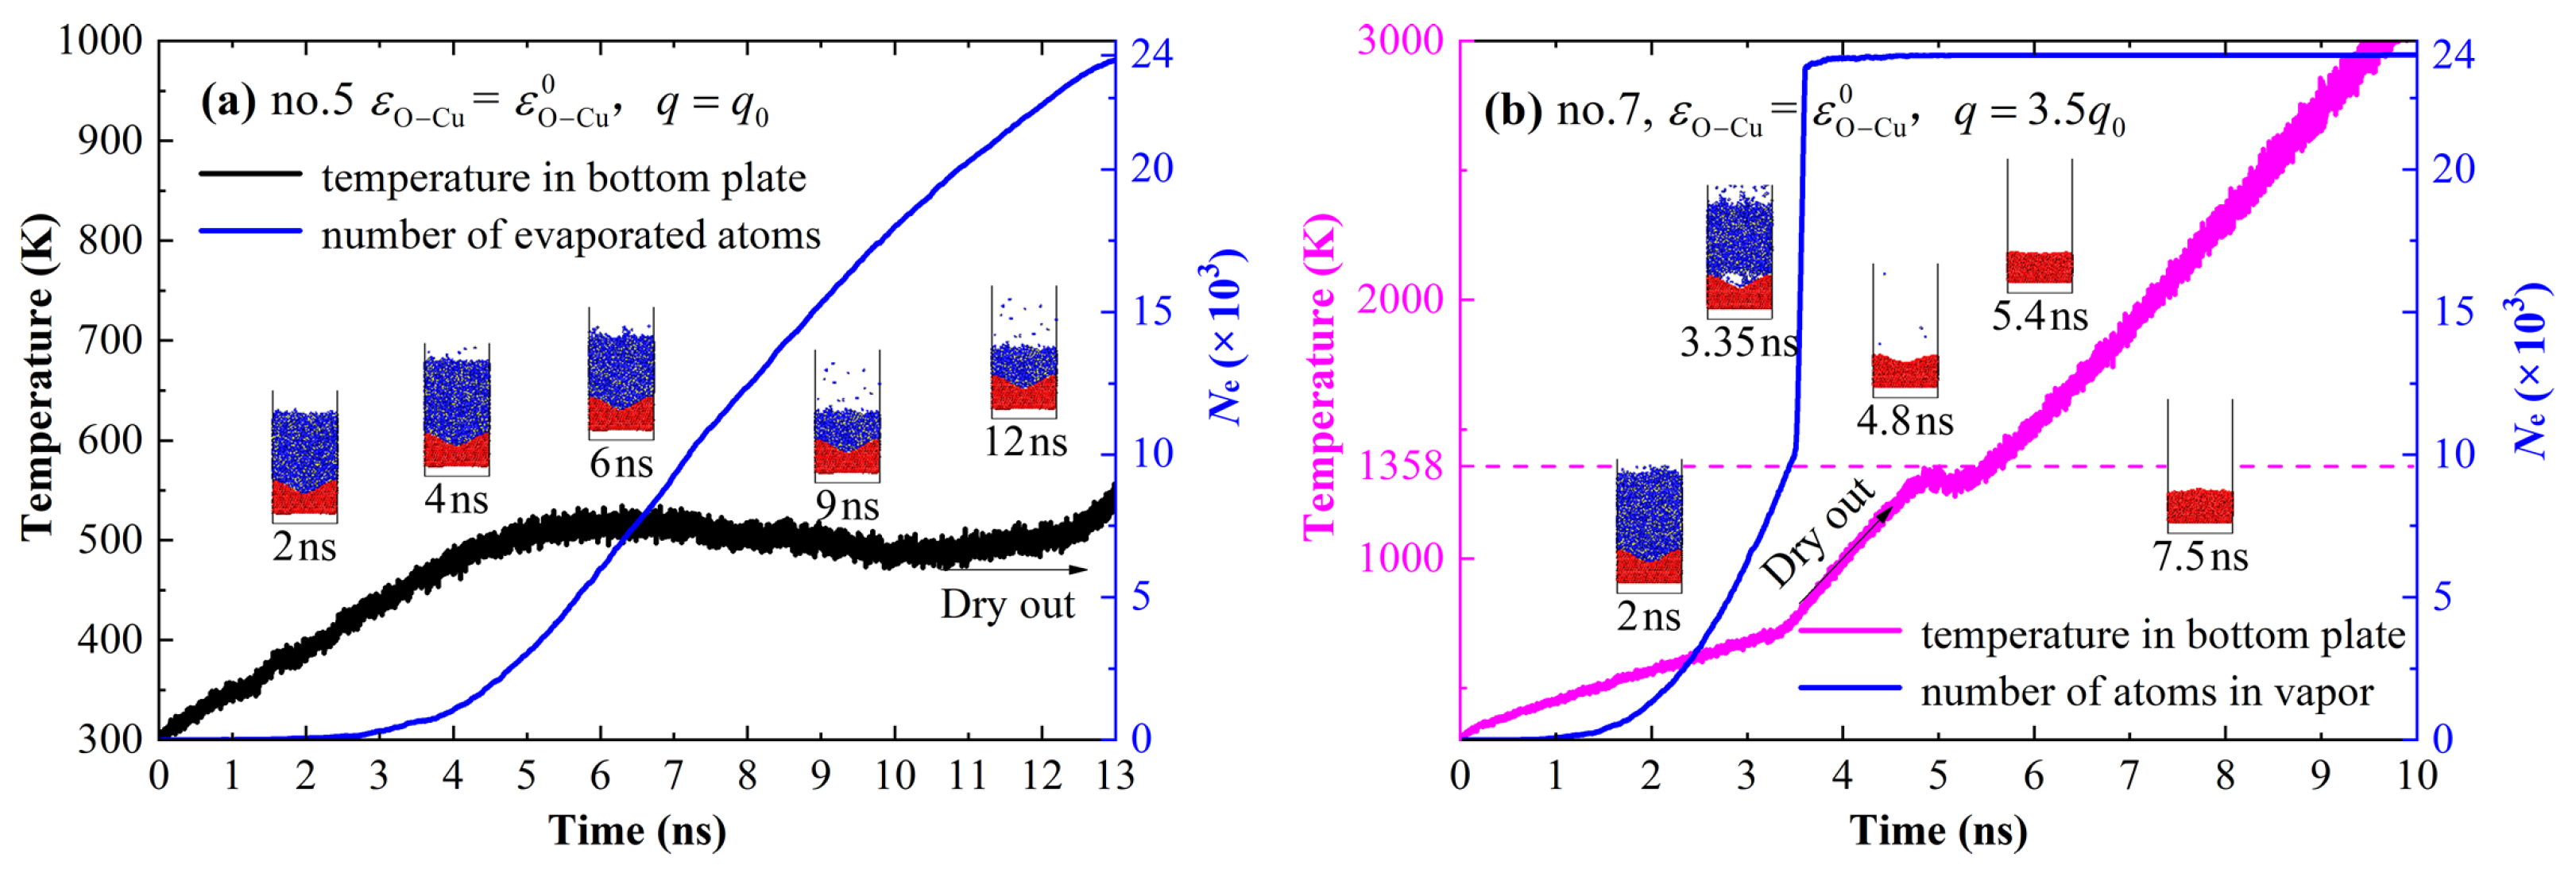
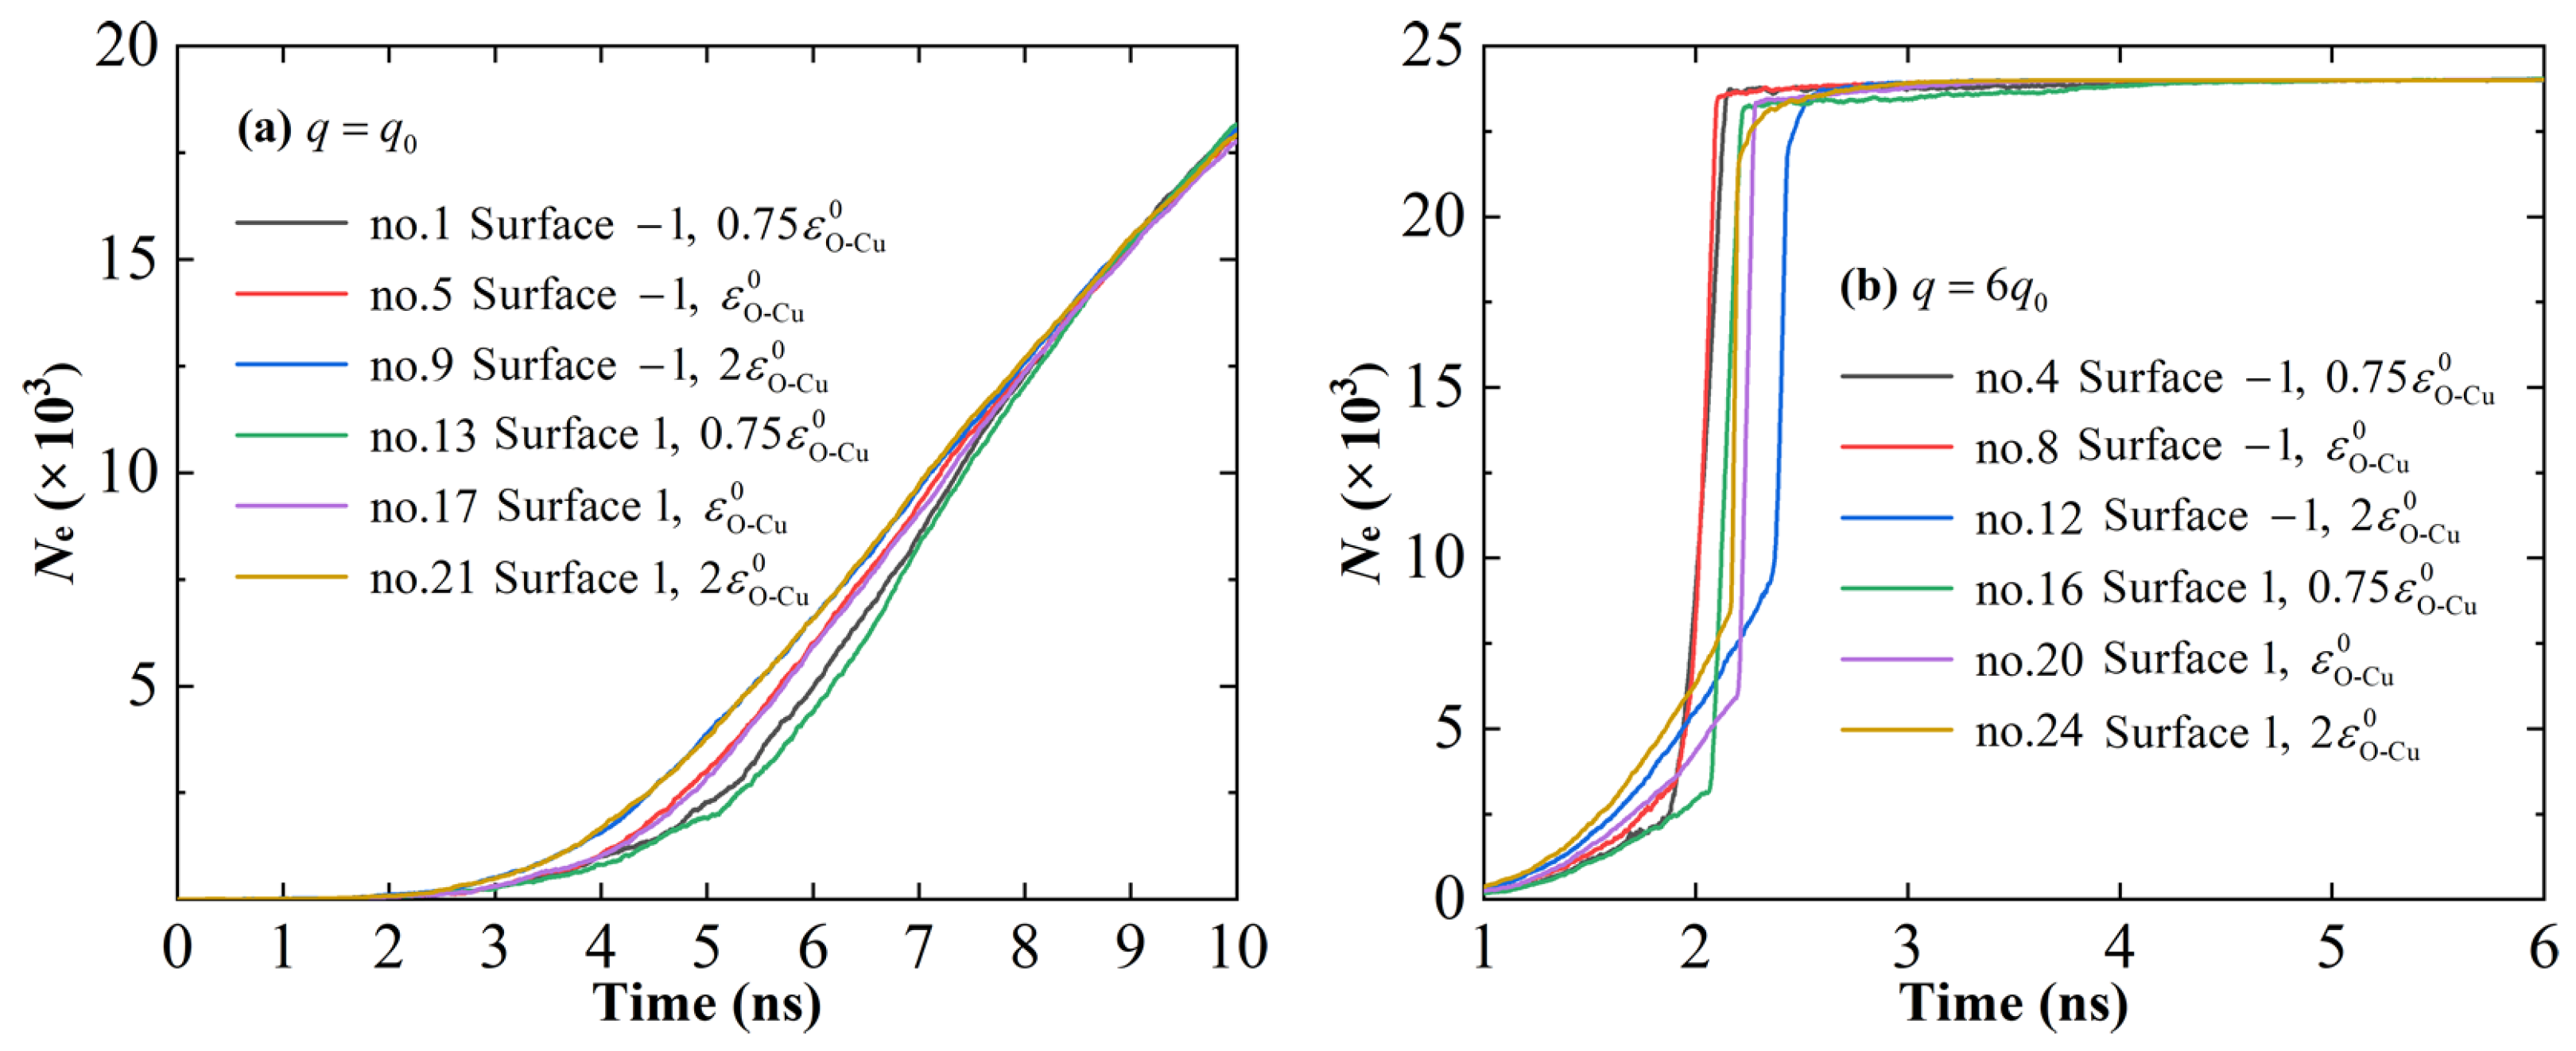
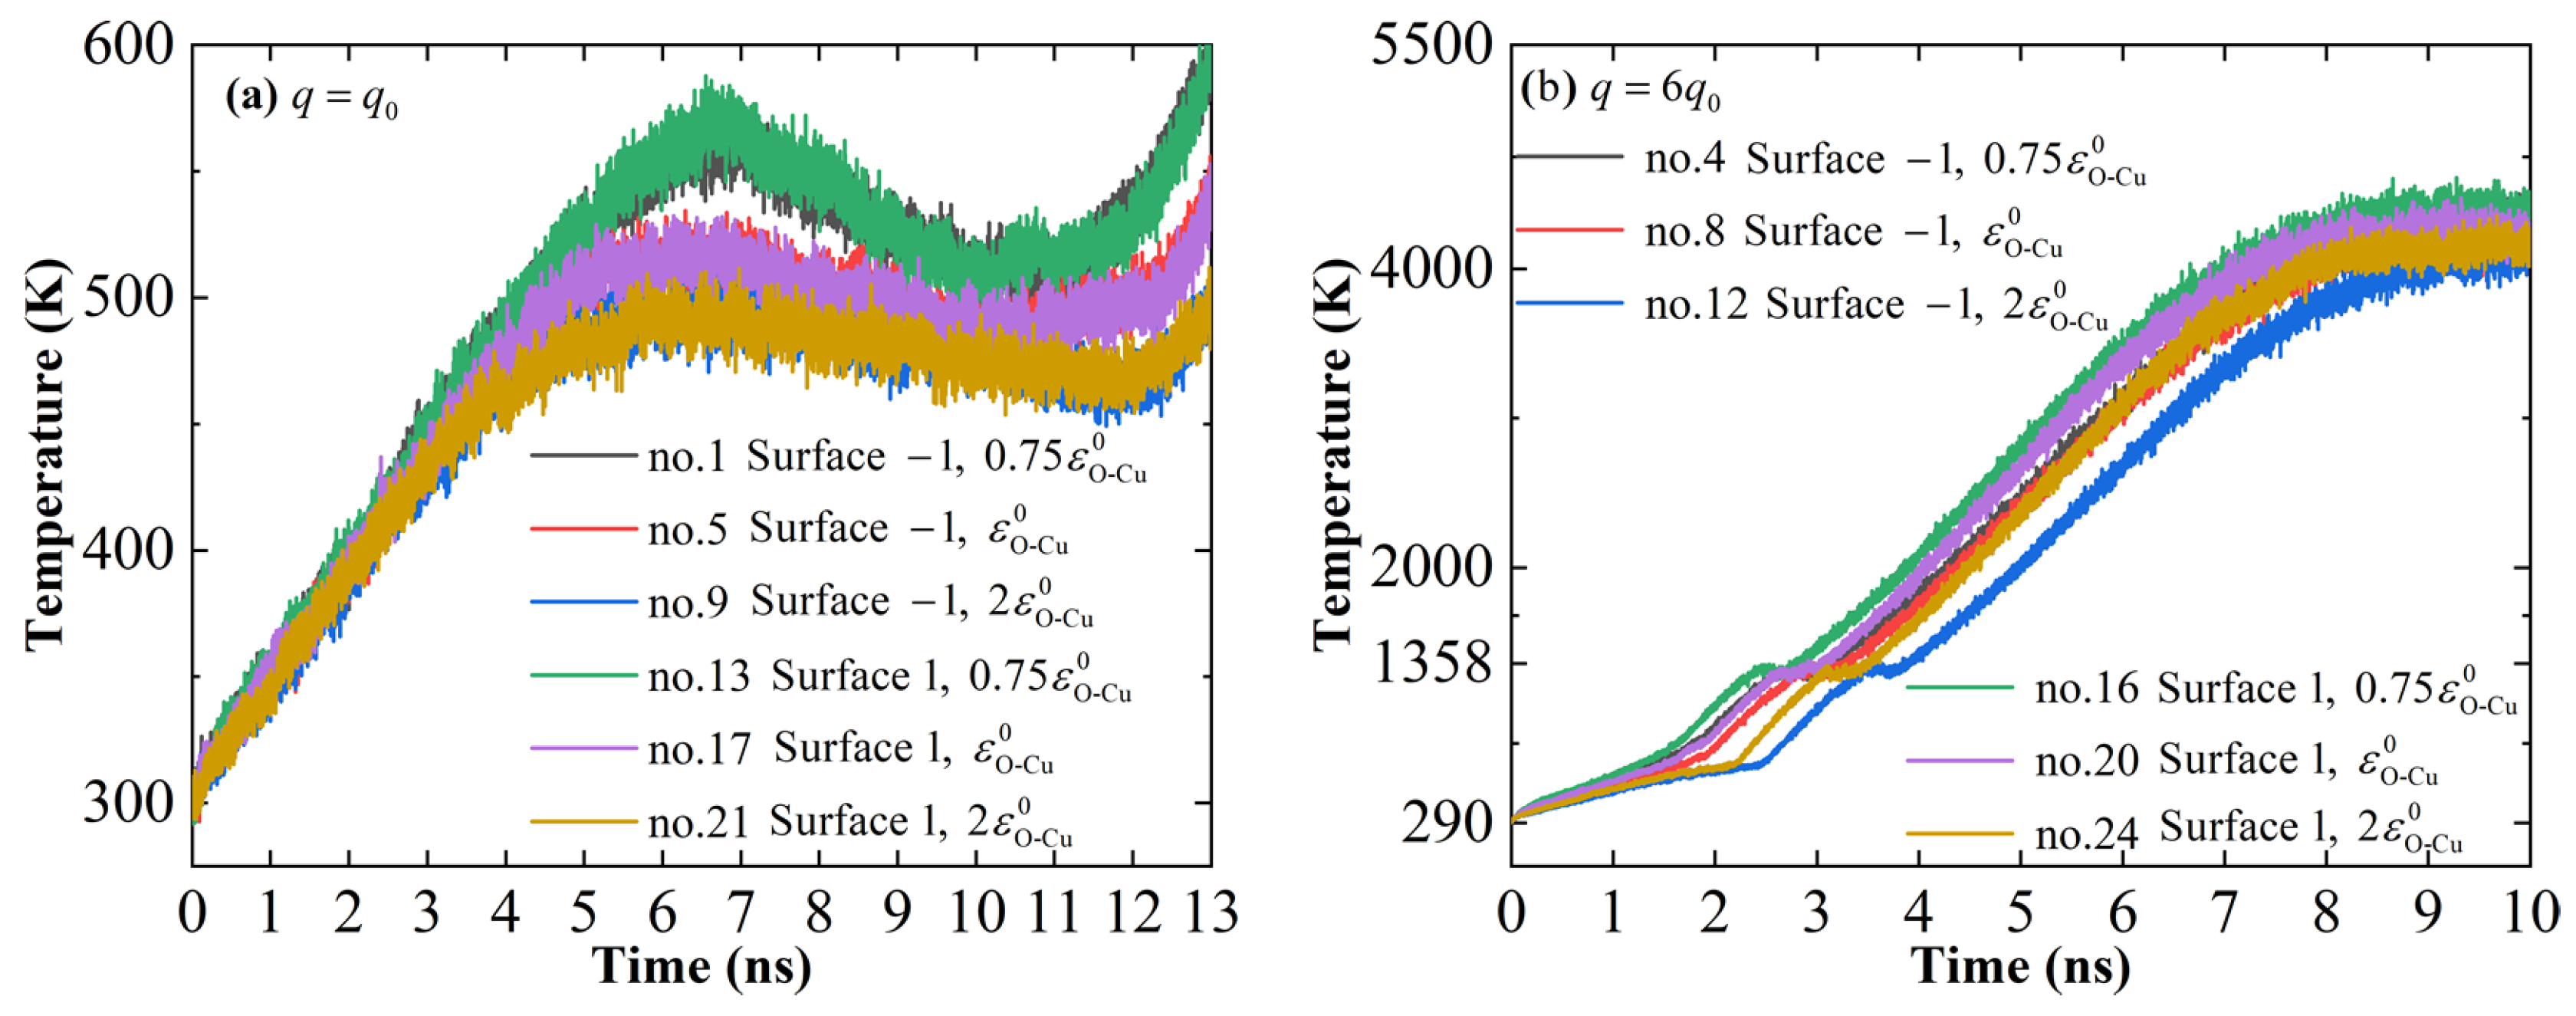
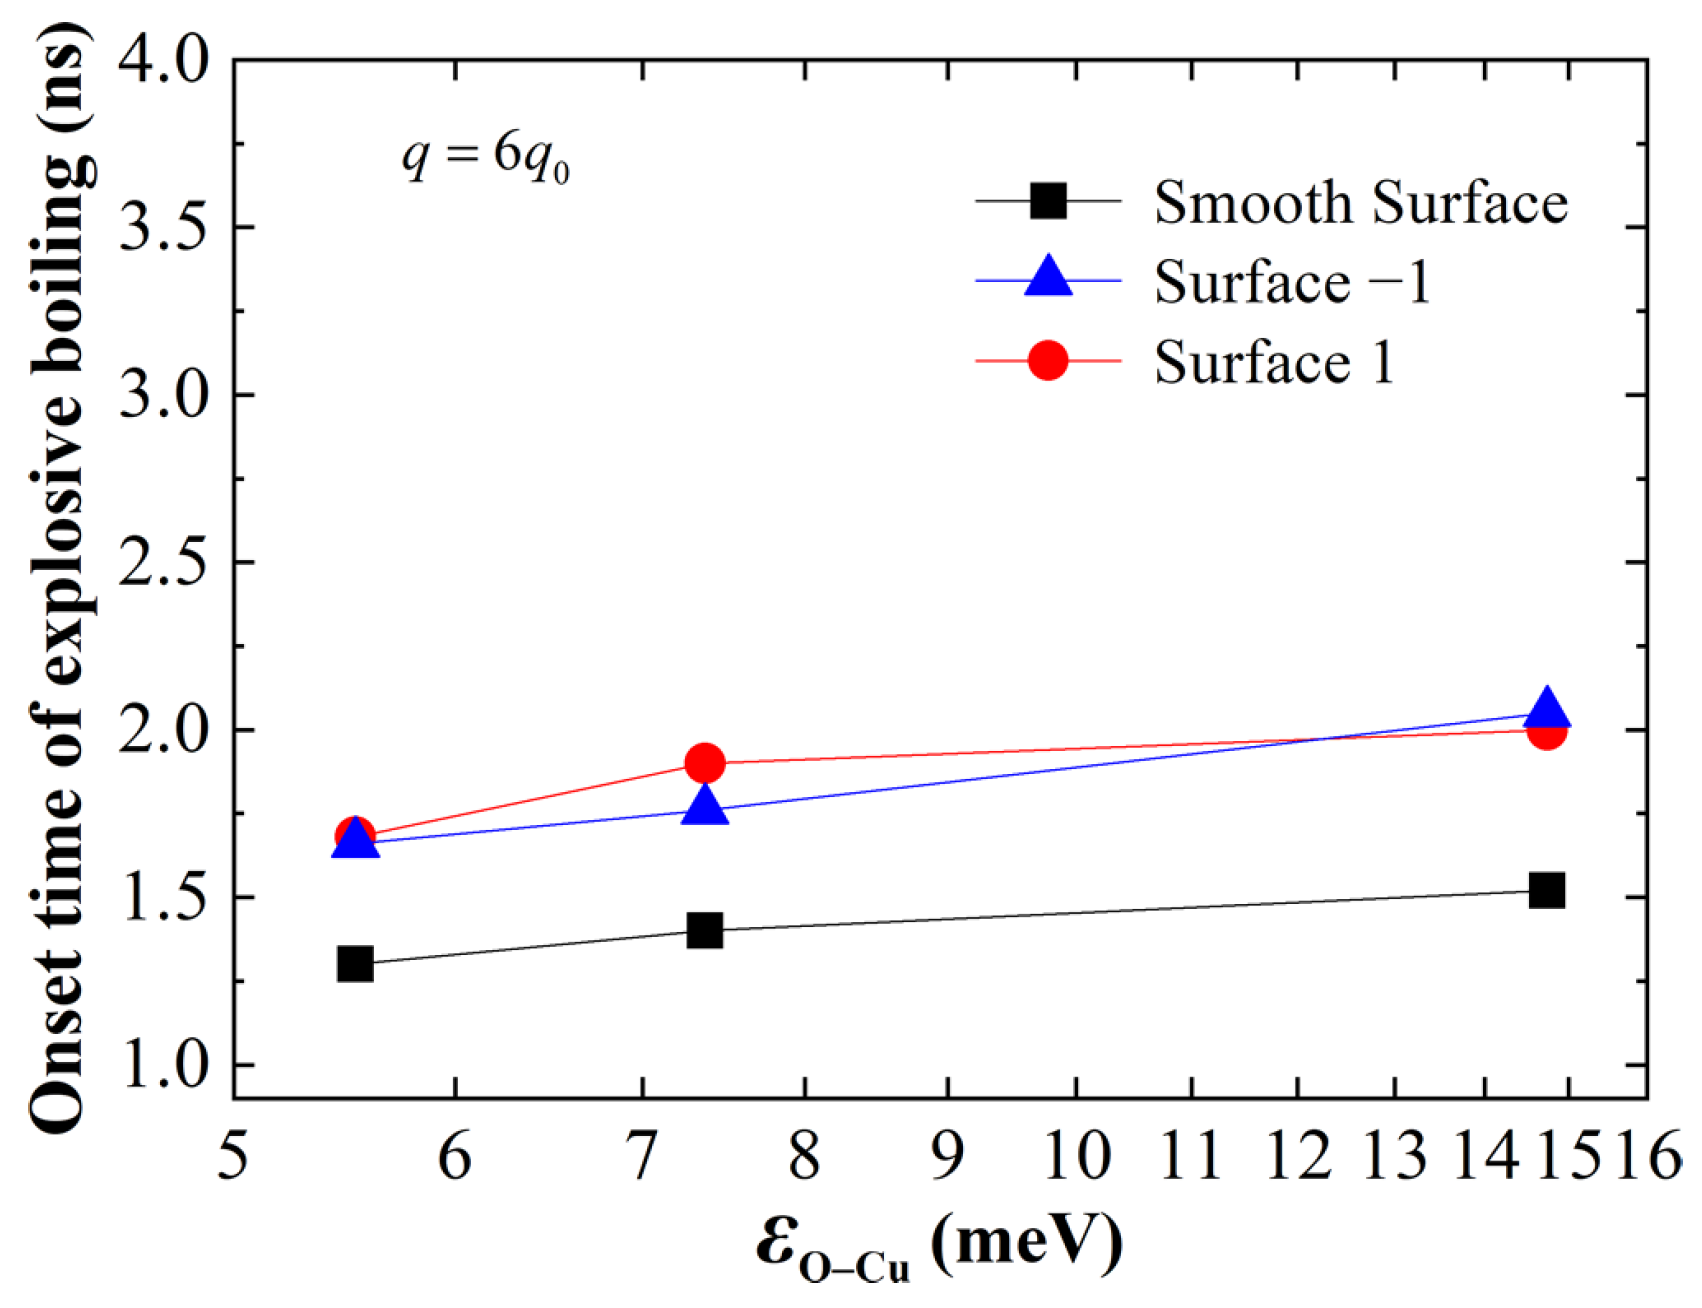
3.2. Temporal Variation in Bottom Plate Temperature and Number of Atoms

After analyzing snapshots of atomic distribution, bottom plate temperature, and evaporated atom number, the simulation case no. 5 (Surface 1 , ϵ O C u 0 , q 0 ) is chosen as the typical normal evaporation and case no. 7 (Surface 1 , ϵ O C u 0 , 3.5 q 0 ) is chosen as the typical explosive boiling case to explain the above phenomena. The normal evaporation can be roughly divided into three stages, as shown in Figure 4a. At first, the temperature of the bottom plate, which is heated by applying a constant heat flux, increases gradually, and the water nanofilm starts to evaporate after 2 ns. Then, the temperature enters a plateau period due to the balance between the heat dissipated by the evaporationand the heat input to the bottom plate. Eventually, when the bottom plate dries out, the heat in the bottom plate continues to accumulate, and thus the temperature starts to rise.
Likewise, explosive boiling cases can be roughly divided into four stages, as shown in Figure 4b. At first, the temperature of the bottom plate rises steadily in the initial period, such as 3.5 ns in Figure 4b. In this period, the water nanofilm begins to evaporate, the rate of which increases gradually. Then, the explosive boiling occurs in water nanofilm, which corresponds to the slope changing point of the bottom plate temperature curve in Figure 4b. The number of atoms rises abruptly. Because it takes time for water molecules to enter the statistical region after leaving the substrate surface, the moment of the slope changing point of the curve representing the number of atoms is a little later than the onset of explosive boiling in atomic distribution snapshots, which is completely acceptable. Since the heat in the bottom plate cannot be dissipated through the water nanofilm phase transition, the temperature of the bottom plate continues to rise. Next, the bottom plate begins to melt when reaching the temperature of 1358 K, the melting point of Cu, causing a brief drop at 5 ns in Figure 4b. Eventually, the bottom plate temperature reaches such a high level that the Cu atoms evaporate, bringing the number of evaporated atoms to over 24,000.
In contrast to our previous work [35], it is observed that the nanoroughness has obviously inflected the phase transition. As for the normal evaporation case no. 5 (Surface 1 , ϵ O C u 0 , q 0 ), the temperature of the bottom plate increases by 200 K within 5 ns, which is 1.6 times the temperature shift of the plate nanoroughness. Moreover, the time for the complete evaporation of the water nanofilm is reduced by nearly 2 s. The faster evaporation of the water nanofilm allows for the rapid dissipation of heat from the bottom plate, resulting in a temperature that does not fluctuate severely at the end of the simulation. Therefore, the nanoroughness over the bottom plate has a boosting effect on normal evaporation. As for the explosive boiling case no. 7 (Surface 1 , ϵ O C u 0 , 3.5 q 0 ), the onset of that is delayed from 2.78 nsto 3.35 ns. Longer normal evaporation periods imply that more heat can be transferred at the same heat flux. Moreover, the heat flux responsible for the explosive boiling of the water nanofilm varies from 3 q 0 to 3.5 q 0 . As a result, more heat can be transferred during the same period.
In addition, the temporal variations in atom numbers and bottom temperature during part of the phase transition of nanorough surfaces (Surface −1 and Surface 1) are investigated at a heat flux of q 0 and 6 q 0 (Figure 5 and Figure 6). The trend of the evaporated atom number in normal evaporation cases is basically the same, and the difference is mainly reflected in 3–8 ns. It is observed that the number of evaporated atoms on the neutral surface is larger than on the hydrophobic surface, but is smaller than on the hydrophilic surface. However, the rate of evaporation on the neutral surface is smaller than on the hydrophobic surface, but is larger than on the hydrophilic surface. The curves of cases for which only the surface is different, such as the cases of no. 5 (Surface 1 , ϵ O C u 0 , q 0 ) and no. 17 (Surface 1, ϵ O C u 0 , q 0 ) are always the closest, indicating that the effect of different nanoroughness can be ignored. Similarly, the trend of the number of displaced atoms in the case of explosive boiling is mainly due to the curve extending to the upper right, caused by the different onset of explosive boiling. The effect of different nanoroughness is much smaller such that the slight difference in the onset of explosive boiling is negligible.
There is a dynamical balance between the two curves in Figure 4. It is significant to study the trends in the number of evaporated atoms by analyzing the bottom plate temperature. In the normal evaporation case, most of the curves for cases with the same wettability coincide, which indicates that the nanoroughness has little effect on the bottom plate temperature. Moreover, the temperature is always highest on hydrophobic surfaces, followed by neutral surfaces, and lowest on hydrophilic surfaces after 3 ns. Moreover, the temperature on the hydrophobic surface reaches its maximum at 6–7 ns, which corresponds exactly to the moment when the evaporation rate starts to reach its maximum in cases no. 1 and no. 13. That is, the temperature of bottom plate is an important cause of the evaporation rate variation of water nanofilm. Compared to the other two wetting conditions, the hydrophilic surface has a better heat transfer effect as reflected by the lower bottom plate temperature and the higher number of evaporated atoms. However, according to Figure 5 and Figure 6, explosive boiling is more favorable to occur on hydrophobic surfaces. The difference in the bottom plate temperature is mainly reflected in the evaporation period before the onset Figure 6b. After this occurrence, the temperature curves are so similar that it seems as if they could be obtained by translation.
In addition, Figure 7 shows the comparison of the onsets of explosive boiling between nanorough surfaces (Surface −1 and Surface 1) and smooth surfaces with different wettability at heat flux, which is nearly the same for nanorough surfaces, with the onset being later than for smooth surfaces. Therefore, the effect on the explosive boiling of Surface −1 is essentially the same. This is due to the fact that the two surfaces are essentially the same due to the periodic boundaries in the y- dimension. Although the nanoroughness on the bottom plate prevents the early onset of explosive boiling, it facilitates the transfer of heat between solid and liquid and delays the onset of film boiling, which is of interest in engineering applications.

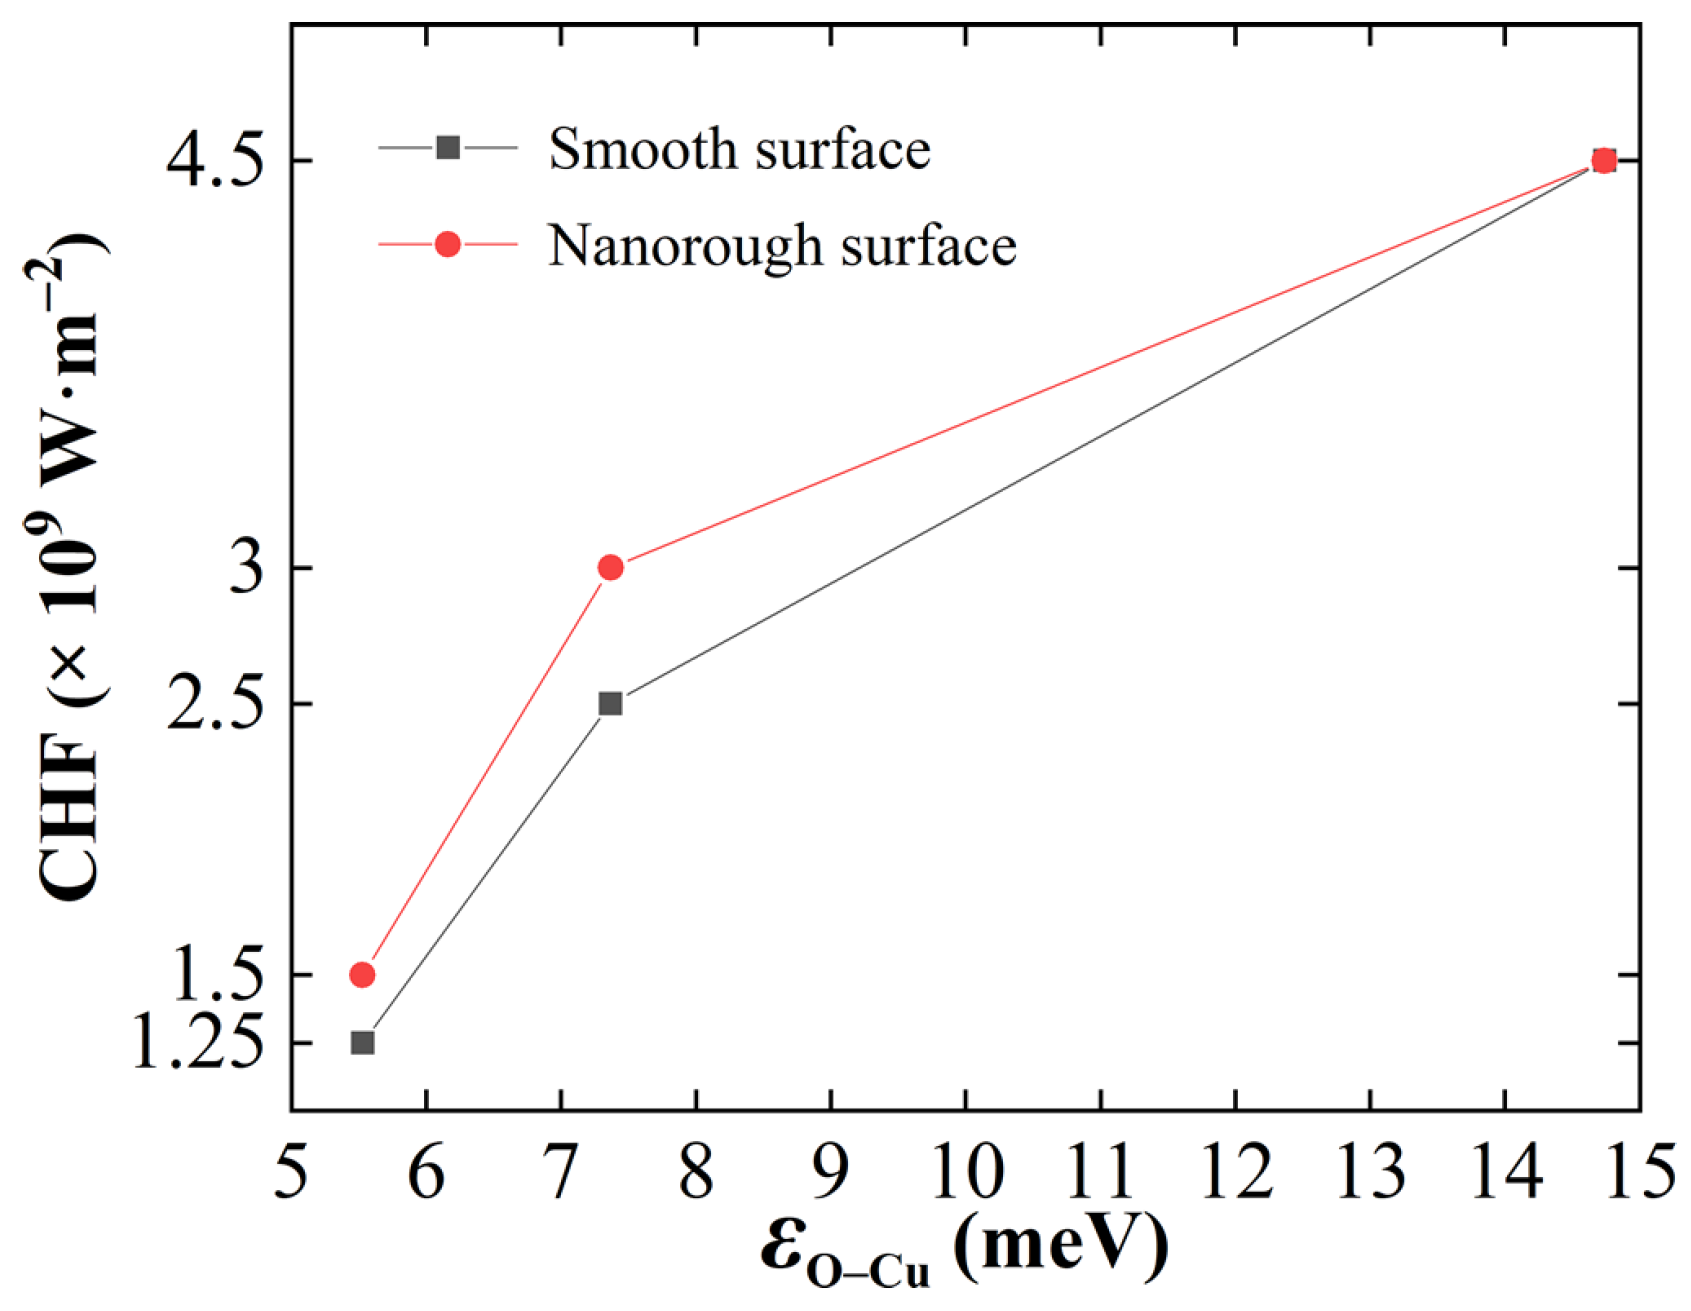
3.3. Temporal Variation in Bottom Plate Temperature and Number of Atoms

The x o z plane of the cubic box is divided into 0.5 × 0.14 nm2 pencils along the y direction due to the nanoroughness. A portion of the data for the area near the fixed Cu layer are selected to create the spatial variation in temperature, which is shown is Figure 8 for representative cases at representative times.
Figure 8(a1–a3) show the spatial variation in temperature for normal evaporation case no. 5 (Surface 1 , ϵ O C u 0 , q 0 ). The temperature of the water nanofilm is already chronologically in a relatively homogeneous state, which prevents convective effects. Although there are patchy blue regions where the temperature cannot be counted for no atoms, they are too few to be able to connect and form a vapor film for explosive boiling. As for the explosive boiling case no. 8 (Surface 1 , ϵ O C u 0 , 6 q 0 ), shown in Figure 8(b1–b3), a uniform temperature distribution in the first 1.76 ns can be also observed, which is the evaporation period. As heat is input into the system continuously, the temperature also rises. However, it is not enough to just dissipate heat through evaporation. Therefore, the temperature gradient is also gradually increased, leading to the temperature 575 K beginning to appear. Furthermore, several nucleation sites are also generated at the solid–liquid surface. Then, as the temperature continues to rise, the nucleation sites gather and form a vapor film, resulting in explosive boiling. Importantly, essentially all of the water molecules reached the temperature of 575 K at the occurrence, which is considered the homogeneous nucleation limit. In contrast to our previous work [35], the temperature of the system in this study is higher than the cases without nanoroughness. However, the highest temperature of water nanofilm is still 575 K. In other words, although the nanoroughness over the bottom plate strengthens the heat transfer from the solid to liquid, it does not change the homogeneous nucleation limit of 575 K.
Figure 8c–h illustrate the spatial profile of the temperature at the onset of explosive boiling for case nos. 4, 12, 19, 20, 16, and 24, which are also compared to explore the mechanism of explosive boiling on a nanorough surface with different wettability. As the wettability of the solid–liquid surface changes from hydrophobic to hydrophilic, the area with a temperature of 575 K increases. In explosive boiling case no. 12 (Surface 1 , 2 ϵ O C u 0 , 6 q 0 ) and no. 24 (Surface 1, 2 ϵ O C u 0 , 6 q 0 ), shown in Figure 8d,h, part of the unevaporated water nanofilm is located between the solid surface and the vapor film, which is not as obvious as in other cases. In addition, the area with the temperature 575 K in cases with Surface 1 is greater than that in cases with Surface 1, which is because of the location of the nucleation sites.
The energy parameter ϵ O C u is closely related to the wettability and Kapitza thermal resistance, which for hydrophobic surfaces is higher than that for hydrophilic surfaces [35]. The Kapitza thermal resistance R is calculated as
R = Δ T q ,
where Δ T is the temperature drop across the interface. The higher the heat flux, the larger the temperature difference between the bottom plate and water nanofilm. As shown in Figure 8(a1–a3,b1,b2), the difference in temperature is smaller in the evaporation period, which means the nanoroughness on the bottom plate makes the distribution of temperature in the water nanofilm more uniform. That is, the Kapitza thermal resistance on nanorough surfaces is smaller than on smooth surfaces. Therefore, a higher heat flux is required for the water nanofilm to reach the homogeneous nucleation limit of 575 K to achieve explosive boiling. So, the increase in the heat flux at which explosive boiling occurs from 1.5 q 0 and 3 q 0 to 2 q 0 and 3.5 q 0 for hydrophilic and neutral surfaces, respectively. As for hydrophilic surfaces, the heat can easily be transferred due to the less Kapitza thermal resistance. Therefore, the heat flux triggering explosive boiling is still 5 q 0 . To achieve the same temperature difference, a surface with larger Kapitza thermal resistance requires less heat flow. Therefore, the heat flux for explosive boiling is 2 q 0 for hydrophobic surfaces, while it is 5 q 0 for hydrophilic surfaces. In the same way, under the same heat flow, There is a large temperature difference between surfaces with large Kapitaza thermal resistanceis large, which explains why hydrophobic surfaces are more favorable for explosive boiling. The energy parameter ϵ O C u on the hydrophilic surface is much larger than ϵ O O among water molecules, such that the interaction force between Cu atoms and O atoms is larger than that among water molecules. As a result, confinement between water molecules is more easily broken when the heat flux is sufficiently high, resulting in an explosive boiling that does not occur immediately next to the bottom plate. Therefore, there is a certain thickness of liquid film between the bottom plate and the cavity when explosive boiling occurs.
The heat transfer effect is greatly reduced after the apperence of vapor film. Therefore, the maximum heat flux input to the system, which makes the water nanofilm evaporate, is deemed to be the critical heat flux (CHF). The results given in Figure 9 show that the CHF of the hydrophilic surface is higher than that of the hydrophobic surface, implying that the hydrophilic surface has better heat transfer. While the CHF on the nanofilm surface is higher than that on the smooth surface, the interaction between the solid surface and the water nanofilm is lower, implying that the use of nanofilms as a way to enhance the transfer of boiling heat is suitable for situations with a low hydrophilic surface.

4. Conclusions

In this paper, molecular dynamics simulation is implemented for the investigation of the phase transition of a water nanofilm over a Cu plate with a regular semi-periodic sinusoidal surface for a variety of heat flux conditions. The results are obtained for cases with two types of nanostructures (Surface 1 and Surface 1) and three different wetting conditions (hydrophilic, neutral, and hydrophobic) to analyze the water nanofilm phase transition mechanism on a nanorough surface with variable wettability.
1. The phase transition mode of the water nanofilm is normal evaporation at low heat flux and explosive boiling at high heat flux. Two nanorough surfaces with the same surface area have almost identical effects on the water nanofilm phase transition.
2. Explosive boiling occurs earlier on hydrophobic surfaces at the same heat flux, and hydrophilic surfaces have a better heat transfer effect due to Kapitza thermal resistance and critical heat flux.
3. The critical heat flux increases by 0.25 q 0 for hydrophilic and 0.5 q 0 for neutral surfaces compared with smooth surfaces, while it remains 5 q 0 for hydrophilic surfaces. The onset of explosive boiling on nanorough surfaces is later than that on smooth surfaces, which is beneficial to heat dissipation in engineering applications.

Author Contributions

Conceptualization, Y.T. and Y.H.; methodology, Y.T. and S.W.; software, Y.T. and L.W.; formal analysis, S.W. and L.W.; investigation, Y.T. and S.W.; writing—original draft preparation, S.W.; writing—review and editing, Y.H., Y.T. and L.W. All authors have read and agreed to the published version of the manuscript.

Funding

This research was funded by the National Natural Science Foundation of China grant numbers 52176076 and 52176077.

Institutional Review Board Statement

Not applicable.

Informed Consent Statement

Not applicable.

Data Availability Statement

Not applicable.

Conflicts of Interest

The authors declare no conflict of interest.

References

  1. Akhlaghi, H.; Roohi, E.; Stefanov, S. A new iterative wall heat flux specifying technique in dsmc for heating/cooling simulations of MEMS/NEMS. Int. J. Therm. Sci. 2012, 59, 111–125. [Google Scholar] [CrossRef]
  2. Nazari, M.; Masoudi, A.; Jafari, P.; Irajizad, P.; Kashyap, V.; Ghasemi, H. Ultrahigh evaporative heat fluxes in nanoconfined geometries. Langmuir 2019, 35, 78–85. [Google Scholar] [CrossRef] [PubMed]
  3. Zhang, S.; Yuan, W.; Tang, Y.; Chen, J.; Li, Z. Enhanced flow boiling in an interconnected microchannel net at different inlet subcooling. Appl. Therm. Eng. 2016, 104, 659–667. [Google Scholar] [CrossRef]
  4. Duncan, A.B.; Peterson, G.P. Review of microscale heat transfer. Appl. Mech. Rev. 1994, 47, 397–428. [Google Scholar] [CrossRef]
  5. Haas, C.; Kaiser, F.; Schulenberg, T.; Wetzel, T. Critical heat flux for flow boiling of water on micro-structured zircaloy tube surfaces. Int. J. Heat Mass Transf. 2018, 120, 793–806. [Google Scholar] [CrossRef]
  6. Kim, S.H.; Lee, G.C.; Kang, J.Y.; Moriyama, K.; Park, H.S.; Kim, M.H. The role of surface energy inheterogeneous bubble growth on idealsurface. Int. J. Heat Mass Transf. 2018, 108, 1901–1909. [Google Scholar] [CrossRef]
  7. Esmaeili, E.; Chaydareh, R.G.; Farsad, S.; Rounaghi, S.A.; Mollayi, N. Enhanced heat transfer properties of magnetite nanofluids due to neel and brownian relaxation mechanisms. Chem. Eng. Commun. 2016, 203, 1157–1164. [Google Scholar] [CrossRef]
  8. Karami, E.; Rahimi, M.; Azimi, N. Convective heat transfer enhancement in a pitted microchannel by stimulation of magnetic nanoparticles. Chem. Eng. Process. 2018, 126, 156–167. [Google Scholar] [CrossRef]
  9. Zhang, P. Molecular Dynamics Simulation of Rapid Boiling of Water on Copper Nanoscale Surface. Master’s Thesis, North China Electric Power University, Beijing, China, 2019. [Google Scholar]
  10. Zhang, S.W.; Hao, F.; Chen, H.M.; Yuan, W.; Tang, Y.; Chen, X. Molecular dynamics simulation on explosive boiling of liquid argon film on copper nanochannels. Appl. Therm. Eng. 2017, 113, 208–214. [Google Scholar] [CrossRef]
  11. Chen, Y.J.; Zou, Y.; Sun, D.L.; Wang, Y.; Yu, B. Molecular dynamics simulation of bubble nucleation on nanostructure surface. Int. J. Heat Mass Transf. 2018, 118, 1043–1151. [Google Scholar] [CrossRef]
  12. Wang, W.D.; Zhang, H.Y.; Tian, C.H.; Meng, X.J. Numerical experiments on evaporation and explosive boiling of ultra-thin liquid argon film on aluminum nanostructure substrate. Nanoscale Res. Lett. 2015, 10, 158. [Google Scholar] [CrossRef] [Green Version]
  13. Zhao, M.W. Molecular Dynamics Study on Boiling Heat Transfer of Ultra-Thin Water Film on MoS2 Substrate. Master’s Thesis, Xidian University, Xi’an, China, 2018. [Google Scholar]
  14. She, X.H.; Timothy, A.S.; Lindeman, B.; Yin, Y.G.; Zhang, X.S. Bubble formation on solid surface with a cavity based on molecular dynamics simulation. Int. J. Heat Mass Transf. 2016, 95, 278–287. [Google Scholar] [CrossRef]
  15. Liu, R.K.; Liu, Z.Y. Rapid thermal transport at rough solid-fluid interface: Evaporation and explosive boiling on concave nanostructure. Int. J. Heat Mass Transf. 2020, 154, 119676. [Google Scholar] [CrossRef]
  16. Seyf, R.H.; Zhang, Y.W. Effect of nanotextured array of conical features on explosive boiling over a flat substrate: A nonequilibrium molecular dynamics study. Int. J. Heat Mass Transf. 2013, 66, 613–624. [Google Scholar] [CrossRef] [Green Version]
  17. Seyf, R.H.; Zhang, Y.W. Molecular dynamics simulation of normal and explosive boiling on nanostructured surface. J. Heat Transfer 2013, 135, 121503. [Google Scholar] [CrossRef]
  18. Fu, T.; Mao, Y.J.; Tang, Y.; Zhang, Y.W.; Wei, Y. Molecular dynamics simulation on rapid boiling of thin water film on cone-shaped nanostructure surface. Nanoscale Microscale Thermophys. Eng. 2015, 19, 17–30. [Google Scholar] [CrossRef]
  19. Qasemian, A.; Qanbarian, M.; Arab, B. Molecular dynamics simulation on explosive boiling of thin liquid argon films on cone-shaped Al-Cu-based nanostructures. J. Therm. Anal. Calorim. 2020, 145, 269–278. [Google Scholar] [CrossRef]
  20. Tang, Y.Z.; Zhang, X.G.; Lin, Y.; Xue, J.; He, Y.; Ma, L.X. Molecular dynamics simulation of nanofilm boiling on graphene-Coated surface. Adv. Theory Simul. 2019, 2, 1900065. [Google Scholar] [CrossRef]
  21. Min, J.; Guo, Z.X. Pool boiling on defective graphene coated surface: A molecular dynamics study. J. Enhanced Heat Transf. 2020, 28, 85–89. [Google Scholar] [CrossRef]
  22. Diaz, R.; Guo, Z.X. Enhanced conduction and pool boiling heat transfer on single-layer graphene-coated substrates. J. Enhanced Heat Transf. 2019, 26, 127–143. [Google Scholar] [CrossRef]
  23. Zhou, H.R.; Ji, X.B.; Kong, Q.P.; Qiang, D. Research progress of pool boiling heat transferon different wettability surfaces. J. Eng. Therm. Energy Power 2019, 34, 1–8. [Google Scholar]
  24. Rafiee1, J.; Mi, X.; Gullapalli, H.; Thomas, A.V.; Yavari, F.; Shi, Y.F.; Ajayan, P.M.; Koratkar, N.A. Wetting transparency of grapheme. Nat. Mater. 2012, 11, 217–222. [Google Scholar] [CrossRef] [PubMed]
  25. Chen, Y.J.; Li, J.F.; Yu, B.; Sun, D.L.; Zou, Y.; Han, D.X. Nanoscale study of bubble nucleation on a cavity substrate using molecular dynamics simulation. J. Langmuir 2018, 34, 14234–14248. [Google Scholar] [CrossRef] [PubMed]
  26. Nagayama, G.; Tsuruta, T.; Cheng, P. Molecular dynamics simulation on bubble formation in a nanochannel. Int. J. Heat Mass Transf. 2006, 49, 4437–4443. [Google Scholar] [CrossRef]
  27. Zhang, S.Z.; Chen, Z.X.; Yang, L.; Miao, R.C.; Zhang, Z.J. Molecular dynamics simulation of liquid boiling on different wetting surface. JoChem. Ind. Eng. Prog. 2020, 39, 3892–3899. [Google Scholar]
  28. Wang, Y.H. Molecular Dynamics Simulation of the Effect Wettability on Explosive Boiling of a Nanoscale Thin Liquid Film. Master’s Thesis, Beijing North China Electric Power University, Beijing, China, 2018. [Google Scholar]
  29. Shavik, S.M.; Hasan, M.N.; Morshed, M.A.K.M. Molecular dynamics study on explosive boiling of thin liquid argon film on nanostructured surface under different wetting conditions. J. Electron. Packag. 2016, 138, 010904. [Google Scholar] [CrossRef]
  30. Zhang, H.Y.; Li, C.H.; Zhao, M.W.; Zhu, Y.M.; Wang, W.D. Influence of interface wettability on normal and explosive boiling of ultra-thin liquid films on a heated substrate in nanoscale: A molecular dynamics study. Micro Nano Lett. 2017, 12, 843–848. [Google Scholar] [CrossRef]
  31. Diaz, R.; Guo, Z.X. A molecular dynamics study of phobic/philic nano-patterning on pool boiling heat transfer. Heat Mass Transf. 2017, 53, 2061–2071. [Google Scholar] [CrossRef]
  32. Wang, Y.H.; Wang, S.Y.; Lu, G.; Wang, X.D. Explosive boiling of nano-liquid argon films on high temperature platinum walls: Effects of surface wettability and film thickness. Int. J. Therm. Sci. 2018, 132, 608–617. [Google Scholar] [CrossRef]
  33. Liu, R.K.; Liu, Z.Y. Study of boiling heat transfer on concave hemispherical nanostructure surface with MD simulation. Int. J. Heat Mass Transf. 2019, 143, 118534. [Google Scholar] [CrossRef]
  34. Zhang, L.Y.; Xu, J.L.; Lei, J.P. Molecular dynamics study of bubble nucleation on a nanoscale. Acta Phys. Sin. 2018, 67, 172–182. [Google Scholar]
  35. Tang, Y.Z.; Wu, L.F.; Xue, J.; Li, H.F.; Gao, J.S.; He, Y.; Ma, L.X. Effects of wettability and heat flux on water nanofilm phase change over copper plate. Appl. Therm. Eng. 2022, 213, 118638. [Google Scholar] [CrossRef]
  36. Mishin, Y.; Mehl, M.J.; Papaconstantopoulos, D.A.; Voter, A.F.; Kress, J.D. Structural stability and lattice defects in copper: Ab initio; tight binding and embedded-atom calculations. Phys. Rev. B 2001, 63, 224106. [Google Scholar] [CrossRef]
  37. Berendsenm, H.J.C.; Grigera, J.R.; Straatsma, T.P.J. The missing term in effective pair potentials. J. Phys. Chem. 1987, 62, 6269–6271. [Google Scholar] [CrossRef]
  38. Ryckaert, J.P.; Ciccotti, G.; Berendsen, H.J.C. Numerical integration of the cartesian equations of motion of a system with constraints: Molecular dynamics of n-alkanes. J. Comput. Phys. 1977, 23, 327–341. [Google Scholar] [CrossRef] [Green Version]
  39. Wirnsberger, P.; Frenkel, D.; Dellago, C. An enhanced version of the heat exchange algorithm with excellent energy conservation properties. J. Chem. Phys. 2015, 143, 124104. [Google Scholar] [CrossRef]
Figure 1. Initial structure of simulated system: (a) total model, (b) bottom section, (c) nanorough Surface 1 , and (d) nanorough Surface 1.
Coatings 12 01943 g001
Figure 2. Arrangements of boundaries and reservoirs.
Coatings 12 01943 g002
Figure 3. Snapshots of atom distribution at representative time points for cases (a) no. 1 (Surface 1 , 0.75 ϵ O C u 0 , q 0 ), (b) no. 3 (Surface 1 , 0.75 ϵ O C u 0 , 2 q 0 ), (c) no. 4 (Surface 1 , 0.75 ϵ O C u 0 , 6 q 0 ), (d) no. 5 (Surface 1 , ϵ O C u 0 , q 0 ), (e) no. 7 (Surface 1 , ϵ O C u 0 , 3.5 q 0 ), (f) no. 8 (Surface 1 , ϵ O C u 0 , 6 q 0 ), (g) no. 9 (Surface 1 , 2 ϵ O C u 0 , q 0 ), (h) no. 11 (Surface 1 , 2 ϵ O C u 0 , 5 q 0 ), (i) no. 12 (Surface 1 , 2 ϵ O C u 0 , 6 q 0 ), (j) no. 17 (Surface 1, ϵ O C u 0 , q 0 ), (k) no. 19 (Surface 1, ϵ O C u 0 , 3.5 q 0 ), and (l) no. 20 (Surface 1, ϵ O C u 0 , 6 q 0 ).
Coatings 12 01943 g003
Figure 4. Temporal variations in temperatures in the bottom plates and the evaporated atom numbers for cases (a) no. 5 (Surface 1 , ϵ O C u 0 , q 0 ) and (b) no. 7 (Surface 1 , ϵ O C u 0 , 3.5 q 0 ).
Coatings 12 01943 g004
Figure 5. Comparison of the numbers of evaporated atoms of different nanorough surfaces at different wettability under a heat flux of (a) q 0 and (b) 6 q 0 .
Coatings 12 01943 g005
Figure 6. Comparison of the bottom plate temperature of different nanorough surfaces at different wettability under a heat flux of (a) q 0 and (b) 6 q 0 .
Coatings 12 01943 g006
Figure 7. Comparison of the time of onset of explosive boiling at different wettability under a heat flux of 6 q 0 .
Coatings 12 01943 g007
Figure 8. Two-dimensional distribution of temperature at representative time points for cases (a1) no. 5 (Surface 1 , ϵ O C u 0 , q 0 ) at 0.01 ns, (a2) no. 5 (Surface 1 , ϵ O C u 0 , q 0 ) at 1 ns, (a3) no. 5 (Surface 1 , ϵ O C u 0 , q 0 ) at 1.76 ns, (b1) no. 8 (Surface 1 , ϵ O C u 0 , 6 q 0 ) at 0.01 ns, (b2) no. 8 (Surface 1 , ϵ O C u 0 , 6 q 0 ) at 1 ns, (b3) no. 8 (Surface 1 , ϵ O C u 0 , 6 q 0 ) at 1.76 ns, (c) no. 4 (Surface 1 , 0.75 ϵ O C u 0 , 6 q 0 ) at 1.66 ns, (d) no. 12 (Surface 1 , 2 ϵ O C u 0 , 6 q 0 ) at 2.05 ns, (e) no. 19 (Surface 1, ϵ O C u 0 , 3.5 q 0 ) at 3.15 ns, (f) no. 20 (Surface 1, ϵ O C u 0 , 6 q 0 ) at 1.9 ns, (g) no. 16 (Surface 1, 0.75 ϵ O C u 0 , 6 q 0 ) at 1.68 ns, and (h) no. 24 (Surface 1, 2 ϵ O C u 0 , 6 q 0 ) at 2 ns.
Coatings 12 01943 g008
Figure 9. Comparison of CHF on a smooth surface and nanorough surface with different wettability.
Coatings 12 01943 g009
Table 1. Parameters of water molecules in SPC/E model.
ParameterValue
Charge (O)−0.8476e
Charge (O)0.4238e
Bond (O-H)0.1 nm
Angle (H-O-H)109.47
Table 2. Parameters for L-J potential.
Atoms Pairs ϵ (meV) σ (nm)
O–O6.7390.3166
O–Cu ( ϵ O C u 0 )7.3700.2752
O–Cu (0.75 ϵ O C u 0 )5.5280.2752
O–Cu (2 ϵ O C u 0 )14.7400.2752
Table 3. Simulation case Nos. in study.
QNos.
Surface −1 Surface 1
0.75 ϵ O Cu 0 ϵ O Cu 0 2 ϵ O Cu 0 0.75 ϵ O Cu 0 ϵ O Cu 0 2 ϵ O Cu 0
237.182 ( Q 0 )159131721
355.774 (1.5 Q 0 )2————14————
474.365 (2 Q 0 )3————15————
711.547 (3 Q 0 )——6————18——
830.137 (3.5 Q 0 )——7————19——
1067.321 (4.5 Q 0 )————10————22
1185.912 (5 Q 0 )————11————23
1423.092 (6 Q 0 )4812162024
Publisher’s Note: MDPI stays neutral with regard to jurisdictional claims in published maps and institutional affiliations.

