
Research on Distribution Model and Detection Spacing of Compaction Degree of Asphalt Pavement Based on the PQI Method
Abstract
:1. Introduction
2. Compaction-Degree Detection Based on PQI Method
2.1. Project Information
2.2. Density Measurement and Calibration
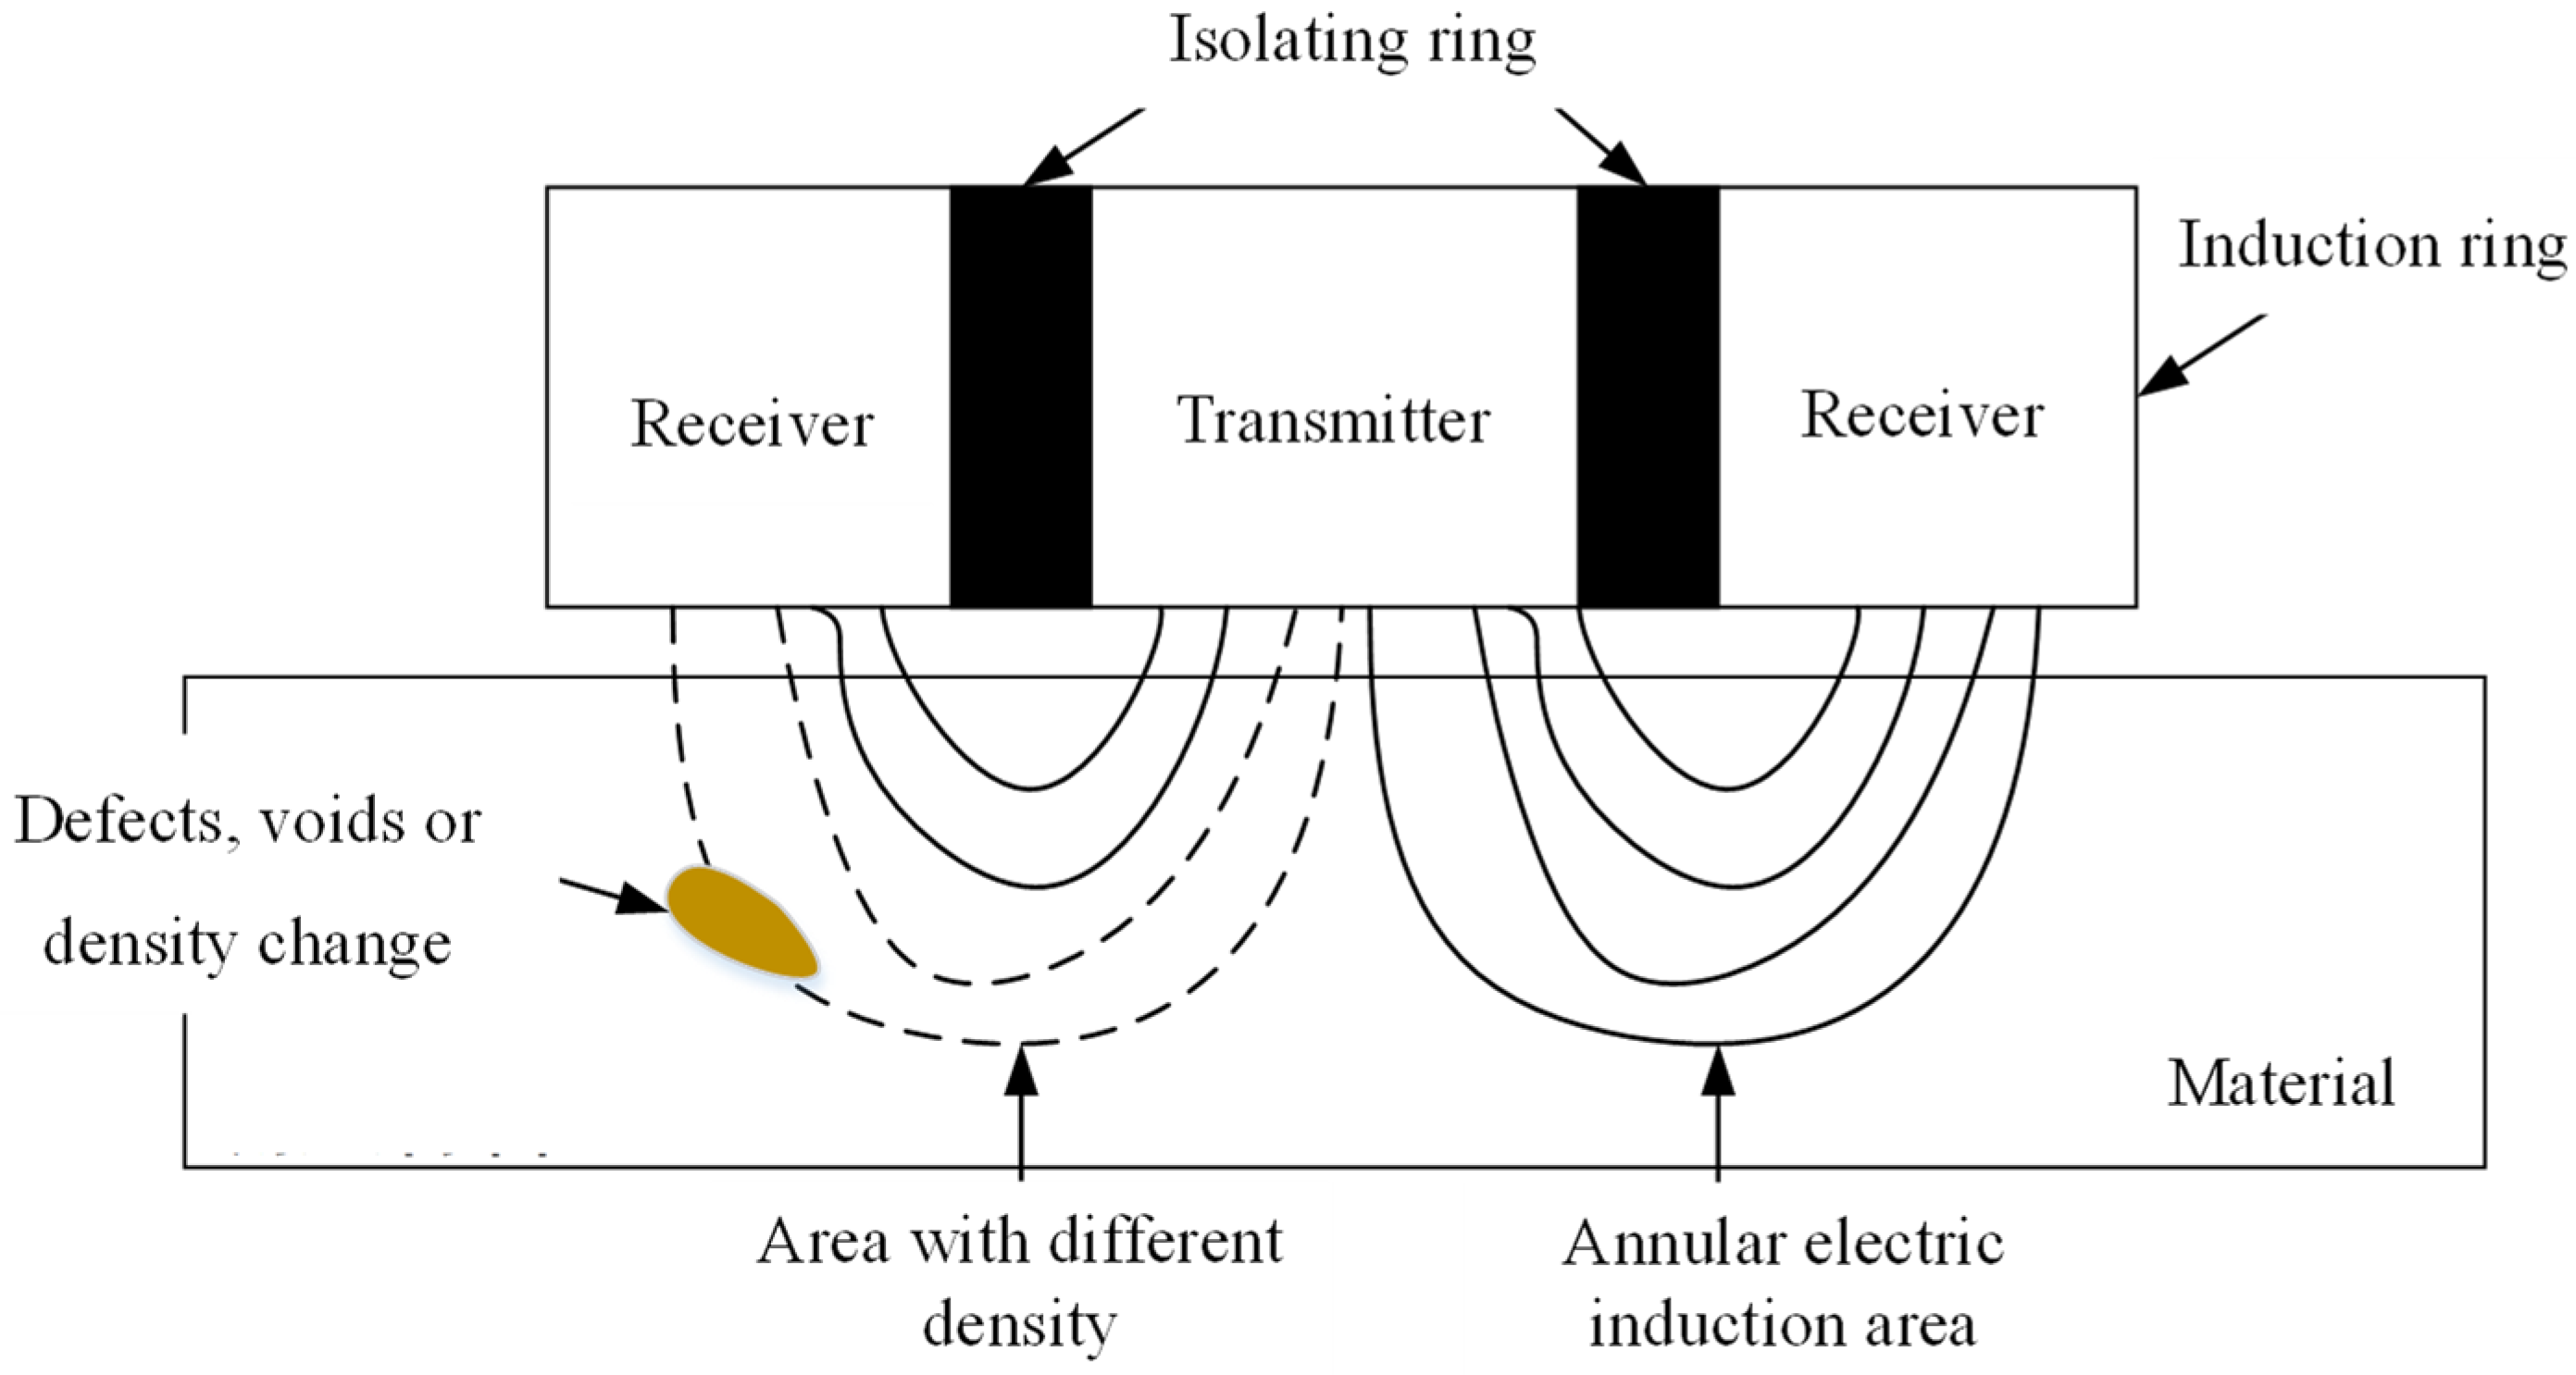
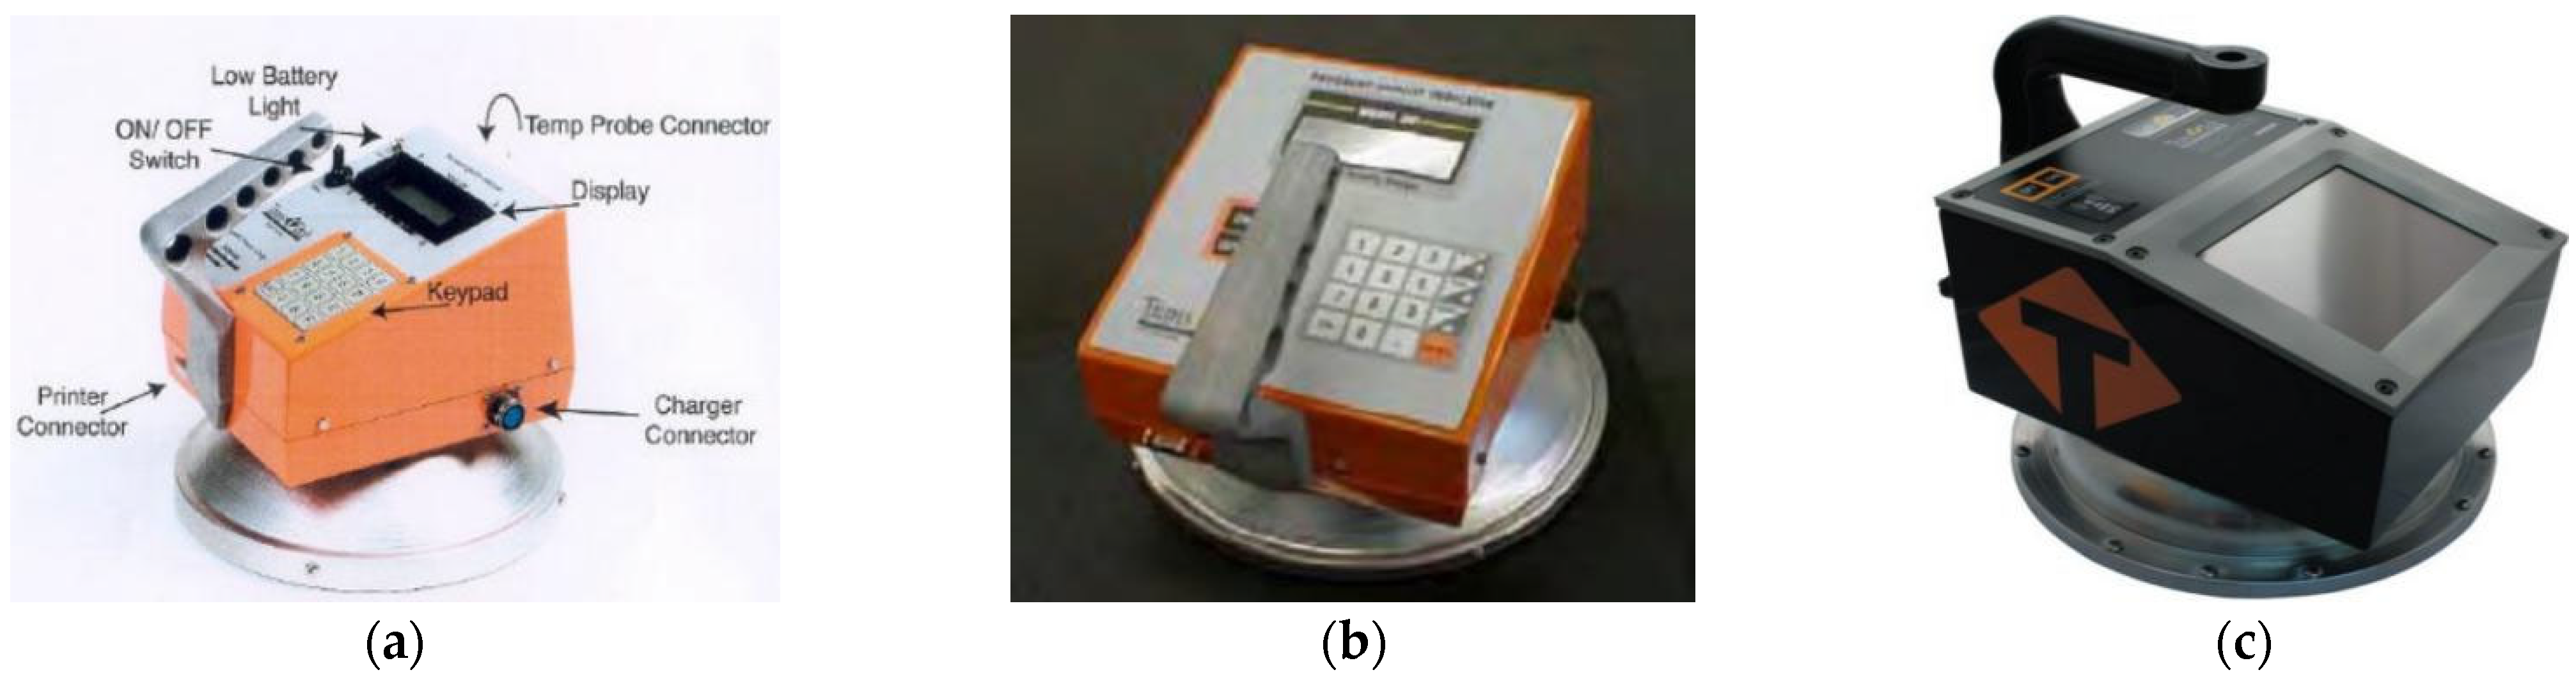
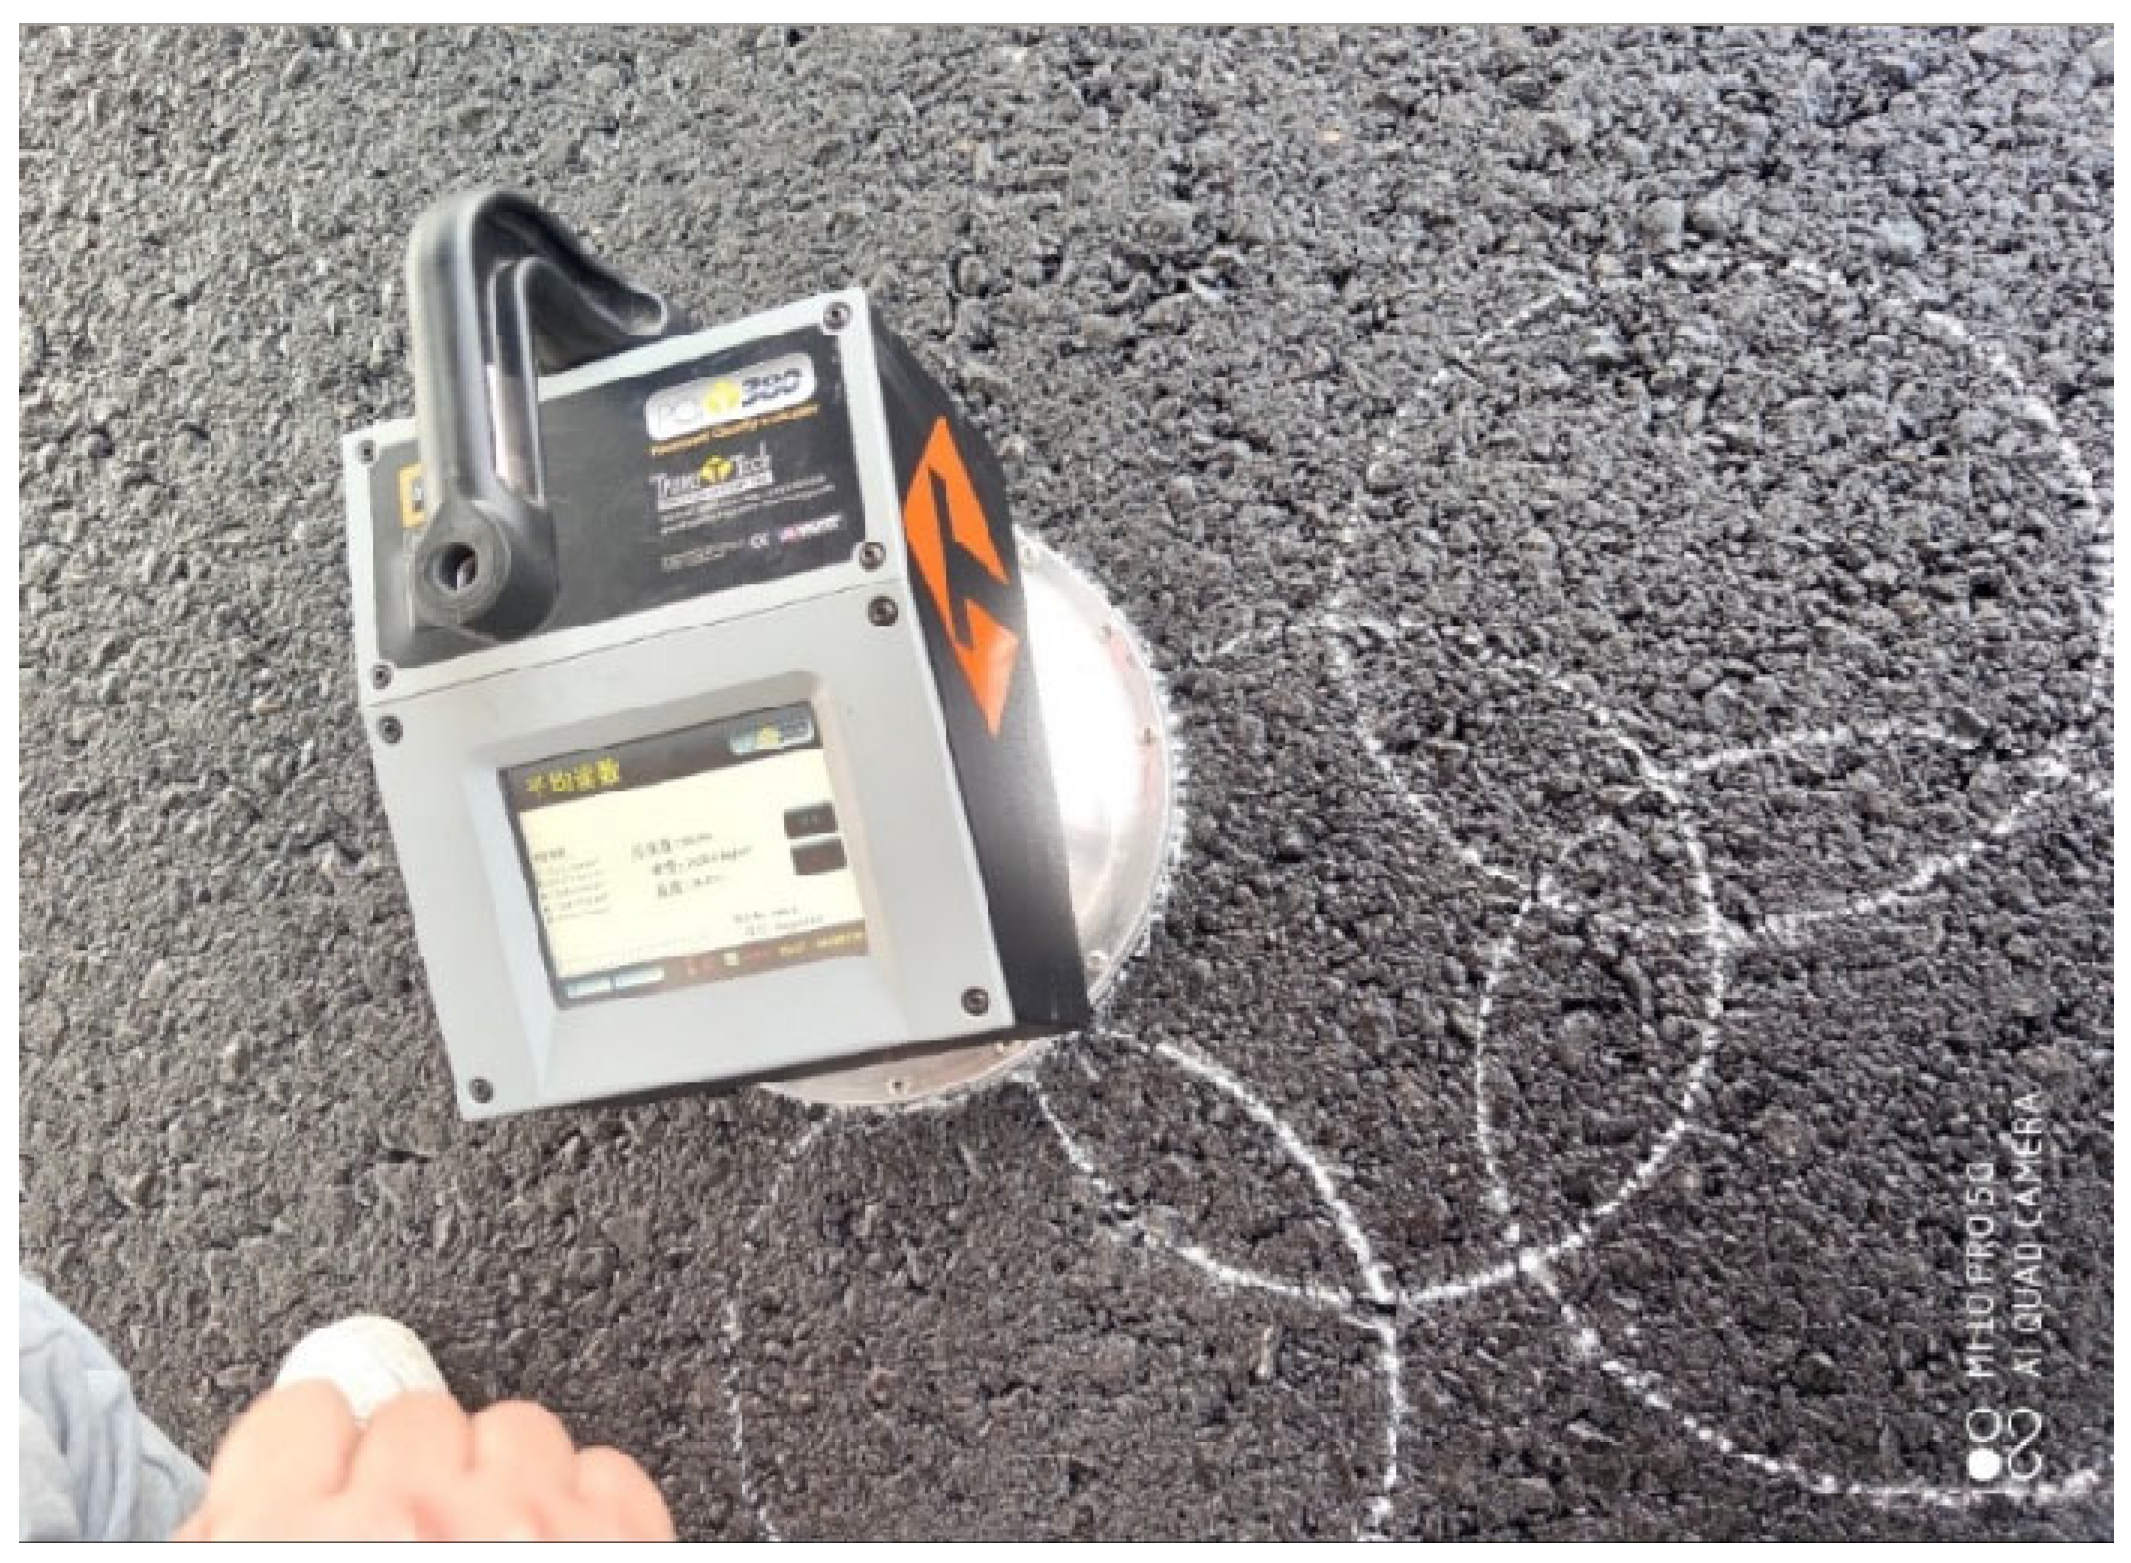
2.2.1. Density Measurement Based on the PQI Method
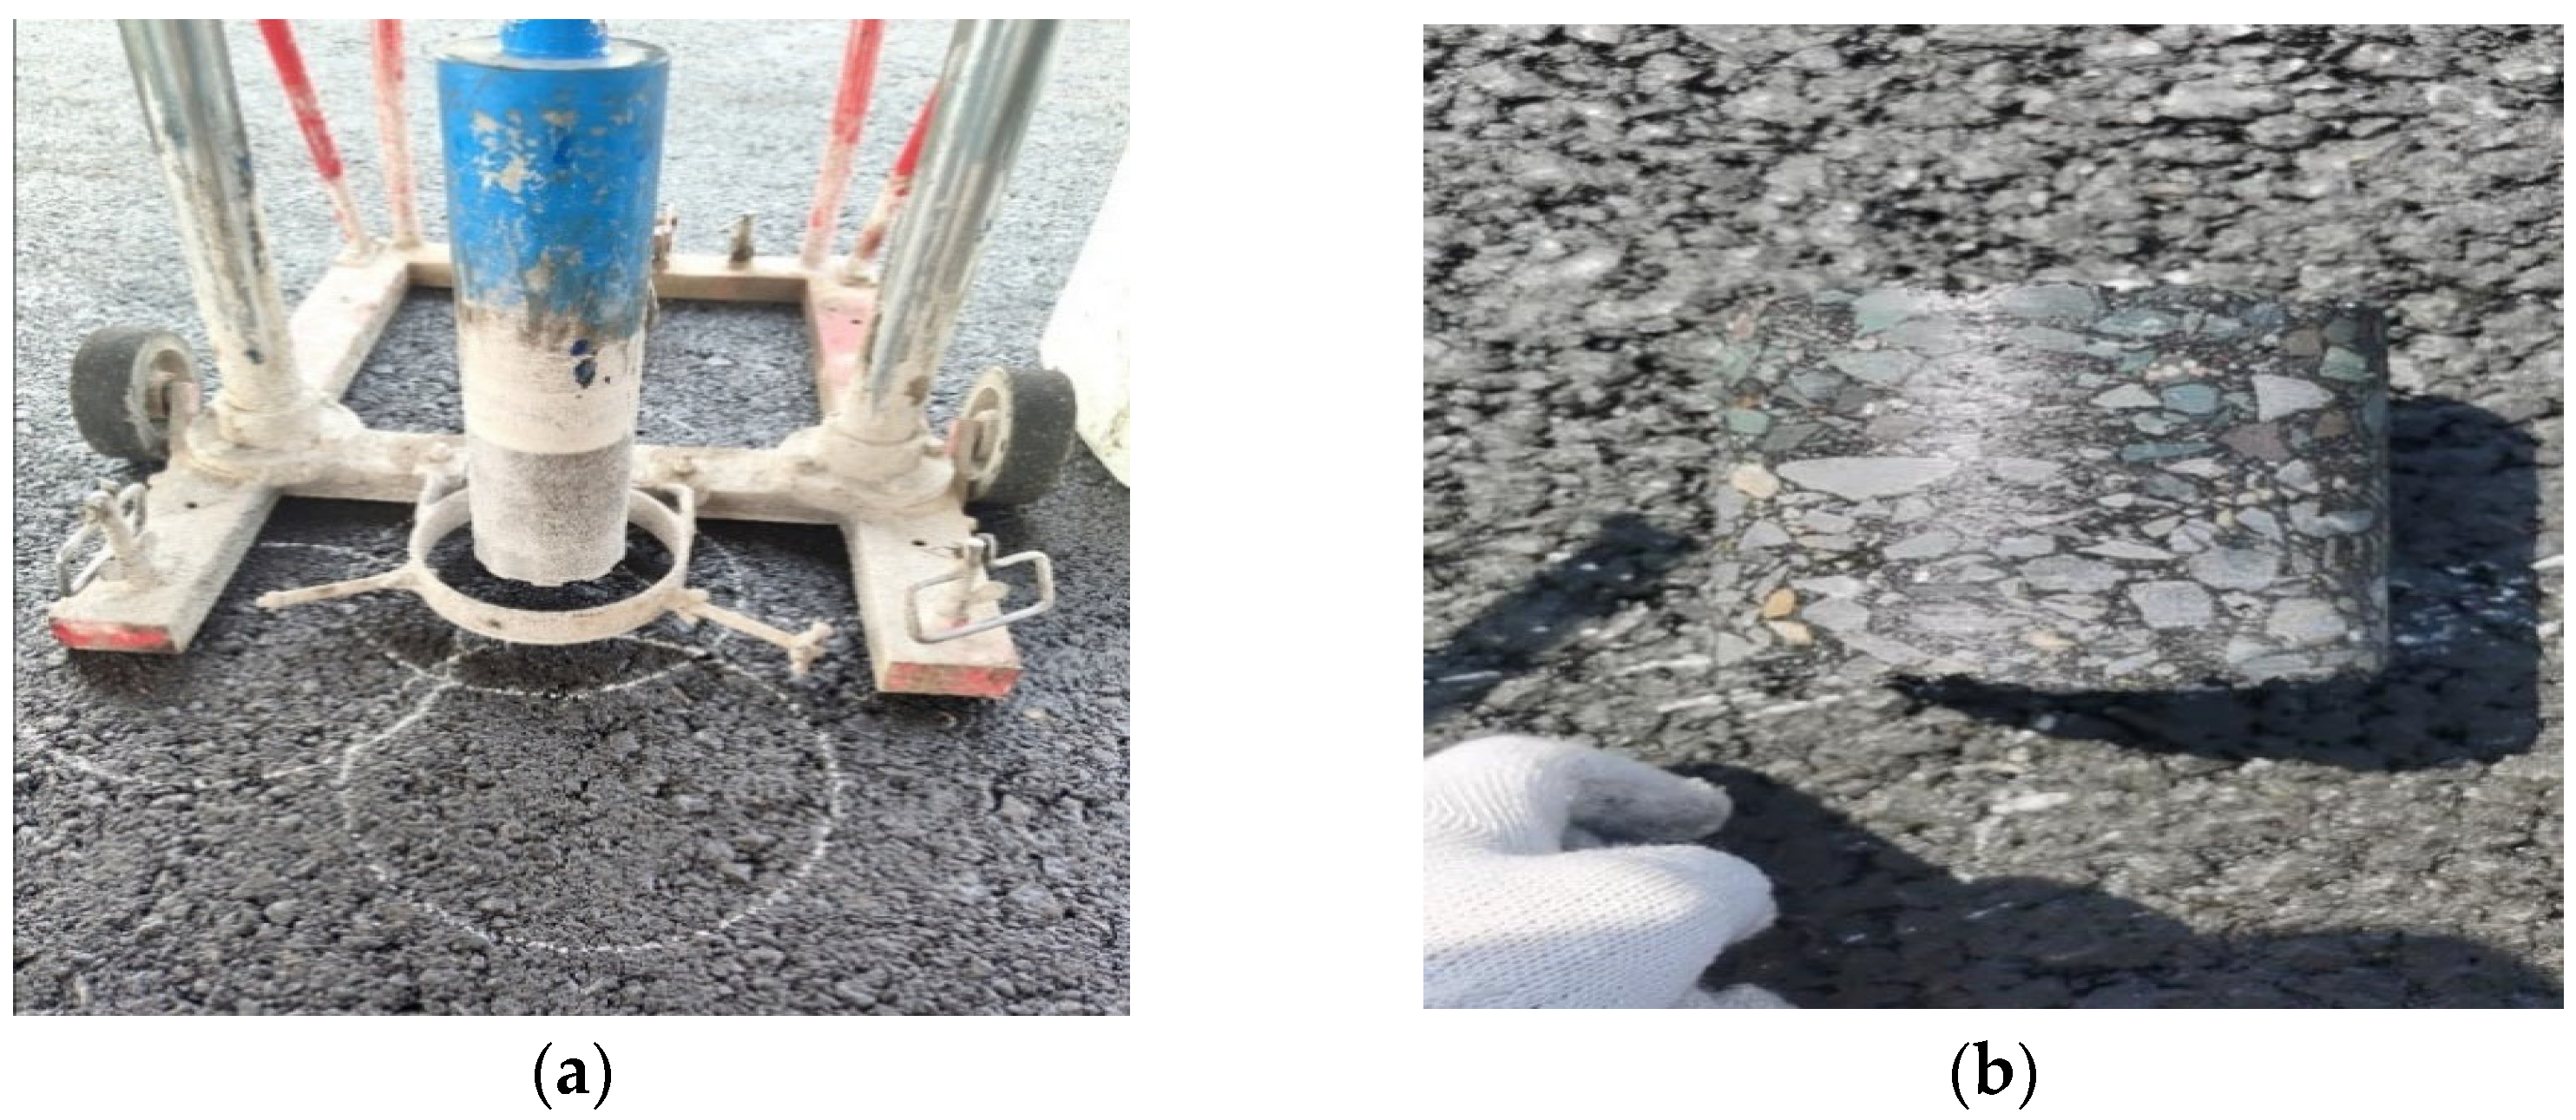
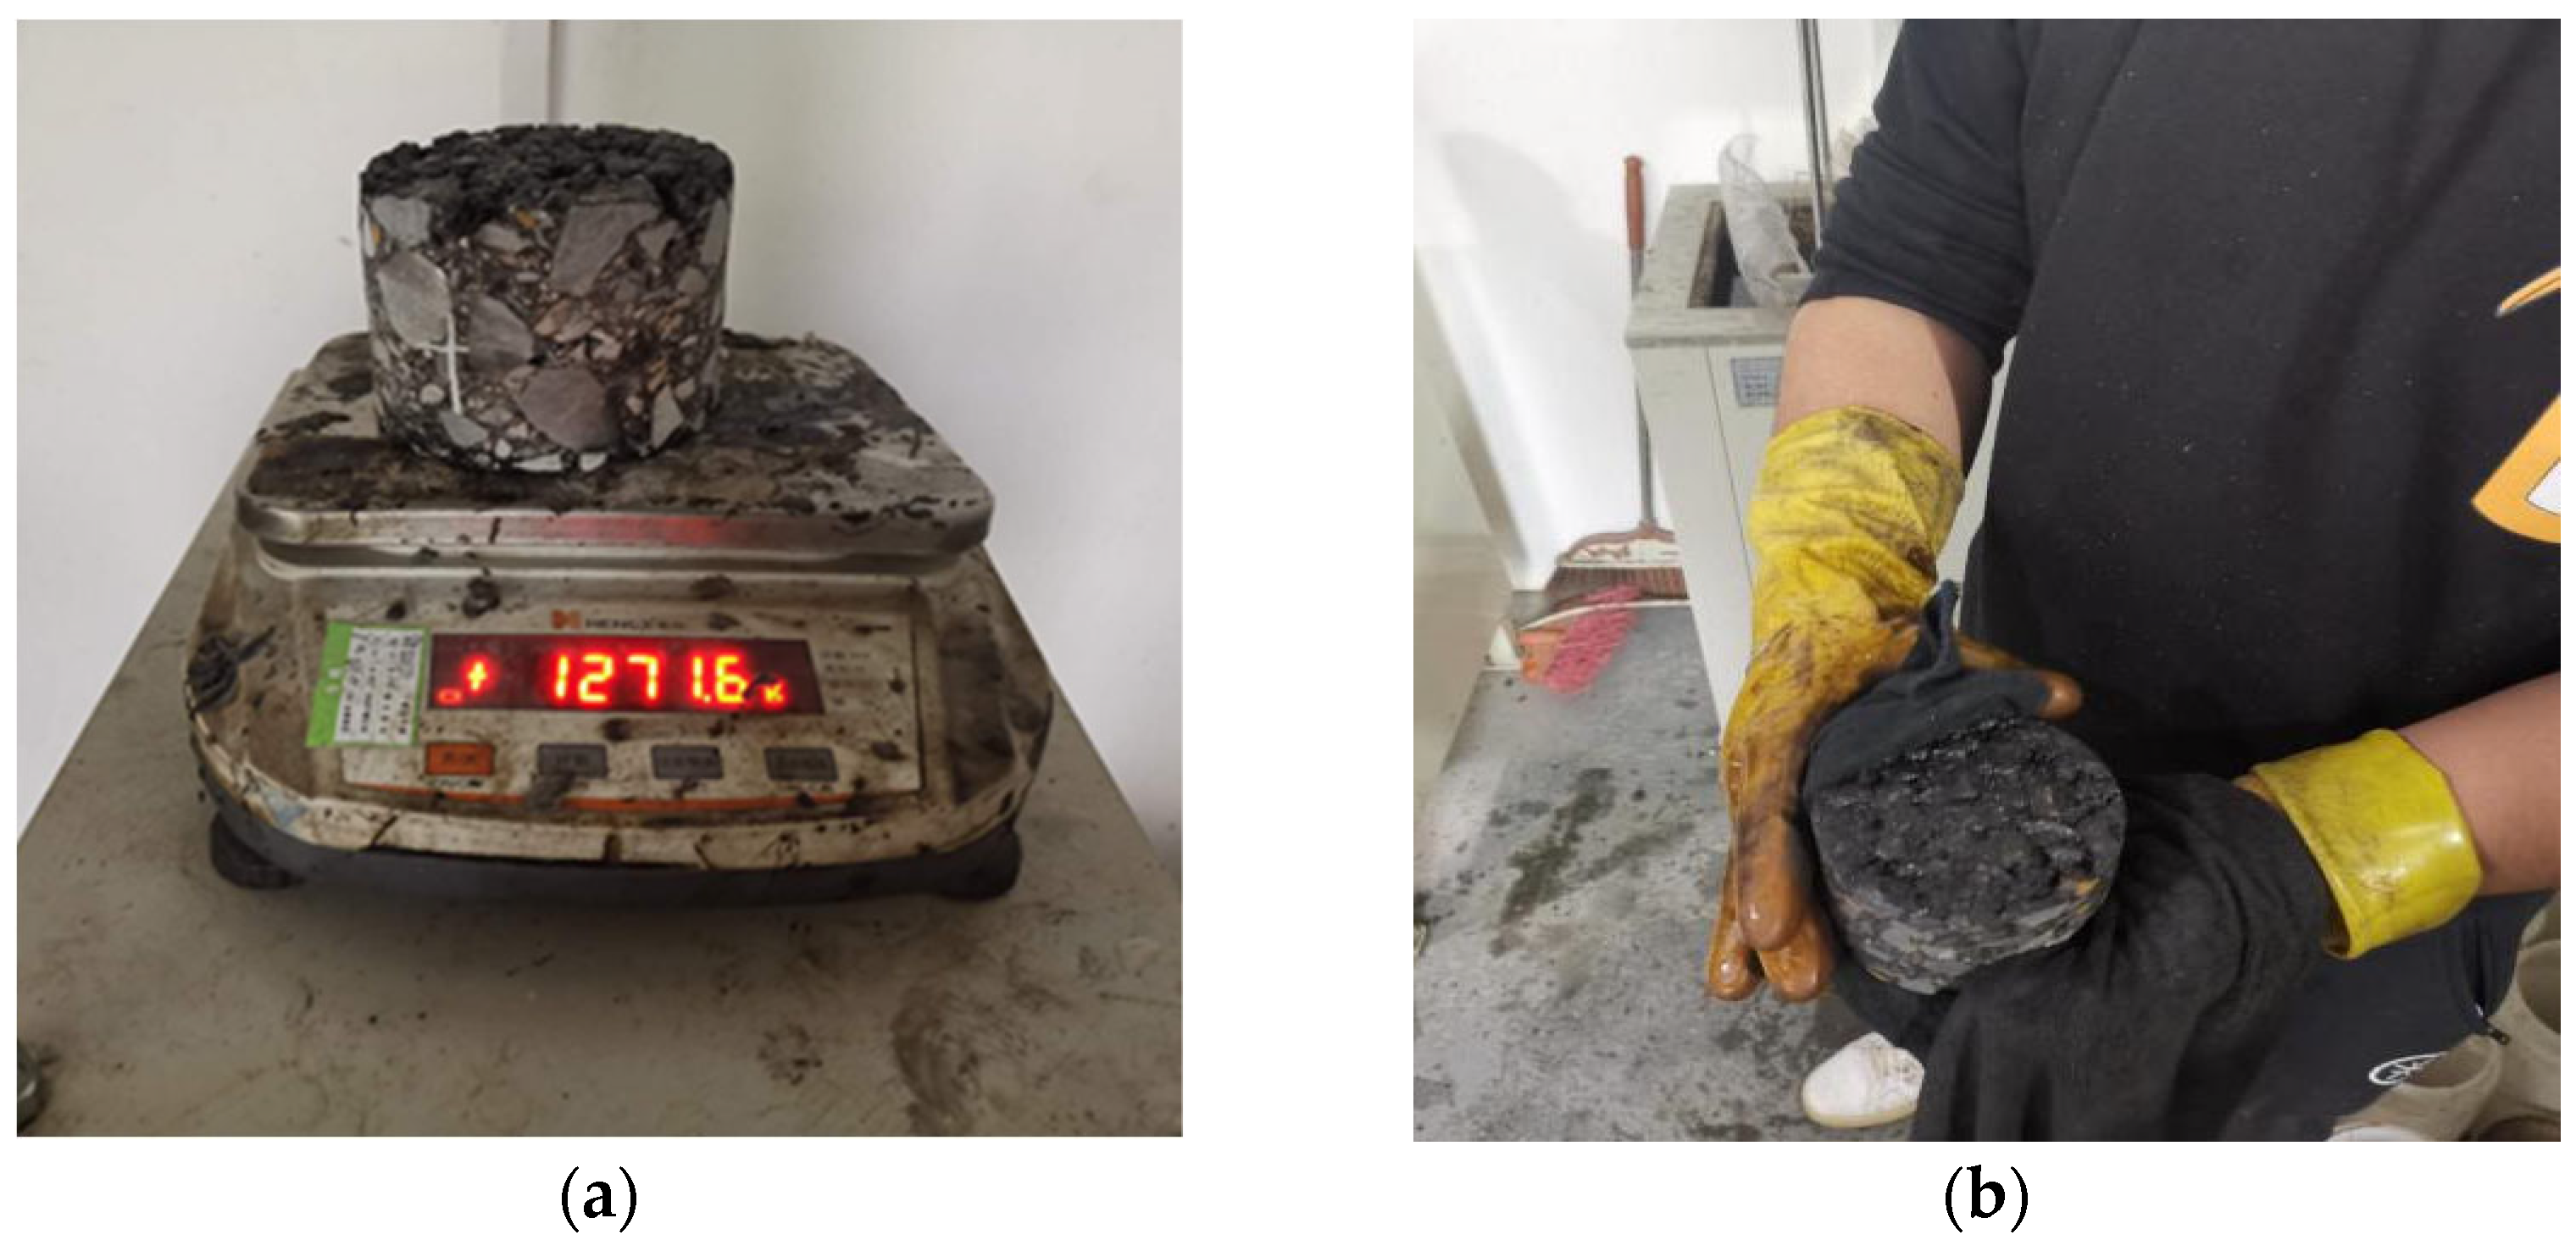
2.2.2. Density Measurement Based on the Core Sample
2.2.3. Determination of the Calibration Coefficient
2.2.4. Rechecking of the Calibration Coefficient
2.3. Calculation of Compaction Degree
3. Evaluation and Analysis of Compaction Degree of Asphalt Pavement
3.1. Evaluation of Compaction Degree of Asphalt Pavement
3.2. Analysis of Probability Distribution Model of Compaction Degree
3.3. Optimization of Probability Distribution Model of Compaction Degree
3.4. Determination of Compaction Degree Detection-Spacing
4. Conclusions
- The calibration coefficient was calculated as −0.016 g/cm3. The calibrated PQI density was close to the actual density of the core sample, and the error rate was within 1%, indicating that the PQI method had a high testing-accuracy.
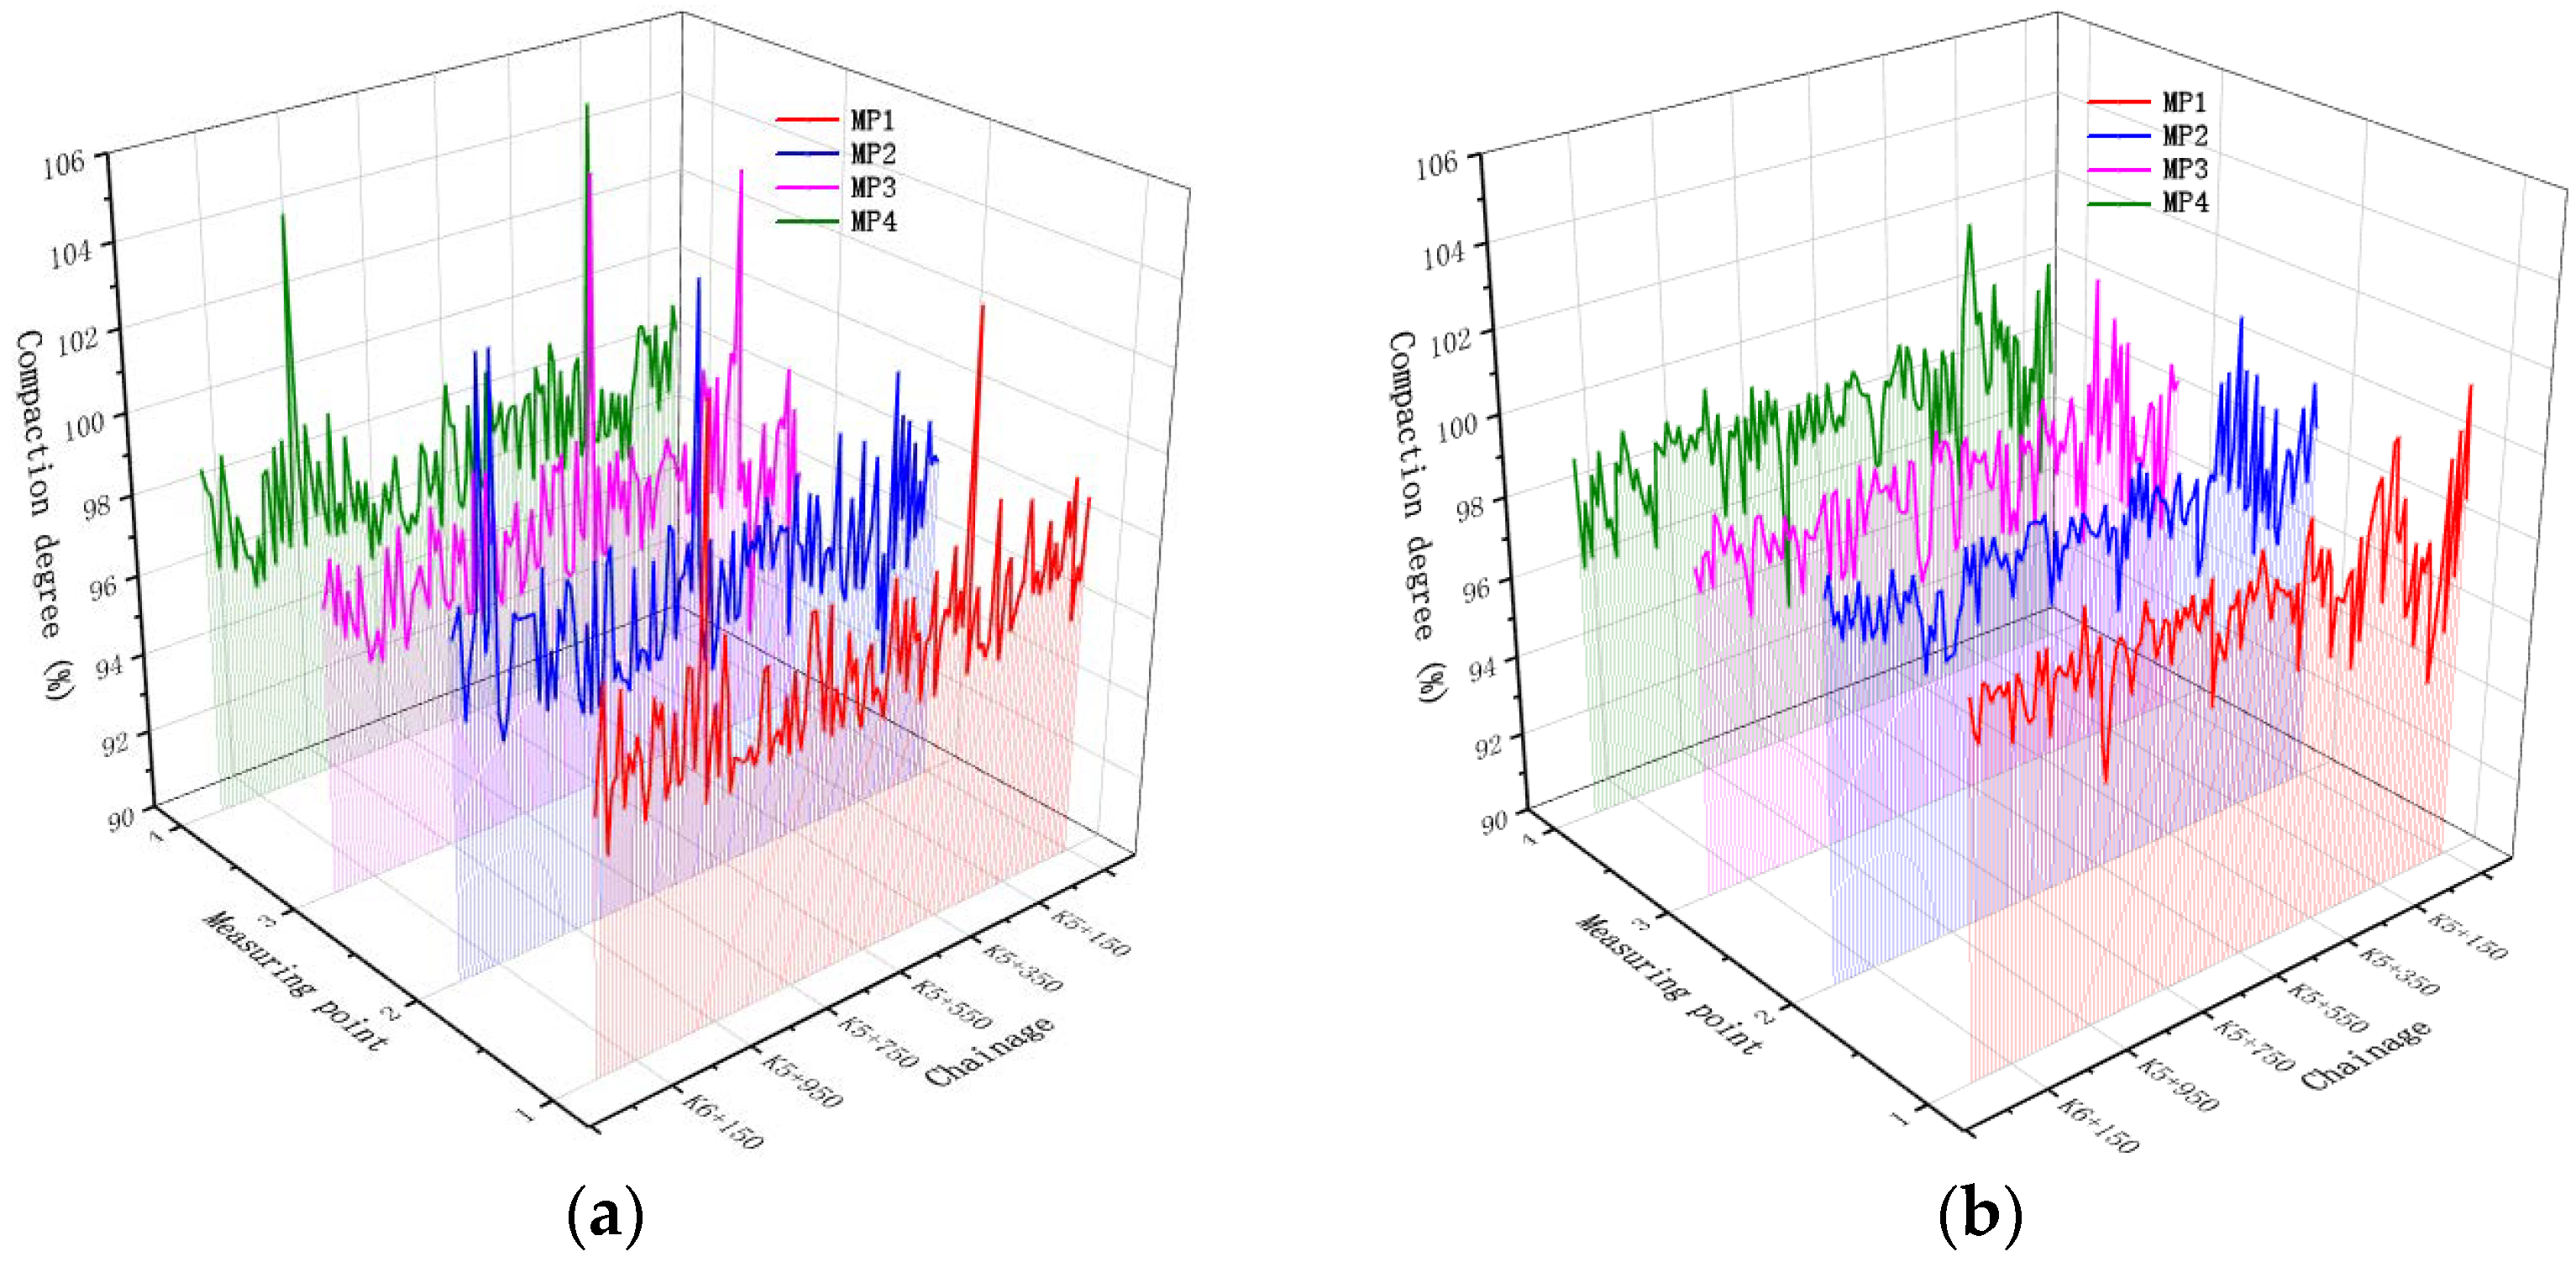
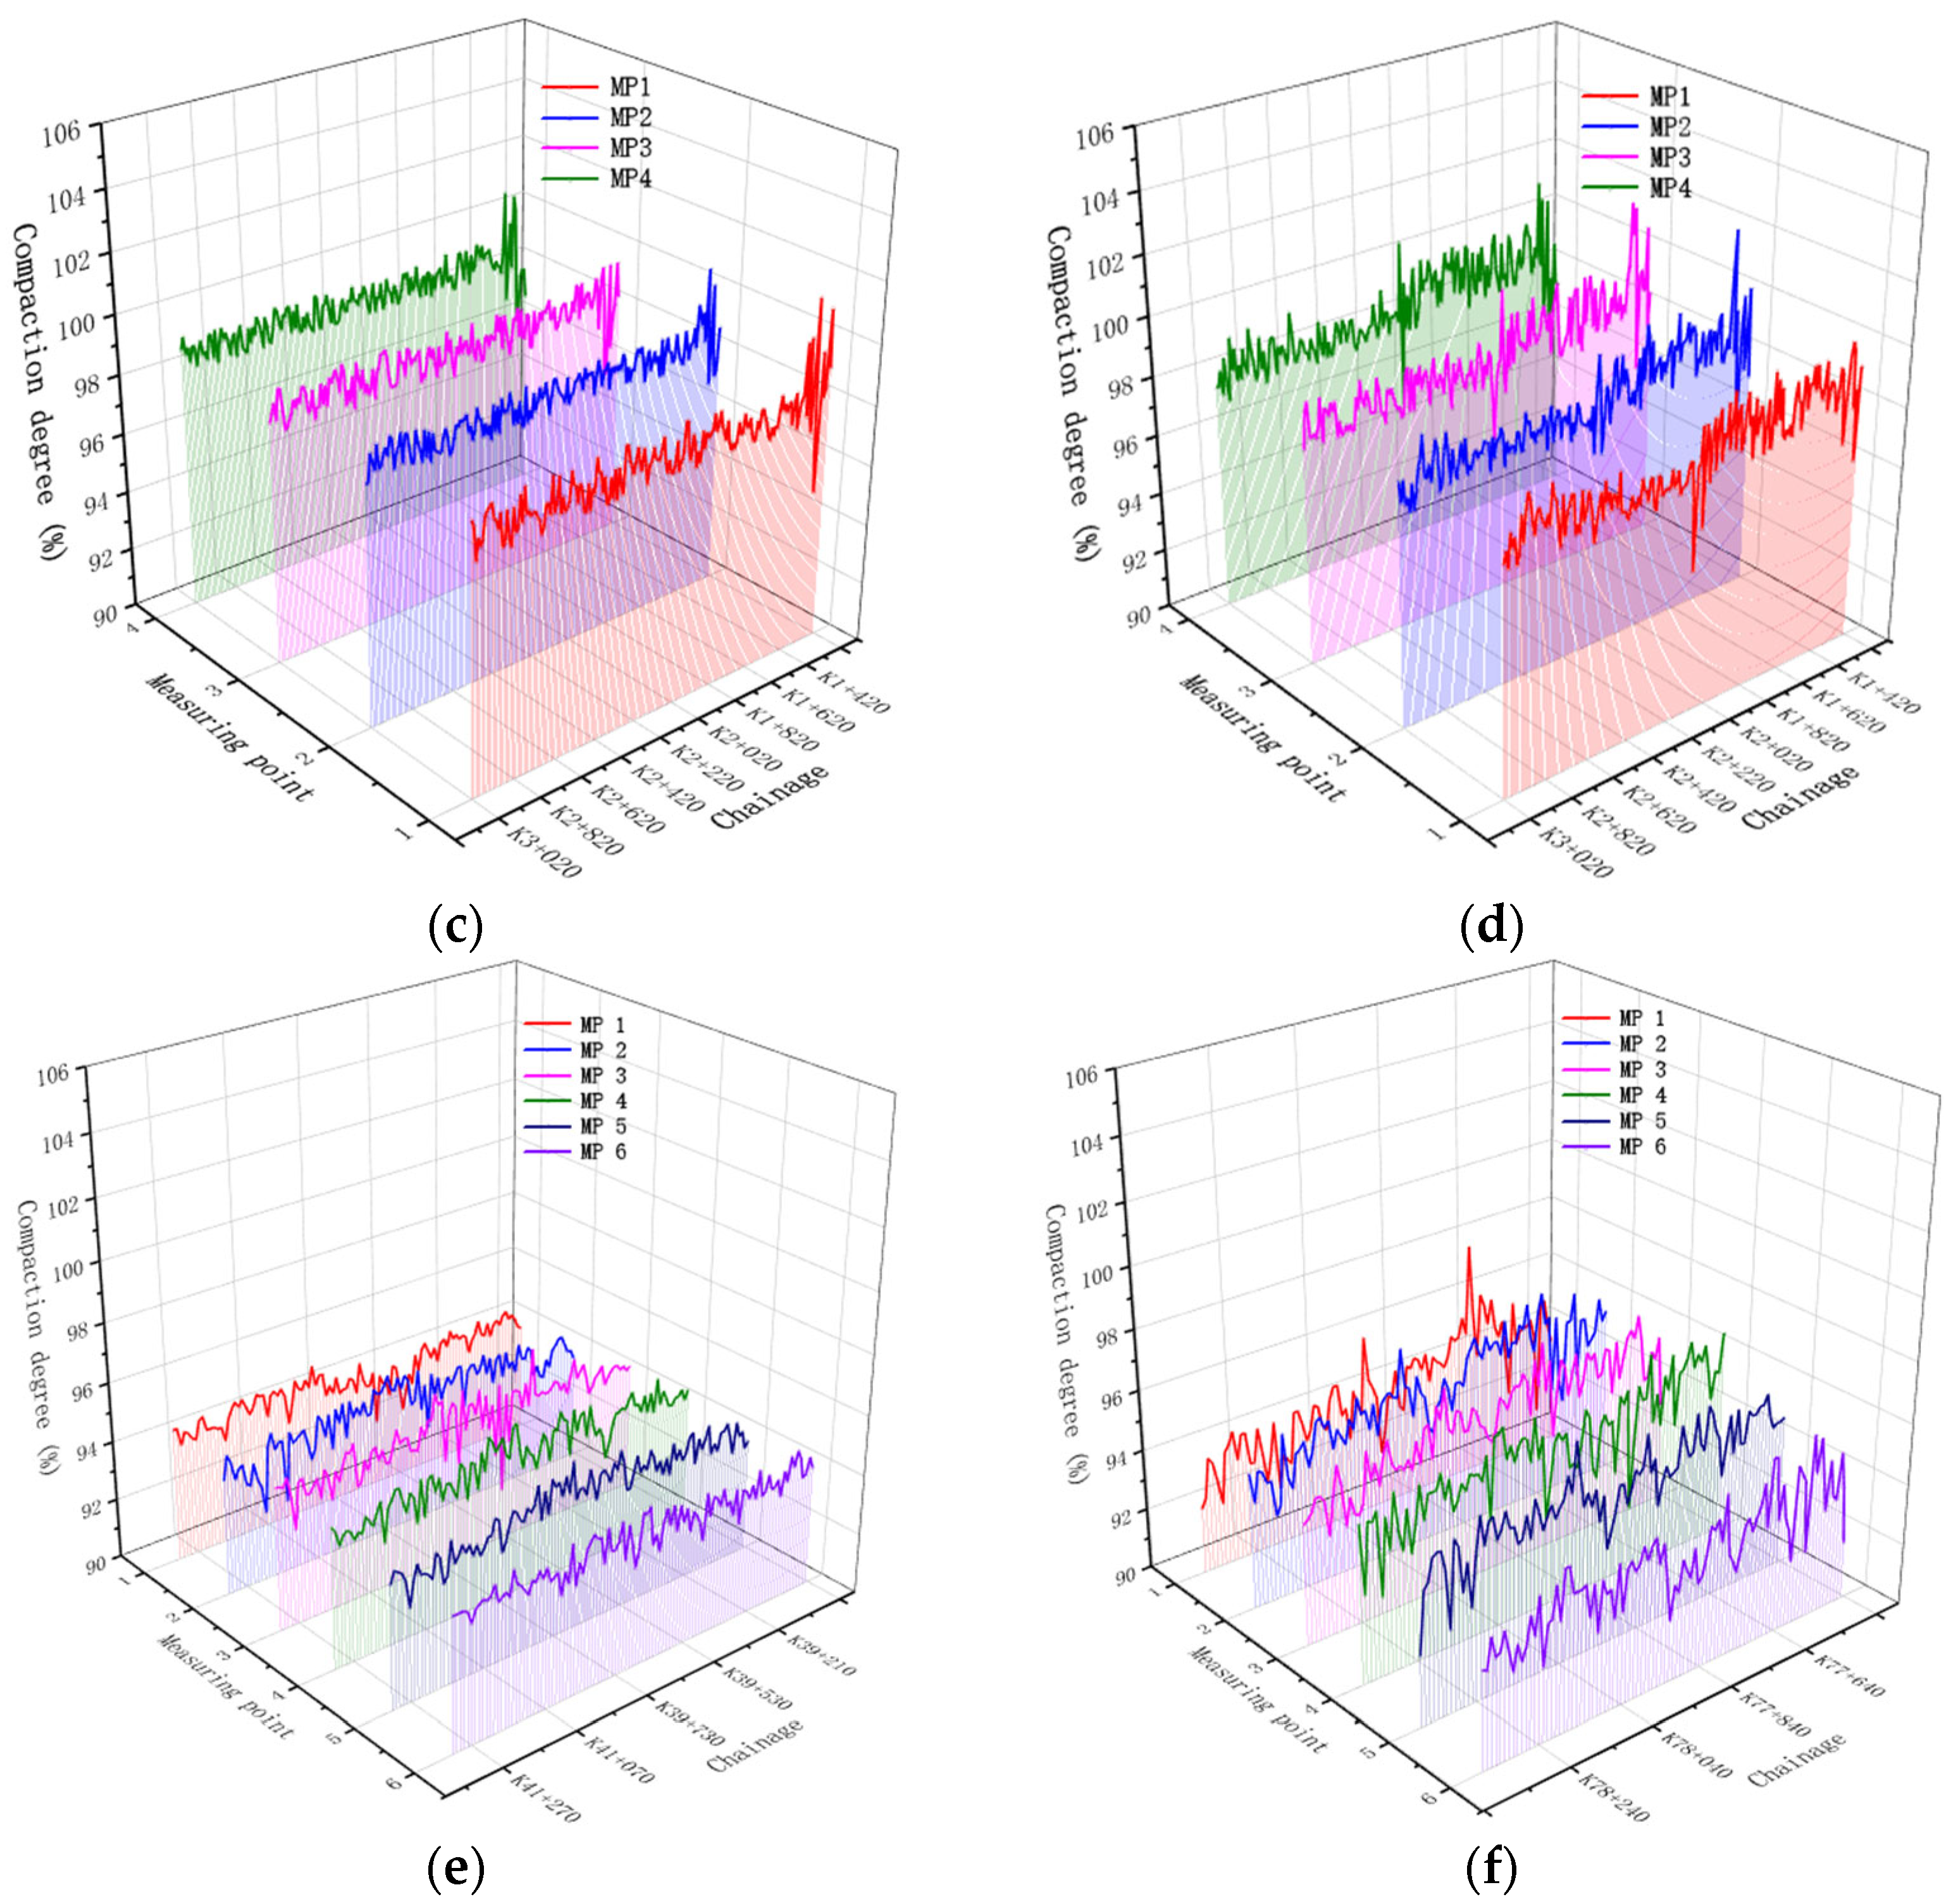
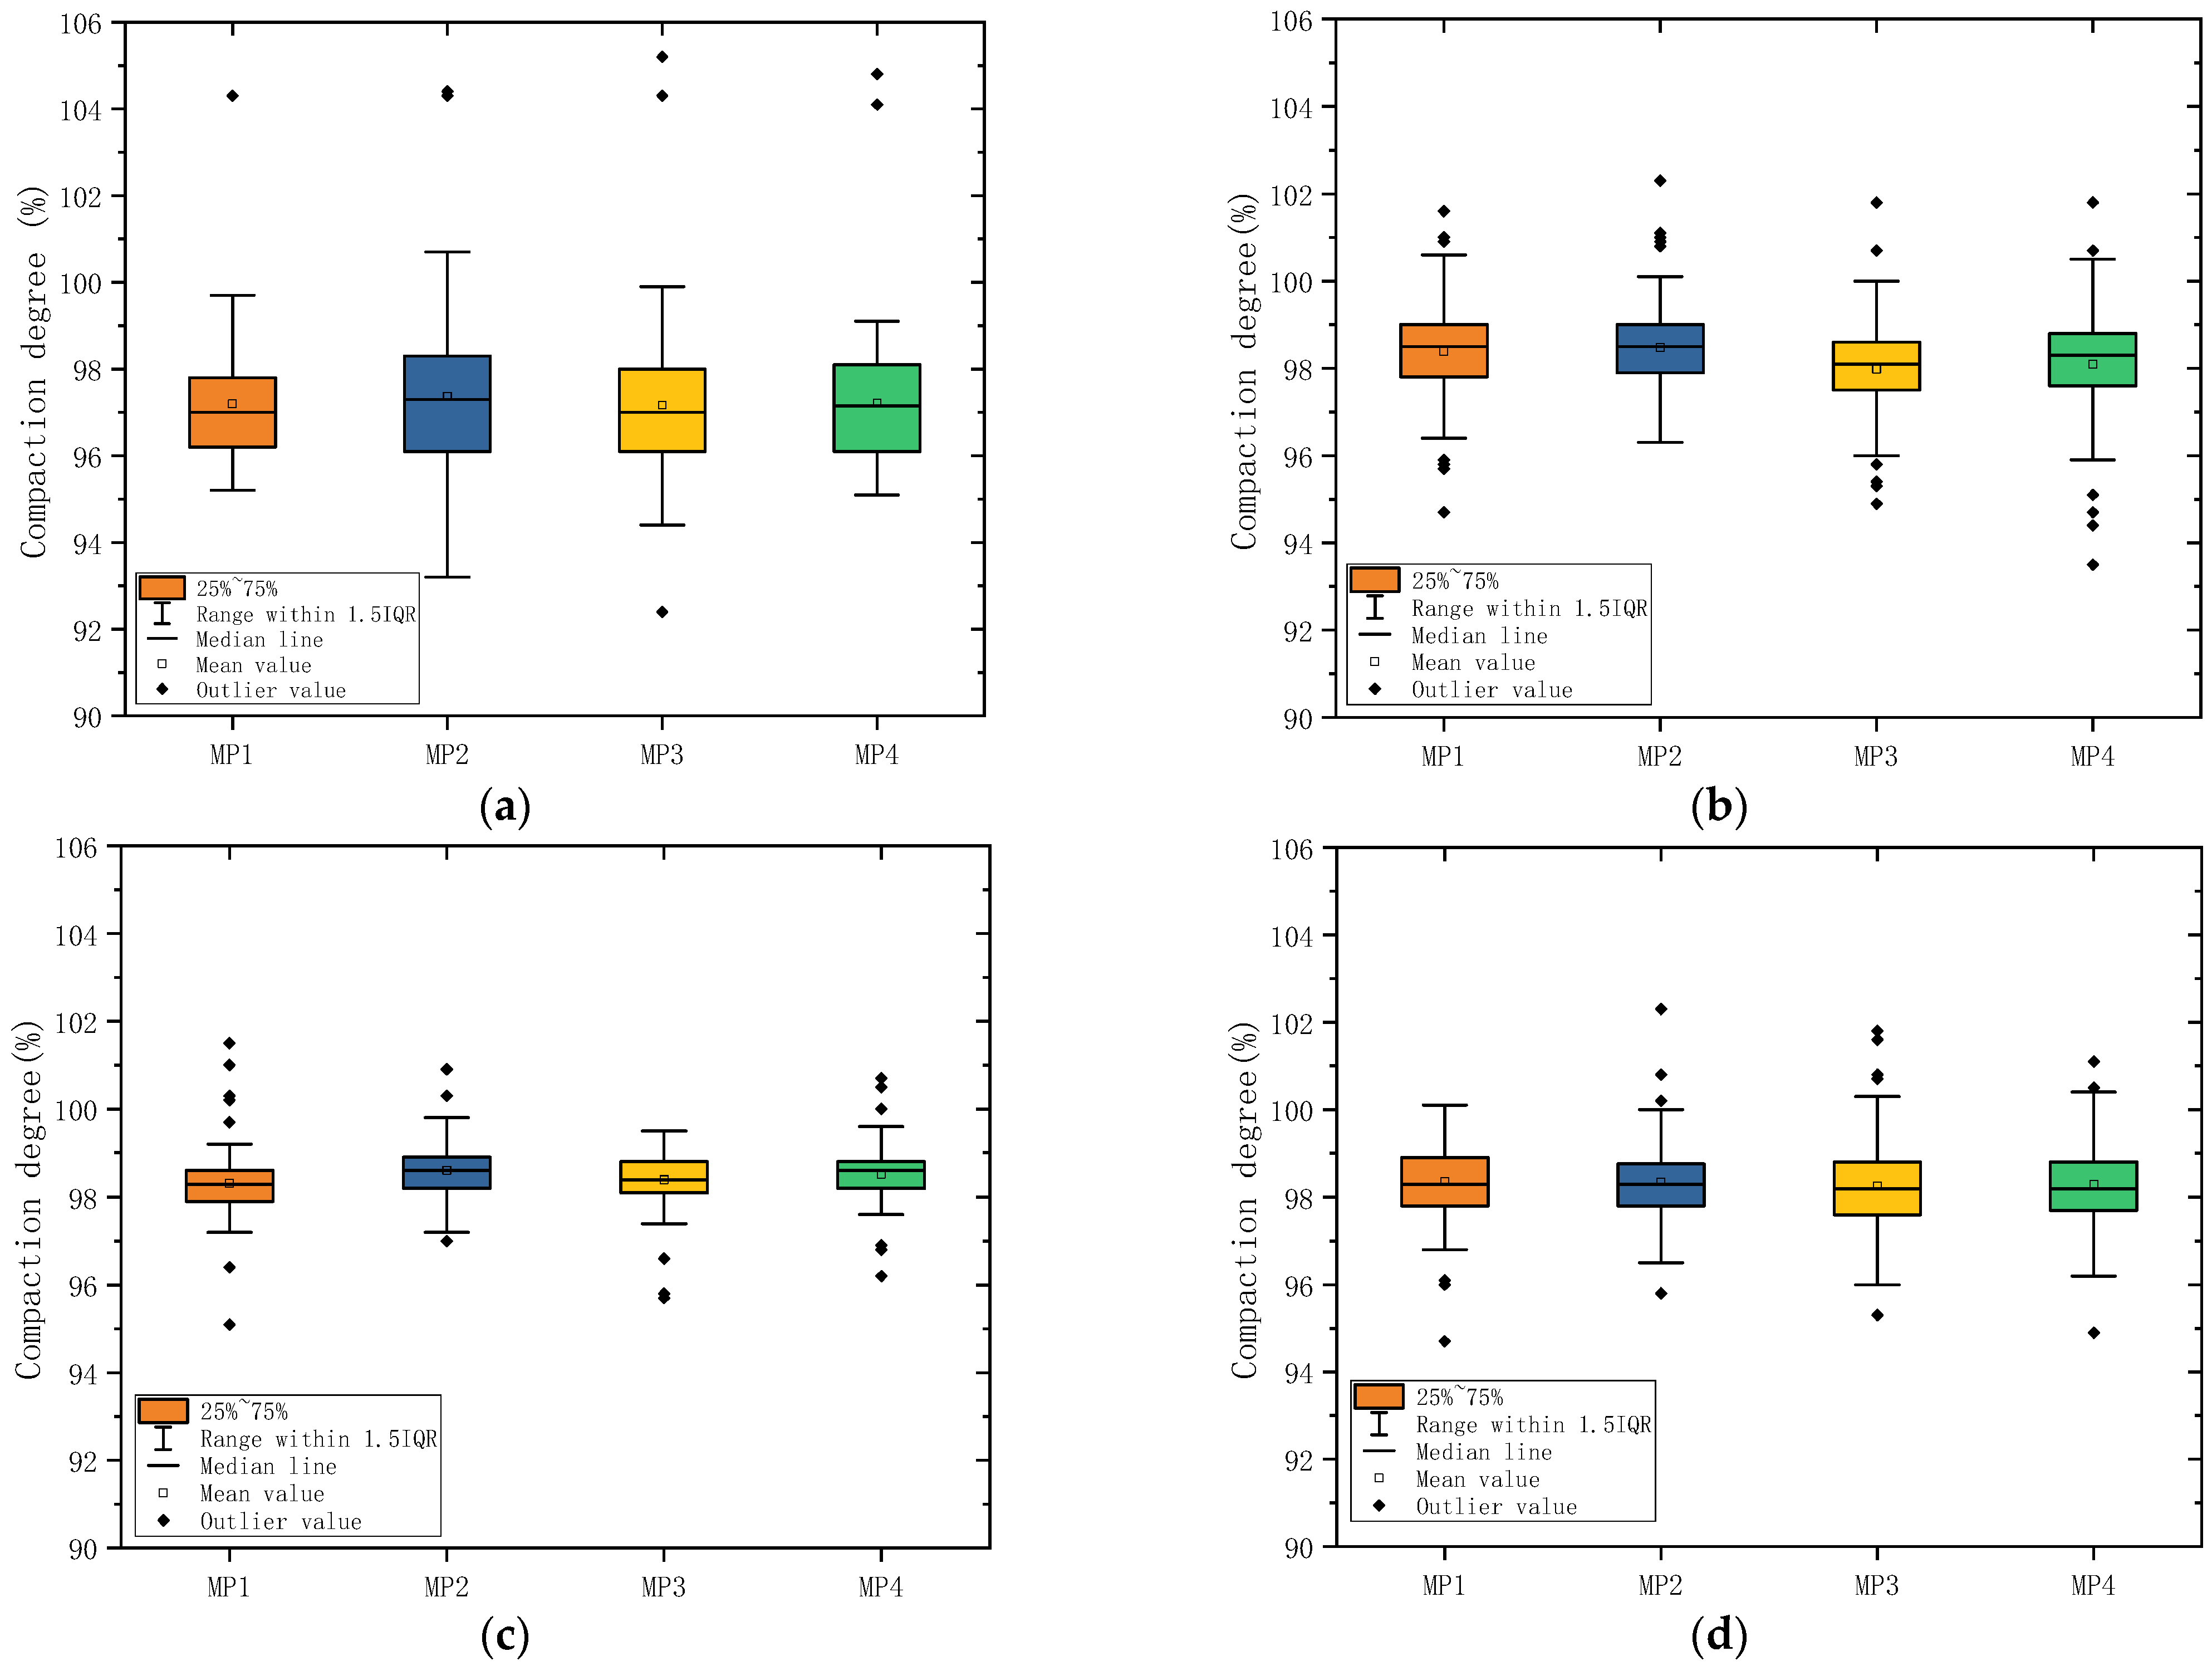
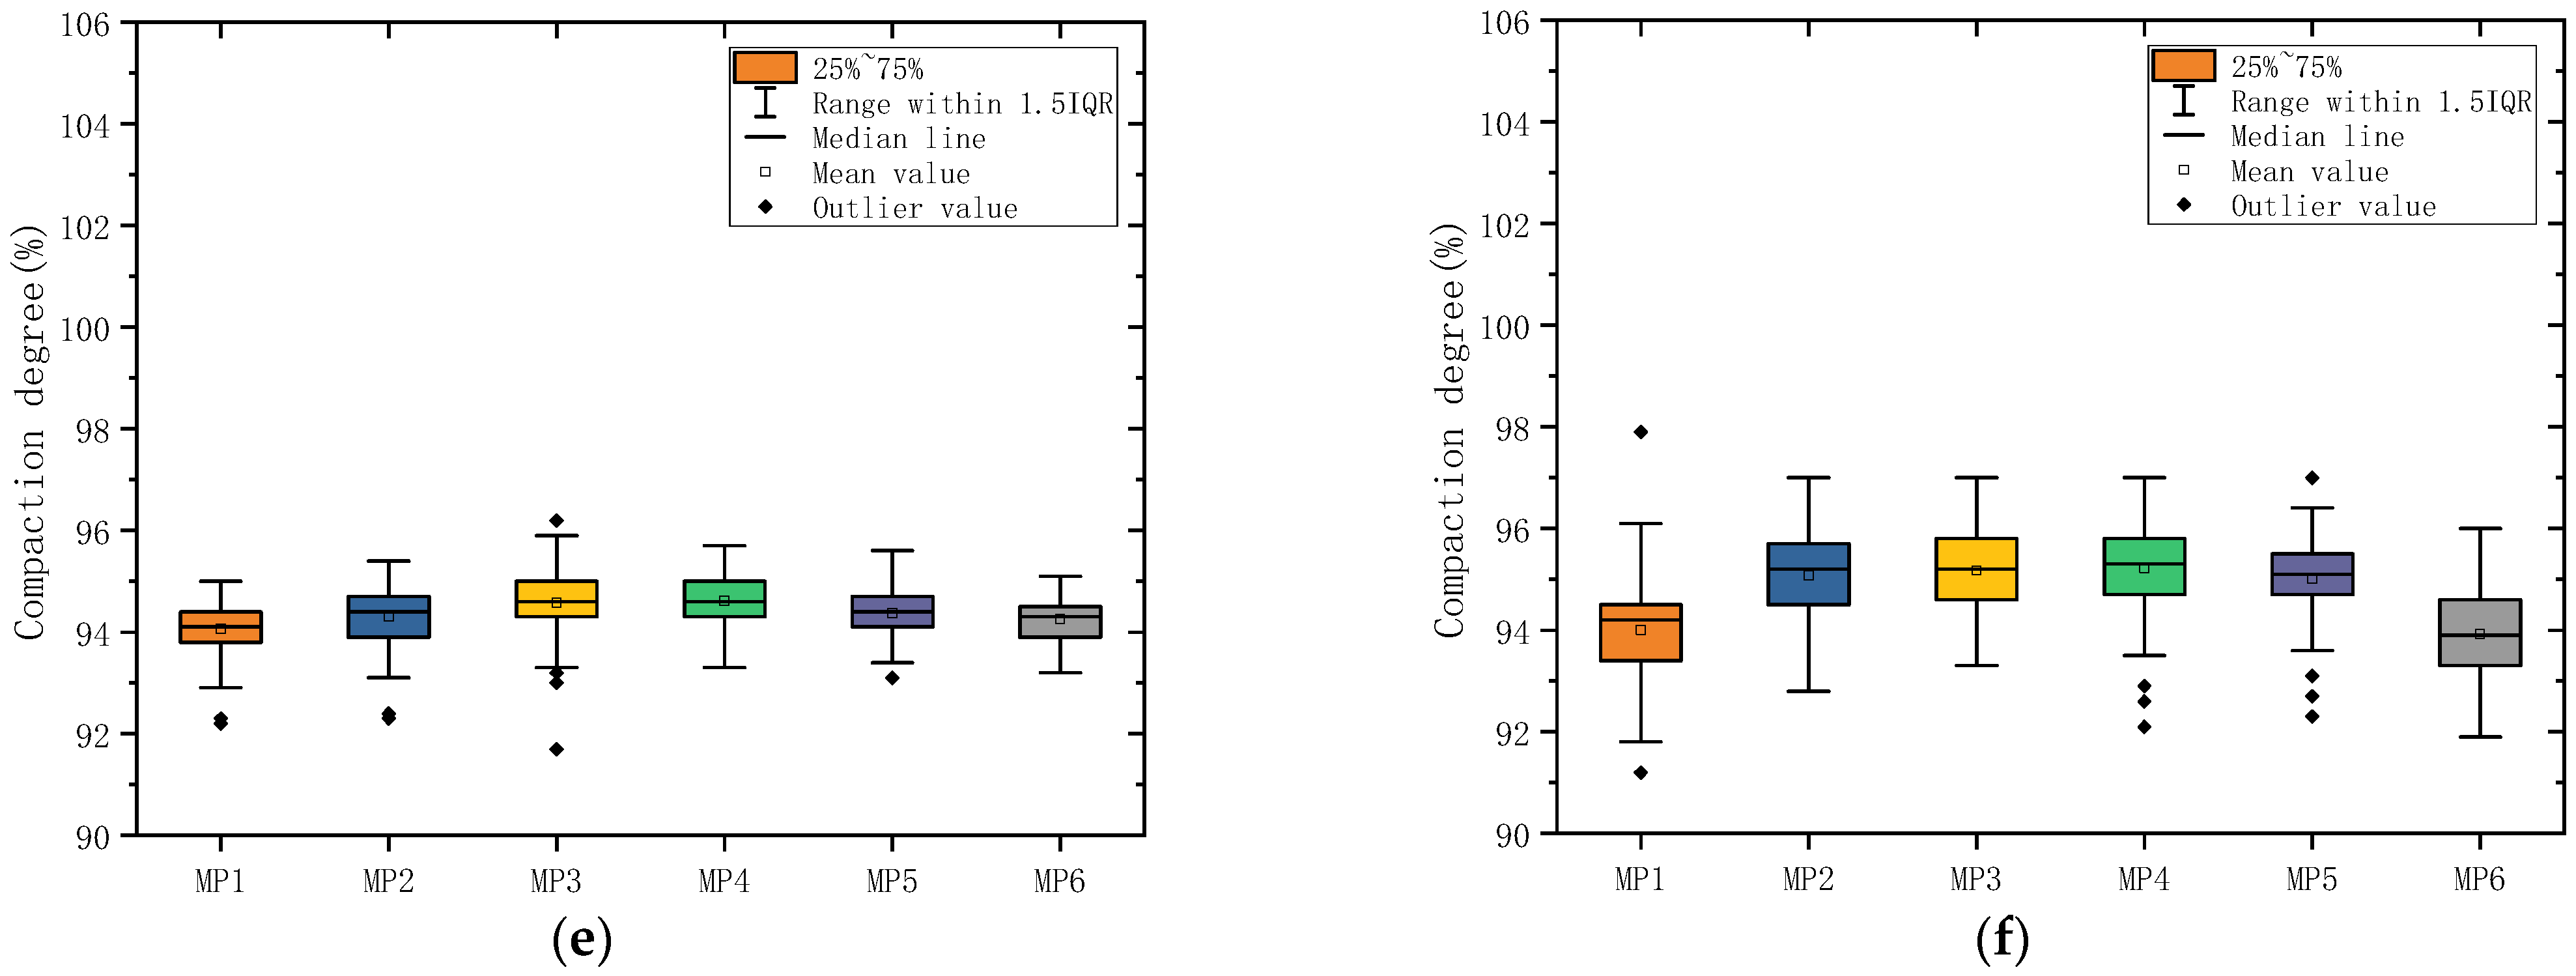
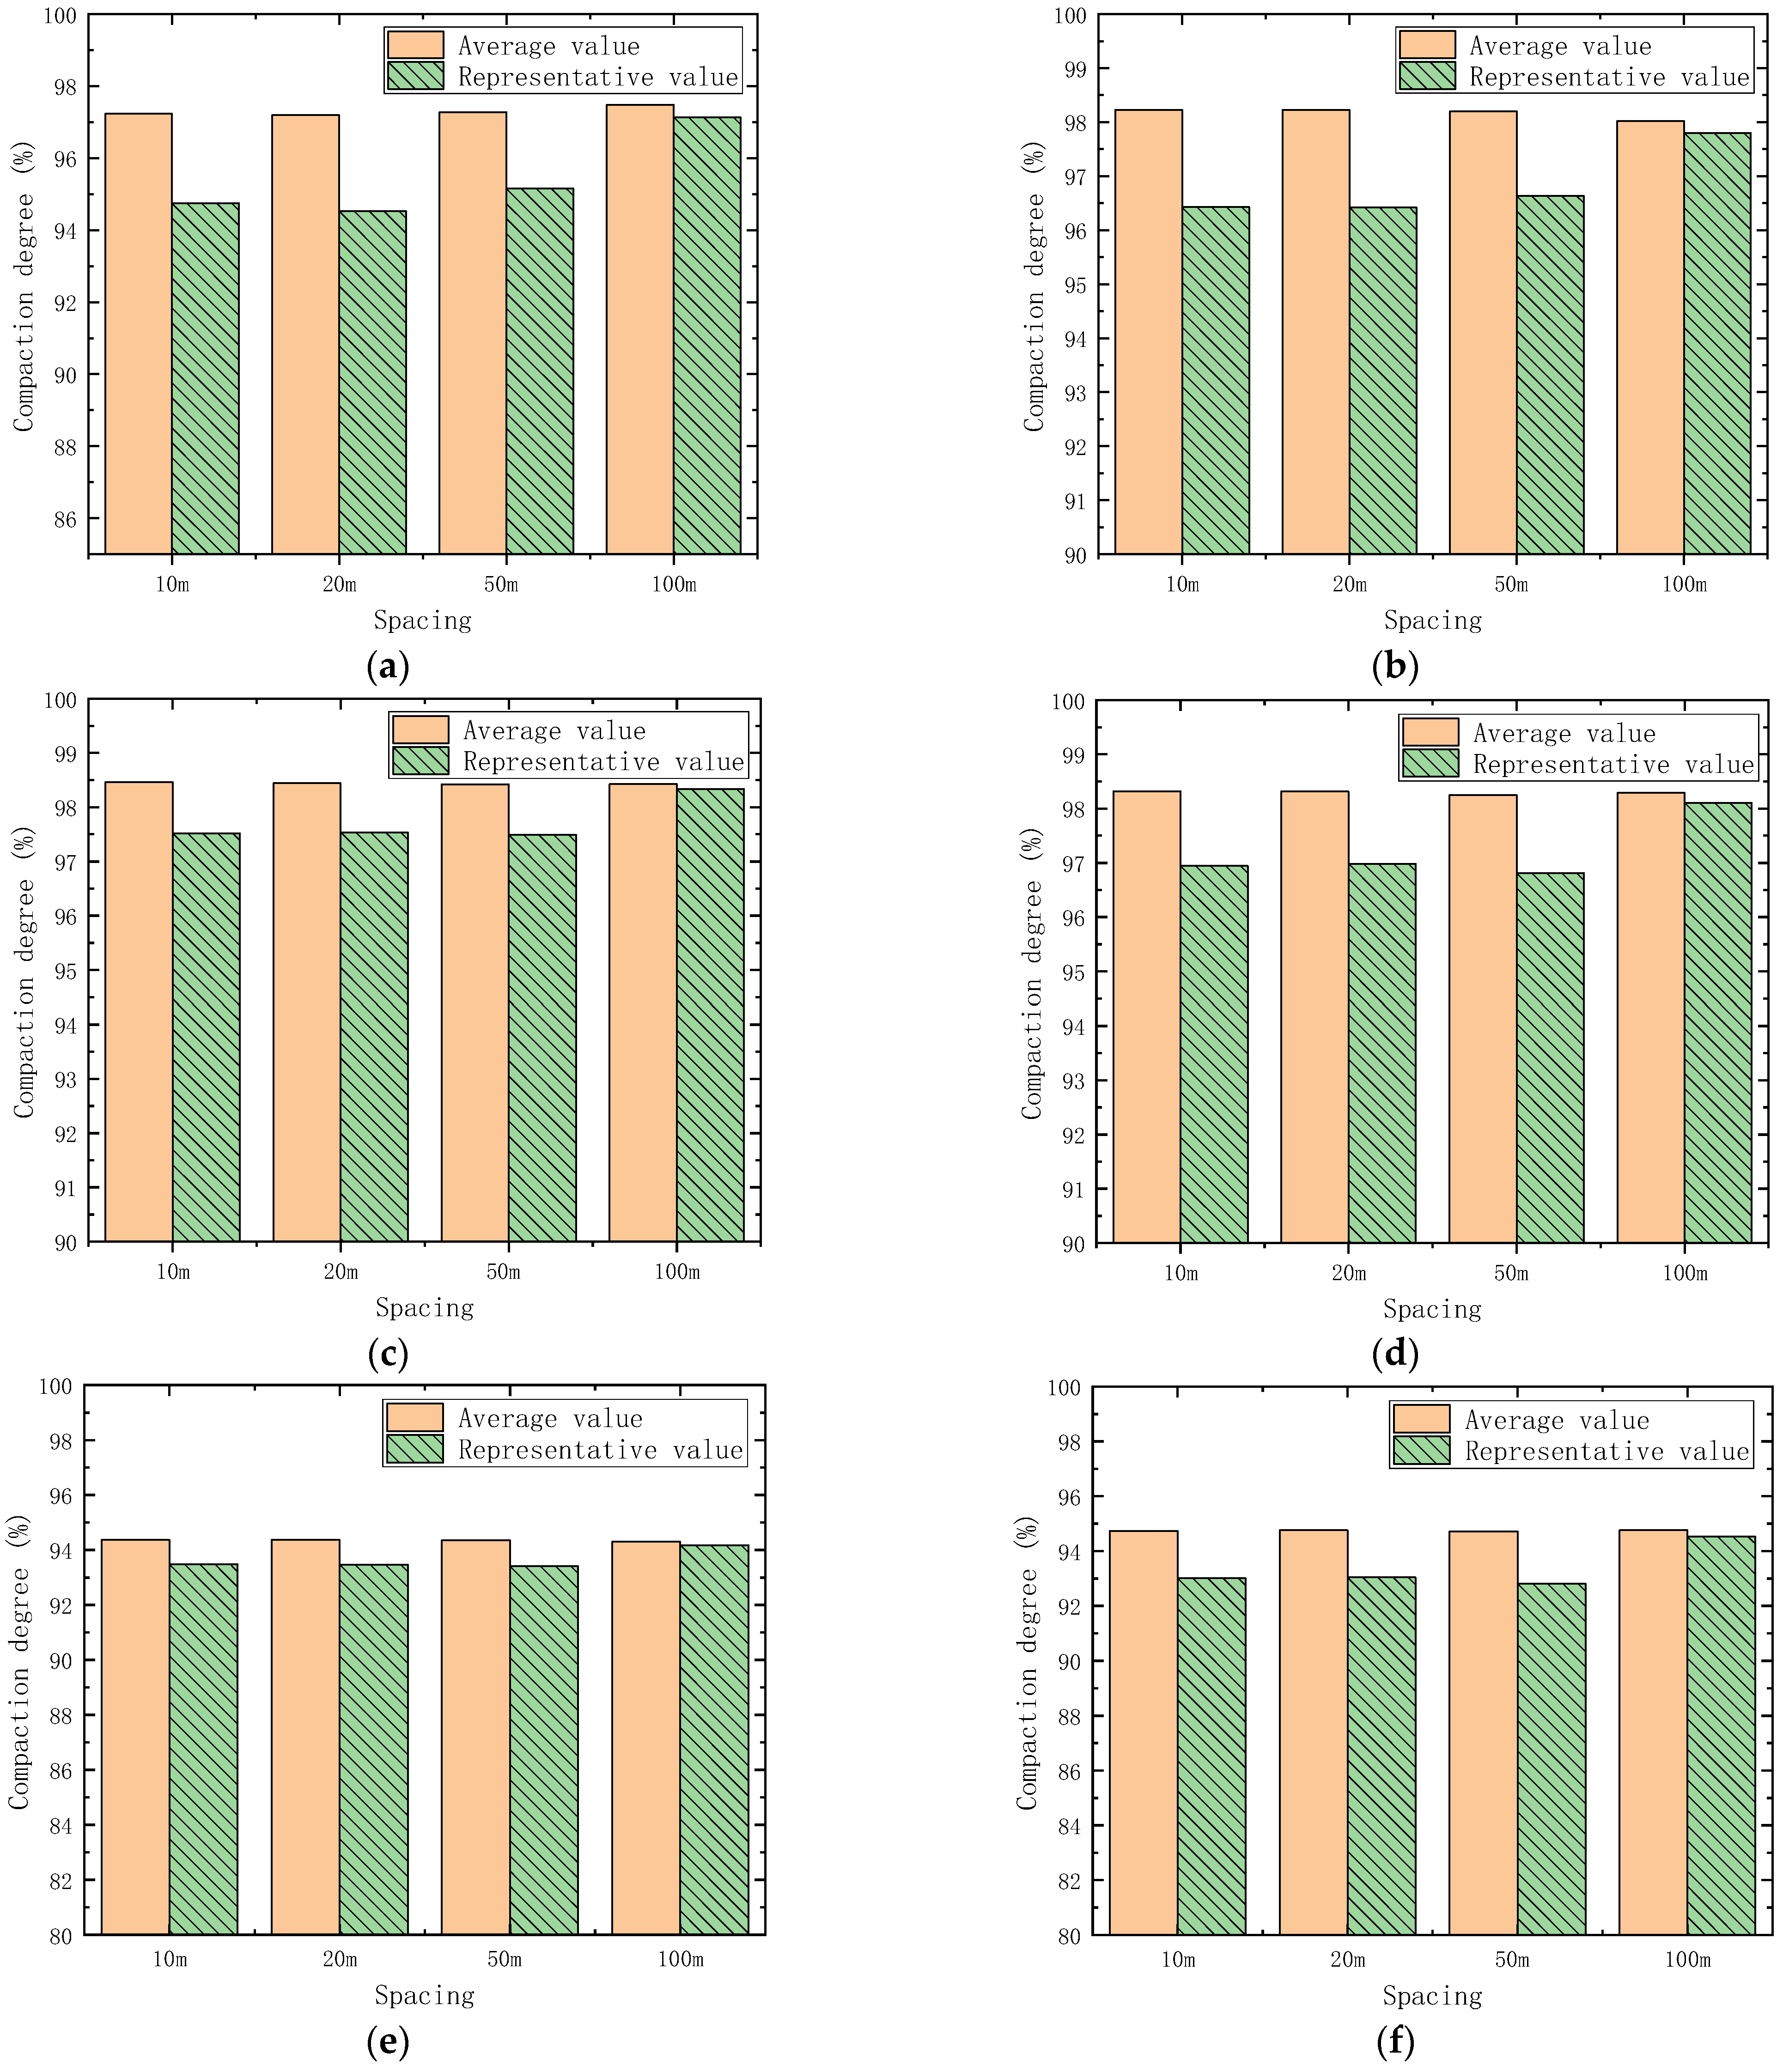
- The compaction degree of the test road was mostly located between 92% and 99%, and the variable coefficient was entirely below 2%. This indicates that the compaction quality of the asphalt pavement was satisfactory and uniform.
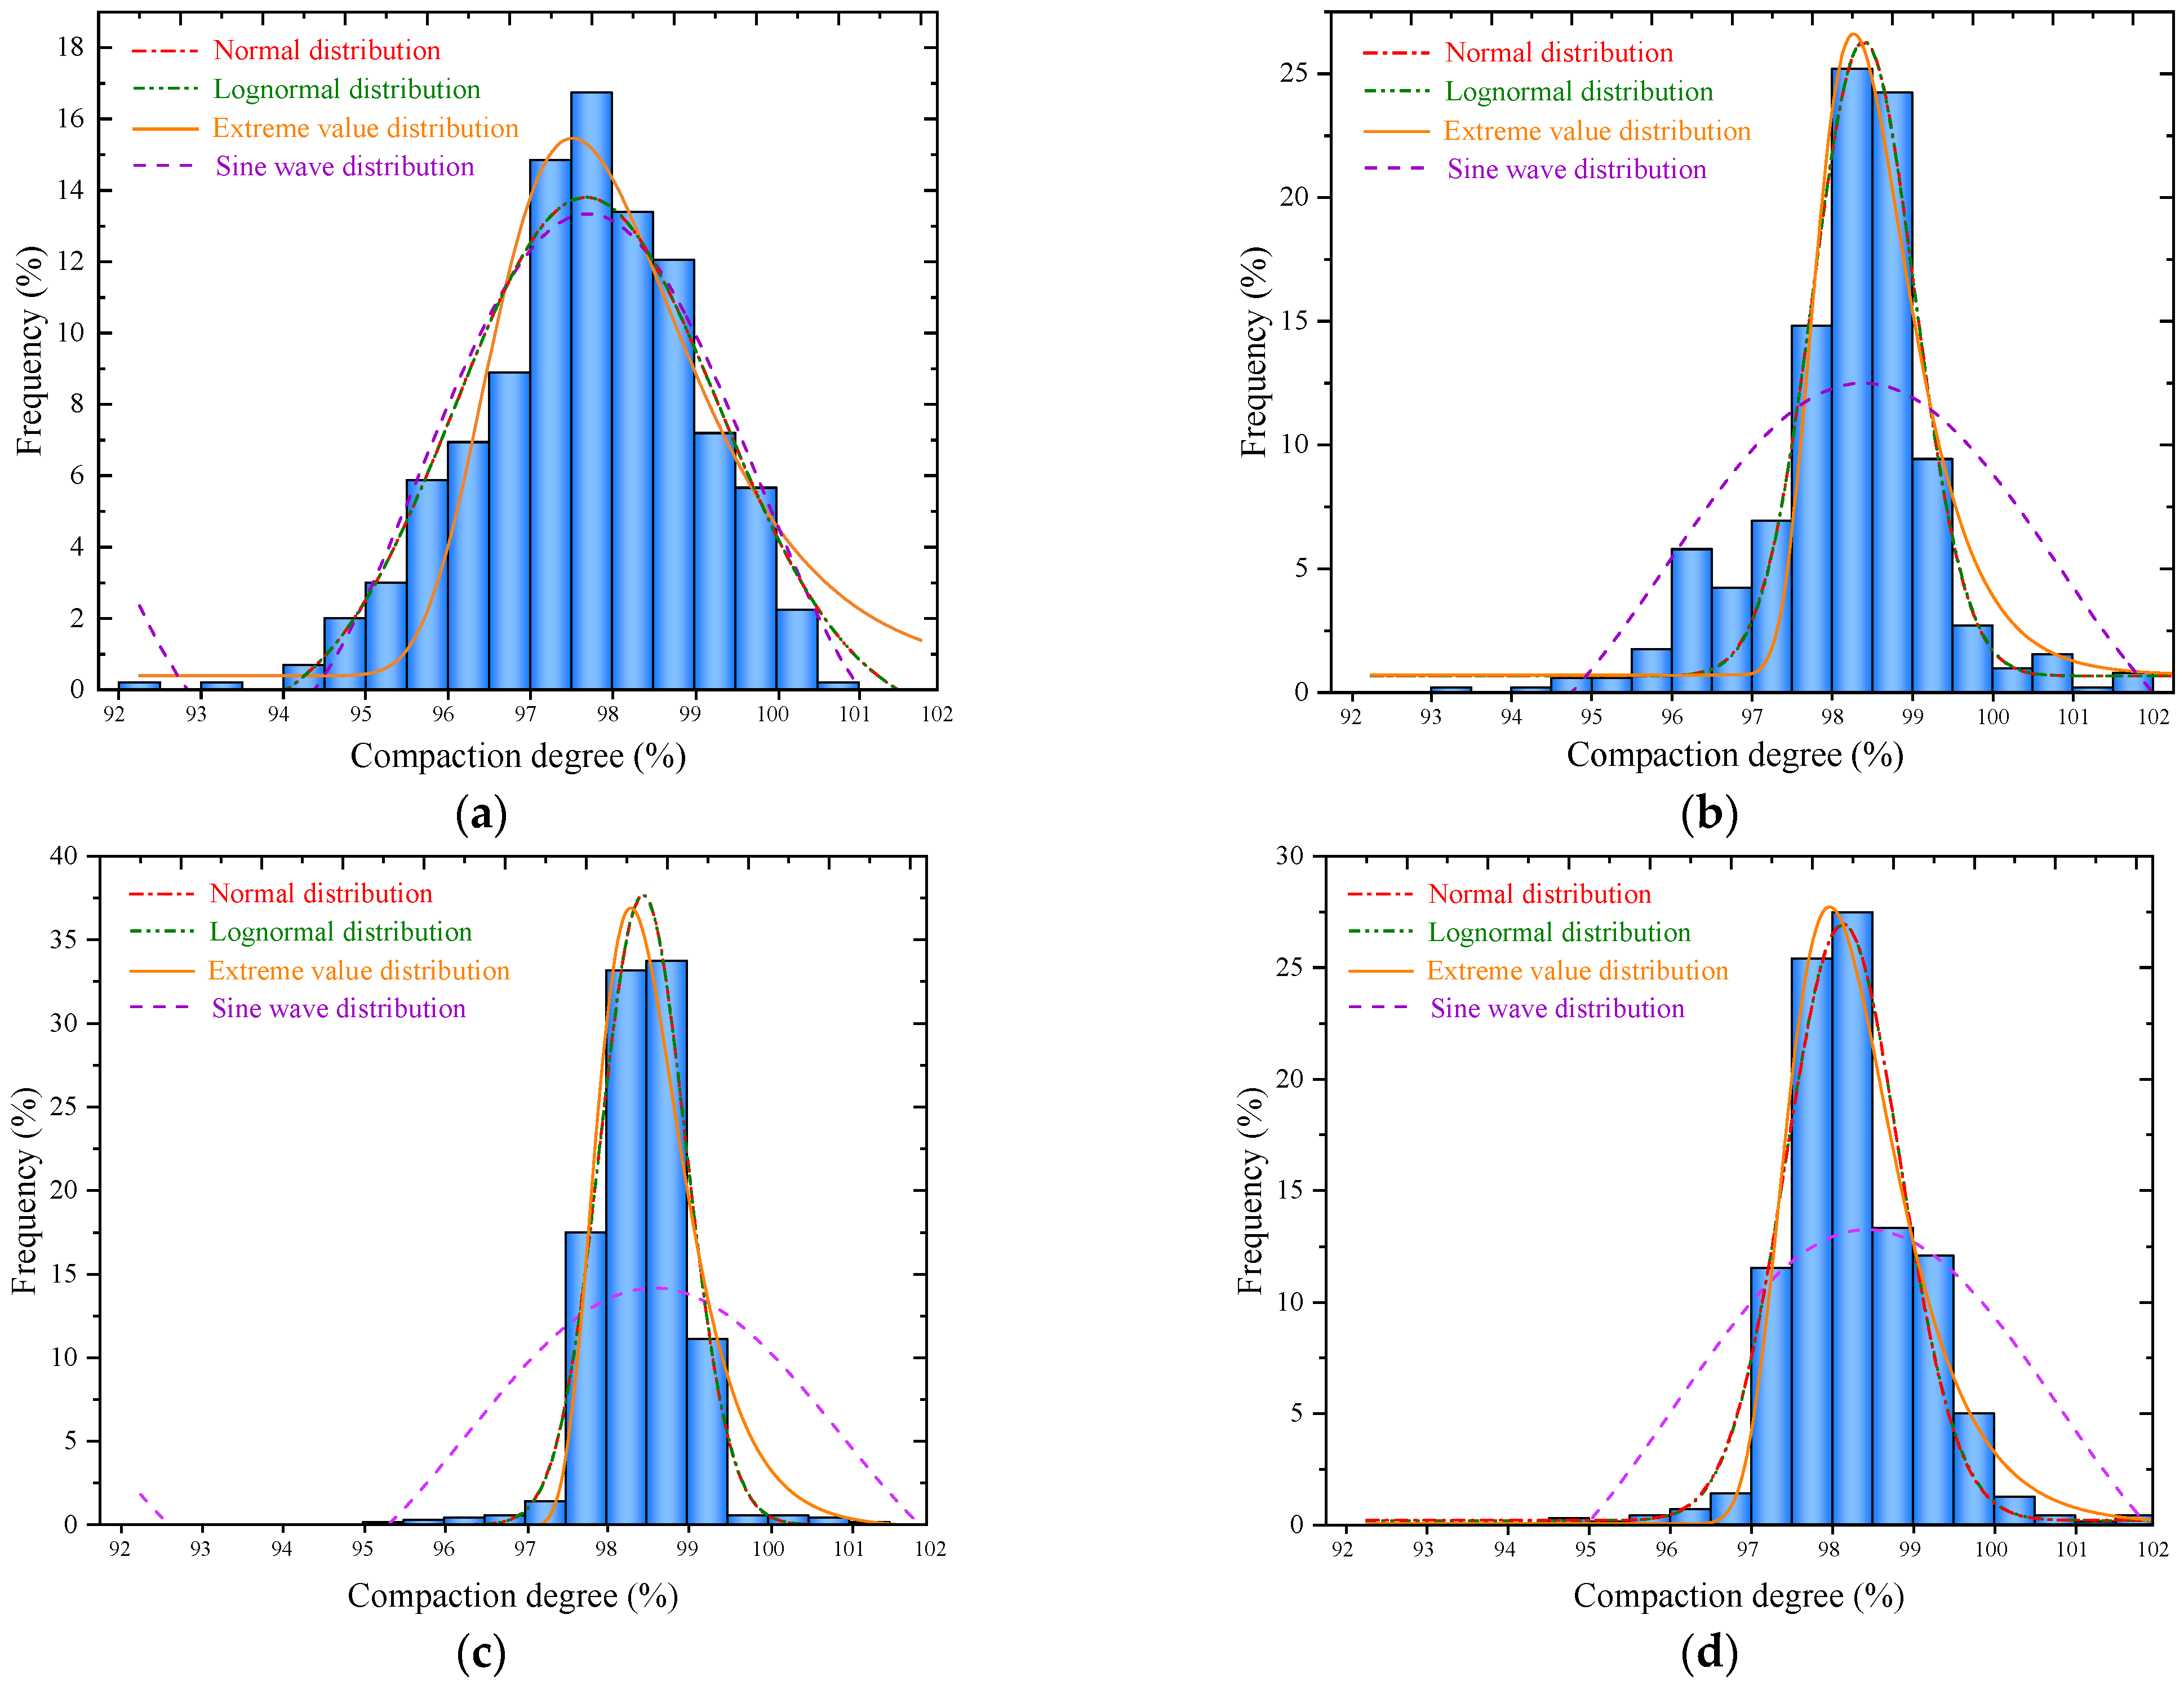
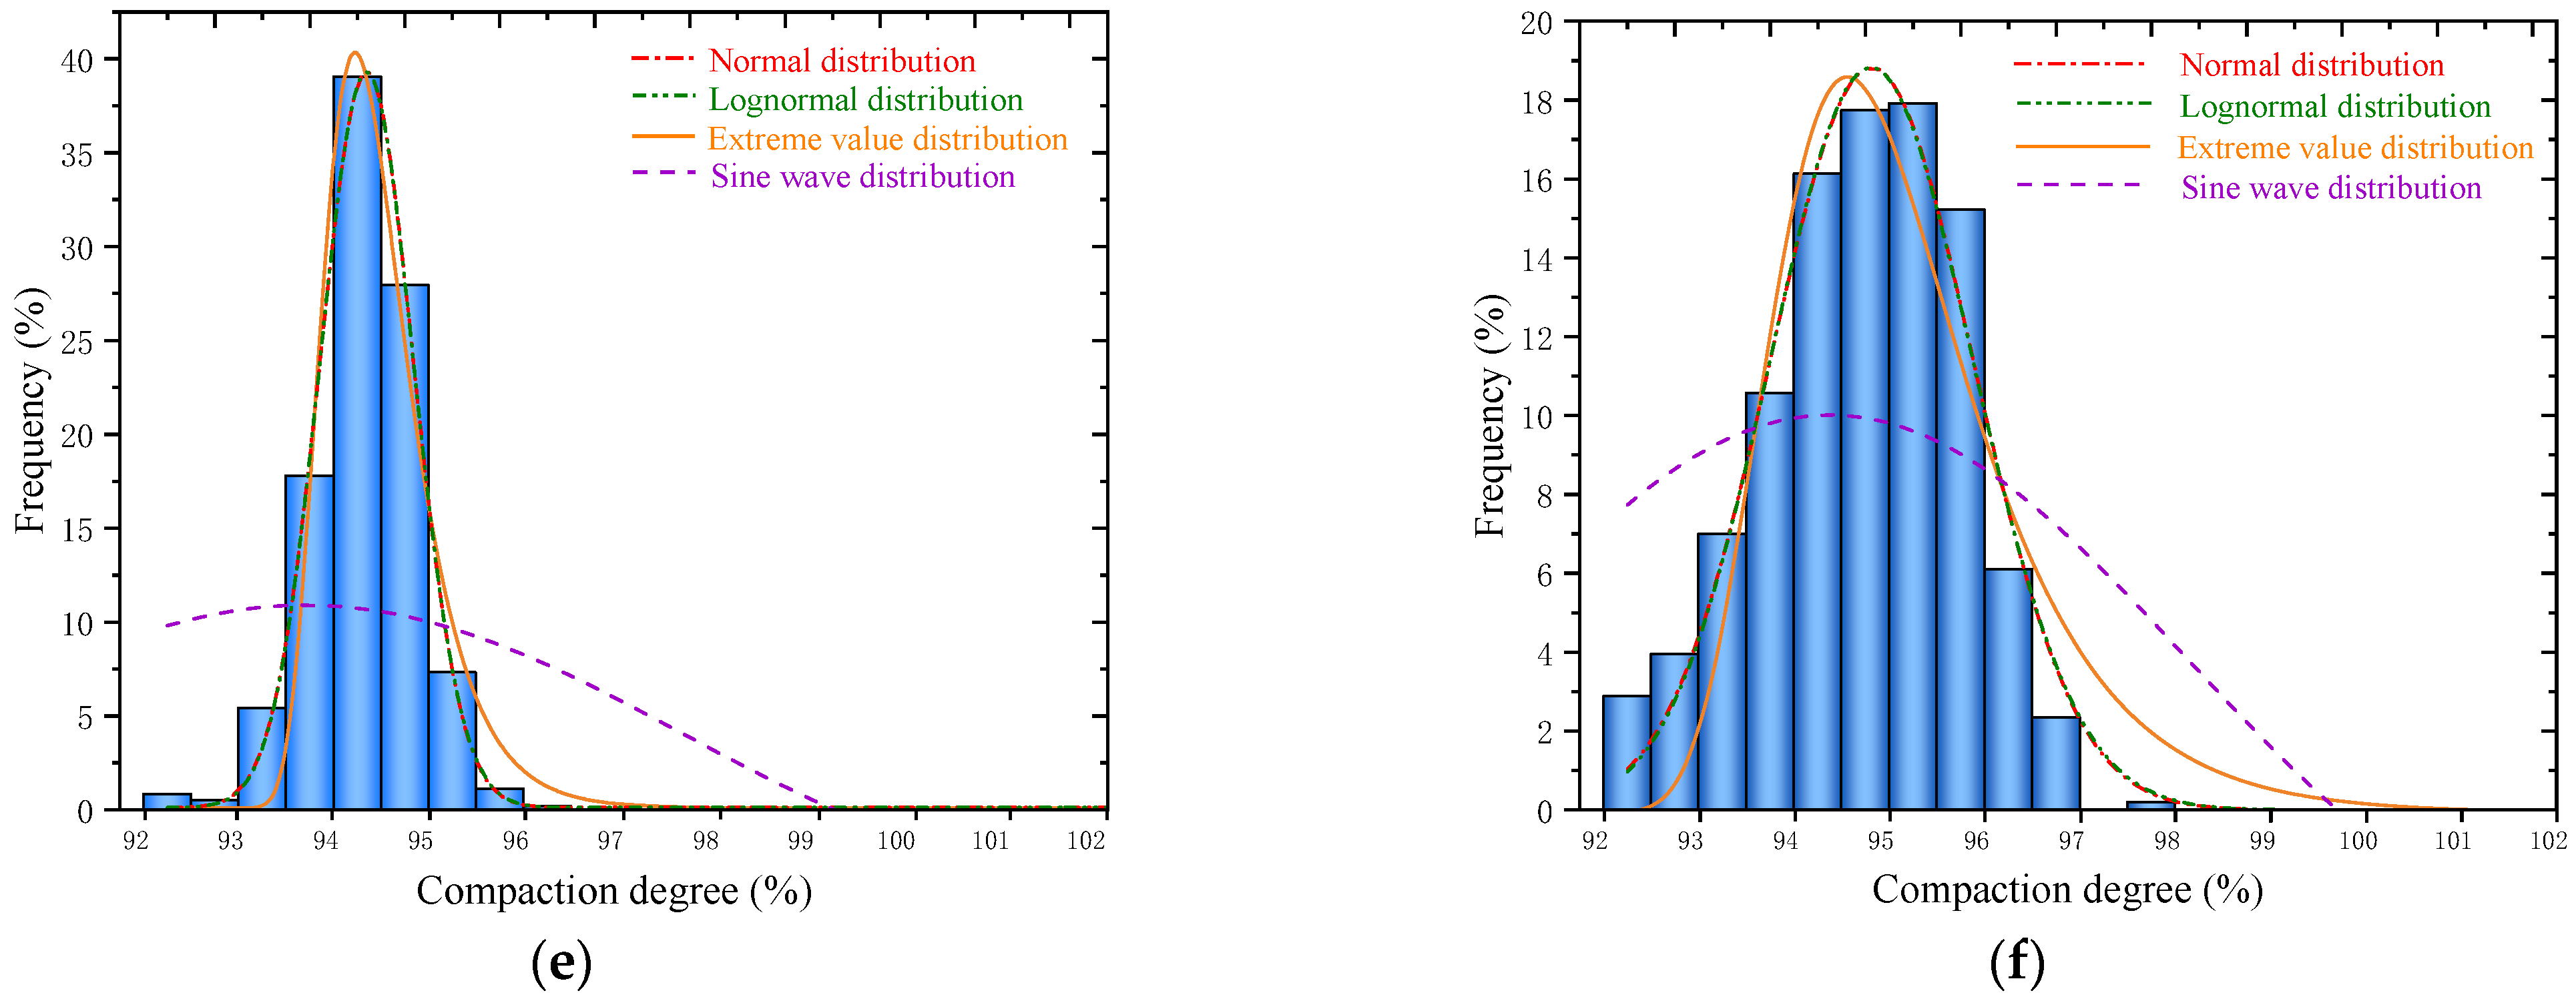
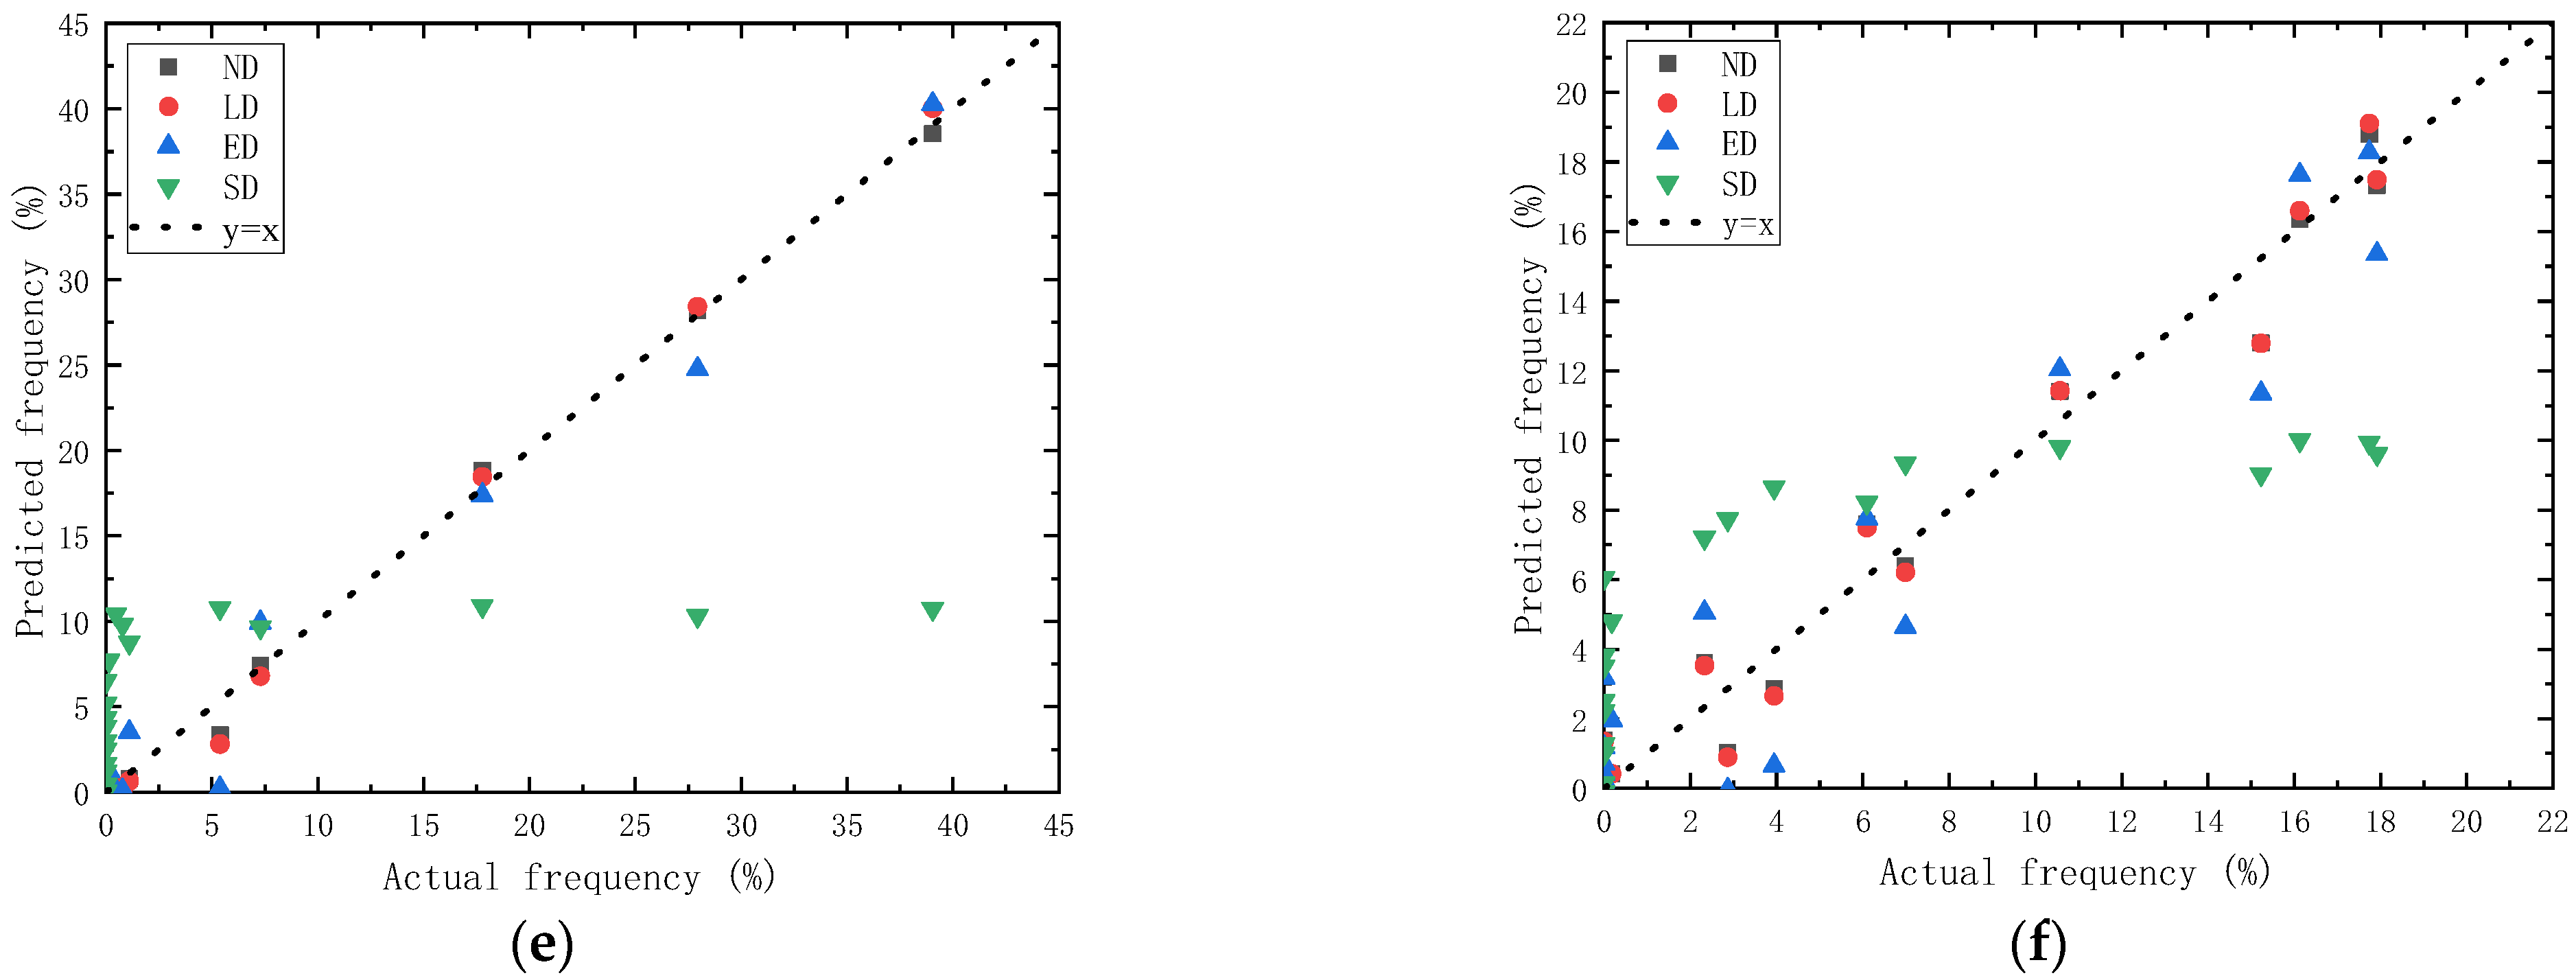
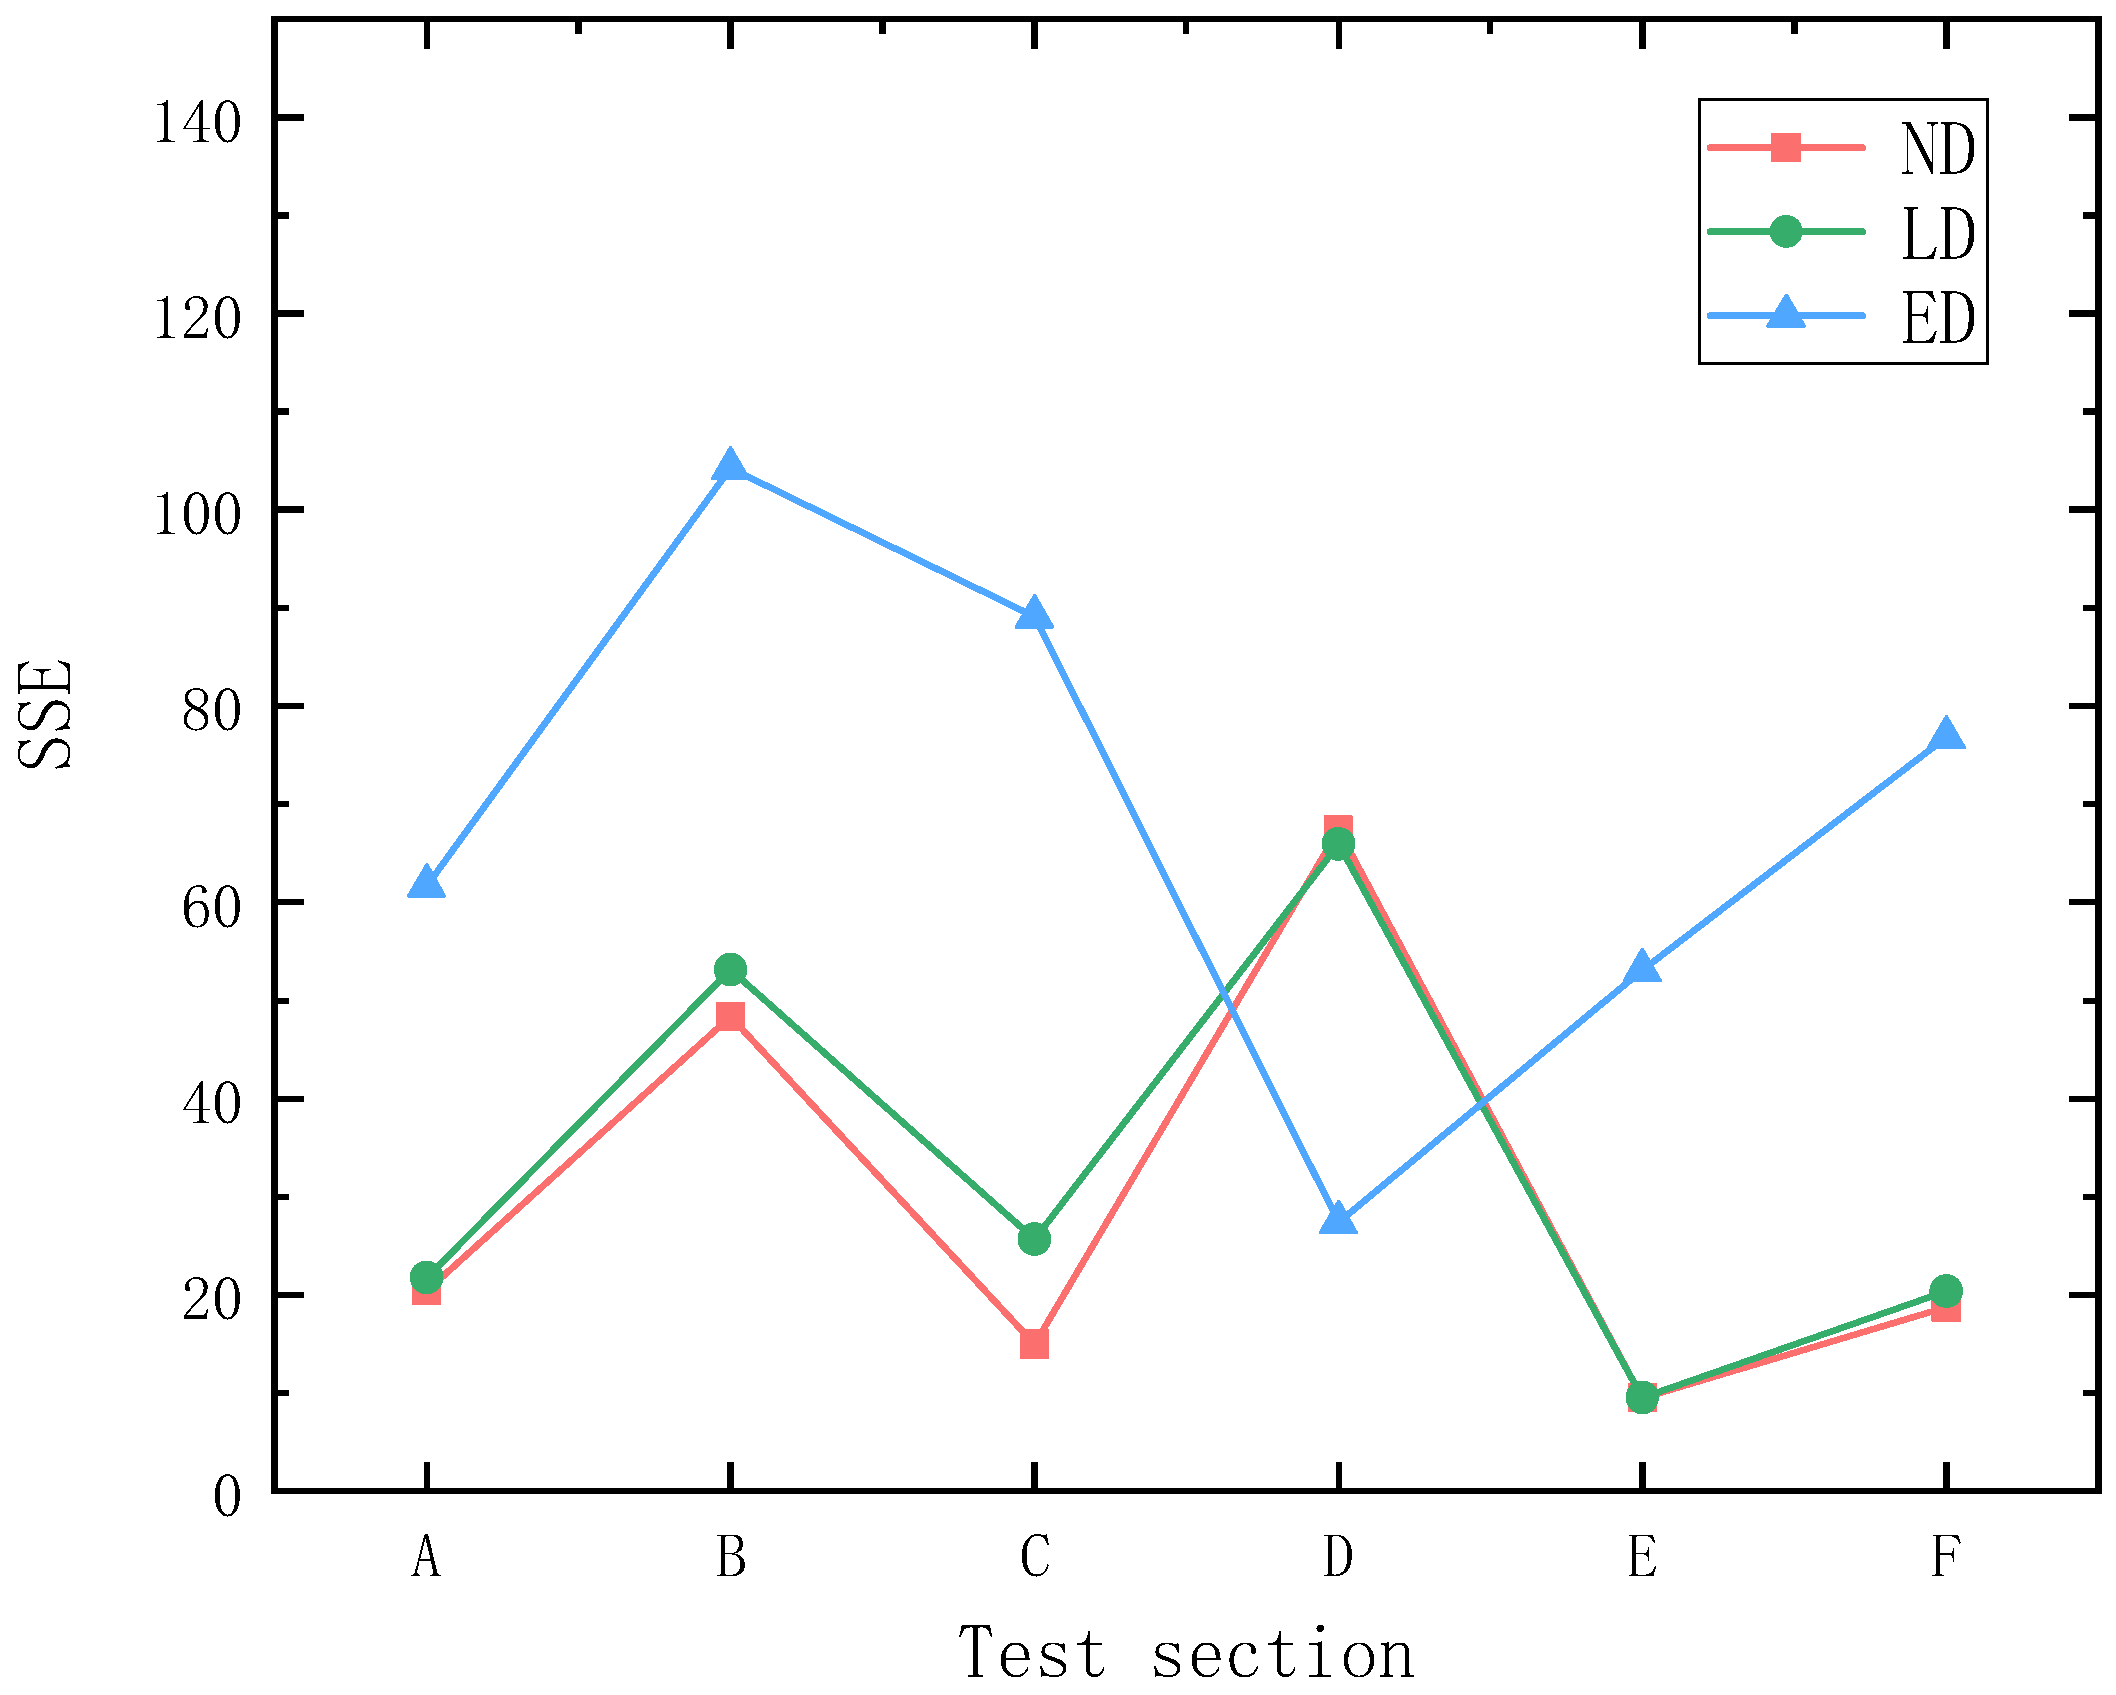
- The ND model, LD model and ED model had relatively high fitting accuracies, and the fitting parameters were in accord with the statistical analysis results of the compaction degree. The SD model was low in fitting accuracy, which made it unsuitable for describing the distribution law of compaction degree.
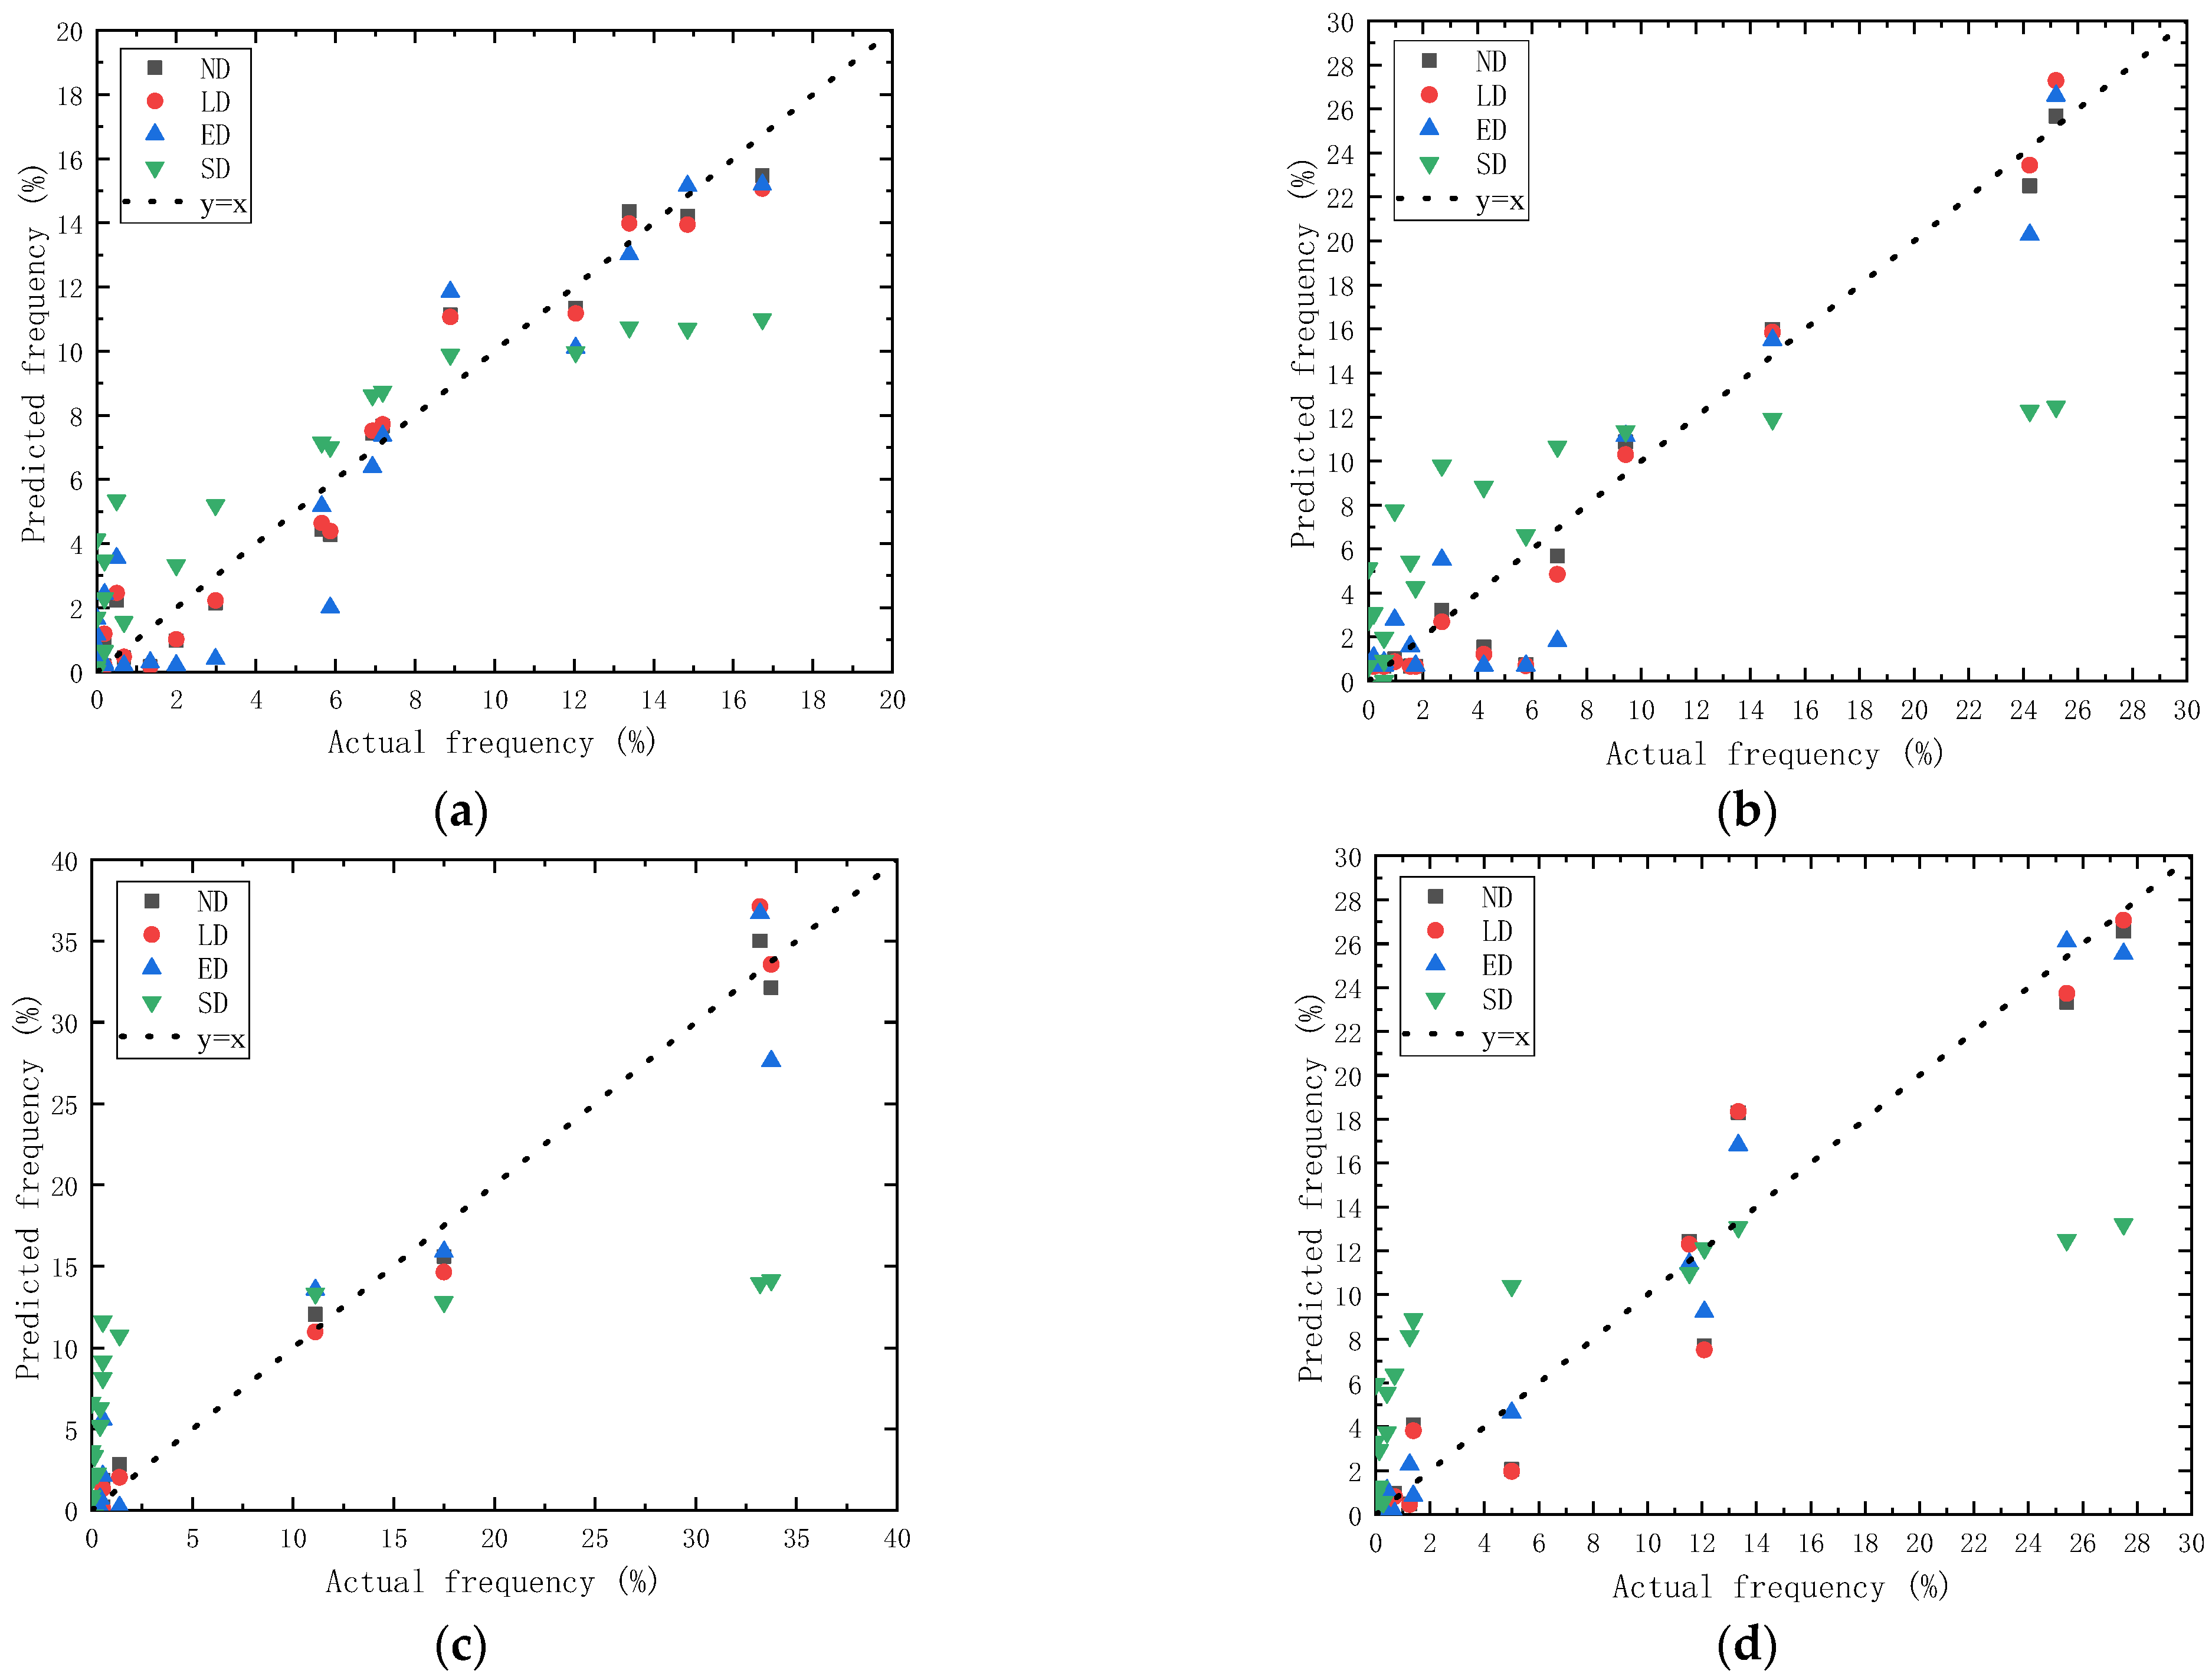
- According to the comparison results of the predicted value with the actual value of compaction degree, the ND model was determined as the most appropriate model for describing the frequency-distribution characteristics of pavement compaction degree.
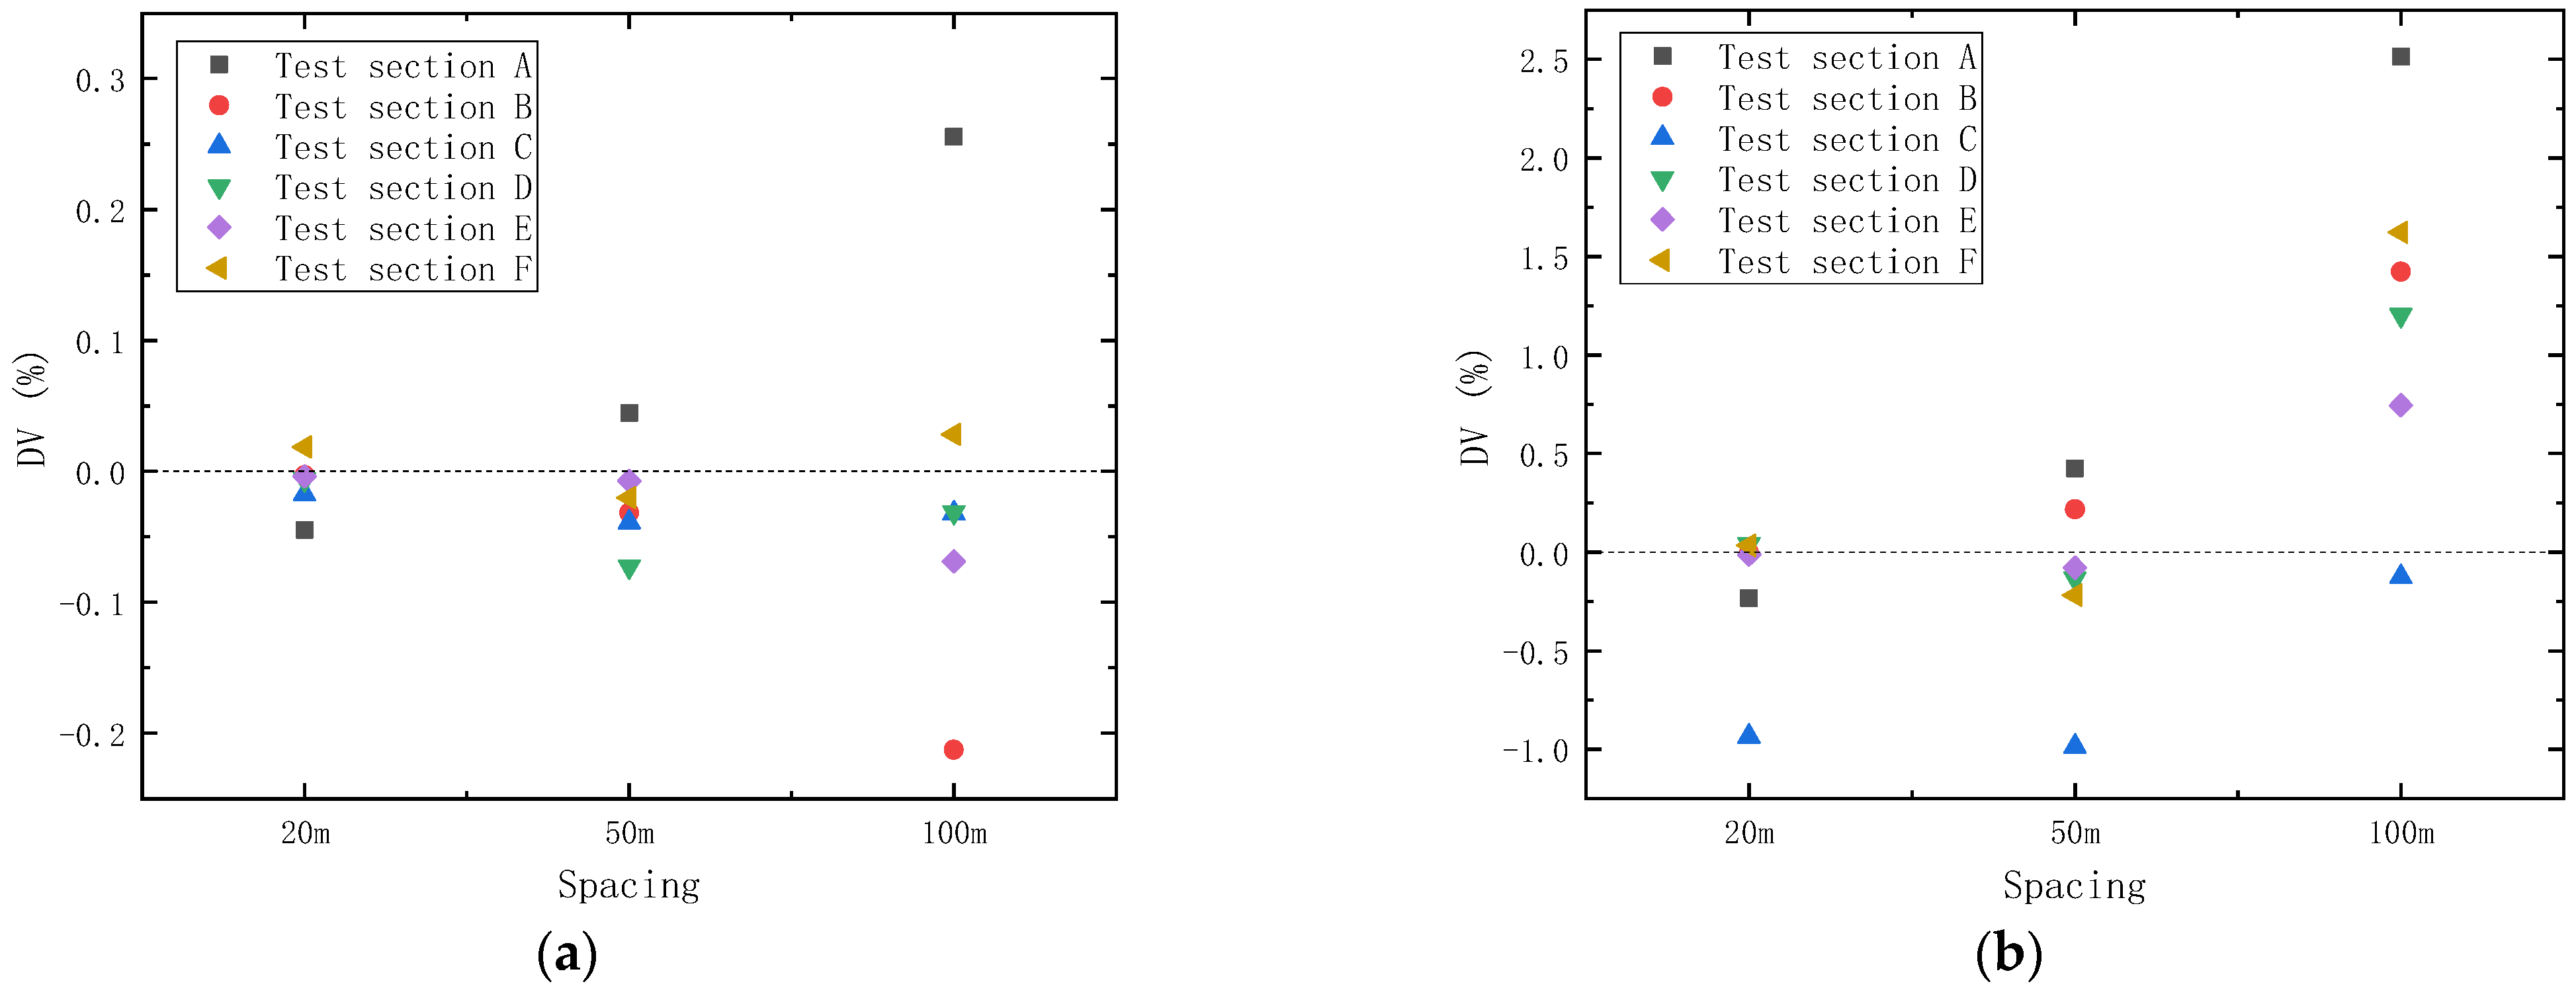
- The range of deviation value expanded rapidly with the increase of detection spacing. Considering both efficiency and accuracy, the optimal detection-spacing was determined as 50 m.
Author Contributions
Funding
Institutional Review Board Statement
Informed Consent Statement
Data Availability Statement
Conflicts of Interest
References
- Wang, F. Research on the Detection Method of Compaction Degree of Asphalt Pavement Construction Site; Southeast University: Dhaka, Bangladesh, 2021. [Google Scholar]
- Ziari, H.; Behbahani, H.; Izadi, A.; Divandary, H. Field Evaluation of Nondestructive Tests in Measuring the Pavement Layers Density. J. Appl. Sci. 2010, 23, 3091–3097. [Google Scholar] [CrossRef] [Green Version]
- Ameri, M.; Kashani Novin, M.; Yousefi, B. Comparison of the Field Measurements of Asphalt Concrete Densities Obtained by Ground-Penetrating Radar, Pavement Quality Indicator and the Borehole Coring Methods. Road Mater. Pavement Des. 2014, 15, 759–773. [Google Scholar] [CrossRef]
- Zaman, S.; Hassaan, M.; Hussain, J.; Hayat, U. Efficacy of Non-Nuclear Methods Used for Hot Mix Asphalt Density Determination. Civ. Eng. J. 2020, 6, 1166–1179. [Google Scholar] [CrossRef]
- Smith, B.C.; Diefenderfer, B.K. Comparison of Nuclear and Nonnuclear Pavement Density Testing Devices. Transp. Res. Rec. 2008, 2081, 121–129. [Google Scholar] [CrossRef]
- Chen, C.; Hu, Y.; Jia, F.; Wang, X. Intelligent Compaction Quality Evaluation Based on Multi-Domain Analysis and Artificial Neural Network. Constr. Build. Mater. 2022, 341, 127583. [Google Scholar] [CrossRef]
- Guo, D.J.; Sun, J.H.; Wang, D.Y.; Han, L.Z.; Xu, J.Q. Application of Pavement Quality Indicator in Compaction Detecting. J. Highw. Transp. Res. Dev. 2007, 24, 50–52. [Google Scholar]
- Wu, Y. Research on Application of Real-Time Compaction Detection Technology. Road Mach. Constr. Mech. 2013, 30, 27–31. [Google Scholar]
- Chen, J.; Wang, J.; Shao, J. Method of Sample Capacity Determination for Compaction Test by Non-Nuclear Density Gauge. Road Mach. Constr. Mech. 2020, 37, 71–74. [Google Scholar]
- Wang, Z. Influencing Factors and Compaction Quality Evaluation of Compaction Test with Pavement Quality Indicator; Harbin Institute of Technology: Harbin, China, 2019. [Google Scholar]
- Zaman, S.; Hussain, J.; Ahmad Zaidi, S.B.; Ejaz, N.; Awan, H.H. Field Assessment of Non-Nuclear Methods Used for Hot Mix Asphalt Density Measurement. Civ. Eng. J. 2019, 5, 1820–1831. [Google Scholar] [CrossRef]
- Zhang, G.D. Study on Method of Using Non-Nuclear Densitometer to Detect Compactness of Dynamic Compaction Foundation. Brick-Tile 2022, 414, 50–51. [Google Scholar] [CrossRef]
- Chen, S.; Zhang, X.; Zou, G.; Chen, J. Application of PQI in Asphalt Pavement Compaction Degree Measurement. Road Mach. Constr. Mech. 2005, 22, 55–57. [Google Scholar]
- Wang, Y.; Sun, X.; Yang, L.; Guan, G. Application of Non-Nuclear Densitometer in Nondestructive Testing of Compactness of Shenshan Expressway Pavement. North. Commun. 2022, 61, 61–64. [Google Scholar]
- Zha, X.D.; Huang, L. Application Research on Rapid Testing and Evaluation of Compaction Quality in Asphalt Pavement with Pavement Quality Indicator (PQI). J. Chang. Univ. Sci. Technol. Sci. 2008, 5, 3–10. [Google Scholar]
- Fu, Y.; Wu, S.; Qiu, J.; Liu, Q.; Tang, N. Application of Non-Nuclear Density Gauge in the Density Measurement of Asphalt Pavement. J. Wuhan Univ. Techonol. 2007, 19, 22–23. [Google Scholar]
- Allen, D.L.; Schultz, D.B.; Willett, D.A. Evaluation of Non-Nuclear Density Gauges; Report No. KTC-03-24/FR115-01-1F ; University of Kentucky: Lexington, KY, USA, 2003. [Google Scholar]
- Popik, M.; Maser, K.; Holzschuher, C. Using High-Speed Ground Penetrating Radar for Evaluation of Asphalt Density Measurements. In Proceedings of the Annual Conference & Exhibition of the Transportation Association of Canada, Halifax, NS, Canada, 26–29 September 2010. [Google Scholar]
- He, Y.; Gao, X.M.; Yang, Y.Q.; Guo, H.J. Research on Nondestructive Testing Technology and Application of Asphalt Pavement Compactness. Constr. Mach. 2021, 542, 39–44. [Google Scholar] [CrossRef]
- Li, C.M.; De, T.; Chen, Z.Y. The Improvement of PQI Density Testing Method of Considering Texture Depth of Asphalt Pavement. Adv. Mater. Res. 2013, 718–720, 1914–1918. [Google Scholar] [CrossRef]
- Kim, Y.-R.; Cho, Y. Non-Nuclear Method for Density Measurements; Nebraska Department of Roads: Lincoln, NE, USA, 2011. [Google Scholar]
- Maharaj, A.; Leyland, R. The Dielectric Constant as a Means of Assessing the Properties of Road Construction Materials. In Proceedings of the 29th Southern African Transport Conference (SATC), Pretoria, South Africa, 16–19 August 2010; Volume 1, pp. 487–498. [Google Scholar]
- Sargand, S.; Kim, S.-S.; Farrington, S.P. A Working Review of Available Non-Nuclear Equipment for Determining in-Place Density of Asphalt; The National Academies of Sciences, Engineering, and Medicine: Washington, DC, USA, 2005. [Google Scholar]
- Li, G.; Huang, S.; Li, W.; Chang, R.; Ma, G.; Wang, C. Influencing Factor Analysis and on-Site Inspection Verificatoni of PQI Detection. Road Mach. Constr. Mech. 2019, 36, 110–116. [Google Scholar]
- Schmitt, R.; Rao, C.; Von Quintus, H.L. Non-Nuclear Density Testing Devices and Systems to Evaluate in-Place Asphalt Pavement Density; The National Academies of Sciences, Engineering, and Medicine: Washington, DC, USA, 2006. [Google Scholar]
- Evans, R.D.; Frost, M.; Stonecliffe-Jones, M.; Dixon, N. Assessment of in Situ Dielectric Constant of Pavement Materials. Transp. Res. Rec. 2007, 2037, 128–135. [Google Scholar] [CrossRef]
- Liu, J.; Lai, X.H. Brief Analysis on Application of Pavement Quality Indicator (PQI) in Uniformity Evaluation of Asphalt Pavement Construction Quality. North. Commun. 2017, 87–90, 94. [Google Scholar]
- Guo, D.D. Application of Pavement Quality Indicator in the Construction Quality Instant Control of Asphalt Pavement. Appl. Mech. Mater. 2013, 333–335, 1691–1694. [Google Scholar] [CrossRef]
- Sebesta, S.; Zeig, M.; Scullion, T. Evaluation of Non-Nuclear Density Gauges for HMAC; Report No. FHWA/TX-04/0-4577-1, Texas Transportation Institute Report; Texas Transportation Institute: Austin, TX, USA, 2003. [Google Scholar]
- Ni, H.; Lin, Q.; Xu, J. Operation Principle of PQI and Factors Affecting Its Density Readings. Road Mach. Constr. Mech. 2011, 28, 32–35. [Google Scholar]
- Kvasnak, A.N.; Williams, R.; Ceylan, H.C.; Gopalakrishnan, K. Investigation of Electromagnetic Gauges for Determining in-Place HMA Density; Iowa State University: Ames, IA, USA, 2007. [Google Scholar]
- Peng, Y.H.; Xi, H.J.; Li, F.F.; Sun, D.W. Application of Pavement Quality Indicator in Asphalt Pavement Density Measuring. Road Mach. Constr. Mech. 2008, 33, 47–50. [Google Scholar]
- Megali, G.; Cacciola, M.; Ammendola, R.; Moro, A.; Praticò, F.G.; Morabito, F.C. Assessing Reliability and Potentiality of Nonnuclear Portable Devices for Asphalt Mixture Density Measurement. J. Mater. Civ. Eng. 2010, 22, 874–886. [Google Scholar] [CrossRef]
- Yang, C. Study on the Non-Destruction Detection Technology in Asphalt Concrete Pavement Based on the Technique of Electromagnetic Waves; Chang’an University: Xi’an, China, 2012. [Google Scholar]
- Plati, C.; Loizos, A.; Gkyrtis, K. Assessment of Modern Roadways Using Non-Destructive Geophysical Surveying Techniques. Surv. Geophys. 2020, 41, 395–430. [Google Scholar] [CrossRef]
- He, J.B.; Zhou, J.C.; Zhou, G.; Yan, S.X. Application of Asphalt Pavement Quality Indicator (PQI) in Controlling Compaction of Asphalt Pavement. Technol. Highw. Transp. 2007, 6477, 50–54. [Google Scholar]
- Wang, Z.; Li, W. Research on the Application of Non-Nuclear Densitometer in the Detection of Asphalt Layer of Airport Runway. J. China Foreign Highw. 2014, 34, 86–90. [Google Scholar] [CrossRef]
- Nie, Z.; Jiao, T.; Wang, X. Study on Probability Distribution Models of Continuous Compaction Indicators. J. Zhengzhou Univ. Sci. 2014, 35, 15–18. [Google Scholar]
- Rao, C.B.; Von Quintus, H.L.; Schmitt, R.L. Calibration of Nonnuclear Density Gauge Data for Accurate in-Place Density Prediction. Transp. Res. Rec. 2007, 2040, 123–136. [Google Scholar] [CrossRef]


| Test Section | Chainage | Layer | Thickness | Asphalt Mixture Type |
|---|---|---|---|---|
| Test section A | K4+957-K6+250 | Upper layer | 40 mm | ARHM-13 |
| Test section B | K4+957-K6+250 | Lower layer | 60 mm | ARHM-20 |
| Test section C | K1+230-K3+020 | Upper layer | 40 mm | ARHM-13 |
| Test section D | K1+230-K3+020 | Lower layer | 60 mm | ARHM-20 |
| Test section E | K39+020-K41+320 | Lower layer | 60 mm | ARHM-20 |
| Test section F | K77+450-K79+750 | Lower layer | 60 mm | ARHM-20 |
| Number of Calibration Point | Density (g/cm3) | Disparity (g/cm3) | Calibration Coefficient d (g/cm3) | |
|---|---|---|---|---|
| Original PQI Data | Core Sample | |||
| 1 | 2.450 | 2.420 | −0.030 | −0.016 |
| 2 | 2.424 | 2.414 | −0.010 | |
| 3 | 2.388 | 2.402 | 0.014 | |
| 4 | 2.392 | 2.399 | 0.007 | |
| 5 | 2.351 | 2.401 | 0.050 | |
| 6 | 2.340 | 2.399 | 0.059 | |
| 7 | 2.401 | 2.103 | −0.298 | |
| 8 | 2.362 | 2.386 | 0.024 | |
| 9 | 2.459 | 2.461 | 0.002 | |
| 10 | 2.431 | 2.446 | 0.015 | |
| 11 | 2.386 | 2.375 | −0.011 | |
| 12 | 2.450 | 2.438 | −0.012 | |
| 13 | 2.409 | 2.385 | −0.024 | |
| Number of Testing Point | Standard Density (g/cm3) | PQI | Core Sample | Error Rate (%) | ||
|---|---|---|---|---|---|---|
| Density (g/cm3) | Compaction Degree (%) | Density (g/cm3) | Compaction Degree (%) | |||
| a | 2.512 | 2.467 | 98.2 | 2.452 | 97.6 | 0.61 |
| b | 2.445 | 97.3 | 2.426 | 96.6 | 0.78 | |
| c | 2.416 | 96.2 | 2.435 | 96.9 | −0.78 | |
| d | 2.401 | 95.6 | 2.408 | 95.9 | −0.29 | |
| e | 2.450 | 97.5 | 2.448 | 97.4 | 0.08 | |
| f | 2.441 | 97.2 | 2.445 | 97.3 | −0.16 | |
| g | 2.429 | 96.7 | 2.415 | 96.1 | 0.58 | |
| h | 2.456 | 97.8 | 2.463 | 98.0 | −0.28 | |
| Test Section | Number of Measuring Point | Total | ||||||
|---|---|---|---|---|---|---|---|---|
| 1 | 2 | 3 | 4 | 5 | 6 | |||
| A | Min (%) | 95.2 | 93.2 | 92.4 | 95.1 | / | / | 92.4 |
| Max (%) | 104.3 | 104.4 | 105.2 | 104.8 | / | / | 105.2 | |
| Aver (%) | 97.2 | 97.3 | 97.2 | 97.2 | / | / | 97.2 | |
| MSD (%) | 1.39 | 1.72 | 1.54 | 1.42 | / | / | 1.52 | |
| VC (%) | 1.43 | 1.76 | 1.59 | 1.46 | / | / | 1.56 | |
| B | Min (%) | 94.7 | 96.3 | 94.9 | 93.5 | / | / | 93.5 |
| Max (%) | 101.6 | 102.3 | 101.8 | 101.8 | / | / | 102.3 | |
| Aver (%) | 98.4 | 98.5 | 98.0 | 98.1 | / | / | 98.2 | |
| MSD (%) | 1.08 | 0.96 | 1.08 | 1.20 | / | / | 1.10 | |
| VC (%) | 1.09 | 0.98 | 1.10 | 1.22 | / | / | 1.12 | |
| C | Min (%) | 95.1 | 97.0 | 95.7 | 96.2 | / | / | 95.1 |
| Max (%) | 101.5 | 100.9 | 99.5 | 100.7 | / | / | 101.5 | |
| Aver (%) | 98.3 | 98.6 | 98.4 | 98.5 | / | / | 98.5 | |
| MSD (%) | 0.66 | 0.48 | 0.55 | 0.55 | / | / | 0.43 | |
| VC (%) | 0.67 | 0.49 | 0.56 | 0.56 | / | / | 0.43 | |
| D | Min (%) | 94.7 | 95.8 | 95.3 | 94.9 | / | / | 94.7 |
| Max (%) | 100.1 | 102.3 | 101.8 | 101.1 | / | / | 102.3 | |
| Aver (%) | 98.4 | 98.4 | 98.3 | 98.3 | / | / | 98.3 | |
| MSD (%) | 0.81 | 0.82 | 0.88 | 0.4 | / | / | 0.71 | |
| VC (%) | 0.83 | 0.84 | 0.89 | 0.85 | / | / | 0.72 | |
| E | Min (%) | 92.2 | 92.3 | 91.7 | 93.3 | 93.1 | 93.2 | 91.7 |
| Max (%) | 95.0 | 95.4 | 96.2 | 95.7 | 95.6 | 95.1 | 96.2 | |
| Aver (%) | 94.06 | 94.31 | 94.58 | 94.61 | 94.38 | 94.26 | 94.4 | |
| MSD (%) | 0.47 | 0.57 | 0.62 | 0.48 | 0.45 | 0.42 | 0.54 | |
| VC (%) | 0.50 | 0.61 | 0.65 | 0.51 | 0.48 | 0.45 | 0.57 | |
| F | Min (%) | 91.2 | 92.8 | 93.3 | 92.1 | 92.3 | 91.9 | 91.2 |
| Max (%) | 97.9 | 97.0 | 97.0 | 97.0 | 97.0 | 96.0 | 97.9 | |
| Aver (%) | 94.0 | 95.1 | 95.2 | 95.2 | 95.0 | 93.9 | 94.7 | |
| MSD (%) | 1.04 | 0.89 | 0.81 | 0.96 | 0.77 | 0.88 | 1.05 | |
| VC (%) | 1.11 | 0.94 | 0.85 | 1.01 | 0.81 | 0.94 | 1.11 | |
| Test Section | Model | Fitting Parameters | R2 | |||
|---|---|---|---|---|---|---|
| y0 | ||||||
| A | ND | 0.138 | 15.194 | 98.030 | 1.277 | 0.969 |
| LD | 0.154 | 48.491 | 98.035 | 0.013 | 0.968 | |
| ED | 0.393 | 15.066 | 97.763 | 1.147 | 0.897 | |
| SD | 6.053 | 7.287 | 22.213 | 4.094 | 0.908 | |
| B | ND | 0.667 | 25.645 | 98.642 | 0.632 | 0.958 |
| LD | 0.671 | 40.608 | 98.644 | 0.006 | 0.957 | |
| ED | 0.704 | 25.908 | 98.513 | 0.570 | 0.919 | |
| SD | 5.065 | 7.437 | 27.443 | 4.909 | 0.521 | |
| C | ND | 0.009 | 37.672 | 98.702 | 0.528 | 0.993 |
| LD | 0.008 | 49.883 | 98.703 | 0.005 | 0.993 | |
| ED | −0.151 | 37.050 | 98.551 | 0.517 | 0.962 | |
| SD | 5.363 | 8.819 | 31.708 | 4.630 | 0.428 | |
| D | ND | 0.208 | 26.744 | 98.379 | 0.702 | 0.951 |
| LD | 0.204 | 47.140 | 98.380 | 0.007 | 0.952 | |
| ED | 0.058 | 27.672 | 98.215 | 0.654 | 0.982 | |
| SD | 5.199 | 8.065 | 29.203 | 4.791 | 0.558 | |
| E | ND | 0.122 | 39.175 | 94.598 | 0.492 | 0.997 |
| LD | 0.123 | 48.278 | 94.598 | 0.005 | 0.997 | |
| ED | 0.098 | 40.235 | 94.475 | 0.444 | 0.974 | |
| SD | 4.030 | 6.870 | −5.564 | 7.961 | 0.209 | |
| F | ND | 0.000 | 18.825 | 95.065 | 1.064 | 0.979 |
| LD | 0.001 | 50.148 | 95.068 | 0.011 | 0.977 | |
| ED | −0.070 | 18.654 | 94.809 | 1.005 | 0.913 | |
| SD | 3.745 | 6.272 | 0.011 | 7.569 | 0.532 | |
Publisher’s Note: MDPI stays neutral with regard to jurisdictional claims in published maps and institutional affiliations. |
© 2022 by the authors. Licensee MDPI, Basel, Switzerland. This article is an open access article distributed under the terms and conditions of the Creative Commons Attribution (CC BY) license (https://creativecommons.org/licenses/by/4.0/).
Share and Cite
Li, Y.; Zhang, H.; Peng, Y.; Li, Y.; Wang, K. Research on Distribution Model and Detection Spacing of Compaction Degree of Asphalt Pavement Based on the PQI Method. Coatings 2022, 12, 1751. https://doi.org/10.3390/coatings12111751
Li Y, Zhang H, Peng Y, Li Y, Wang K. Research on Distribution Model and Detection Spacing of Compaction Degree of Asphalt Pavement Based on the PQI Method. Coatings. 2022; 12(11):1751. https://doi.org/10.3390/coatings12111751
Chicago/Turabian StyleLi, Yanli, Haiwei Zhang, Yatao Peng, Yan Li, and Ke Wang. 2022. "Research on Distribution Model and Detection Spacing of Compaction Degree of Asphalt Pavement Based on the PQI Method" Coatings 12, no. 11: 1751. https://doi.org/10.3390/coatings12111751