Article

Chromium Luminescence in Plasma Electrolytic Oxidation Coatings on Aluminum Surface

1
Laboratory of Optical Materials, Institute of Solid State Physics, University of Latvia, Kengaraga Street 8, LV-1063 Riga, Latvia
2
Laboratory of Radiation Chemistry of Solids, Institute of Chemical Physics, University of Latvia, 1 Jelgavas Street, LV-1004 Riga, Latvia
*
Author to whom correspondence should be addressed.
Coatings 2022, 12(11), 1733; https://doi.org/10.3390/coatings12111733
Submission received: 19 October 2022 / Revised: 4 November 2022 / Accepted: 8 November 2022 / Published: 13 November 2022
(This article belongs to the Special Issue Plasma Electrolytic Oxidation (PEO) Coatings, 2nd Edition)

Abstract

:
With plasma electrolytic oxidation (PEO), one can easily obtain thick (tens of microns), mechanically resilient and chemically stable oxide coating on aluminum and other valve metal alloys. The study of luminescent PEO coatings is a relatively new subfield of the already well-established coating preparation methods. In recent years, many new luminescence-based approaches have been developed, one of which is the detection of ionizing radiation of carbon-doped PEO alumina coating. This study presents an improved approach by doping the alumina coating with chromium using citric acid as an additive in the electrolyte. Trivalent chromium ions replacing aluminum in the crystalline lattice of the coating exhibit characteristic sharp lines in the luminescence spectrum. The effectiveness of different DC voltages, process times and citric acid concentrations in electrolyte were examined. The use of citric acid in the electrolyte also provides the conditions required for the formation of an energy trap in the bandgap of the material, thus opening up the possibility for the coating to be used as an ionizing radiation detector by measuring its thermoluminescence. Chromium atoms are incorporated in the coating from the Al6082 aluminum alloy itself and are not added in the electrolyte, therefore making the process much more reliable, repeatable, and environmentally friendly.

1. Introduction

Electrochemical oxidation of materials has been extensively studied and applied for decades, with many established technologies like anodization and plasma electrolytic oxidation (PEO). PEO has been under extensive research for over 40 years [1,2,3] and is of particular interest for applications that require a thick [4], hard [5], thermally [6] and chemically resilient [7] coating. PEO uses large voltages and high current densities to produce plasma discharges through the oxide layer, thus enabling synthesis of the hardest and most stable phases, e.g., an alpha phase of alumina [8]. Due to its crystalline structure and chemical composition, this material is chemically inert with outstanding thermal stability and hardness. It is mainly exploited as a ceramic and is widely used for industrial purposes where a hard, mechanical shock-resistant, chemically inert, or biocompatible material is required [9,10,11].
In recent years, the PEO research branched out to studies on optical properties of coatings with subsequent application in combining functional properties (e.g., gas sensitivity [12] or ionizing radiation detection [13]) with established strengths of the PEO. Usually, a pure oxide coating is not luminescent by itself, so various approaches were developed to implement impurities (dopants) into the coating. Fortunately, the PEO process requires precise control of many variables (voltage, voltage profile, current density, electrolyte content, substrate itself) and therefore presents many possibilities for incorporation of dopants (e.g., rare earths [14]). While doping from the suspension electrolyte is the easiest [15,16,17], the first one discovered was the addition of desired dopant in the substrate (aluminum alloy) itself [18]. Aluminum alloys are used in most practical applications, as the substrate already contains some concentrations of various alloying elements, of which Si, Mg, and Mn are the most abundant. These elements will introduce impurities in the crystalline structure of the coating and need to be studied.
Previous research [19,20,21,22] suggests that chromium creates deep charge carrier traps, making it suitable for detection of high dose ionizing radiation used in applications like the calibrators of equipment for radiation sterilization of plant seeds, border control vehicle scanners, power plant energy generators, and other high dose applications. This research will focus on forming α-Al2O3 and γ-Al2O3 crystalline phases on aluminum samples using the PEO process, specifically exploring impurities introduced by a common additive in most alloys—chromium. Chromium as a synthetic alumina activator is widely explored in material science, is isovalent to alumina, and does not create any meaningful point defects. α-Al2O3 and γ-Al2O3 are the most common crystalline phases of aluminum, however the alpha phase is found to possess higher hardness, resistance to wear, and thermal stability [23,24]. This paper will explore the possibilities of obtaining hard α-Al2O3 with intense chromium luminescence in PEO coatings by using the chromium impurities naturally present in the substrate material as luminescence centers. It is important to explore the coating process of the highly luminescent aluminum coating to a point where it can be easily, repeatably mass-produced for ionizing radiation detector usage. Cr-doped alumina has previously been reported [19], however the novelty of this research lies in the optimization of the method of coating as, to our knowledge, the usage of impurities naturally occurring in substrate material to create chromium-doped alumina for dosimetric applications has not yet been explored.

2. Materials and Methods

2.1. Samples

The substrate material (Al6082) is from the wrought aluminum–magnesium–silicon family. Although the purity is better than 95.2%, the alloy still contains traces of Cr, Cu, Fe, Mg, Mn, Si, Ti, Zn, and other metals with a concentration of chromium up to 0.25% and 0.7% of other metals. In addition, one sample using high purity (99.999%) Al was prepared. In this study, a 0.5 mm thick aluminum sheet was cut into samples 6.5 × 25 × 0.5 mm3 in size, each having a total surface area of approximately 3.5 cm2 (used in calculations of current density, a bit less than geometric value due to the non-constant waterline). Before the PEO process, samples were cleaned in ultrasonic cleaner (ASonic (Singapore), PRO30, 40 kHz) in deionized water with soap, then rinsed in acetone.

2.2. PEO Setup

Custom 5 kW bipolar pulse electric generator ELGOO PEO V3 (Riga, Latvia) was used. The device is externally controlled via PC, which allows great repeatability and high customization of parameters like pulse timing, voltage, current, and their changes in time.
The electrolyte for “doped” samples consisted of three components: 800 mL deionized water, 1 g·L−1 KOH (Emplura >84% pellets) and citric acid (Sigma Aldrich (St. Louis, MO, USA), 99.5–100.5% based on anhydrous substance) with varying concentration (2/5/10/15/30 g·L−1), as well as a sample without the addition of citric acid was prepared. The electrolyte was contained in a double-walled water-cooled reaction chamber, and thus a stable 30 ± 5 °C temperature was maintained. However, evaporation of the electrolyte was still present. To compensate, a constant influx of deionized water was supplied to the reactor keeping the water level constant.
According to the tested parameters, DC constant voltages were chosen (450/550/650/700/750 V) and kept constant throughout the whole process. The total process time (15/30/45/60 min) also varied between processes. Throughout the process, current density dropped, starting at approximately 178 mA·cm−2 in the first half of the process and declined in the second half for about 30%. The current density for the sample without citric acid in the electrolyte was approximately 25 mA·cm−2 larger throughout the whole synthesis. However, the current profile throughout the synthesis is highly dependent on the citric acid concentration, as electric characteristics of the electrolyte are different. Pt plate was used as a counter electrode.
Three PEO process parameters—DC voltage, PEO process time, and concentration of citric acid in the electrolyte—were consecutively varied and tested on different samples. The samples produced with a citric acid concentration of 15 and 30 g·L−1 were heavily corroded during PEO and thus were not included in further measurements. From each series of tests, the sample with the highest luminescence intensity measurement in TSL was chosen to represent the optimal value of each tested parameter. Thus, the sample with DC voltage, process time, and citric acid concentration values of 700 V, 45 min, and 10 g·L−1 was found to produce the highest TSL intensity around the 692.9 and 694.3 nm [25] luminescence lines of Cr3+.
Lastly, the high purity Al sample was exposed to PEO process with 700 V DC voltage, 45 min process time, and no citric acid added in electrolyte for reference on the effect of Cr presence in Al alloy.

2.3. Measurements

The X-ray diffraction (XRD) spectrometer Rigaku MiniFlex 600 (Rigaku, Tokyo, Japan) was used to determine the crystalline structures. The crystalline phases of the PEO coating were characterized by X-ray powder diffraction using a cathode voltage of 700 V with Cu Kα radiation (1.5418 Å). The scan rate was 1.5 °/min.
The photoluminescence (PL) and X-ray induced luminescence (XRL) measurements were performed at room temperature with the Andor DU-401A-BV IDus CCD camera (Andor Technology Ltd., Belfast, United Kingdom) coupled with the Andor Shamrock B-303i spectrograph. (Andor Technology Ltd., Belfast, United Kingdom) Slit size was 100 µm. The excitation source for PL measurements was CryLaS Nd:YAG laser (CryLaS, Berlin, Germany, 266 nm) and the excitation source for XRL measurements was X-ray tube with W anode operating at 30 kV, 10 mA.
Thermally stimulated luminescence (TSL) measurements were conducted using Lexsygresearch LMS (Freiberg Instruments, Freiberg, Germany) with X-ray and beta sources, however only X-ray irradiation was used. The X-ray source was set to 40 kV and 0.5 mA and the tube consisted of a tungsten target, beryllium window, and was powered by Spellman MNX50P50/XCC (Spellman, Hauppauge, NY, USA) power supply. As multiple samples with slightly varying masses and surface area were prepared, calibration measurements were performed. Between measurements, samples were preheated to remove any previously accumulated dose, irradiated for 600 s (with 33 Gy), and repeatedly measured. The highest registered intensity was taken as a baseline and an equalization coefficient was calculated for other samples, which was applied to avoid invalidation based on inconsistency of surface area.
Spectra measured with CCD in PL, XRL, and TSL were not corrected to accommodate differences in detection at different wavelengths because they were used comparatively only.
Scanning electron microscope (SEM) measurements were made on Phenom Pro scanning electron microscope (Phenom-World, Eindhoven, Netherlands, using 10 kV accelerating voltage.
X-ray fluorescence (XRF) was measured using RIGAKU miniflex 600 X-ray diffractometer (Rigaku, Tokyo, Japan) at 50 kV voltage and 50 μA current.

3. Results

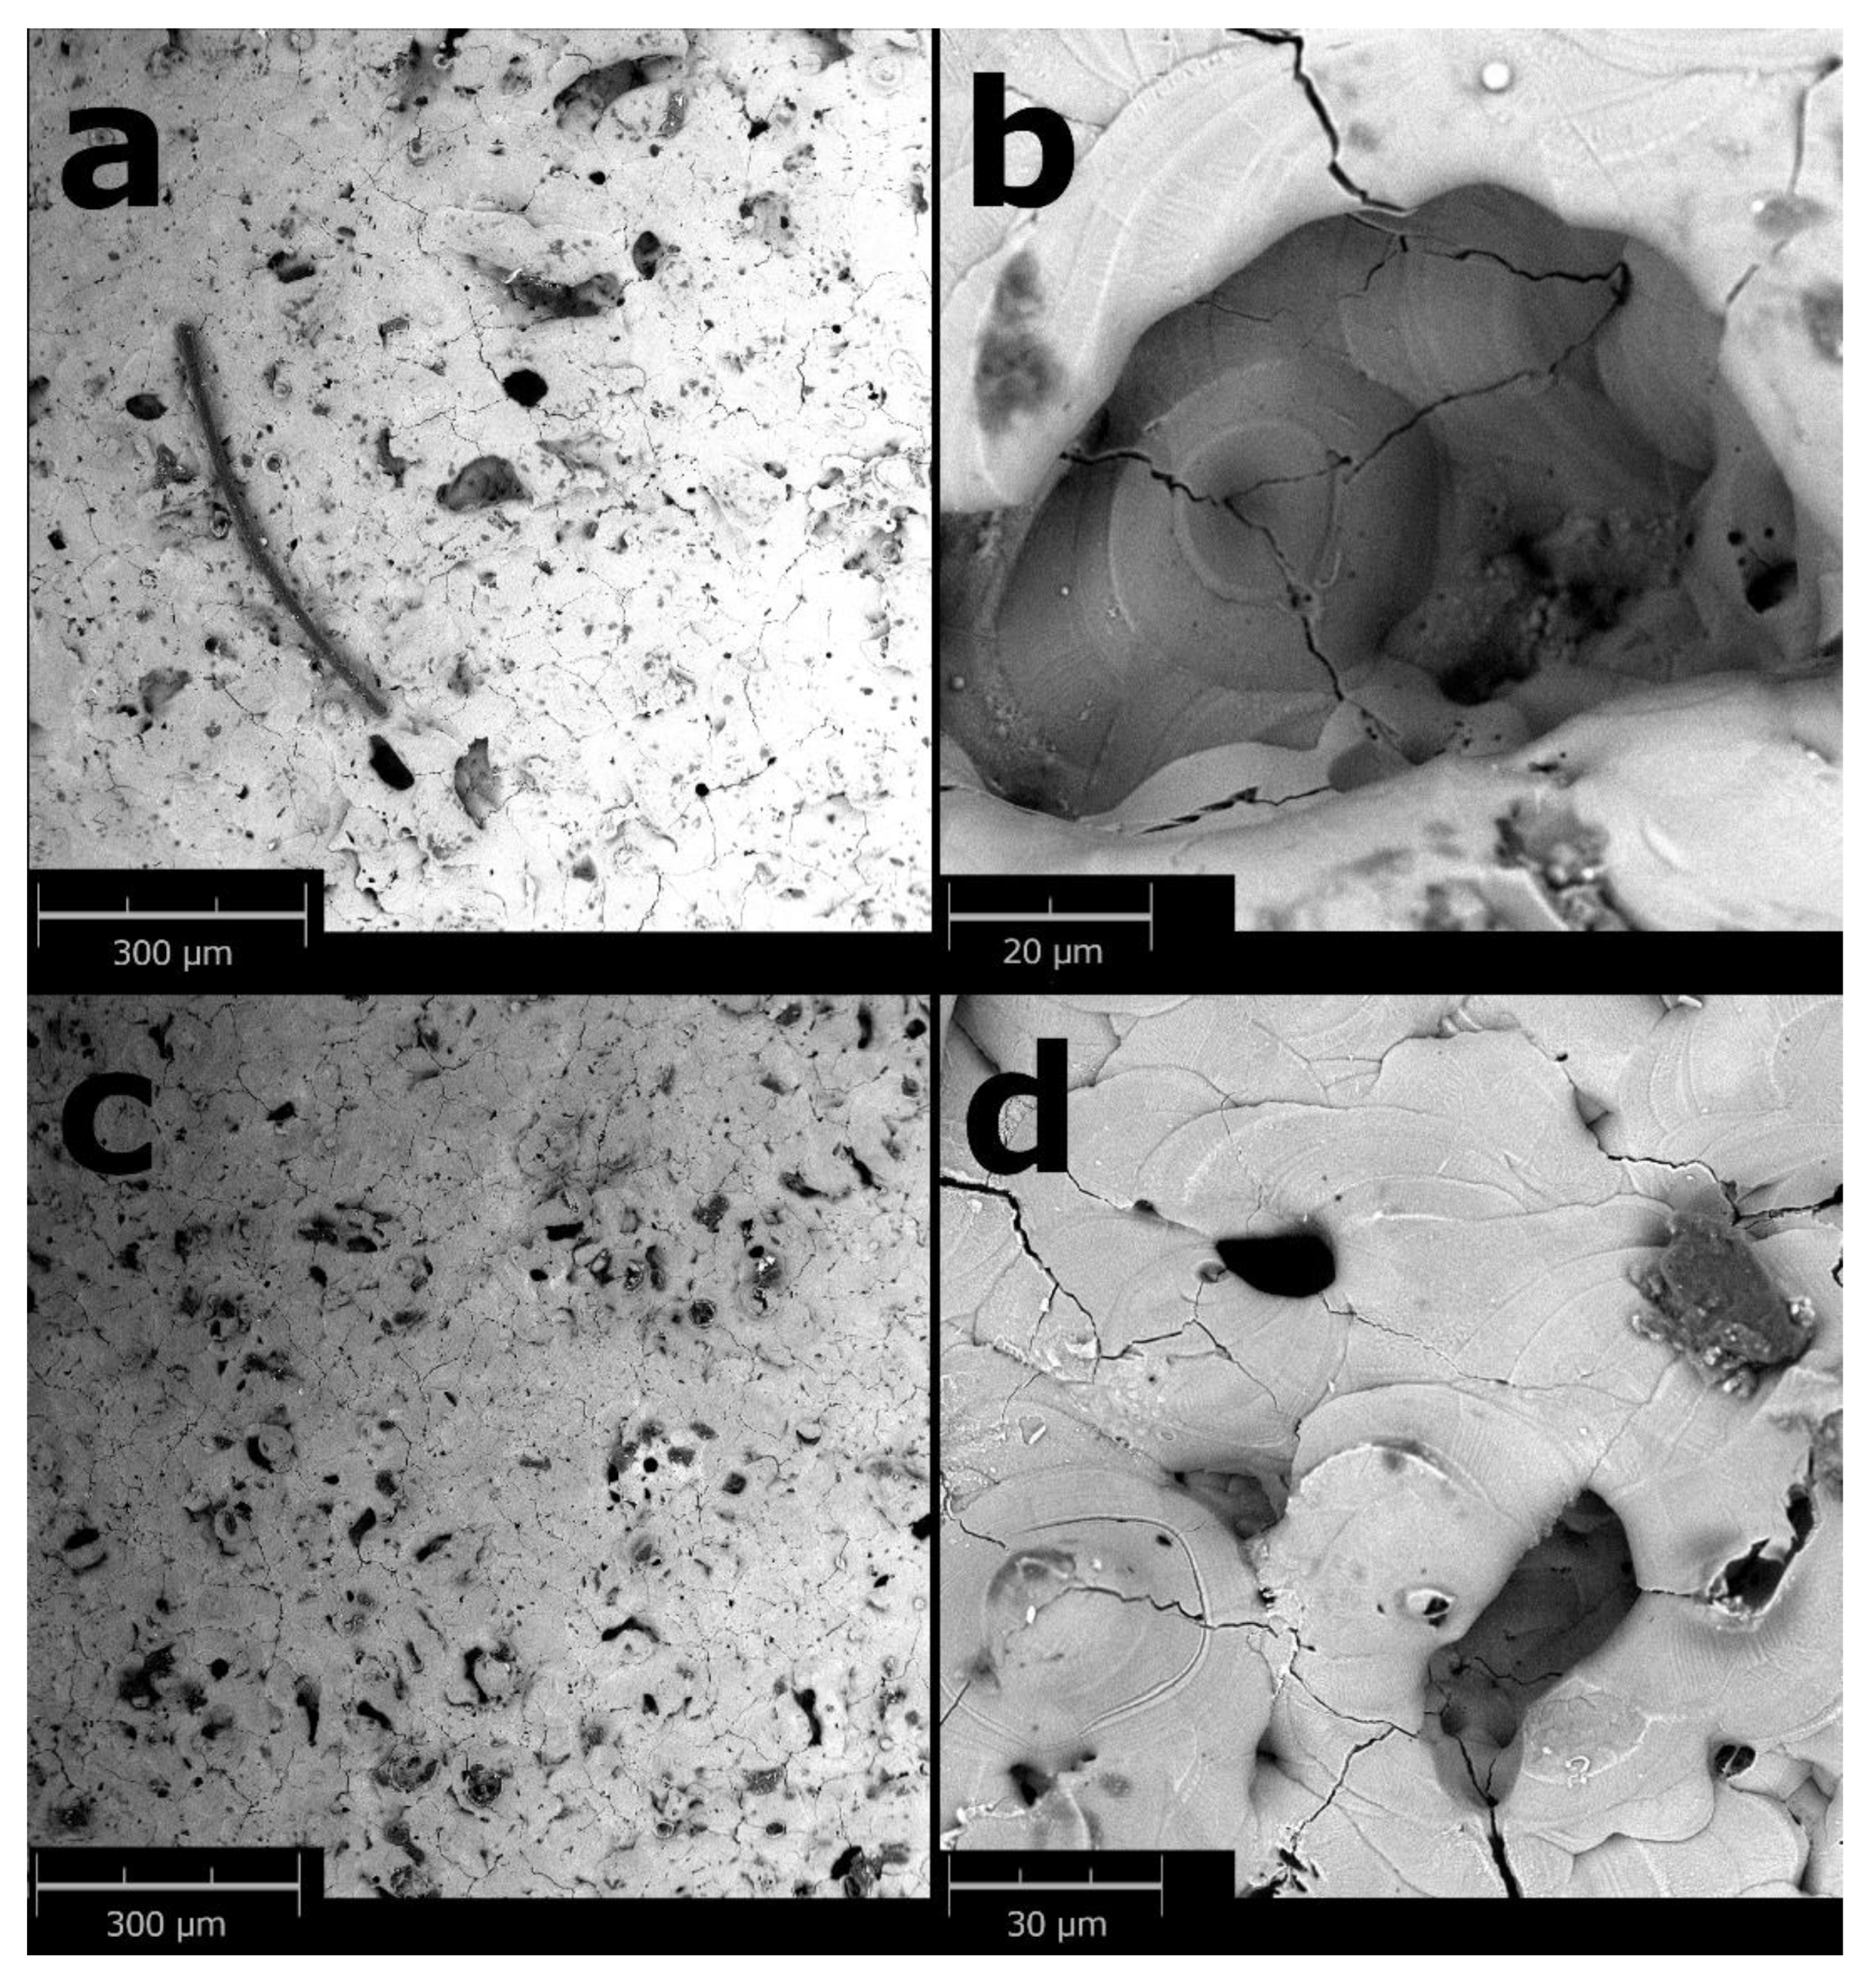
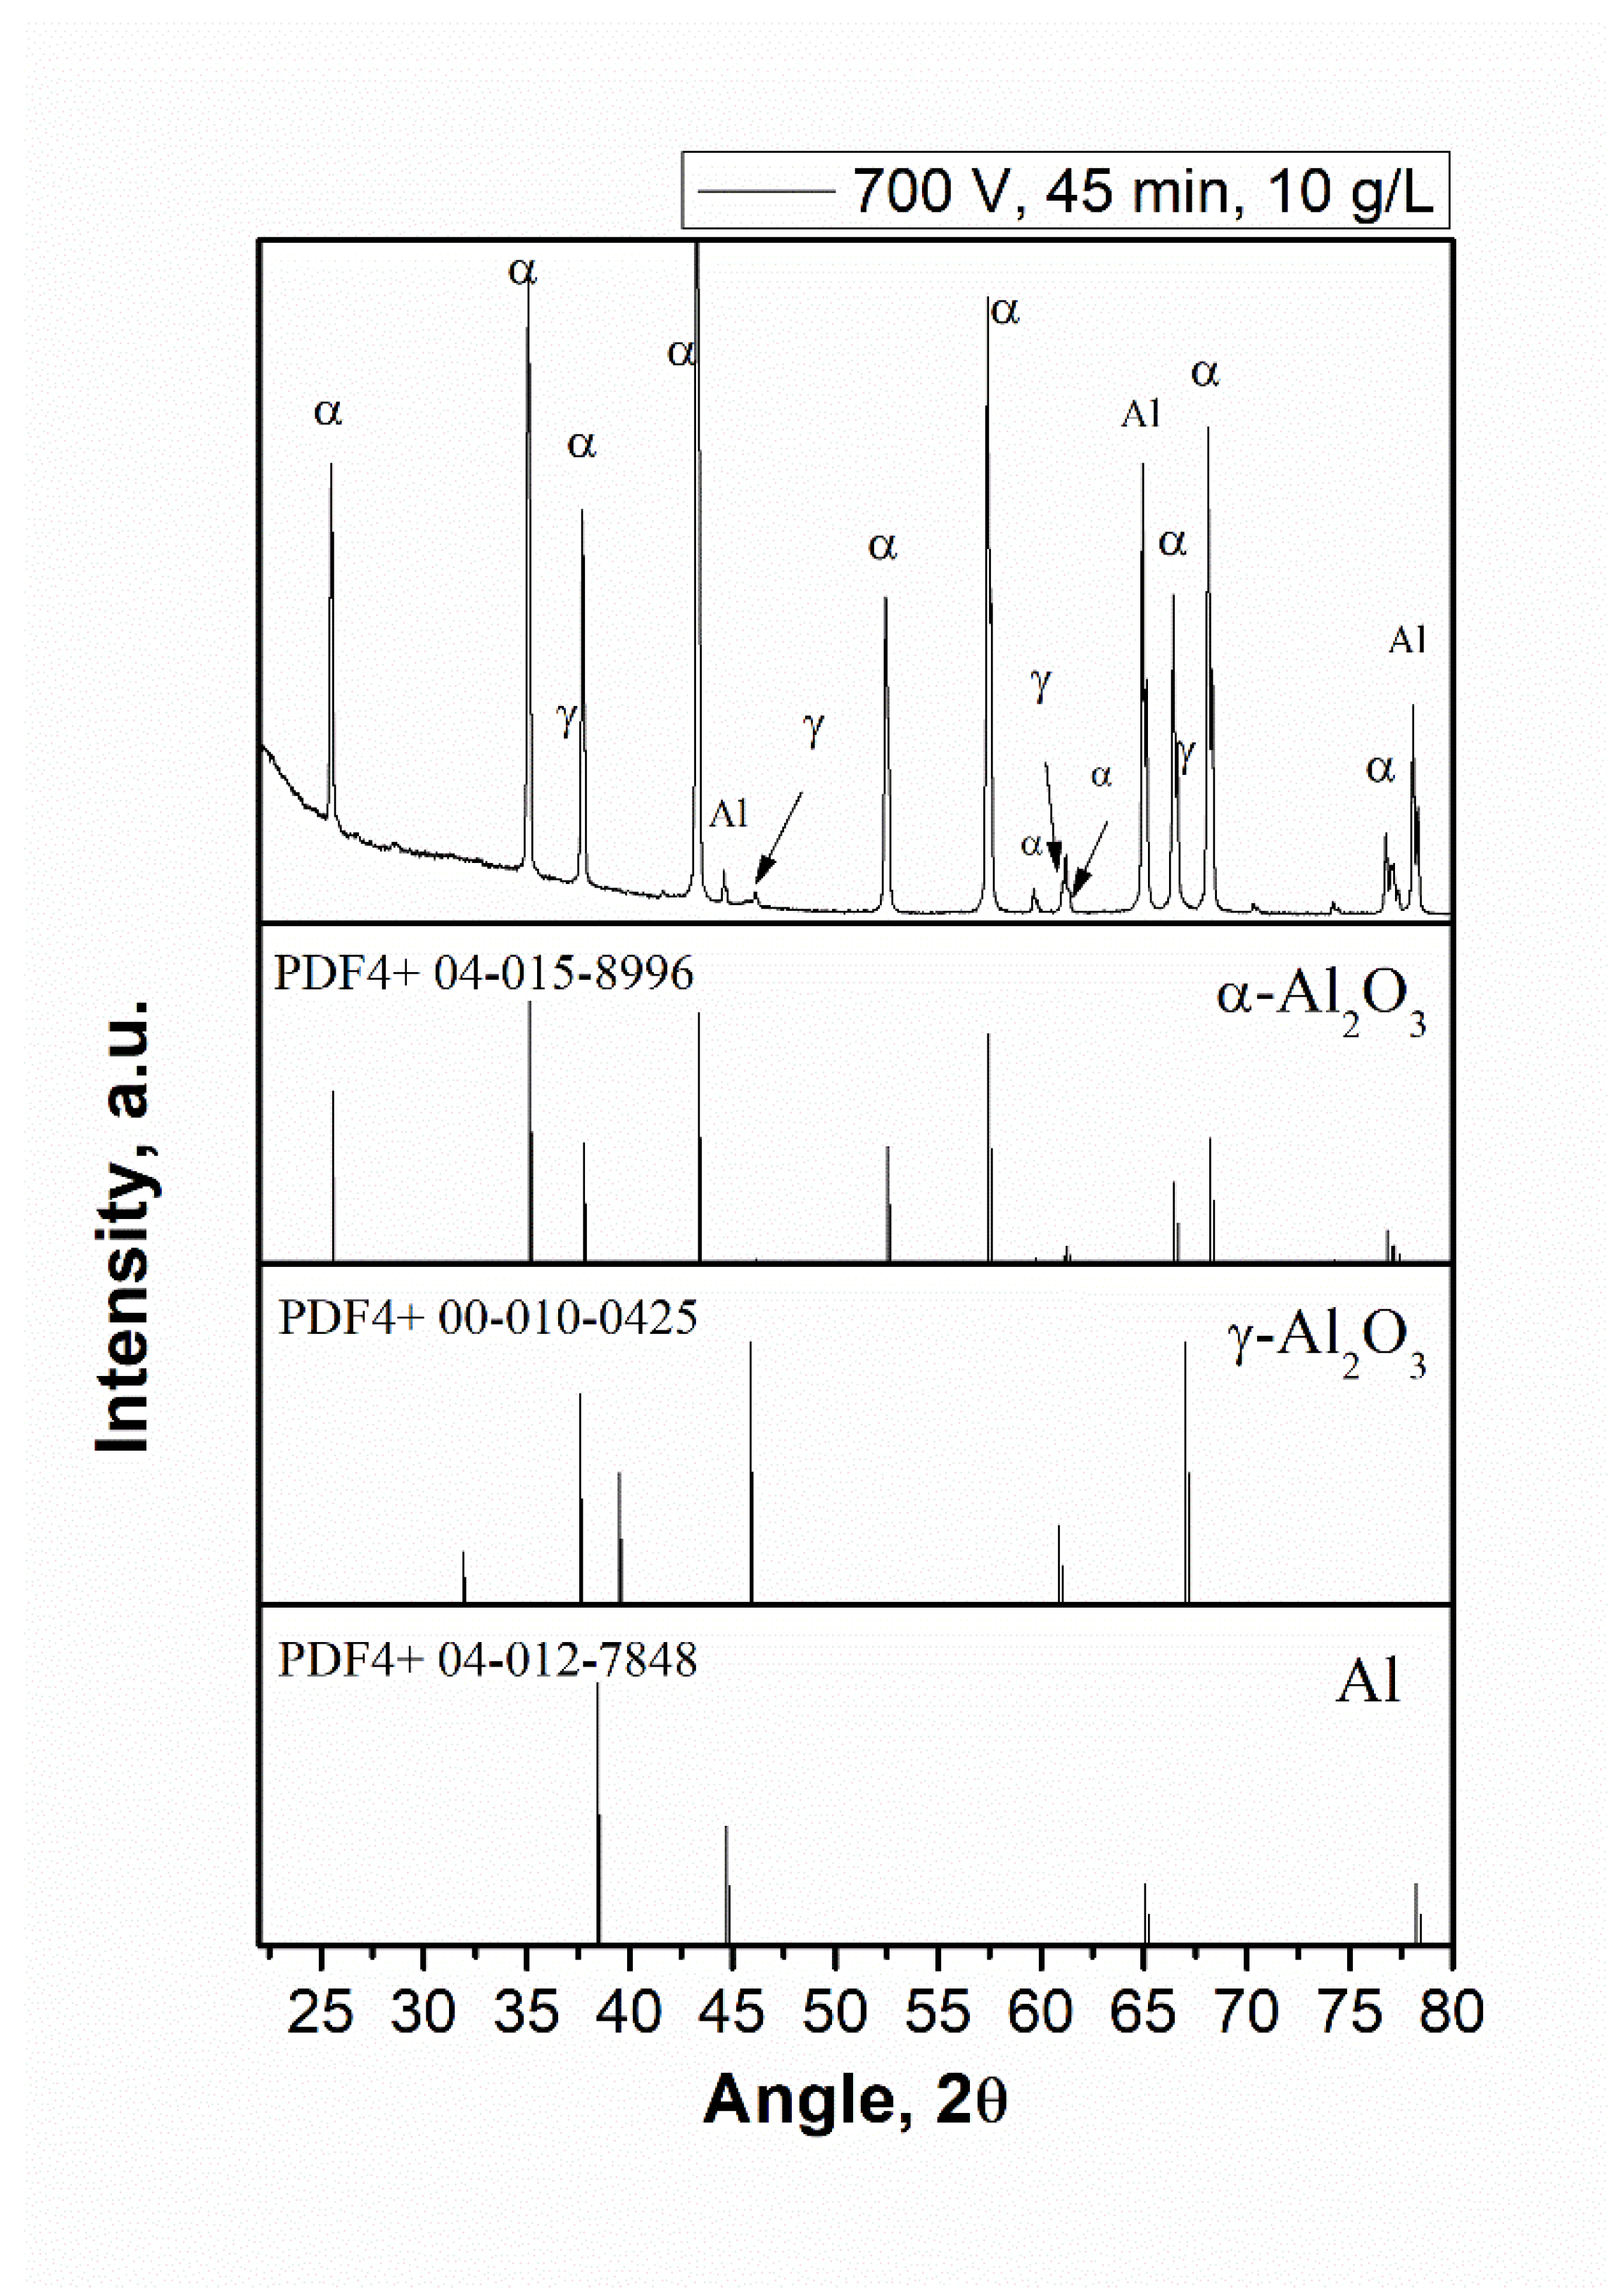
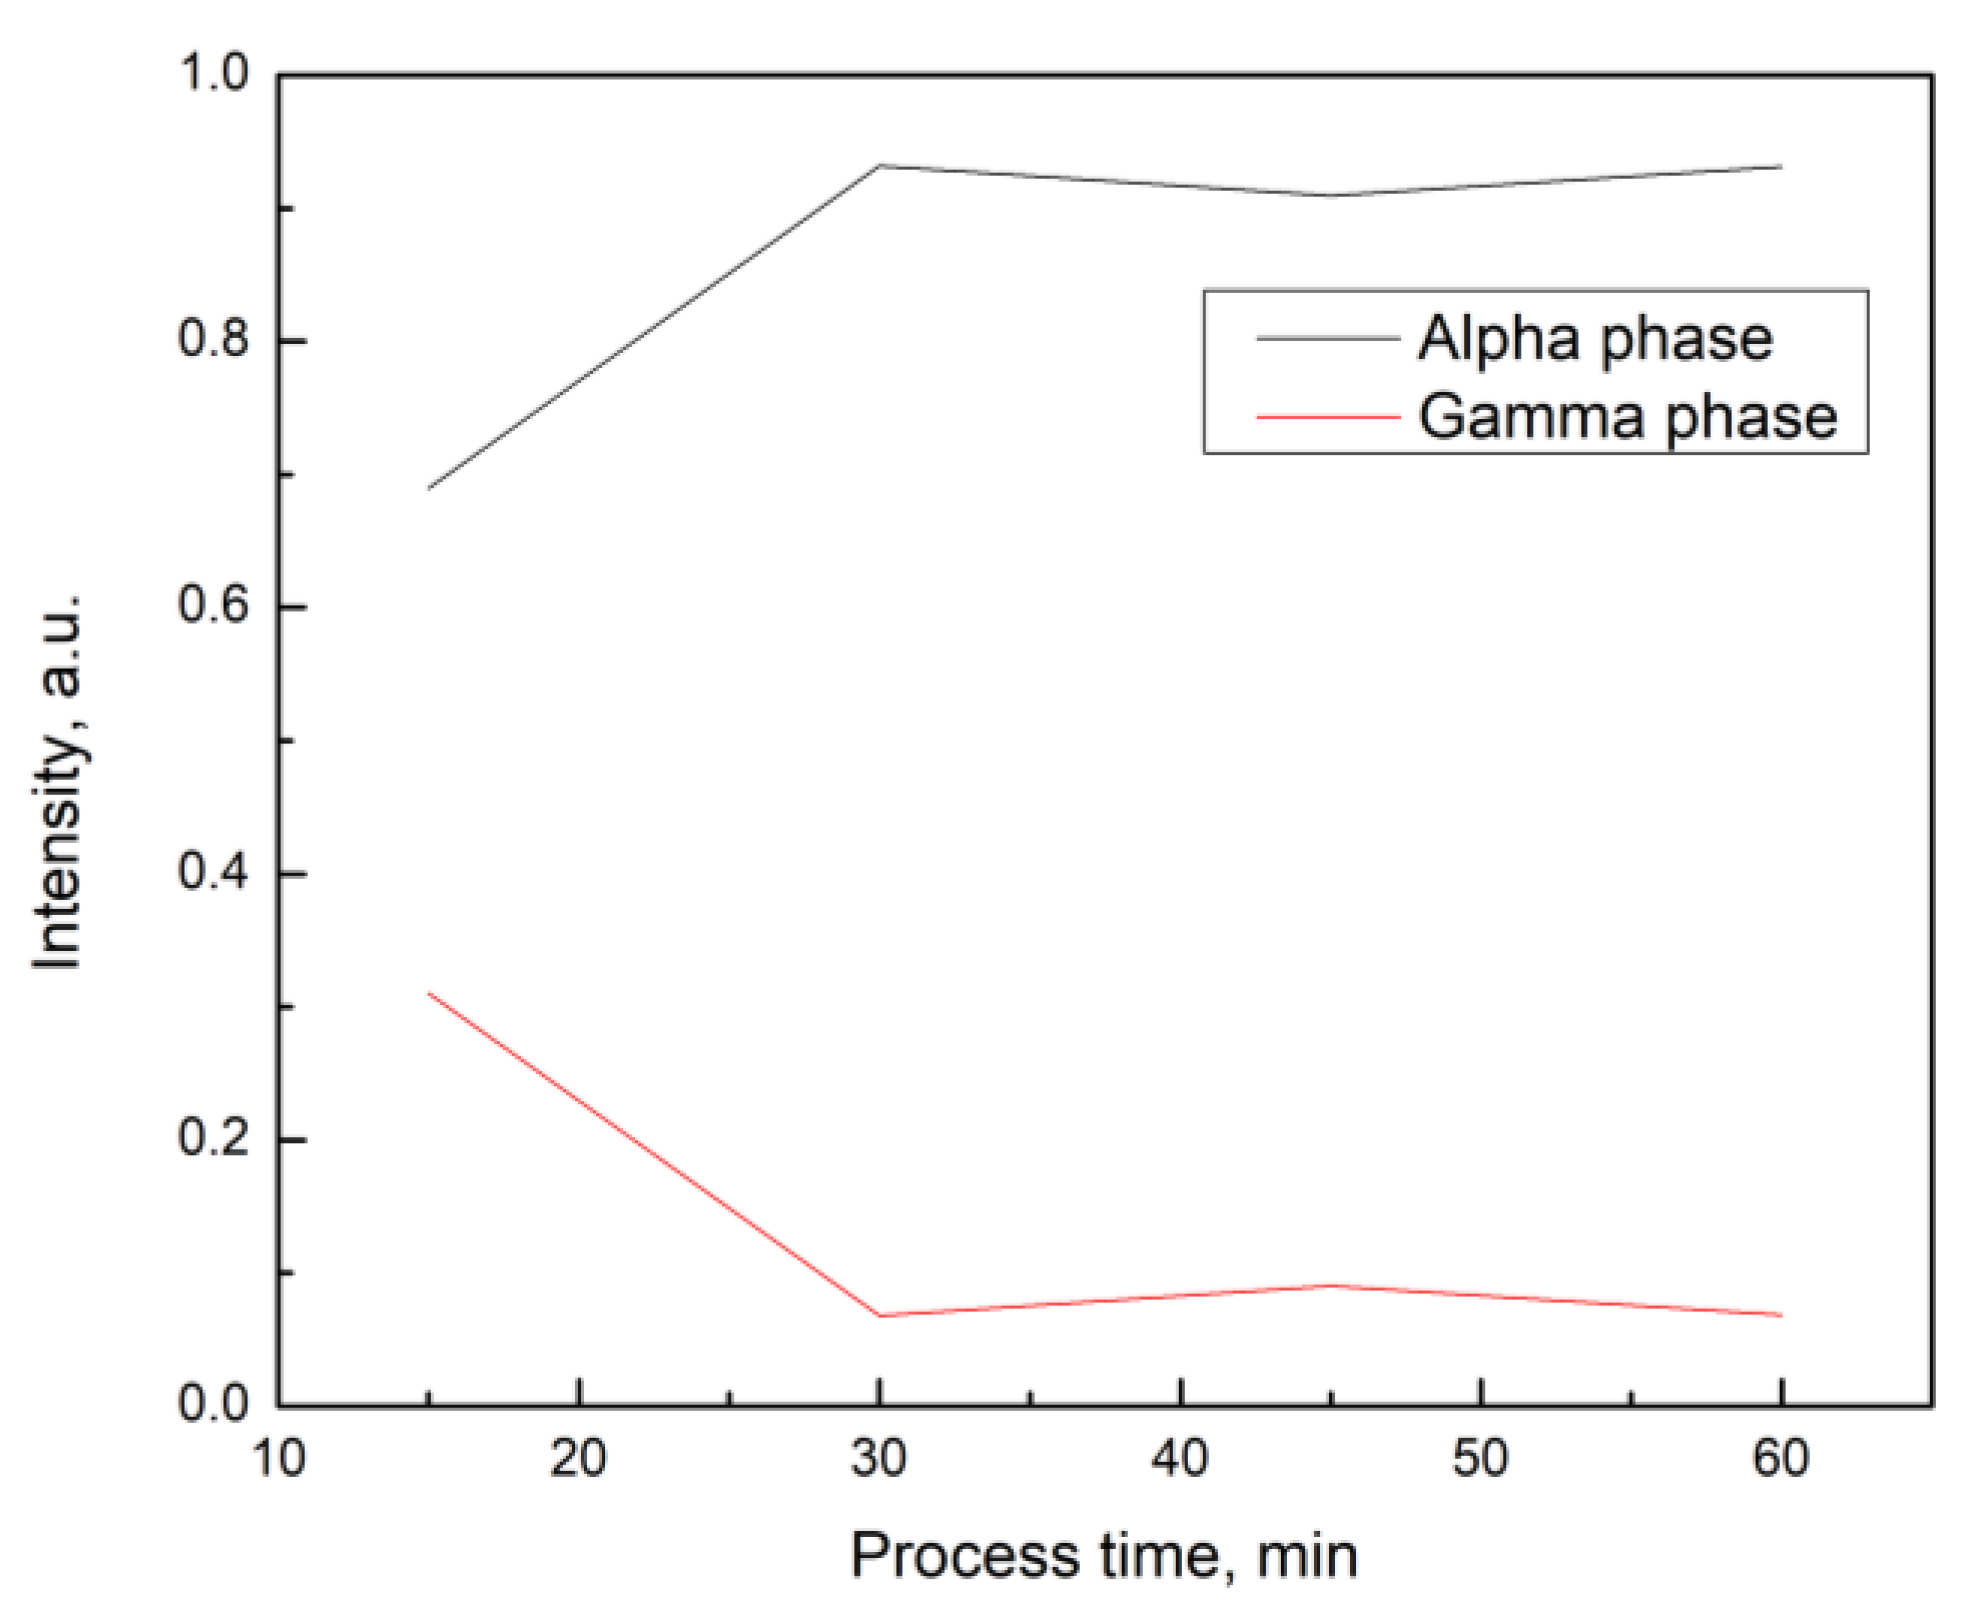
3.1. Structure and Morphology

SEM measurements were performed to study the surface of the coating and to compare the two samples. Porosity of the samples prepared with citric acid (Figure 1a,b) and those prepared in just KOH solution (Figure 1c,d) seems similar, however the citric acid samples possess marginally larger pores, which can be attributed to the slightly larger current density during the PEO of the undoped sample. The coating surface is coarse and porous, and it is similar to the coating surface of valve metal in universal PEO. Both coatings exhibit porosity, which sometimes can be an advantage [26], and cracks. Zoomed in images (Figure 1b,d) show a similar ceramic-like structure with irregular cracks formed by large temperature gradients. It can be deduced that the pores in the surface are the residual discharge channel during the discharge reaction. The irregularly shaped areas around the pores are formed due to the rapid cooling of the electrolyte. The average diameters of the pores are 0.3–0.4 mm [27].
The XRD measurements are crucial in almost any study of PEO coatings as the presence and type of crystalline structure in the coating will manifest most mechanical properties and capabilities. Figure 2 shows the XRD graph of one of the samples, with major peaks identified and connected to different alumina phases corresponding to PDF4+ database. Two main crystalline phases were identified—α-Al2O3 rhombohedral and γ-Al2O3 cubic [28].
It was found that the 15 min processing time was enough to produce some amount of α-Al2O3, however at 30 min processing time the mixture of the hardest α-phase and a “softer” γ-phase reaches 13:1 ratio and barely changes with increased process time, as shown in Figure 3, which correlates well with literature [29,30] and previous investigations. As such, the coating is expected to perform well in wear and hardness tests.
During the PEO process, a coating is formed at the interface between the substrate and the electrolyte or the previously formed coating and the electrolyte. Therefore, some of the impurities from the aluminum alloy are expected to migrate to the coating. However, the effect of citric acid inclusion in the electrolyte, voltage applied during PEO process, and duration of the PEO process time has on the concentration of impurity metal ions in the resulting coating is yet unknown.
Photoluminescence of samples consists of three spectral regions of interest—two broad peaks at around 425 nm and 550 nm and a significant peak at 693 nm typical to Cr3+ ion presence in α-Al2O3 matrix. The three regions in which these peaks are found are often referred to as blue, green, and red, representing visible light spectrum parts.
A blue luminescence peak (maximum at 425–450 nm) appears under UV irradiation in both samples, and it relates to alumina F and F+ centers (oxygen vacancies with one or two electrons) and is often observed in anodic aluminum oxide films. Both F+ and F centers are present, and the maxima are overlapping, thus producing a broad emission band [31]. A slight variation in integrated intensity at this region between samples is due to the overlap of maxima (F and F+) with different intensities, as intensities of both bands are highly sensitive to the structure, internal stresses, and preparation conditions of the coating [32,33,34].
A green luminescence band with maximum at 550 nm is also present under UV irradiation in both samples. This well-known band in amorphous and crystalline alumina is due to intrinsic defects of the alumina matrix, specifically F2 centers. The band is observed in alumina prepared by a wide range of methods [35,36,37,38].
Red luminescence observed under UV irradiation is a complex band consisting of a sharp peak (at 693 nm) and a broad-band covering the whole red part of the spectrum. The 693 nm sharp line’s intensity is minor compared to the luminescence of the blue band, however still notable over the red broad-band. It is associated with widely studied and abbreviated in literature as R1 and R2 line doublet of Cr3+ ions in Al sites of the α-Al2O3 matrix. The inability to distinguish R1 and R2 (692.5 nm and 694 nm [39]) lines is explained by the irregularities in the crystalline lattice of the coating and the presence of other impurities [39,40]. Besides Cr3+ luminescence, another maximum is also present around the R1 and R2 lines in TSL glow-curves, which most likely correlates with self-luminescence of α-Al2O3 (Figure 4).
XRL spectrum shows only a weak intensity blue luminescence, peaking at 450 nm and likely relating to the same alumina F and F+ centers, as observed in PL. Additionally, in the red luminescence part of the spectrum the sharp 693 nm peak, belonging to the R1 and R2 lines of the Cr3+ luminescence, can be observed here even more distinct against the broad red luminescence band.
Both PL and XRL measurements show an additional, wide, and particularly complex red luminescence band. Based on previous observations (from XRF), it is evident that a broad red luminescence originates from different metal ions (besides Mn and Cr) present in alumina structure and is obtained from the alloy itself during the growth of the coating [37]. If we compare samples with or without citric acid addition, an improvement in the intensity of luminescence is visible both for XRL and PL (Figure 4).
XRF measurements were performed and, together with thermally stimulated luminescence (TSL) results, are presented in Figure 5. TSL measurements are very important for determining which sample is best suited for dosimetric applications. With increasing duration of PEO process time, a clear peak in TSL intensity can be found for sample with 45 min process duration. Figure 5a shows that the concentration of impurity metal ions in the resulting coating only seems to correlate with these parameters after the 30 min mark. In Figure 5b, a correlation can be seen between an increased PEO process duration, TSL intensity, and Cr ion concentration measured in XRF. The only sample deviating from this correlation is the one created at 700 V DC. The sample series with varied citric acid concentration value yields close to no correlation between TSL intensity and Cr ion concentration. In Figure 5c, the presence of Cr ions in the formed coating peaks at 2 g·L−1 of added citric acid in electrolyte, however with increasing the citric acid concentration, TSL intensity seems to also increase up until the 10 g·L−1 limit, where the samples began heavily corroding during the PEO process.

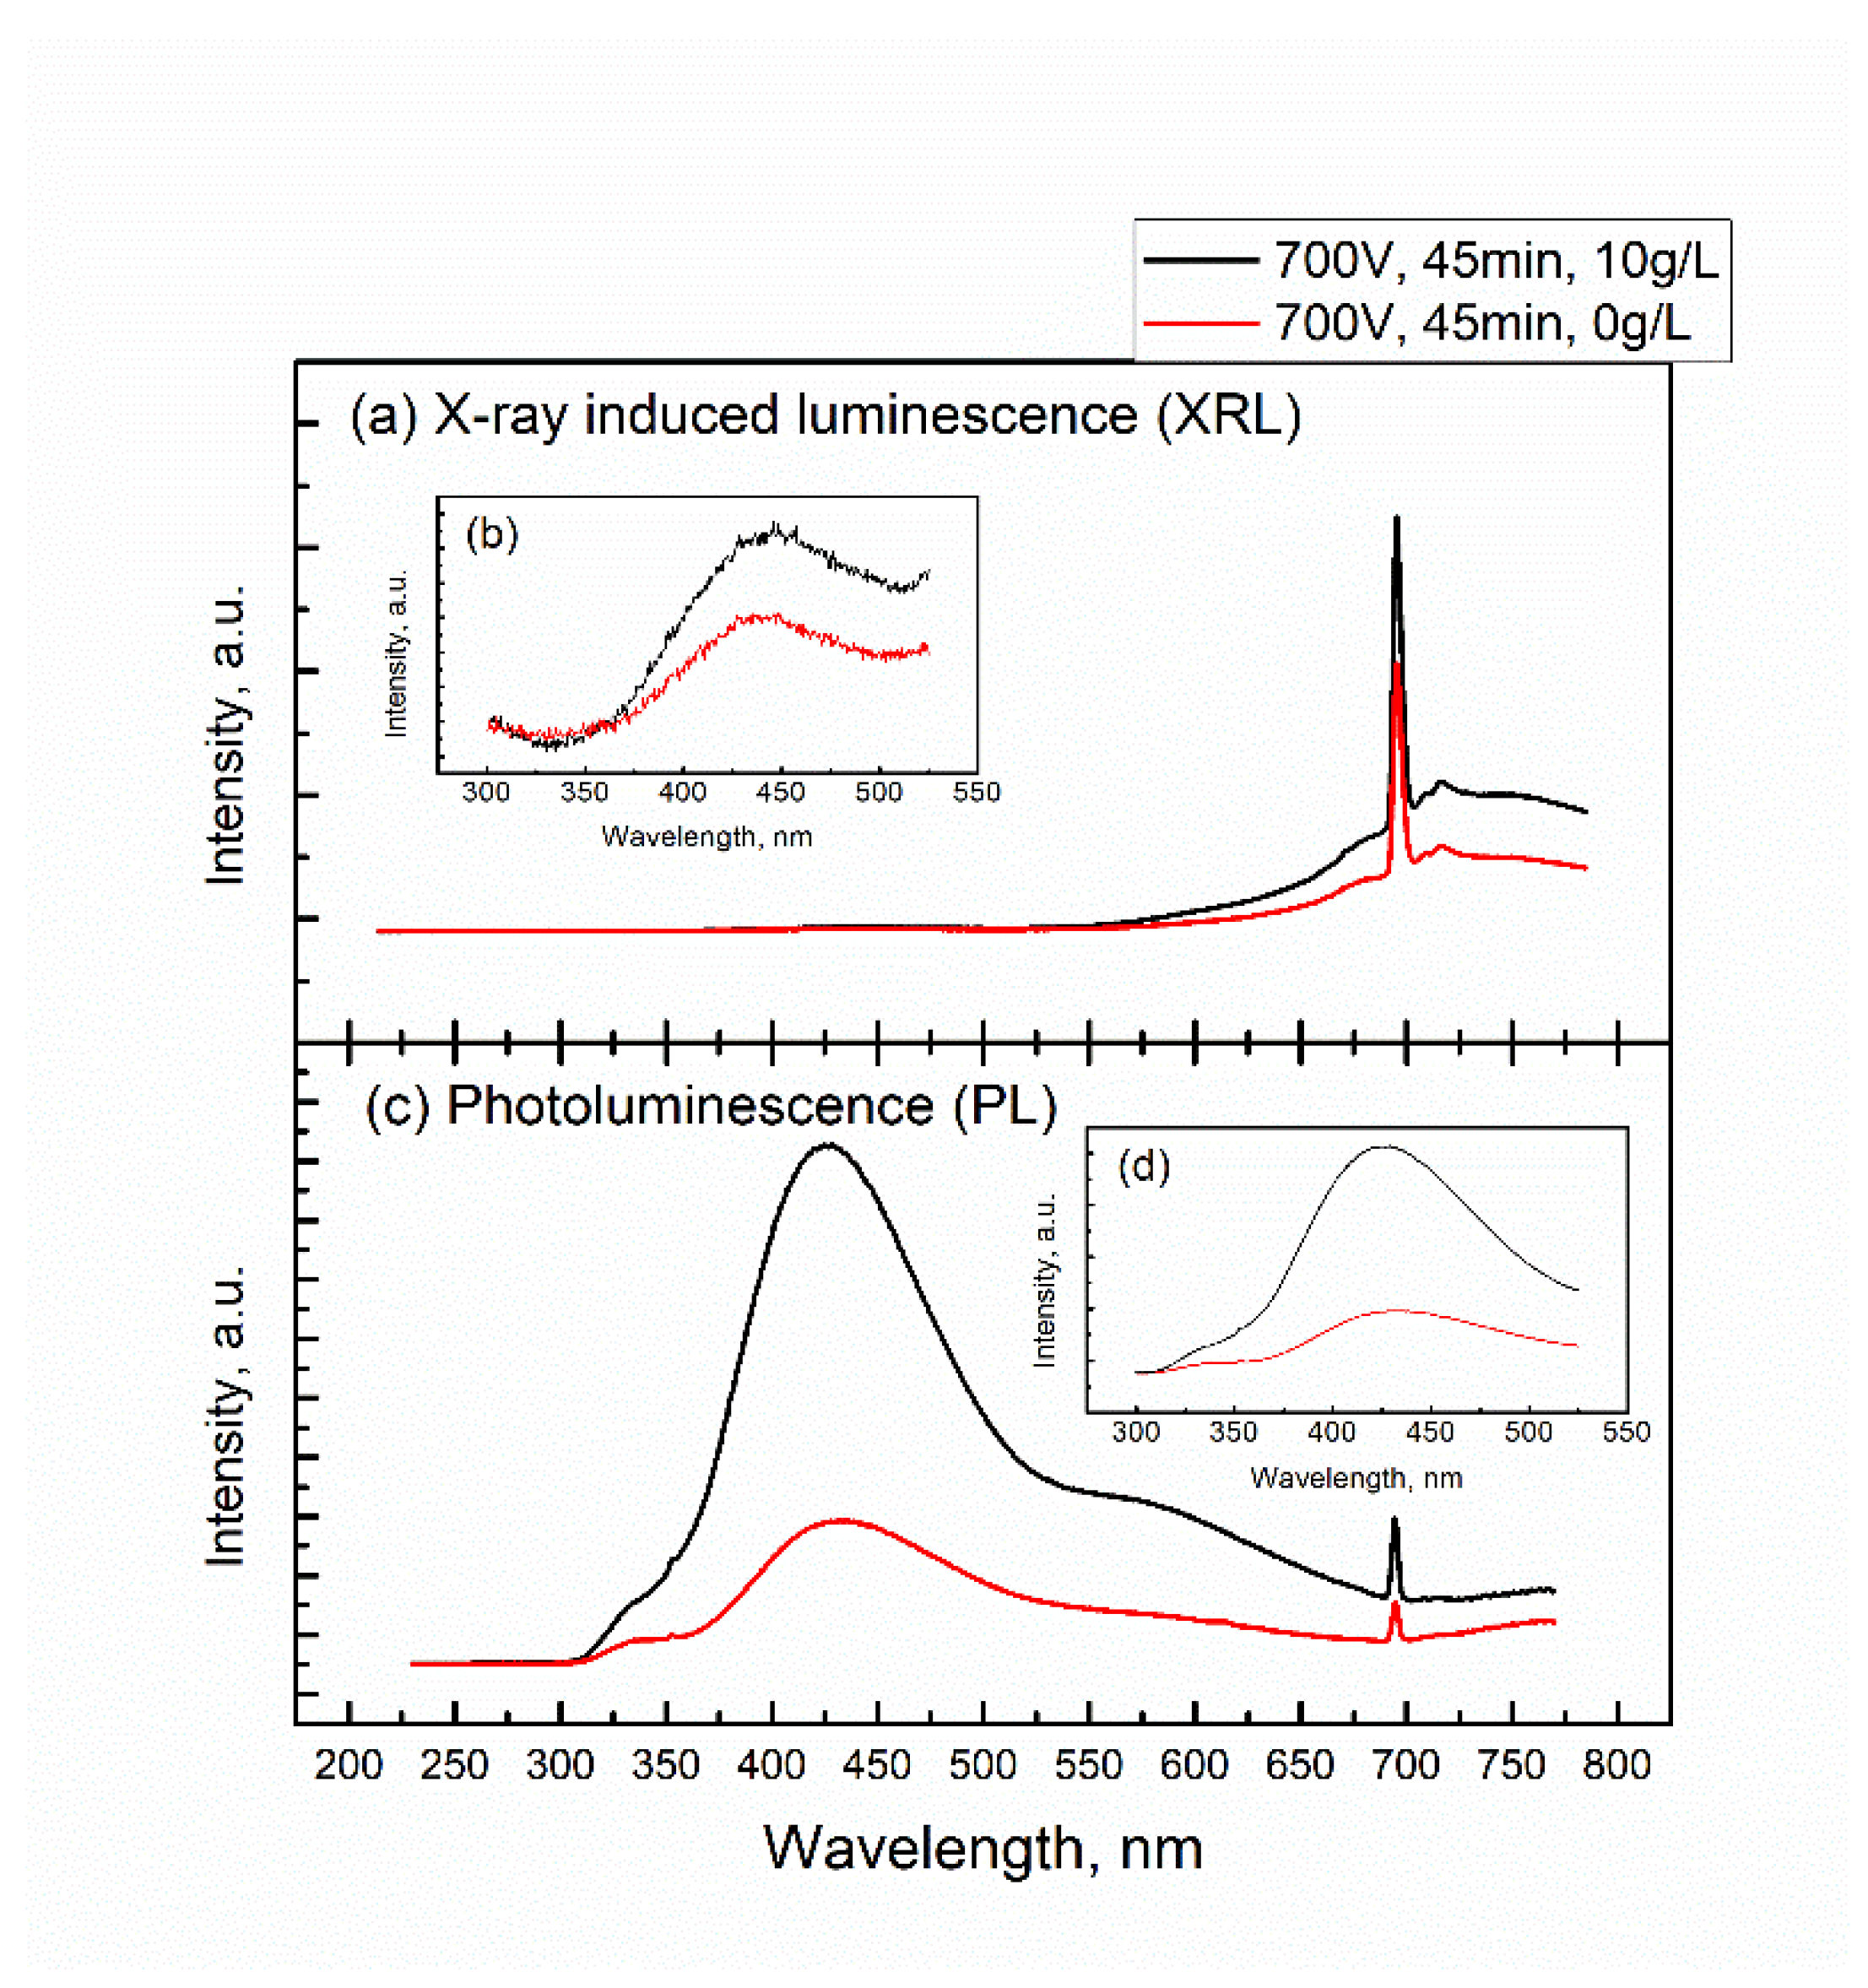
3.2. Optical Properties

TSL glow curves (Figure 6) were measured with CCD, therefore quick analysis of the full spectral distribution can be performed. Although a strong luminescence can be observed around 420 nm in TSL measurements, the highest intensity maximum corresponds with Cr3+ luminescence, meaning that any energy carriers stored in traps present in the lattice recombine on Cr atoms, which correlates well with previous observations even in other matrices. By analyzing only the 693 nm line, one can observe that the Cr-doped sample exhibits intense TSL signal in temperature ranges above room temperature, consisting of two or more overlapping maxima. Low temperature maximum (centered at about 375 K) produces an afterglow at room temperature and its intensity relates to the delay between the “impact” ionizing radiation dose and the measurement itself. The most intense glow curve maximum (at 480 K with FWHM of 50 K) represents the trap center with an activation energy of approximately 1.2 eV (estimated Randall–Wilkins equation [41,42,43]), well within the broad band-gap of the alumina. The intensity of this maximum might correlate with the acquired radiation dose, as long as the center is stable enough at room temperature. Additionally, a high temperature complex maximum is observed (from 550 K and up); however, the intensity is relatively low, and the limitations of the measurement setup deny comprehensive study of this part of the glow curve). It is important to note that no TSL signal above room temperature was observed for the undoped sample; therefore, all glow curve maxima are due to the increased concentration of defects (impurity ions) in the alumina matrix.

4. Conclusions

A new approach to produce Cr3+-doped hard ceramic alumina coating on aluminum alloy (Al6082) surface is proposed. The coating is prepared during the PEO process with the use of a modified KOH-based electrolyte by the addition of citric acid. No additional Cr is introduced in the electrolyte as the luminescence centers migrate into the coating from the substrate material. The obtained material exhibits outstanding luminescence properties that are promising for use in the detection and quantification of ionizing radiation. Strong Cr3+ emission is observed in PL, XRL, and TSL spectra, providing a basis for a range of sensor applications.
Since the proposed technique does not require an artificial dopant to be added to the electrolyte and in turn uses the impurities already present in most aluminum alloys, this method is easily and inexpensively scalable and is more environmentally friendly than the conventional Cr-based electrolytes. The best performing samples were created with 45 min PEO process time, 700 V DC voltage, and 10 g·L−1 concentration of citric acid in the electrolyte.
To evaluate the coating for use as a dosimeter, additional measurements should be performed. Moreover, although the alpha phase is present in the coating, mechanical properties should be studied if the approach is to be considered for use in coating preparation with both mechanical stability and functional properties in mind.

Author Contributions

Conceptualization, K.S. and A.Z. (Aleksejs Zolotarjovs); methodology, A.Z. (Aleksejs Zolotarjovs) and G.T.; software, E.E.; validation, A.Z. (Aleksejs Zolotarjovs), V.V. and K.S.; formal analysis, R.P. and G.T.; investigation, R.P., E.E., V.V. and K.S.; resources, R.P., A.Z. (Arturs Zarins) and G.K.; data curation, G.T. and K.S.; writing—original draft preparation, R.P.; writing—review and editing, A.Z. (Aleksejs Zolotarjovs), V.V. and E.E.; visualization, G.T.; supervision, A.Z. (Aleksejs Zolotarjovs); project administration, K.S.; funding acquisition, K.S. All authors have read and agreed to the published version of the manuscript.

Funding

Financial support provided by the ERDF, European-Union Project No.1.1.1.1/16/A/182 realized at the Institute of Solid State Physics, University of Latvia is greatly acknowledged. Authors are grateful to ElGoo Tech Ltd. for providing PEO equipment. Institute of Solid State Physics, University of Latvia as the Center of Excellence has received funding from the European Union’s Horizon 2020 Framework Programme H2020-WIDESPREAD-01-2016-2017-TeamingPhase2 under grant agreement No.739508, project CAMART2.

Institutional Review Board Statement

Not applicable.

Informed Consent Statement

Not applicable.

Data Availability Statement

Data available upon request to the authors.

Conflicts of Interest

The authors declare no conflict of interest.

References

  1. Auzins, K.; Zolotarjovs, A.; Bite, I.; Laganovska, K.; Vitola, V.; Smits, K.; Millers, D. Production of Phosphorescent Coatings on 6082 Aluminum Using Sr0.95Eu0.02Dy0.03Al2O4−δ Powder and Plasma Electrolytic Oxidation. Coatings 2019, 9, 865. [Google Scholar] [CrossRef] [Green Version]
  2. Yerokhin, A.L.; Nie, X.; Leyland, A.; Matthews, A.; Dowey, S.J. Plasma Electrolysis for Surface Engineering. Surf. Coat. Technol. 1999, 122, 73–93. [Google Scholar] [CrossRef]
  3. Agureev, L.; Savushkina, S.; Ashmarin, A.; Borisov, A.; Apelfeld, A.; Anikin, K.; Tkachenko, N.; Gerasimov, M.; Shcherbakov, A.; Ignatenko, V.; et al. Study of Plasma Electrolytic Oxidation Coatings on Aluminum Composites. Metals 2018, 8, 459. [Google Scholar] [CrossRef] [Green Version]
  4. Snizhko, L.O.; Yerokhin, A.L.; Pilkington, A.; Gurevina, N.L.; Misnyankin, D.O.; Leyland, A.; Matthews, A. Anodic Processes in Plasma Electrolytic Oxidation of Aluminium in Alkaline Solutions. Electrochim. Acta 2004, 49, 2085–2095. [Google Scholar] [CrossRef]
  5. White, L.; Koo, Y.; Neralla, S.; Sankar, J.; Yun, Y. Enhanced Mechanical Properties and Increased Corrosion Resistance of a Biodegradable Magnesium Alloy by Plasma Electrolytic Oxidation (PEO). Mater. Sci. Eng. B 2016, 208, 39–46. [Google Scholar] [CrossRef] [Green Version]
  6. Ramesh, M.; Marimuthu, K.; Karuppuswamy, P.; Rajeshkumar, L. Microstructure and Properties of YSZ-Al2O3 Functional Ceramic Thermal Barrier Coatings for Military Applications. Boletín Soc. Española Cerámica Vidr. 2021; in press. [Google Scholar] [CrossRef]
  7. Liang, J.; Srinivasan, P.B.; Blawert, C.; Störmer, M.; Dietzel, W. Electrochemical Corrosion Behaviour of Plasma Electrolytic Oxidation Coatings on AM50 Magnesium Alloy Formed in Silicate and Phosphate Based Electrolytes. Electrochim. Acta 2009, 54, 3842–3850. [Google Scholar] [CrossRef]
  8. Shirai, T.; Watanabe, H.; Fuji, M.; Takahashi, M. Structural Properties and Surface Characteristics on Aluminum Oxide Powders. Ceram. Res. Lab. 2009, 9, 23–31. [Google Scholar]
  9. da Costa Cunha, G.; Romão, L.P.C.; Macedo, Z.S. Production of Alpha-Alumina Nanoparticles Using Aquatic Humic Substances. Powder Technol. 2014, 254, 344–351. [Google Scholar] [CrossRef]
  10. Serdechnova, M.; Karpushenkov, S.; Karpushenkava, L.; Starykevich, M.; Ferreira, M.; Hack, T.; Iuzviuk, M.; Zobkalo, I.; Blawert, C.; Zheludkevich, M. The Influence of PSA Pre-Anodization of AA2024 on PEO Coating Formation: Composition, Microstructure, Corrosion, and Wear Behaviors. Materials 2018, 11, 2428. [Google Scholar] [CrossRef] [Green Version]
  11. Bouali, A.C.; Straumal, E.A.; Serdechnova, M.; Wieland, D.C.F.; Starykevich, M.; Blawert, C.; Hammel, J.U.; Lermontov, S.A.; Ferreira, M.G.S.; Zheludkevich, M.L. Layered Double Hydroxide Based Active Corrosion Protective Sealing of Plasma Electrolytic Oxidation/Sol-Gel Composite Coating on AA2024. Appl. Surf. Sci. 2019, 494, 829–840. [Google Scholar] [CrossRef]
  12. Grigorjeva, L.; Millers, D.; Smits, K.; Zolotarjovs, A. Gas Sensitive Luminescence of ZnO Coatings Obtained by Plazma Electrolytic Oxidation. Sens. Actuators A Phys. 2015, 234, 290–293. [Google Scholar] [CrossRef]
  13. Zolotarjovs, A.; Smits, K.; Laganovska, K.; Bite, I.; Grigorjeva, L.; Auzins, K.; Millers, D.; Skuja, L. Thermostimulated Luminescence of Plasma Electrolytic Oxidation Coatings on 6082 Aluminium Surface. Radiat. Meas. 2019, 124, 29–34. [Google Scholar] [CrossRef]
  14. Zolotarjovs, A.; Smits, K.; Krumina, A.; Millers, D.; Grigorjeva, L. Luminescent PEO Coatings on Aluminum. ECS J. Solid State Sci. Technol. 2016, 5, R150–R153. [Google Scholar] [CrossRef]
  15. Bite, I.; Krieke, G.; Zolotarjovs, A.; Laganovska, K.; Liepina, V.; Smits, K.; Auzins, K.; Grigorjeva, L.; Millers, D.; Skuja, L. Novel Method of Phosphorescent Strontium Aluminate Coating Preparation on Aluminum. Mater. Des. 2018, 160, 794–802. [Google Scholar] [CrossRef]
  16. Stojadinović, S.; Vasilić, R. Formation and Photoluminescence of Eu3+ Doped Zirconia Coatings Formed by Plasma Electrolytic Oxidation. J. Lumin. 2016, 176, 25–31. [Google Scholar] [CrossRef]
  17. Bordbar-Khiabani, A.; Yarmand, B.; Mozafari, M. Enhanced Corrosion Resistance and In-Vitro Biodegradation of Plasma Electrolytic Oxidation Coatings Prepared on AZ91 Mg Alloy Using ZnO Nanoparticles-Incorporated Electrolyte. Surf. Coat. Technol. 2019, 360, 153–171. [Google Scholar] [CrossRef]
  18. Smits, K.; Millers, D.; Zolotarjovs, A.; Drunka, R.; Vanks, M. Luminescence of Eu Ion in Alumina Prepared by Plasma Electrolytic Oxidation. Appl. Surf. Sci. 2015, 337, 166–171. [Google Scholar] [CrossRef]
  19. Einbergs, E.; Zolotarjovs, A.; Bite, I.; Laganovska, K.; Auzins, K.; Smits, K.; Trinkler, L. Usability of Cr-Doped Alumina in Dosimetry. Ceramics 2019, 2, 525–535. [Google Scholar] [CrossRef] [Green Version]
  20. Lapraz, D.; Iacconi, P.; Daviller, D.; Guilhot, B. Thermostimulated Luminescence and Fluorescence of α-Al2O3:Cr3+Samples (Ruby). Influence of the Cr3+ Concentration. Phys. Status Solidi (A) 1991, 126, 521–531. [Google Scholar] [CrossRef]
  21. Yunusov, M.S.; Tsoi, A.N.; Muminkhodzhaev, K.M.; Khaimov-Mal’kov, V.Y. Using Thermoluminescence of Ruby for the Dosimetry of γ-Radiation. Sov. At. Energy 1974, 36, 396–398. [Google Scholar] [CrossRef]
  22. Grigorjeva, L.; Zolotarjovs, A.; Millers, D.; Smits, K.; Krug, P.; Stollenwerk, J.; Osman, A.; Tenostendarp, T. Magnetron Sputtering Fabrication of α-Al2O3:Cr Powders and Their Thermoluminescence Properties. Radiat. Meas. 2018, 119, 140–143. [Google Scholar] [CrossRef]
  23. García-Mayorga, J.C.; Urbano-Reyes, G.; Veloz-Rodríguez, M.A.; Reyes-Cruz, V.E.; Cobos-Murcia, J.A.; Hernández-Ávila, J.; Pérez-Labra, M. Electrochemical Preparation of Precursor Phases for Obtaining Alpha-Alumina from Aluminium Scrap. Ceram. Int. 2018, 44, 7435–7441. [Google Scholar] [CrossRef]
  24. Pham, T.D.; Kobayashi, M.; Adachi, Y. Interfacial Characterization of α-Alumina with Small Surface Area by Streaming Potential and Chromatography. Colloids Surf. A Physicochem. Eng. Asp. 2013, 436, 148–157. [Google Scholar] [CrossRef]
  25. Patra, A.; Tallman, R.E.; Weinstein, B.A. Effect of Crystal Structure and Dopant Concentration on the Luminescence of Cr3+ in Al2O3 Nanocrystals. Opt. Mater. 2005, 27, 1396–1401. [Google Scholar] [CrossRef]
  26. Curran, J.A.; Clyne, T.W. Porosity in Plasma Electrolytic Oxide Coatings. Acta Mater. 2006, 54, 1985–1993. [Google Scholar] [CrossRef]
  27. Wang, Y.L.; Wang, M.; Zhou, M.; Li, B.J.; Amoako, G.; Jiang, Z.H. Microstructure Characterisation of Alumina Coating on Steel by PEO. Surf. Eng. 2013, 29, 271–275. [Google Scholar] [CrossRef]
  28. Gražulis, S.; Chateigner, D.; Downs, R.T.; Yokochi, A.F.T.; Quirós, M.; Lutterotti, L.; Manakova, E.; Butkus, J.; Moeck, P.; le Bail, A. Crystallography Open Database—An Open-Access Collection of Crystal Structures. J. Appl. Crystallogr. 2009, 42, 726–729. [Google Scholar] [CrossRef] [Green Version]
  29. Tian, J.; Luo, Z.; Qi, S.; Sun, X. Structure and Antiwear Behavior of Micro-Arc Oxidized Coatings on Aluminum Alloy. Surf. Coat. Technol. 2002, 154, 1–7. [Google Scholar] [CrossRef]
  30. Yerokhin, A.; Snizhko, L.; Gurevina, N.; Leyland, A.; Pilkington, A.; Matthews, A. Matthews Discharge Characterization in Plasma Electrolytic Oxidation of Aluminium. J. Phys. D Appl. Phys. 2003, 36, 2110. [Google Scholar] [CrossRef]
  31. Huang, G.S.; Wu, X.L.; Yang, L.W.; Shao, X.F.; Siu, G.G.; Chu, P.K. Dependence of Blue-Emitting Property on Nanopore Geometrical Structure in Al-Based Porous Anodic Alumina Membranes. Appl. Phys. A 2005, 81, 1345–1349. [Google Scholar] [CrossRef]
  32. Li, S.-Y.; Wang, J.; Li, Y. Photoluminescence Properties of Anodic Aluminum Oxide Formed in a Mixture of Ammonium Fluoride and Oxalic Acid. Opt. Eng. 2017, 56, 067107. [Google Scholar] [CrossRef]
  33. Palanza, V.; Galli, A.; Lorenzi, R.; Moretti, F.; Mozzati, M.C.; Paleari, A.; Spinolo, G. Luminescence Study of Transition Metal Ions in Natural Magmatic and Metamorphic Yellow Sapphires. IOP Conf. Ser. Mater. Sci. Eng. 2010, 15, 012086. [Google Scholar] [CrossRef] [Green Version]
  34. Brewer, J.D.; Jeffries, B.T.; Summers, G.P. Low-Temperature Fluorescence in Sapphire. Phys. Rev. B 1980, 22, 4900–4906. [Google Scholar] [CrossRef]
  35. de Azevedo, W.M.; de Oliveira, G.B.; da Silva, E.F.; Khoury, H.J.; Oliveira de Jesus, E.F. Highly Sensitive Thermoluminescent Carbon Doped Nanoporous Aluminium Oxide Detectors. Radiat. Prot. Dosim. 2006, 119, 201–205. [Google Scholar] [CrossRef] [PubMed]
  36. Baronskiy, M.; Rastorguev, A.; Zhuzhgov, A.; Kostyukov, A.; Krivoruchko, O.; Snytnikov, V. Photoluminescence and Raman Spectroscopy Studies of Low-Temperature γ-Al2O3 Phases Synthesized from Different Precursors. Opt. Mater. 2016, 53, 87–93. [Google Scholar] [CrossRef]
  37. Gorbunov, S.V.; Cholakh, S.O.; Pustovarov, V.A.; Yakovlev, V.Y.; Zatsepin, A.F.; Kucharenko, A.I. Electronic Excitations and Intrinsic Defects in Nanostructural Al2O3. Phys. Status Solidi (C) 2005, 2, 351–354. [Google Scholar] [CrossRef]
  38. Rodriguez, M.G.; Denis, G.; Akselrod, M.S.; Underwood, T.H.; Yukihara, E.G. Thermoluminescence, Optically Stimulated Luminescence and Radioluminescence Properties of Al2O3:C,Mg. Radiat. Meas. 2011, 46, 1469–1473. [Google Scholar] [CrossRef]
  39. Kostyukov, A.; Baronskiy, M.; Rastorguev, A.; Snytnikov, V.; Snytnikov, V.; Zhuzhgov, A.; Ishchenko, A. Photoluminescence of Cr3+ in Nanostructured Al2O3 Synthesized by Evaporation Using a Continuous Wave CO2 Laser. RSC Adv. 2016, 6, 2072–2078. [Google Scholar] [CrossRef]
  40. Ivakin, Y.; Danchevskaya, M.; Muravieva, G.P.; Ovchinnikova, O.G. Physicochemical properties of corundum doped in supercritical water. In Proceedings of the Joint 19th AIRAPT and 41st EHPRG International Conference on High Pressure Science and Technology, Bordeaux, France, 7–11 July 2003. [Google Scholar]
  41. Randall, J.T.; Wilkins, M.H.F. The Phosphorescence of Various Solids. Proc. R. Soc. Lond. A Math. Phys. Sci. 1945, 184, 347–364. [Google Scholar] [CrossRef]
  42. Randall, J.T.; Wilkins, M.H.F. Phosphorescence and Electron Traps—I. The Study of Trap Distributions. Proc. R. Soc. Lond. A Math. Phys. Sci. 1945, 184, 365–389. [Google Scholar] [CrossRef]
  43. Randall, J.T.; Wilkins, M.H.F. Phosphorescence and Electron Traps II. The Interpretation of Long-Period Phosphorescence. Proc. R. Soc. Lond. A Math. Phys. Sci. 1945, 184, 390–407. [Google Scholar] [CrossRef]
Figure 1. (a,b) Scanning electron microscope image of doped coating with different scales; (c,d) Scanning electron microscope image of undoped coating with different scales.
Coatings 12 01733 g001
Figure 2. XRD measurement of the sample coating produced with PEO parameters 700 V, 45 min process duration and 10 g·L−1 citric acid concentration with all major peaks marked with the corresponding phase.
Coatings 12 01733 g002
Figure 3. α-Al2O3 and γ-Al2O3 phase concentrations as derived from XRD measurements for samples with different PEO process duration.
Coatings 12 01733 g003
Figure 4. (a) XRL spectra of samples with concentrations of 10 g·L−1 and 0 g·L−1 citric acid used in electrolyte during PEO process, (b) intrinsic defect range 300–550 nm; (c) PL spectra of samples with concentrations of 10 g·L−1 and 0 g·L−1 citric acid used in electrolyte during PEO process, (d) intrinsic defect range 300–550 nm.
Coatings 12 01733 g004
Figure 5. TSL intensity and XRF mass % of Cr based on: (a) different PEO process times at 700 V voltage and 10 g·L−1 citric acid concentration; (b) different PEO voltages at 30 min process time and 10 g·L−1 citric acid concentration; (c) different citric acid concentrations in PEO electrolyte at 700 V voltage and 45 min process time.
Coatings 12 01733 g005aCoatings 12 01733 g005b
Figure 6. TSL glow curve at 693 nm (white line, right Y scale) overlayed on top of full measurement matrix (left Y scale). X-scale is joined between an overlay and a matrix. Color represents the intensity of the 2D graph (temperature to wavelength).
Coatings 12 01733 g006
Publisher’s Note: MDPI stays neutral with regard to jurisdictional claims in published maps and institutional affiliations.

